Santee, SC Map & Demographics
Santee Map
Santee Overview
$25,483
PER CAPITA INCOME
$54,896
AVG FAMILY INCOME
$43,000
AVG HOUSEHOLD INCOME
7.3%
WAGE / INCOME GAP [ % ]
92.7¢/ $1
WAGE / INCOME GAP [ $ ]
0.48
INEQUALITY / GINI INDEX
1,189
TOTAL POPULATION
535
MALE POPULATION
654
FEMALE POPULATION
81.80
MALES / 100 FEMALES
122.24
FEMALES / 100 MALES
51.7
MEDIAN AGE
3.3
AVG FAMILY SIZE
2.5
AVG HOUSEHOLD SIZE
601
LABOR FORCE [ PEOPLE ]
59.2%
PERCENT IN LABOR FORCE
1.0%
UNEMPLOYMENT RATE
Santee Zip Codes
Santee Area Codes
Income in Santee
Income Overview in Santee
Per Capita Income in Santee is $25,483, while median incomes of families and households are $54,896 and $43,000 respectively.
| Characteristic | Number | Measure |
| Per Capita Income | 1,189 | $25,483 |
| Median Family Income | 279 | $54,896 |
| Mean Family Income | 279 | $75,962 |
| Median Household Income | 442 | $43,000 |
| Mean Household Income | 442 | $62,309 |
| Income Deficit | 279 | $0 |
| Wage / Income Gap (%) | 1,189 | 7.31% |
| Wage / Income Gap ($) | 1,189 | 92.69¢ per $1 |
| Gini / Inequality Index | 1,189 | 0.48 |
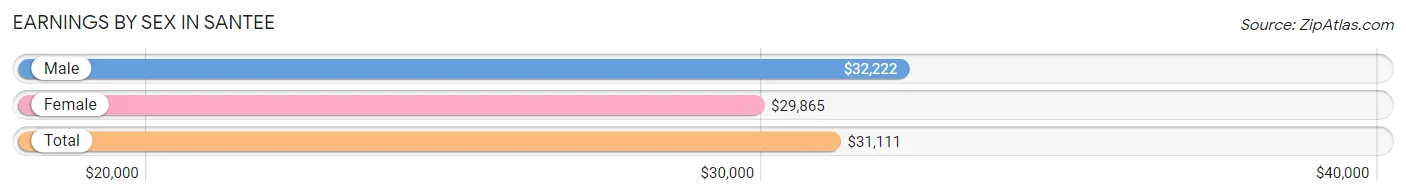
Earnings by Sex in Santee
Average Earnings in Santee are $31,111, $32,222 for men and $29,865 for women, a difference of 7.3%.
| Sex | Number | Average Earnings |
| Male | 302 (49.3%) | $32,222 |
| Female | 310 (50.6%) | $29,865 |
| Total | 612 (100.0%) | $31,111 |
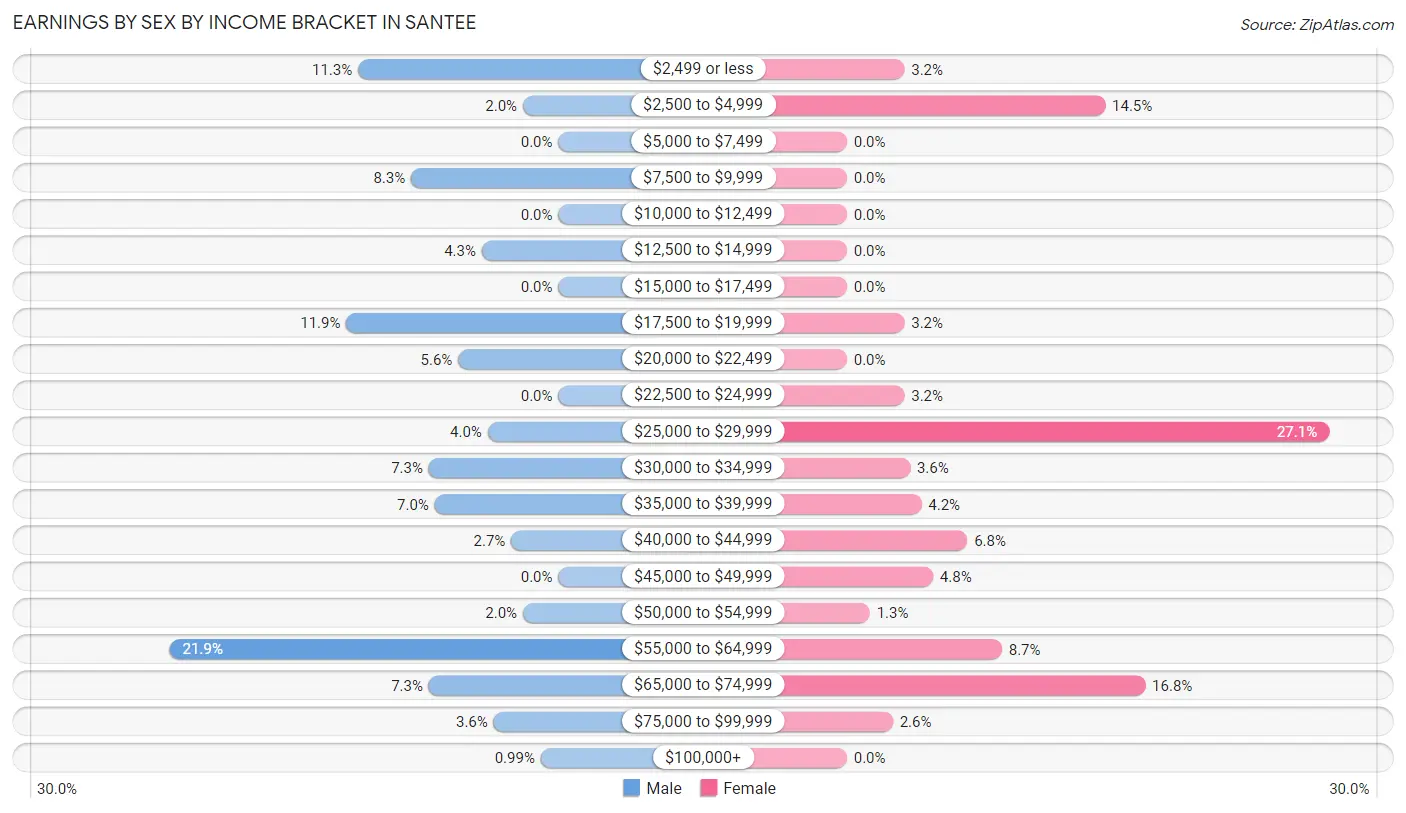
Earnings by Sex by Income Bracket in Santee
The most common earnings brackets in Santee are $55,000 to $64,999 for men (66 | 21.8%) and $25,000 to $29,999 for women (84 | 27.1%).
| Income | Male | Female |
| $2,499 or less | 34 (11.3%) | 10 (3.2%) |
| $2,500 to $4,999 | 6 (2.0%) | 45 (14.5%) |
| $5,000 to $7,499 | 0 (0.0%) | 0 (0.0%) |
| $7,500 to $9,999 | 25 (8.3%) | 0 (0.0%) |
| $10,000 to $12,499 | 0 (0.0%) | 0 (0.0%) |
| $12,500 to $14,999 | 13 (4.3%) | 0 (0.0%) |
| $15,000 to $17,499 | 0 (0.0%) | 0 (0.0%) |
| $17,500 to $19,999 | 36 (11.9%) | 10 (3.2%) |
| $20,000 to $22,499 | 17 (5.6%) | 0 (0.0%) |
| $22,500 to $24,999 | 0 (0.0%) | 10 (3.2%) |
| $25,000 to $29,999 | 12 (4.0%) | 84 (27.1%) |
| $30,000 to $34,999 | 22 (7.3%) | 11 (3.5%) |
| $35,000 to $39,999 | 21 (7.0%) | 13 (4.2%) |
| $40,000 to $44,999 | 8 (2.6%) | 21 (6.8%) |
| $45,000 to $49,999 | 0 (0.0%) | 15 (4.8%) |
| $50,000 to $54,999 | 6 (2.0%) | 4 (1.3%) |
| $55,000 to $64,999 | 66 (21.8%) | 27 (8.7%) |
| $65,000 to $74,999 | 22 (7.3%) | 52 (16.8%) |
| $75,000 to $99,999 | 11 (3.6%) | 8 (2.6%) |
| $100,000+ | 3 (1.0%) | 0 (0.0%) |
| Total | 302 (100.0%) | 310 (100.0%) |
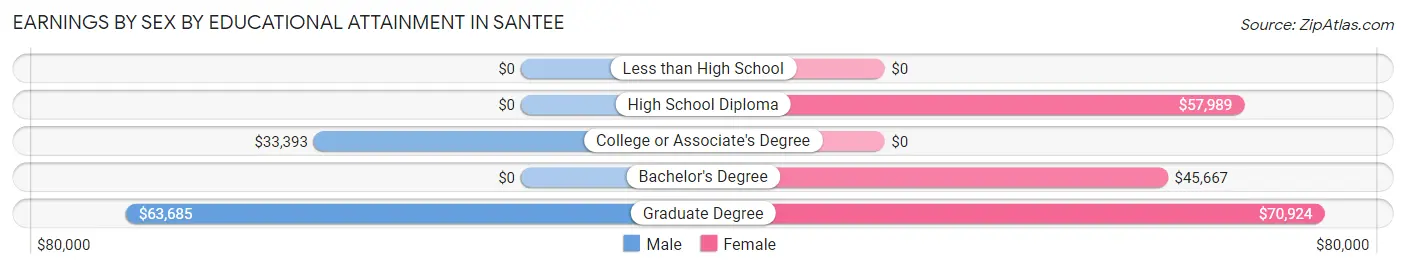
Earnings by Sex by Educational Attainment in Santee
Average earnings in Santee are $36,012 for men and $47,417 for women, a difference of 24.0%. Men with an educational attainment of graduate degree enjoy the highest average annual earnings of $63,685, while those with college or associate's degree education earn the least with $33,393. Women with an educational attainment of graduate degree earn the most with the average annual earnings of $70,924, while those with bachelor's degree education have the smallest earnings of $45,667.
| Educational Attainment | Male Income | Female Income |
| Less than High School | - | - |
| High School Diploma | - | - |
| College or Associate's Degree | $33,393 | $0 |
| Bachelor's Degree | - | - |
| Graduate Degree | $63,685 | $70,924 |
| Total | $36,012 | $47,417 |
Family Income in Santee
Family Income Brackets in Santee
According to the Santee family income data, there are 65 families falling into the $150,000 to $199,999 income range, which is the most common income bracket and makes up 23.3% of all families.
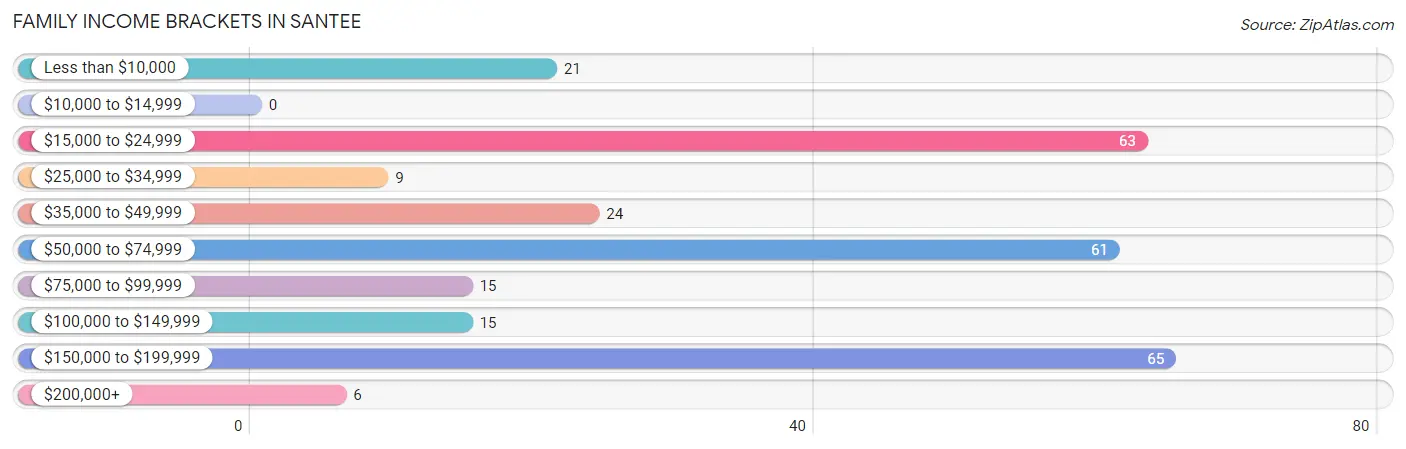
| Income Bracket | # Families | % Families |
| Less than $10,000 | 21 | 7.5% |
| $10,000 to $14,999 | 0 | 0.0% |
| $15,000 to $24,999 | 63 | 22.6% |
| $25,000 to $34,999 | 9 | 3.2% |
| $35,000 to $49,999 | 24 | 8.6% |
| $50,000 to $74,999 | 61 | 21.9% |
| $75,000 to $99,999 | 15 | 5.4% |
| $100,000 to $149,999 | 15 | 5.4% |
| $150,000 to $199,999 | 65 | 23.3% |
| $200,000+ | 6 | 2.2% |
Family Income by Famaliy Size in Santee
4-person families (74 | 26.5%) account for the highest median family income in Santee with $163,664 per family, while 4-person families (74 | 26.5%) have the highest median income of $40,916 per family member.
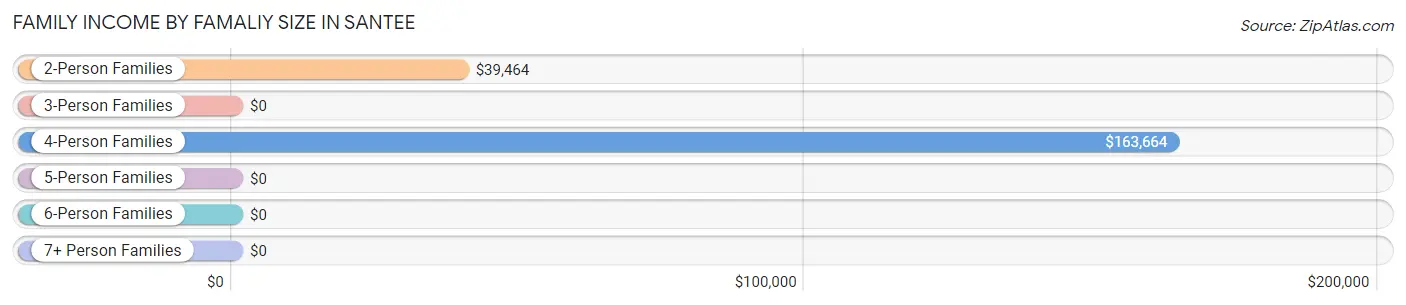
| Income Bracket | # Families | Median Income |
| 2-Person Families | 133 (47.7%) | $39,464 |
| 3-Person Families | 56 (20.1%) | $0 |
| 4-Person Families | 74 (26.5%) | $163,664 |
| 5-Person Families | 9 (3.2%) | $0 |
| 6-Person Families | 7 (2.5%) | $0 |
| 7+ Person Families | 0 (0.0%) | $0 |
| Total | 279 (100.0%) | $54,896 |
Family Income by Number of Earners in Santee
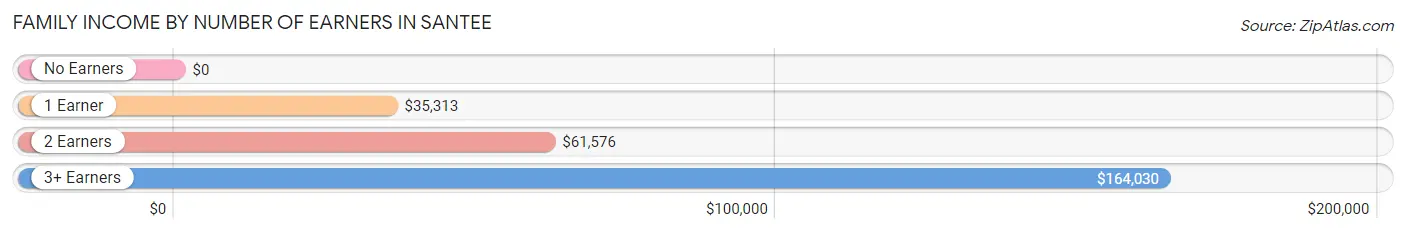
| Number of Earners | # Families | Median Income |
| No Earners | 50 (17.9%) | $0 |
| 1 Earner | 117 (41.9%) | $35,313 |
| 2 Earners | 41 (14.7%) | $61,576 |
| 3+ Earners | 71 (25.5%) | $164,030 |
| Total | 279 (100.0%) | $54,896 |
Household Income in Santee
Household Income Brackets in Santee
With 86 households falling in the category, the $50,000 to $74,999 income range is the most frequent in Santee, accounting for 19.5% of all households. In contrast, only 9 households (2.0%) fall into the $200,000+ income bracket, making it the least populous group.
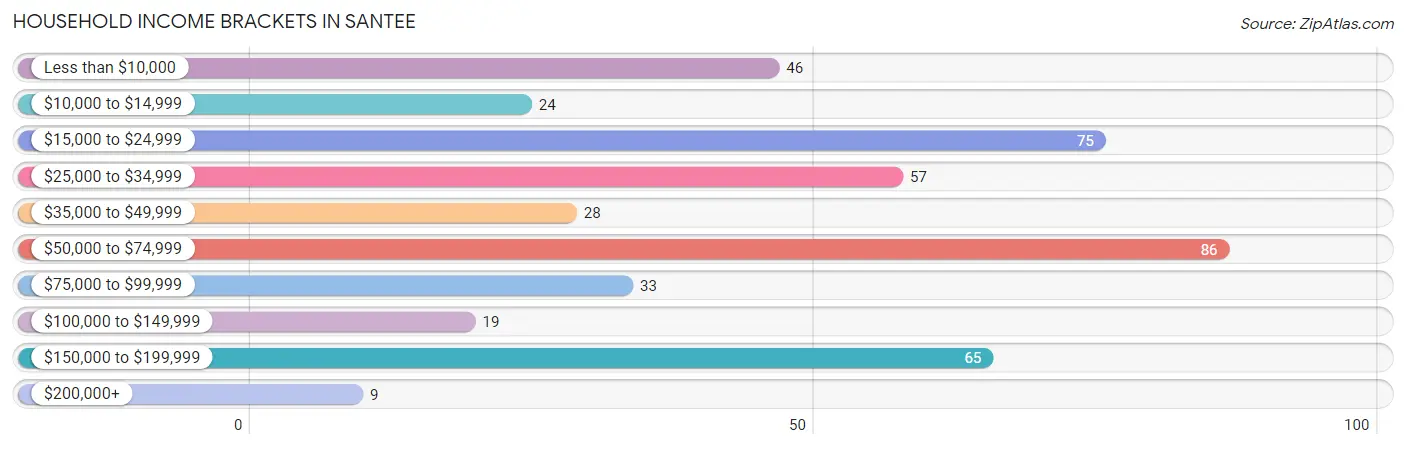
| Income Bracket | # Households | % Households |
| Less than $10,000 | 46 | 10.4% |
| $10,000 to $14,999 | 24 | 5.4% |
| $15,000 to $24,999 | 75 | 17.0% |
| $25,000 to $34,999 | 57 | 12.9% |
| $35,000 to $49,999 | 28 | 6.3% |
| $50,000 to $74,999 | 86 | 19.5% |
| $75,000 to $99,999 | 33 | 7.5% |
| $100,000 to $149,999 | 19 | 4.3% |
| $150,000 to $199,999 | 65 | 14.7% |
| $200,000+ | 9 | 2.0% |
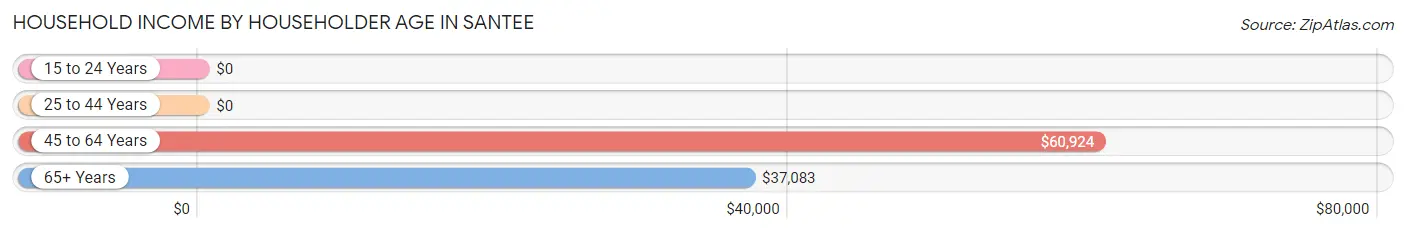
Household Income by Householder Age in Santee
The median household income in Santee is $43,000, with the highest median household income of $60,924 found in the 45 to 64 years age bracket for the primary householder. A total of 197 households (44.6%) fall into this category.
| Income Bracket | # Households | Median Income |
| 15 to 24 Years | 0 (0.0%) | $0 |
| 25 to 44 Years | 67 (15.2%) | $0 |
| 45 to 64 Years | 197 (44.6%) | $60,924 |
| 65+ Years | 178 (40.3%) | $37,083 |
| Total | 442 (100.0%) | $43,000 |
Poverty in Santee
Income Below Poverty by Sex and Age in Santee
With 33.8% poverty level for males and 25.8% for females among the residents of Santee, 55 to 64 year old males and under 5 year old females are the most vulnerable to poverty, with 66 males (84.6%) and 8 females (100.0%) in their respective age groups living below the poverty level.
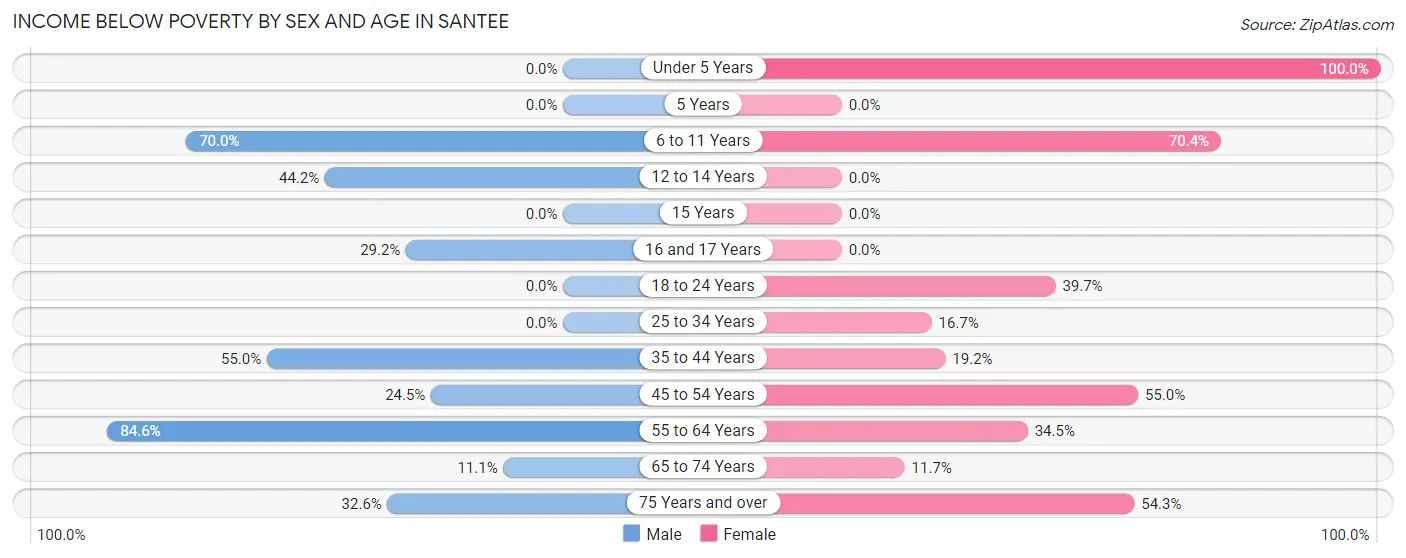
| Age Bracket | Male | Female |
| Under 5 Years | 0 (0.0%) | 8 (100.0%) |
| 5 Years | 0 (0.0%) | 0 (0.0%) |
| 6 to 11 Years | 14 (70.0%) | 19 (70.4%) |
| 12 to 14 Years | 23 (44.2%) | 0 (0.0%) |
| 15 Years | 0 (0.0%) | 0 (0.0%) |
| 16 and 17 Years | 14 (29.2%) | 0 (0.0%) |
| 18 to 24 Years | 0 (0.0%) | 23 (39.7%) |
| 25 to 34 Years | 0 (0.0%) | 3 (16.7%) |
| 35 to 44 Years | 11 (55.0%) | 10 (19.2%) |
| 45 to 54 Years | 26 (24.5%) | 11 (55.0%) |
| 55 to 64 Years | 66 (84.6%) | 49 (34.5%) |
| 65 to 74 Years | 7 (11.1%) | 14 (11.7%) |
| 75 Years and over | 15 (32.6%) | 19 (54.3%) |
| Total | 176 (33.8%) | 156 (25.8%) |
Income Above Poverty by Sex and Age in Santee
According to the poverty statistics in Santee, males aged under 5 years and females aged 12 to 14 years are the age groups that are most secure financially, with 100.0% of males and 100.0% of females in these age groups living above the poverty line.
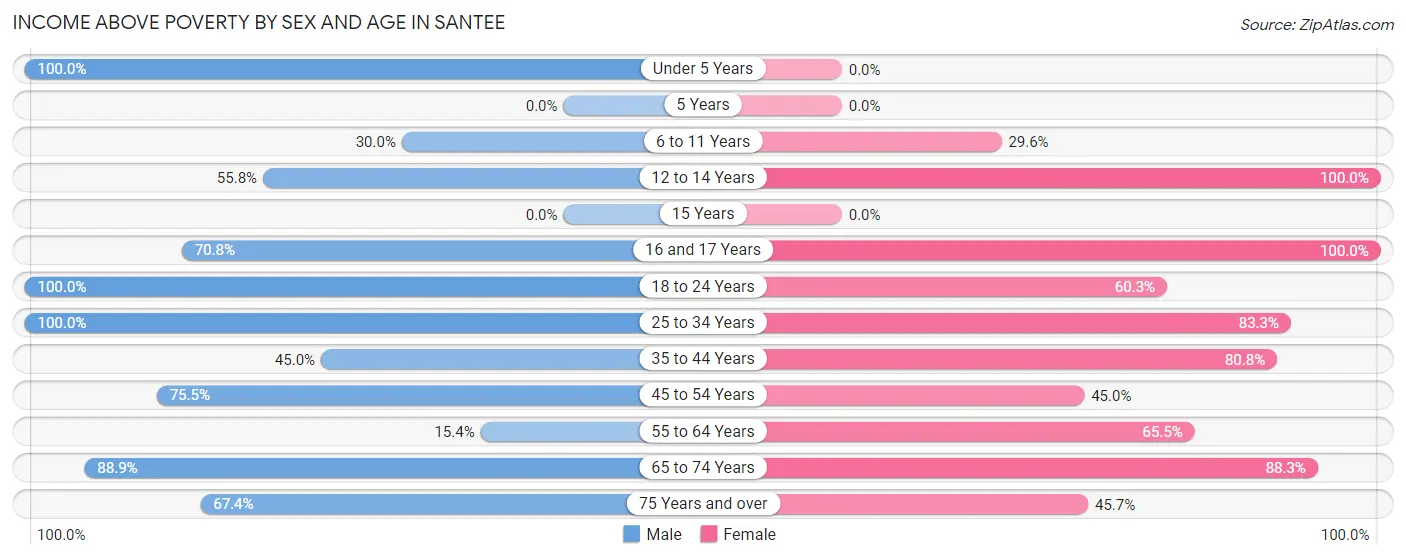
| Age Bracket | Male | Female |
| Under 5 Years | 11 (100.0%) | 0 (0.0%) |
| 5 Years | 0 (0.0%) | 0 (0.0%) |
| 6 to 11 Years | 6 (30.0%) | 8 (29.6%) |
| 12 to 14 Years | 29 (55.8%) | 56 (100.0%) |
| 15 Years | 0 (0.0%) | 0 (0.0%) |
| 16 and 17 Years | 34 (70.8%) | 69 (100.0%) |
| 18 to 24 Years | 11 (100.0%) | 35 (60.3%) |
| 25 to 34 Years | 66 (100.0%) | 15 (83.3%) |
| 35 to 44 Years | 9 (45.0%) | 42 (80.8%) |
| 45 to 54 Years | 80 (75.5%) | 9 (45.0%) |
| 55 to 64 Years | 12 (15.4%) | 93 (65.5%) |
| 65 to 74 Years | 56 (88.9%) | 106 (88.3%) |
| 75 Years and over | 31 (67.4%) | 16 (45.7%) |
| Total | 345 (66.2%) | 449 (74.2%) |
Income Below Poverty Among Married-Couple Families in Santee
The poverty statistics for married-couple families in Santee show that 19.3% or 28 of the total 145 families live below the poverty line. Families with no children have the highest poverty rate of 34.6%, comprising of 28 families. On the other hand, families with 1 or 2 children have the lowest poverty rate of 0.0%, which includes 0 families.
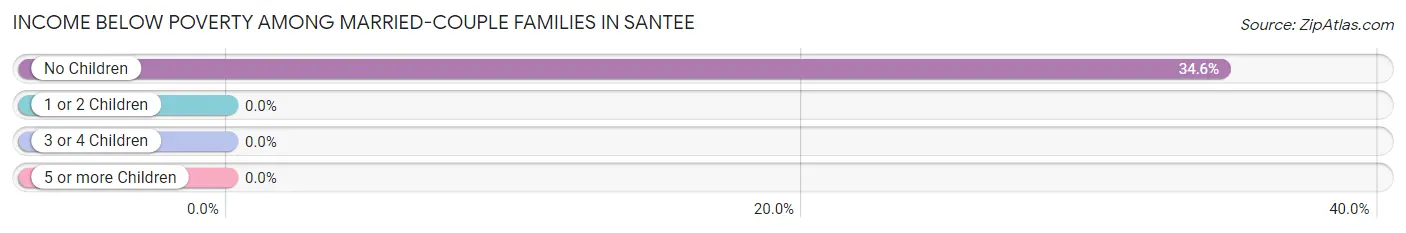
| Children | Above Poverty | Below Poverty |
| No Children | 53 (65.4%) | 28 (34.6%) |
| 1 or 2 Children | 64 (100.0%) | 0 (0.0%) |
| 3 or 4 Children | 0 (0.0%) | 0 (0.0%) |
| 5 or more Children | 0 (0.0%) | 0 (0.0%) |
| Total | 117 (80.7%) | 28 (19.3%) |
Income Below Poverty Among Single-Parent Households in Santee
According to the poverty data in Santee, 70.0% or 14 single-father households and 39.5% or 45 single-mother households are living below the poverty line. Among single-father households, those with no children have the highest poverty rate, with 14 households (100.0%) experiencing poverty. Likewise, among single-mother households, those with 3 or 4 children have the highest poverty rate, with 19 households (100.0%) falling below the poverty line.
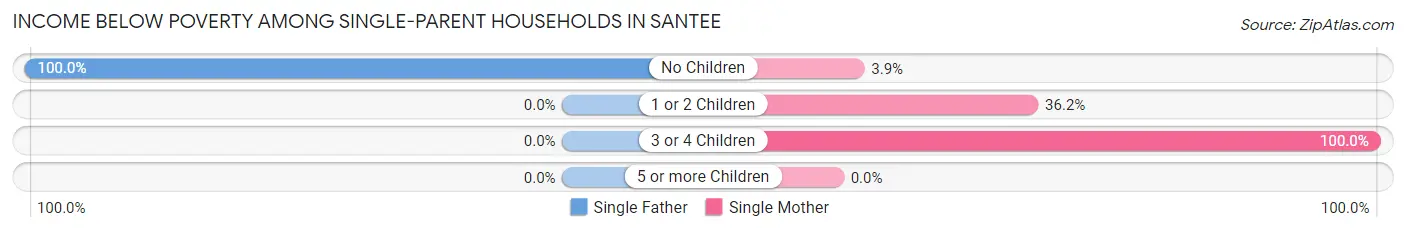
| Children | Single Father | Single Mother |
| No Children | 14 (100.0%) | 1 (3.8%) |
| 1 or 2 Children | 0 (0.0%) | 25 (36.2%) |
| 3 or 4 Children | 0 (0.0%) | 19 (100.0%) |
| 5 or more Children | 0 (0.0%) | 0 (0.0%) |
| Total | 14 (70.0%) | 45 (39.5%) |
Income Below Poverty Among Married-Couple vs Single-Parent Households in Santee
The poverty data for Santee shows that 28 of the married-couple family households (19.3%) and 59 of the single-parent households (44.0%) are living below the poverty level. Within the married-couple family households, those with no children have the highest poverty rate, with 28 households (34.6%) falling below the poverty line. Among the single-parent households, those with 3 or 4 children have the highest poverty rate, with 19 household (100.0%) living below poverty.
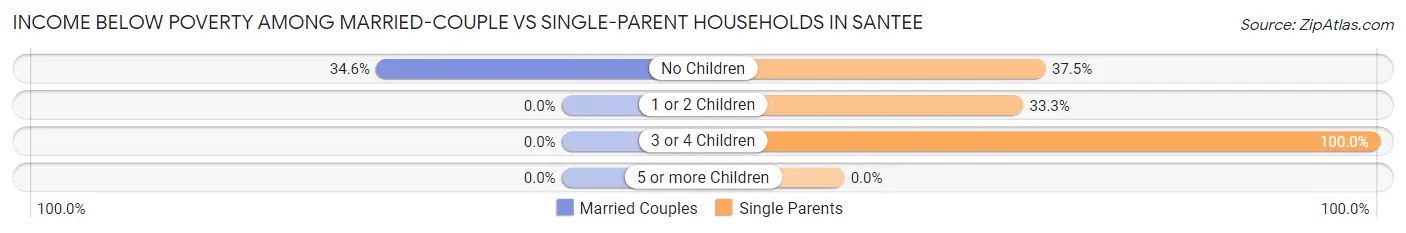
| Children | Married-Couple Families | Single-Parent Households |
| No Children | 28 (34.6%) | 15 (37.5%) |
| 1 or 2 Children | 0 (0.0%) | 25 (33.3%) |
| 3 or 4 Children | 0 (0.0%) | 19 (100.0%) |
| 5 or more Children | 0 (0.0%) | 0 (0.0%) |
| Total | 28 (19.3%) | 59 (44.0%) |
Race in Santee
The most populous races in Santee are Black / African American (940 | 79.1%), White / Caucasian (165 | 13.9%), and Asian (77 | 6.5%).
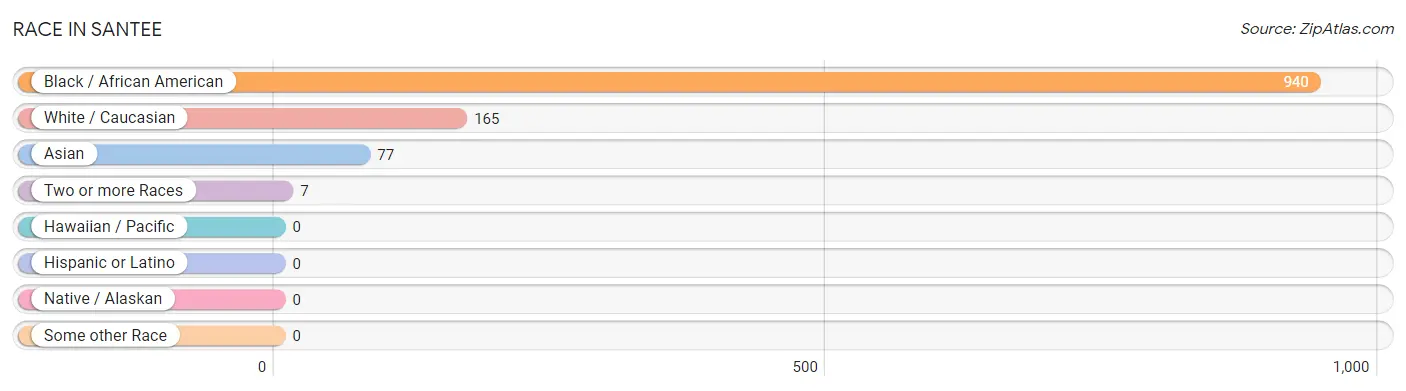
| Race | # Population | % Population |
| Asian | 77 | 6.5% |
| Black / African American | 940 | 79.1% |
| Hawaiian / Pacific | 0 | 0.0% |
| Hispanic or Latino | 0 | 0.0% |
| Native / Alaskan | 0 | 0.0% |
| White / Caucasian | 165 | 13.9% |
| Two or more Races | 7 | 0.6% |
| Some other Race | 0 | 0.0% |
| Total | 1,189 | 100.0% |
Ancestry in Santee
The most populous ancestries reported in Santee are Thai (71 | 6.0%), English (30 | 2.5%), German (21 | 1.8%), American (15 | 1.3%), and Irish (12 | 1.0%), together accounting for 12.5% of all Santee residents.
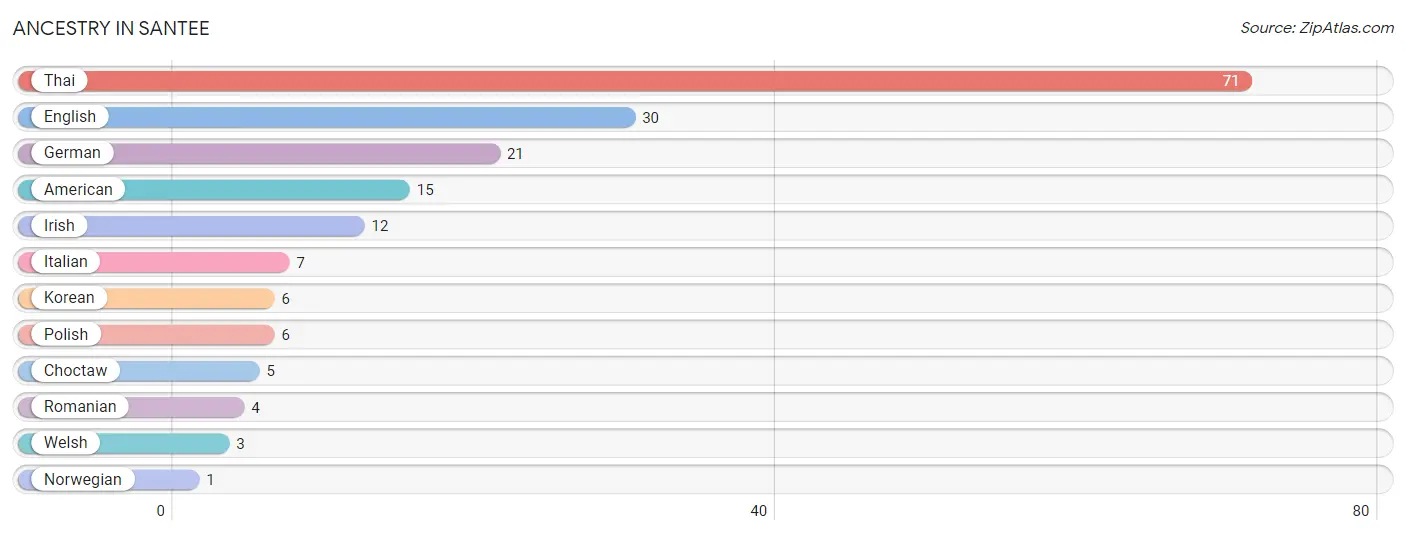
| Ancestry | # Population | % Population |
| American | 15 | 1.3% |
| Choctaw | 5 | 0.4% |
| English | 30 | 2.5% |
| German | 21 | 1.8% |
| Irish | 12 | 1.0% |
| Italian | 7 | 0.6% |
| Korean | 6 | 0.5% |
| Norwegian | 1 | 0.1% |
| Polish | 6 | 0.5% |
| Romanian | 4 | 0.3% |
| Thai | 71 | 6.0% |
| Welsh | 3 | 0.3% | View All 12 Rows |
Immigrants in Santee
The most numerous immigrant groups reported in Santee came from Europe (14 | 1.2%), England (10 | 0.8%), Northern Europe (10 | 0.8%), Asia (6 | 0.5%), and Philippines (6 | 0.5%), together accounting for 3.9% of all Santee residents.
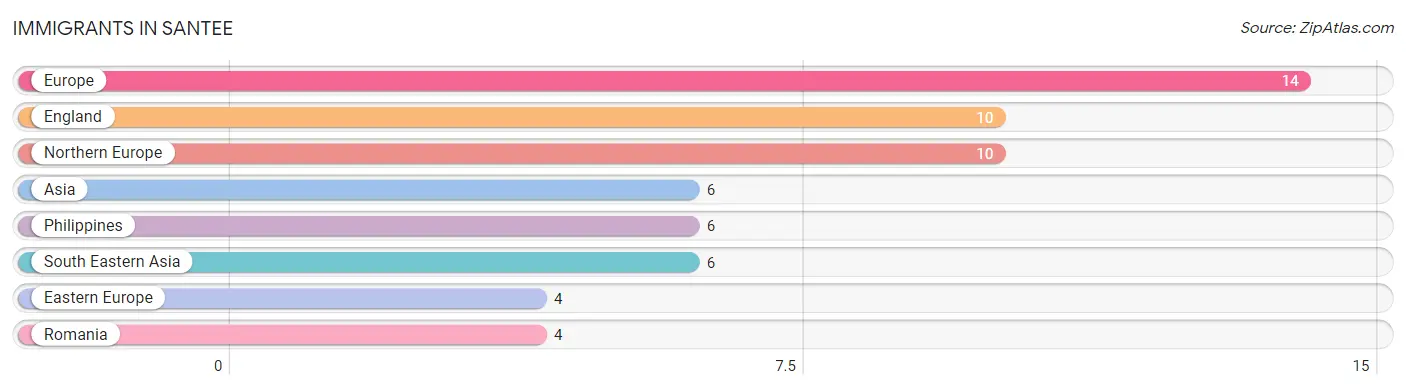
| Immigration Origin | # Population | % Population |
| Asia | 6 | 0.5% |
| Eastern Europe | 4 | 0.3% |
| England | 10 | 0.8% |
| Europe | 14 | 1.2% |
| Northern Europe | 10 | 0.8% |
| Philippines | 6 | 0.5% |
| Romania | 4 | 0.3% |
| South Eastern Asia | 6 | 0.5% | View All 8 Rows |
Sex and Age in Santee
Sex and Age in Santee
The most populous age groups in Santee are 50 to 54 Years (79 | 14.8%) for men and 15 to 19 Years (113 | 17.3%) for women.
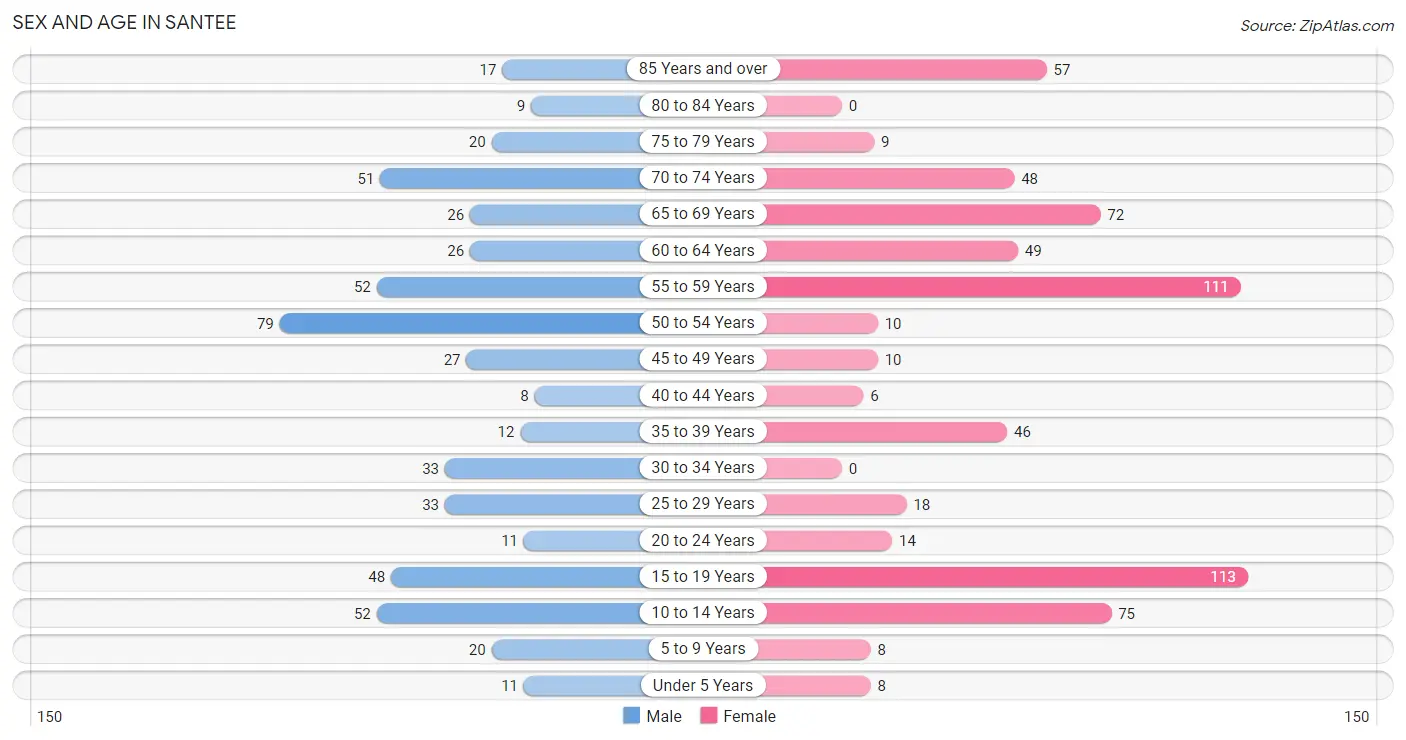
| Age Bracket | Male | Female |
| Under 5 Years | 11 (2.1%) | 8 (1.2%) |
| 5 to 9 Years | 20 (3.7%) | 8 (1.2%) |
| 10 to 14 Years | 52 (9.7%) | 75 (11.5%) |
| 15 to 19 Years | 48 (9.0%) | 113 (17.3%) |
| 20 to 24 Years | 11 (2.1%) | 14 (2.1%) |
| 25 to 29 Years | 33 (6.2%) | 18 (2.8%) |
| 30 to 34 Years | 33 (6.2%) | 0 (0.0%) |
| 35 to 39 Years | 12 (2.2%) | 46 (7.0%) |
| 40 to 44 Years | 8 (1.5%) | 6 (0.9%) |
| 45 to 49 Years | 27 (5.1%) | 10 (1.5%) |
| 50 to 54 Years | 79 (14.8%) | 10 (1.5%) |
| 55 to 59 Years | 52 (9.7%) | 111 (17.0%) |
| 60 to 64 Years | 26 (4.9%) | 49 (7.5%) |
| 65 to 69 Years | 26 (4.9%) | 72 (11.0%) |
| 70 to 74 Years | 51 (9.5%) | 48 (7.3%) |
| 75 to 79 Years | 20 (3.7%) | 9 (1.4%) |
| 80 to 84 Years | 9 (1.7%) | 0 (0.0%) |
| 85 Years and over | 17 (3.2%) | 57 (8.7%) |
| Total | 535 (100.0%) | 654 (100.0%) |
Families and Households in Santee
Median Family Size in Santee
The median family size in Santee is 3.34 persons per family, with single female/mother families (114 | 40.9%) accounting for the largest median family size of 3.95 persons per family. On the other hand, single male/father families (20 | 7.2%) represent the smallest median family size with 2.25 persons per family.
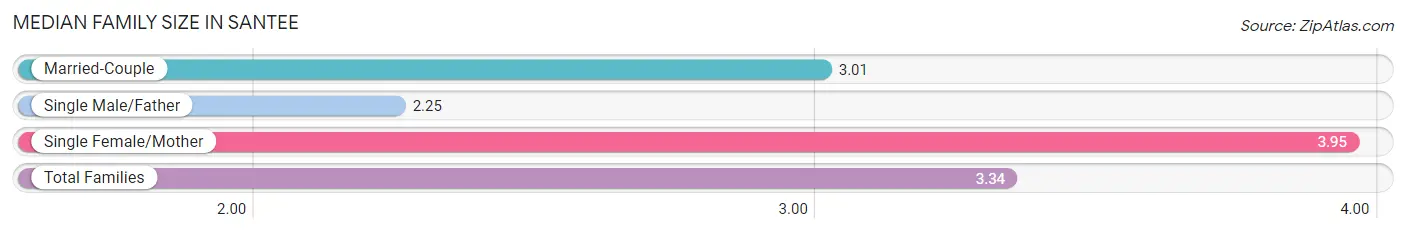
| Family Type | # Families | Family Size |
| Married-Couple | 145 (52.0%) | 3.01 |
| Single Male/Father | 20 (7.2%) | 2.25 |
| Single Female/Mother | 114 (40.9%) | 3.95 |
| Total Families | 279 (100.0%) | 3.34 |
Median Household Size in Santee
The median household size in Santee is 2.55 persons per household, with single female/mother households (114 | 25.8%) accounting for the largest median household size of 4.08 persons per household. non-family households (163 | 36.9%) represent the smallest median household size with 1.10 persons per household.
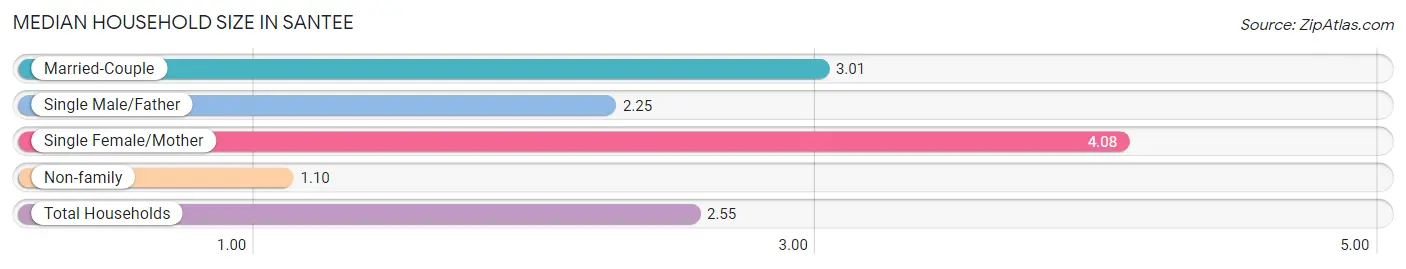
| Household Type | # Households | Household Size |
| Married-Couple | 145 (32.8%) | 3.01 |
| Single Male/Father | 20 (4.5%) | 2.25 |
| Single Female/Mother | 114 (25.8%) | 4.08 |
| Non-family | 163 (36.9%) | 1.10 |
| Total Households | 442 (100.0%) | 2.55 |
Household Size by Marriage Status in Santee
Out of a total of 442 households in Santee, 279 (63.1%) are family households, while 163 (36.9%) are nonfamily households. The most numerous type of family households are 2-person households, comprising 125, and the most common type of nonfamily households are 1-person households, comprising 150.
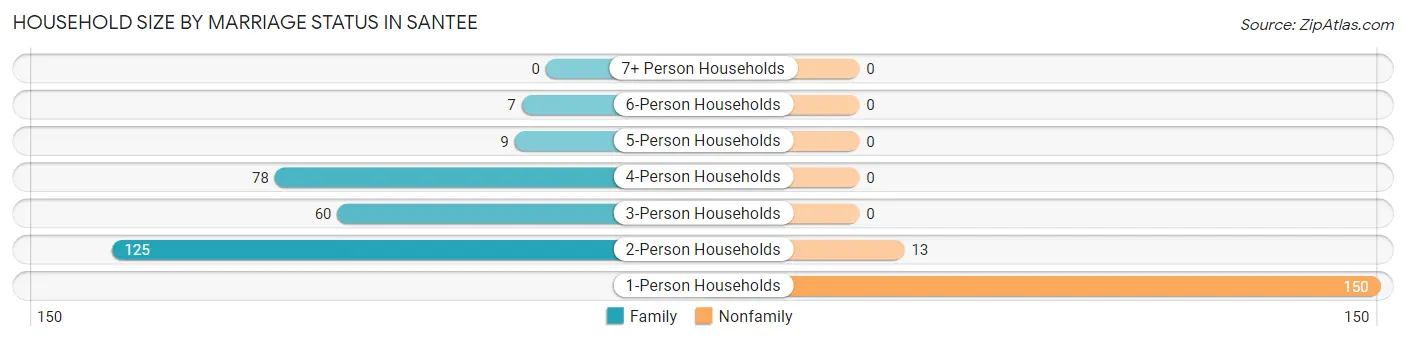
| Household Size | Family Households | Nonfamily Households |
| 1-Person Households | - | 150 (33.9%) |
| 2-Person Households | 125 (28.3%) | 13 (2.9%) |
| 3-Person Households | 60 (13.6%) | 0 (0.0%) |
| 4-Person Households | 78 (17.6%) | 0 (0.0%) |
| 5-Person Households | 9 (2.0%) | 0 (0.0%) |
| 6-Person Households | 7 (1.6%) | 0 (0.0%) |
| 7+ Person Households | 0 (0.0%) | 0 (0.0%) |
| Total | 279 (63.1%) | 163 (36.9%) |
Female Fertility in Santee
Fertility by Age in Santee
Average fertility rate in Santee is 19.0 births per 1,000 women. Women in the age bracket of 20 to 34 years have the highest fertility rate with 125.0 births per 1,000 women. Women in the age bracket of 20 to 34 years acount for 100.0% of all women with births.

| Age Bracket | Women with Births | Births / 1,000 Women |
| 15 to 19 years | 0 (0.0%) | 0.0 |
| 20 to 34 years | 4 (100.0%) | 125.0 |
| 35 to 50 years | 0 (0.0%) | 0.0 |
| Total | 4 (100.0%) | 19.0 |
Fertility by Age by Marriage Status in Santee
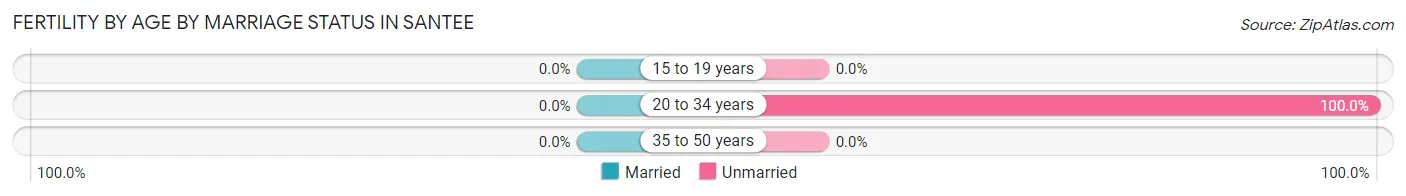
| Age Bracket | Married | Unmarried |
| 15 to 19 years | 0 (0.0%) | 0 (0.0%) |
| 20 to 34 years | 0 (0.0%) | 4 (100.0%) |
| 35 to 50 years | 0 (0.0%) | 0 (0.0%) |
| Total | 0 (0.0%) | 4 (100.0%) |
Fertility by Education in Santee
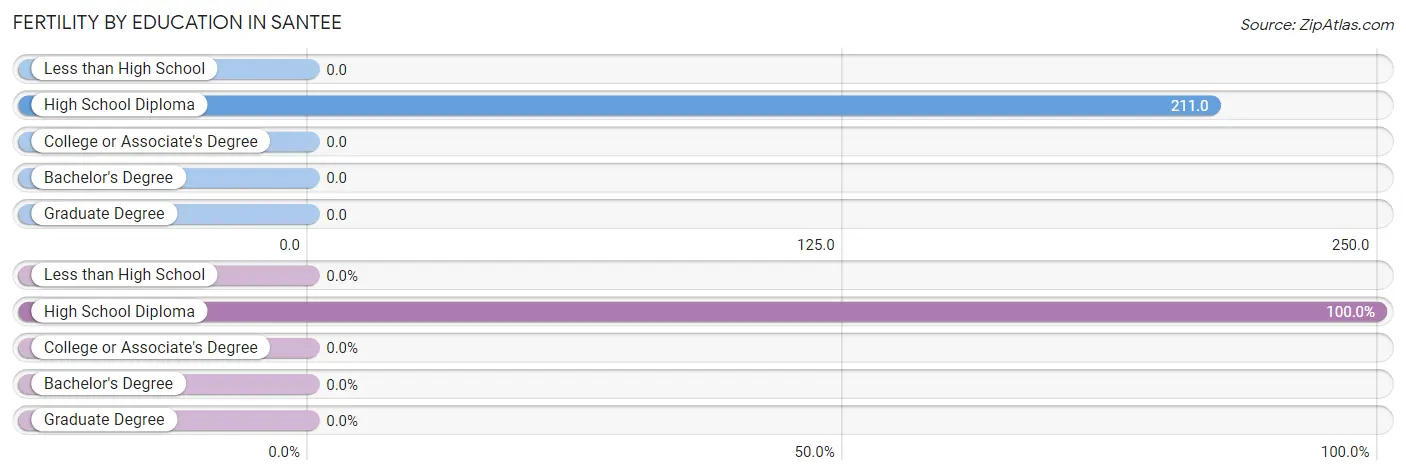
| Educational Attainment | Women with Births | Births / 1,000 Women |
| Less than High School | 0 (0.0%) | 0.0 |
| High School Diploma | 4 (100.0%) | 211.0 |
| College or Associate's Degree | 0 (0.0%) | 0.0 |
| Bachelor's Degree | 0 (0.0%) | 0.0 |
| Graduate Degree | 0 (0.0%) | 0.0 |
| Total | 4 (100.0%) | 19.0 |
Fertility by Education by Marriage Status in Santee
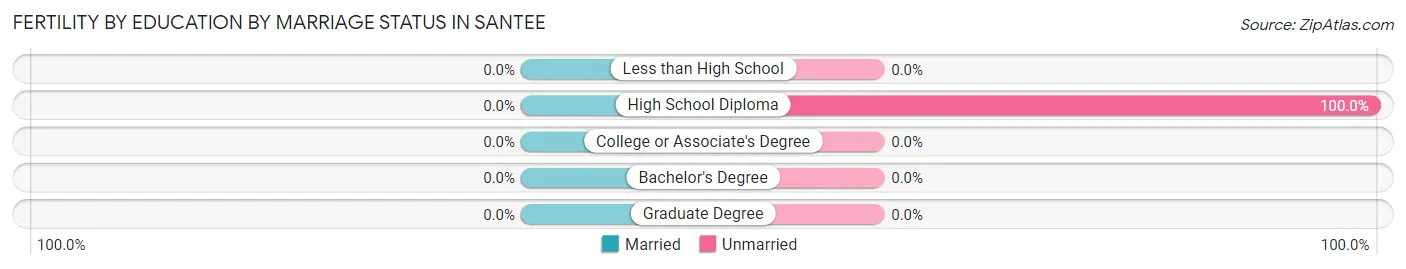
| Educational Attainment | Married | Unmarried |
| Less than High School | 0 (0.0%) | 0 (0.0%) |
| High School Diploma | 0 (0.0%) | 4 (100.0%) |
| College or Associate's Degree | 0 (0.0%) | 0 (0.0%) |
| Bachelor's Degree | 0 (0.0%) | 0 (0.0%) |
| Graduate Degree | 0 (0.0%) | 0 (0.0%) |
| Total | 0 (0.0%) | 4 (100.0%) |
Employment Characteristics in Santee
Employment by Class of Employer in Santee
Among the 594 employed individuals in Santee, private company employees (394 | 66.3%), not-for-profit organizations (61 | 10.3%), and state government employees (57 | 9.6%) make up the most common classes of employment.
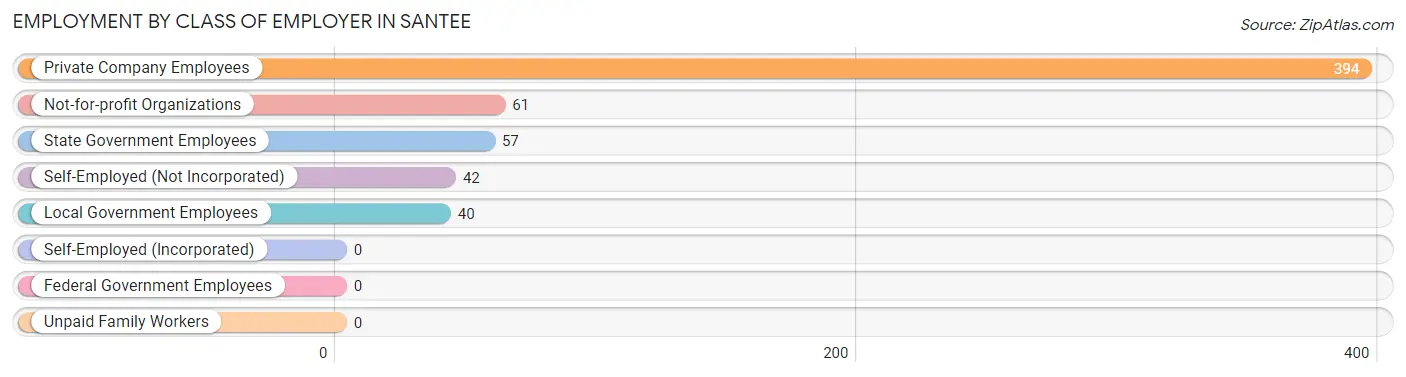
| Employer Class | # Employees | % Employees |
| Private Company Employees | 394 | 66.3% |
| Self-Employed (Incorporated) | 0 | 0.0% |
| Self-Employed (Not Incorporated) | 42 | 7.1% |
| Not-for-profit Organizations | 61 | 10.3% |
| Local Government Employees | 40 | 6.7% |
| State Government Employees | 57 | 9.6% |
| Federal Government Employees | 0 | 0.0% |
| Unpaid Family Workers | 0 | 0.0% |
| Total | 594 | 100.0% |
Employment Status by Age in Santee
According to the labor force statistics for Santee, out of the total population over 16 years of age (1,015), 59.2% or 601 individuals are in the labor force, with 1.0% or 6 of them unemployed. The age group with the highest labor force participation rate is 20 to 24 years, with 100.0% or 25 individuals in the labor force. Within the labor force, the 35 to 44 years age range has the highest percentage of unemployed individuals, with 9.0% or 6 of them being unemployed.
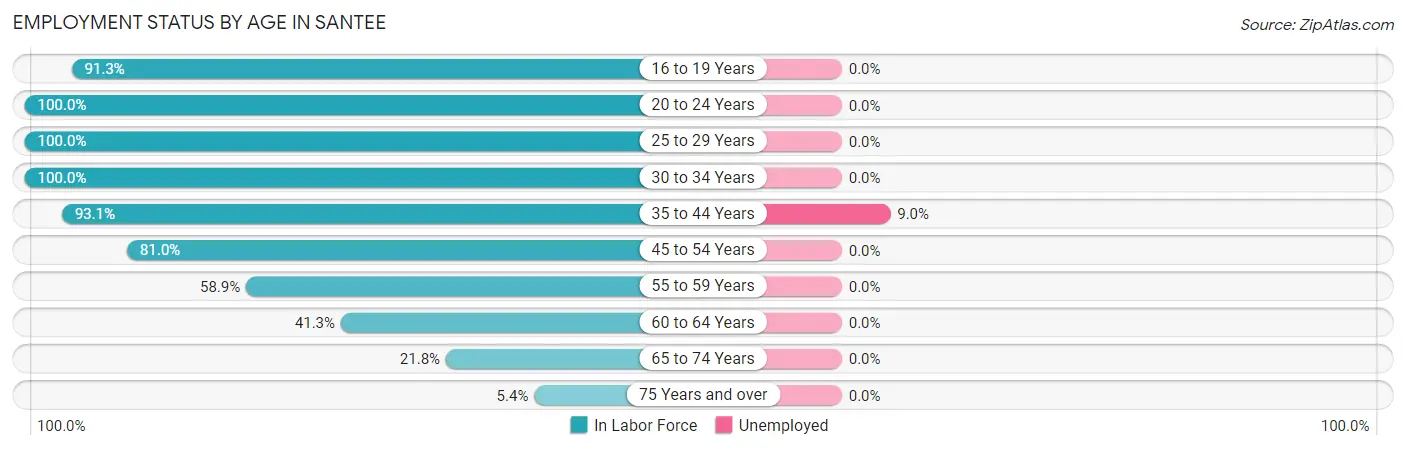
| Age Bracket | In Labor Force | Unemployed |
| 16 to 19 Years | 147 (91.3%) | 0 (0.0%) |
| 20 to 24 Years | 25 (100.0%) | 0 (0.0%) |
| 25 to 29 Years | 51 (100.0%) | 0 (0.0%) |
| 30 to 34 Years | 33 (100.0%) | 0 (0.0%) |
| 35 to 44 Years | 67 (93.1%) | 6 (9.0%) |
| 45 to 54 Years | 102 (81.0%) | 0 (0.0%) |
| 55 to 59 Years | 96 (58.9%) | 0 (0.0%) |
| 60 to 64 Years | 31 (41.3%) | 0 (0.0%) |
| 65 to 74 Years | 43 (21.8%) | 0 (0.0%) |
| 75 Years and over | 6 (5.4%) | 0 (0.0%) |
| Total | 601 (59.2%) | 6 (1.0%) |
Employment Status by Educational Attainment in Santee
According to labor force statistics for Santee, 73.1% of individuals (380) out of the total population between 25 and 64 years of age (520) are in the labor force, with 1.6% or 6 of them being unemployed. The group with the highest labor force participation rate are those with the educational attainment of bachelor's degree or higher, with 100.0% or 176 individuals in the labor force. Within the labor force, individuals with high school diploma education have the highest percentage of unemployment, with 8.5% or 6 of them being unemployed.
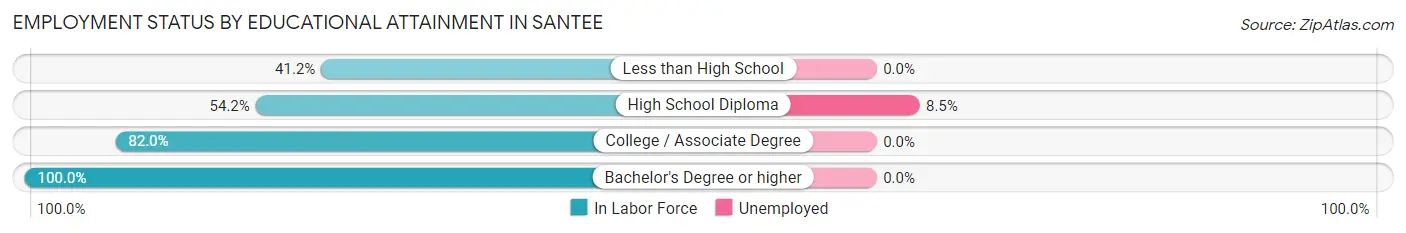
| Educational Attainment | In Labor Force | Unemployed |
| Less than High School | 42 (41.2%) | 0 (0.0%) |
| High School Diploma | 71 (54.2%) | 11 (8.5%) |
| College / Associate Degree | 91 (82.0%) | 0 (0.0%) |
| Bachelor's Degree or higher | 176 (100.0%) | 0 (0.0%) |
| Total | 380 (73.1%) | 8 (1.6%) |
Employment Occupations by Sex in Santee
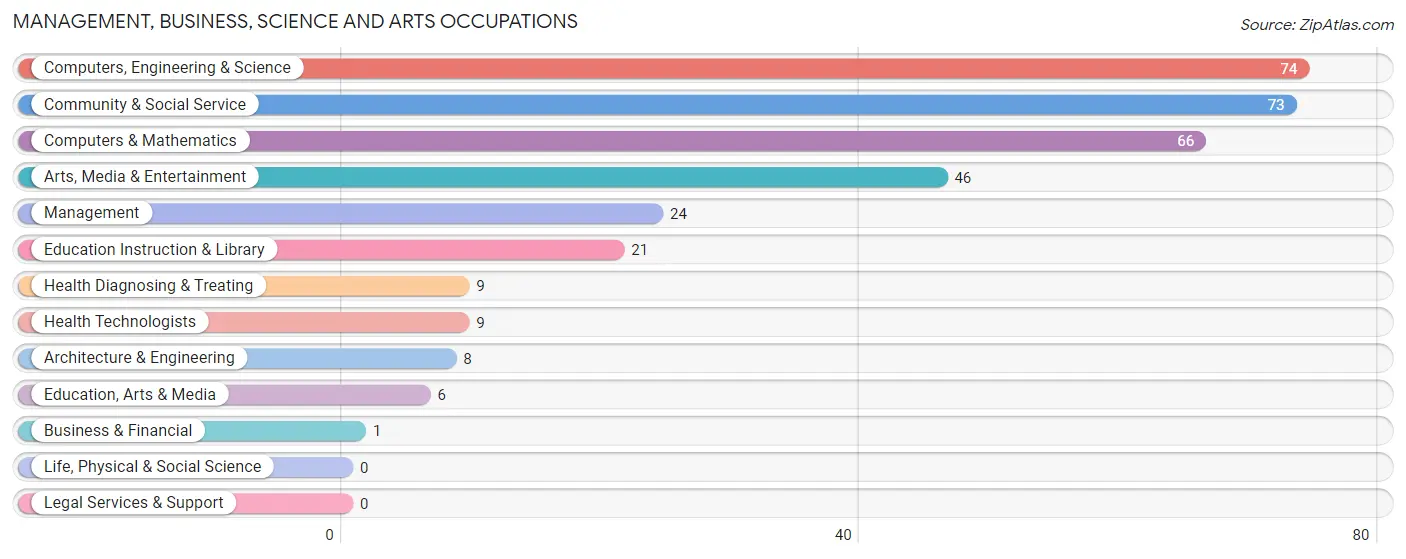
Management, Business, Science and Arts Occupations
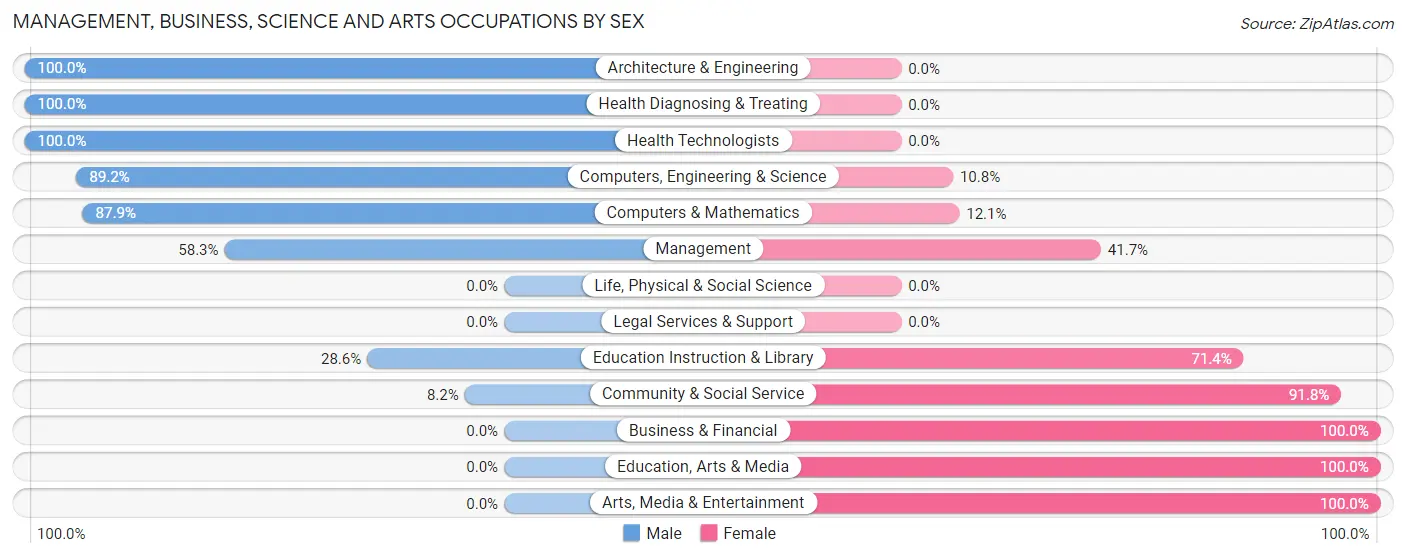
The most common Management, Business, Science and Arts occupations in Santee are Computers, Engineering & Science (74 | 12.4%), Community & Social Service (73 | 12.3%), Computers & Mathematics (66 | 11.1%), Arts, Media & Entertainment (46 | 7.7%), and Management (24 | 4.0%).
Management, Business, Science and Arts Occupations by Sex
Within the Management, Business, Science and Arts occupations in Santee, the most male-oriented occupations are Architecture & Engineering (100.0%), Health Diagnosing & Treating (100.0%), and Health Technologists (100.0%), while the most female-oriented occupations are Business & Financial (100.0%), Education, Arts & Media (100.0%), and Arts, Media & Entertainment (100.0%).
| Occupation | Male | Female |
| Management | 14 (58.3%) | 10 (41.7%) |
| Business & Financial | 0 (0.0%) | 1 (100.0%) |
| Computers, Engineering & Science | 66 (89.2%) | 8 (10.8%) |
| Computers & Mathematics | 58 (87.9%) | 8 (12.1%) |
| Architecture & Engineering | 8 (100.0%) | 0 (0.0%) |
| Life, Physical & Social Science | 0 (0.0%) | 0 (0.0%) |
| Community & Social Service | 6 (8.2%) | 67 (91.8%) |
| Education, Arts & Media | 0 (0.0%) | 6 (100.0%) |
| Legal Services & Support | 0 (0.0%) | 0 (0.0%) |
| Education Instruction & Library | 6 (28.6%) | 15 (71.4%) |
| Arts, Media & Entertainment | 0 (0.0%) | 46 (100.0%) |
| Health Diagnosing & Treating | 9 (100.0%) | 0 (0.0%) |
| Health Technologists | 9 (100.0%) | 0 (0.0%) |
| Total (Category) | 95 (52.5%) | 86 (47.5%) |
| Total (Overall) | 292 (49.1%) | 303 (50.9%) |
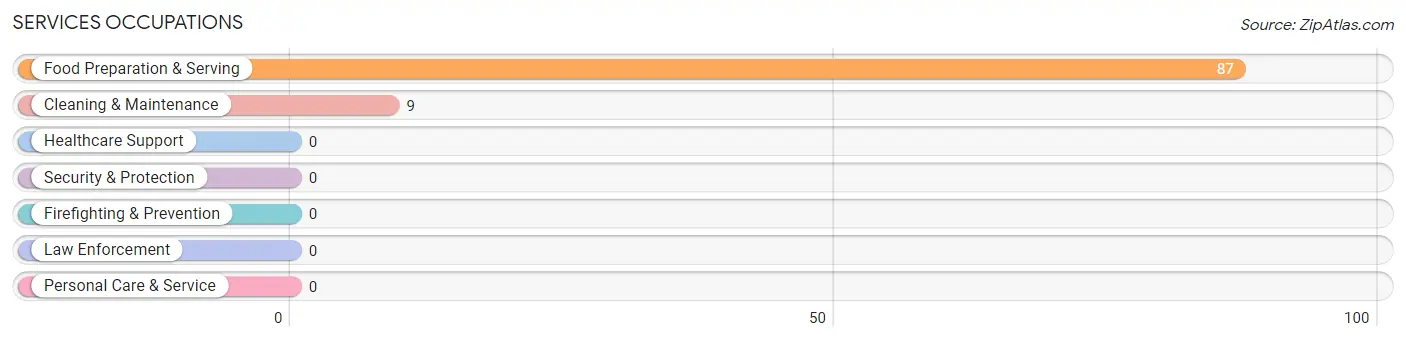
Services Occupations
The most common Services occupations in Santee are Food Preparation & Serving (87 | 14.6%), and Cleaning & Maintenance (9 | 1.5%).
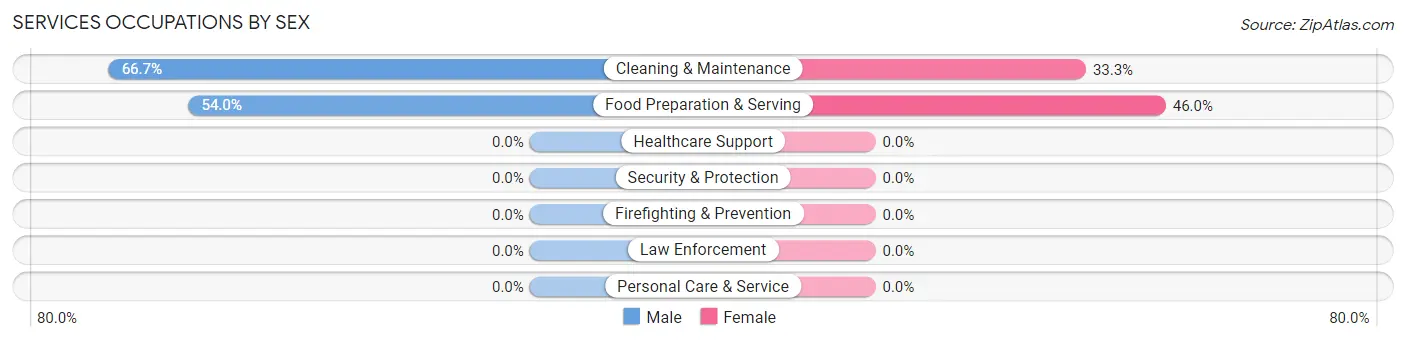
Services Occupations by Sex
Within the Services occupations in Santee, the most male-oriented occupations are Cleaning & Maintenance (66.7%), and Food Preparation & Serving (54.0%), while the most female-oriented occupations are Food Preparation & Serving (46.0%), and Cleaning & Maintenance (33.3%).
| Occupation | Male | Female |
| Healthcare Support | 0 (0.0%) | 0 (0.0%) |
| Security & Protection | 0 (0.0%) | 0 (0.0%) |
| Firefighting & Prevention | 0 (0.0%) | 0 (0.0%) |
| Law Enforcement | 0 (0.0%) | 0 (0.0%) |
| Food Preparation & Serving | 47 (54.0%) | 40 (46.0%) |
| Cleaning & Maintenance | 6 (66.7%) | 3 (33.3%) |
| Personal Care & Service | 0 (0.0%) | 0 (0.0%) |
| Total (Category) | 53 (55.2%) | 43 (44.8%) |
| Total (Overall) | 292 (49.1%) | 303 (50.9%) |
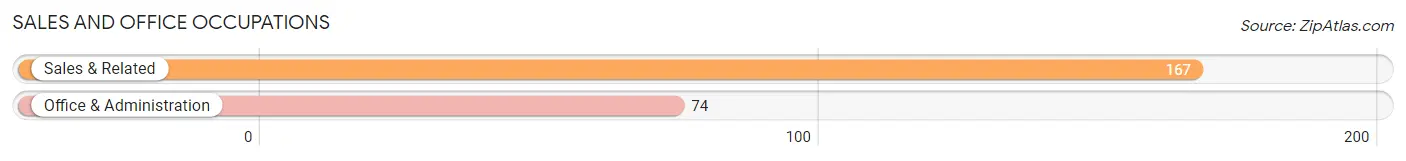
Sales and Office Occupations
The most common Sales and Office occupations in Santee are Sales & Related (167 | 28.1%), and Office & Administration (74 | 12.4%).
Sales and Office Occupations by Sex
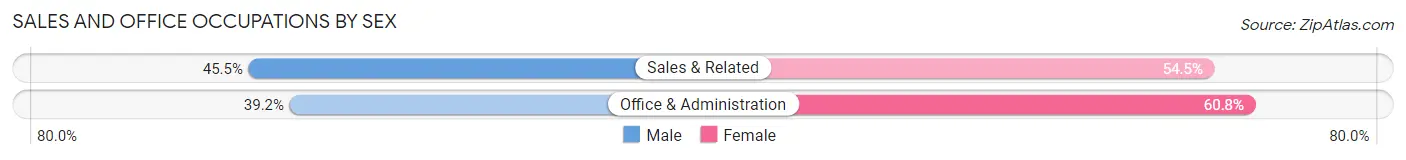
| Occupation | Male | Female |
| Sales & Related | 76 (45.5%) | 91 (54.5%) |
| Office & Administration | 29 (39.2%) | 45 (60.8%) |
| Total (Category) | 105 (43.6%) | 136 (56.4%) |
| Total (Overall) | 292 (49.1%) | 303 (50.9%) |
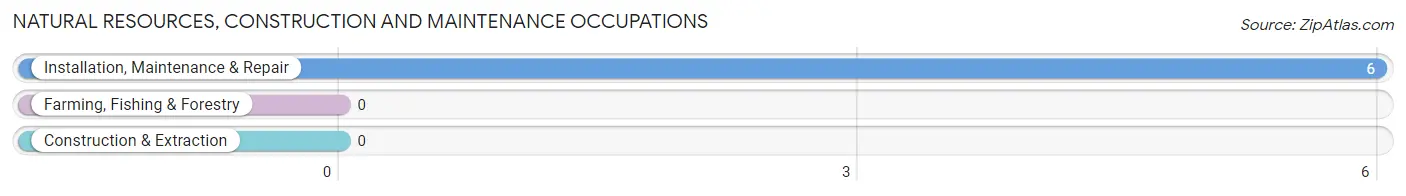
Natural Resources, Construction and Maintenance Occupations
The most common Natural Resources, Construction and Maintenance occupations in Santee are , and Installation, Maintenance & Repair (6 | 1.0%).
Natural Resources, Construction and Maintenance Occupations by Sex
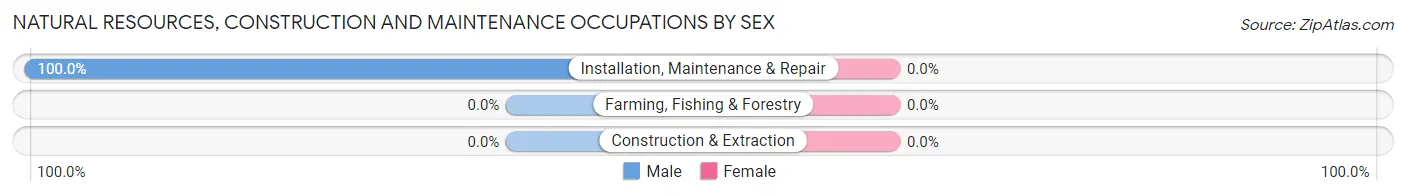
| Occupation | Male | Female |
| Farming, Fishing & Forestry | 0 (0.0%) | 0 (0.0%) |
| Construction & Extraction | 0 (0.0%) | 0 (0.0%) |
| Installation, Maintenance & Repair | 6 (100.0%) | 0 (0.0%) |
| Total (Category) | 6 (100.0%) | 0 (0.0%) |
| Total (Overall) | 292 (49.1%) | 303 (50.9%) |
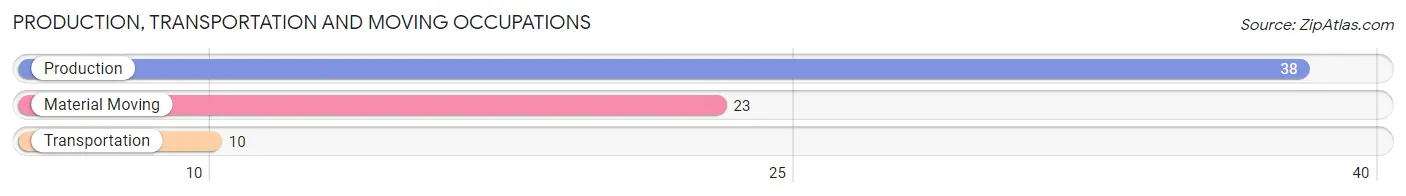
Production, Transportation and Moving Occupations
The most common Production, Transportation and Moving occupations in Santee are Production (38 | 6.4%), Material Moving (23 | 3.9%), and Transportation (10 | 1.7%).
Production, Transportation and Moving Occupations by Sex
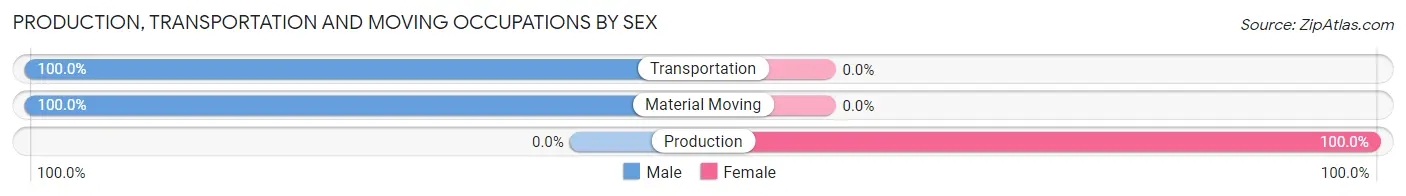
| Occupation | Male | Female |
| Production | 0 (0.0%) | 38 (100.0%) |
| Transportation | 10 (100.0%) | 0 (0.0%) |
| Material Moving | 23 (100.0%) | 0 (0.0%) |
| Total (Category) | 33 (46.5%) | 38 (53.5%) |
| Total (Overall) | 292 (49.1%) | 303 (50.9%) |
Employment Industries by Sex in Santee
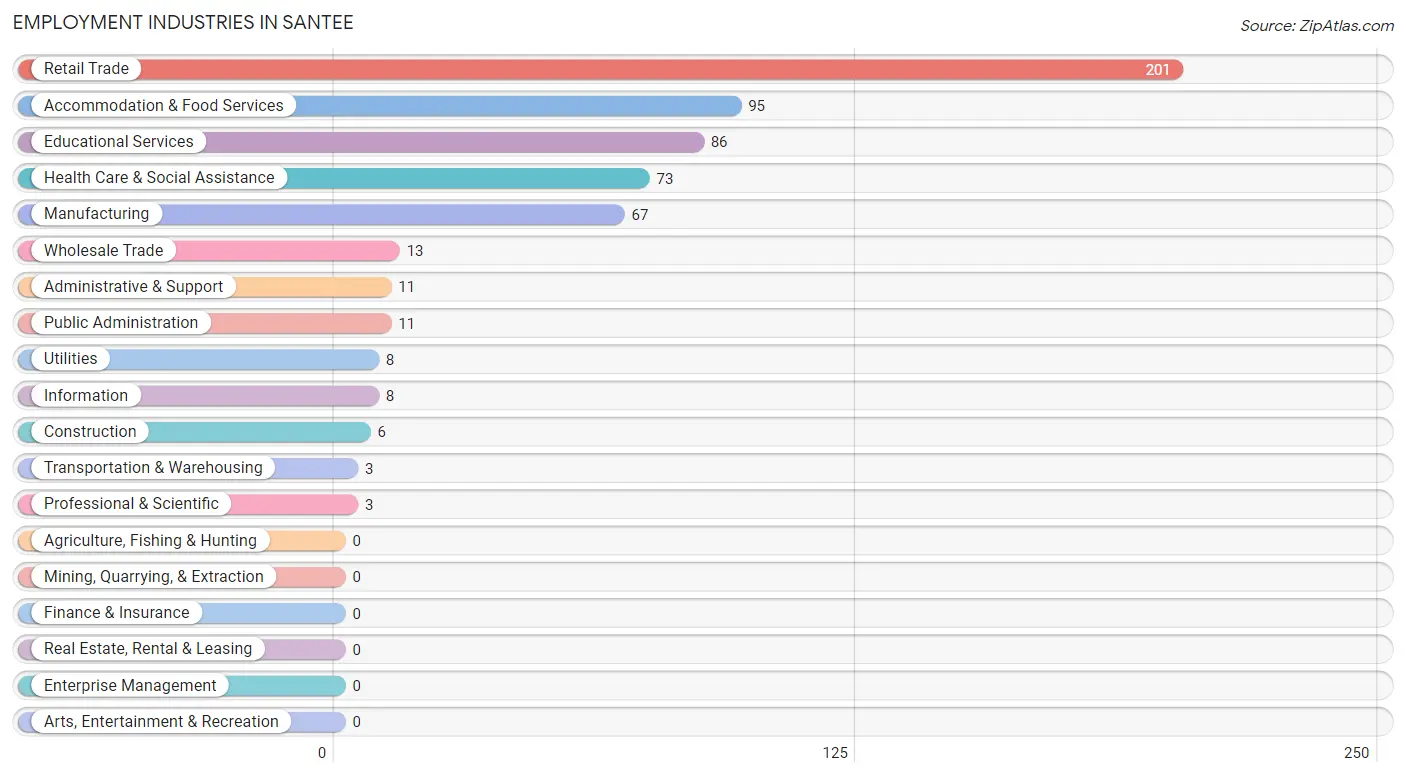
Employment Industries in Santee
The major employment industries in Santee include Retail Trade (201 | 33.8%), Accommodation & Food Services (95 | 16.0%), Educational Services (86 | 14.4%), Health Care & Social Assistance (73 | 12.3%), and Manufacturing (67 | 11.3%).
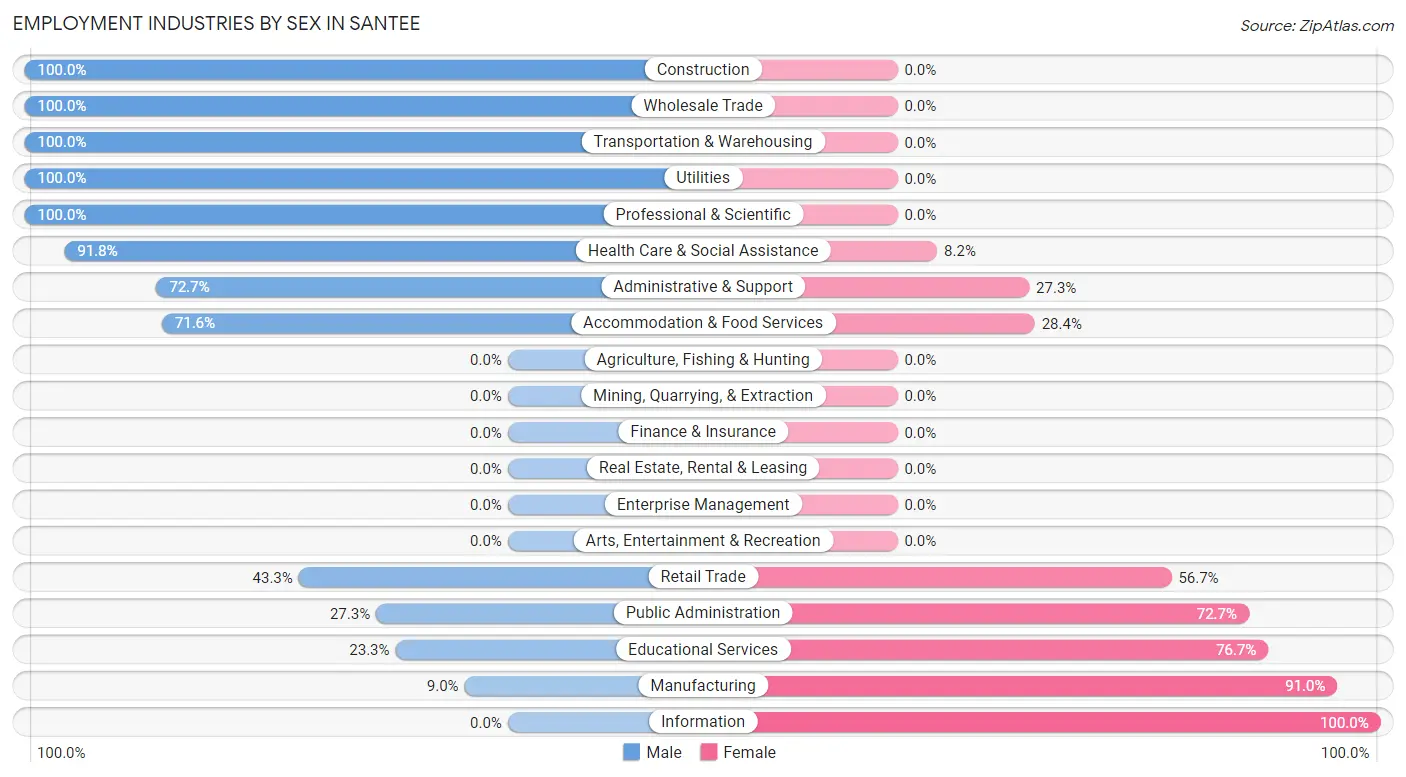
Employment Industries by Sex in Santee
The Santee industries that see more men than women are Construction (100.0%), Wholesale Trade (100.0%), and Transportation & Warehousing (100.0%), whereas the industries that tend to have a higher number of women are Information (100.0%), Manufacturing (91.0%), and Educational Services (76.7%).
| Industry | Male | Female |
| Agriculture, Fishing & Hunting | 0 (0.0%) | 0 (0.0%) |
| Mining, Quarrying, & Extraction | 0 (0.0%) | 0 (0.0%) |
| Construction | 6 (100.0%) | 0 (0.0%) |
| Manufacturing | 6 (9.0%) | 61 (91.0%) |
| Wholesale Trade | 13 (100.0%) | 0 (0.0%) |
| Retail Trade | 87 (43.3%) | 114 (56.7%) |
| Transportation & Warehousing | 3 (100.0%) | 0 (0.0%) |
| Utilities | 8 (100.0%) | 0 (0.0%) |
| Information | 0 (0.0%) | 8 (100.0%) |
| Finance & Insurance | 0 (0.0%) | 0 (0.0%) |
| Real Estate, Rental & Leasing | 0 (0.0%) | 0 (0.0%) |
| Professional & Scientific | 3 (100.0%) | 0 (0.0%) |
| Enterprise Management | 0 (0.0%) | 0 (0.0%) |
| Administrative & Support | 8 (72.7%) | 3 (27.3%) |
| Educational Services | 20 (23.3%) | 66 (76.7%) |
| Health Care & Social Assistance | 67 (91.8%) | 6 (8.2%) |
| Arts, Entertainment & Recreation | 0 (0.0%) | 0 (0.0%) |
| Accommodation & Food Services | 68 (71.6%) | 27 (28.4%) |
| Public Administration | 3 (27.3%) | 8 (72.7%) |
| Total | 292 (49.1%) | 303 (50.9%) |
Education in Santee
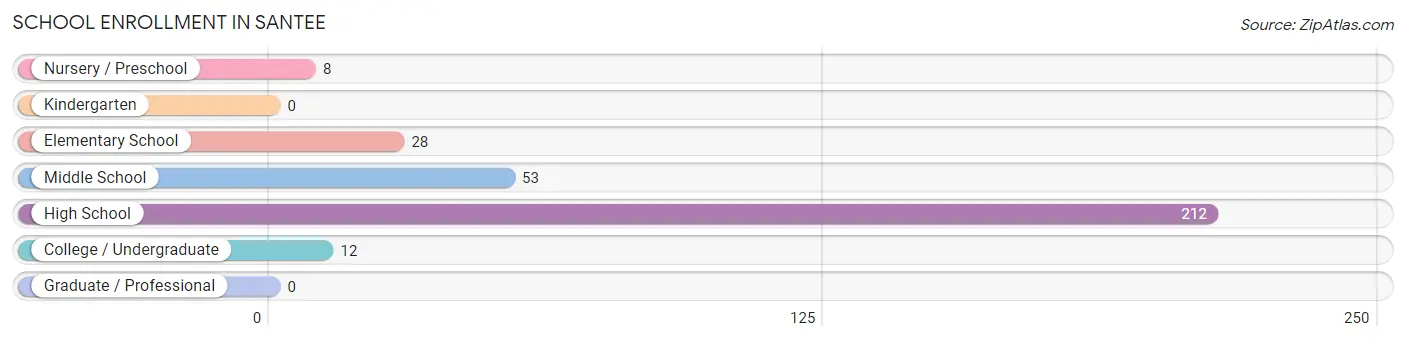
School Enrollment in Santee
The most common levels of schooling among the 313 students in Santee are high school (212 | 67.7%), middle school (53 | 16.9%), and elementary school (28 | 8.9%).
| School Level | # Students | % Students |
| Nursery / Preschool | 8 | 2.6% |
| Kindergarten | 0 | 0.0% |
| Elementary School | 28 | 8.9% |
| Middle School | 53 | 16.9% |
| High School | 212 | 67.7% |
| College / Undergraduate | 12 | 3.8% |
| Graduate / Professional | 0 | 0.0% |
| Total | 313 | 100.0% |
School Enrollment by Age by Funding Source in Santee
Out of a total of 313 students who are enrolled in schools in Santee, 8 (2.6%) attend a private institution, while the remaining 305 (97.4%) are enrolled in public schools. The age group of 3 to 4 year olds has the highest likelihood of being enrolled in private schools, with 8 (100.0% in the age bracket) enrolled. Conversely, the age group of 5 to 9 year old has the lowest likelihood of being enrolled in a private school, with 28 (100.0% in the age bracket) attending a public institution.
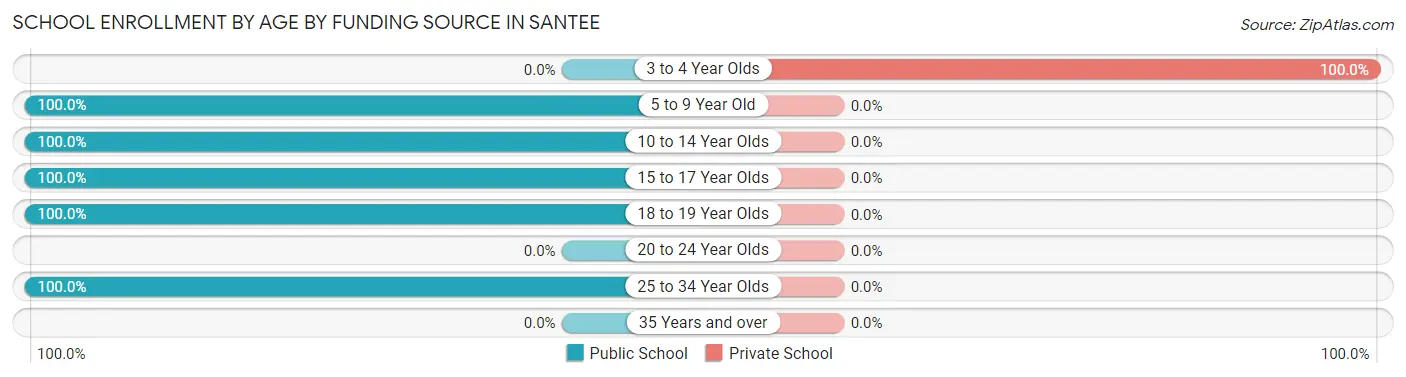
| Age Bracket | Public School | Private School |
| 3 to 4 Year Olds | 0 (0.0%) | 8 (100.0%) |
| 5 to 9 Year Old | 28 (100.0%) | 0 (0.0%) |
| 10 to 14 Year Olds | 127 (100.0%) | 0 (0.0%) |
| 15 to 17 Year Olds | 117 (100.0%) | 0 (0.0%) |
| 18 to 19 Year Olds | 21 (100.0%) | 0 (0.0%) |
| 20 to 24 Year Olds | 0 (0.0%) | 0 (0.0%) |
| 25 to 34 Year Olds | 12 (100.0%) | 0 (0.0%) |
| 35 Years and over | 0 (0.0%) | 0 (0.0%) |
| Total | 305 (97.4%) | 8 (2.6%) |
Educational Attainment by Field of Study in Santee
Education (89 | 36.5%), computers & mathematics (67 | 27.5%), business (37 | 15.2%), arts & humanities (21 | 8.6%), and engineering (8 | 3.3%) are the most common fields of study among 244 individuals in Santee who have obtained a bachelor's degree or higher.
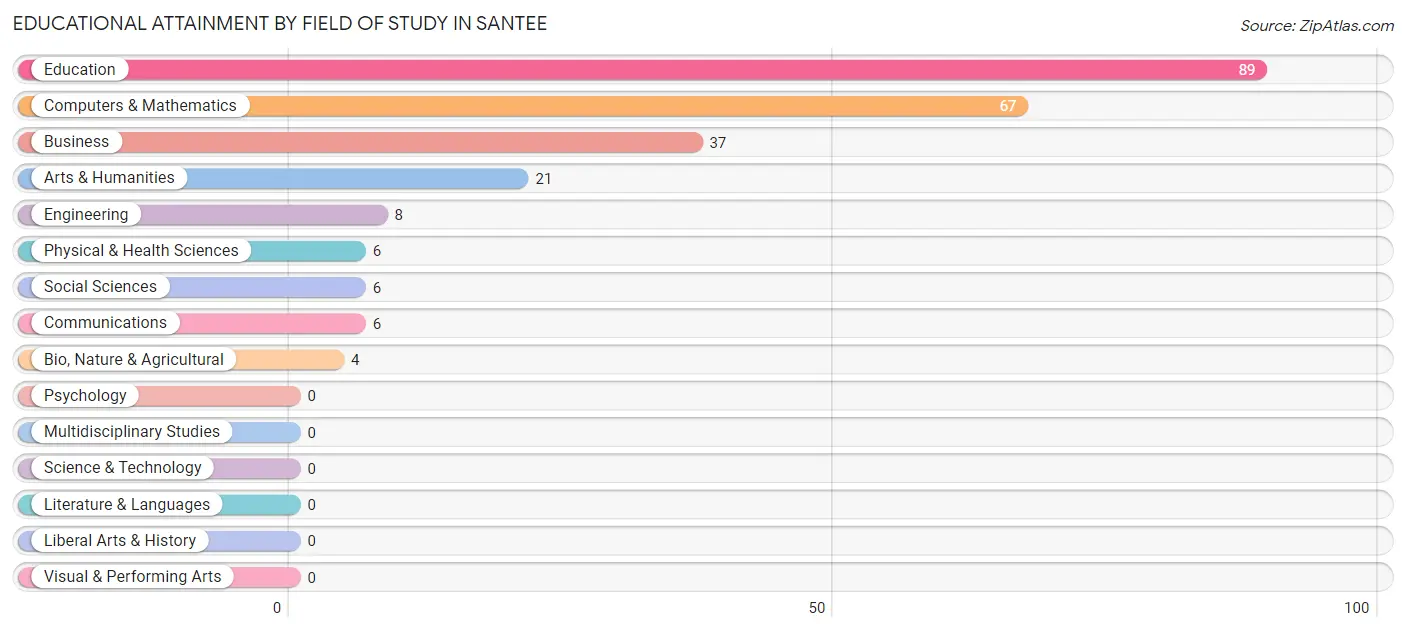
| Field of Study | # Graduates | % Graduates |
| Computers & Mathematics | 67 | 27.5% |
| Bio, Nature & Agricultural | 4 | 1.6% |
| Physical & Health Sciences | 6 | 2.5% |
| Psychology | 0 | 0.0% |
| Social Sciences | 6 | 2.5% |
| Engineering | 8 | 3.3% |
| Multidisciplinary Studies | 0 | 0.0% |
| Science & Technology | 0 | 0.0% |
| Business | 37 | 15.2% |
| Education | 89 | 36.5% |
| Literature & Languages | 0 | 0.0% |
| Liberal Arts & History | 0 | 0.0% |
| Visual & Performing Arts | 0 | 0.0% |
| Communications | 6 | 2.5% |
| Arts & Humanities | 21 | 8.6% |
| Total | 244 | 100.0% |
Transportation & Commute in Santee
Vehicle Availability by Sex in Santee
The most prevalent vehicle ownership categories in Santee are males with 2 vehicles (101, accounting for 34.6%) and females with 2 vehicles (134, making up 33.4%).
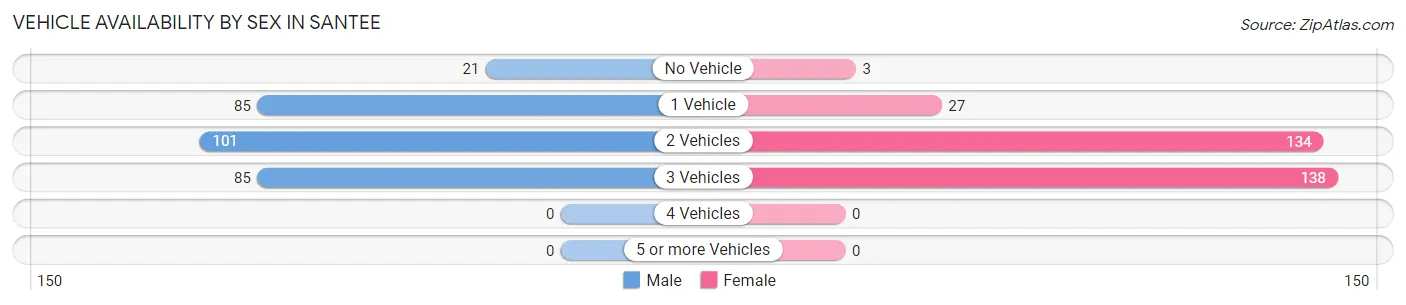
| Vehicles Available | Male | Female |
| No Vehicle | 21 (7.2%) | 3 (1.0%) |
| 1 Vehicle | 85 (29.1%) | 27 (8.9%) |
| 2 Vehicles | 101 (34.6%) | 134 (44.4%) |
| 3 Vehicles | 85 (29.1%) | 138 (45.7%) |
| 4 Vehicles | 0 (0.0%) | 0 (0.0%) |
| 5 or more Vehicles | 0 (0.0%) | 0 (0.0%) |
| Total | 292 (100.0%) | 302 (100.0%) |
Commute Time in Santee
The most frequently occuring commute durations in Santee are 5 to 9 minutes (141 commuters, 24.5%), 10 to 14 minutes (109 commuters, 18.9%), and 30 to 34 minutes (89 commuters, 15.4%).
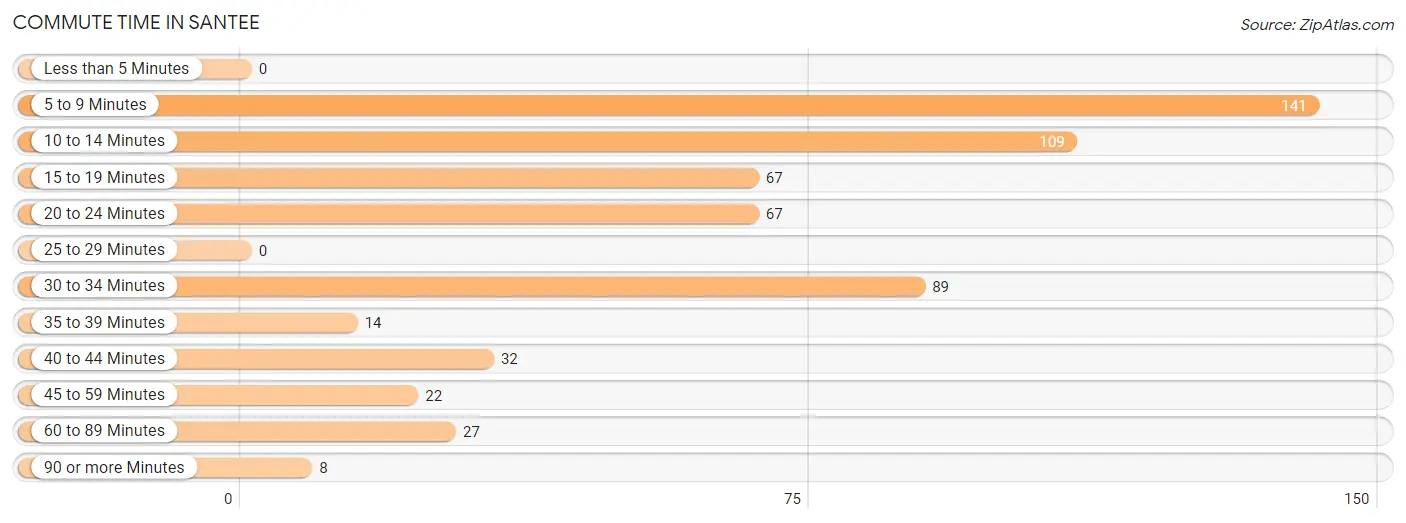
| Commute Time | # Commuters | % Commuters |
| Less than 5 Minutes | 0 | 0.0% |
| 5 to 9 Minutes | 141 | 24.5% |
| 10 to 14 Minutes | 109 | 18.9% |
| 15 to 19 Minutes | 67 | 11.6% |
| 20 to 24 Minutes | 67 | 11.6% |
| 25 to 29 Minutes | 0 | 0.0% |
| 30 to 34 Minutes | 89 | 15.4% |
| 35 to 39 Minutes | 14 | 2.4% |
| 40 to 44 Minutes | 32 | 5.6% |
| 45 to 59 Minutes | 22 | 3.8% |
| 60 to 89 Minutes | 27 | 4.7% |
| 90 or more Minutes | 8 | 1.4% |
Commute Time by Sex in Santee
The most common commute times in Santee are 30 to 34 minutes (83 commuters, 29.2%) for males and 5 to 9 minutes (101 commuters, 34.6%) for females.
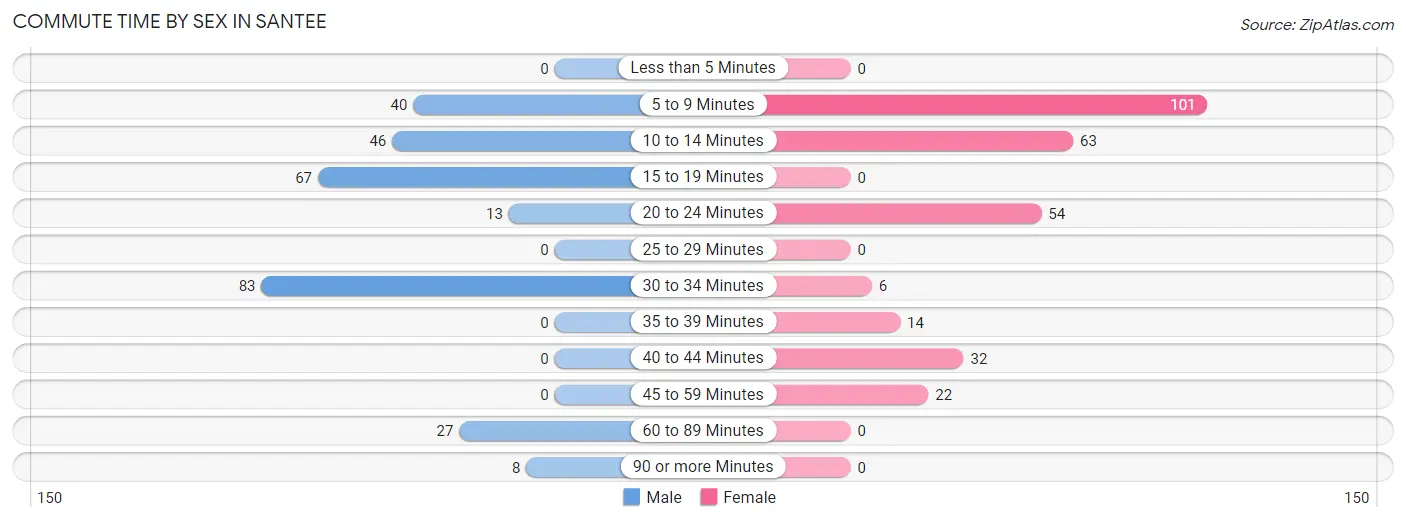
| Commute Time | Male | Female |
| Less than 5 Minutes | 0 (0.0%) | 0 (0.0%) |
| 5 to 9 Minutes | 40 (14.1%) | 101 (34.6%) |
| 10 to 14 Minutes | 46 (16.2%) | 63 (21.6%) |
| 15 to 19 Minutes | 67 (23.6%) | 0 (0.0%) |
| 20 to 24 Minutes | 13 (4.6%) | 54 (18.5%) |
| 25 to 29 Minutes | 0 (0.0%) | 0 (0.0%) |
| 30 to 34 Minutes | 83 (29.2%) | 6 (2.1%) |
| 35 to 39 Minutes | 0 (0.0%) | 14 (4.8%) |
| 40 to 44 Minutes | 0 (0.0%) | 32 (11.0%) |
| 45 to 59 Minutes | 0 (0.0%) | 22 (7.5%) |
| 60 to 89 Minutes | 27 (9.5%) | 0 (0.0%) |
| 90 or more Minutes | 8 (2.8%) | 0 (0.0%) |
Time of Departure to Work by Sex in Santee
The most frequent times of departure to work in Santee are 7:00 AM to 7:29 AM (144, 50.7%) for males and 4:00 PM to 11:59 PM (122, 41.8%) for females.
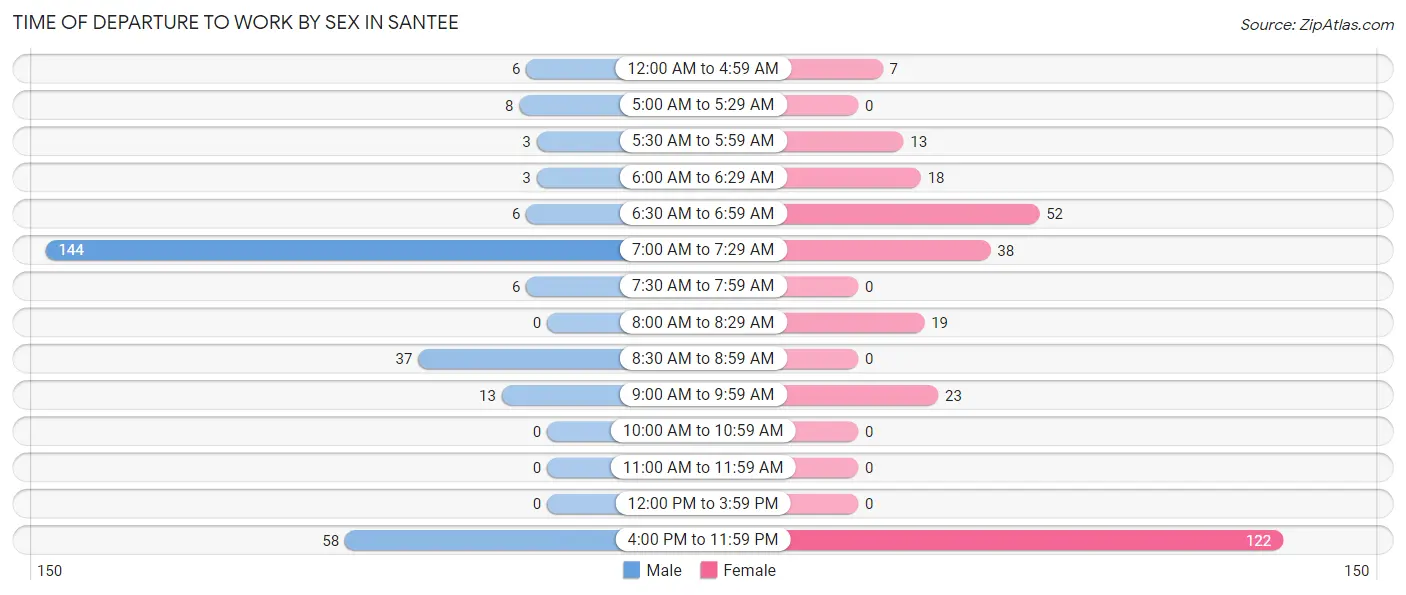
| Time of Departure | Male | Female |
| 12:00 AM to 4:59 AM | 6 (2.1%) | 7 (2.4%) |
| 5:00 AM to 5:29 AM | 8 (2.8%) | 0 (0.0%) |
| 5:30 AM to 5:59 AM | 3 (1.1%) | 13 (4.4%) |
| 6:00 AM to 6:29 AM | 3 (1.1%) | 18 (6.2%) |
| 6:30 AM to 6:59 AM | 6 (2.1%) | 52 (17.8%) |
| 7:00 AM to 7:29 AM | 144 (50.7%) | 38 (13.0%) |
| 7:30 AM to 7:59 AM | 6 (2.1%) | 0 (0.0%) |
| 8:00 AM to 8:29 AM | 0 (0.0%) | 19 (6.5%) |
| 8:30 AM to 8:59 AM | 37 (13.0%) | 0 (0.0%) |
| 9:00 AM to 9:59 AM | 13 (4.6%) | 23 (7.9%) |
| 10:00 AM to 10:59 AM | 0 (0.0%) | 0 (0.0%) |
| 11:00 AM to 11:59 AM | 0 (0.0%) | 0 (0.0%) |
| 12:00 PM to 3:59 PM | 0 (0.0%) | 0 (0.0%) |
| 4:00 PM to 11:59 PM | 58 (20.4%) | 122 (41.8%) |
| Total | 284 (100.0%) | 292 (100.0%) |
Housing Occupancy in Santee
Occupancy by Ownership in Santee
Of the total 442 dwellings in Santee, owner-occupied units account for 313 (70.8%), while renter-occupied units make up 129 (29.2%).
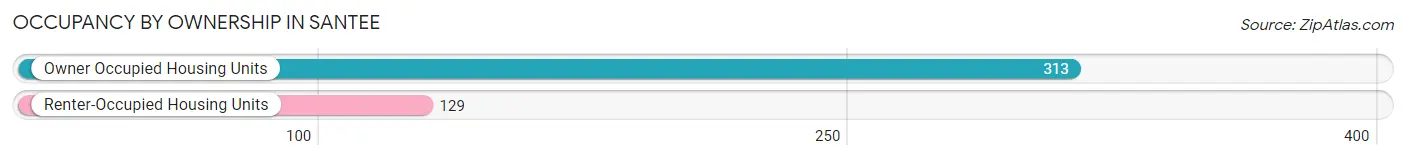
| Occupancy | # Housing Units | % Housing Units |
| Owner Occupied Housing Units | 313 | 70.8% |
| Renter-Occupied Housing Units | 129 | 29.2% |
| Total Occupied Housing Units | 442 | 100.0% |
Occupancy by Household Size in Santee
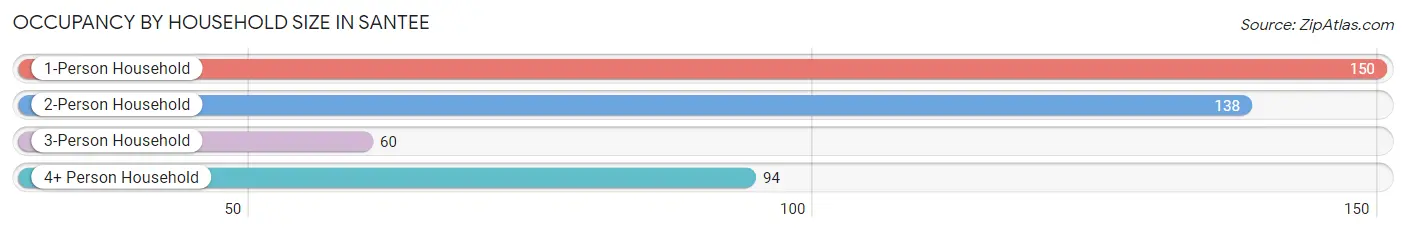
| Household Size | # Housing Units | % Housing Units |
| 1-Person Household | 150 | 33.9% |
| 2-Person Household | 138 | 31.2% |
| 3-Person Household | 60 | 13.6% |
| 4+ Person Household | 94 | 21.3% |
| Total Housing Units | 442 | 100.0% |
Occupancy by Ownership by Household Size in Santee
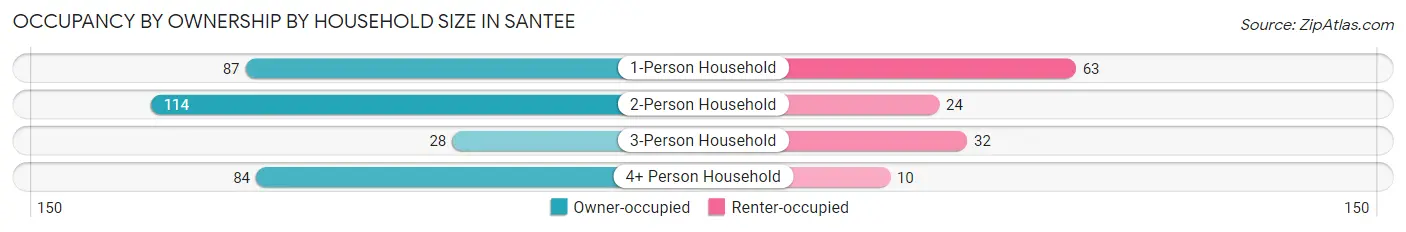
| Household Size | Owner-occupied | Renter-occupied |
| 1-Person Household | 87 (58.0%) | 63 (42.0%) |
| 2-Person Household | 114 (82.6%) | 24 (17.4%) |
| 3-Person Household | 28 (46.7%) | 32 (53.3%) |
| 4+ Person Household | 84 (89.4%) | 10 (10.6%) |
| Total Housing Units | 313 (70.8%) | 129 (29.2%) |
Occupancy by Educational Attainment in Santee
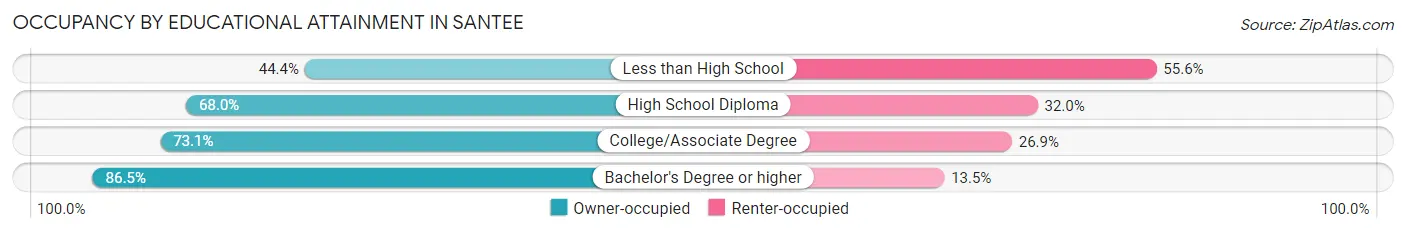
| Household Size | Owner-occupied | Renter-occupied |
| Less than High School | 32 (44.4%) | 40 (55.6%) |
| High School Diploma | 85 (68.0%) | 40 (32.0%) |
| College/Associate Degree | 87 (73.1%) | 32 (26.9%) |
| Bachelor's Degree or higher | 109 (86.5%) | 17 (13.5%) |
Occupancy by Age of Householder in Santee
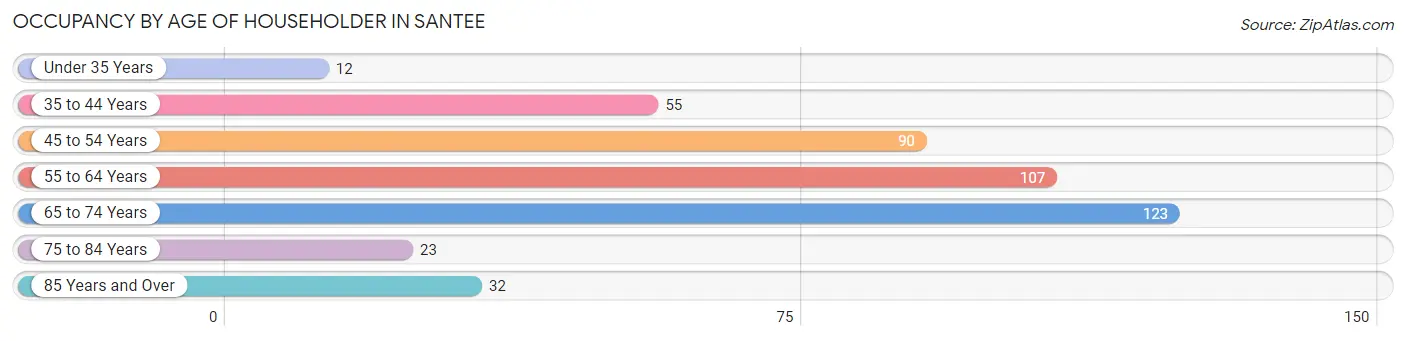
| Age Bracket | # Households | % Households |
| Under 35 Years | 12 | 2.7% |
| 35 to 44 Years | 55 | 12.4% |
| 45 to 54 Years | 90 | 20.4% |
| 55 to 64 Years | 107 | 24.2% |
| 65 to 74 Years | 123 | 27.8% |
| 75 to 84 Years | 23 | 5.2% |
| 85 Years and Over | 32 | 7.2% |
| Total | 442 | 100.0% |
Housing Finances in Santee
Median Income by Occupancy in Santee
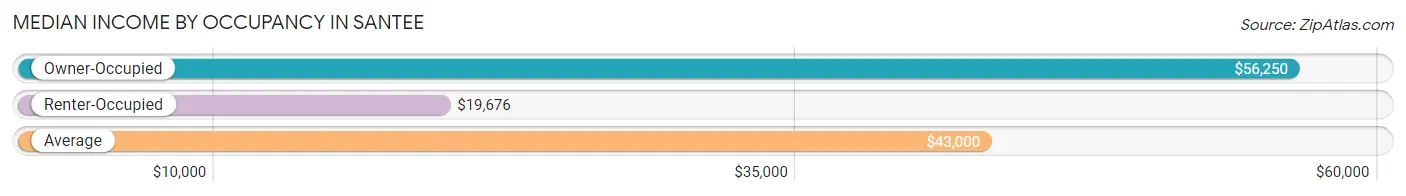
| Occupancy Type | # Households | Median Income |
| Owner-Occupied | 313 (70.8%) | $56,250 |
| Renter-Occupied | 129 (29.2%) | $19,676 |
| Average | 442 (100.0%) | $43,000 |
Occupancy by Householder Income Bracket in Santee
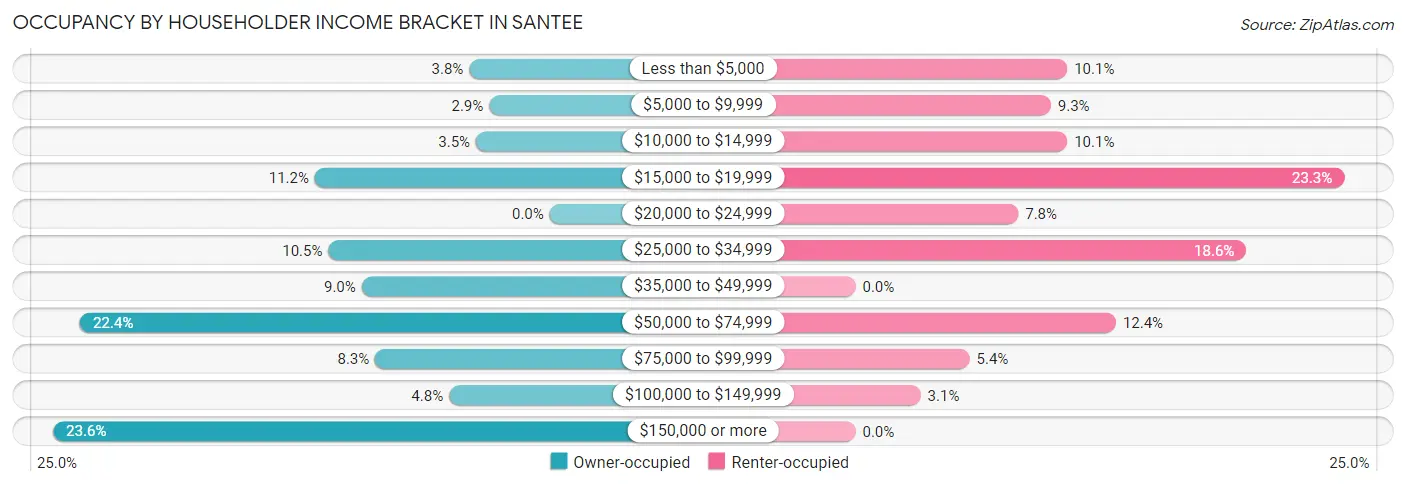
| Income Bracket | Owner-occupied | Renter-occupied |
| Less than $5,000 | 12 (3.8%) | 13 (10.1%) |
| $5,000 to $9,999 | 9 (2.9%) | 12 (9.3%) |
| $10,000 to $14,999 | 11 (3.5%) | 13 (10.1%) |
| $15,000 to $19,999 | 35 (11.2%) | 30 (23.3%) |
| $20,000 to $24,999 | 0 (0.0%) | 10 (7.7%) |
| $25,000 to $34,999 | 33 (10.5%) | 24 (18.6%) |
| $35,000 to $49,999 | 28 (8.9%) | 0 (0.0%) |
| $50,000 to $74,999 | 70 (22.4%) | 16 (12.4%) |
| $75,000 to $99,999 | 26 (8.3%) | 7 (5.4%) |
| $100,000 to $149,999 | 15 (4.8%) | 4 (3.1%) |
| $150,000 or more | 74 (23.6%) | 0 (0.0%) |
| Total | 313 (100.0%) | 129 (100.0%) |
Monthly Housing Cost Tiers in Santee
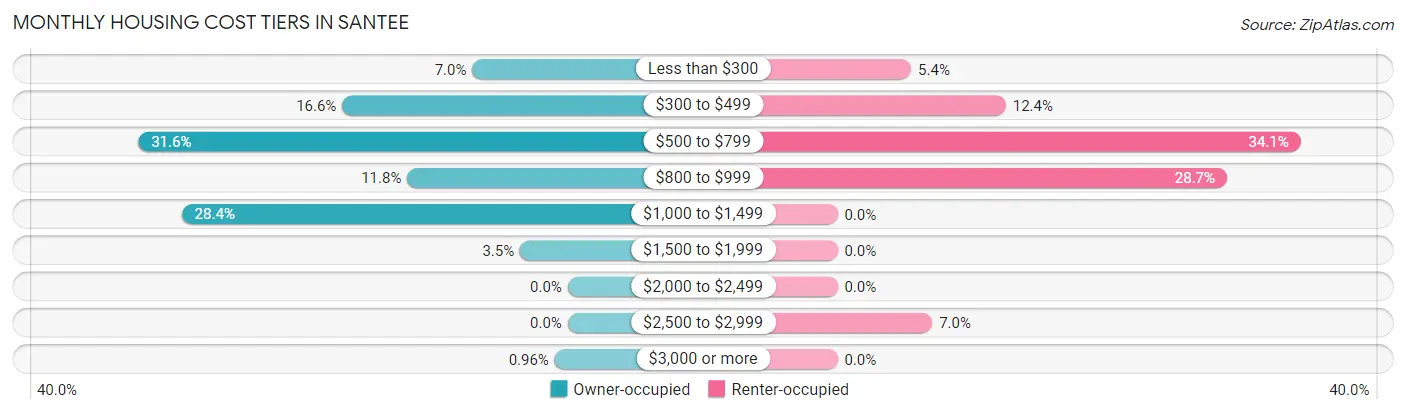
| Monthly Cost | Owner-occupied | Renter-occupied |
| Less than $300 | 22 (7.0%) | 7 (5.4%) |
| $300 to $499 | 52 (16.6%) | 16 (12.4%) |
| $500 to $799 | 99 (31.6%) | 44 (34.1%) |
| $800 to $999 | 37 (11.8%) | 37 (28.7%) |
| $1,000 to $1,499 | 89 (28.4%) | 0 (0.0%) |
| $1,500 to $1,999 | 11 (3.5%) | 0 (0.0%) |
| $2,000 to $2,499 | 0 (0.0%) | 0 (0.0%) |
| $2,500 to $2,999 | 0 (0.0%) | 9 (7.0%) |
| $3,000 or more | 3 (1.0%) | 0 (0.0%) |
| Total | 313 (100.0%) | 129 (100.0%) |
Physical Housing Characteristics in Santee
Housing Structures in Santee
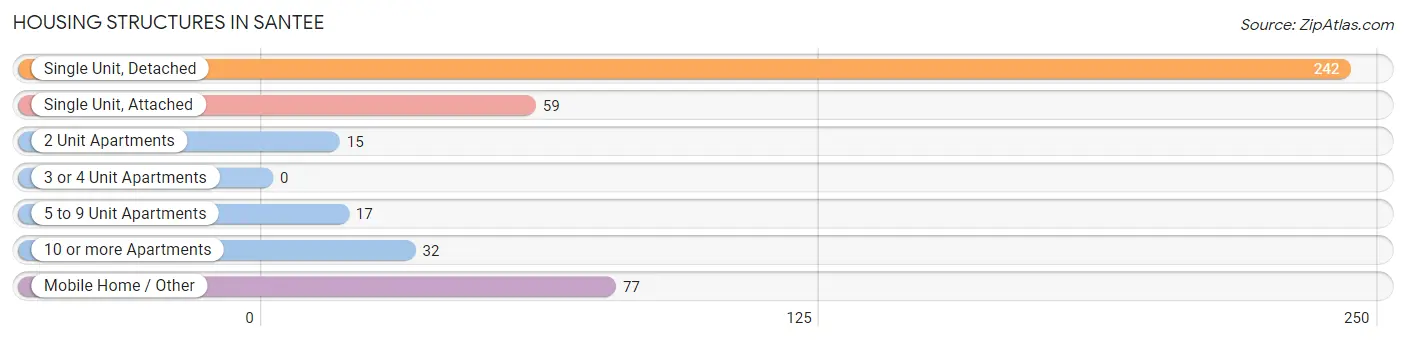
| Structure Type | # Housing Units | % Housing Units |
| Single Unit, Detached | 242 | 54.7% |
| Single Unit, Attached | 59 | 13.4% |
| 2 Unit Apartments | 15 | 3.4% |
| 3 or 4 Unit Apartments | 0 | 0.0% |
| 5 to 9 Unit Apartments | 17 | 3.8% |
| 10 or more Apartments | 32 | 7.2% |
| Mobile Home / Other | 77 | 17.4% |
| Total | 442 | 100.0% |
Housing Structures by Occupancy in Santee
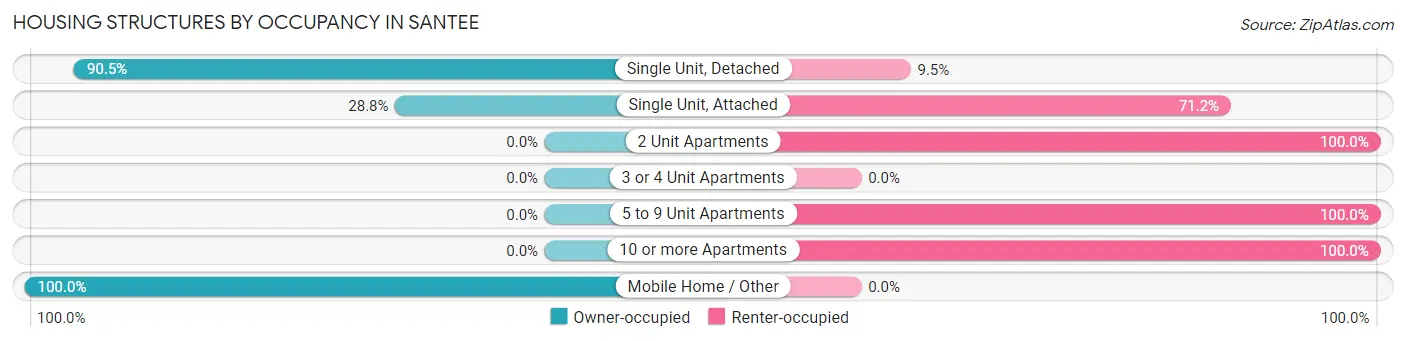
| Structure Type | Owner-occupied | Renter-occupied |
| Single Unit, Detached | 219 (90.5%) | 23 (9.5%) |
| Single Unit, Attached | 17 (28.8%) | 42 (71.2%) |
| 2 Unit Apartments | 0 (0.0%) | 15 (100.0%) |
| 3 or 4 Unit Apartments | 0 (0.0%) | 0 (0.0%) |
| 5 to 9 Unit Apartments | 0 (0.0%) | 17 (100.0%) |
| 10 or more Apartments | 0 (0.0%) | 32 (100.0%) |
| Mobile Home / Other | 77 (100.0%) | 0 (0.0%) |
| Total | 313 (70.8%) | 129 (29.2%) |
Housing Structures by Number of Rooms in Santee
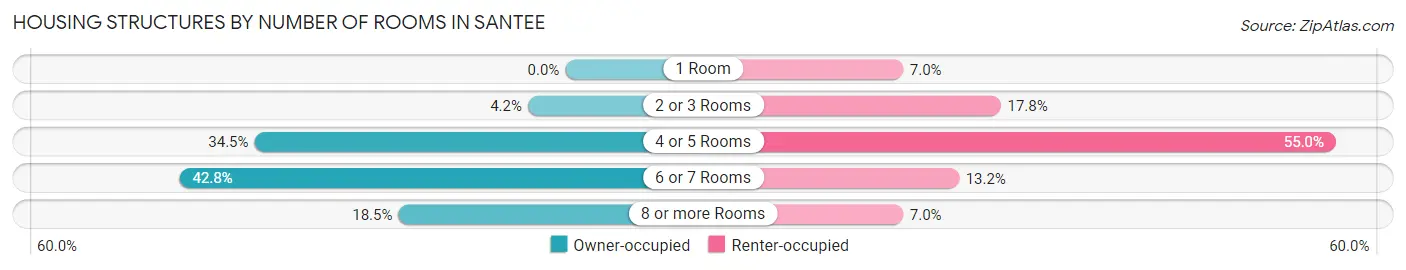
| Number of Rooms | Owner-occupied | Renter-occupied |
| 1 Room | 0 (0.0%) | 9 (7.0%) |
| 2 or 3 Rooms | 13 (4.2%) | 23 (17.8%) |
| 4 or 5 Rooms | 108 (34.5%) | 71 (55.0%) |
| 6 or 7 Rooms | 134 (42.8%) | 17 (13.2%) |
| 8 or more Rooms | 58 (18.5%) | 9 (7.0%) |
| Total | 313 (100.0%) | 129 (100.0%) |
Housing Structure by Heating Type in Santee
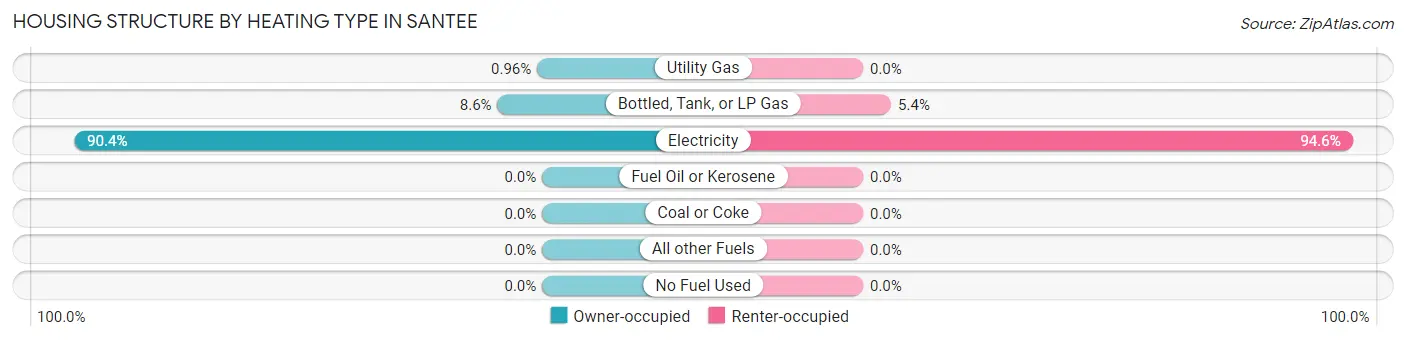
| Heating Type | Owner-occupied | Renter-occupied |
| Utility Gas | 3 (1.0%) | 0 (0.0%) |
| Bottled, Tank, or LP Gas | 27 (8.6%) | 7 (5.4%) |
| Electricity | 283 (90.4%) | 122 (94.6%) |
| Fuel Oil or Kerosene | 0 (0.0%) | 0 (0.0%) |
| Coal or Coke | 0 (0.0%) | 0 (0.0%) |
| All other Fuels | 0 (0.0%) | 0 (0.0%) |
| No Fuel Used | 0 (0.0%) | 0 (0.0%) |
| Total | 313 (100.0%) | 129 (100.0%) |
Household Vehicle Usage in Santee
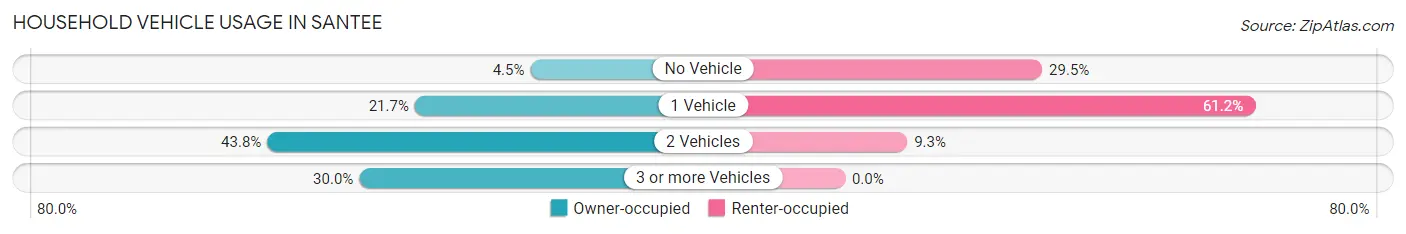
| Vehicles per Household | Owner-occupied | Renter-occupied |
| No Vehicle | 14 (4.5%) | 38 (29.5%) |
| 1 Vehicle | 68 (21.7%) | 79 (61.2%) |
| 2 Vehicles | 137 (43.8%) | 12 (9.3%) |
| 3 or more Vehicles | 94 (30.0%) | 0 (0.0%) |
| Total | 313 (100.0%) | 129 (100.0%) |
Real Estate & Mortgages in Santee
Real Estate and Mortgage Overview in Santee
| Characteristic | Without Mortgage | With Mortgage |
| Housing Units | 155 | 158 |
| Median Property Value | $141,300 | $166,700 |
| Median Household Income | $51,250 | $61 |
| Monthly Housing Costs | $506 | $3 |
| Real Estate Taxes | $1,083 | $12 |
Property Value by Mortgage Status in Santee
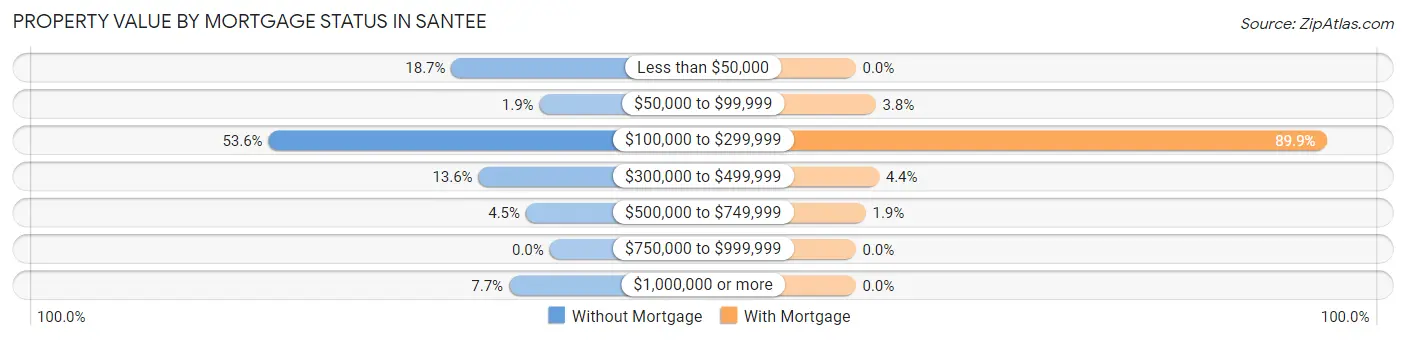
| Property Value | Without Mortgage | With Mortgage |
| Less than $50,000 | 29 (18.7%) | 0 (0.0%) |
| $50,000 to $99,999 | 3 (1.9%) | 6 (3.8%) |
| $100,000 to $299,999 | 83 (53.5%) | 142 (89.9%) |
| $300,000 to $499,999 | 21 (13.6%) | 7 (4.4%) |
| $500,000 to $749,999 | 7 (4.5%) | 3 (1.9%) |
| $750,000 to $999,999 | 0 (0.0%) | 0 (0.0%) |
| $1,000,000 or more | 12 (7.7%) | 0 (0.0%) |
| Total | 155 (100.0%) | 158 (100.0%) |
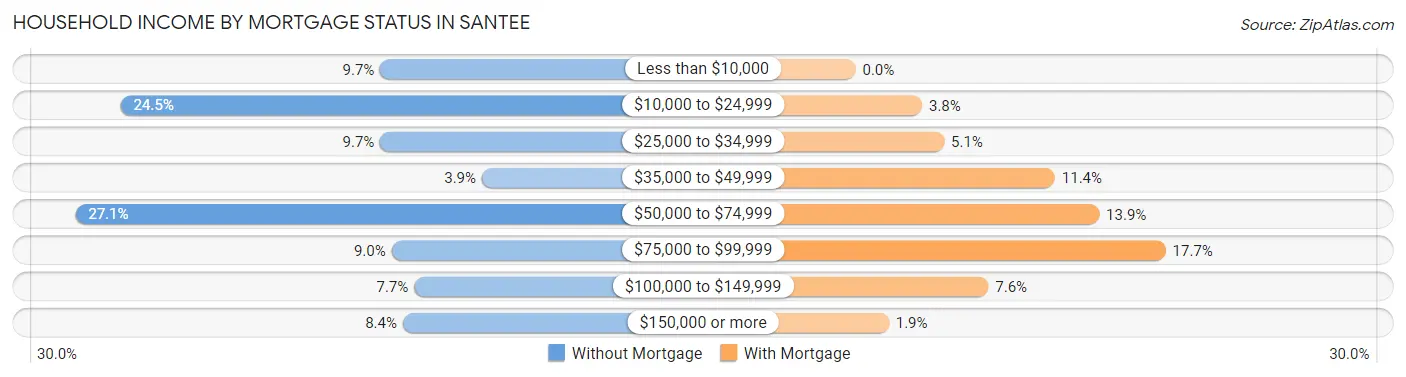
Household Income by Mortgage Status in Santee
| Household Income | Without Mortgage | With Mortgage |
| Less than $10,000 | 15 (9.7%) | 0 (0.0%) |
| $10,000 to $24,999 | 38 (24.5%) | 6 (3.8%) |
| $25,000 to $34,999 | 15 (9.7%) | 8 (5.1%) |
| $35,000 to $49,999 | 6 (3.9%) | 18 (11.4%) |
| $50,000 to $74,999 | 42 (27.1%) | 22 (13.9%) |
| $75,000 to $99,999 | 14 (9.0%) | 28 (17.7%) |
| $100,000 to $149,999 | 12 (7.7%) | 12 (7.6%) |
| $150,000 or more | 13 (8.4%) | 3 (1.9%) |
| Total | 155 (100.0%) | 158 (100.0%) |
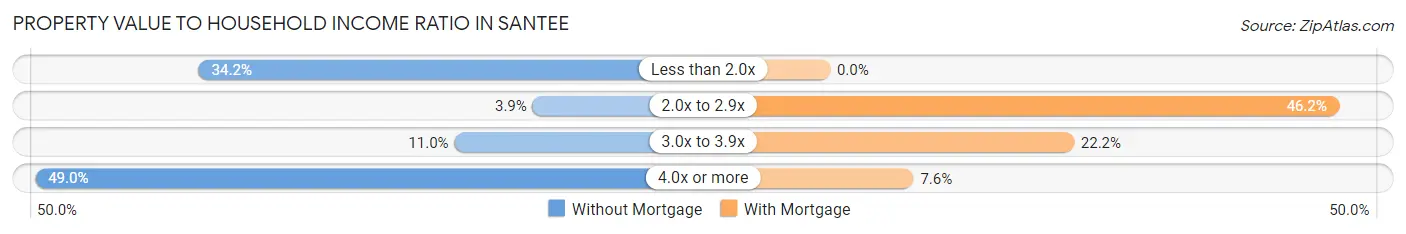
Property Value to Household Income Ratio in Santee
| Value-to-Income Ratio | Without Mortgage | With Mortgage |
| Less than 2.0x | 53 (34.2%) | 0 (0.0%) |
| 2.0x to 2.9x | 6 (3.9%) | 73 (46.2%) |
| 3.0x to 3.9x | 17 (11.0%) | 35 (22.2%) |
| 4.0x or more | 76 (49.0%) | 12 (7.6%) |
| Total | 155 (100.0%) | 158 (100.0%) |
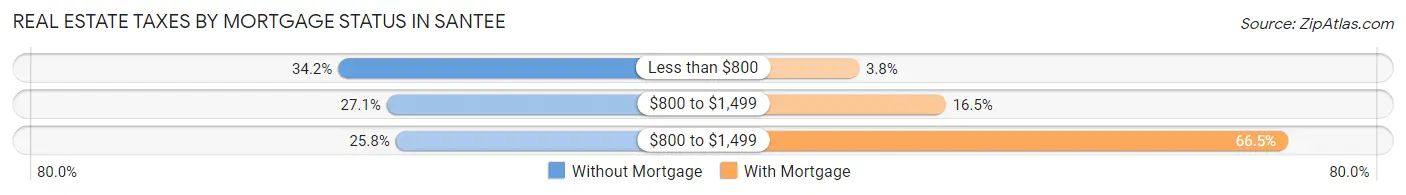
Real Estate Taxes by Mortgage Status in Santee
| Property Taxes | Without Mortgage | With Mortgage |
| Less than $800 | 53 (34.2%) | 6 (3.8%) |
| $800 to $1,499 | 42 (27.1%) | 26 (16.5%) |
| $800 to $1,499 | 40 (25.8%) | 105 (66.5%) |
| Total | 155 (100.0%) | 158 (100.0%) |
Health & Disability in Santee
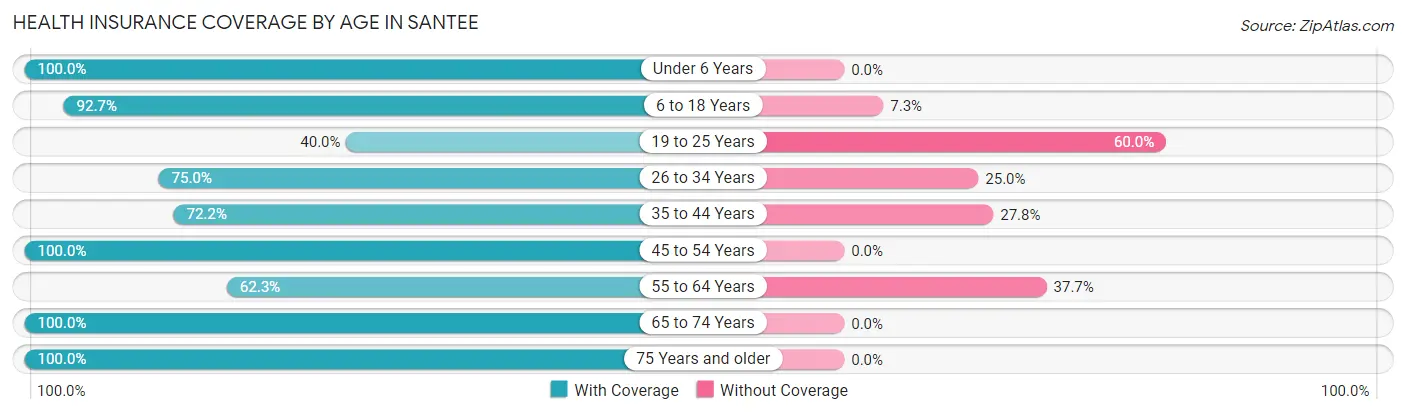
Health Insurance Coverage by Age in Santee
| Age Bracket | With Coverage | Without Coverage |
| Under 6 Years | 19 (100.0%) | 0 (0.0%) |
| 6 to 18 Years | 293 (92.7%) | 23 (7.3%) |
| 19 to 25 Years | 10 (40.0%) | 15 (60.0%) |
| 26 to 34 Years | 63 (75.0%) | 21 (25.0%) |
| 35 to 44 Years | 52 (72.2%) | 20 (27.8%) |
| 45 to 54 Years | 126 (100.0%) | 0 (0.0%) |
| 55 to 64 Years | 137 (62.3%) | 83 (37.7%) |
| 65 to 74 Years | 183 (100.0%) | 0 (0.0%) |
| 75 Years and older | 81 (100.0%) | 0 (0.0%) |
| Total | 964 (85.6%) | 162 (14.4%) |
Health Insurance Coverage by Citizenship Status in Santee
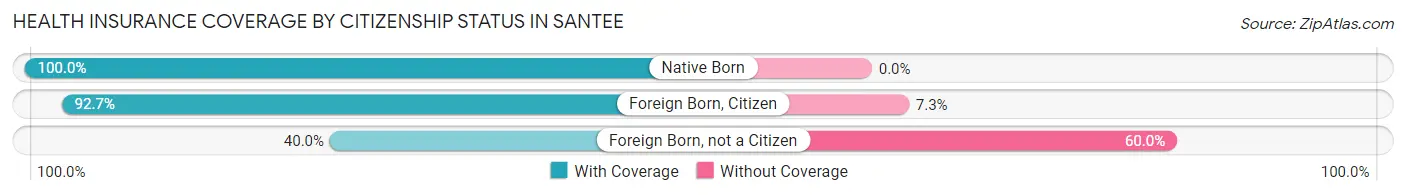
| Citizenship Status | With Coverage | Without Coverage |
| Native Born | 19 (100.0%) | 0 (0.0%) |
| Foreign Born, Citizen | 293 (92.7%) | 23 (7.3%) |
| Foreign Born, not a Citizen | 10 (40.0%) | 15 (60.0%) |
Health Insurance Coverage by Household Income in Santee
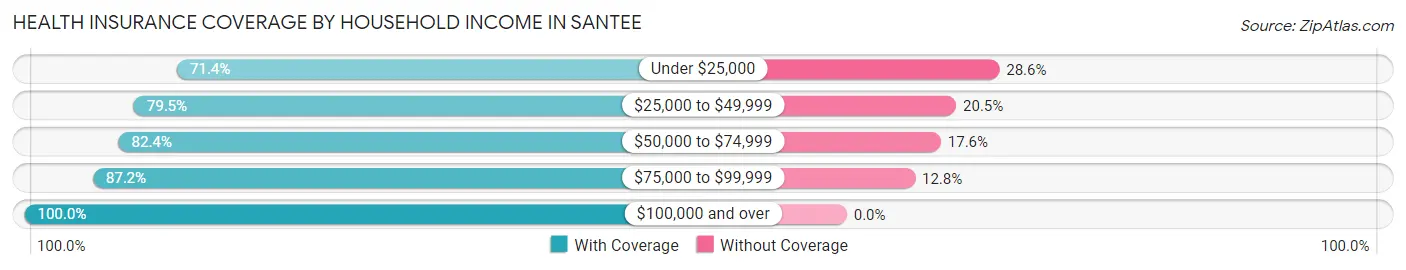
| Household Income | With Coverage | Without Coverage |
| Under $25,000 | 200 (71.4%) | 80 (28.6%) |
| $25,000 to $49,999 | 132 (79.5%) | 34 (20.5%) |
| $50,000 to $74,999 | 173 (82.4%) | 37 (17.6%) |
| $75,000 to $99,999 | 75 (87.2%) | 11 (12.8%) |
| $100,000 and over | 384 (100.0%) | 0 (0.0%) |
Public vs Private Health Insurance Coverage by Age in Santee
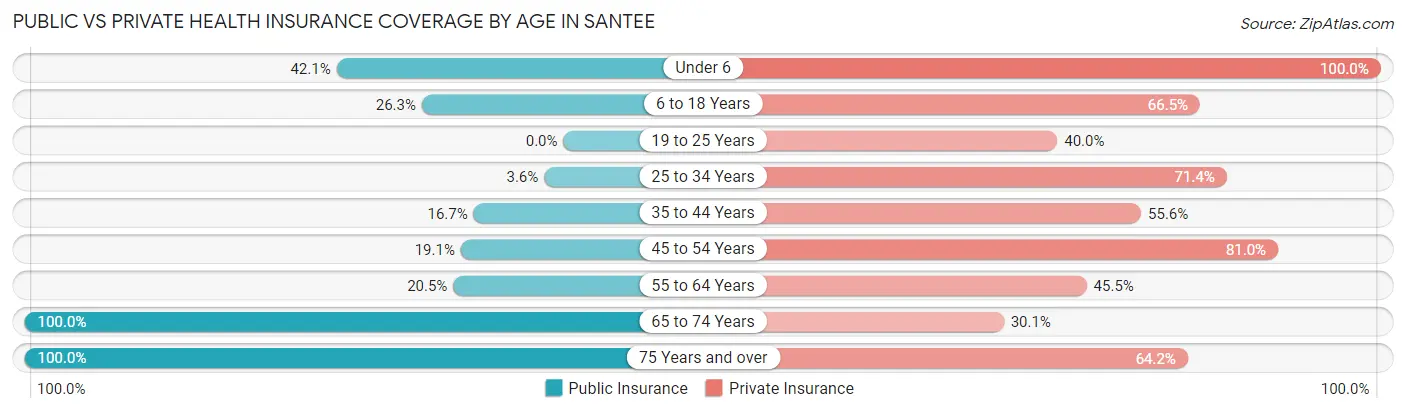
| Age Bracket | Public Insurance | Private Insurance |
| Under 6 | 8 (42.1%) | 19 (100.0%) |
| 6 to 18 Years | 83 (26.3%) | 210 (66.5%) |
| 19 to 25 Years | 0 (0.0%) | 10 (40.0%) |
| 25 to 34 Years | 3 (3.6%) | 60 (71.4%) |
| 35 to 44 Years | 12 (16.7%) | 40 (55.6%) |
| 45 to 54 Years | 24 (19.1%) | 102 (80.9%) |
| 55 to 64 Years | 45 (20.4%) | 100 (45.5%) |
| 65 to 74 Years | 183 (100.0%) | 55 (30.0%) |
| 75 Years and over | 81 (100.0%) | 52 (64.2%) |
| Total | 439 (39.0%) | 648 (57.6%) |
Disability Status by Sex by Age in Santee
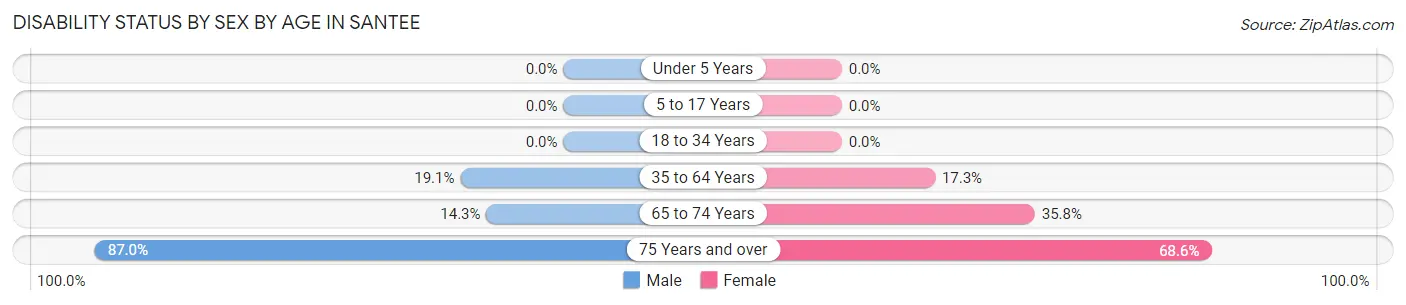
| Age Bracket | Male | Female |
| Under 5 Years | 0 (0.0%) | 0 (0.0%) |
| 5 to 17 Years | 0 (0.0%) | 0 (0.0%) |
| 18 to 34 Years | 0 (0.0%) | 0 (0.0%) |
| 35 to 64 Years | 39 (19.1%) | 37 (17.3%) |
| 65 to 74 Years | 9 (14.3%) | 43 (35.8%) |
| 75 Years and over | 40 (87.0%) | 24 (68.6%) |
Disability Class by Sex by Age in Santee
Disability Class: Hearing Difficulty
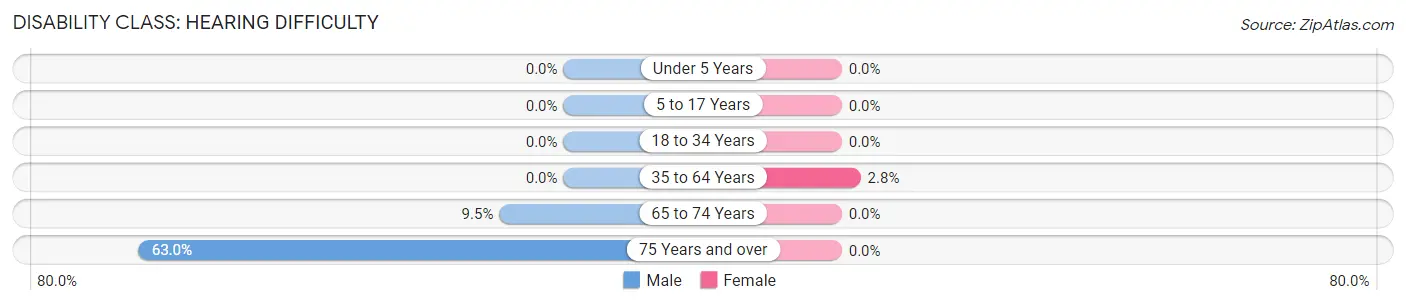
| Age Bracket | Male | Female |
| Under 5 Years | 0 (0.0%) | 0 (0.0%) |
| 5 to 17 Years | 0 (0.0%) | 0 (0.0%) |
| 18 to 34 Years | 0 (0.0%) | 0 (0.0%) |
| 35 to 64 Years | 0 (0.0%) | 6 (2.8%) |
| 65 to 74 Years | 6 (9.5%) | 0 (0.0%) |
| 75 Years and over | 29 (63.0%) | 0 (0.0%) |
Disability Class: Vision Difficulty
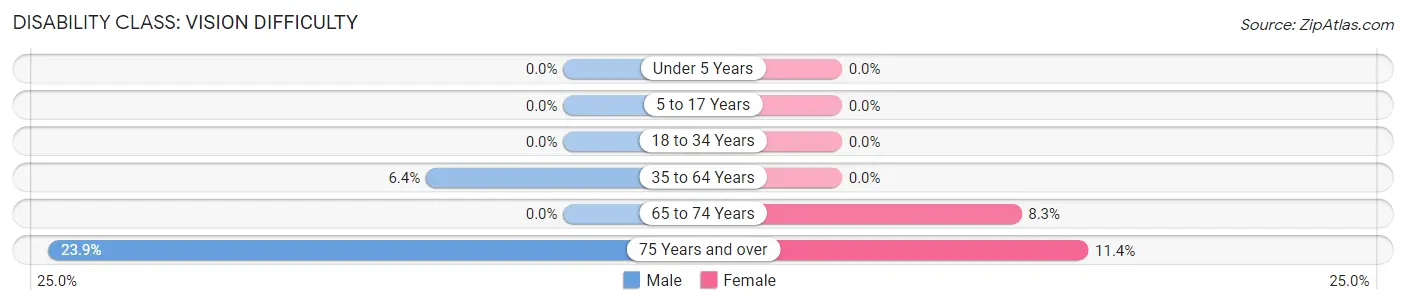
| Age Bracket | Male | Female |
| Under 5 Years | 0 (0.0%) | 0 (0.0%) |
| 5 to 17 Years | 0 (0.0%) | 0 (0.0%) |
| 18 to 34 Years | 0 (0.0%) | 0 (0.0%) |
| 35 to 64 Years | 13 (6.4%) | 0 (0.0%) |
| 65 to 74 Years | 0 (0.0%) | 10 (8.3%) |
| 75 Years and over | 11 (23.9%) | 4 (11.4%) |
Disability Class: Cognitive Difficulty
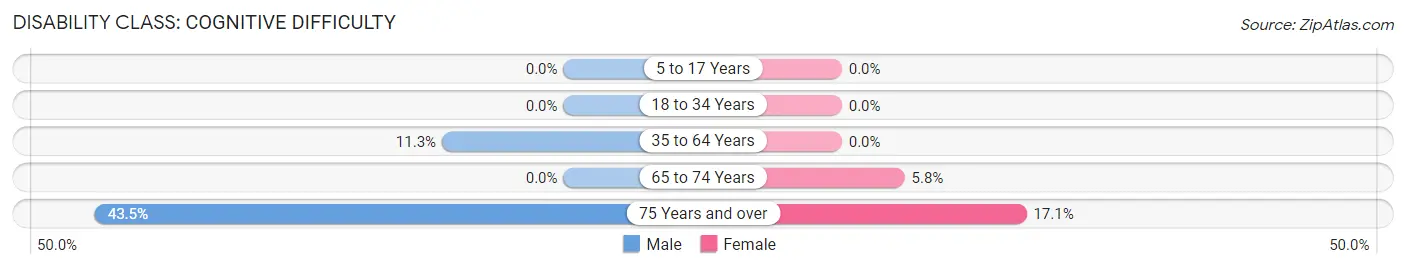
| Age Bracket | Male | Female |
| 5 to 17 Years | 0 (0.0%) | 0 (0.0%) |
| 18 to 34 Years | 0 (0.0%) | 0 (0.0%) |
| 35 to 64 Years | 23 (11.3%) | 0 (0.0%) |
| 65 to 74 Years | 0 (0.0%) | 7 (5.8%) |
| 75 Years and over | 20 (43.5%) | 6 (17.1%) |
Disability Class: Ambulatory Difficulty
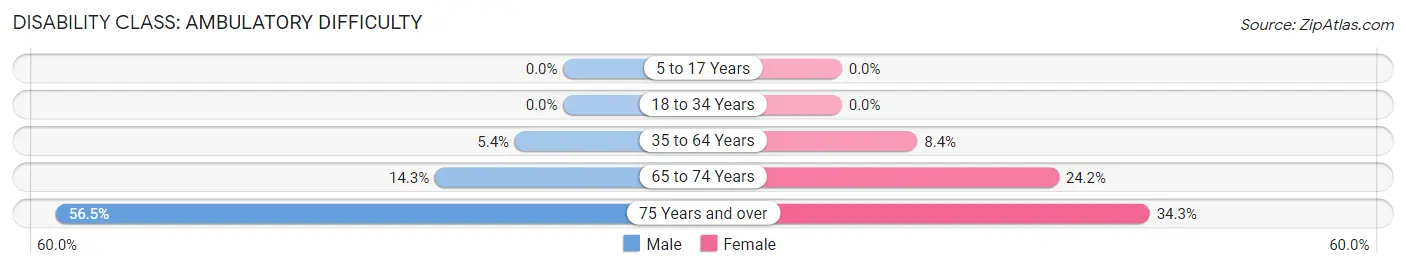
| Age Bracket | Male | Female |
| 5 to 17 Years | 0 (0.0%) | 0 (0.0%) |
| 18 to 34 Years | 0 (0.0%) | 0 (0.0%) |
| 35 to 64 Years | 11 (5.4%) | 18 (8.4%) |
| 65 to 74 Years | 9 (14.3%) | 29 (24.2%) |
| 75 Years and over | 26 (56.5%) | 12 (34.3%) |
Disability Class: Self-Care Difficulty
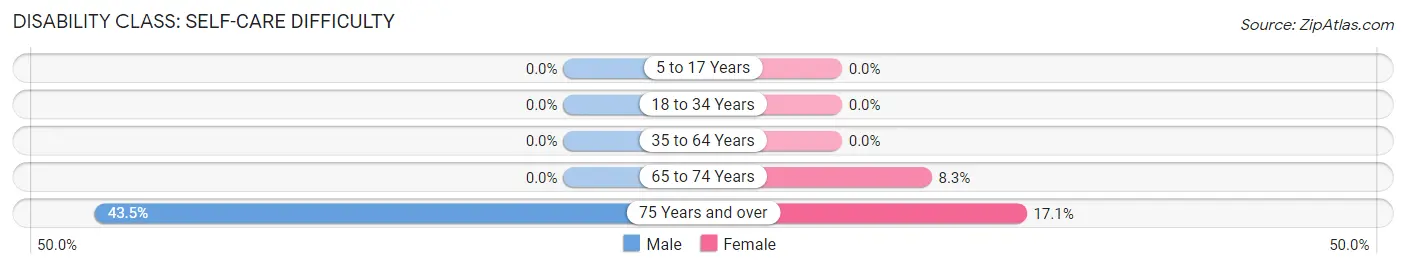
| Age Bracket | Male | Female |
| 5 to 17 Years | 0 (0.0%) | 0 (0.0%) |
| 18 to 34 Years | 0 (0.0%) | 0 (0.0%) |
| 35 to 64 Years | 0 (0.0%) | 0 (0.0%) |
| 65 to 74 Years | 0 (0.0%) | 10 (8.3%) |
| 75 Years and over | 20 (43.5%) | 6 (17.1%) |
Technology Access in Santee
Computing Device Access in Santee
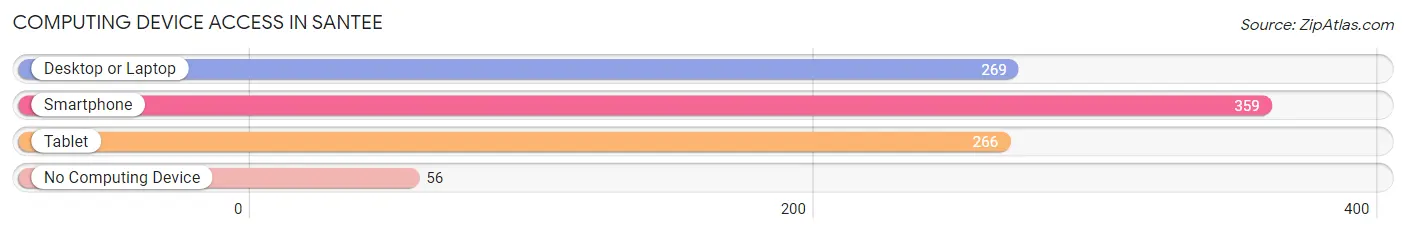
| Device Type | # Households | % Households |
| Desktop or Laptop | 269 | 60.9% |
| Smartphone | 359 | 81.2% |
| Tablet | 266 | 60.2% |
| No Computing Device | 56 | 12.7% |
| Total | 442 | 100.0% |
Internet Access in Santee
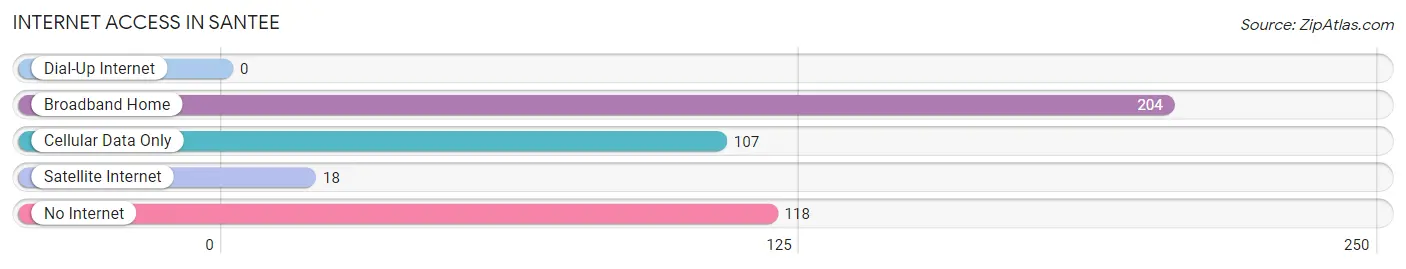
| Internet Type | # Households | % Households |
| Dial-Up Internet | 0 | 0.0% |
| Broadband Home | 204 | 46.2% |
| Cellular Data Only | 107 | 24.2% |
| Satellite Internet | 18 | 4.1% |
| No Internet | 118 | 26.7% |
| Total | 442 | 100.0% |
Santee Summary
Santee, South Carolina is a small town located in Orangeburg County, South Carolina. It is situated on the banks of Lake Marion, a large lake that is part of the Santee Cooper Lakes system. Santee is located approximately 40 miles southeast of Columbia, the state capital. The town has a population of approximately 1,500 people and is part of the Orangeburg-Calhoun-Bamberg Combined Statistical Area.
History
Santee was founded in 1717 by French Huguenots who had fled religious persecution in France. The town was named after the Santee River, which was named after the Santee Native American tribe. The town was originally a trading post and was the site of a Revolutionary War battle in 1781. The town was incorporated in 1872 and has remained relatively unchanged since then.
Geography
Santee is located in the Piedmont region of South Carolina. The town is situated on the banks of Lake Marion, a large lake that is part of the Santee Cooper Lakes system. The town is located approximately 40 miles southeast of Columbia, the state capital. The town is surrounded by rural farmland and is located near the towns of Summerton, St. Matthews, and Elloree.
Economy
Santee’s economy is largely based on agriculture and tourism. The town is home to several farms that produce cotton, soybeans, corn, and other crops. The town is also home to several small businesses, including restaurants, retail stores, and service providers. Tourism is also an important part of the local economy, as the town is located near several popular attractions, including Lake Marion, Santee State Park, and the Santee National Wildlife Refuge.
Demographics
As of the 2010 census, Santee had a population of 1,500 people. The racial makeup of the town was 79.3% White, 17.3% African American, 0.7% Native American, 0.3% Asian, 0.7% from other races, and 1.7% from two or more races. The median household income was $30,000 and the median family income was $37,000. The per capita income was $15,000. The town had a poverty rate of 22.3%.
Santee is a small town with a rich history and a vibrant economy. The town is home to several farms and businesses, and is a popular tourist destination. The town has a diverse population and a strong sense of community. Santee is a great place to live, work, and play.
Common Questions
What is Per Capita Income in Santee?
Per Capita income in Santee is $25,483.
What is the Median Family Income in Santee?
Median Family Income in Santee is $54,896.
What is the Median Household income in Santee?
Median Household Income in Santee is $43,000.
What is Income or Wage Gap in Santee?
Income or Wage Gap in Santee is 7.3%.
Women in Santee earn 92.7 cents for every dollar earned by a man.
What is Inequality or Gini Index in Santee?
Inequality or Gini Index in Santee is 0.48.
What is the Total Population of Santee?
Total Population of Santee is 1,189.
What is the Total Male Population of Santee?
Total Male Population of Santee is 535.
What is the Total Female Population of Santee?
Total Female Population of Santee is 654.
What is the Ratio of Males per 100 Females in Santee?
There are 81.80 Males per 100 Females in Santee.
What is the Ratio of Females per 100 Males in Santee?
There are 122.24 Females per 100 Males in Santee.
What is the Median Population Age in Santee?
Median Population Age in Santee is 51.7 Years.
What is the Average Family Size in Santee
Average Family Size in Santee is 3.3 People.
What is the Average Household Size in Santee
Average Household Size in Santee is 2.5 People.
How Large is the Labor Force in Santee?
There are 601 People in the Labor Forcein in Santee.
What is the Percentage of People in the Labor Force in Santee?
59.2% of People are in the Labor Force in Santee.
What is the Unemployment Rate in Santee?
Unemployment Rate in Santee is 1.0%.