Central, SC Map & Demographics
Central Map
Central Overview
$19,889
PER CAPITA INCOME
$59,337
AVG FAMILY INCOME
$45,909
AVG HOUSEHOLD INCOME
0.46
INEQUALITY / GINI INDEX
5,272
TOTAL POPULATION
2,339
MALE POPULATION
2,933
FEMALE POPULATION
79.75
MALES / 100 FEMALES
125.40
FEMALES / 100 MALES
21.6
MEDIAN AGE
3.4
AVG FAMILY SIZE
2.6
AVG HOUSEHOLD SIZE
2,457
LABOR FORCE [ PEOPLE ]
54.7%
PERCENT IN LABOR FORCE
4.5%
UNEMPLOYMENT RATE
Central Zip Codes
Central Area Codes
Income in Central
Income Overview in Central
Per Capita Income in Central is $19,889, while median incomes of families and households are $59,337 and $45,909 respectively.
| Characteristic | Number | Measure |
| Per Capita Income | 5,272 | $19,889 |
| Median Family Income | 761 | $59,337 |
| Mean Family Income | 761 | $76,783 |
| Median Household Income | 1,886 | $45,909 |
| Mean Household Income | 1,886 | $55,641 |
| Income Deficit | 761 | $0 |
| Wage / Income Gap (%) | 5,272 | 0.00% |
| Wage / Income Gap ($) | 5,272 | 100.00¢ per $1 |
| Gini / Inequality Index | 5,272 | 0.46 |
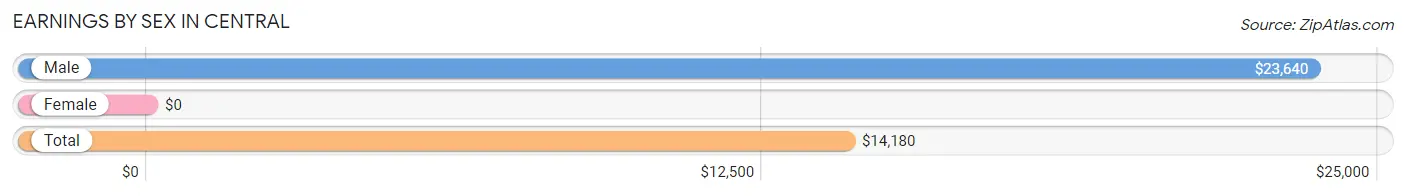
Earnings by Sex in Central
| Sex | Number | Average Earnings |
| Male | 1,541 (49.8%) | $23,640 |
| Female | 1,552 (50.2%) | $0 |
| Total | 3,093 (100.0%) | $14,180 |
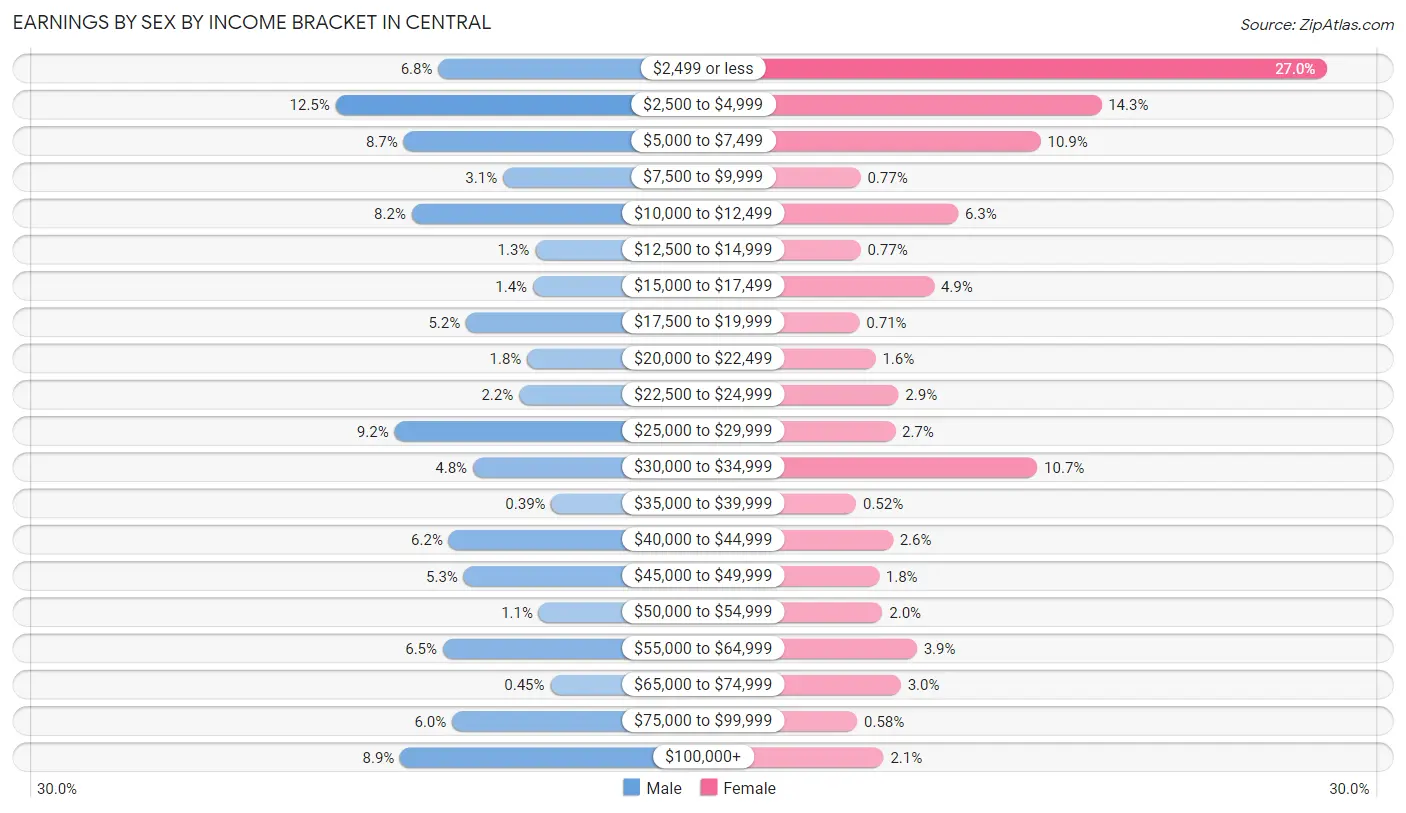
Earnings by Sex by Income Bracket in Central
The most common earnings brackets in Central are $2,500 to $4,999 for men (193 | 12.5%) and $2,499 or less for women (419 | 27.0%).
| Income | Male | Female |
| $2,499 or less | 104 (6.8%) | 419 (27.0%) |
| $2,500 to $4,999 | 193 (12.5%) | 222 (14.3%) |
| $5,000 to $7,499 | 134 (8.7%) | 169 (10.9%) |
| $7,500 to $9,999 | 48 (3.1%) | 12 (0.8%) |
| $10,000 to $12,499 | 127 (8.2%) | 97 (6.2%) |
| $12,500 to $14,999 | 20 (1.3%) | 12 (0.8%) |
| $15,000 to $17,499 | 22 (1.4%) | 76 (4.9%) |
| $17,500 to $19,999 | 80 (5.2%) | 11 (0.7%) |
| $20,000 to $22,499 | 27 (1.8%) | 25 (1.6%) |
| $22,500 to $24,999 | 34 (2.2%) | 45 (2.9%) |
| $25,000 to $29,999 | 142 (9.2%) | 42 (2.7%) |
| $30,000 to $34,999 | 74 (4.8%) | 166 (10.7%) |
| $35,000 to $39,999 | 6 (0.4%) | 8 (0.5%) |
| $40,000 to $44,999 | 95 (6.2%) | 40 (2.6%) |
| $45,000 to $49,999 | 82 (5.3%) | 28 (1.8%) |
| $50,000 to $54,999 | 17 (1.1%) | 31 (2.0%) |
| $55,000 to $64,999 | 100 (6.5%) | 61 (3.9%) |
| $65,000 to $74,999 | 7 (0.4%) | 47 (3.0%) |
| $75,000 to $99,999 | 92 (6.0%) | 9 (0.6%) |
| $100,000+ | 137 (8.9%) | 32 (2.1%) |
| Total | 1,541 (100.0%) | 1,552 (100.0%) |
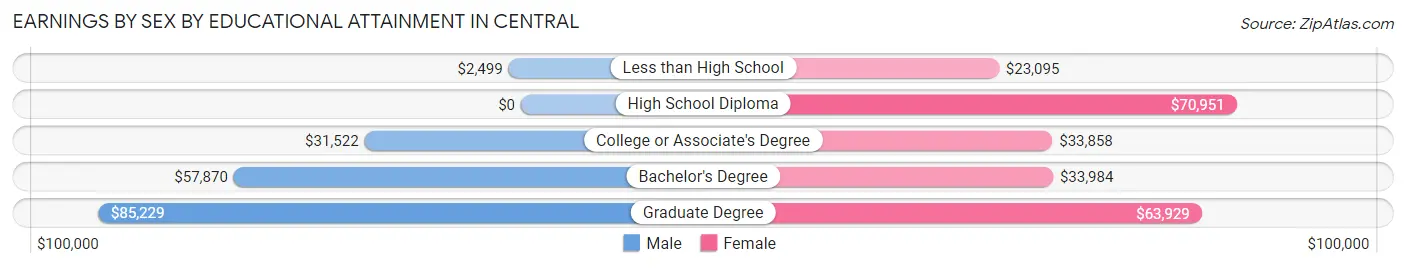
Earnings by Sex by Educational Attainment in Central
Average earnings in Central are $41,566 for men and $34,341 for women, a difference of 17.4%. Men with an educational attainment of graduate degree enjoy the highest average annual earnings of $85,229, while those with less than high school education earn the least with $2,499. Women with an educational attainment of high school diploma earn the most with the average annual earnings of $70,951, while those with less than high school education have the smallest earnings of $23,095.
| Educational Attainment | Male Income | Female Income |
| Less than High School | $2,499 | $23,095 |
| High School Diploma | - | - |
| College or Associate's Degree | $31,522 | $33,858 |
| Bachelor's Degree | $57,870 | $33,984 |
| Graduate Degree | $85,229 | $63,929 |
| Total | $41,566 | $34,341 |
Family Income in Central
Family Income Brackets in Central
According to the Central family income data, there are 279 families falling into the $50,000 to $74,999 income range, which is the most common income bracket and makes up 36.7% of all families.
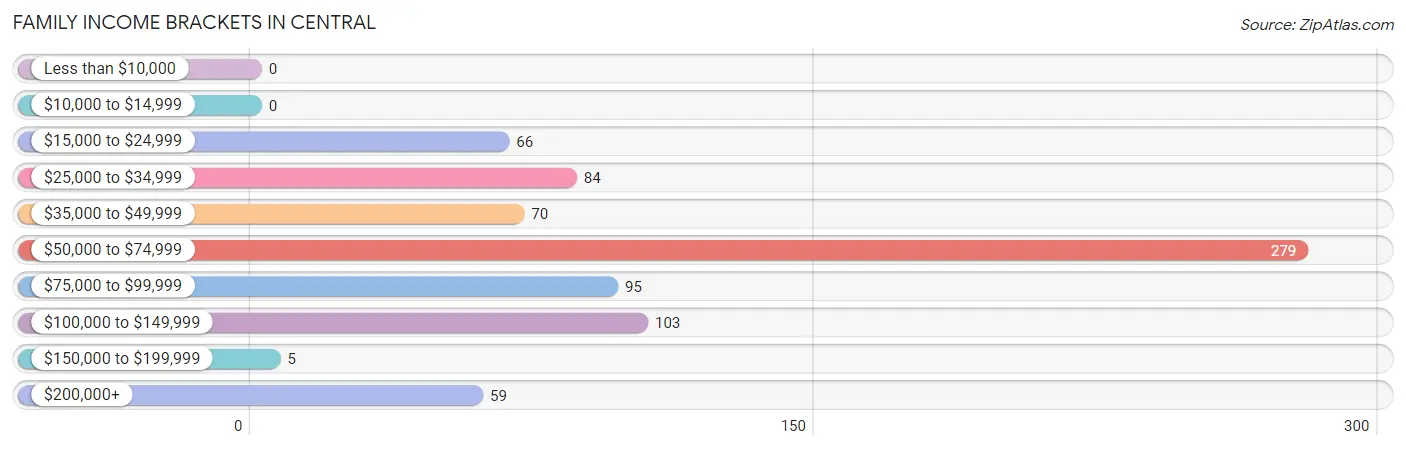
| Income Bracket | # Families | % Families |
| Less than $10,000 | 0 | 0.0% |
| $10,000 to $14,999 | 0 | 0.0% |
| $15,000 to $24,999 | 66 | 8.7% |
| $25,000 to $34,999 | 84 | 11.0% |
| $35,000 to $49,999 | 70 | 9.2% |
| $50,000 to $74,999 | 279 | 36.7% |
| $75,000 to $99,999 | 95 | 12.5% |
| $100,000 to $149,999 | 103 | 13.5% |
| $150,000 to $199,999 | 5 | 0.7% |
| $200,000+ | 59 | 7.8% |
Family Income by Famaliy Size in Central
2-person families (149 | 19.6%) account for the highest median family income in Central with $63,125 per family, while 2-person families (149 | 19.6%) have the highest median income of $31,562 per family member.
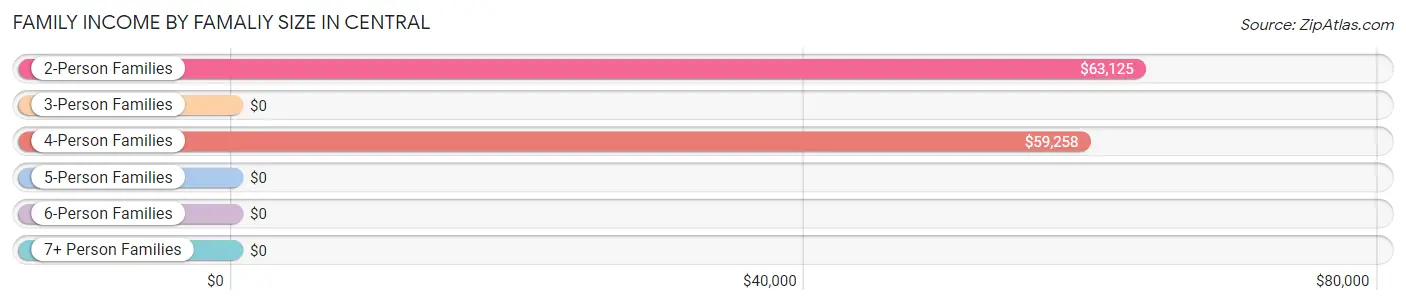
| Income Bracket | # Families | Median Income |
| 2-Person Families | 149 (19.6%) | $63,125 |
| 3-Person Families | 170 (22.3%) | $0 |
| 4-Person Families | 373 (49.0%) | $59,258 |
| 5-Person Families | 11 (1.5%) | $0 |
| 6-Person Families | 18 (2.4%) | $0 |
| 7+ Person Families | 40 (5.3%) | $0 |
| Total | 761 (100.0%) | $59,337 |
Family Income by Number of Earners in Central
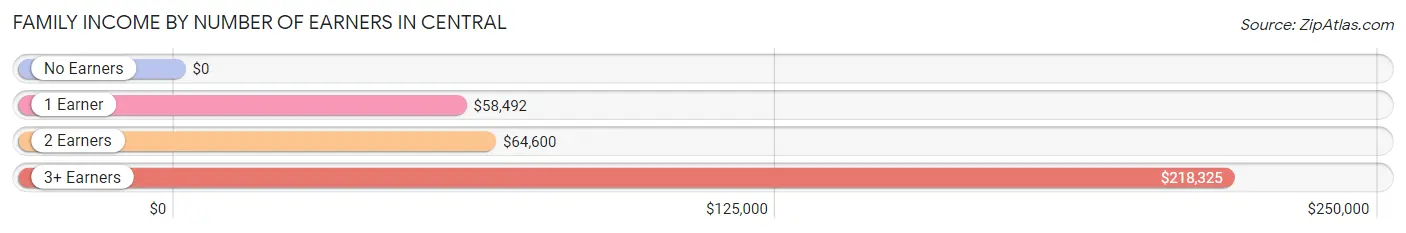
| Number of Earners | # Families | Median Income |
| No Earners | 10 (1.3%) | $0 |
| 1 Earner | 428 (56.2%) | $58,492 |
| 2 Earners | 250 (32.9%) | $64,600 |
| 3+ Earners | 73 (9.6%) | $218,325 |
| Total | 761 (100.0%) | $59,337 |
Household Income in Central
Household Income Brackets in Central
With 479 households falling in the category, the $50,000 to $74,999 income range is the most frequent in Central, accounting for 25.4% of all households. In contrast, only 23 households (1.2%) fall into the $150,000 to $199,999 income bracket, making it the least populous group.
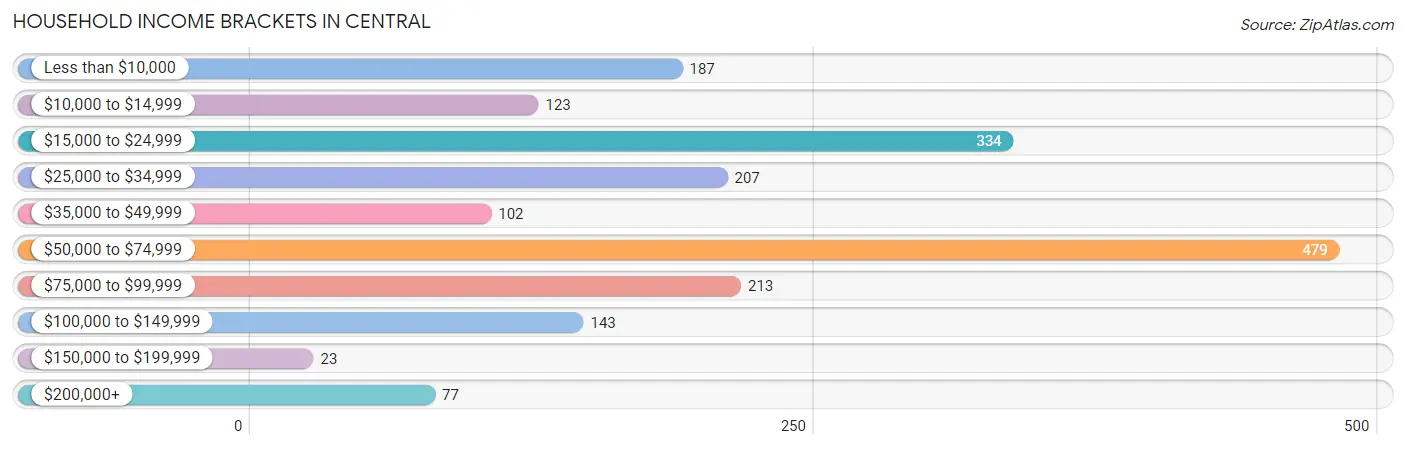
| Income Bracket | # Households | % Households |
| Less than $10,000 | 187 | 9.9% |
| $10,000 to $14,999 | 123 | 6.5% |
| $15,000 to $24,999 | 334 | 17.7% |
| $25,000 to $34,999 | 207 | 11.0% |
| $35,000 to $49,999 | 102 | 5.4% |
| $50,000 to $74,999 | 479 | 25.4% |
| $75,000 to $99,999 | 213 | 11.3% |
| $100,000 to $149,999 | 143 | 7.6% |
| $150,000 to $199,999 | 23 | 1.2% |
| $200,000+ | 77 | 4.1% |
Household Income by Householder Age in Central
The median household income in Central is $45,909, with the highest median household income of $59,333 found in the 25 to 44 years age bracket for the primary householder. A total of 713 households (37.8%) fall into this category. Meanwhile, the 45 to 64 years age bracket for the primary householder has the lowest median household income of $0, with 453 households (24.0%) in this group.
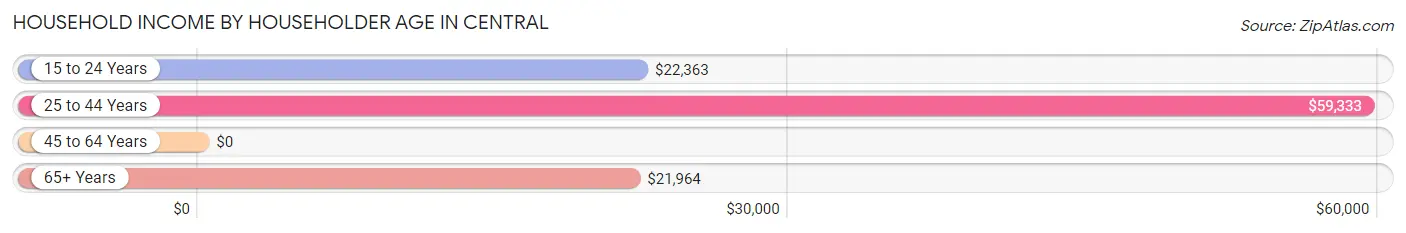
| Income Bracket | # Households | Median Income |
| 15 to 24 Years | 533 (28.3%) | $22,363 |
| 25 to 44 Years | 713 (37.8%) | $59,333 |
| 45 to 64 Years | 453 (24.0%) | $0 |
| 65+ Years | 187 (9.9%) | $21,964 |
| Total | 1,886 (100.0%) | $45,909 |
Poverty in Central
Income Below Poverty by Sex and Age in Central
With 38.2% poverty level for males and 31.3% for females among the residents of Central, 18 to 24 year old males and 18 to 24 year old females are the most vulnerable to poverty, with 489 males (61.1%) and 564 females (60.4%) in their respective age groups living below the poverty level.
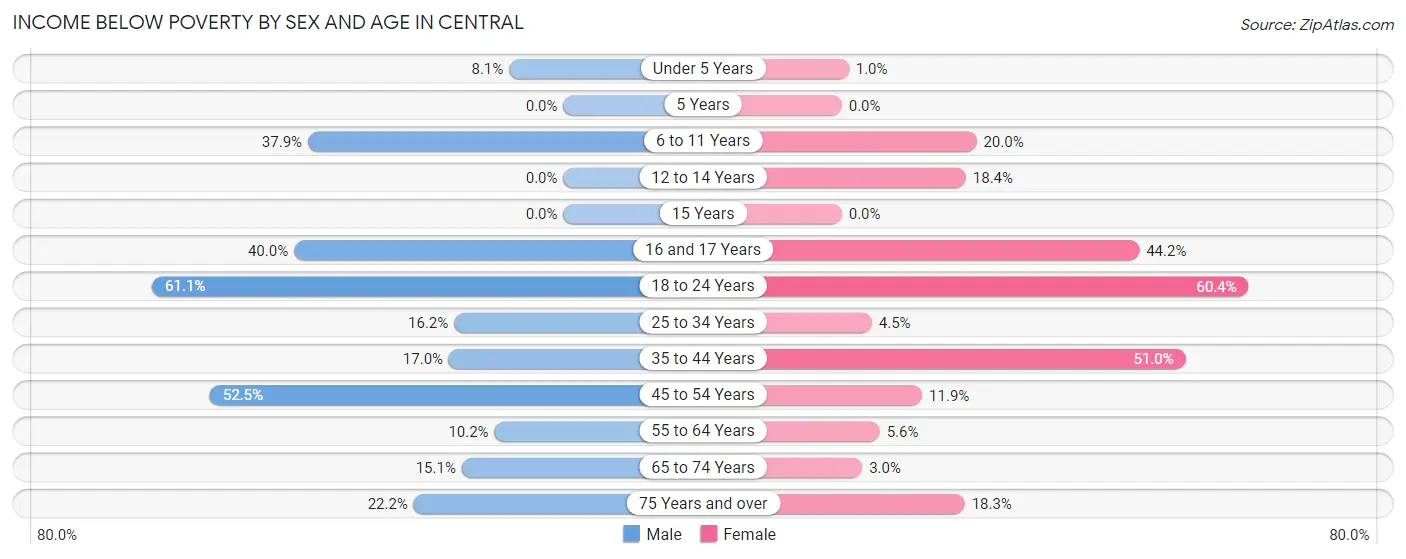
| Age Bracket | Male | Female |
| Under 5 Years | 12 (8.1%) | 3 (1.0%) |
| 5 Years | 0 (0.0%) | 0 (0.0%) |
| 6 to 11 Years | 33 (37.9%) | 21 (20.0%) |
| 12 to 14 Years | 0 (0.0%) | 14 (18.4%) |
| 15 Years | 0 (0.0%) | 0 (0.0%) |
| 16 and 17 Years | 8 (40.0%) | 53 (44.2%) |
| 18 to 24 Years | 489 (61.1%) | 564 (60.4%) |
| 25 to 34 Years | 60 (16.2%) | 15 (4.5%) |
| 35 to 44 Years | 35 (17.0%) | 123 (51.0%) |
| 45 to 54 Years | 158 (52.5%) | 26 (11.9%) |
| 55 to 64 Years | 9 (10.2%) | 8 (5.6%) |
| 65 to 74 Years | 8 (15.1%) | 4 (3.0%) |
| 75 Years and over | 6 (22.2%) | 23 (18.2%) |
| Total | 818 (38.2%) | 854 (31.3%) |
Income Above Poverty by Sex and Age in Central
According to the poverty statistics in Central, males aged 5 years and females aged 15 years are the age groups that are most secure financially, with 100.0% of males and 100.0% of females in these age groups living above the poverty line.
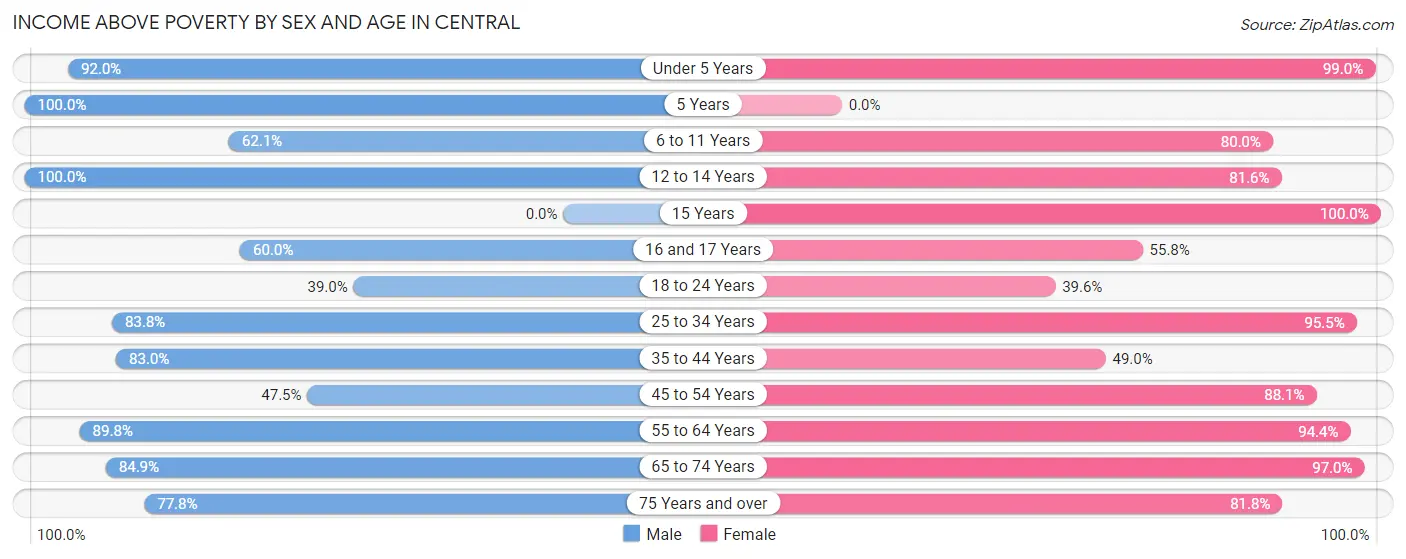
| Age Bracket | Male | Female |
| Under 5 Years | 137 (91.9%) | 286 (99.0%) |
| 5 Years | 5 (100.0%) | 0 (0.0%) |
| 6 to 11 Years | 54 (62.1%) | 84 (80.0%) |
| 12 to 14 Years | 36 (100.0%) | 62 (81.6%) |
| 15 Years | 0 (0.0%) | 6 (100.0%) |
| 16 and 17 Years | 12 (60.0%) | 67 (55.8%) |
| 18 to 24 Years | 312 (39.0%) | 370 (39.6%) |
| 25 to 34 Years | 310 (83.8%) | 321 (95.5%) |
| 35 to 44 Years | 171 (83.0%) | 118 (49.0%) |
| 45 to 54 Years | 143 (47.5%) | 192 (88.1%) |
| 55 to 64 Years | 79 (89.8%) | 134 (94.4%) |
| 65 to 74 Years | 45 (84.9%) | 128 (97.0%) |
| 75 Years and over | 21 (77.8%) | 103 (81.8%) |
| Total | 1,325 (61.8%) | 1,871 (68.7%) |
Income Below Poverty Among Married-Couple Families in Central
The poverty statistics for married-couple families in Central show that 12.4% or 72 of the total 580 families live below the poverty line. Families with 3 or 4 children have the highest poverty rate of 48.6%, comprising of 18 families. On the other hand, families with no children have the lowest poverty rate of 5.3%, which includes 9 families.
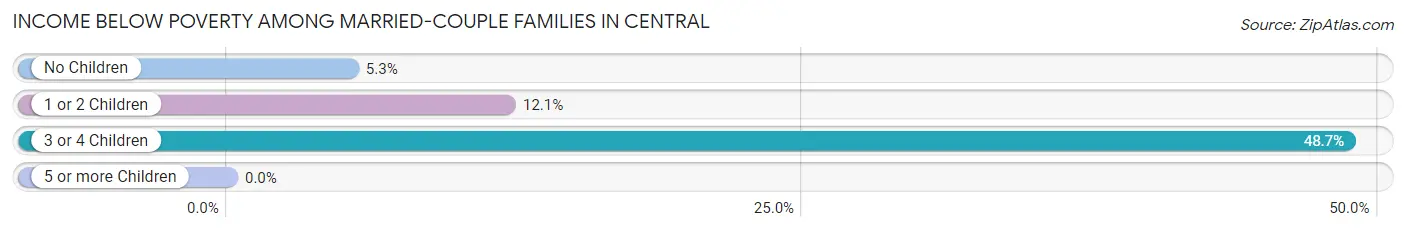
| Children | Above Poverty | Below Poverty |
| No Children | 162 (94.7%) | 9 (5.3%) |
| 1 or 2 Children | 327 (87.9%) | 45 (12.1%) |
| 3 or 4 Children | 19 (51.3%) | 18 (48.6%) |
| 5 or more Children | 0 (0.0%) | 0 (0.0%) |
| Total | 508 (87.6%) | 72 (12.4%) |
Income Below Poverty Among Single-Parent Households in Central
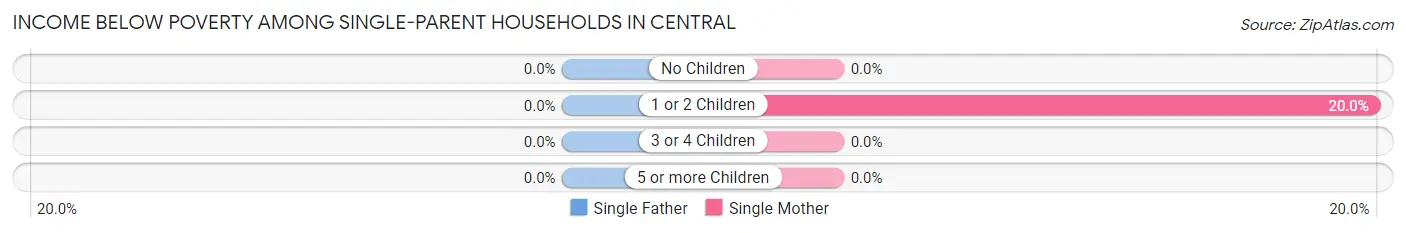
| Children | Single Father | Single Mother |
| No Children | 0 (0.0%) | 0 (0.0%) |
| 1 or 2 Children | 0 (0.0%) | 18 (20.0%) |
| 3 or 4 Children | 0 (0.0%) | 0 (0.0%) |
| 5 or more Children | 0 (0.0%) | 0 (0.0%) |
| Total | 0 (0.0%) | 18 (13.1%) |
Income Below Poverty Among Married-Couple vs Single-Parent Households in Central
The poverty data for Central shows that 72 of the married-couple family households (12.4%) and 18 of the single-parent households (9.9%) are living below the poverty level. Within the married-couple family households, those with 3 or 4 children have the highest poverty rate, with 18 households (48.6%) falling below the poverty line. Among the single-parent households, those with 1 or 2 children have the highest poverty rate, with 18 household (15.5%) living below poverty.
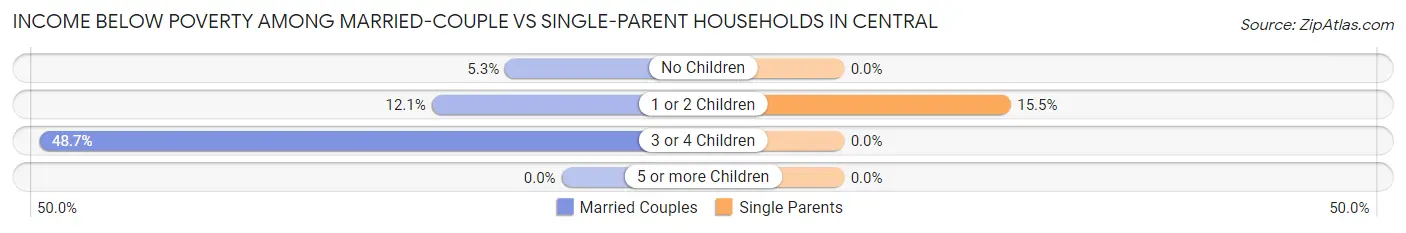
| Children | Married-Couple Families | Single-Parent Households |
| No Children | 9 (5.3%) | 0 (0.0%) |
| 1 or 2 Children | 45 (12.1%) | 18 (15.5%) |
| 3 or 4 Children | 18 (48.6%) | 0 (0.0%) |
| 5 or more Children | 0 (0.0%) | 0 (0.0%) |
| Total | 72 (12.4%) | 18 (9.9%) |
Race in Central
The most populous races in Central are White / Caucasian (3,421 | 64.9%), Two or more Races (825 | 15.7%), and Black / African American (533 | 10.1%).
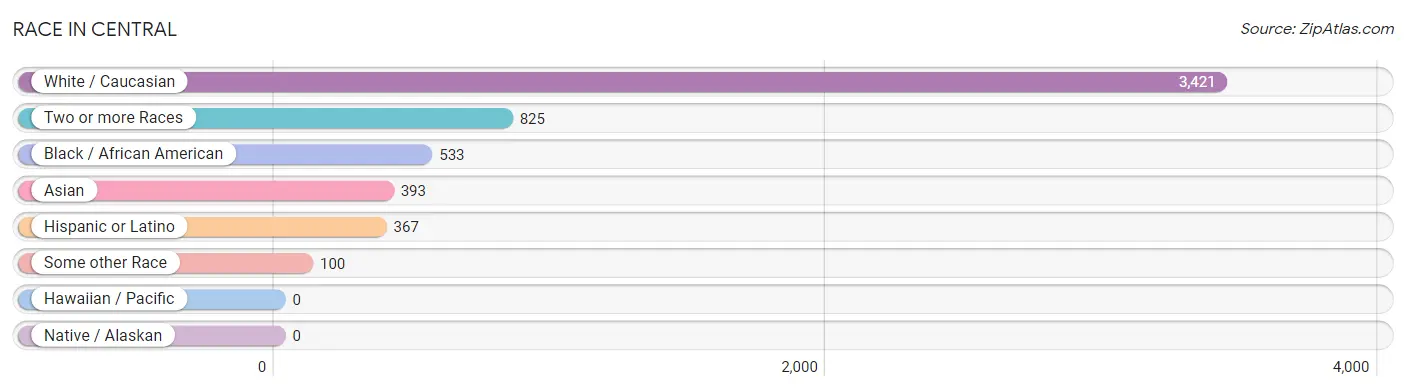
| Race | # Population | % Population |
| Asian | 393 | 7.4% |
| Black / African American | 533 | 10.1% |
| Hawaiian / Pacific | 0 | 0.0% |
| Hispanic or Latino | 367 | 7.0% |
| Native / Alaskan | 0 | 0.0% |
| White / Caucasian | 3,421 | 64.9% |
| Two or more Races | 825 | 15.7% |
| Some other Race | 100 | 1.9% |
| Total | 5,272 | 100.0% |
Ancestry in Central
The most populous ancestries reported in Central are American (449 | 8.5%), Italian (384 | 7.3%), Irish (347 | 6.6%), German (249 | 4.7%), and English (207 | 3.9%), together accounting for 31.0% of all Central residents.
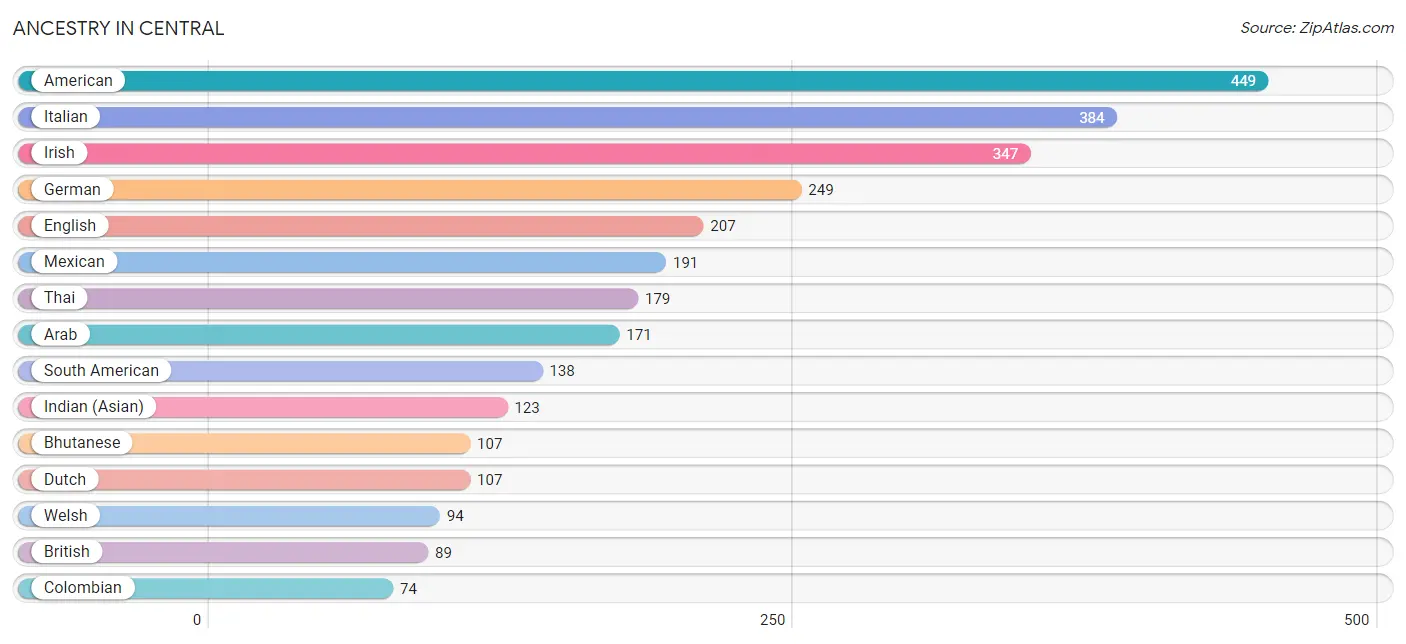
| Ancestry | # Population | % Population |
| African | 12 | 0.2% |
| American | 449 | 8.5% |
| Arab | 171 | 3.2% |
| Argentinean | 64 | 1.2% |
| Bhutanese | 107 | 2.0% |
| British | 89 | 1.7% |
| Burmese | 60 | 1.1% |
| Canadian | 2 | 0.0% |
| Central American | 35 | 0.7% |
| Colombian | 74 | 1.4% |
| Czech | 8 | 0.2% |
| Danish | 22 | 0.4% |
| Dutch | 107 | 2.0% |
| English | 207 | 3.9% |
| European | 20 | 0.4% |
| French | 69 | 1.3% |
| French Canadian | 22 | 0.4% |
| German | 249 | 4.7% |
| Honduran | 35 | 0.7% |
| Indian (Asian) | 123 | 2.3% |
| Iraqi | 55 | 1.0% |
| Irish | 347 | 6.6% |
| Italian | 384 | 7.3% |
| Korean | 12 | 0.2% |
| Laotian | 2 | 0.0% |
| Lumbee | 17 | 0.3% |
| Mexican | 191 | 3.6% |
| Norwegian | 10 | 0.2% |
| Polish | 9 | 0.2% |
| Portuguese | 51 | 1.0% |
| Puerto Rican | 2 | 0.0% |
| Scotch-Irish | 28 | 0.5% |
| Scottish | 40 | 0.8% |
| South African | 3 | 0.1% |
| South American | 138 | 2.6% |
| Subsaharan African | 15 | 0.3% |
| Thai | 179 | 3.4% |
| Ukrainian | 1 | 0.0% |
| Welsh | 94 | 1.8% | View All 39 Rows |
Immigrants in Central
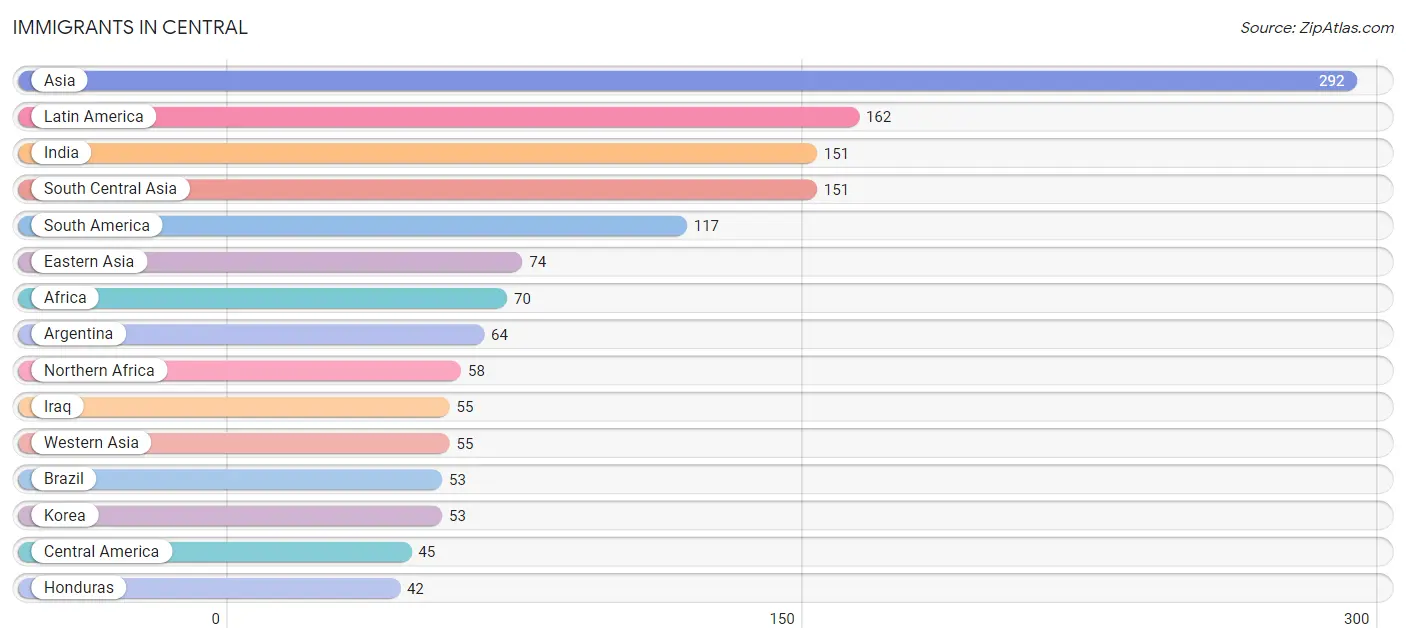
The most numerous immigrant groups reported in Central came from Asia (292 | 5.5%), Latin America (162 | 3.1%), India (151 | 2.9%), South Central Asia (151 | 2.9%), and South America (117 | 2.2%), together accounting for 16.5% of all Central residents.
| Immigration Origin | # Population | % Population |
| Africa | 70 | 1.3% |
| Argentina | 64 | 1.2% |
| Asia | 292 | 5.5% |
| Brazil | 53 | 1.0% |
| Cameroon | 12 | 0.2% |
| Canada | 2 | 0.0% |
| Central America | 45 | 0.9% |
| China | 20 | 0.4% |
| Eastern Asia | 74 | 1.4% |
| Eastern Europe | 6 | 0.1% |
| England | 6 | 0.1% |
| Europe | 30 | 0.6% |
| Honduras | 42 | 0.8% |
| India | 151 | 2.9% |
| Iraq | 55 | 1.0% |
| Japan | 1 | 0.0% |
| Korea | 53 | 1.0% |
| Latin America | 162 | 3.1% |
| Mexico | 3 | 0.1% |
| Middle Africa | 12 | 0.2% |
| Northern Africa | 58 | 1.1% |
| Northern Europe | 24 | 0.5% |
| Philippines | 12 | 0.2% |
| Poland | 6 | 0.1% |
| South America | 117 | 2.2% |
| South Central Asia | 151 | 2.9% |
| South Eastern Asia | 12 | 0.2% |
| Western Asia | 55 | 1.0% | View All 28 Rows |
Sex and Age in Central
Sex and Age in Central
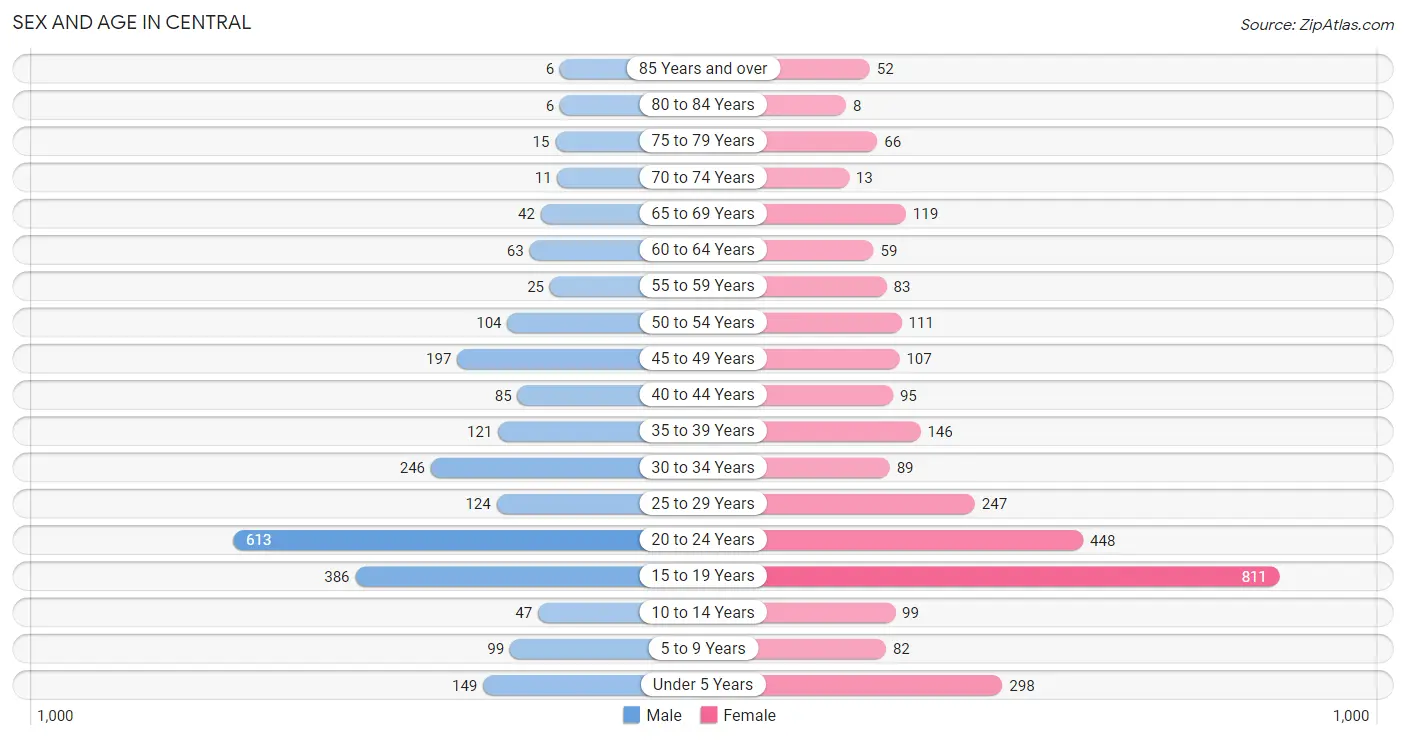
The most populous age groups in Central are 20 to 24 Years (613 | 26.2%) for men and 15 to 19 Years (811 | 27.7%) for women.
| Age Bracket | Male | Female |
| Under 5 Years | 149 (6.4%) | 298 (10.2%) |
| 5 to 9 Years | 99 (4.2%) | 82 (2.8%) |
| 10 to 14 Years | 47 (2.0%) | 99 (3.4%) |
| 15 to 19 Years | 386 (16.5%) | 811 (27.7%) |
| 20 to 24 Years | 613 (26.2%) | 448 (15.3%) |
| 25 to 29 Years | 124 (5.3%) | 247 (8.4%) |
| 30 to 34 Years | 246 (10.5%) | 89 (3.0%) |
| 35 to 39 Years | 121 (5.2%) | 146 (5.0%) |
| 40 to 44 Years | 85 (3.6%) | 95 (3.2%) |
| 45 to 49 Years | 197 (8.4%) | 107 (3.6%) |
| 50 to 54 Years | 104 (4.4%) | 111 (3.8%) |
| 55 to 59 Years | 25 (1.1%) | 83 (2.8%) |
| 60 to 64 Years | 63 (2.7%) | 59 (2.0%) |
| 65 to 69 Years | 42 (1.8%) | 119 (4.1%) |
| 70 to 74 Years | 11 (0.5%) | 13 (0.4%) |
| 75 to 79 Years | 15 (0.6%) | 66 (2.2%) |
| 80 to 84 Years | 6 (0.3%) | 8 (0.3%) |
| 85 Years and over | 6 (0.3%) | 52 (1.8%) |
| Total | 2,339 (100.0%) | 2,933 (100.0%) |
Families and Households in Central
Median Family Size in Central
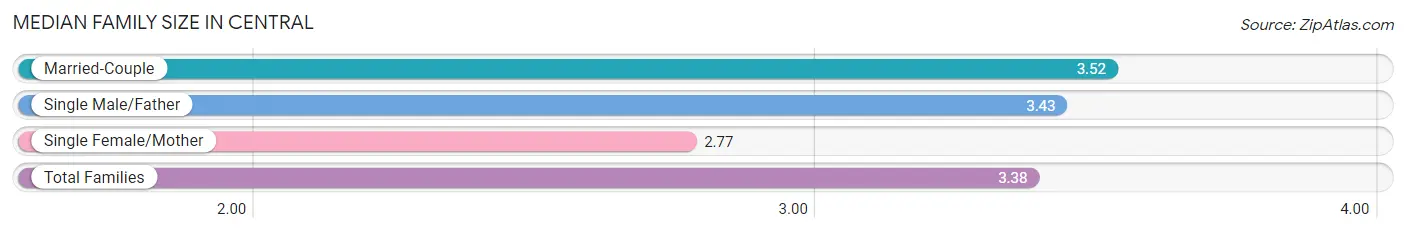
The median family size in Central is 3.38 persons per family, with married-couple families (580 | 76.2%) accounting for the largest median family size of 3.52 persons per family. On the other hand, single female/mother families (137 | 18.0%) represent the smallest median family size with 2.77 persons per family.
| Family Type | # Families | Family Size |
| Married-Couple | 580 (76.2%) | 3.52 |
| Single Male/Father | 44 (5.8%) | 3.43 |
| Single Female/Mother | 137 (18.0%) | 2.77 |
| Total Families | 761 (100.0%) | 3.38 |
Median Household Size in Central
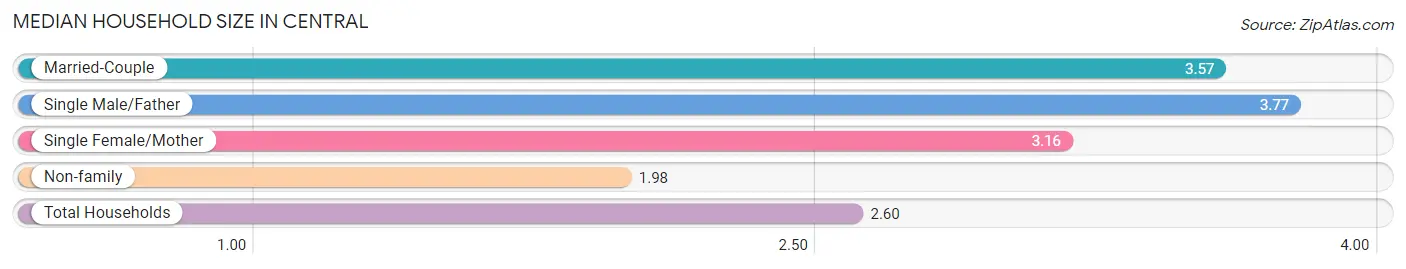
The median household size in Central is 2.60 persons per household, with single male/father households (44 | 2.3%) accounting for the largest median household size of 3.77 persons per household. non-family households (1,125 | 59.7%) represent the smallest median household size with 1.98 persons per household.
| Household Type | # Households | Household Size |
| Married-Couple | 580 (30.7%) | 3.57 |
| Single Male/Father | 44 (2.3%) | 3.77 |
| Single Female/Mother | 137 (7.3%) | 3.16 |
| Non-family | 1,125 (59.7%) | 1.98 |
| Total Households | 1,886 (100.0%) | 2.60 |
Household Size by Marriage Status in Central
Out of a total of 1,886 households in Central, 761 (40.4%) are family households, while 1,125 (59.7%) are nonfamily households. The most numerous type of family households are 4-person households, comprising 400, and the most common type of nonfamily households are 1-person households, comprising 513.
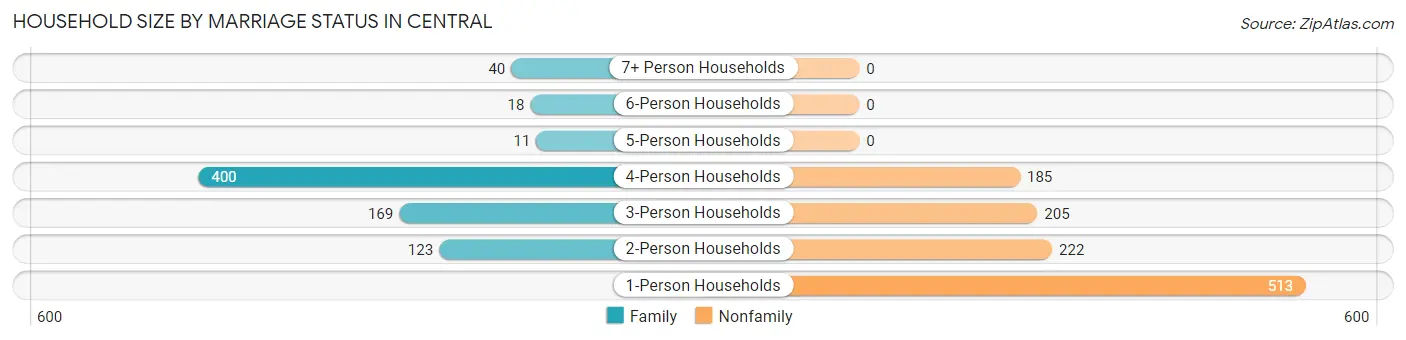
| Household Size | Family Households | Nonfamily Households |
| 1-Person Households | - | 513 (27.2%) |
| 2-Person Households | 123 (6.5%) | 222 (11.8%) |
| 3-Person Households | 169 (9.0%) | 205 (10.9%) |
| 4-Person Households | 400 (21.2%) | 185 (9.8%) |
| 5-Person Households | 11 (0.6%) | 0 (0.0%) |
| 6-Person Households | 18 (0.9%) | 0 (0.0%) |
| 7+ Person Households | 40 (2.1%) | 0 (0.0%) |
| Total | 761 (40.4%) | 1,125 (59.7%) |
Female Fertility in Central
Fertility by Age in Central
Average fertility rate in Central is 105.0 births per 1,000 women. Women in the age bracket of 20 to 34 years have the highest fertility rate with 241.0 births per 1,000 women. Women in the age bracket of 20 to 34 years acount for 90.0% of all women with births.
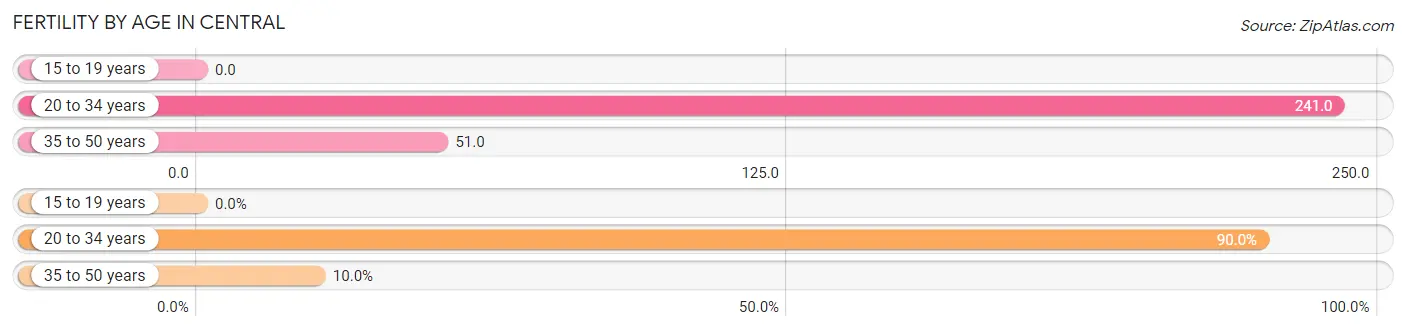
| Age Bracket | Women with Births | Births / 1,000 Women |
| 15 to 19 years | 0 (0.0%) | 0.0 |
| 20 to 34 years | 189 (90.0%) | 241.0 |
| 35 to 50 years | 21 (10.0%) | 51.0 |
| Total | 210 (100.0%) | 105.0 |
Fertility by Age by Marriage Status in Central
96.2% of women with births (210) in Central are married. The highest percentage of unmarried women with births falls into 20 to 34 years age bracket with 4.2% of them unmarried at the time of birth, while the lowest percentage of unmarried women with births belong to 35 to 50 years age bracket with 0.0% of them unmarried.
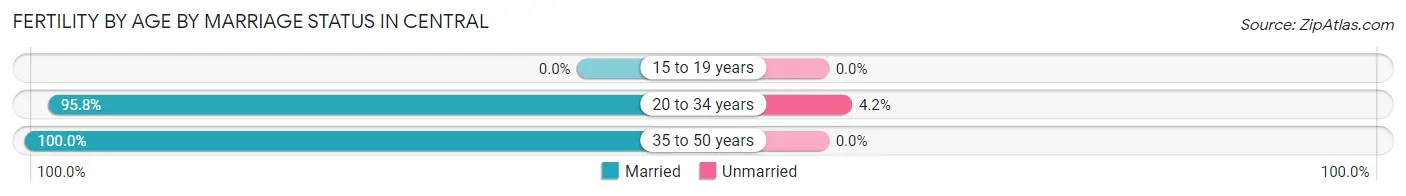
| Age Bracket | Married | Unmarried |
| 15 to 19 years | 0 (0.0%) | 0 (0.0%) |
| 20 to 34 years | 181 (95.8%) | 8 (4.2%) |
| 35 to 50 years | 21 (100.0%) | 0 (0.0%) |
| Total | 202 (96.2%) | 8 (3.8%) |
Fertility by Education in Central
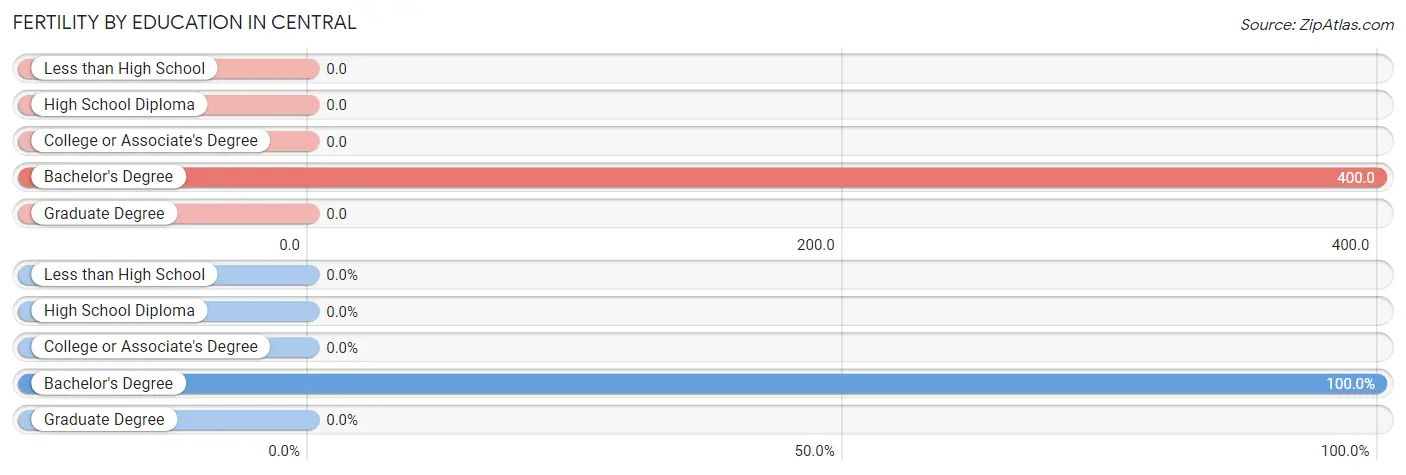
| Educational Attainment | Women with Births | Births / 1,000 Women |
| Less than High School | 0 (0.0%) | 0.0 |
| High School Diploma | 0 (0.0%) | 0.0 |
| College or Associate's Degree | 0 (0.0%) | 0.0 |
| Bachelor's Degree | 210 (100.0%) | 400.0 |
| Graduate Degree | 0 (0.0%) | 0.0 |
| Total | 210 (100.0%) | 105.0 |
Fertility by Education by Marriage Status in Central
3.8% of women with births in Central are unmarried. Women with the educational attainment of bachelor's degree are most likely to be married with 96.2% of them married at childbirth, while women with the educational attainment of bachelor's degree are least likely to be married with 3.8% of them unmarried at childbirth.
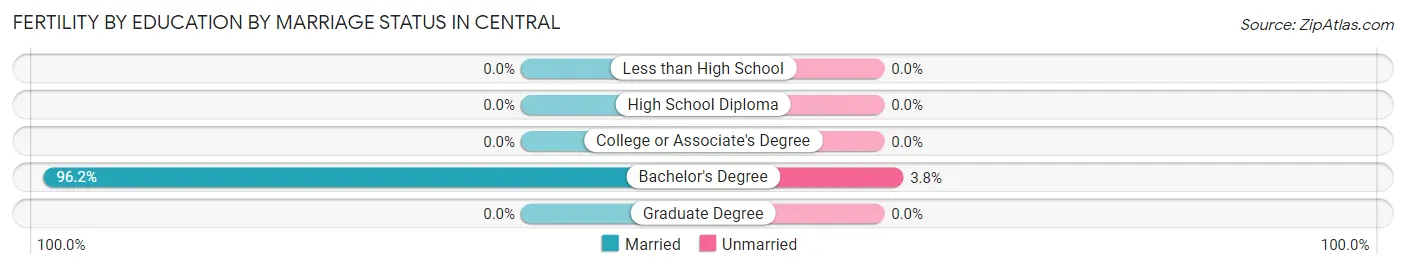
| Educational Attainment | Married | Unmarried |
| Less than High School | 0 (0.0%) | 0 (0.0%) |
| High School Diploma | 0 (0.0%) | 0 (0.0%) |
| College or Associate's Degree | 0 (0.0%) | 0 (0.0%) |
| Bachelor's Degree | 202 (96.2%) | 8 (3.8%) |
| Graduate Degree | 0 (0.0%) | 0 (0.0%) |
| Total | 202 (96.2%) | 8 (3.8%) |
Employment Characteristics in Central
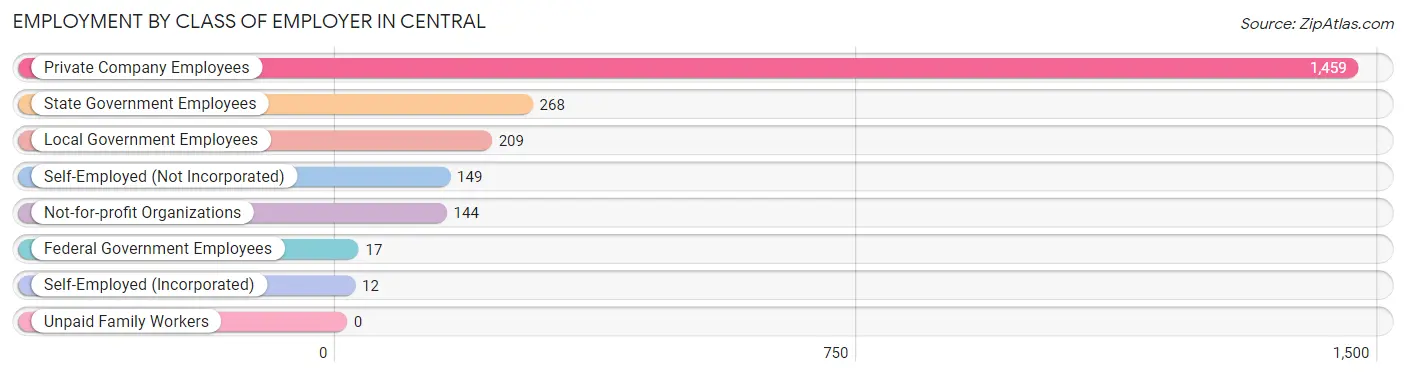
Employment by Class of Employer in Central
Among the 2,258 employed individuals in Central, private company employees (1,459 | 64.6%), state government employees (268 | 11.9%), and local government employees (209 | 9.3%) make up the most common classes of employment.
| Employer Class | # Employees | % Employees |
| Private Company Employees | 1,459 | 64.6% |
| Self-Employed (Incorporated) | 12 | 0.5% |
| Self-Employed (Not Incorporated) | 149 | 6.6% |
| Not-for-profit Organizations | 144 | 6.4% |
| Local Government Employees | 209 | 9.3% |
| State Government Employees | 268 | 11.9% |
| Federal Government Employees | 17 | 0.7% |
| Unpaid Family Workers | 0 | 0.0% |
| Total | 2,258 | 100.0% |
Employment Status by Age in Central
According to the labor force statistics for Central, out of the total population over 16 years of age (4,492), 54.7% or 2,457 individuals are in the labor force, with 4.5% or 111 of them unemployed. The age group with the highest labor force participation rate is 45 to 54 years, with 71.5% or 371 individuals in the labor force. Within the labor force, the 65 to 74 years age range has the highest percentage of unemployed individuals, with 44.1% or 15 of them being unemployed.
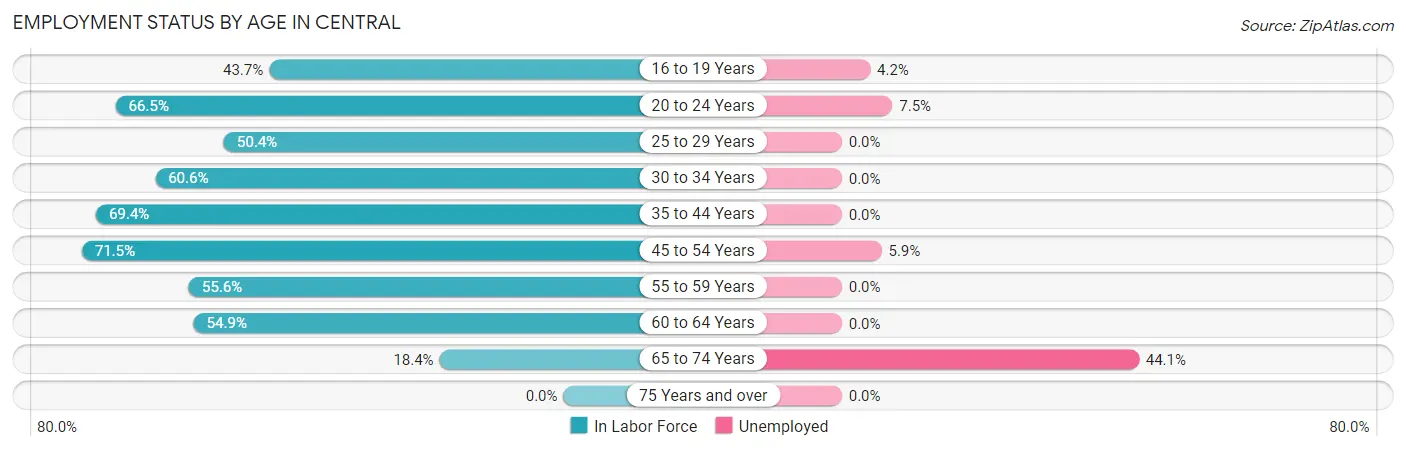
| Age Bracket | In Labor Force | Unemployed |
| 16 to 19 Years | 520 (43.7%) | 22 (4.2%) |
| 20 to 24 Years | 706 (66.5%) | 53 (7.5%) |
| 25 to 29 Years | 187 (50.4%) | 0 (0.0%) |
| 30 to 34 Years | 203 (60.6%) | 0 (0.0%) |
| 35 to 44 Years | 310 (69.4%) | 0 (0.0%) |
| 45 to 54 Years | 371 (71.5%) | 22 (5.9%) |
| 55 to 59 Years | 60 (55.6%) | 0 (0.0%) |
| 60 to 64 Years | 67 (54.9%) | 0 (0.0%) |
| 65 to 74 Years | 34 (18.4%) | 15 (44.1%) |
| 75 Years and over | 0 (0.0%) | 0 (0.0%) |
| Total | 2,457 (54.7%) | 111 (4.5%) |
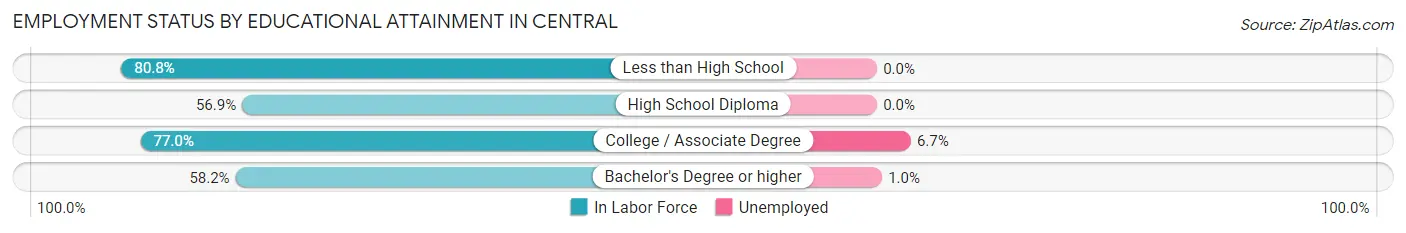
Employment Status by Educational Attainment in Central
According to labor force statistics for Central, 63.0% of individuals (1,198) out of the total population between 25 and 64 years of age (1,902) are in the labor force, with 1.8% or 22 of them being unemployed. The group with the highest labor force participation rate are those with the educational attainment of less than high school, with 80.8% or 135 individuals in the labor force. Within the labor force, individuals with college / associate degree education have the highest percentage of unemployment, with 6.7% or 16 of them being unemployed.
| Educational Attainment | In Labor Force | Unemployed |
| Less than High School | 135 (80.8%) | 0 (0.0%) |
| High School Diploma | 214 (56.9%) | 0 (0.0%) |
| College / Associate Degree | 238 (77.0%) | 21 (6.7%) |
| Bachelor's Degree or higher | 611 (58.2%) | 10 (1.0%) |
| Total | 1,198 (63.0%) | 34 (1.8%) |
Employment Occupations by Sex in Central
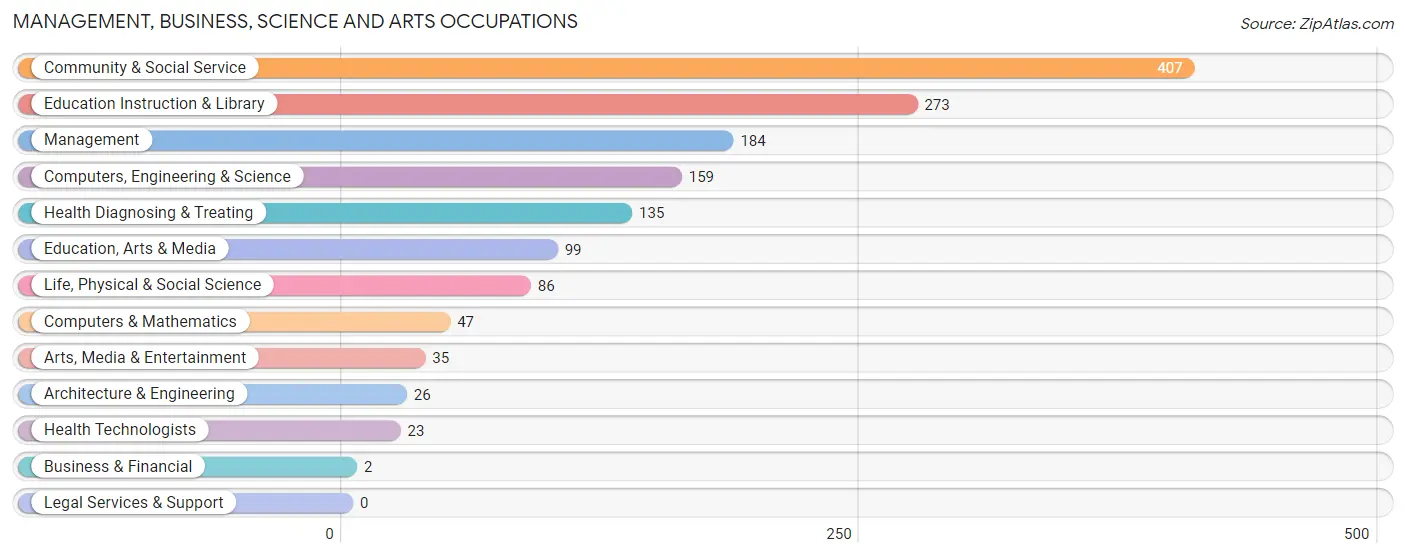
Management, Business, Science and Arts Occupations
The most common Management, Business, Science and Arts occupations in Central are Community & Social Service (407 | 17.5%), Education Instruction & Library (273 | 11.7%), Management (184 | 7.9%), Computers, Engineering & Science (159 | 6.8%), and Health Diagnosing & Treating (135 | 5.8%).
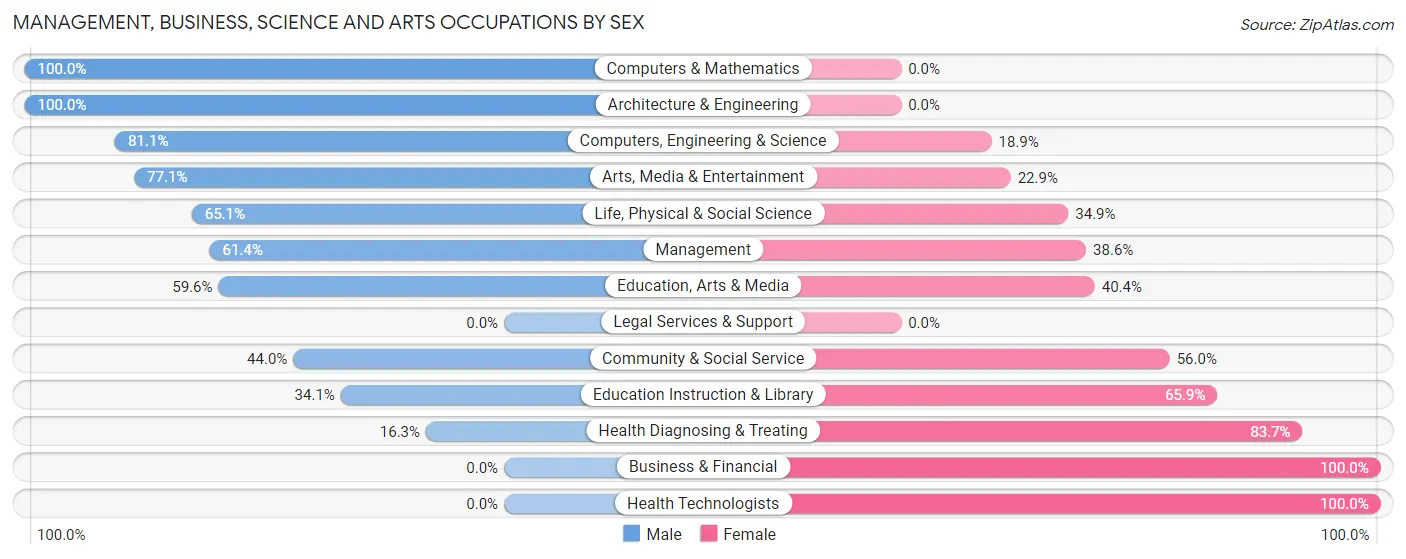
Management, Business, Science and Arts Occupations by Sex
Within the Management, Business, Science and Arts occupations in Central, the most male-oriented occupations are Computers & Mathematics (100.0%), Architecture & Engineering (100.0%), and Computers, Engineering & Science (81.1%), while the most female-oriented occupations are Business & Financial (100.0%), Health Technologists (100.0%), and Health Diagnosing & Treating (83.7%).
| Occupation | Male | Female |
| Management | 113 (61.4%) | 71 (38.6%) |
| Business & Financial | 0 (0.0%) | 2 (100.0%) |
| Computers, Engineering & Science | 129 (81.1%) | 30 (18.9%) |
| Computers & Mathematics | 47 (100.0%) | 0 (0.0%) |
| Architecture & Engineering | 26 (100.0%) | 0 (0.0%) |
| Life, Physical & Social Science | 56 (65.1%) | 30 (34.9%) |
| Community & Social Service | 179 (44.0%) | 228 (56.0%) |
| Education, Arts & Media | 59 (59.6%) | 40 (40.4%) |
| Legal Services & Support | 0 (0.0%) | 0 (0.0%) |
| Education Instruction & Library | 93 (34.1%) | 180 (65.9%) |
| Arts, Media & Entertainment | 27 (77.1%) | 8 (22.9%) |
| Health Diagnosing & Treating | 22 (16.3%) | 113 (83.7%) |
| Health Technologists | 0 (0.0%) | 23 (100.0%) |
| Total (Category) | 443 (49.9%) | 444 (50.1%) |
| Total (Overall) | 1,178 (50.5%) | 1,153 (49.5%) |
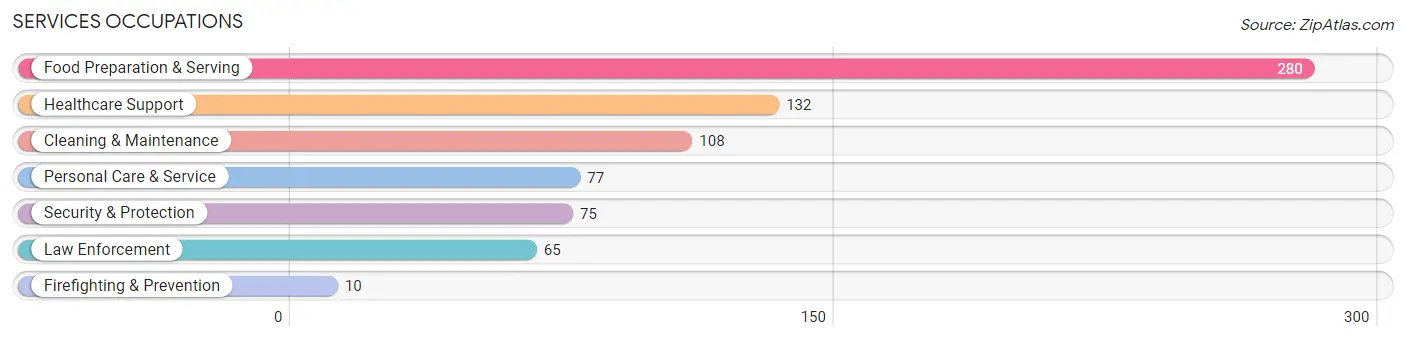
Services Occupations
The most common Services occupations in Central are Food Preparation & Serving (280 | 12.0%), Healthcare Support (132 | 5.7%), Cleaning & Maintenance (108 | 4.6%), Personal Care & Service (77 | 3.3%), and Security & Protection (75 | 3.2%).
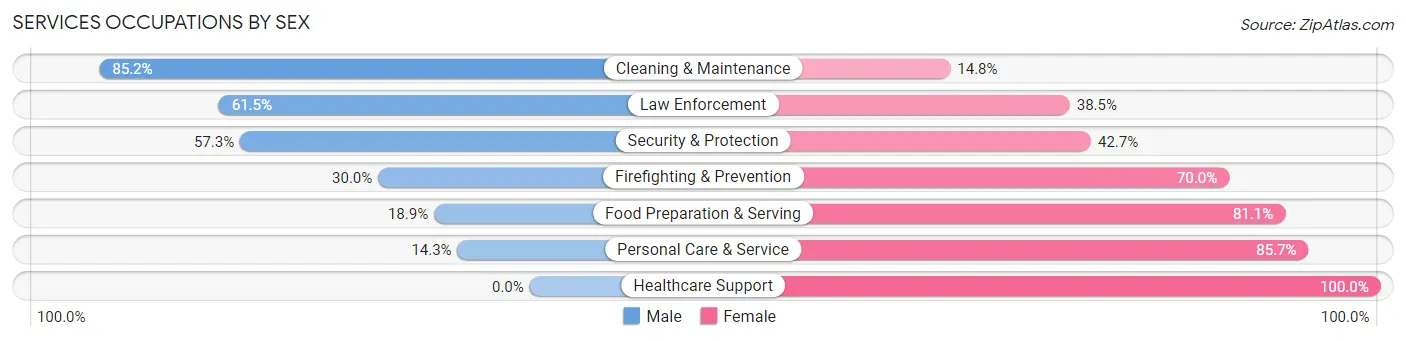
Services Occupations by Sex
Within the Services occupations in Central, the most male-oriented occupations are Cleaning & Maintenance (85.2%), Law Enforcement (61.5%), and Security & Protection (57.3%), while the most female-oriented occupations are Healthcare Support (100.0%), Personal Care & Service (85.7%), and Food Preparation & Serving (81.1%).
| Occupation | Male | Female |
| Healthcare Support | 0 (0.0%) | 132 (100.0%) |
| Security & Protection | 43 (57.3%) | 32 (42.7%) |
| Firefighting & Prevention | 3 (30.0%) | 7 (70.0%) |
| Law Enforcement | 40 (61.5%) | 25 (38.5%) |
| Food Preparation & Serving | 53 (18.9%) | 227 (81.1%) |
| Cleaning & Maintenance | 92 (85.2%) | 16 (14.8%) |
| Personal Care & Service | 11 (14.3%) | 66 (85.7%) |
| Total (Category) | 199 (29.6%) | 473 (70.4%) |
| Total (Overall) | 1,178 (50.5%) | 1,153 (49.5%) |
Sales and Office Occupations
The most common Sales and Office occupations in Central are Sales & Related (210 | 9.0%), and Office & Administration (133 | 5.7%).
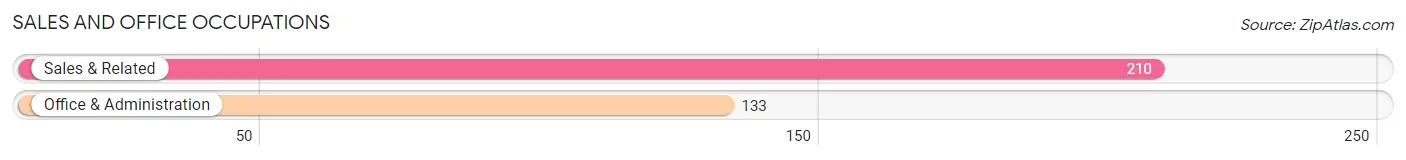
Sales and Office Occupations by Sex
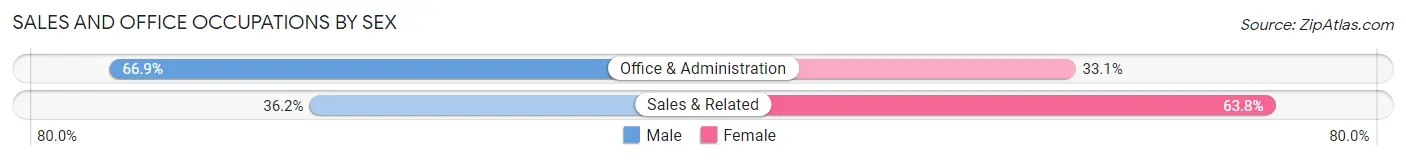
| Occupation | Male | Female |
| Sales & Related | 76 (36.2%) | 134 (63.8%) |
| Office & Administration | 89 (66.9%) | 44 (33.1%) |
| Total (Category) | 165 (48.1%) | 178 (51.9%) |
| Total (Overall) | 1,178 (50.5%) | 1,153 (49.5%) |
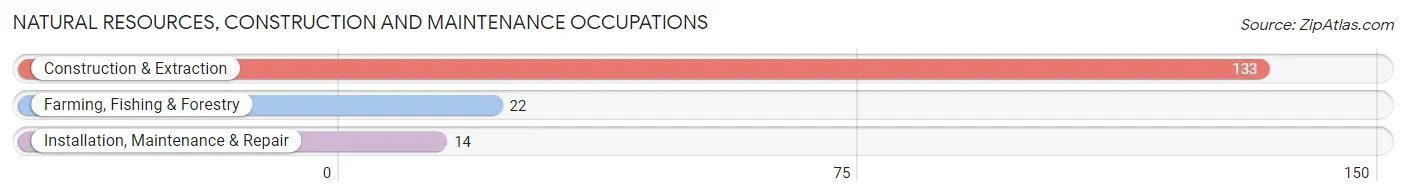
Natural Resources, Construction and Maintenance Occupations
The most common Natural Resources, Construction and Maintenance occupations in Central are Construction & Extraction (133 | 5.7%), Farming, Fishing & Forestry (22 | 0.9%), and Installation, Maintenance & Repair (14 | 0.6%).
Natural Resources, Construction and Maintenance Occupations by Sex
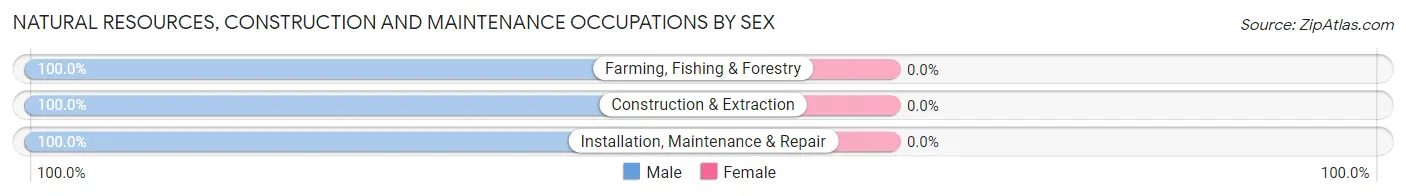
| Occupation | Male | Female |
| Farming, Fishing & Forestry | 22 (100.0%) | 0 (0.0%) |
| Construction & Extraction | 133 (100.0%) | 0 (0.0%) |
| Installation, Maintenance & Repair | 14 (100.0%) | 0 (0.0%) |
| Total (Category) | 169 (100.0%) | 0 (0.0%) |
| Total (Overall) | 1,178 (50.5%) | 1,153 (49.5%) |
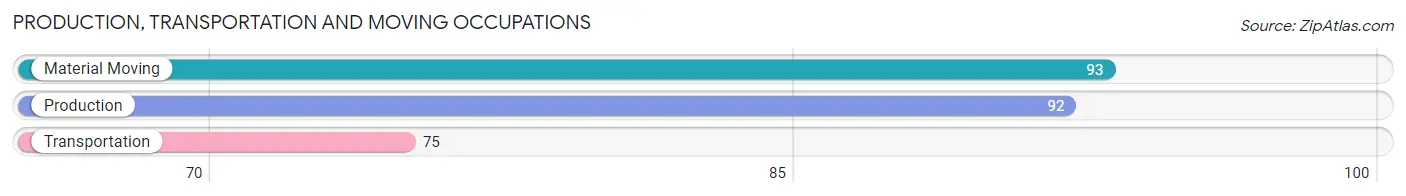
Production, Transportation and Moving Occupations
The most common Production, Transportation and Moving occupations in Central are Material Moving (93 | 4.0%), Production (92 | 4.0%), and Transportation (75 | 3.2%).
Production, Transportation and Moving Occupations by Sex
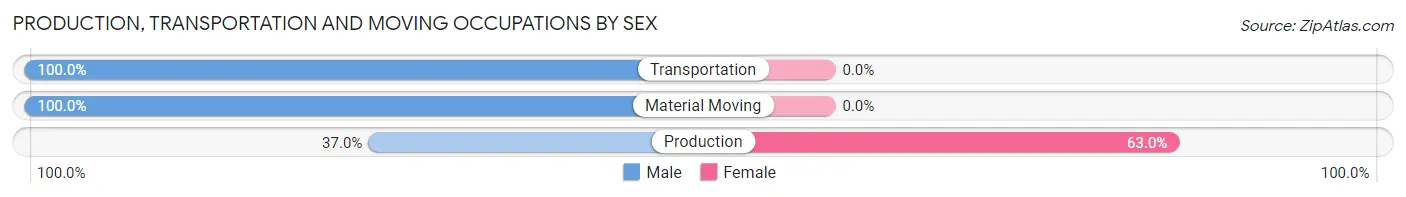
| Occupation | Male | Female |
| Production | 34 (37.0%) | 58 (63.0%) |
| Transportation | 75 (100.0%) | 0 (0.0%) |
| Material Moving | 93 (100.0%) | 0 (0.0%) |
| Total (Category) | 202 (77.7%) | 58 (22.3%) |
| Total (Overall) | 1,178 (50.5%) | 1,153 (49.5%) |
Employment Industries by Sex in Central
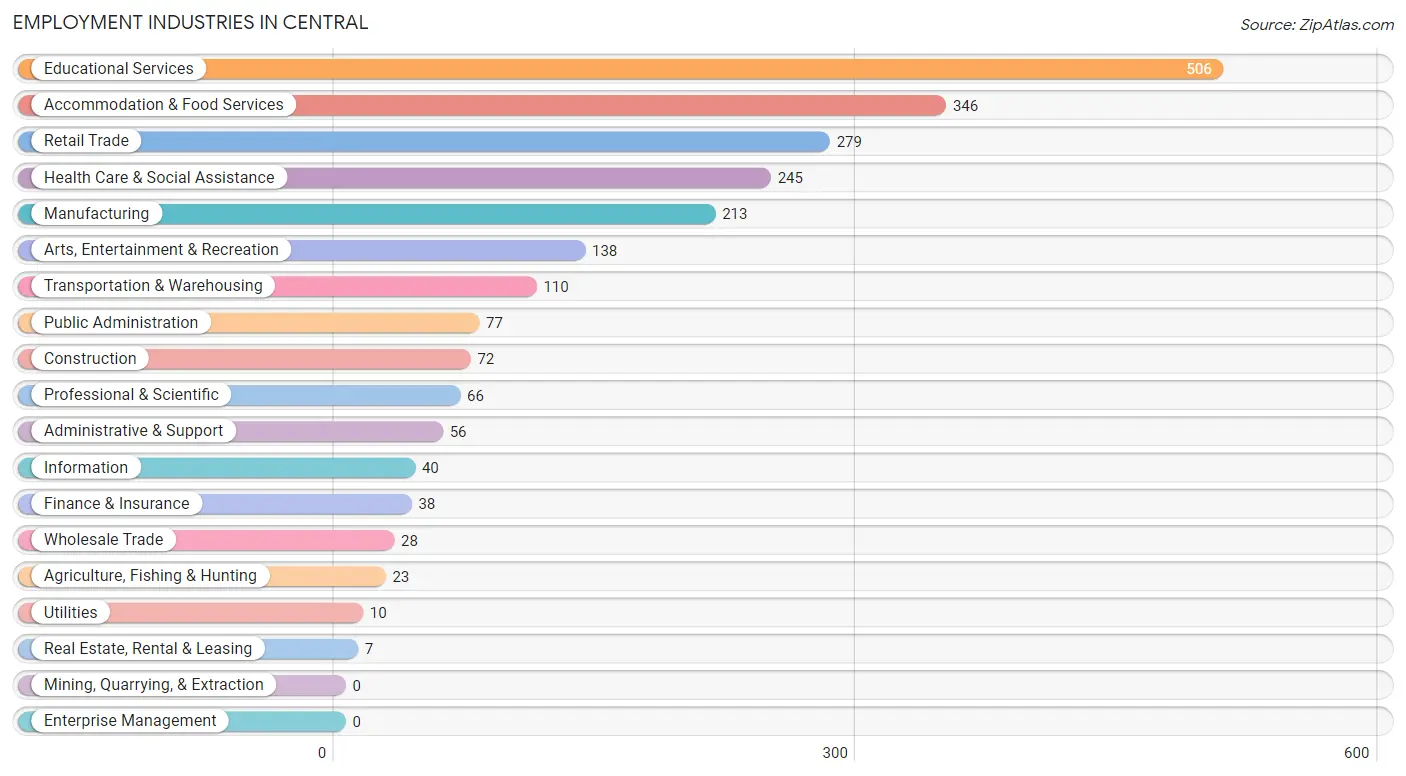
Employment Industries in Central
The major employment industries in Central include Educational Services (506 | 21.7%), Accommodation & Food Services (346 | 14.8%), Retail Trade (279 | 12.0%), Health Care & Social Assistance (245 | 10.5%), and Manufacturing (213 | 9.1%).
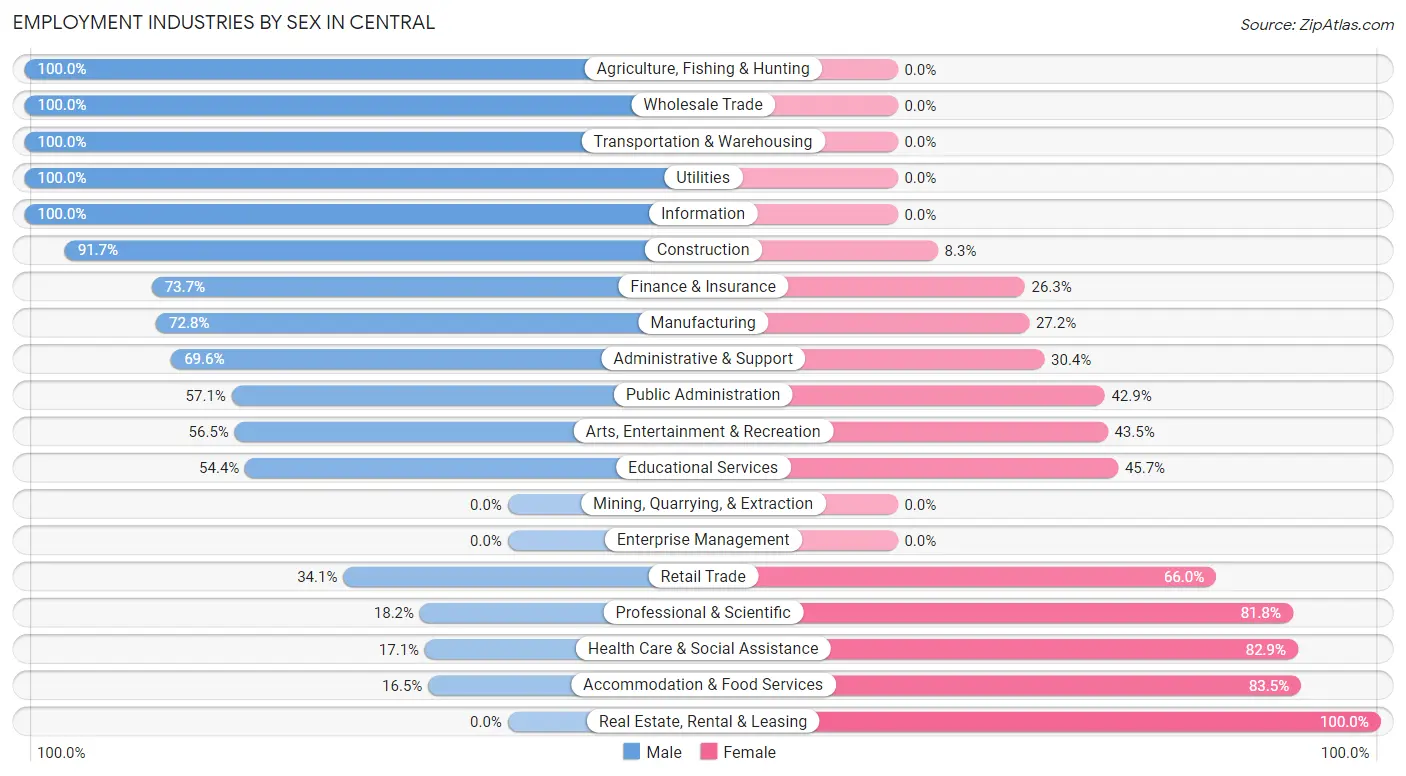
Employment Industries by Sex in Central
The Central industries that see more men than women are Agriculture, Fishing & Hunting (100.0%), Wholesale Trade (100.0%), and Transportation & Warehousing (100.0%), whereas the industries that tend to have a higher number of women are Real Estate, Rental & Leasing (100.0%), Accommodation & Food Services (83.5%), and Health Care & Social Assistance (82.9%).
| Industry | Male | Female |
| Agriculture, Fishing & Hunting | 23 (100.0%) | 0 (0.0%) |
| Mining, Quarrying, & Extraction | 0 (0.0%) | 0 (0.0%) |
| Construction | 66 (91.7%) | 6 (8.3%) |
| Manufacturing | 155 (72.8%) | 58 (27.2%) |
| Wholesale Trade | 28 (100.0%) | 0 (0.0%) |
| Retail Trade | 95 (34.1%) | 184 (65.9%) |
| Transportation & Warehousing | 110 (100.0%) | 0 (0.0%) |
| Utilities | 10 (100.0%) | 0 (0.0%) |
| Information | 40 (100.0%) | 0 (0.0%) |
| Finance & Insurance | 28 (73.7%) | 10 (26.3%) |
| Real Estate, Rental & Leasing | 0 (0.0%) | 7 (100.0%) |
| Professional & Scientific | 12 (18.2%) | 54 (81.8%) |
| Enterprise Management | 0 (0.0%) | 0 (0.0%) |
| Administrative & Support | 39 (69.6%) | 17 (30.4%) |
| Educational Services | 275 (54.3%) | 231 (45.7%) |
| Health Care & Social Assistance | 42 (17.1%) | 203 (82.9%) |
| Arts, Entertainment & Recreation | 78 (56.5%) | 60 (43.5%) |
| Accommodation & Food Services | 57 (16.5%) | 289 (83.5%) |
| Public Administration | 44 (57.1%) | 33 (42.9%) |
| Total | 1,178 (50.5%) | 1,153 (49.5%) |
Education in Central
School Enrollment in Central
The most common levels of schooling among the 2,509 students in Central are college / undergraduate (1,695 | 67.6%), high school (260 | 10.4%), and graduate / professional (250 | 10.0%).
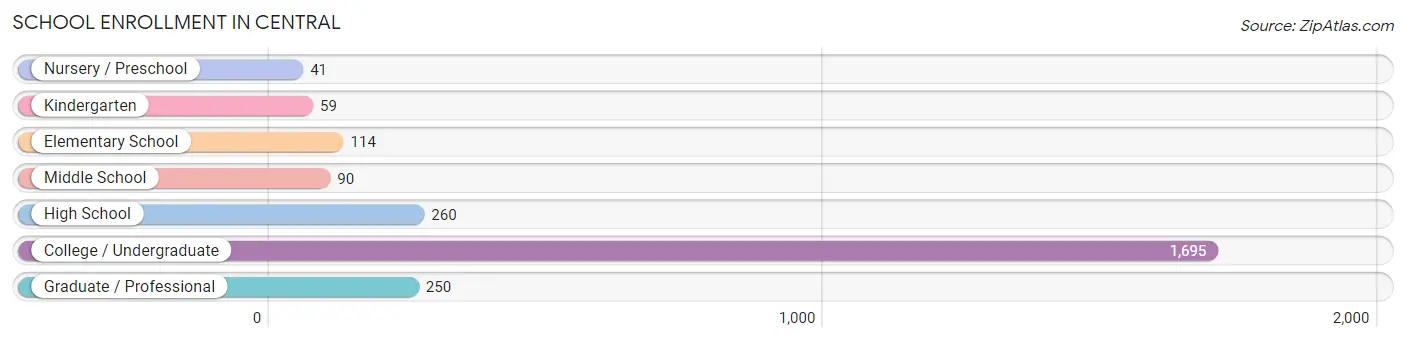
| School Level | # Students | % Students |
| Nursery / Preschool | 41 | 1.6% |
| Kindergarten | 59 | 2.4% |
| Elementary School | 114 | 4.5% |
| Middle School | 90 | 3.6% |
| High School | 260 | 10.4% |
| College / Undergraduate | 1,695 | 67.6% |
| Graduate / Professional | 250 | 10.0% |
| Total | 2,509 | 100.0% |
School Enrollment by Age by Funding Source in Central
Out of a total of 2,509 students who are enrolled in schools in Central, 321 (12.8%) attend a private institution, while the remaining 2,188 (87.2%) are enrolled in public schools. The age group of 3 to 4 year olds has the highest likelihood of being enrolled in private schools, with 41 (100.0% in the age bracket) enrolled. Conversely, the age group of 15 to 17 year olds has the lowest likelihood of being enrolled in a private school, with 118 (100.0% in the age bracket) attending a public institution.
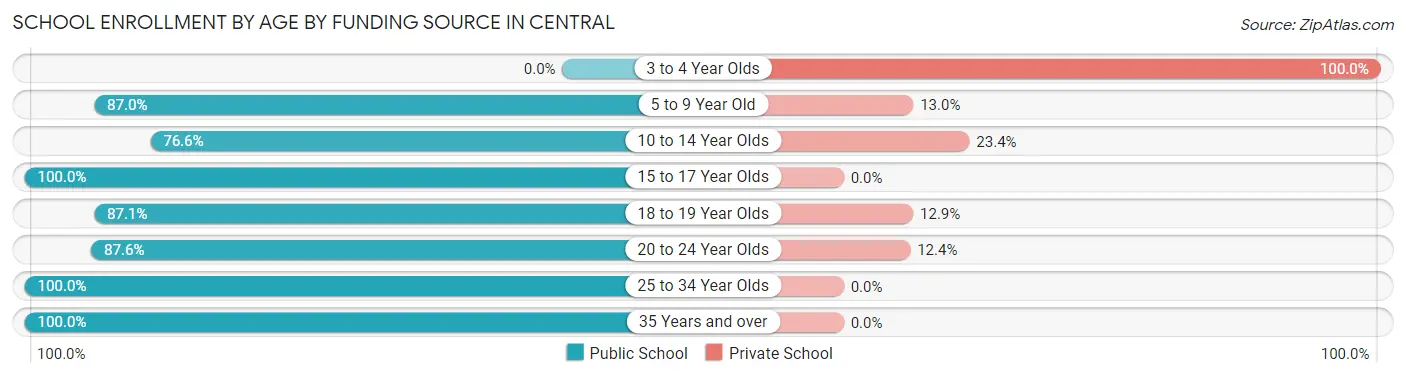
| Age Bracket | Public School | Private School |
| 3 to 4 Year Olds | 0 (0.0%) | 41 (100.0%) |
| 5 to 9 Year Old | 141 (87.0%) | 21 (13.0%) |
| 10 to 14 Year Olds | 85 (76.6%) | 26 (23.4%) |
| 15 to 17 Year Olds | 118 (100.0%) | 0 (0.0%) |
| 18 to 19 Year Olds | 835 (87.1%) | 124 (12.9%) |
| 20 to 24 Year Olds | 777 (87.6%) | 110 (12.4%) |
| 25 to 34 Year Olds | 206 (100.0%) | 0 (0.0%) |
| 35 Years and over | 25 (100.0%) | 0 (0.0%) |
| Total | 2,188 (87.2%) | 321 (12.8%) |
Educational Attainment by Field of Study in Central
Education (289 | 24.4%), social sciences (218 | 18.4%), computers & mathematics (118 | 10.0%), science & technology (97 | 8.2%), and visual & performing arts (97 | 8.2%) are the most common fields of study among 1,185 individuals in Central who have obtained a bachelor's degree or higher.
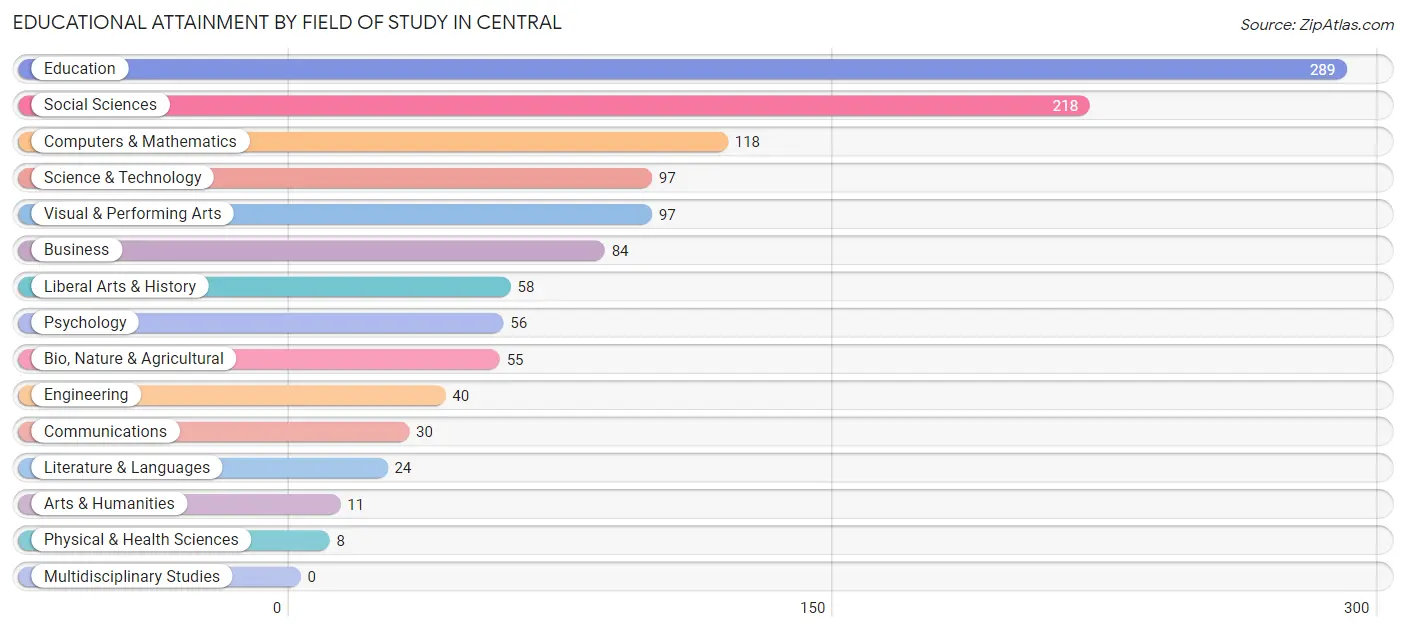
| Field of Study | # Graduates | % Graduates |
| Computers & Mathematics | 118 | 10.0% |
| Bio, Nature & Agricultural | 55 | 4.6% |
| Physical & Health Sciences | 8 | 0.7% |
| Psychology | 56 | 4.7% |
| Social Sciences | 218 | 18.4% |
| Engineering | 40 | 3.4% |
| Multidisciplinary Studies | 0 | 0.0% |
| Science & Technology | 97 | 8.2% |
| Business | 84 | 7.1% |
| Education | 289 | 24.4% |
| Literature & Languages | 24 | 2.0% |
| Liberal Arts & History | 58 | 4.9% |
| Visual & Performing Arts | 97 | 8.2% |
| Communications | 30 | 2.5% |
| Arts & Humanities | 11 | 0.9% |
| Total | 1,185 | 100.0% |
Transportation & Commute in Central
Vehicle Availability by Sex in Central
The most prevalent vehicle ownership categories in Central are males with 1 vehicle (277, accounting for 25.7%) and females with 1 vehicle (218, making up 24.5%).
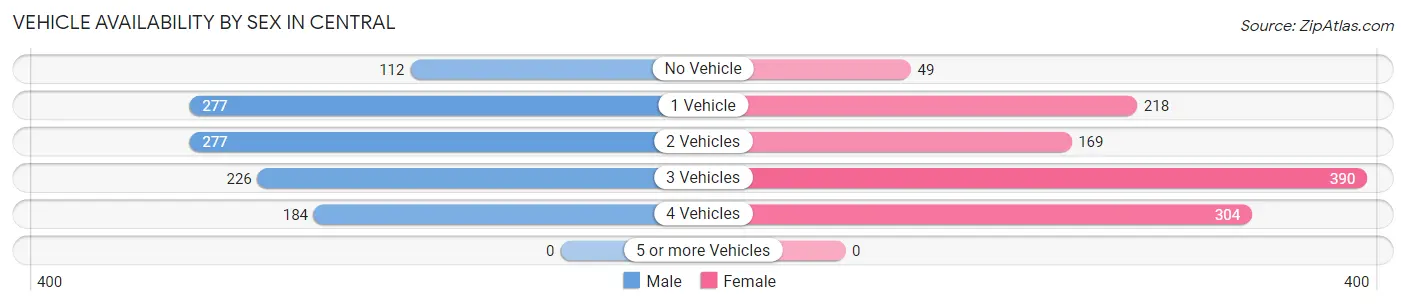
| Vehicles Available | Male | Female |
| No Vehicle | 112 (10.4%) | 49 (4.3%) |
| 1 Vehicle | 277 (25.7%) | 218 (19.3%) |
| 2 Vehicles | 277 (25.7%) | 169 (15.0%) |
| 3 Vehicles | 226 (21.0%) | 390 (34.5%) |
| 4 Vehicles | 184 (17.1%) | 304 (26.9%) |
| 5 or more Vehicles | 0 (0.0%) | 0 (0.0%) |
| Total | 1,076 (100.0%) | 1,130 (100.0%) |
Commute Time in Central
The most frequently occuring commute durations in Central are 5 to 9 minutes (478 commuters, 22.4%), 10 to 14 minutes (460 commuters, 21.5%), and 20 to 24 minutes (372 commuters, 17.4%).
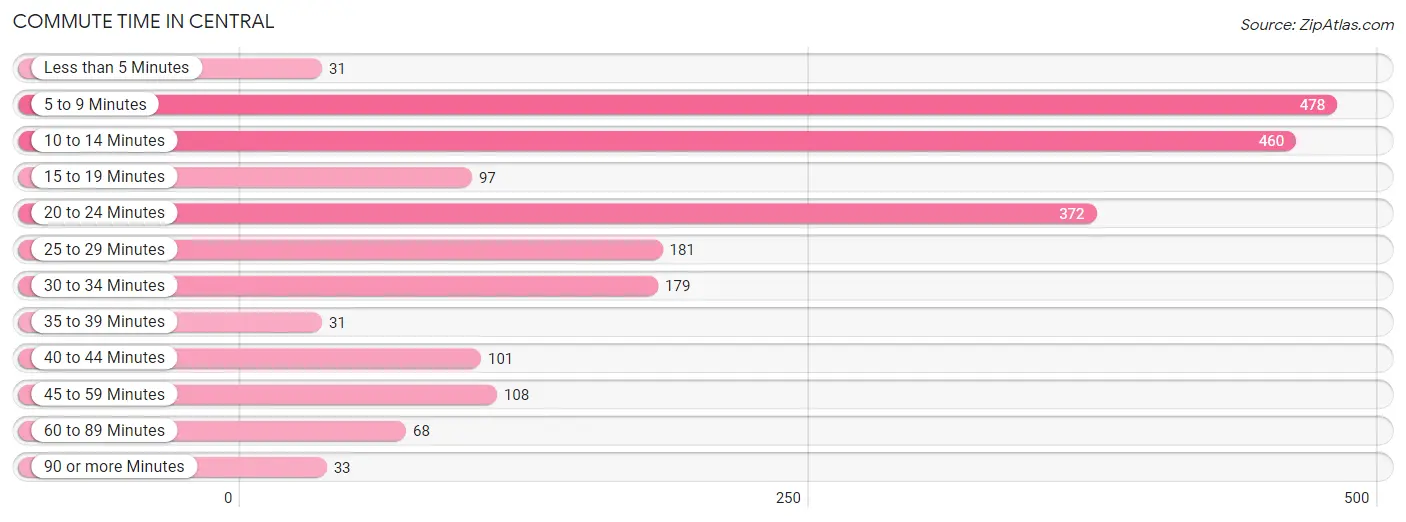
| Commute Time | # Commuters | % Commuters |
| Less than 5 Minutes | 31 | 1.5% |
| 5 to 9 Minutes | 478 | 22.4% |
| 10 to 14 Minutes | 460 | 21.5% |
| 15 to 19 Minutes | 97 | 4.5% |
| 20 to 24 Minutes | 372 | 17.4% |
| 25 to 29 Minutes | 181 | 8.5% |
| 30 to 34 Minutes | 179 | 8.4% |
| 35 to 39 Minutes | 31 | 1.5% |
| 40 to 44 Minutes | 101 | 4.7% |
| 45 to 59 Minutes | 108 | 5.1% |
| 60 to 89 Minutes | 68 | 3.2% |
| 90 or more Minutes | 33 | 1.5% |
Commute Time by Sex in Central
The most common commute times in Central are 10 to 14 minutes (197 commuters, 19.8%) for males and 5 to 9 minutes (283 commuters, 24.7%) for females.
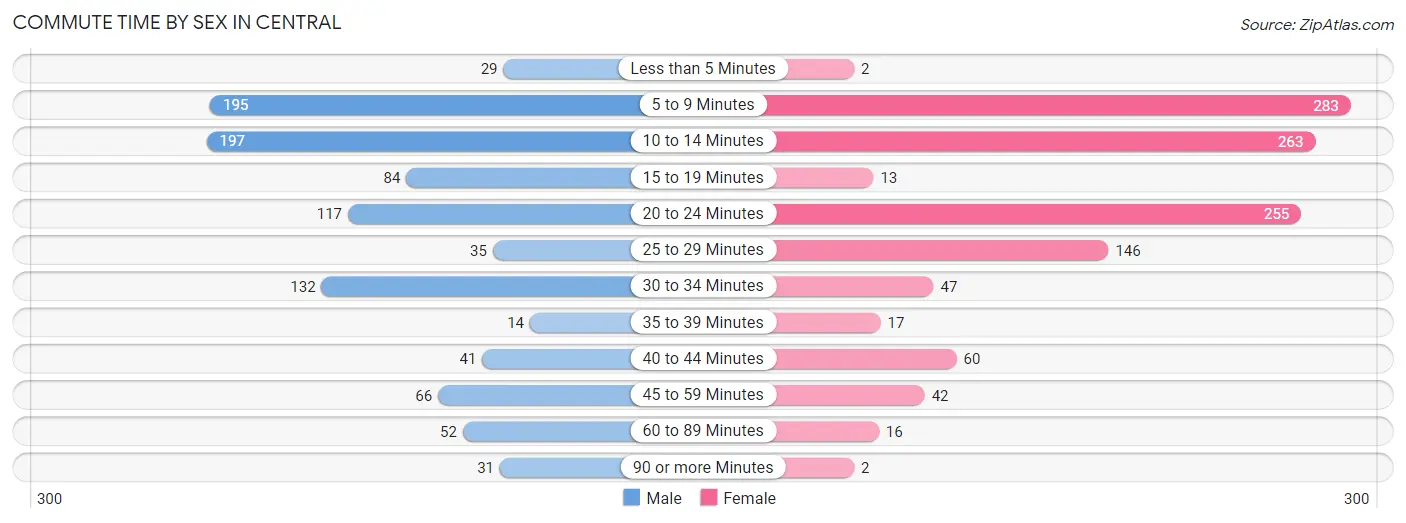
| Commute Time | Male | Female |
| Less than 5 Minutes | 29 (2.9%) | 2 (0.2%) |
| 5 to 9 Minutes | 195 (19.6%) | 283 (24.7%) |
| 10 to 14 Minutes | 197 (19.8%) | 263 (23.0%) |
| 15 to 19 Minutes | 84 (8.5%) | 13 (1.1%) |
| 20 to 24 Minutes | 117 (11.8%) | 255 (22.3%) |
| 25 to 29 Minutes | 35 (3.5%) | 146 (12.7%) |
| 30 to 34 Minutes | 132 (13.3%) | 47 (4.1%) |
| 35 to 39 Minutes | 14 (1.4%) | 17 (1.5%) |
| 40 to 44 Minutes | 41 (4.1%) | 60 (5.2%) |
| 45 to 59 Minutes | 66 (6.7%) | 42 (3.7%) |
| 60 to 89 Minutes | 52 (5.2%) | 16 (1.4%) |
| 90 or more Minutes | 31 (3.1%) | 2 (0.2%) |
Time of Departure to Work by Sex in Central
The most frequent times of departure to work in Central are 8:00 AM to 8:29 AM (205, 20.6%) for males and 7:00 AM to 7:29 AM (284, 24.8%) for females.
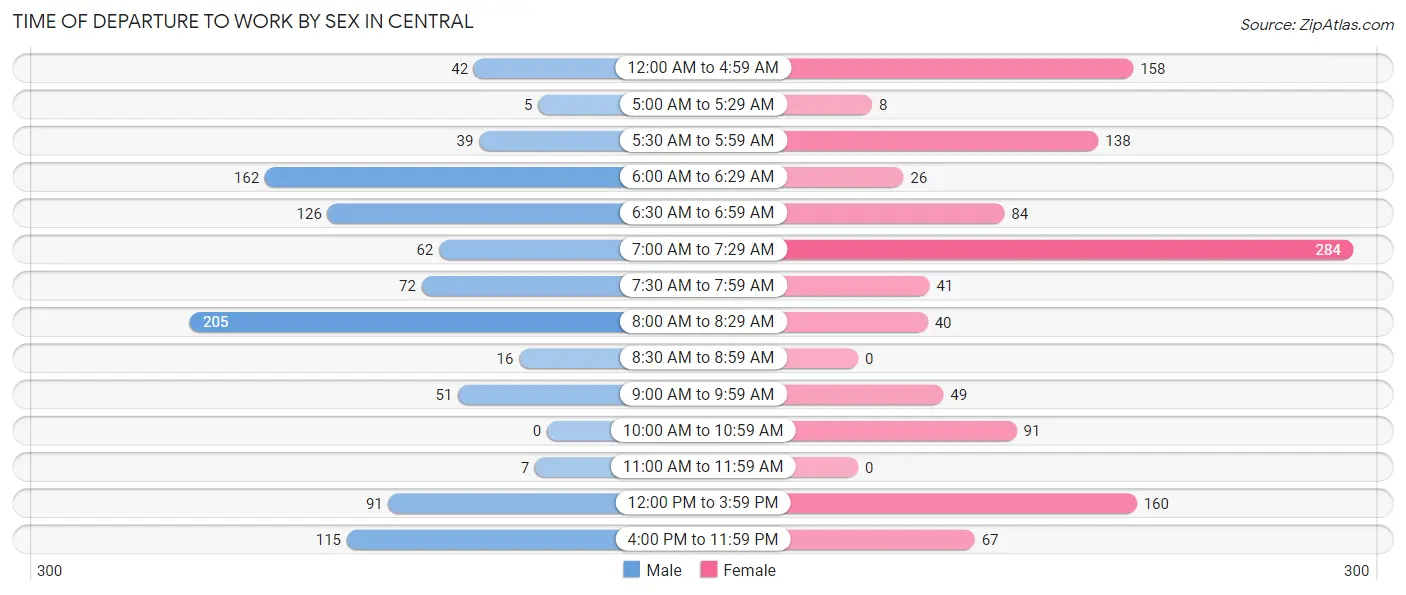
| Time of Departure | Male | Female |
| 12:00 AM to 4:59 AM | 42 (4.2%) | 158 (13.8%) |
| 5:00 AM to 5:29 AM | 5 (0.5%) | 8 (0.7%) |
| 5:30 AM to 5:59 AM | 39 (3.9%) | 138 (12.0%) |
| 6:00 AM to 6:29 AM | 162 (16.3%) | 26 (2.3%) |
| 6:30 AM to 6:59 AM | 126 (12.7%) | 84 (7.3%) |
| 7:00 AM to 7:29 AM | 62 (6.2%) | 284 (24.8%) |
| 7:30 AM to 7:59 AM | 72 (7.2%) | 41 (3.6%) |
| 8:00 AM to 8:29 AM | 205 (20.6%) | 40 (3.5%) |
| 8:30 AM to 8:59 AM | 16 (1.6%) | 0 (0.0%) |
| 9:00 AM to 9:59 AM | 51 (5.1%) | 49 (4.3%) |
| 10:00 AM to 10:59 AM | 0 (0.0%) | 91 (7.9%) |
| 11:00 AM to 11:59 AM | 7 (0.7%) | 0 (0.0%) |
| 12:00 PM to 3:59 PM | 91 (9.2%) | 160 (14.0%) |
| 4:00 PM to 11:59 PM | 115 (11.6%) | 67 (5.9%) |
| Total | 993 (100.0%) | 1,146 (100.0%) |
Housing Occupancy in Central
Occupancy by Ownership in Central
Of the total 1,886 dwellings in Central, owner-occupied units account for 379 (20.1%), while renter-occupied units make up 1,507 (79.9%).
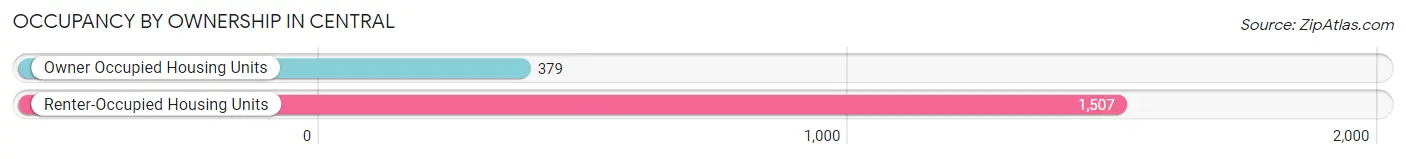
| Occupancy | # Housing Units | % Housing Units |
| Owner Occupied Housing Units | 379 | 20.1% |
| Renter-Occupied Housing Units | 1,507 | 79.9% |
| Total Occupied Housing Units | 1,886 | 100.0% |
Occupancy by Household Size in Central
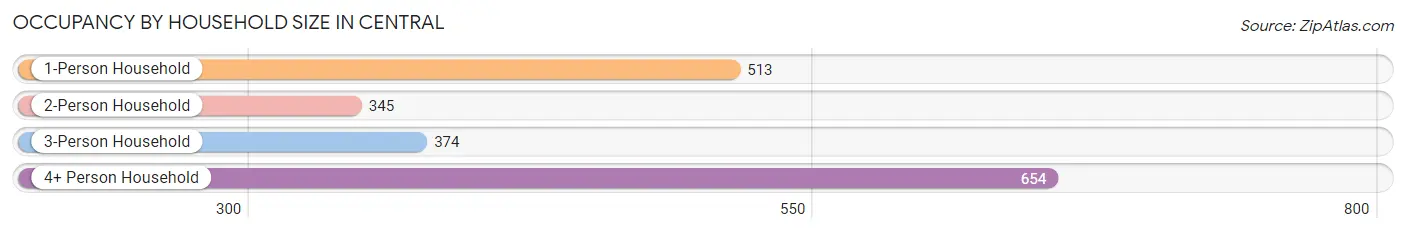
| Household Size | # Housing Units | % Housing Units |
| 1-Person Household | 513 | 27.2% |
| 2-Person Household | 345 | 18.3% |
| 3-Person Household | 374 | 19.8% |
| 4+ Person Household | 654 | 34.7% |
| Total Housing Units | 1,886 | 100.0% |
Occupancy by Ownership by Household Size in Central
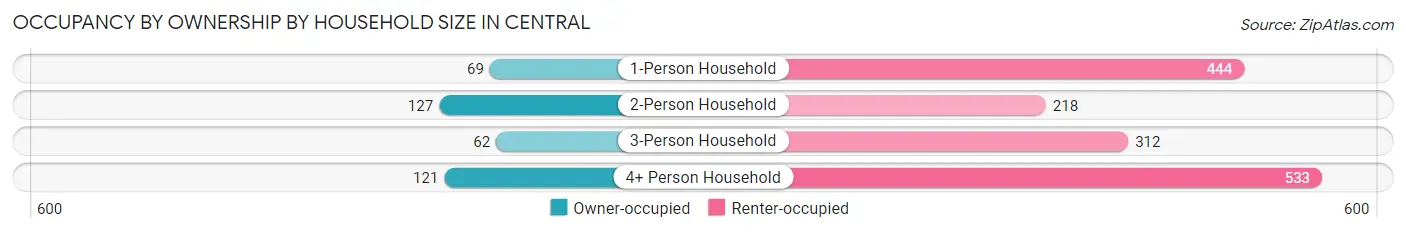
| Household Size | Owner-occupied | Renter-occupied |
| 1-Person Household | 69 (13.5%) | 444 (86.6%) |
| 2-Person Household | 127 (36.8%) | 218 (63.2%) |
| 3-Person Household | 62 (16.6%) | 312 (83.4%) |
| 4+ Person Household | 121 (18.5%) | 533 (81.5%) |
| Total Housing Units | 379 (20.1%) | 1,507 (79.9%) |
Occupancy by Educational Attainment in Central
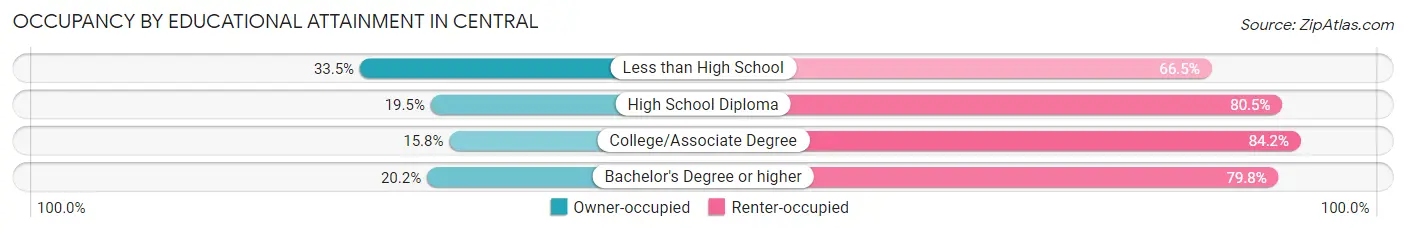
| Household Size | Owner-occupied | Renter-occupied |
| Less than High School | 62 (33.5%) | 123 (66.5%) |
| High School Diploma | 83 (19.5%) | 343 (80.5%) |
| College/Associate Degree | 85 (15.8%) | 453 (84.2%) |
| Bachelor's Degree or higher | 149 (20.2%) | 588 (79.8%) |
Occupancy by Age of Householder in Central
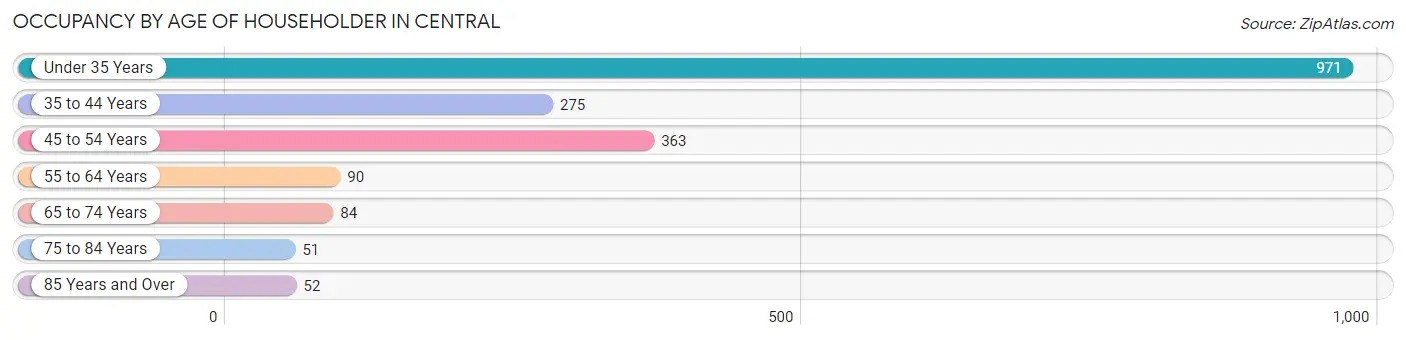
| Age Bracket | # Households | % Households |
| Under 35 Years | 971 | 51.5% |
| 35 to 44 Years | 275 | 14.6% |
| 45 to 54 Years | 363 | 19.3% |
| 55 to 64 Years | 90 | 4.8% |
| 65 to 74 Years | 84 | 4.4% |
| 75 to 84 Years | 51 | 2.7% |
| 85 Years and Over | 52 | 2.8% |
| Total | 1,886 | 100.0% |
Housing Finances in Central
Median Income by Occupancy in Central
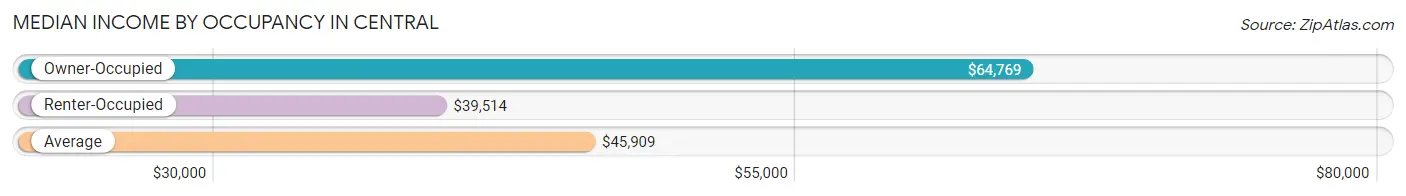
| Occupancy Type | # Households | Median Income |
| Owner-Occupied | 379 (20.1%) | $64,769 |
| Renter-Occupied | 1,507 (79.9%) | $39,514 |
| Average | 1,886 (100.0%) | $45,909 |
Occupancy by Householder Income Bracket in Central
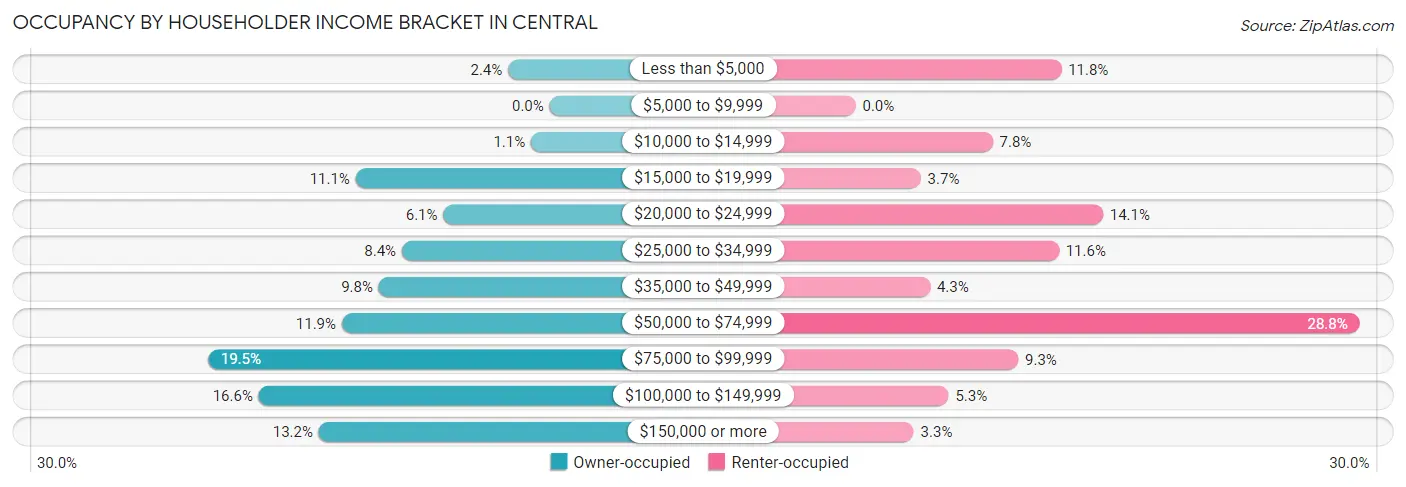
| Income Bracket | Owner-occupied | Renter-occupied |
| Less than $5,000 | 9 (2.4%) | 177 (11.7%) |
| $5,000 to $9,999 | 0 (0.0%) | 0 (0.0%) |
| $10,000 to $14,999 | 4 (1.1%) | 118 (7.8%) |
| $15,000 to $19,999 | 42 (11.1%) | 56 (3.7%) |
| $20,000 to $24,999 | 23 (6.1%) | 213 (14.1%) |
| $25,000 to $34,999 | 32 (8.4%) | 175 (11.6%) |
| $35,000 to $49,999 | 37 (9.8%) | 64 (4.3%) |
| $50,000 to $74,999 | 45 (11.9%) | 434 (28.8%) |
| $75,000 to $99,999 | 74 (19.5%) | 140 (9.3%) |
| $100,000 to $149,999 | 63 (16.6%) | 80 (5.3%) |
| $150,000 or more | 50 (13.2%) | 50 (3.3%) |
| Total | 379 (100.0%) | 1,507 (100.0%) |
Monthly Housing Cost Tiers in Central
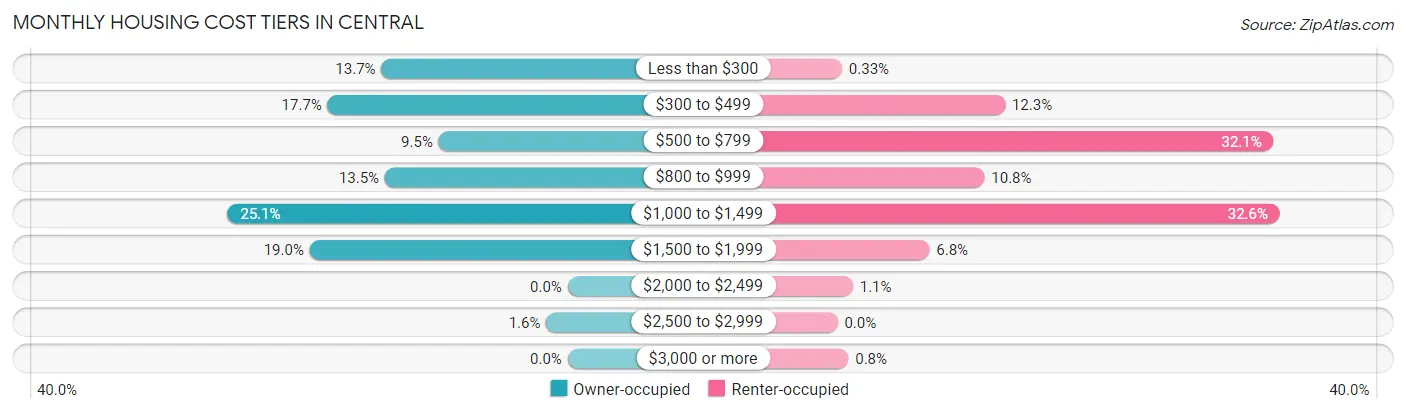
| Monthly Cost | Owner-occupied | Renter-occupied |
| Less than $300 | 52 (13.7%) | 5 (0.3%) |
| $300 to $499 | 67 (17.7%) | 186 (12.3%) |
| $500 to $799 | 36 (9.5%) | 484 (32.1%) |
| $800 to $999 | 51 (13.5%) | 163 (10.8%) |
| $1,000 to $1,499 | 95 (25.1%) | 491 (32.6%) |
| $1,500 to $1,999 | 72 (19.0%) | 102 (6.8%) |
| $2,000 to $2,499 | 0 (0.0%) | 17 (1.1%) |
| $2,500 to $2,999 | 6 (1.6%) | 0 (0.0%) |
| $3,000 or more | 0 (0.0%) | 12 (0.8%) |
| Total | 379 (100.0%) | 1,507 (100.0%) |
Physical Housing Characteristics in Central
Housing Structures in Central
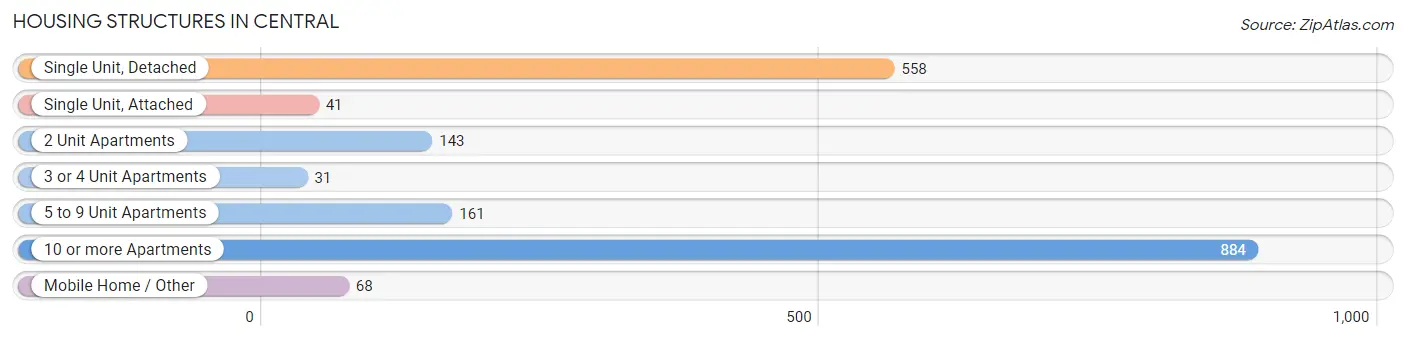
| Structure Type | # Housing Units | % Housing Units |
| Single Unit, Detached | 558 | 29.6% |
| Single Unit, Attached | 41 | 2.2% |
| 2 Unit Apartments | 143 | 7.6% |
| 3 or 4 Unit Apartments | 31 | 1.6% |
| 5 to 9 Unit Apartments | 161 | 8.5% |
| 10 or more Apartments | 884 | 46.9% |
| Mobile Home / Other | 68 | 3.6% |
| Total | 1,886 | 100.0% |
Housing Structures by Occupancy in Central
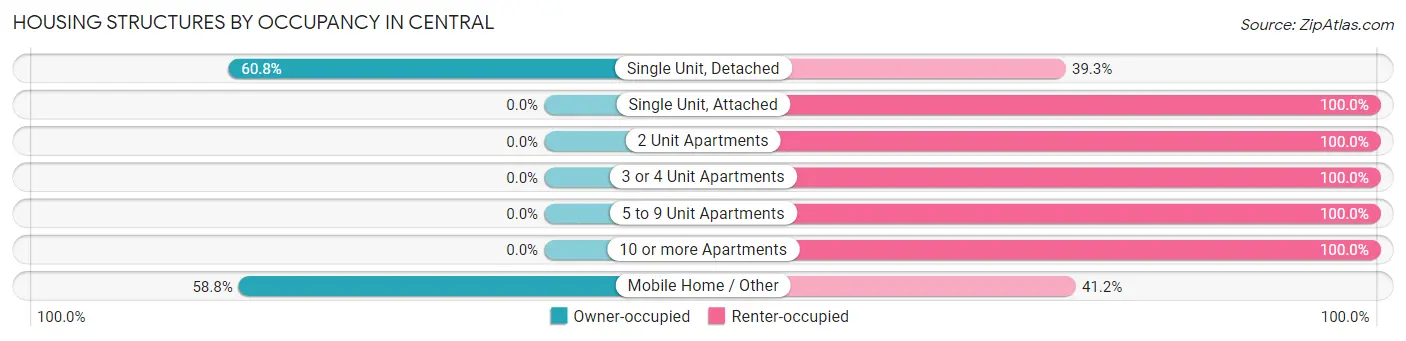
| Structure Type | Owner-occupied | Renter-occupied |
| Single Unit, Detached | 339 (60.8%) | 219 (39.3%) |
| Single Unit, Attached | 0 (0.0%) | 41 (100.0%) |
| 2 Unit Apartments | 0 (0.0%) | 143 (100.0%) |
| 3 or 4 Unit Apartments | 0 (0.0%) | 31 (100.0%) |
| 5 to 9 Unit Apartments | 0 (0.0%) | 161 (100.0%) |
| 10 or more Apartments | 0 (0.0%) | 884 (100.0%) |
| Mobile Home / Other | 40 (58.8%) | 28 (41.2%) |
| Total | 379 (20.1%) | 1,507 (79.9%) |
Housing Structures by Number of Rooms in Central
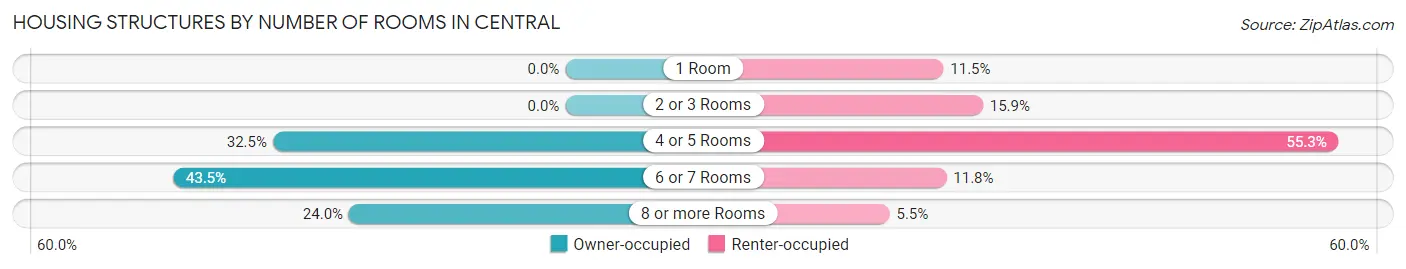
| Number of Rooms | Owner-occupied | Renter-occupied |
| 1 Room | 0 (0.0%) | 173 (11.5%) |
| 2 or 3 Rooms | 0 (0.0%) | 239 (15.9%) |
| 4 or 5 Rooms | 123 (32.5%) | 834 (55.3%) |
| 6 or 7 Rooms | 165 (43.5%) | 178 (11.8%) |
| 8 or more Rooms | 91 (24.0%) | 83 (5.5%) |
| Total | 379 (100.0%) | 1,507 (100.0%) |
Housing Structure by Heating Type in Central
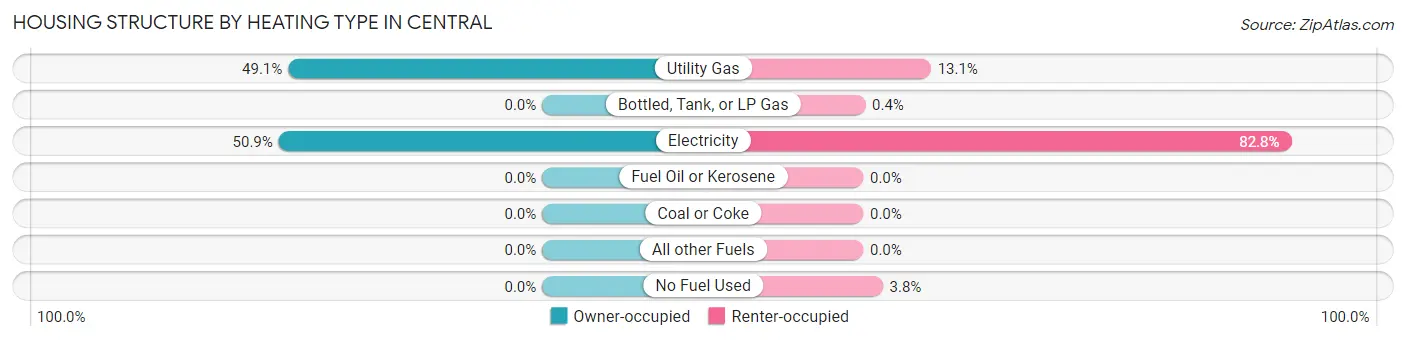
| Heating Type | Owner-occupied | Renter-occupied |
| Utility Gas | 186 (49.1%) | 197 (13.1%) |
| Bottled, Tank, or LP Gas | 0 (0.0%) | 6 (0.4%) |
| Electricity | 193 (50.9%) | 1,247 (82.8%) |
| Fuel Oil or Kerosene | 0 (0.0%) | 0 (0.0%) |
| Coal or Coke | 0 (0.0%) | 0 (0.0%) |
| All other Fuels | 0 (0.0%) | 0 (0.0%) |
| No Fuel Used | 0 (0.0%) | 57 (3.8%) |
| Total | 379 (100.0%) | 1,507 (100.0%) |
Household Vehicle Usage in Central
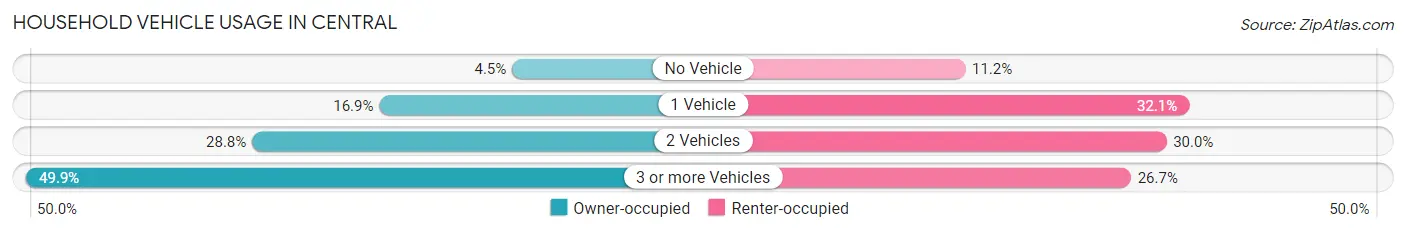
| Vehicles per Household | Owner-occupied | Renter-occupied |
| No Vehicle | 17 (4.5%) | 169 (11.2%) |
| 1 Vehicle | 64 (16.9%) | 484 (32.1%) |
| 2 Vehicles | 109 (28.8%) | 452 (30.0%) |
| 3 or more Vehicles | 189 (49.9%) | 402 (26.7%) |
| Total | 379 (100.0%) | 1,507 (100.0%) |
Real Estate & Mortgages in Central
Real Estate and Mortgage Overview in Central
| Characteristic | Without Mortgage | With Mortgage |
| Housing Units | 139 | 240 |
| Median Property Value | $198,100 | $215,900 |
| Median Household Income | - | - |
| Monthly Housing Costs | $317 | $0 |
| Real Estate Taxes | $486 | $35 |
Property Value by Mortgage Status in Central
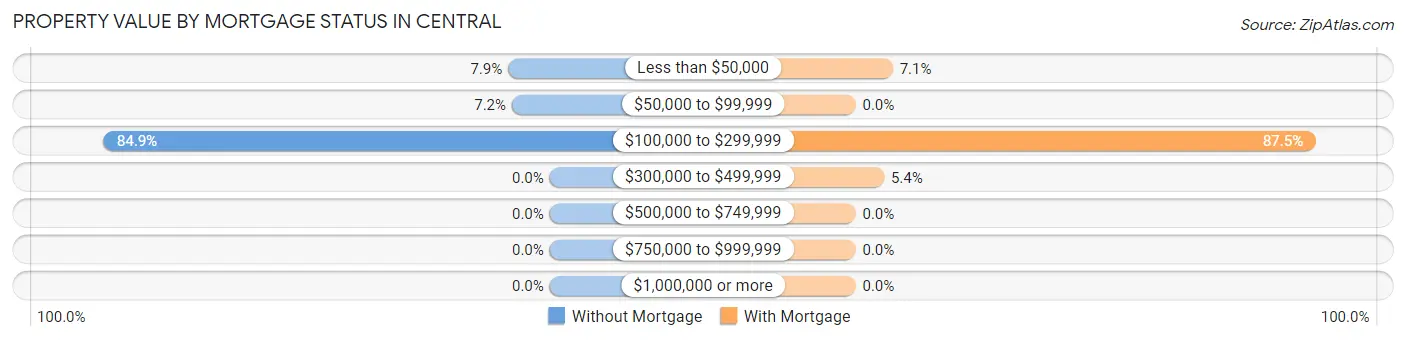
| Property Value | Without Mortgage | With Mortgage |
| Less than $50,000 | 11 (7.9%) | 17 (7.1%) |
| $50,000 to $99,999 | 10 (7.2%) | 0 (0.0%) |
| $100,000 to $299,999 | 118 (84.9%) | 210 (87.5%) |
| $300,000 to $499,999 | 0 (0.0%) | 13 (5.4%) |
| $500,000 to $749,999 | 0 (0.0%) | 0 (0.0%) |
| $750,000 to $999,999 | 0 (0.0%) | 0 (0.0%) |
| $1,000,000 or more | 0 (0.0%) | 0 (0.0%) |
| Total | 139 (100.0%) | 240 (100.0%) |
Household Income by Mortgage Status in Central
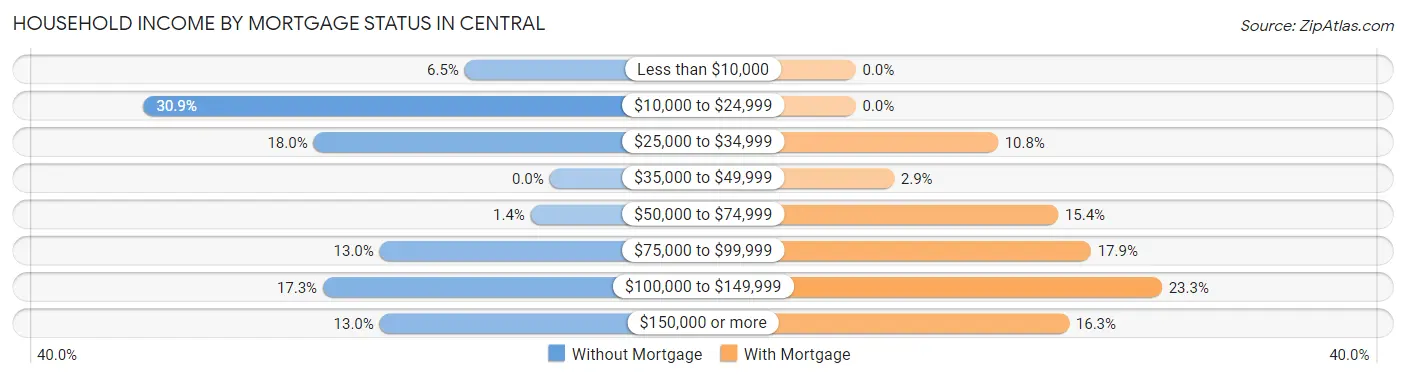
| Household Income | Without Mortgage | With Mortgage |
| Less than $10,000 | 9 (6.5%) | 0 (0.0%) |
| $10,000 to $24,999 | 43 (30.9%) | 0 (0.0%) |
| $25,000 to $34,999 | 25 (18.0%) | 26 (10.8%) |
| $35,000 to $49,999 | 0 (0.0%) | 7 (2.9%) |
| $50,000 to $74,999 | 2 (1.4%) | 37 (15.4%) |
| $75,000 to $99,999 | 18 (13.0%) | 43 (17.9%) |
| $100,000 to $149,999 | 24 (17.3%) | 56 (23.3%) |
| $150,000 or more | 18 (13.0%) | 39 (16.3%) |
| Total | 139 (100.0%) | 240 (100.0%) |
Property Value to Household Income Ratio in Central
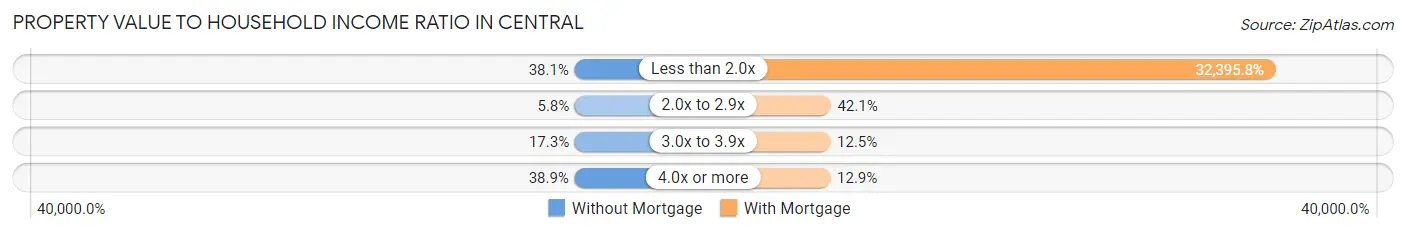
| Value-to-Income Ratio | Without Mortgage | With Mortgage |
| Less than 2.0x | 53 (38.1%) | 77,750 (32,395.8%) |
| 2.0x to 2.9x | 8 (5.8%) | 101 (42.1%) |
| 3.0x to 3.9x | 24 (17.3%) | 30 (12.5%) |
| 4.0x or more | 54 (38.9%) | 31 (12.9%) |
| Total | 139 (100.0%) | 240 (100.0%) |
Real Estate Taxes by Mortgage Status in Central
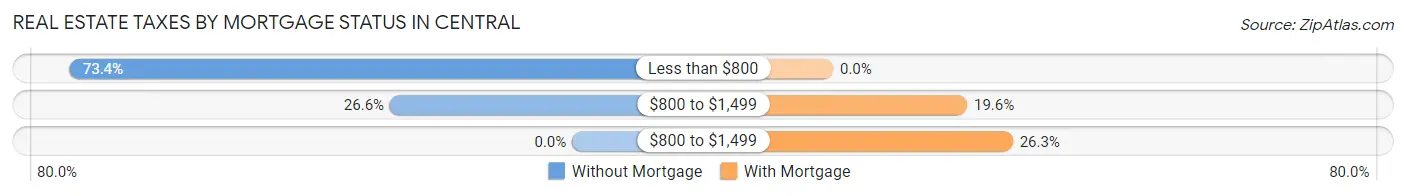
| Property Taxes | Without Mortgage | With Mortgage |
| Less than $800 | 102 (73.4%) | 0 (0.0%) |
| $800 to $1,499 | 37 (26.6%) | 47 (19.6%) |
| $800 to $1,499 | 0 (0.0%) | 63 (26.3%) |
| Total | 139 (100.0%) | 240 (100.0%) |
Health & Disability in Central
Health Insurance Coverage by Age in Central
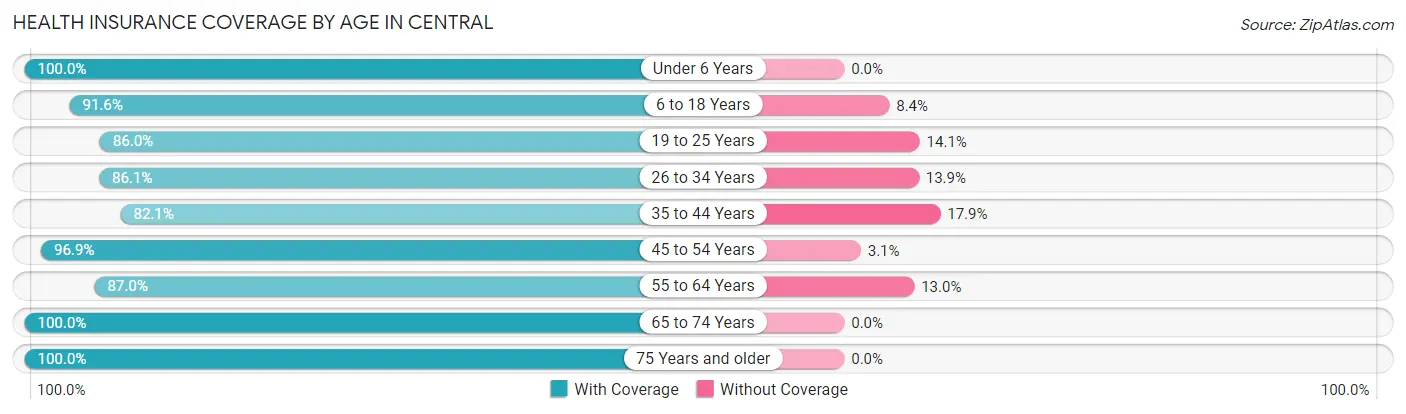
| Age Bracket | With Coverage | Without Coverage |
| Under 6 Years | 452 (100.0%) | 0 (0.0%) |
| 6 to 18 Years | 699 (91.6%) | 64 (8.4%) |
| 19 to 25 Years | 1,560 (86.0%) | 255 (14.1%) |
| 26 to 34 Years | 595 (86.1%) | 96 (13.9%) |
| 35 to 44 Years | 367 (82.1%) | 80 (17.9%) |
| 45 to 54 Years | 503 (96.9%) | 16 (3.1%) |
| 55 to 64 Years | 200 (87.0%) | 30 (13.0%) |
| 65 to 74 Years | 185 (100.0%) | 0 (0.0%) |
| 75 Years and older | 153 (100.0%) | 0 (0.0%) |
| Total | 4,714 (89.7%) | 541 (10.3%) |
Health Insurance Coverage by Citizenship Status in Central
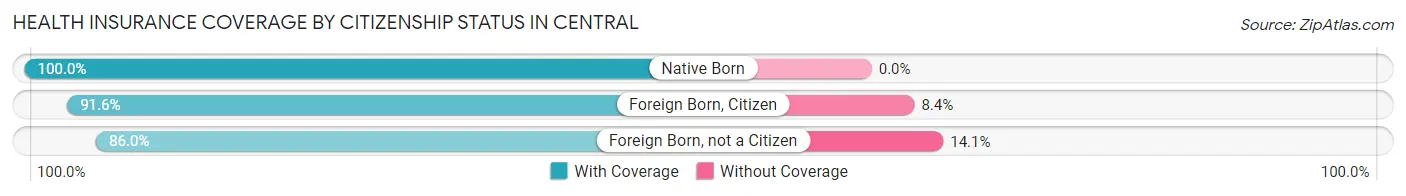
| Citizenship Status | With Coverage | Without Coverage |
| Native Born | 452 (100.0%) | 0 (0.0%) |
| Foreign Born, Citizen | 699 (91.6%) | 64 (8.4%) |
| Foreign Born, not a Citizen | 1,560 (86.0%) | 255 (14.1%) |
Health Insurance Coverage by Household Income in Central
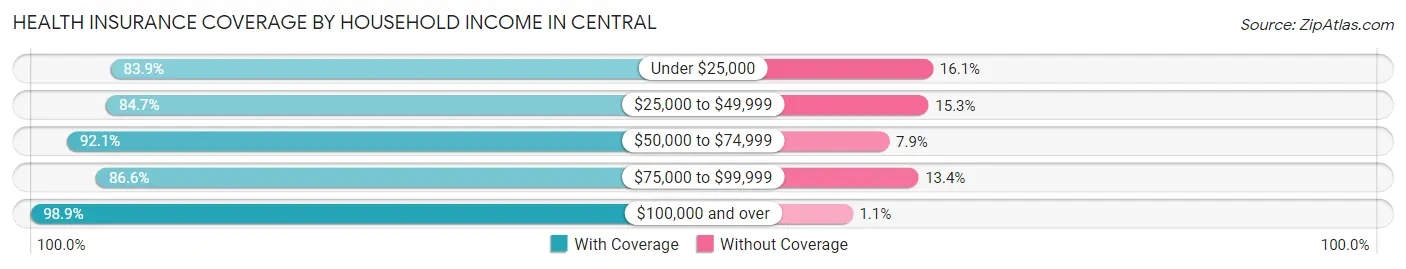
| Household Income | With Coverage | Without Coverage |
| Under $25,000 | 1,076 (83.9%) | 207 (16.1%) |
| $25,000 to $49,999 | 721 (84.7%) | 130 (15.3%) |
| $50,000 to $74,999 | 1,266 (92.1%) | 109 (7.9%) |
| $75,000 to $99,999 | 531 (86.6%) | 82 (13.4%) |
| $100,000 and over | 748 (98.9%) | 8 (1.1%) |
Public vs Private Health Insurance Coverage by Age in Central
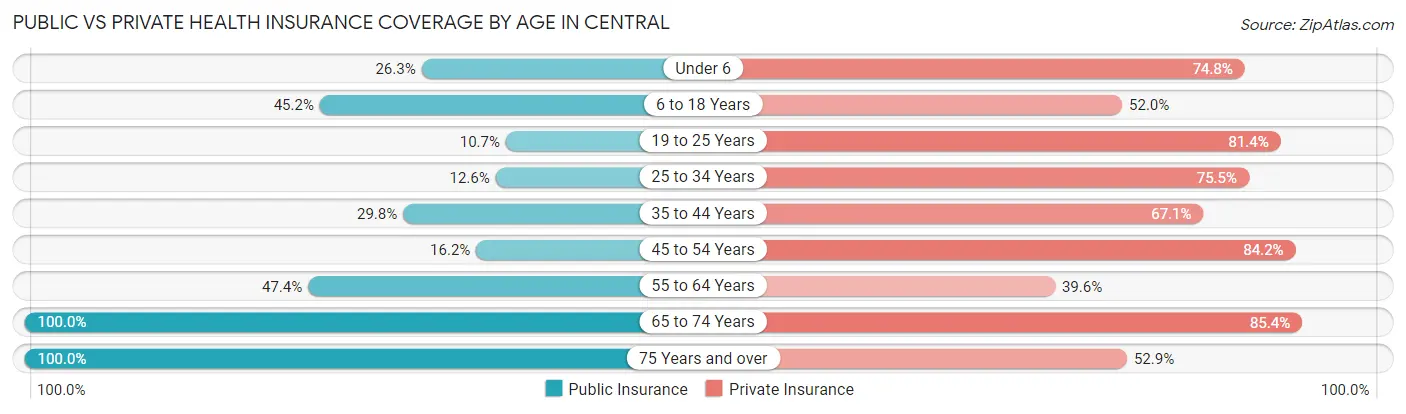
| Age Bracket | Public Insurance | Private Insurance |
| Under 6 | 119 (26.3%) | 338 (74.8%) |
| 6 to 18 Years | 345 (45.2%) | 397 (52.0%) |
| 19 to 25 Years | 194 (10.7%) | 1,478 (81.4%) |
| 25 to 34 Years | 87 (12.6%) | 522 (75.5%) |
| 35 to 44 Years | 133 (29.7%) | 300 (67.1%) |
| 45 to 54 Years | 84 (16.2%) | 437 (84.2%) |
| 55 to 64 Years | 109 (47.4%) | 91 (39.6%) |
| 65 to 74 Years | 185 (100.0%) | 158 (85.4%) |
| 75 Years and over | 153 (100.0%) | 81 (52.9%) |
| Total | 1,409 (26.8%) | 3,802 (72.4%) |
Disability Status by Sex by Age in Central
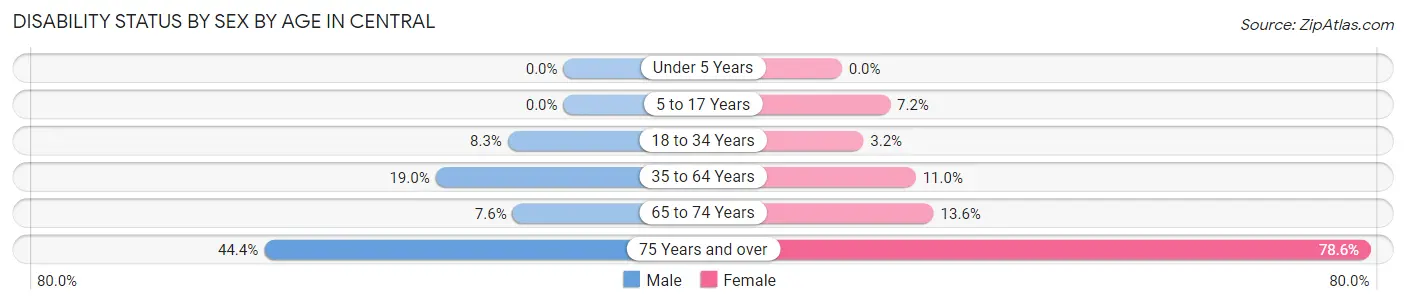
| Age Bracket | Male | Female |
| Under 5 Years | 0 (0.0%) | 0 (0.0%) |
| 5 to 17 Years | 0 (0.0%) | 22 (7.2%) |
| 18 to 34 Years | 110 (8.3%) | 47 (3.2%) |
| 35 to 64 Years | 113 (19.0%) | 66 (11.0%) |
| 65 to 74 Years | 4 (7.5%) | 18 (13.6%) |
| 75 Years and over | 12 (44.4%) | 99 (78.6%) |
Disability Class by Sex by Age in Central
Disability Class: Hearing Difficulty
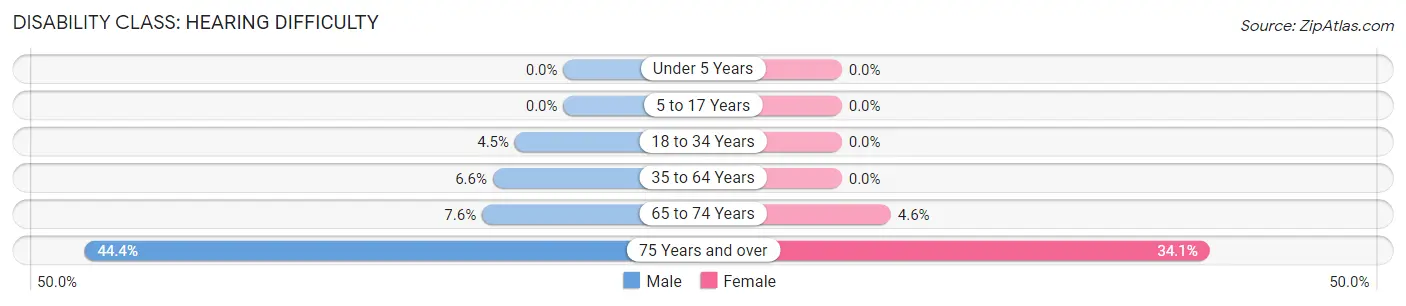
| Age Bracket | Male | Female |
| Under 5 Years | 0 (0.0%) | 0 (0.0%) |
| 5 to 17 Years | 0 (0.0%) | 0 (0.0%) |
| 18 to 34 Years | 60 (4.5%) | 0 (0.0%) |
| 35 to 64 Years | 39 (6.6%) | 0 (0.0%) |
| 65 to 74 Years | 4 (7.5%) | 6 (4.5%) |
| 75 Years and over | 12 (44.4%) | 43 (34.1%) |
Disability Class: Vision Difficulty
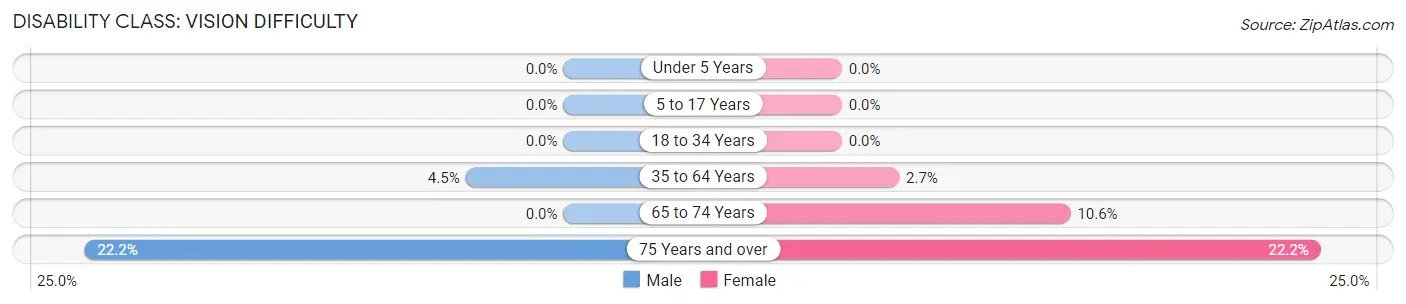
| Age Bracket | Male | Female |
| Under 5 Years | 0 (0.0%) | 0 (0.0%) |
| 5 to 17 Years | 0 (0.0%) | 0 (0.0%) |
| 18 to 34 Years | 0 (0.0%) | 0 (0.0%) |
| 35 to 64 Years | 27 (4.5%) | 16 (2.7%) |
| 65 to 74 Years | 0 (0.0%) | 14 (10.6%) |
| 75 Years and over | 6 (22.2%) | 28 (22.2%) |
Disability Class: Cognitive Difficulty
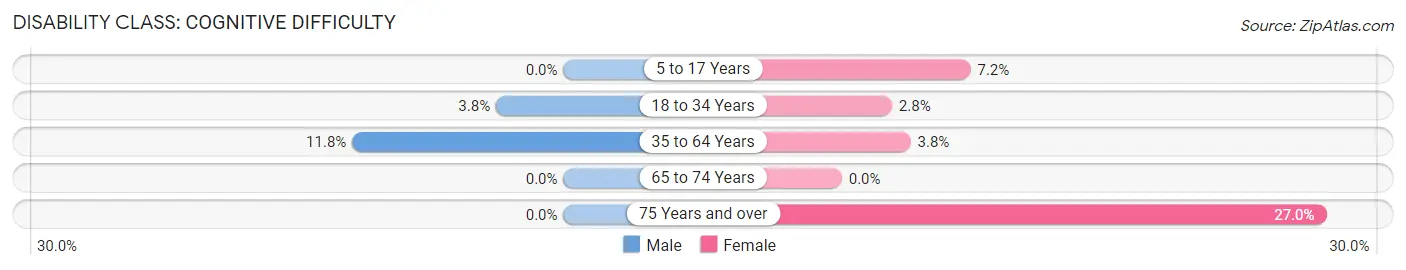
| Age Bracket | Male | Female |
| 5 to 17 Years | 0 (0.0%) | 22 (7.2%) |
| 18 to 34 Years | 50 (3.7%) | 41 (2.8%) |
| 35 to 64 Years | 70 (11.8%) | 23 (3.8%) |
| 65 to 74 Years | 0 (0.0%) | 0 (0.0%) |
| 75 Years and over | 0 (0.0%) | 34 (27.0%) |
Disability Class: Ambulatory Difficulty
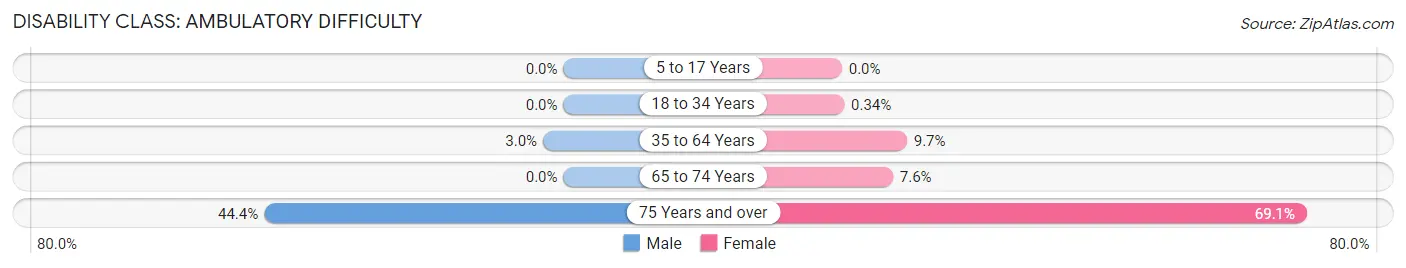
| Age Bracket | Male | Female |
| 5 to 17 Years | 0 (0.0%) | 0 (0.0%) |
| 18 to 34 Years | 0 (0.0%) | 5 (0.3%) |
| 35 to 64 Years | 18 (3.0%) | 58 (9.7%) |
| 65 to 74 Years | 0 (0.0%) | 10 (7.6%) |
| 75 Years and over | 12 (44.4%) | 87 (69.1%) |
Disability Class: Self-Care Difficulty
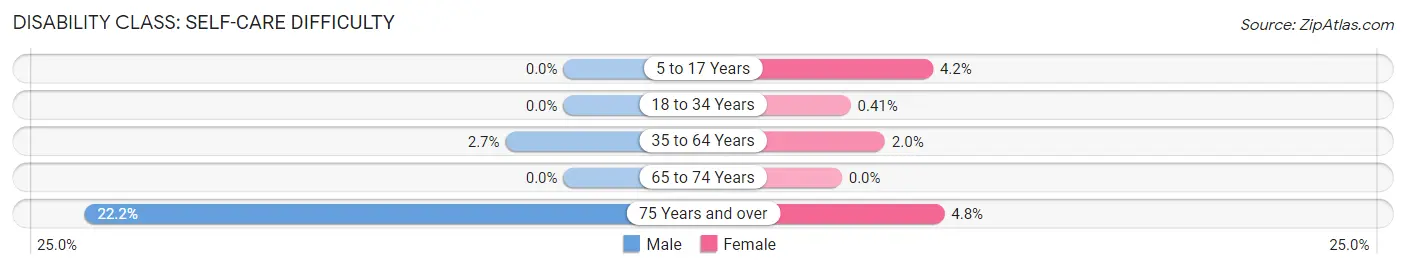
| Age Bracket | Male | Female |
| 5 to 17 Years | 0 (0.0%) | 13 (4.2%) |
| 18 to 34 Years | 0 (0.0%) | 6 (0.4%) |
| 35 to 64 Years | 16 (2.7%) | 12 (2.0%) |
| 65 to 74 Years | 0 (0.0%) | 0 (0.0%) |
| 75 Years and over | 6 (22.2%) | 6 (4.8%) |
Technology Access in Central
Computing Device Access in Central
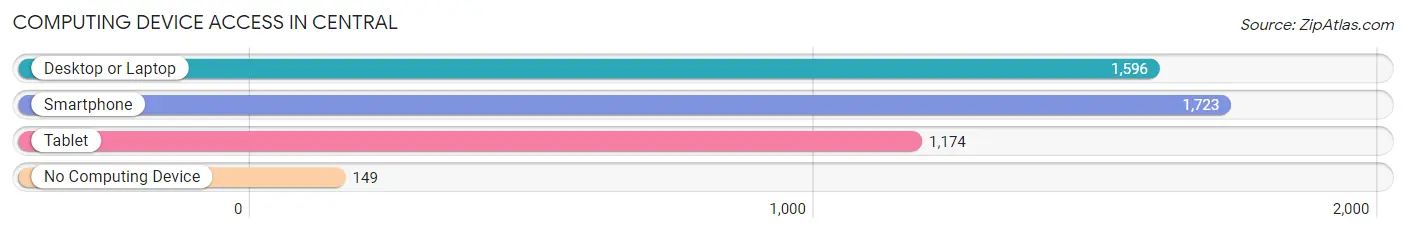
| Device Type | # Households | % Households |
| Desktop or Laptop | 1,596 | 84.6% |
| Smartphone | 1,723 | 91.4% |
| Tablet | 1,174 | 62.3% |
| No Computing Device | 149 | 7.9% |
| Total | 1,886 | 100.0% |
Internet Access in Central
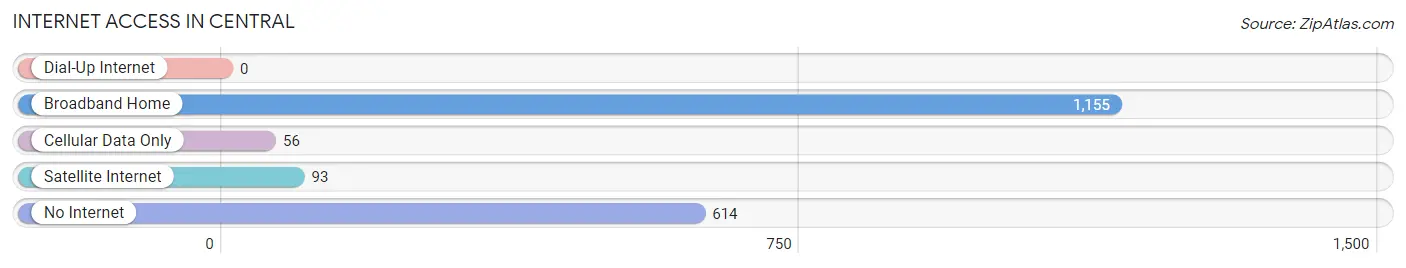
| Internet Type | # Households | % Households |
| Dial-Up Internet | 0 | 0.0% |
| Broadband Home | 1,155 | 61.2% |
| Cellular Data Only | 56 | 3.0% |
| Satellite Internet | 93 | 4.9% |
| No Internet | 614 | 32.6% |
| Total | 1,886 | 100.0% |
Central Summary
Central, South Carolina is a small town located in the Midlands region of the state. It is situated in the center of the state, approximately halfway between the capital city of Columbia and the city of Greenville. The town is located in the heart of the Piedmont region, which is characterized by rolling hills and lush forests. Central is home to a population of approximately 8,000 people, and is the county seat of Pickens County.
History
Central was founded in 1875 by the Central Land and Improvement Company, which was formed by a group of investors from the nearby city of Greenville. The town was named after the Central Railroad, which ran through the area and connected the town to the larger cities of the region. The railroad was instrumental in the development of the town, as it allowed for the transportation of goods and services to and from the area.
In the early 1900s, Central experienced a period of growth and prosperity. The town was home to several cotton mills, which provided employment for many of the town’s residents. The town also had a thriving business district, which included a variety of stores and businesses.
Geography
Central is located in the Piedmont region of South Carolina, which is characterized by rolling hills and lush forests. The town is situated in the center of the state, approximately halfway between the capital city of Columbia and the city of Greenville. The town is located in Pickens County, and is bordered by the cities of Easley, Liberty, and Six Mile.
The town is situated at an elevation of 845 feet above sea level, and is located at the intersection of two major highways, US-123 and US-178. The town is located approximately 30 miles from the Blue Ridge Mountains, and is situated near several lakes, including Lake Hartwell and Lake Keowee.
Economy
Central’s economy is largely based on the manufacturing and service industries. The town is home to several manufacturing plants, including a paper mill, a textile mill, and a plastics plant. The town is also home to several retail stores, restaurants, and other businesses.
The town is also home to several educational institutions, including Tri-County Technical College and Clemson University. The town is also home to several medical facilities, including a hospital and several clinics.
Demographics
As of the 2010 census, Central had a population of 8,000 people. The town is predominantly white, with approximately 75% of the population identifying as white. The town is also home to a small African American population, with approximately 15% of the population identifying as African American. The town is also home to a small Hispanic population, with approximately 5% of the population identifying as Hispanic.
The median household income in Central is approximately $45,000, and the median home value is approximately $150,000. The town has a low unemployment rate, with approximately 4% of the population unemployed. The town also has a low crime rate, with approximately 1,000 crimes reported in the town each year.
Common Questions
What is Per Capita Income in Central?
Per Capita income in Central is $19,889.
What is the Median Family Income in Central?
Median Family Income in Central is $59,337.
What is the Median Household income in Central?
Median Household Income in Central is $45,909.
What is Inequality or Gini Index in Central?
Inequality or Gini Index in Central is 0.46.
What is the Total Population of Central?
Total Population of Central is 5,272.
What is the Total Male Population of Central?
Total Male Population of Central is 2,339.
What is the Total Female Population of Central?
Total Female Population of Central is 2,933.
What is the Ratio of Males per 100 Females in Central?
There are 79.75 Males per 100 Females in Central.
What is the Ratio of Females per 100 Males in Central?
There are 125.40 Females per 100 Males in Central.
What is the Median Population Age in Central?
Median Population Age in Central is 21.6 Years.
What is the Average Family Size in Central
Average Family Size in Central is 3.4 People.
What is the Average Household Size in Central
Average Household Size in Central is 2.6 People.
How Large is the Labor Force in Central?
There are 2,457 People in the Labor Forcein in Central.
What is the Percentage of People in the Labor Force in Central?
54.7% of People are in the Labor Force in Central.
What is the Unemployment Rate in Central?
Unemployment Rate in Central is 4.5%.