Sellers, SC Map & Demographics
Sellers Map
Sellers Overview
$13,838
PER CAPITA INCOME
$31,667
AVG HOUSEHOLD INCOME
0.36
INEQUALITY / GINI INDEX
133
TOTAL POPULATION
94
MALE POPULATION
39
FEMALE POPULATION
241.03
MALES / 100 FEMALES
41.49
FEMALES / 100 MALES
42.6
MEDIAN AGE
3.0
AVG FAMILY SIZE
2.6
AVG HOUSEHOLD SIZE
36
LABOR FORCE [ PEOPLE ]
32.7%
PERCENT IN LABOR FORCE
Sellers Zip Codes
Sellers Area Codes
Income in Sellers
Income Overview in Sellers
| Characteristic | Number | Measure |
| Per Capita Income | 133 | $13,838 |
| Median Family Income | 33 | $0 |
| Mean Family Income | 33 | $23,127 |
| Median Household Income | 52 | $31,667 |
| Mean Household Income | 52 | $34,075 |
| Income Deficit | 33 | $0 |
| Wage / Income Gap (%) | 133 | 0.00% |
| Wage / Income Gap ($) | 133 | 100.00¢ per $1 |
| Gini / Inequality Index | 133 | 0.36 |
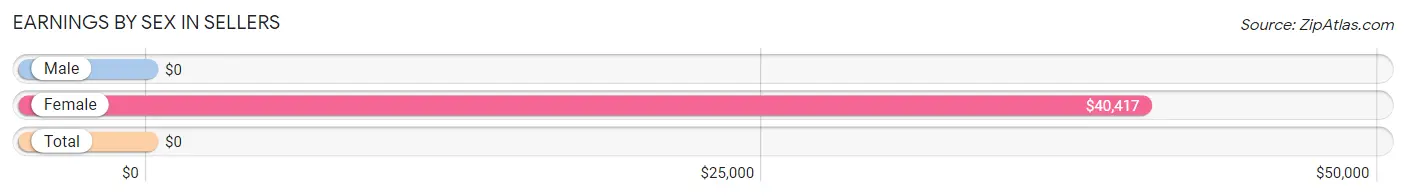
Earnings by Sex in Sellers
| Sex | Number | Average Earnings |
| Male | 44 (81.5%) | $0 |
| Female | 10 (18.5%) | $40,417 |
| Total | 54 (100.0%) | $0 |
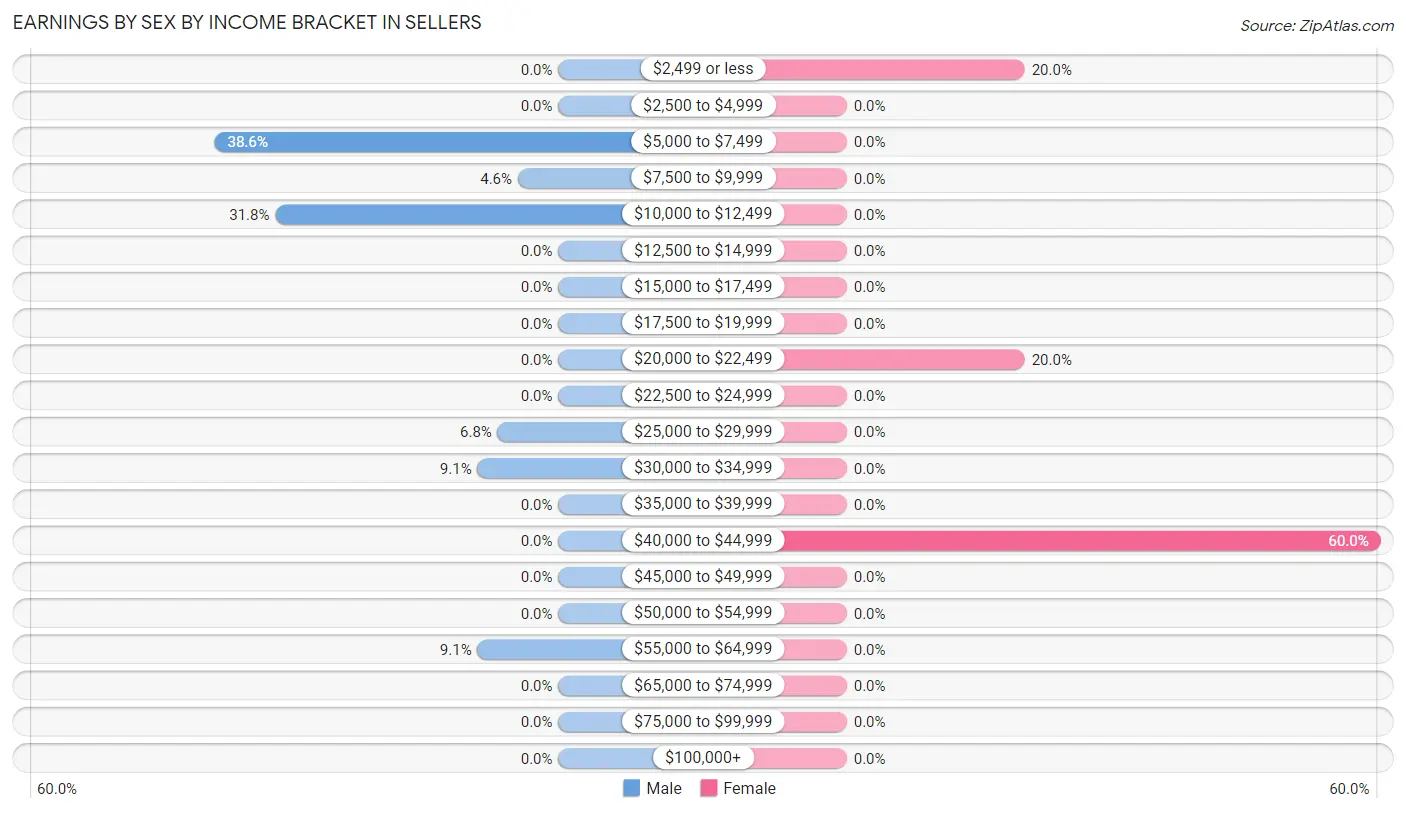
Earnings by Sex by Income Bracket in Sellers
The most common earnings brackets in Sellers are $5,000 to $7,499 for men (17 | 38.6%) and $40,000 to $44,999 for women (6 | 60.0%).
| Income | Male | Female |
| $2,499 or less | 0 (0.0%) | 2 (20.0%) |
| $2,500 to $4,999 | 0 (0.0%) | 0 (0.0%) |
| $5,000 to $7,499 | 17 (38.6%) | 0 (0.0%) |
| $7,500 to $9,999 | 2 (4.5%) | 0 (0.0%) |
| $10,000 to $12,499 | 14 (31.8%) | 0 (0.0%) |
| $12,500 to $14,999 | 0 (0.0%) | 0 (0.0%) |
| $15,000 to $17,499 | 0 (0.0%) | 0 (0.0%) |
| $17,500 to $19,999 | 0 (0.0%) | 0 (0.0%) |
| $20,000 to $22,499 | 0 (0.0%) | 2 (20.0%) |
| $22,500 to $24,999 | 0 (0.0%) | 0 (0.0%) |
| $25,000 to $29,999 | 3 (6.8%) | 0 (0.0%) |
| $30,000 to $34,999 | 4 (9.1%) | 0 (0.0%) |
| $35,000 to $39,999 | 0 (0.0%) | 0 (0.0%) |
| $40,000 to $44,999 | 0 (0.0%) | 6 (60.0%) |
| $45,000 to $49,999 | 0 (0.0%) | 0 (0.0%) |
| $50,000 to $54,999 | 0 (0.0%) | 0 (0.0%) |
| $55,000 to $64,999 | 4 (9.1%) | 0 (0.0%) |
| $65,000 to $74,999 | 0 (0.0%) | 0 (0.0%) |
| $75,000 to $99,999 | 0 (0.0%) | 0 (0.0%) |
| $100,000+ | 0 (0.0%) | 0 (0.0%) |
| Total | 44 (100.0%) | 10 (100.0%) |
Earnings by Sex by Educational Attainment in Sellers
| Educational Attainment | Male Income | Female Income |
| Less than High School | - | - |
| High School Diploma | - | - |
| College or Associate's Degree | - | - |
| Bachelor's Degree | - | - |
| Graduate Degree | - | - |
| Total | - | - |
Family Income in Sellers
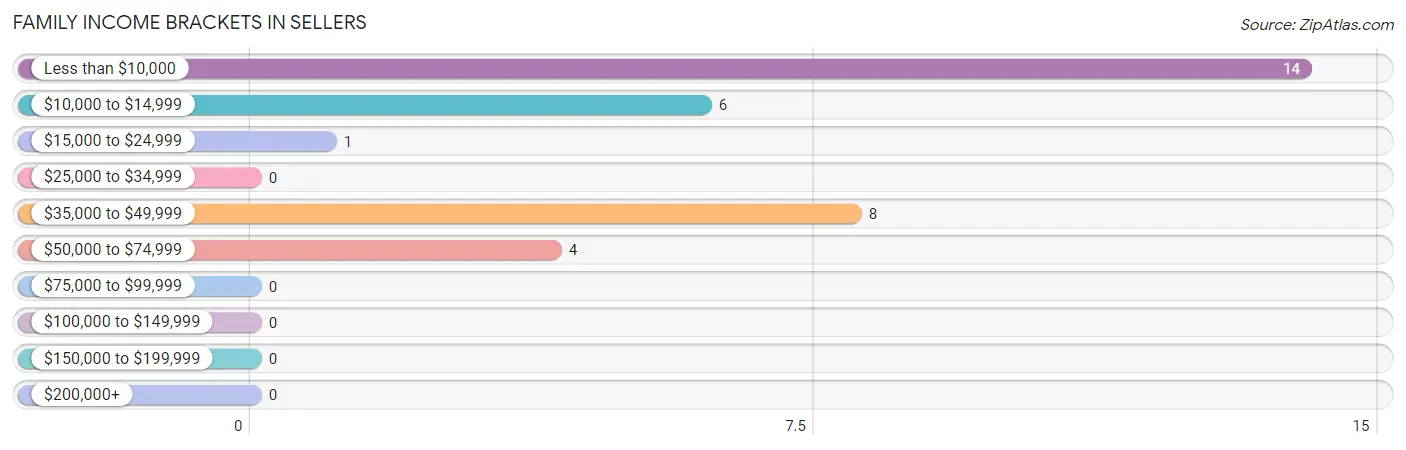
Family Income Brackets in Sellers
According to the Sellers family income data, there are 14 families falling into the less than $10,000 income range, which is the most common income bracket and makes up 42.4% of all families.
| Income Bracket | # Families | % Families |
| Less than $10,000 | 14 | 42.4% |
| $10,000 to $14,999 | 6 | 18.2% |
| $15,000 to $24,999 | 1 | 3.0% |
| $25,000 to $34,999 | 0 | 0.0% |
| $35,000 to $49,999 | 8 | 24.2% |
| $50,000 to $74,999 | 4 | 12.1% |
| $75,000 to $99,999 | 0 | 0.0% |
| $100,000 to $149,999 | 0 | 0.0% |
| $150,000 to $199,999 | 0 | 0.0% |
| $200,000+ | 0 | 0.0% |
Family Income by Famaliy Size in Sellers
| Income Bracket | # Families | Median Income |
| 2-Person Families | 30 (90.9%) | $0 |
| 3-Person Families | 0 (0.0%) | $0 |
| 4-Person Families | 1 (3.0%) | $0 |
| 5-Person Families | 0 (0.0%) | $0 |
| 6-Person Families | 0 (0.0%) | $0 |
| 7+ Person Families | 2 (6.1%) | $0 |
| Total | 33 (100.0%) | $0 |
Family Income by Number of Earners in Sellers
| Number of Earners | # Families | Median Income |
| No Earners | 9 (27.3%) | $0 |
| 1 Earner | 21 (63.6%) | $0 |
| 2 Earners | 3 (9.1%) | $0 |
| 3+ Earners | 0 (0.0%) | $0 |
| Total | 33 (100.0%) | $0 |
Household Income in Sellers
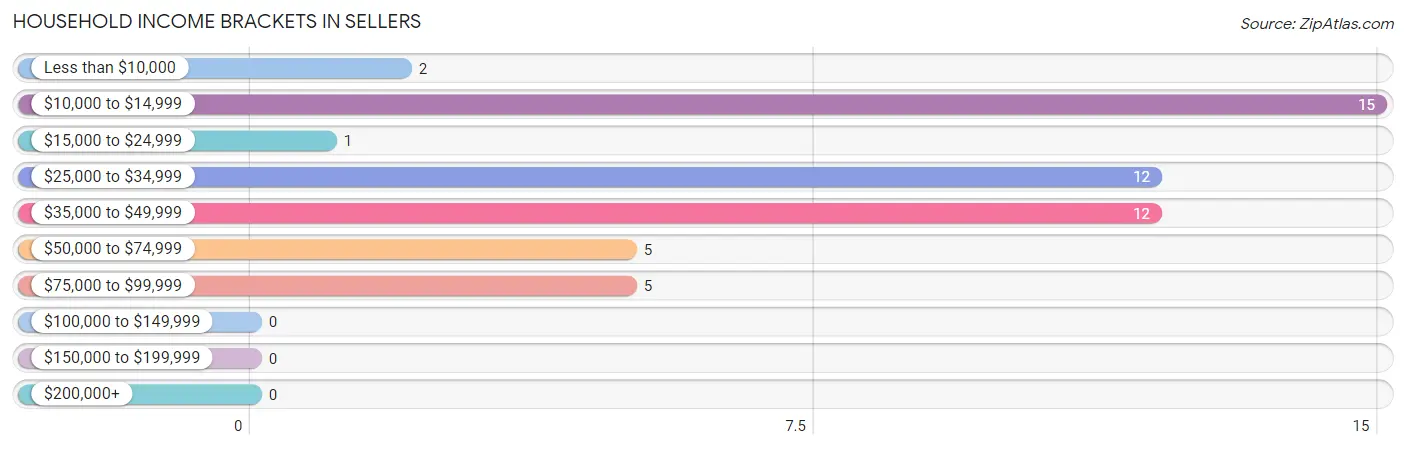
Household Income Brackets in Sellers
With 15 households falling in the category, the $10,000 to $14,999 income range is the most frequent in Sellers, accounting for 28.8% of all households.
| Income Bracket | # Households | % Households |
| Less than $10,000 | 2 | 3.8% |
| $10,000 to $14,999 | 15 | 28.8% |
| $15,000 to $24,999 | 1 | 1.9% |
| $25,000 to $34,999 | 12 | 23.1% |
| $35,000 to $49,999 | 12 | 23.1% |
| $50,000 to $74,999 | 5 | 9.6% |
| $75,000 to $99,999 | 5 | 9.6% |
| $100,000 to $149,999 | 0 | 0.0% |
| $150,000 to $199,999 | 0 | 0.0% |
| $200,000+ | 0 | 0.0% |
Household Income by Householder Age in Sellers
The median household income in Sellers is $31,667, with the highest median household income of $32,396 found in the 25 to 44 years age bracket for the primary householder. A total of 27 households (51.9%) fall into this category.
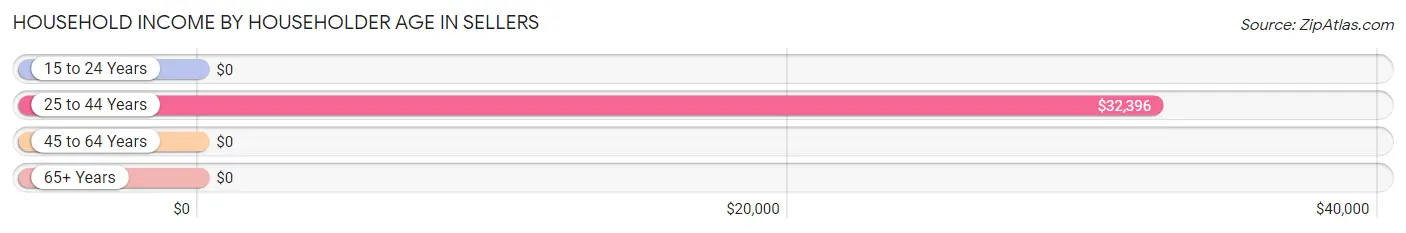
| Income Bracket | # Households | Median Income |
| 15 to 24 Years | 0 (0.0%) | $0 |
| 25 to 44 Years | 27 (51.9%) | $32,396 |
| 45 to 64 Years | 3 (5.8%) | $0 |
| 65+ Years | 22 (42.3%) | $0 |
| Total | 52 (100.0%) | $31,667 |
Poverty in Sellers
Income Below Poverty by Sex and Age in Sellers
With 58.5% poverty level for males and 69.2% for females among the residents of Sellers, 6 to 11 year old males and 6 to 11 year old females are the most vulnerable to poverty, with 5 males (100.0%) and 5 females (100.0%) in their respective age groups living below the poverty level.
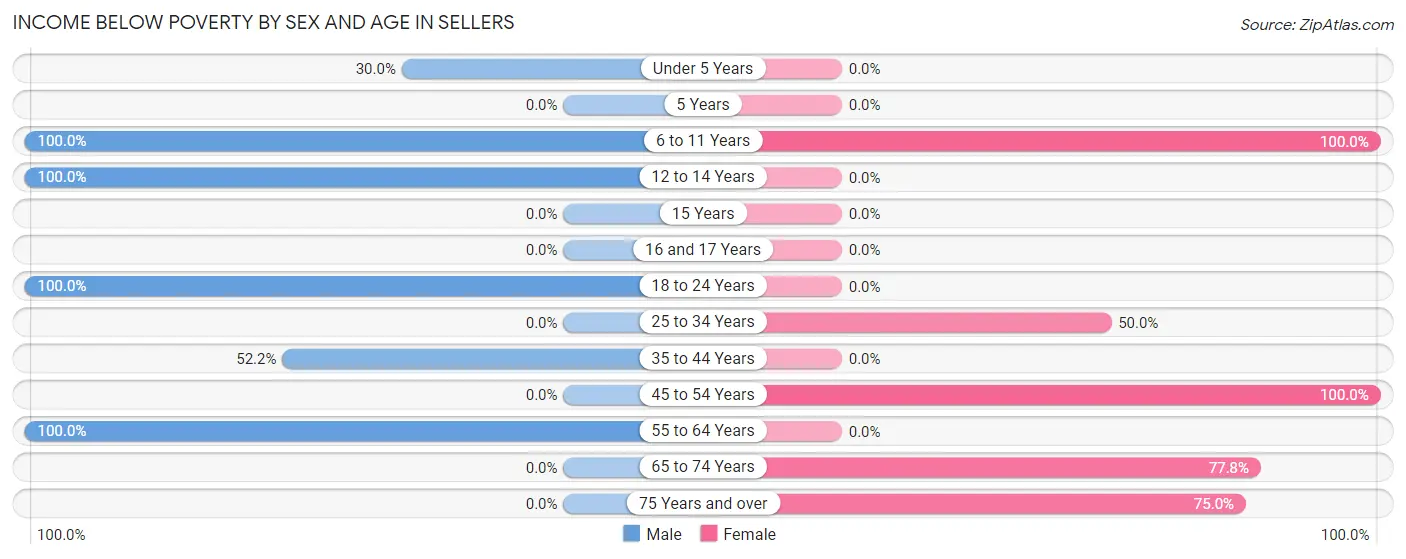
| Age Bracket | Male | Female |
| Under 5 Years | 3 (30.0%) | 0 (0.0%) |
| 5 Years | 0 (0.0%) | 0 (0.0%) |
| 6 to 11 Years | 5 (100.0%) | 5 (100.0%) |
| 12 to 14 Years | 3 (100.0%) | 0 (0.0%) |
| 15 Years | 0 (0.0%) | 0 (0.0%) |
| 16 and 17 Years | 0 (0.0%) | 0 (0.0%) |
| 18 to 24 Years | 19 (100.0%) | 0 (0.0%) |
| 25 to 34 Years | 0 (0.0%) | 2 (50.0%) |
| 35 to 44 Years | 12 (52.2%) | 0 (0.0%) |
| 45 to 54 Years | 0 (0.0%) | 7 (100.0%) |
| 55 to 64 Years | 13 (100.0%) | 0 (0.0%) |
| 65 to 74 Years | 0 (0.0%) | 7 (77.8%) |
| 75 Years and over | 0 (0.0%) | 6 (75.0%) |
| Total | 55 (58.5%) | 27 (69.2%) |
Income Above Poverty by Sex and Age in Sellers
According to the poverty statistics in Sellers, males aged 65 to 74 years and females aged 35 to 44 years are the age groups that are most secure financially, with 100.0% of males and 100.0% of females in these age groups living above the poverty line.
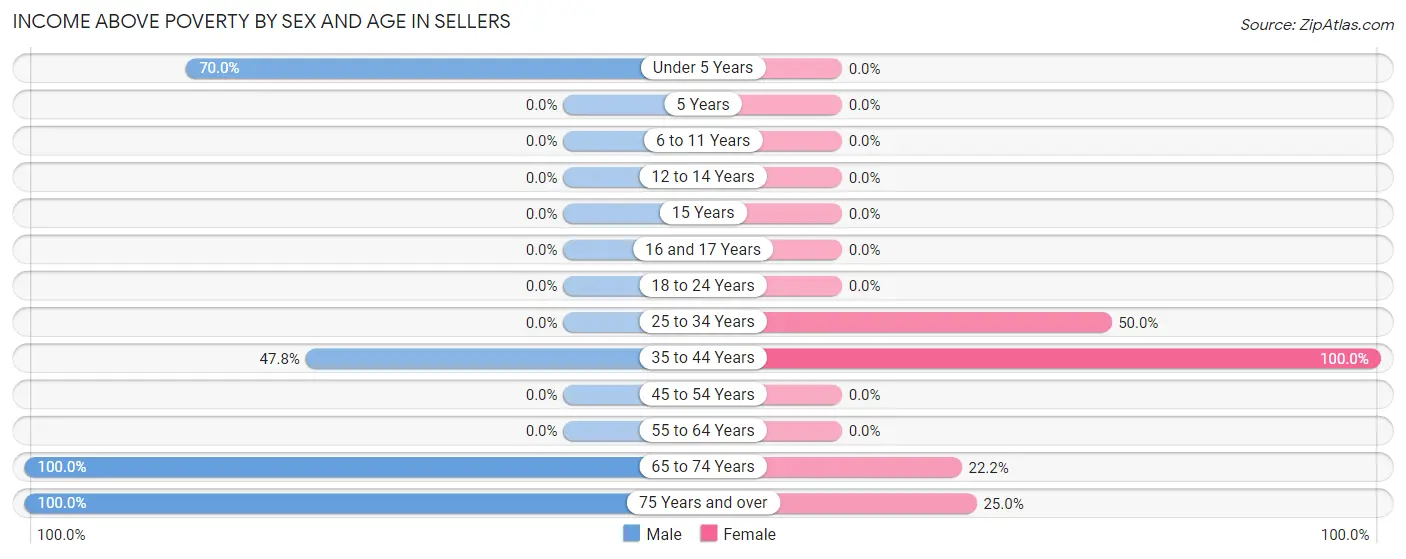
| Age Bracket | Male | Female |
| Under 5 Years | 7 (70.0%) | 0 (0.0%) |
| 5 Years | 0 (0.0%) | 0 (0.0%) |
| 6 to 11 Years | 0 (0.0%) | 0 (0.0%) |
| 12 to 14 Years | 0 (0.0%) | 0 (0.0%) |
| 15 Years | 0 (0.0%) | 0 (0.0%) |
| 16 and 17 Years | 0 (0.0%) | 0 (0.0%) |
| 18 to 24 Years | 0 (0.0%) | 0 (0.0%) |
| 25 to 34 Years | 0 (0.0%) | 2 (50.0%) |
| 35 to 44 Years | 11 (47.8%) | 6 (100.0%) |
| 45 to 54 Years | 0 (0.0%) | 0 (0.0%) |
| 55 to 64 Years | 0 (0.0%) | 0 (0.0%) |
| 65 to 74 Years | 4 (100.0%) | 2 (22.2%) |
| 75 Years and over | 17 (100.0%) | 2 (25.0%) |
| Total | 39 (41.5%) | 12 (30.8%) |
Income Below Poverty Among Married-Couple Families in Sellers
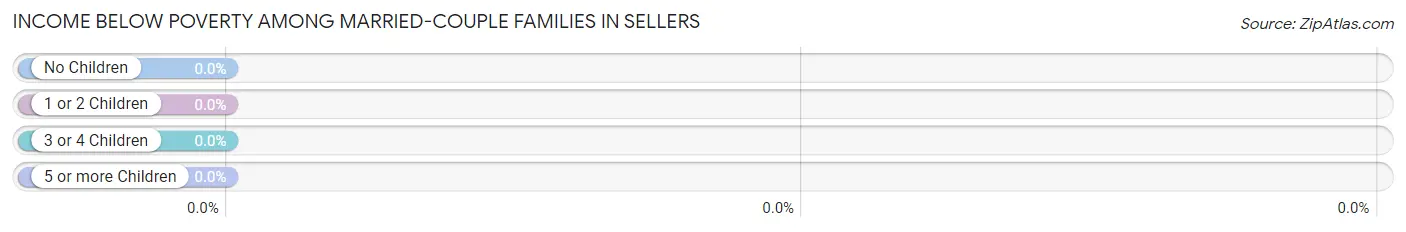
| Children | Above Poverty | Below Poverty |
| No Children | 3 (100.0%) | 0 (0.0%) |
| 1 or 2 Children | 0 (0.0%) | 0 (0.0%) |
| 3 or 4 Children | 0 (0.0%) | 0 (0.0%) |
| 5 or more Children | 0 (0.0%) | 0 (0.0%) |
| Total | 3 (100.0%) | 0 (0.0%) |
Income Below Poverty Among Single-Parent Households in Sellers
According to the poverty data in Sellers, 80.0% or 12 single-father households and 60.0% or 9 single-mother households are living below the poverty line. Among single-father households, those with no children have the highest poverty rate, with 12 households (80.0%) experiencing poverty. Likewise, among single-mother households, those with no children have the highest poverty rate, with 6 households (100.0%) falling below the poverty line.
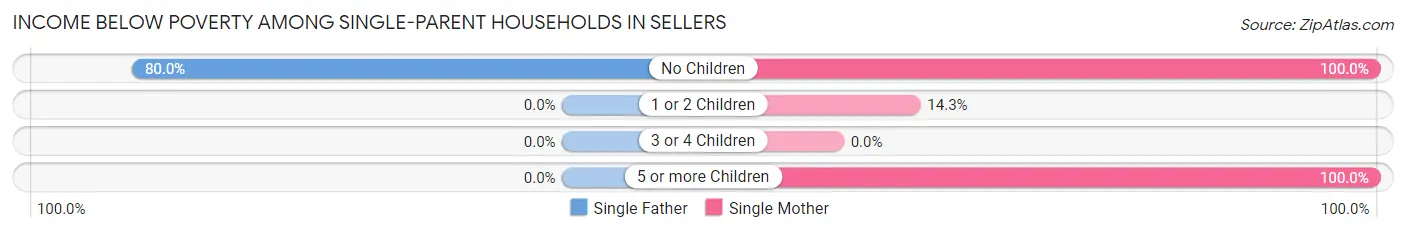
| Children | Single Father | Single Mother |
| No Children | 12 (80.0%) | 6 (100.0%) |
| 1 or 2 Children | 0 (0.0%) | 1 (14.3%) |
| 3 or 4 Children | 0 (0.0%) | 0 (0.0%) |
| 5 or more Children | 0 (0.0%) | 2 (100.0%) |
| Total | 12 (80.0%) | 9 (60.0%) |
Income Below Poverty Among Married-Couple vs Single-Parent Households in Sellers
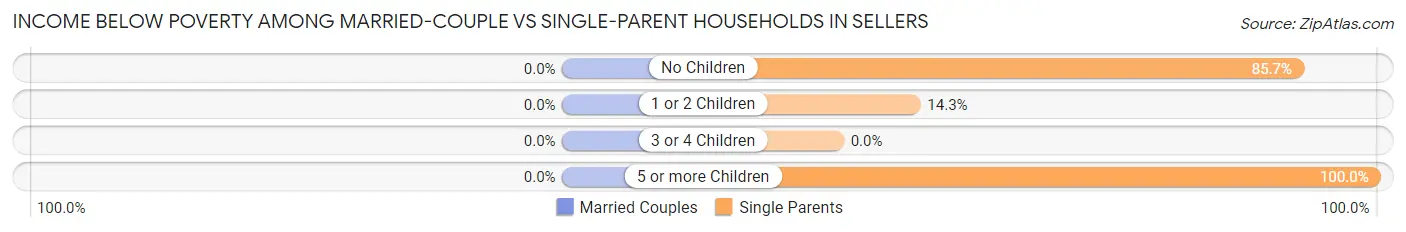
| Children | Married-Couple Families | Single-Parent Households |
| No Children | 0 (0.0%) | 18 (85.7%) |
| 1 or 2 Children | 0 (0.0%) | 1 (14.3%) |
| 3 or 4 Children | 0 (0.0%) | 0 (0.0%) |
| 5 or more Children | 0 (0.0%) | 2 (100.0%) |
| Total | 0 (0.0%) | 21 (70.0%) |
Race in Sellers
The most populous races in Sellers are Black / African American (101 | 75.9%), White / Caucasian (15 | 11.3%), and Two or more Races (14 | 10.5%).
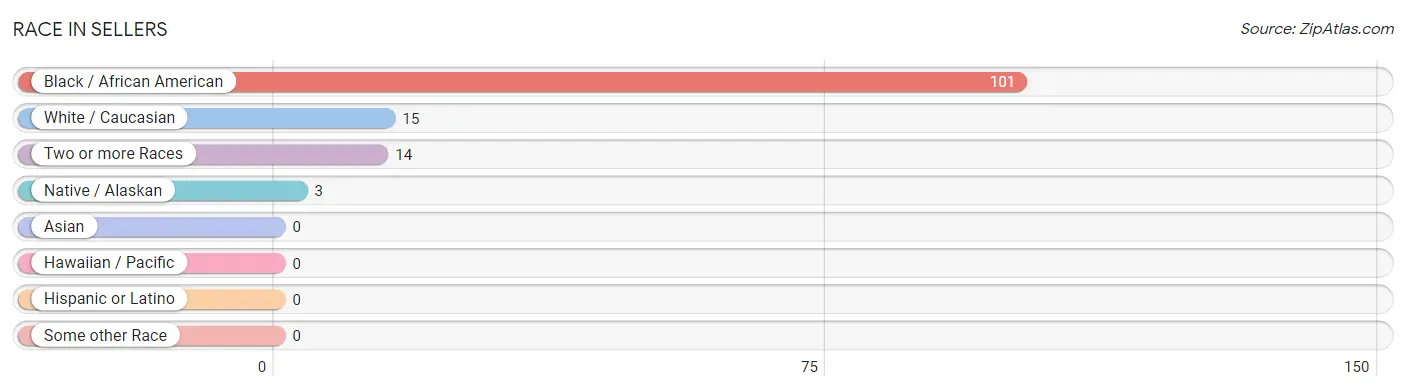
| Race | # Population | % Population |
| Asian | 0 | 0.0% |
| Black / African American | 101 | 75.9% |
| Hawaiian / Pacific | 0 | 0.0% |
| Hispanic or Latino | 0 | 0.0% |
| Native / Alaskan | 3 | 2.3% |
| White / Caucasian | 15 | 11.3% |
| Two or more Races | 14 | 10.5% |
| Some other Race | 0 | 0.0% |
| Total | 133 | 100.0% |
Ancestry in Sellers
The most populous ancestries reported in Sellers are English (22 | 16.5%), American (20 | 15.0%), African (3 | 2.3%), and Subsaharan African (3 | 2.3%), together accounting for 36.1% of all Sellers residents.
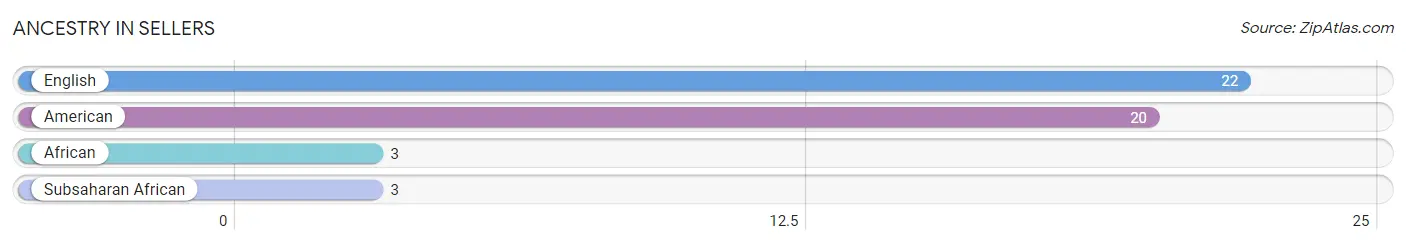
| Ancestry | # Population | % Population |
| African | 3 | 2.3% |
| American | 20 | 15.0% |
| English | 22 | 16.5% |
| Subsaharan African | 3 | 2.3% | View All 4 Rows |
Immigrants in Sellers

| Immigration Origin | # Population | % Population | View All 0 Rows |
Sex and Age in Sellers
Sex and Age in Sellers
The most populous age groups in Sellers are 40 to 44 Years (23 | 24.5%) for men and 50 to 54 Years (7 | 17.9%) for women.
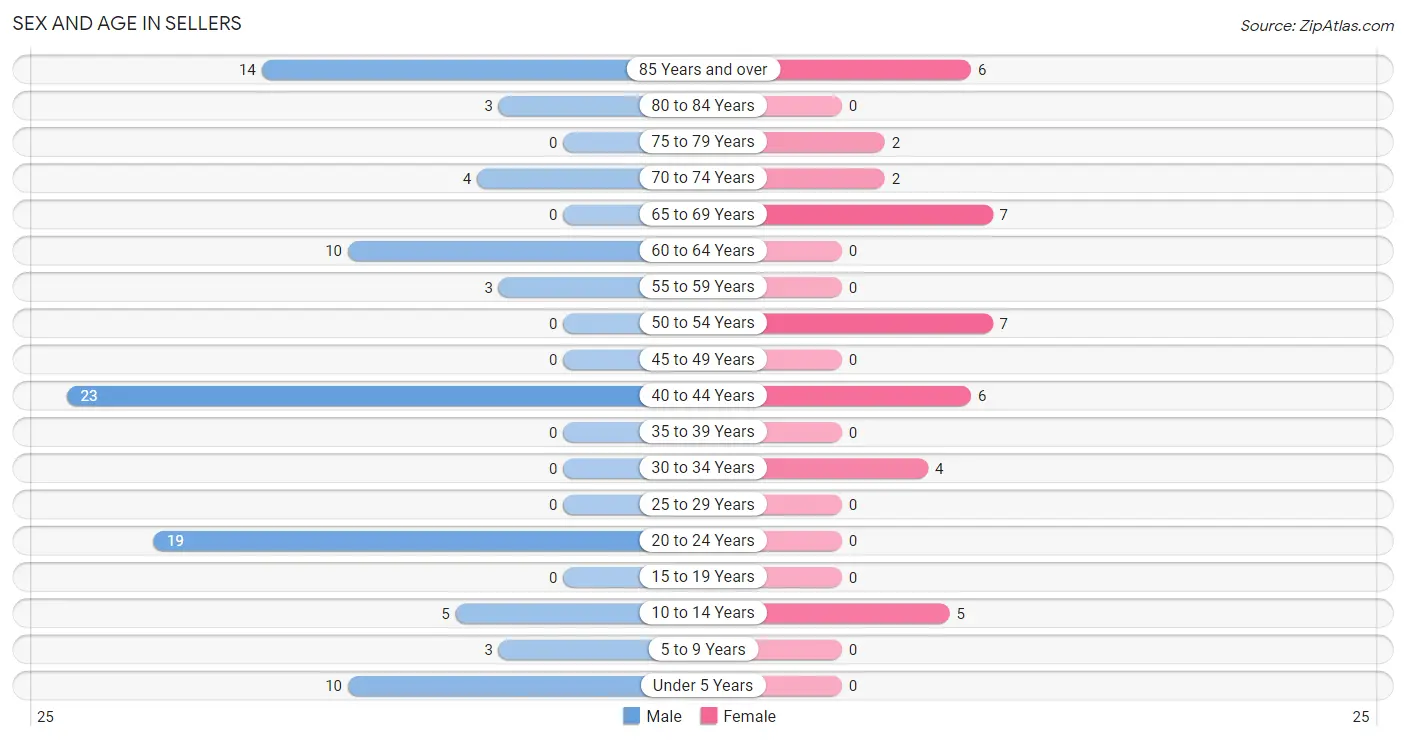
| Age Bracket | Male | Female |
| Under 5 Years | 10 (10.6%) | 0 (0.0%) |
| 5 to 9 Years | 3 (3.2%) | 0 (0.0%) |
| 10 to 14 Years | 5 (5.3%) | 5 (12.8%) |
| 15 to 19 Years | 0 (0.0%) | 0 (0.0%) |
| 20 to 24 Years | 19 (20.2%) | 0 (0.0%) |
| 25 to 29 Years | 0 (0.0%) | 0 (0.0%) |
| 30 to 34 Years | 0 (0.0%) | 4 (10.3%) |
| 35 to 39 Years | 0 (0.0%) | 0 (0.0%) |
| 40 to 44 Years | 23 (24.5%) | 6 (15.4%) |
| 45 to 49 Years | 0 (0.0%) | 0 (0.0%) |
| 50 to 54 Years | 0 (0.0%) | 7 (17.9%) |
| 55 to 59 Years | 3 (3.2%) | 0 (0.0%) |
| 60 to 64 Years | 10 (10.6%) | 0 (0.0%) |
| 65 to 69 Years | 0 (0.0%) | 7 (17.9%) |
| 70 to 74 Years | 4 (4.3%) | 2 (5.1%) |
| 75 to 79 Years | 0 (0.0%) | 2 (5.1%) |
| 80 to 84 Years | 3 (3.2%) | 0 (0.0%) |
| 85 Years and over | 14 (14.9%) | 6 (15.4%) |
| Total | 94 (100.0%) | 39 (100.0%) |
Families and Households in Sellers
Median Family Size in Sellers
The median family size in Sellers is 2.97 persons per family, with single female/mother families (15 | 45.5%) accounting for the largest median family size of 3.8 persons per family. On the other hand, married-couple families (3 | 9.1%) represent the smallest median family size with 1.67 persons per family.
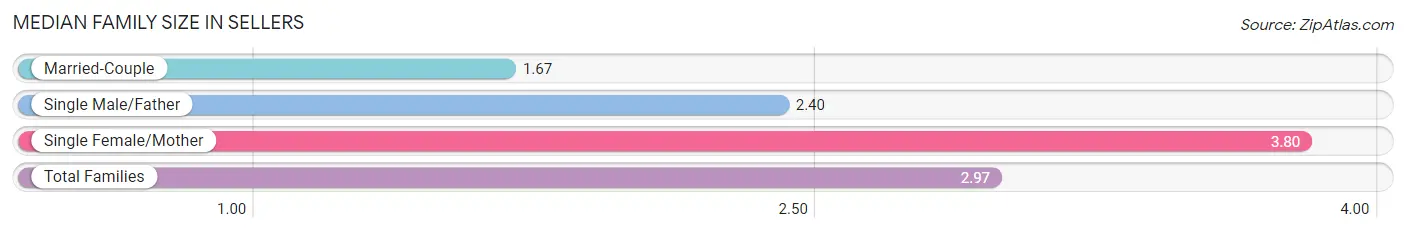
| Family Type | # Families | Family Size |
| Married-Couple | 3 (9.1%) | 1.67 |
| Single Male/Father | 15 (45.5%) | 2.40 |
| Single Female/Mother | 15 (45.5%) | 3.80 |
| Total Families | 33 (100.0%) | 2.97 |
Median Household Size in Sellers
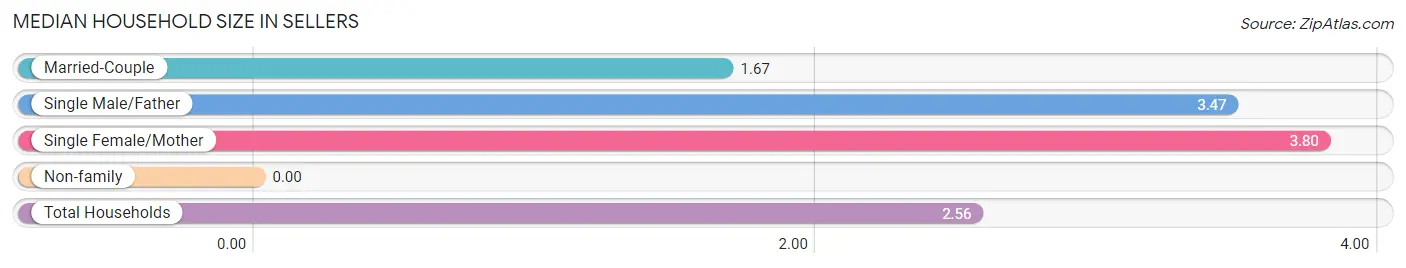
| Household Type | # Households | Household Size |
| Married-Couple | 3 (5.8%) | 1.67 |
| Single Male/Father | 15 (28.8%) | 3.47 |
| Single Female/Mother | 15 (28.8%) | 3.80 |
| Non-family | 19 (36.5%) | - |
| Total Households | 52 (100.0%) | 2.56 |
Household Size by Marriage Status in Sellers
Out of a total of 52 households in Sellers, 33 (63.5%) are family households, while 19 (36.5%) are nonfamily households. The most numerous type of family households are 2-person households, comprising 15, and the most common type of nonfamily households are 1-person households, comprising 19.
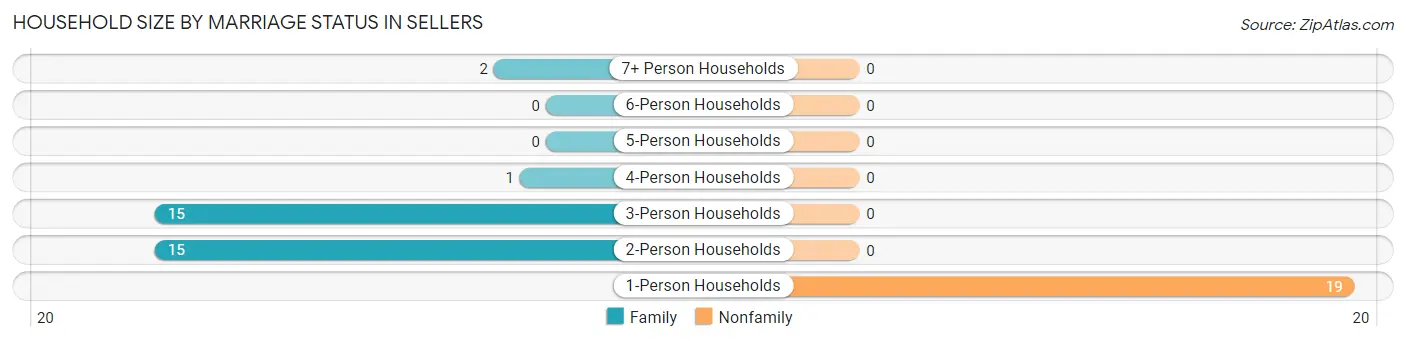
| Household Size | Family Households | Nonfamily Households |
| 1-Person Households | - | 19 (36.5%) |
| 2-Person Households | 15 (28.8%) | 0 (0.0%) |
| 3-Person Households | 15 (28.8%) | 0 (0.0%) |
| 4-Person Households | 1 (1.9%) | 0 (0.0%) |
| 5-Person Households | 0 (0.0%) | 0 (0.0%) |
| 6-Person Households | 0 (0.0%) | 0 (0.0%) |
| 7+ Person Households | 2 (3.8%) | 0 (0.0%) |
| Total | 33 (63.5%) | 19 (36.5%) |
Female Fertility in Sellers
Fertility by Age in Sellers
| Age Bracket | Women with Births | Births / 1,000 Women |
| 15 to 19 years | 0 (0.0%) | 0.0 |
| 20 to 34 years | 0 (0.0%) | 0.0 |
| 35 to 50 years | 0 (0.0%) | 0.0 |
| Total | 0 (0.0%) | 0.0 |
Fertility by Age by Marriage Status in Sellers
| Age Bracket | Married | Unmarried |
| 15 to 19 years | 0 (0.0%) | 0 (0.0%) |
| 20 to 34 years | 0 (0.0%) | 0 (0.0%) |
| 35 to 50 years | 0 (0.0%) | 0 (0.0%) |
| Total | 0 (0.0%) | 0 (0.0%) |
Fertility by Education in Sellers
| Educational Attainment | Women with Births | Births / 1,000 Women |
| Less than High School | 0 (0.0%) | 0.0 |
| High School Diploma | 0 (0.0%) | 0.0 |
| College or Associate's Degree | 0 (0.0%) | 0.0 |
| Bachelor's Degree | 0 (0.0%) | 0.0 |
| Graduate Degree | 0 (0.0%) | 0.0 |
| Total | 0 (0.0%) | 0.0 |
Fertility by Education by Marriage Status in Sellers
| Educational Attainment | Married | Unmarried |
| Less than High School | 0 (0.0%) | 0 (0.0%) |
| High School Diploma | 0 (0.0%) | 0 (0.0%) |
| College or Associate's Degree | 0 (0.0%) | 0 (0.0%) |
| Bachelor's Degree | 0 (0.0%) | 0 (0.0%) |
| Graduate Degree | 0 (0.0%) | 0 (0.0%) |
| Total | 0 (0.0%) | 0 (0.0%) |
Employment Characteristics in Sellers
Employment by Class of Employer in Sellers
Among the 34 employed individuals in Sellers, private company employees (28 | 82.4%), and state government employees (6 | 17.6%) make up the most common classes of employment.
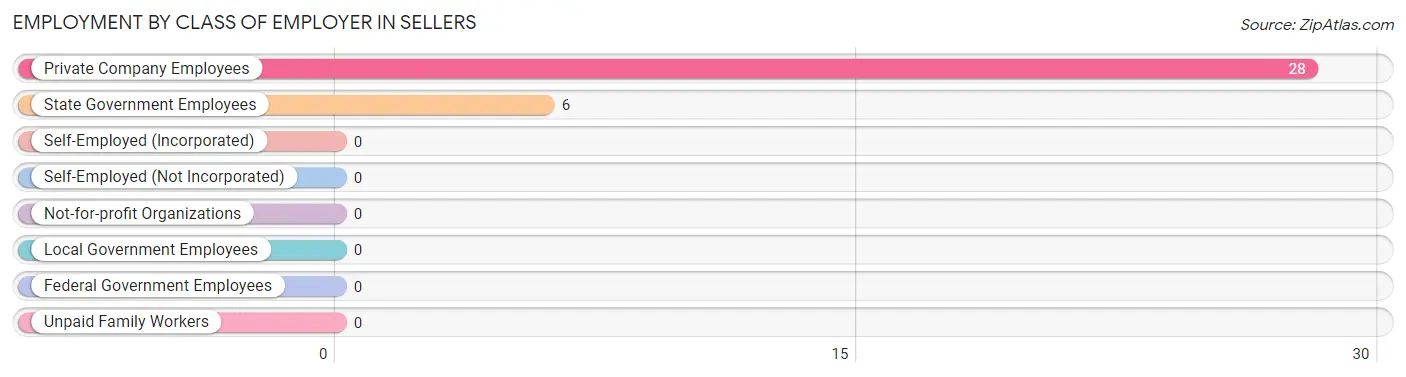
| Employer Class | # Employees | % Employees |
| Private Company Employees | 28 | 82.4% |
| Self-Employed (Incorporated) | 0 | 0.0% |
| Self-Employed (Not Incorporated) | 0 | 0.0% |
| Not-for-profit Organizations | 0 | 0.0% |
| Local Government Employees | 0 | 0.0% |
| State Government Employees | 6 | 17.6% |
| Federal Government Employees | 0 | 0.0% |
| Unpaid Family Workers | 0 | 0.0% |
| Total | 34 | 100.0% |
Employment Status by Age in Sellers
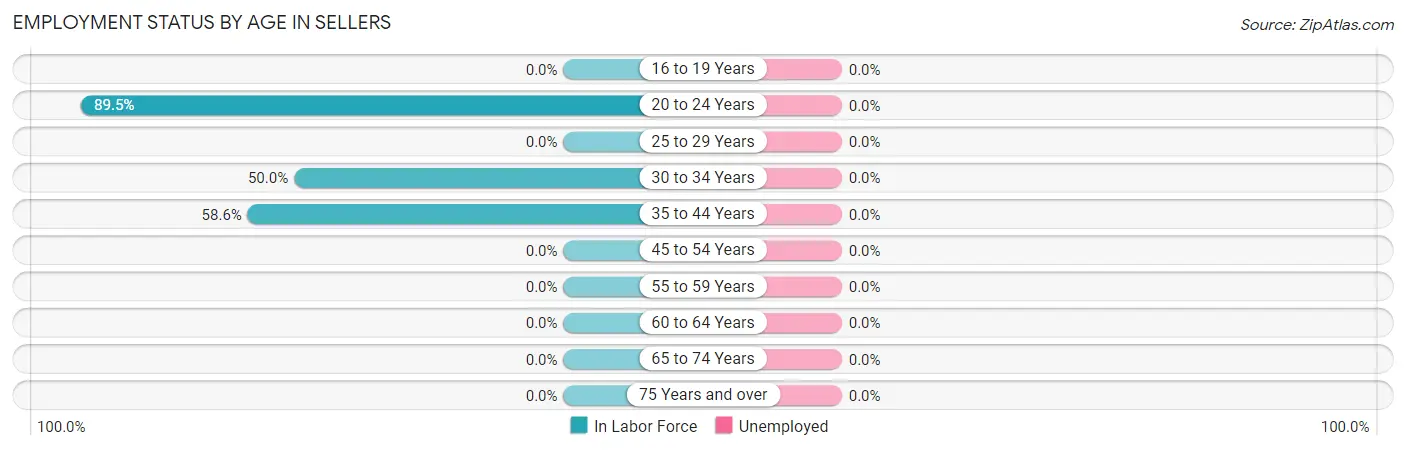
| Age Bracket | In Labor Force | Unemployed |
| 16 to 19 Years | 0 (0.0%) | 0 (0.0%) |
| 20 to 24 Years | 17 (89.5%) | 0 (0.0%) |
| 25 to 29 Years | 0 (0.0%) | 0 (0.0%) |
| 30 to 34 Years | 2 (50.0%) | 0 (0.0%) |
| 35 to 44 Years | 17 (58.6%) | 0 (0.0%) |
| 45 to 54 Years | 0 (0.0%) | 0 (0.0%) |
| 55 to 59 Years | 0 (0.0%) | 0 (0.0%) |
| 60 to 64 Years | 0 (0.0%) | 0 (0.0%) |
| 65 to 74 Years | 0 (0.0%) | 0 (0.0%) |
| 75 Years and over | 0 (0.0%) | 0 (0.0%) |
| Total | 36 (32.7%) | 0 (0.0%) |
Employment Status by Educational Attainment in Sellers
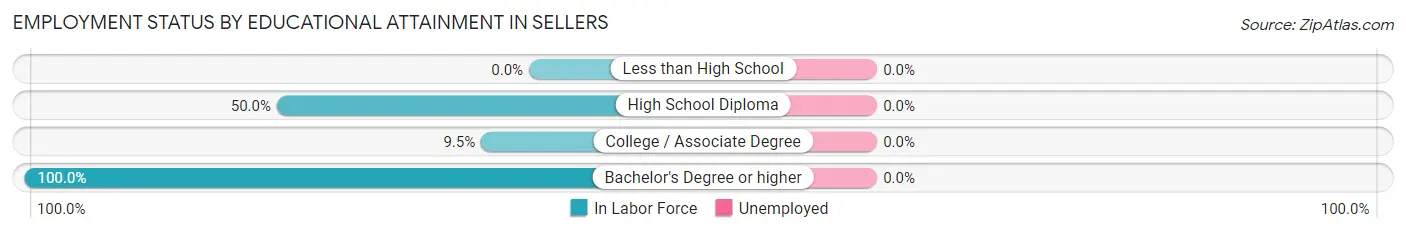
| Educational Attainment | In Labor Force | Unemployed |
| Less than High School | 0 (0.0%) | 0 (0.0%) |
| High School Diploma | 11 (50.0%) | 0 (0.0%) |
| College / Associate Degree | 2 (9.5%) | 0 (0.0%) |
| Bachelor's Degree or higher | 6 (100.0%) | 0 (0.0%) |
| Total | 19 (35.8%) | 0 (0.0%) |
Employment Occupations by Sex in Sellers
Management, Business, Science and Arts Occupations
The most common Management, Business, Science and Arts occupations in Sellers are Community & Social Service (6 | 16.7%), and Education Instruction & Library (6 | 16.7%).
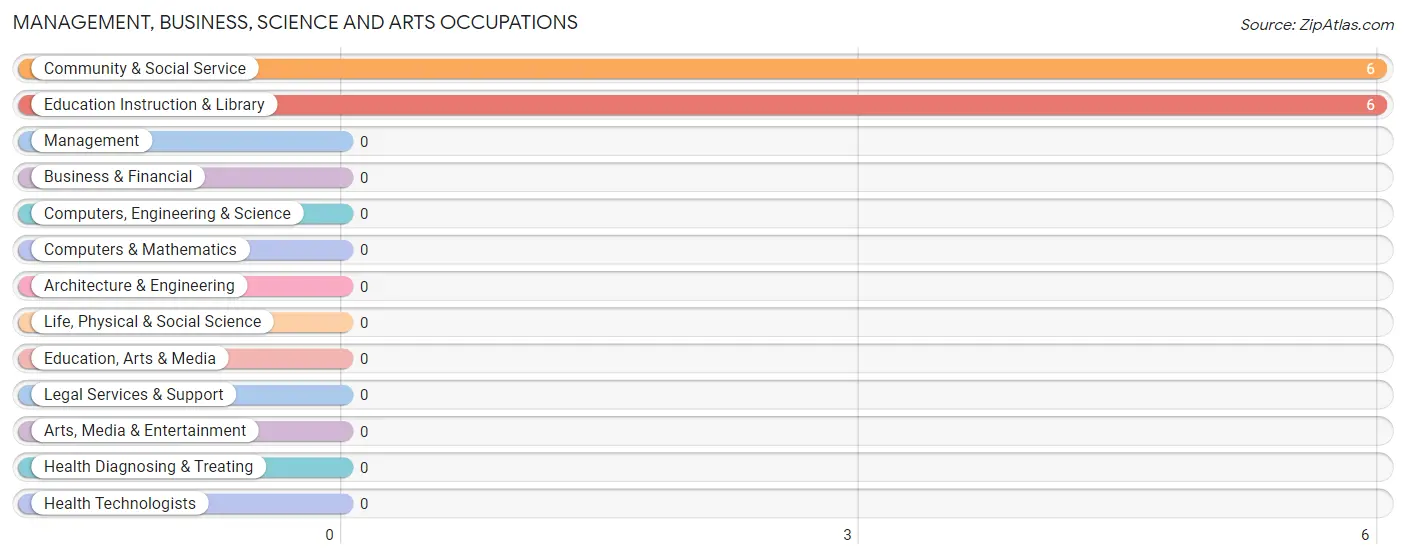
Management, Business, Science and Arts Occupations by Sex
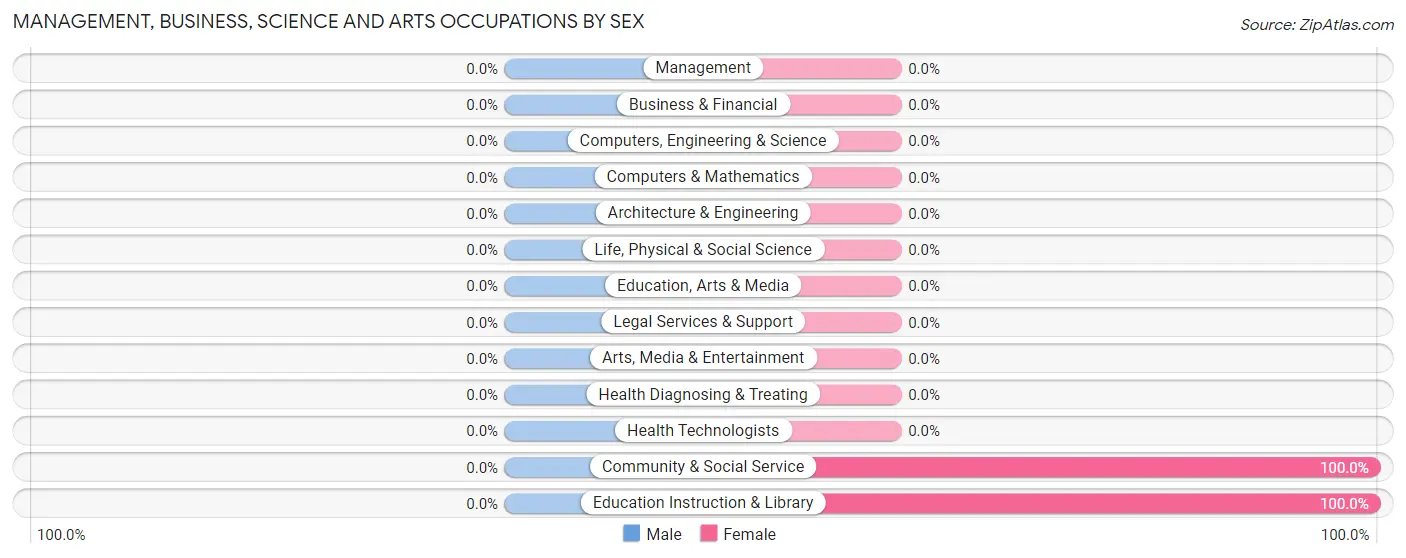
| Occupation | Male | Female |
| Management | 0 (0.0%) | 0 (0.0%) |
| Business & Financial | 0 (0.0%) | 0 (0.0%) |
| Computers, Engineering & Science | 0 (0.0%) | 0 (0.0%) |
| Computers & Mathematics | 0 (0.0%) | 0 (0.0%) |
| Architecture & Engineering | 0 (0.0%) | 0 (0.0%) |
| Life, Physical & Social Science | 0 (0.0%) | 0 (0.0%) |
| Community & Social Service | 0 (0.0%) | 6 (100.0%) |
| Education, Arts & Media | 0 (0.0%) | 0 (0.0%) |
| Legal Services & Support | 0 (0.0%) | 0 (0.0%) |
| Education Instruction & Library | 0 (0.0%) | 6 (100.0%) |
| Arts, Media & Entertainment | 0 (0.0%) | 0 (0.0%) |
| Health Diagnosing & Treating | 0 (0.0%) | 0 (0.0%) |
| Health Technologists | 0 (0.0%) | 0 (0.0%) |
| Total (Category) | 0 (0.0%) | 6 (100.0%) |
| Total (Overall) | 28 (77.8%) | 8 (22.2%) |
Services Occupations
The most common Services occupations in Sellers are , and Healthcare Support (2 | 5.6%).
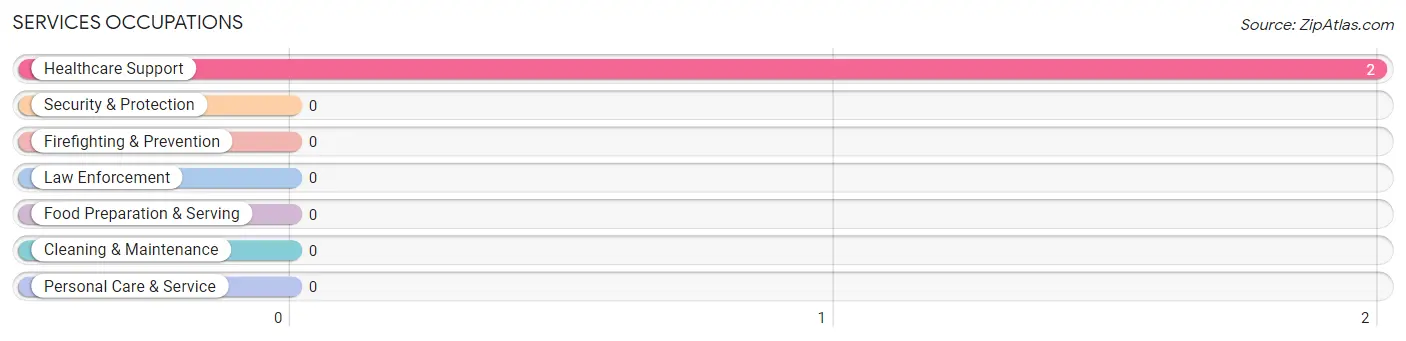
Services Occupations by Sex
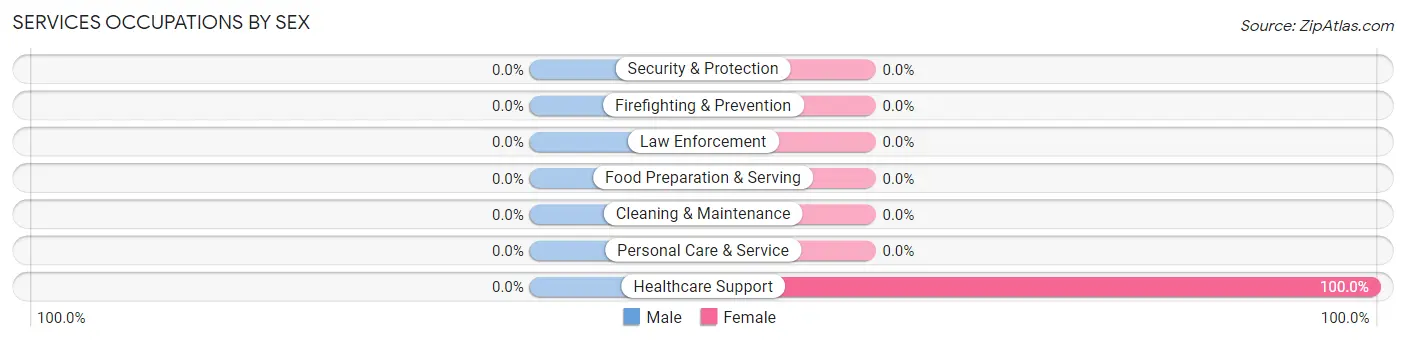
| Occupation | Male | Female |
| Healthcare Support | 0 (0.0%) | 2 (100.0%) |
| Security & Protection | 0 (0.0%) | 0 (0.0%) |
| Firefighting & Prevention | 0 (0.0%) | 0 (0.0%) |
| Law Enforcement | 0 (0.0%) | 0 (0.0%) |
| Food Preparation & Serving | 0 (0.0%) | 0 (0.0%) |
| Cleaning & Maintenance | 0 (0.0%) | 0 (0.0%) |
| Personal Care & Service | 0 (0.0%) | 0 (0.0%) |
| Total (Category) | 0 (0.0%) | 2 (100.0%) |
| Total (Overall) | 28 (77.8%) | 8 (22.2%) |
Sales and Office Occupations
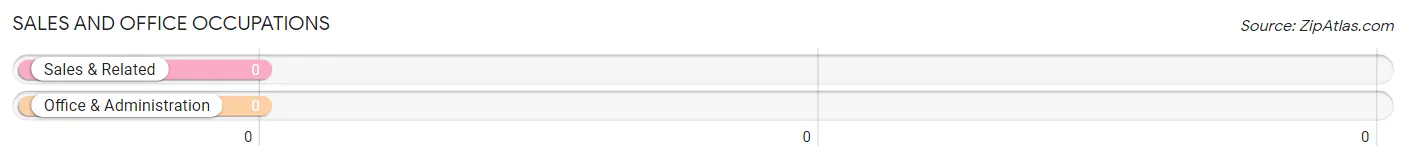
Sales and Office Occupations by Sex
| Occupation | Male | Female |
| Sales & Related | 0 (0.0%) | 0 (0.0%) |
| Office & Administration | 0 (0.0%) | 0 (0.0%) |
| Total (Category) | 0 (0.0%) | 0 (0.0%) |
| Total (Overall) | 28 (77.8%) | 8 (22.2%) |
Natural Resources, Construction and Maintenance Occupations
Natural Resources, Construction and Maintenance Occupations by Sex
| Occupation | Male | Female |
| Farming, Fishing & Forestry | 0 (0.0%) | 0 (0.0%) |
| Construction & Extraction | 0 (0.0%) | 0 (0.0%) |
| Installation, Maintenance & Repair | 0 (0.0%) | 0 (0.0%) |
| Total (Category) | 0 (0.0%) | 0 (0.0%) |
| Total (Overall) | 28 (77.8%) | 8 (22.2%) |
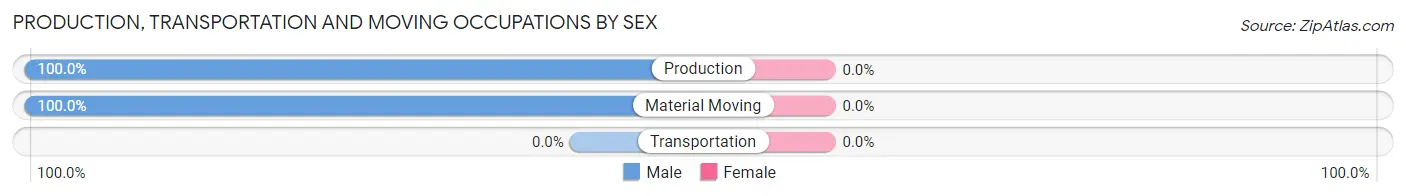
Production, Transportation and Moving Occupations
The most common Production, Transportation and Moving occupations in Sellers are Production (24 | 66.7%), and Material Moving (4 | 11.1%).
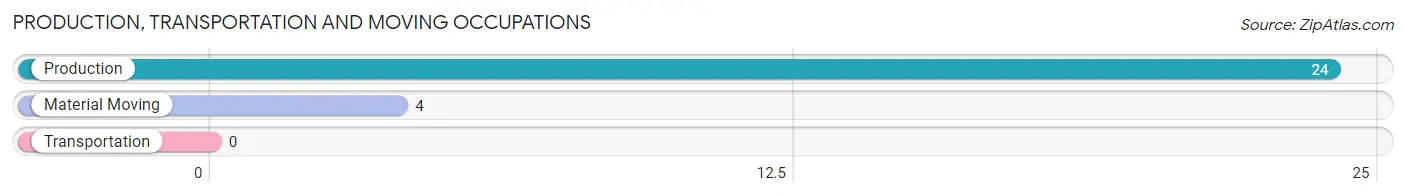
Production, Transportation and Moving Occupations by Sex
| Occupation | Male | Female |
| Production | 24 (100.0%) | 0 (0.0%) |
| Transportation | 0 (0.0%) | 0 (0.0%) |
| Material Moving | 4 (100.0%) | 0 (0.0%) |
| Total (Category) | 28 (100.0%) | 0 (0.0%) |
| Total (Overall) | 28 (77.8%) | 8 (22.2%) |
Employment Industries by Sex in Sellers
Employment Industries in Sellers
The major employment industries in Sellers include Manufacturing (24 | 66.7%), Educational Services (6 | 16.7%), Retail Trade (4 | 11.1%), and Health Care & Social Assistance (2 | 5.6%).
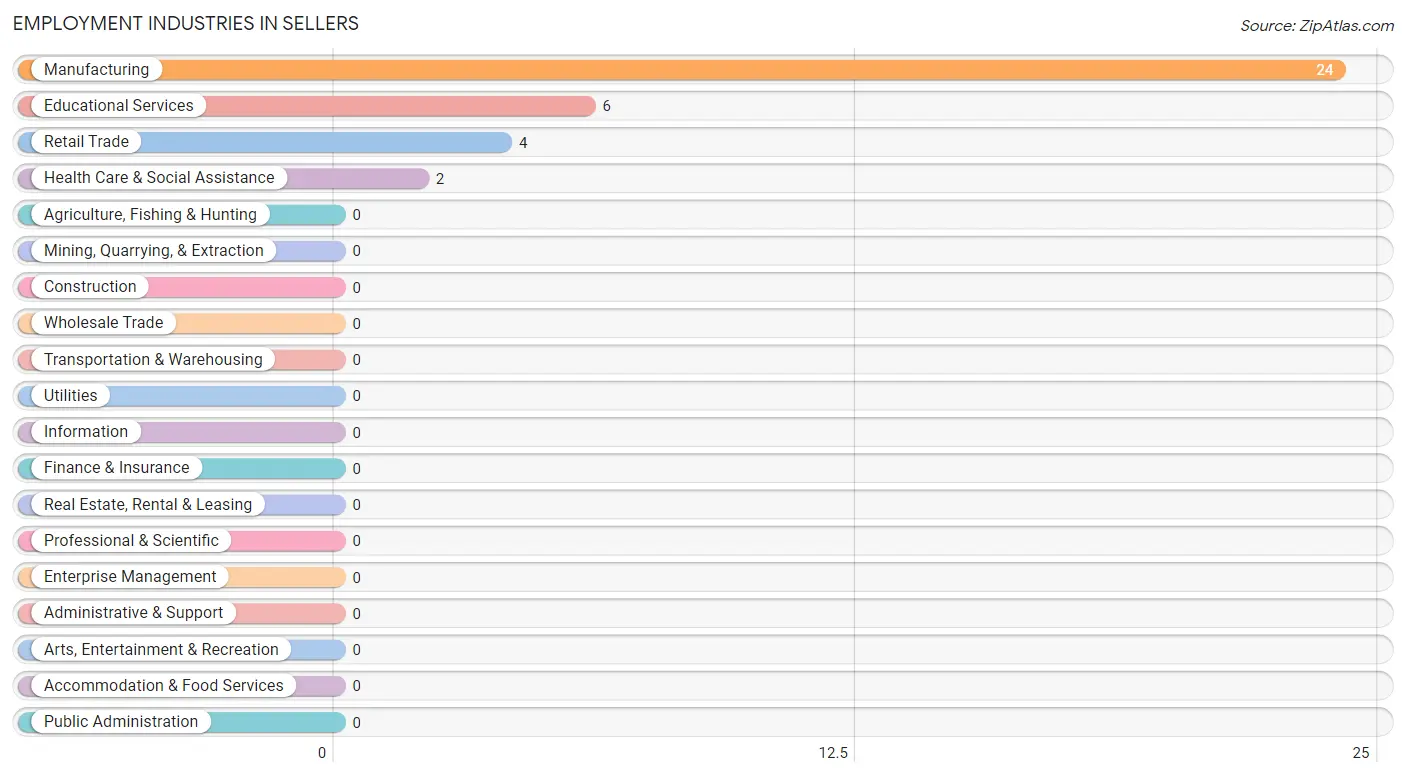
Employment Industries by Sex in Sellers
The Sellers industries that see more men than women are Manufacturing (100.0%), and Retail Trade (100.0%), whereas the industries that tend to have a higher number of women are Educational Services (100.0%), and Health Care & Social Assistance (100.0%).
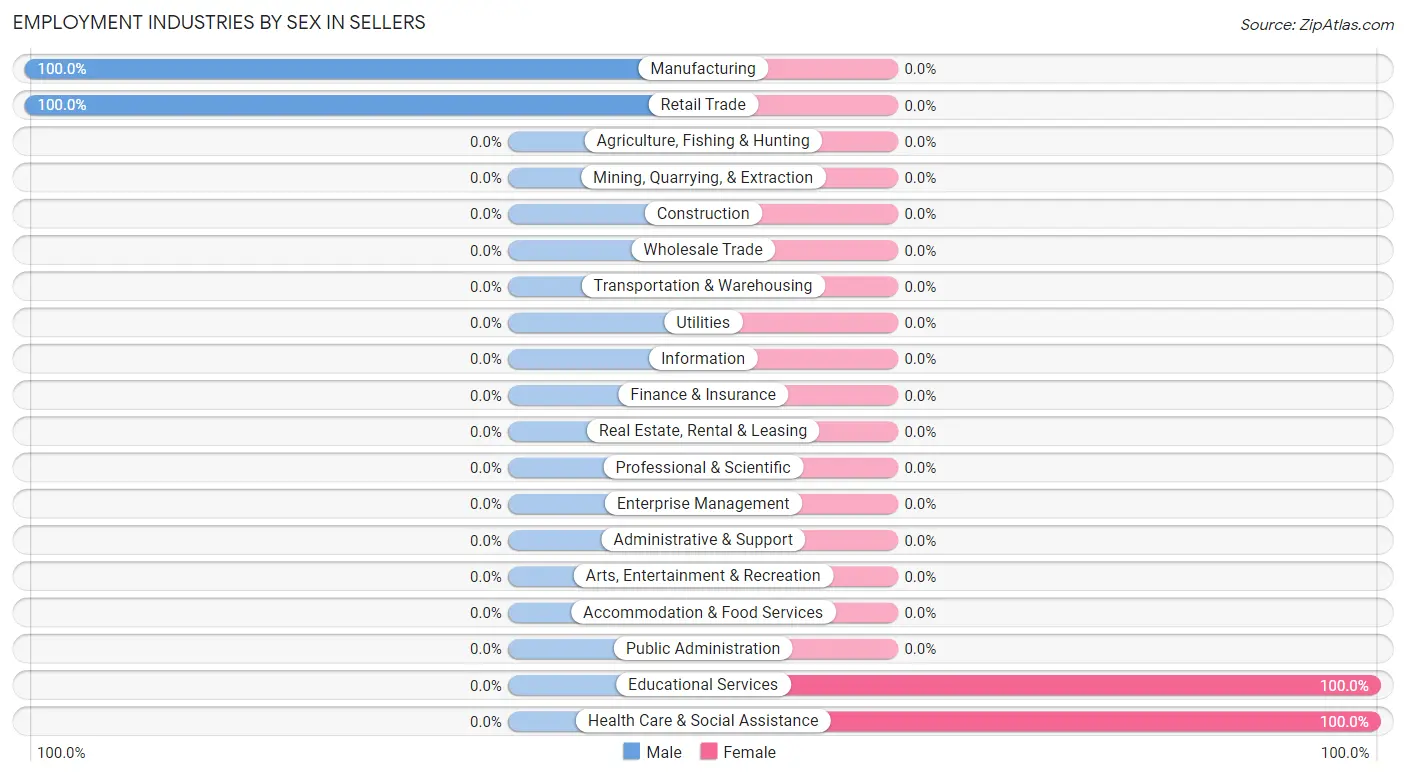
| Industry | Male | Female |
| Agriculture, Fishing & Hunting | 0 (0.0%) | 0 (0.0%) |
| Mining, Quarrying, & Extraction | 0 (0.0%) | 0 (0.0%) |
| Construction | 0 (0.0%) | 0 (0.0%) |
| Manufacturing | 24 (100.0%) | 0 (0.0%) |
| Wholesale Trade | 0 (0.0%) | 0 (0.0%) |
| Retail Trade | 4 (100.0%) | 0 (0.0%) |
| Transportation & Warehousing | 0 (0.0%) | 0 (0.0%) |
| Utilities | 0 (0.0%) | 0 (0.0%) |
| Information | 0 (0.0%) | 0 (0.0%) |
| Finance & Insurance | 0 (0.0%) | 0 (0.0%) |
| Real Estate, Rental & Leasing | 0 (0.0%) | 0 (0.0%) |
| Professional & Scientific | 0 (0.0%) | 0 (0.0%) |
| Enterprise Management | 0 (0.0%) | 0 (0.0%) |
| Administrative & Support | 0 (0.0%) | 0 (0.0%) |
| Educational Services | 0 (0.0%) | 6 (100.0%) |
| Health Care & Social Assistance | 0 (0.0%) | 2 (100.0%) |
| Arts, Entertainment & Recreation | 0 (0.0%) | 0 (0.0%) |
| Accommodation & Food Services | 0 (0.0%) | 0 (0.0%) |
| Public Administration | 0 (0.0%) | 0 (0.0%) |
| Total | 28 (77.8%) | 8 (22.2%) |
Education in Sellers
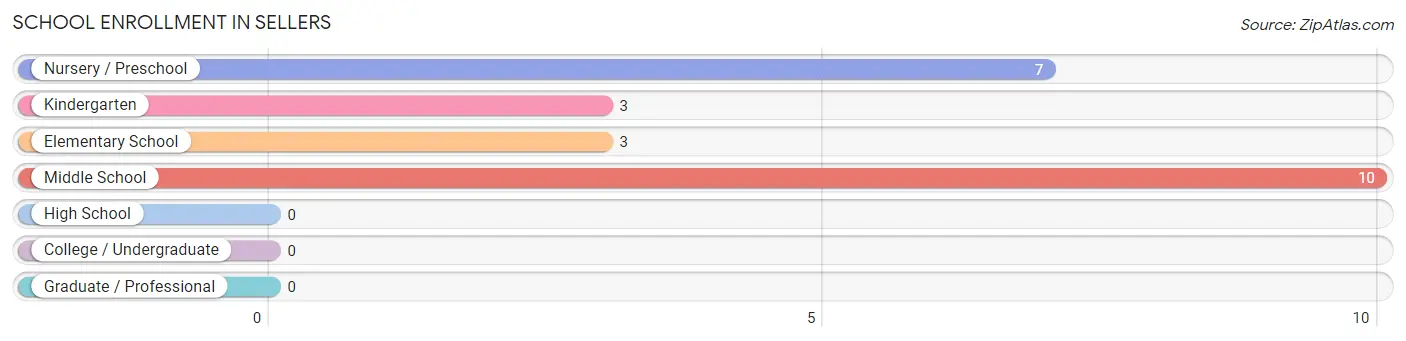
School Enrollment in Sellers
The most common levels of schooling among the 23 students in Sellers are middle school (10 | 43.5%), nursery / preschool (7 | 30.4%), and kindergarten (3 | 13.0%).
| School Level | # Students | % Students |
| Nursery / Preschool | 7 | 30.4% |
| Kindergarten | 3 | 13.0% |
| Elementary School | 3 | 13.0% |
| Middle School | 10 | 43.5% |
| High School | 0 | 0.0% |
| College / Undergraduate | 0 | 0.0% |
| Graduate / Professional | 0 | 0.0% |
| Total | 23 | 100.0% |
School Enrollment by Age by Funding Source in Sellers
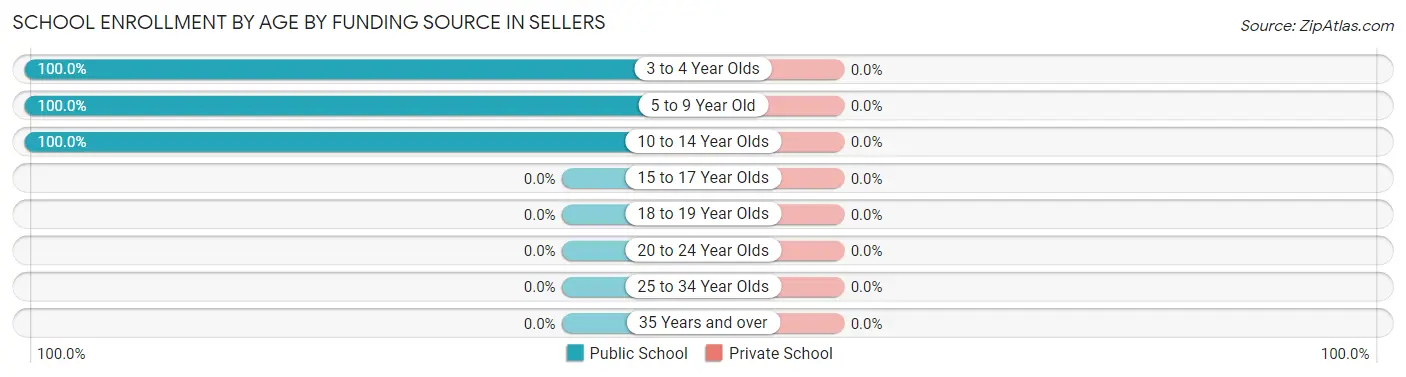
| Age Bracket | Public School | Private School |
| 3 to 4 Year Olds | 10 (100.0%) | 0 (0.0%) |
| 5 to 9 Year Old | 3 (100.0%) | 0 (0.0%) |
| 10 to 14 Year Olds | 10 (100.0%) | 0 (0.0%) |
| 15 to 17 Year Olds | 0 (0.0%) | 0 (0.0%) |
| 18 to 19 Year Olds | 0 (0.0%) | 0 (0.0%) |
| 20 to 24 Year Olds | 0 (0.0%) | 0 (0.0%) |
| 25 to 34 Year Olds | 0 (0.0%) | 0 (0.0%) |
| 35 Years and over | 0 (0.0%) | 0 (0.0%) |
| Total | 23 (100.0%) | 0 (0.0%) |
Educational Attainment by Field of Study in Sellers
, and education (6 | 100.0%) are the most common fields of study among 6 individuals in Sellers who have obtained a bachelor's degree or higher.
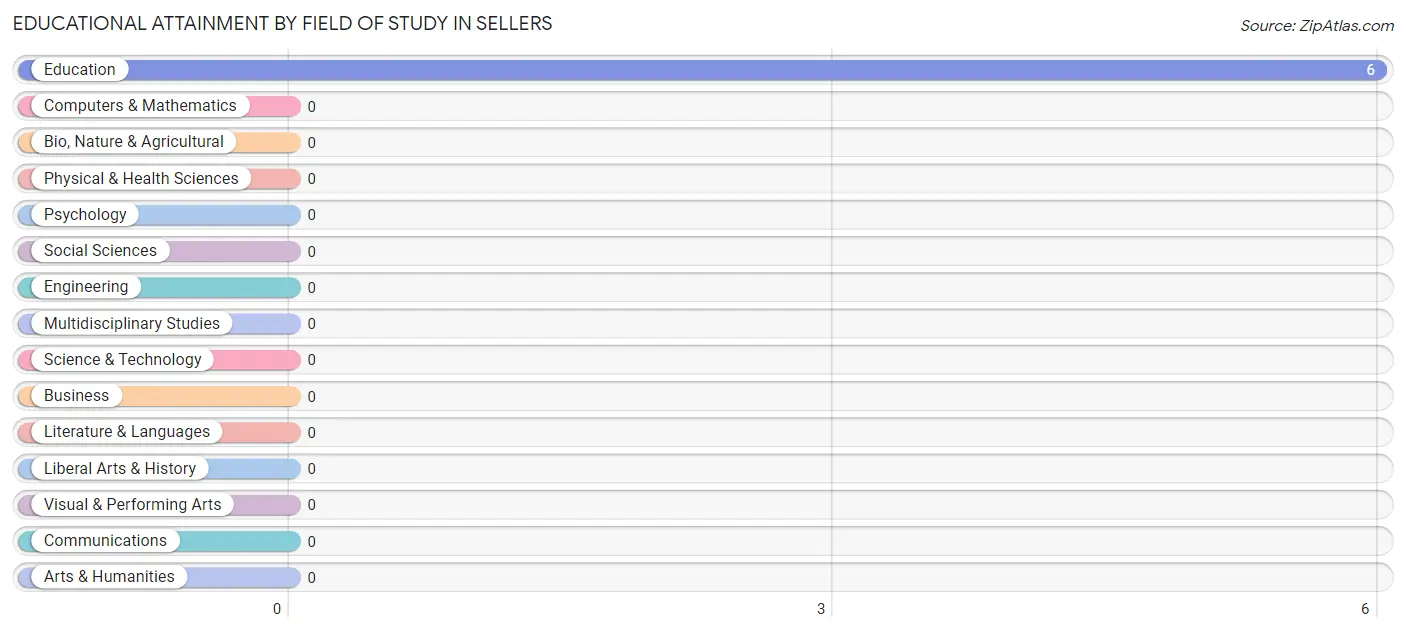
| Field of Study | # Graduates | % Graduates |
| Computers & Mathematics | 0 | 0.0% |
| Bio, Nature & Agricultural | 0 | 0.0% |
| Physical & Health Sciences | 0 | 0.0% |
| Psychology | 0 | 0.0% |
| Social Sciences | 0 | 0.0% |
| Engineering | 0 | 0.0% |
| Multidisciplinary Studies | 0 | 0.0% |
| Science & Technology | 0 | 0.0% |
| Business | 0 | 0.0% |
| Education | 6 | 100.0% |
| Literature & Languages | 0 | 0.0% |
| Liberal Arts & History | 0 | 0.0% |
| Visual & Performing Arts | 0 | 0.0% |
| Communications | 0 | 0.0% |
| Arts & Humanities | 0 | 0.0% |
| Total | 6 | 100.0% |
Transportation & Commute in Sellers
Vehicle Availability by Sex in Sellers
The most prevalent vehicle ownership categories in Sellers are males with 2 vehicles (17, accounting for 60.7%) and females with 2 vehicles (0, making up 283.3%).
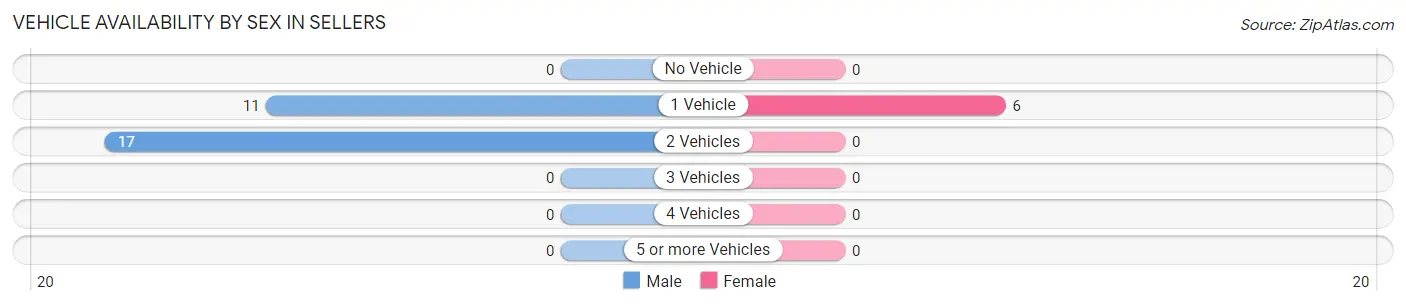
| Vehicles Available | Male | Female |
| No Vehicle | 0 (0.0%) | 0 (0.0%) |
| 1 Vehicle | 11 (39.3%) | 6 (100.0%) |
| 2 Vehicles | 17 (60.7%) | 0 (0.0%) |
| 3 Vehicles | 0 (0.0%) | 0 (0.0%) |
| 4 Vehicles | 0 (0.0%) | 0 (0.0%) |
| 5 or more Vehicles | 0 (0.0%) | 0 (0.0%) |
| Total | 28 (100.0%) | 6 (100.0%) |
Commute Time in Sellers
The most frequently occuring commute durations in Sellers are 40 to 44 minutes (17 commuters, 50.0%), 5 to 9 minutes (7 commuters, 20.6%), and 20 to 24 minutes (6 commuters, 17.6%).
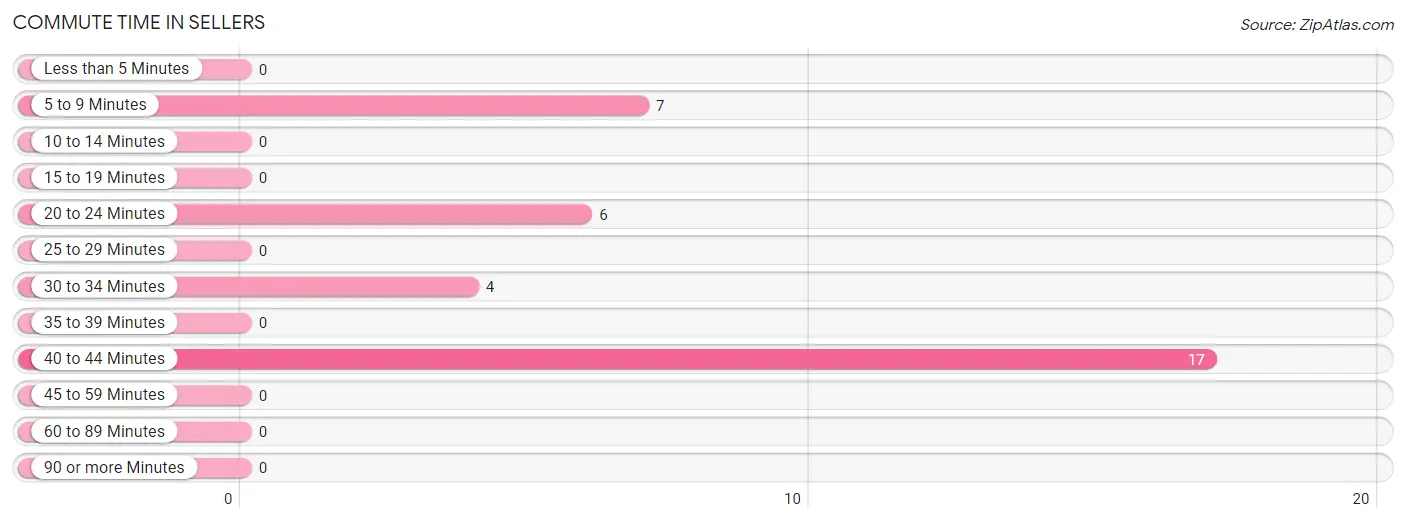
| Commute Time | # Commuters | % Commuters |
| Less than 5 Minutes | 0 | 0.0% |
| 5 to 9 Minutes | 7 | 20.6% |
| 10 to 14 Minutes | 0 | 0.0% |
| 15 to 19 Minutes | 0 | 0.0% |
| 20 to 24 Minutes | 6 | 17.6% |
| 25 to 29 Minutes | 0 | 0.0% |
| 30 to 34 Minutes | 4 | 11.8% |
| 35 to 39 Minutes | 0 | 0.0% |
| 40 to 44 Minutes | 17 | 50.0% |
| 45 to 59 Minutes | 0 | 0.0% |
| 60 to 89 Minutes | 0 | 0.0% |
| 90 or more Minutes | 0 | 0.0% |
Commute Time by Sex in Sellers
The most common commute times in Sellers are 40 to 44 minutes (17 commuters, 60.7%) for males and 20 to 24 minutes (6 commuters, 100.0%) for females.
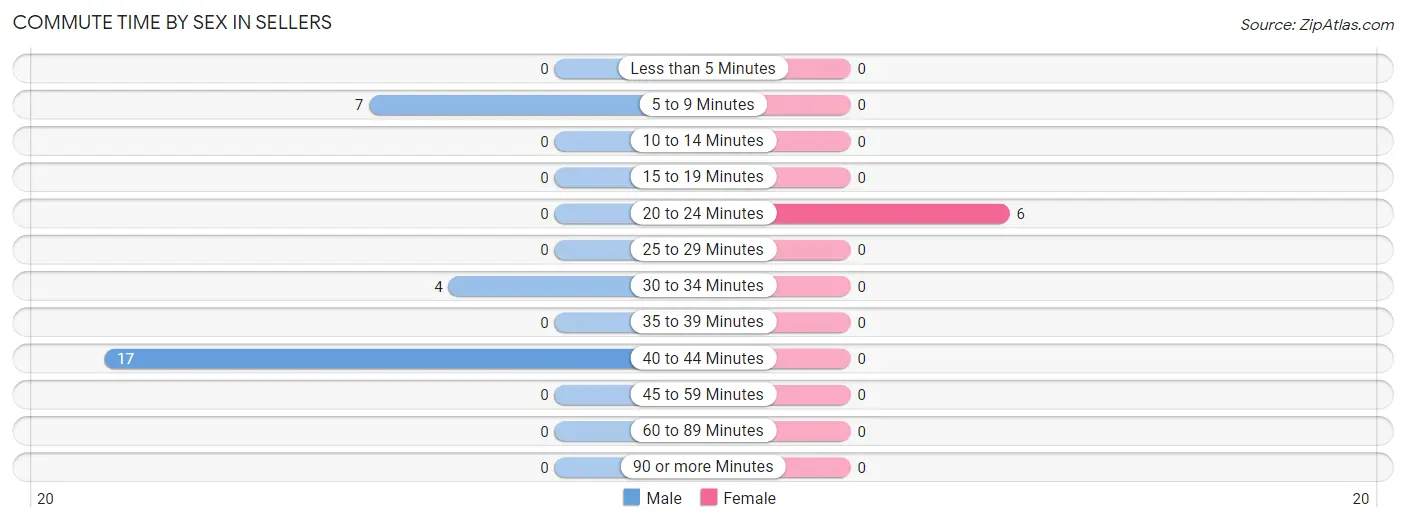
| Commute Time | Male | Female |
| Less than 5 Minutes | 0 (0.0%) | 0 (0.0%) |
| 5 to 9 Minutes | 7 (25.0%) | 0 (0.0%) |
| 10 to 14 Minutes | 0 (0.0%) | 0 (0.0%) |
| 15 to 19 Minutes | 0 (0.0%) | 0 (0.0%) |
| 20 to 24 Minutes | 0 (0.0%) | 6 (100.0%) |
| 25 to 29 Minutes | 0 (0.0%) | 0 (0.0%) |
| 30 to 34 Minutes | 4 (14.3%) | 0 (0.0%) |
| 35 to 39 Minutes | 0 (0.0%) | 0 (0.0%) |
| 40 to 44 Minutes | 17 (60.7%) | 0 (0.0%) |
| 45 to 59 Minutes | 0 (0.0%) | 0 (0.0%) |
| 60 to 89 Minutes | 0 (0.0%) | 0 (0.0%) |
| 90 or more Minutes | 0 (0.0%) | 0 (0.0%) |
Time of Departure to Work by Sex in Sellers
The most frequent times of departure to work in Sellers are 7:00 AM to 7:29 AM (17, 60.7%) for males and 7:30 AM to 7:59 AM (6, 100.0%) for females.
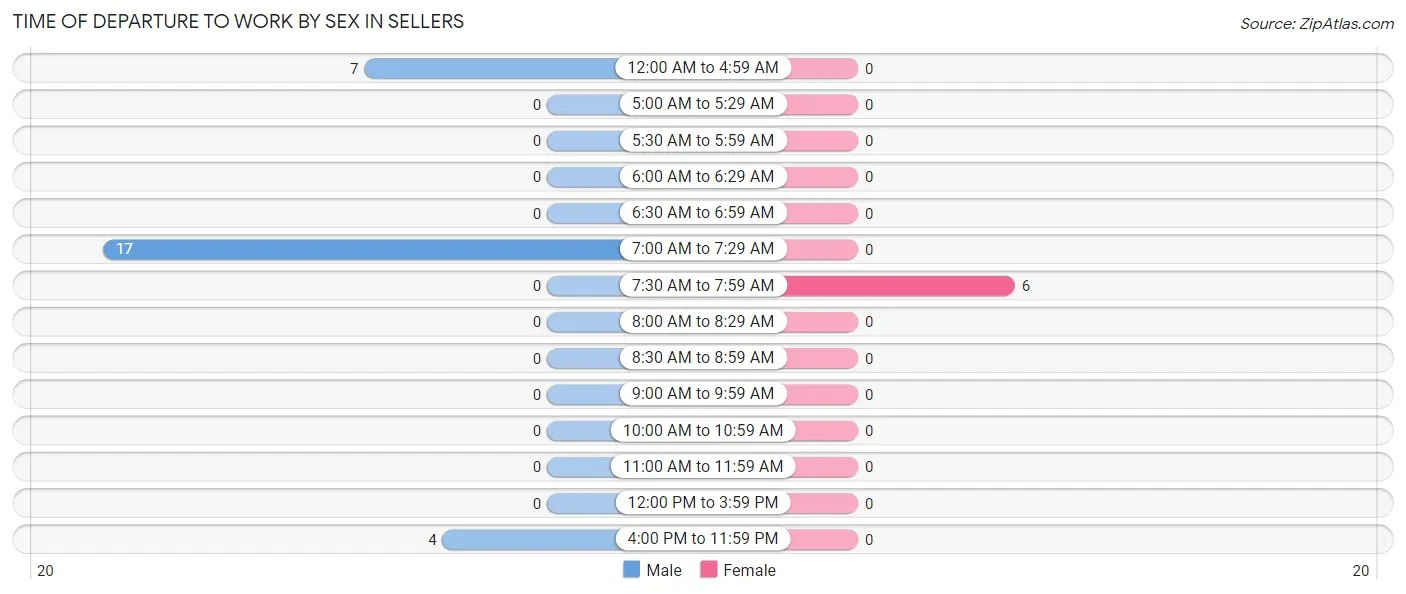
| Time of Departure | Male | Female |
| 12:00 AM to 4:59 AM | 7 (25.0%) | 0 (0.0%) |
| 5:00 AM to 5:29 AM | 0 (0.0%) | 0 (0.0%) |
| 5:30 AM to 5:59 AM | 0 (0.0%) | 0 (0.0%) |
| 6:00 AM to 6:29 AM | 0 (0.0%) | 0 (0.0%) |
| 6:30 AM to 6:59 AM | 0 (0.0%) | 0 (0.0%) |
| 7:00 AM to 7:29 AM | 17 (60.7%) | 0 (0.0%) |
| 7:30 AM to 7:59 AM | 0 (0.0%) | 6 (100.0%) |
| 8:00 AM to 8:29 AM | 0 (0.0%) | 0 (0.0%) |
| 8:30 AM to 8:59 AM | 0 (0.0%) | 0 (0.0%) |
| 9:00 AM to 9:59 AM | 0 (0.0%) | 0 (0.0%) |
| 10:00 AM to 10:59 AM | 0 (0.0%) | 0 (0.0%) |
| 11:00 AM to 11:59 AM | 0 (0.0%) | 0 (0.0%) |
| 12:00 PM to 3:59 PM | 0 (0.0%) | 0 (0.0%) |
| 4:00 PM to 11:59 PM | 4 (14.3%) | 0 (0.0%) |
| Total | 28 (100.0%) | 6 (100.0%) |
Housing Occupancy in Sellers
Occupancy by Ownership in Sellers
Of the total 52 dwellings in Sellers, owner-occupied units account for 31 (59.6%), while renter-occupied units make up 21 (40.4%).
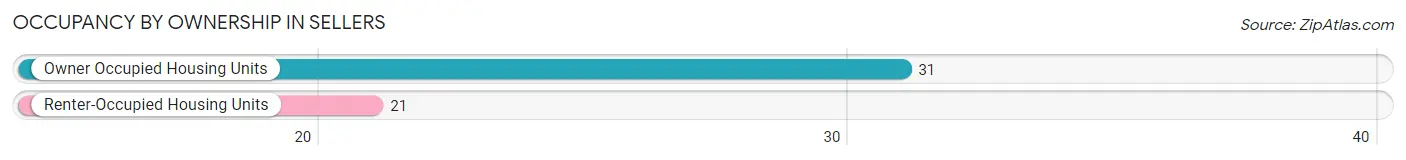
| Occupancy | # Housing Units | % Housing Units |
| Owner Occupied Housing Units | 31 | 59.6% |
| Renter-Occupied Housing Units | 21 | 40.4% |
| Total Occupied Housing Units | 52 | 100.0% |
Occupancy by Household Size in Sellers
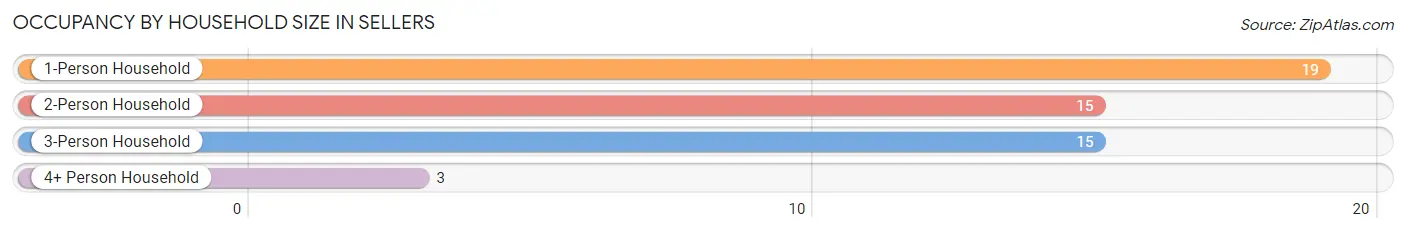
| Household Size | # Housing Units | % Housing Units |
| 1-Person Household | 19 | 36.5% |
| 2-Person Household | 15 | 28.8% |
| 3-Person Household | 15 | 28.8% |
| 4+ Person Household | 3 | 5.8% |
| Total Housing Units | 52 | 100.0% |
Occupancy by Ownership by Household Size in Sellers
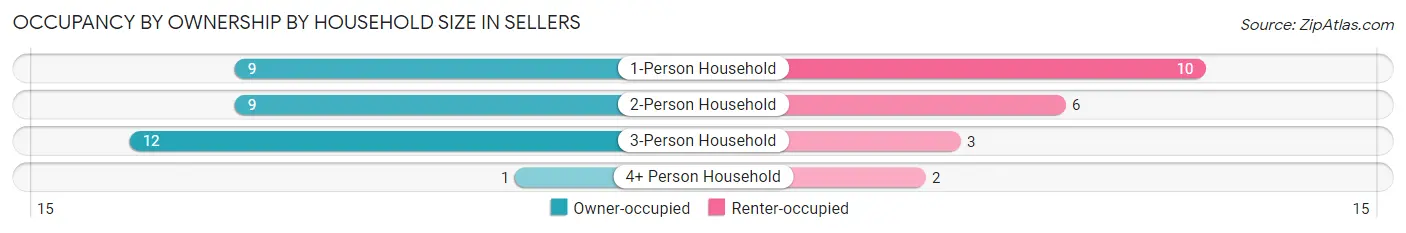
| Household Size | Owner-occupied | Renter-occupied |
| 1-Person Household | 9 (47.4%) | 10 (52.6%) |
| 2-Person Household | 9 (60.0%) | 6 (40.0%) |
| 3-Person Household | 12 (80.0%) | 3 (20.0%) |
| 4+ Person Household | 1 (33.3%) | 2 (66.7%) |
| Total Housing Units | 31 (59.6%) | 21 (40.4%) |
Occupancy by Educational Attainment in Sellers
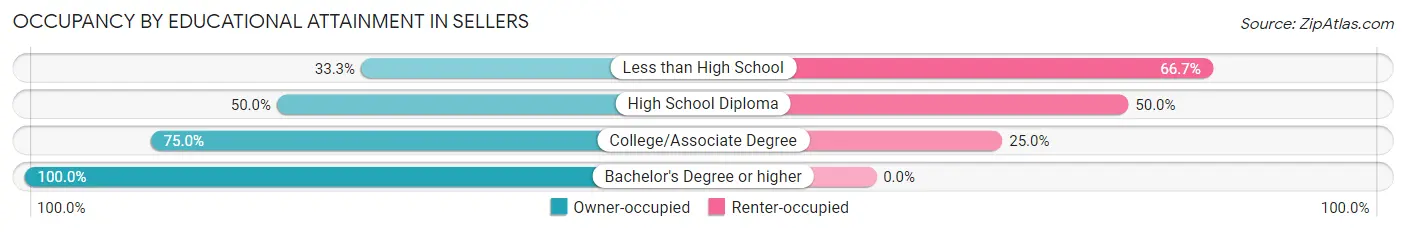
| Household Size | Owner-occupied | Renter-occupied |
| Less than High School | 4 (33.3%) | 8 (66.7%) |
| High School Diploma | 9 (50.0%) | 9 (50.0%) |
| College/Associate Degree | 12 (75.0%) | 4 (25.0%) |
| Bachelor's Degree or higher | 6 (100.0%) | 0 (0.0%) |
Occupancy by Age of Householder in Sellers
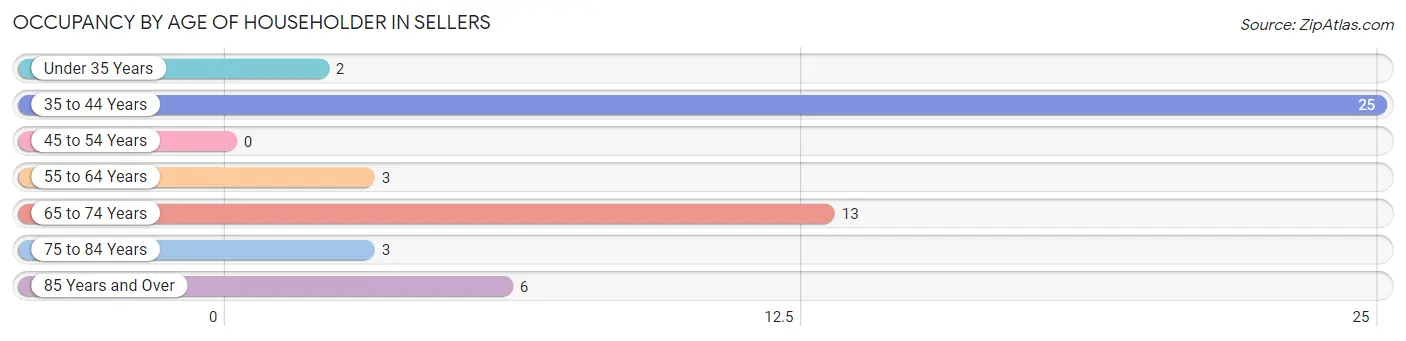
| Age Bracket | # Households | % Households |
| Under 35 Years | 2 | 3.8% |
| 35 to 44 Years | 25 | 48.1% |
| 45 to 54 Years | 0 | 0.0% |
| 55 to 64 Years | 3 | 5.8% |
| 65 to 74 Years | 13 | 25.0% |
| 75 to 84 Years | 3 | 5.8% |
| 85 Years and Over | 6 | 11.5% |
| Total | 52 | 100.0% |
Housing Finances in Sellers
Median Income by Occupancy in Sellers
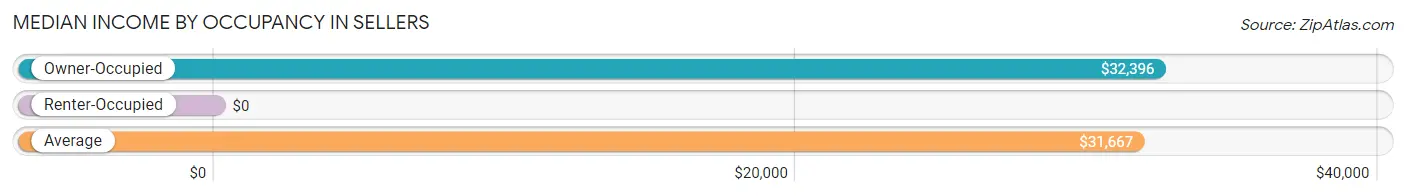
| Occupancy Type | # Households | Median Income |
| Owner-Occupied | 31 (59.6%) | $32,396 |
| Renter-Occupied | 21 (40.4%) | $0 |
| Average | 52 (100.0%) | $31,667 |
Occupancy by Householder Income Bracket in Sellers
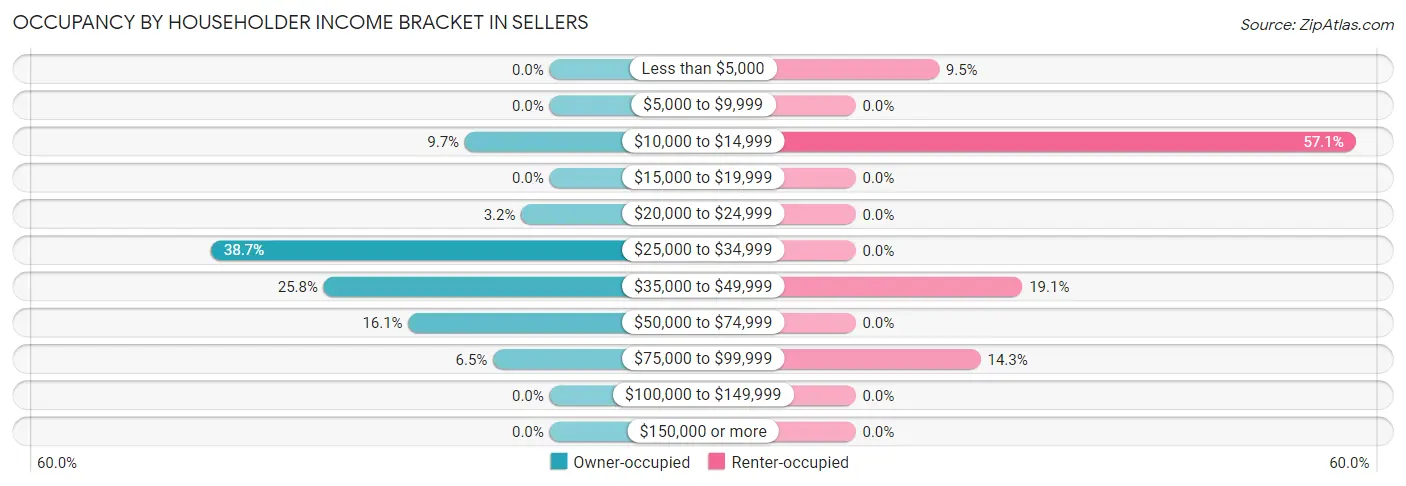
| Income Bracket | Owner-occupied | Renter-occupied |
| Less than $5,000 | 0 (0.0%) | 2 (9.5%) |
| $5,000 to $9,999 | 0 (0.0%) | 0 (0.0%) |
| $10,000 to $14,999 | 3 (9.7%) | 12 (57.1%) |
| $15,000 to $19,999 | 0 (0.0%) | 0 (0.0%) |
| $20,000 to $24,999 | 1 (3.2%) | 0 (0.0%) |
| $25,000 to $34,999 | 12 (38.7%) | 0 (0.0%) |
| $35,000 to $49,999 | 8 (25.8%) | 4 (19.1%) |
| $50,000 to $74,999 | 5 (16.1%) | 0 (0.0%) |
| $75,000 to $99,999 | 2 (6.5%) | 3 (14.3%) |
| $100,000 to $149,999 | 0 (0.0%) | 0 (0.0%) |
| $150,000 or more | 0 (0.0%) | 0 (0.0%) |
| Total | 31 (100.0%) | 21 (100.0%) |
Monthly Housing Cost Tiers in Sellers
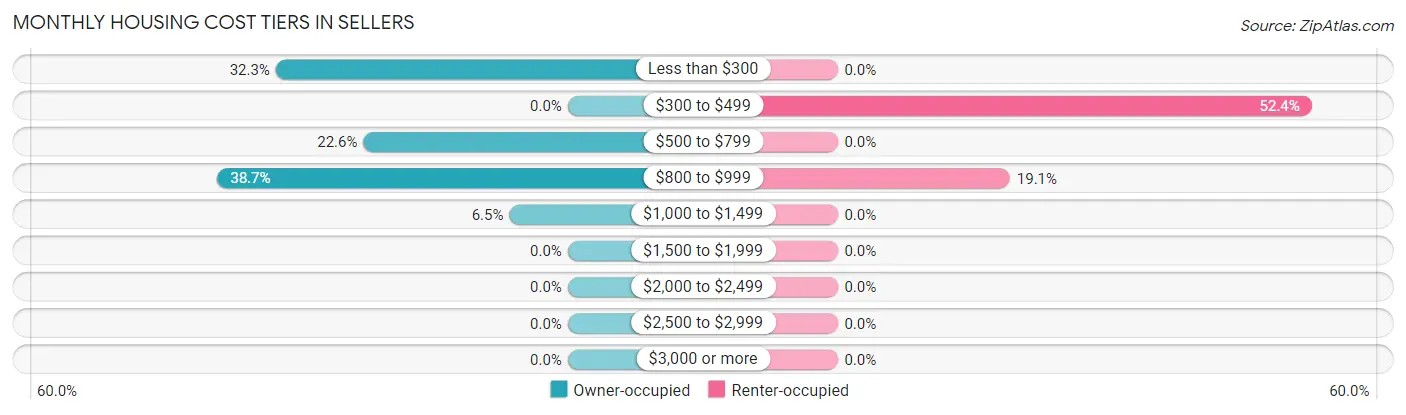
| Monthly Cost | Owner-occupied | Renter-occupied |
| Less than $300 | 10 (32.3%) | 0 (0.0%) |
| $300 to $499 | 0 (0.0%) | 11 (52.4%) |
| $500 to $799 | 7 (22.6%) | 0 (0.0%) |
| $800 to $999 | 12 (38.7%) | 4 (19.1%) |
| $1,000 to $1,499 | 2 (6.5%) | 0 (0.0%) |
| $1,500 to $1,999 | 0 (0.0%) | 0 (0.0%) |
| $2,000 to $2,499 | 0 (0.0%) | 0 (0.0%) |
| $2,500 to $2,999 | 0 (0.0%) | 0 (0.0%) |
| $3,000 or more | 0 (0.0%) | 0 (0.0%) |
| Total | 31 (100.0%) | 21 (100.0%) |
Physical Housing Characteristics in Sellers
Housing Structures in Sellers
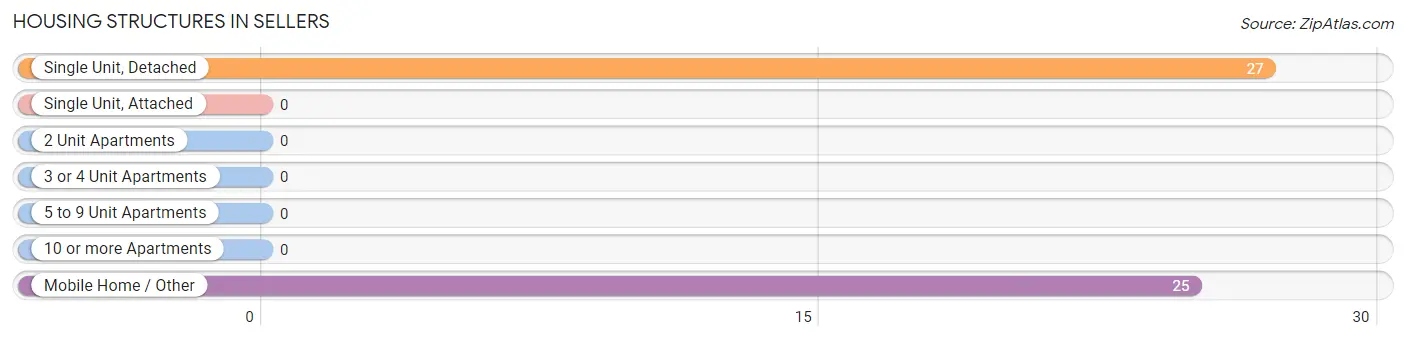
| Structure Type | # Housing Units | % Housing Units |
| Single Unit, Detached | 27 | 51.9% |
| Single Unit, Attached | 0 | 0.0% |
| 2 Unit Apartments | 0 | 0.0% |
| 3 or 4 Unit Apartments | 0 | 0.0% |
| 5 to 9 Unit Apartments | 0 | 0.0% |
| 10 or more Apartments | 0 | 0.0% |
| Mobile Home / Other | 25 | 48.1% |
| Total | 52 | 100.0% |
Housing Structures by Occupancy in Sellers
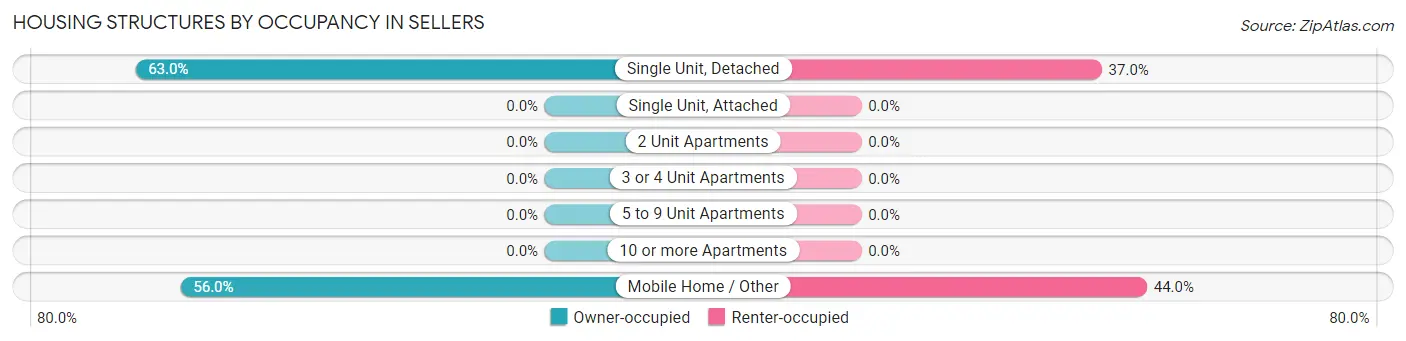
| Structure Type | Owner-occupied | Renter-occupied |
| Single Unit, Detached | 17 (63.0%) | 10 (37.0%) |
| Single Unit, Attached | 0 (0.0%) | 0 (0.0%) |
| 2 Unit Apartments | 0 (0.0%) | 0 (0.0%) |
| 3 or 4 Unit Apartments | 0 (0.0%) | 0 (0.0%) |
| 5 to 9 Unit Apartments | 0 (0.0%) | 0 (0.0%) |
| 10 or more Apartments | 0 (0.0%) | 0 (0.0%) |
| Mobile Home / Other | 14 (56.0%) | 11 (44.0%) |
| Total | 31 (59.6%) | 21 (40.4%) |
Housing Structures by Number of Rooms in Sellers
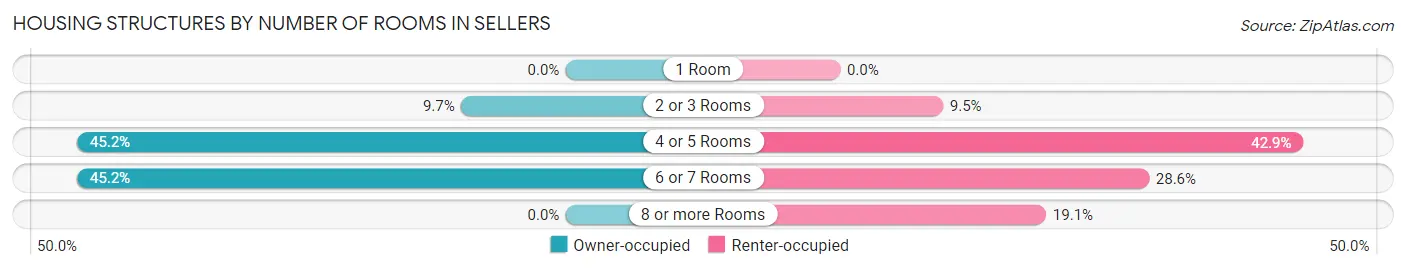
| Number of Rooms | Owner-occupied | Renter-occupied |
| 1 Room | 0 (0.0%) | 0 (0.0%) |
| 2 or 3 Rooms | 3 (9.7%) | 2 (9.5%) |
| 4 or 5 Rooms | 14 (45.2%) | 9 (42.9%) |
| 6 or 7 Rooms | 14 (45.2%) | 6 (28.6%) |
| 8 or more Rooms | 0 (0.0%) | 4 (19.1%) |
| Total | 31 (100.0%) | 21 (100.0%) |
Housing Structure by Heating Type in Sellers
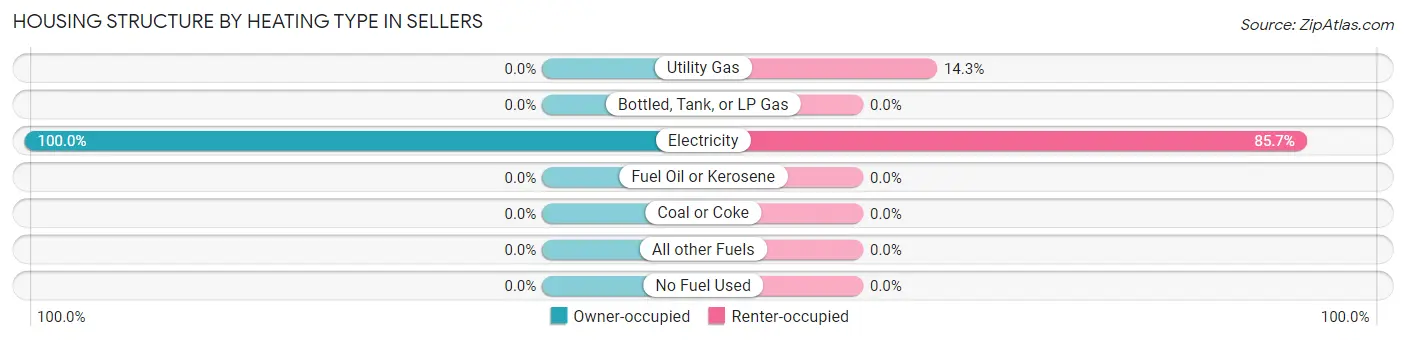
| Heating Type | Owner-occupied | Renter-occupied |
| Utility Gas | 0 (0.0%) | 3 (14.3%) |
| Bottled, Tank, or LP Gas | 0 (0.0%) | 0 (0.0%) |
| Electricity | 31 (100.0%) | 18 (85.7%) |
| Fuel Oil or Kerosene | 0 (0.0%) | 0 (0.0%) |
| Coal or Coke | 0 (0.0%) | 0 (0.0%) |
| All other Fuels | 0 (0.0%) | 0 (0.0%) |
| No Fuel Used | 0 (0.0%) | 0 (0.0%) |
| Total | 31 (100.0%) | 21 (100.0%) |
Household Vehicle Usage in Sellers
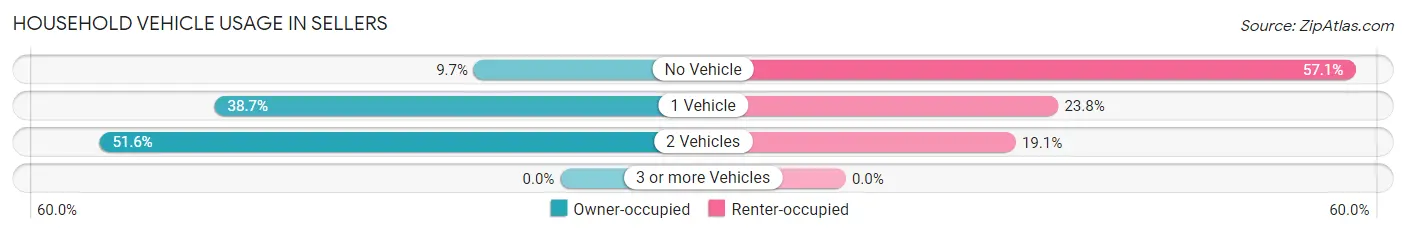
| Vehicles per Household | Owner-occupied | Renter-occupied |
| No Vehicle | 3 (9.7%) | 12 (57.1%) |
| 1 Vehicle | 12 (38.7%) | 5 (23.8%) |
| 2 Vehicles | 16 (51.6%) | 4 (19.1%) |
| 3 or more Vehicles | 0 (0.0%) | 0 (0.0%) |
| Total | 31 (100.0%) | 21 (100.0%) |
Real Estate & Mortgages in Sellers
Real Estate and Mortgage Overview in Sellers
| Characteristic | Without Mortgage | With Mortgage |
| Housing Units | 11 | 20 |
| Median Property Value | $13,900 | $0 |
| Median Household Income | $44,375 | $0 |
| Monthly Housing Costs | $181 | $0 |
| Real Estate Taxes | $199 | $6 |
Property Value by Mortgage Status in Sellers
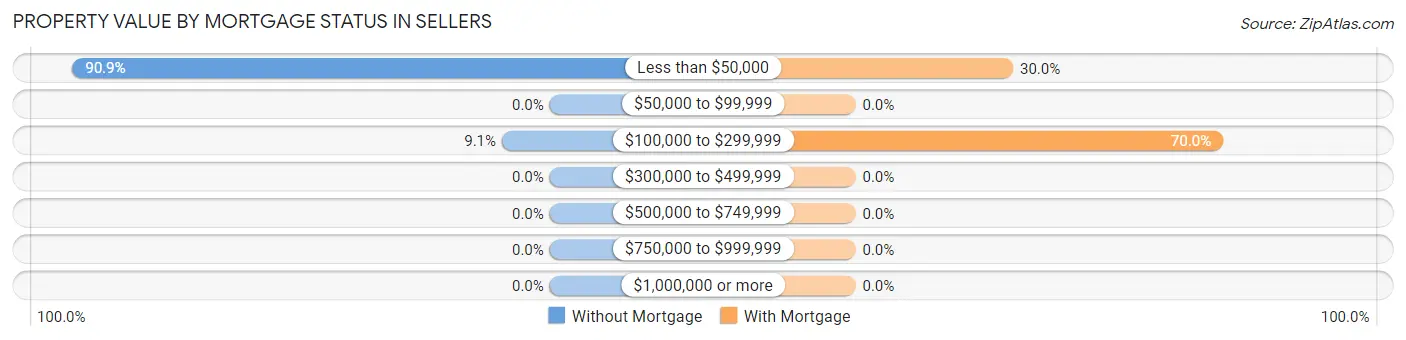
| Property Value | Without Mortgage | With Mortgage |
| Less than $50,000 | 10 (90.9%) | 6 (30.0%) |
| $50,000 to $99,999 | 0 (0.0%) | 0 (0.0%) |
| $100,000 to $299,999 | 1 (9.1%) | 14 (70.0%) |
| $300,000 to $499,999 | 0 (0.0%) | 0 (0.0%) |
| $500,000 to $749,999 | 0 (0.0%) | 0 (0.0%) |
| $750,000 to $999,999 | 0 (0.0%) | 0 (0.0%) |
| $1,000,000 or more | 0 (0.0%) | 0 (0.0%) |
| Total | 11 (100.0%) | 20 (100.0%) |
Household Income by Mortgage Status in Sellers
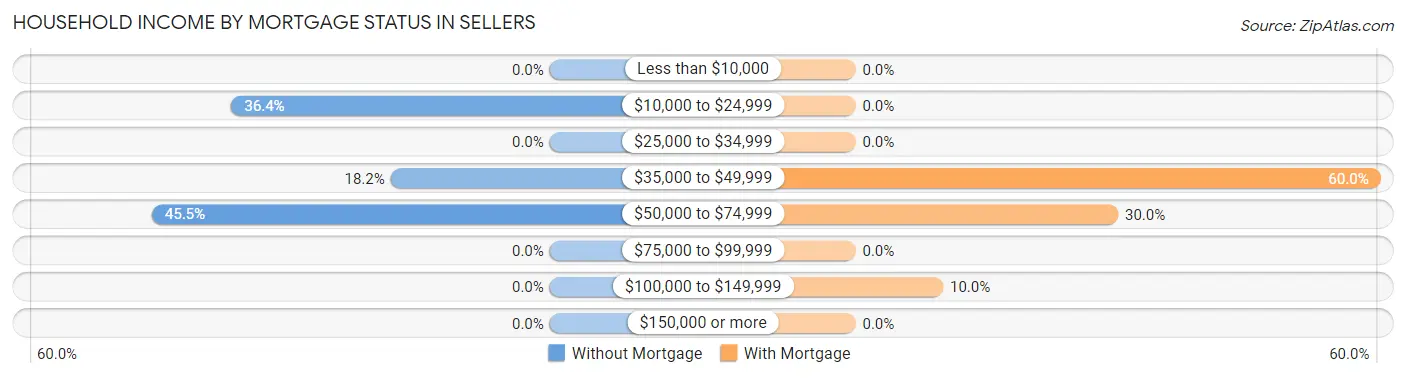
| Household Income | Without Mortgage | With Mortgage |
| Less than $10,000 | 0 (0.0%) | 0 (0.0%) |
| $10,000 to $24,999 | 4 (36.4%) | 0 (0.0%) |
| $25,000 to $34,999 | 0 (0.0%) | 0 (0.0%) |
| $35,000 to $49,999 | 2 (18.2%) | 12 (60.0%) |
| $50,000 to $74,999 | 5 (45.5%) | 6 (30.0%) |
| $75,000 to $99,999 | 0 (0.0%) | 0 (0.0%) |
| $100,000 to $149,999 | 0 (0.0%) | 2 (10.0%) |
| $150,000 or more | 0 (0.0%) | 0 (0.0%) |
| Total | 11 (100.0%) | 20 (100.0%) |
Property Value to Household Income Ratio in Sellers
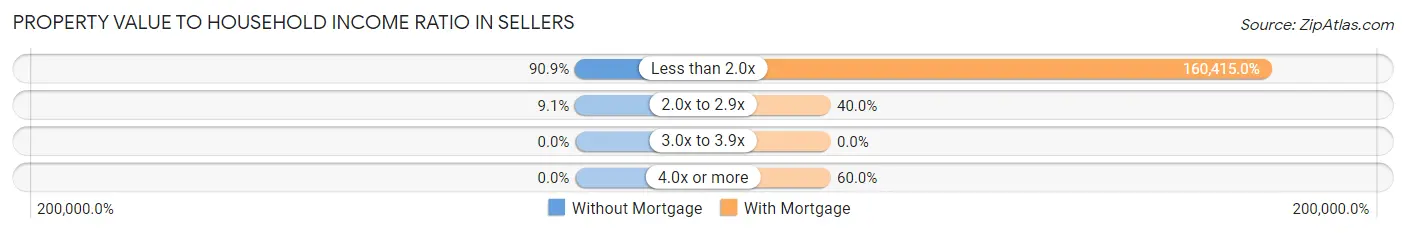
| Value-to-Income Ratio | Without Mortgage | With Mortgage |
| Less than 2.0x | 10 (90.9%) | 32,083 (160,415.0%) |
| 2.0x to 2.9x | 1 (9.1%) | 8 (40.0%) |
| 3.0x to 3.9x | 0 (0.0%) | 0 (0.0%) |
| 4.0x or more | 0 (0.0%) | 12 (60.0%) |
| Total | 11 (100.0%) | 20 (100.0%) |
Real Estate Taxes by Mortgage Status in Sellers
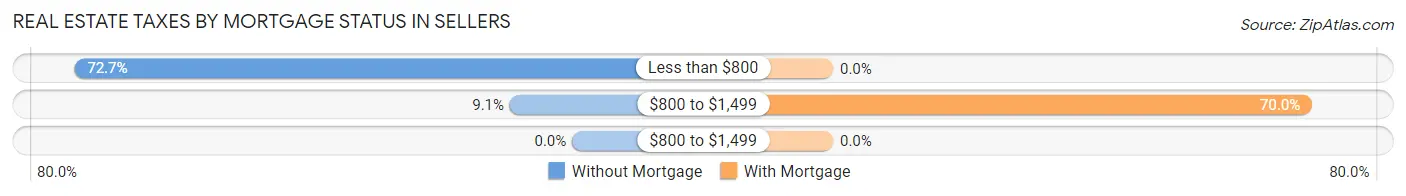
| Property Taxes | Without Mortgage | With Mortgage |
| Less than $800 | 8 (72.7%) | 0 (0.0%) |
| $800 to $1,499 | 1 (9.1%) | 14 (70.0%) |
| $800 to $1,499 | 0 (0.0%) | 0 (0.0%) |
| Total | 11 (100.0%) | 20 (100.0%) |
Health & Disability in Sellers
Health Insurance Coverage by Age in Sellers
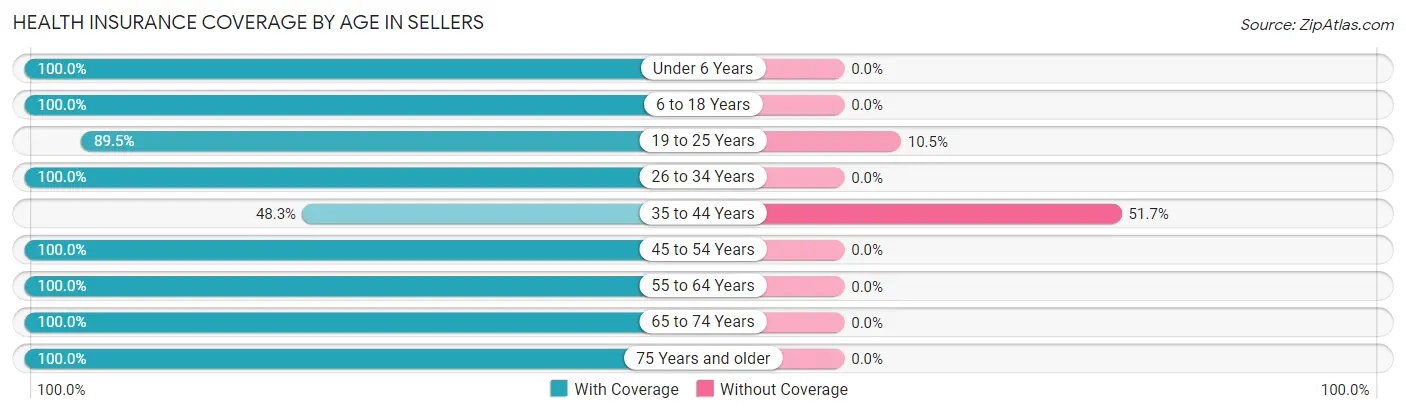
| Age Bracket | With Coverage | Without Coverage |
| Under 6 Years | 10 (100.0%) | 0 (0.0%) |
| 6 to 18 Years | 13 (100.0%) | 0 (0.0%) |
| 19 to 25 Years | 17 (89.5%) | 2 (10.5%) |
| 26 to 34 Years | 4 (100.0%) | 0 (0.0%) |
| 35 to 44 Years | 14 (48.3%) | 15 (51.7%) |
| 45 to 54 Years | 7 (100.0%) | 0 (0.0%) |
| 55 to 64 Years | 13 (100.0%) | 0 (0.0%) |
| 65 to 74 Years | 13 (100.0%) | 0 (0.0%) |
| 75 Years and older | 25 (100.0%) | 0 (0.0%) |
| Total | 116 (87.2%) | 17 (12.8%) |
Health Insurance Coverage by Citizenship Status in Sellers
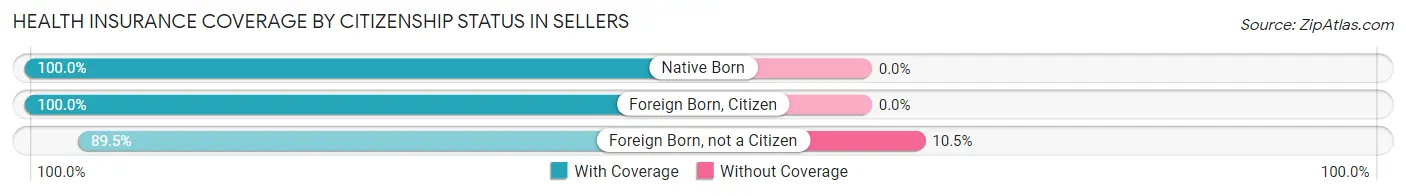
| Citizenship Status | With Coverage | Without Coverage |
| Native Born | 10 (100.0%) | 0 (0.0%) |
| Foreign Born, Citizen | 13 (100.0%) | 0 (0.0%) |
| Foreign Born, not a Citizen | 17 (89.5%) | 2 (10.5%) |
Health Insurance Coverage by Household Income in Sellers
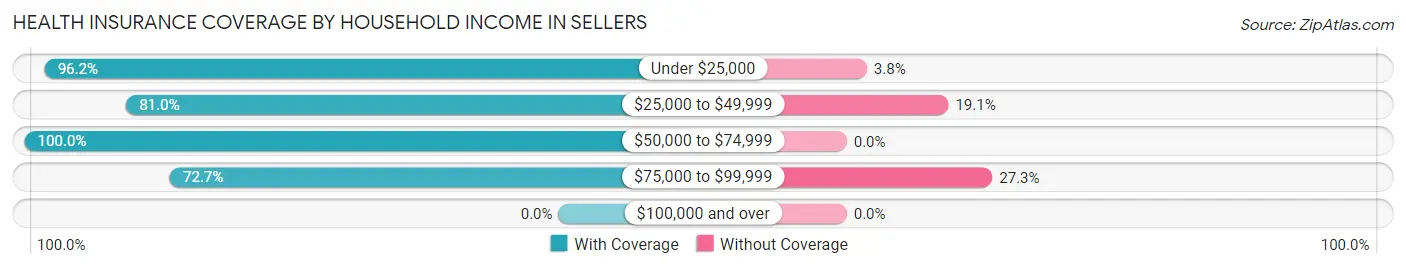
| Household Income | With Coverage | Without Coverage |
| Under $25,000 | 51 (96.2%) | 2 (3.8%) |
| $25,000 to $49,999 | 51 (80.9%) | 12 (19.1%) |
| $50,000 to $74,999 | 6 (100.0%) | 0 (0.0%) |
| $75,000 to $99,999 | 8 (72.7%) | 3 (27.3%) |
| $100,000 and over | 0 (0.0%) | 0 (0.0%) |
Public vs Private Health Insurance Coverage by Age in Sellers
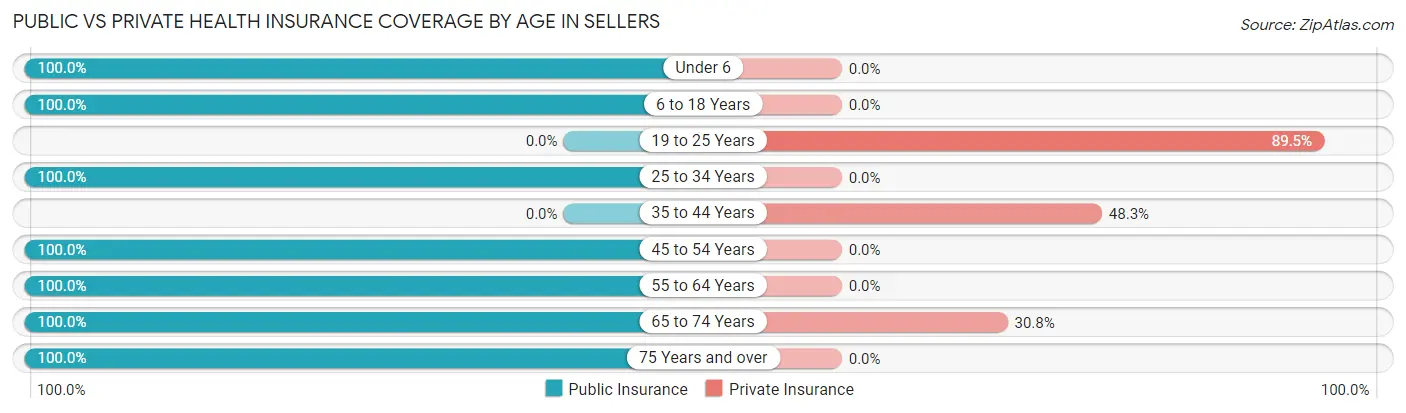
| Age Bracket | Public Insurance | Private Insurance |
| Under 6 | 10 (100.0%) | 0 (0.0%) |
| 6 to 18 Years | 13 (100.0%) | 0 (0.0%) |
| 19 to 25 Years | 0 (0.0%) | 17 (89.5%) |
| 25 to 34 Years | 4 (100.0%) | 0 (0.0%) |
| 35 to 44 Years | 0 (0.0%) | 14 (48.3%) |
| 45 to 54 Years | 7 (100.0%) | 0 (0.0%) |
| 55 to 64 Years | 13 (100.0%) | 0 (0.0%) |
| 65 to 74 Years | 13 (100.0%) | 4 (30.8%) |
| 75 Years and over | 25 (100.0%) | 0 (0.0%) |
| Total | 85 (63.9%) | 35 (26.3%) |
Disability Status by Sex by Age in Sellers
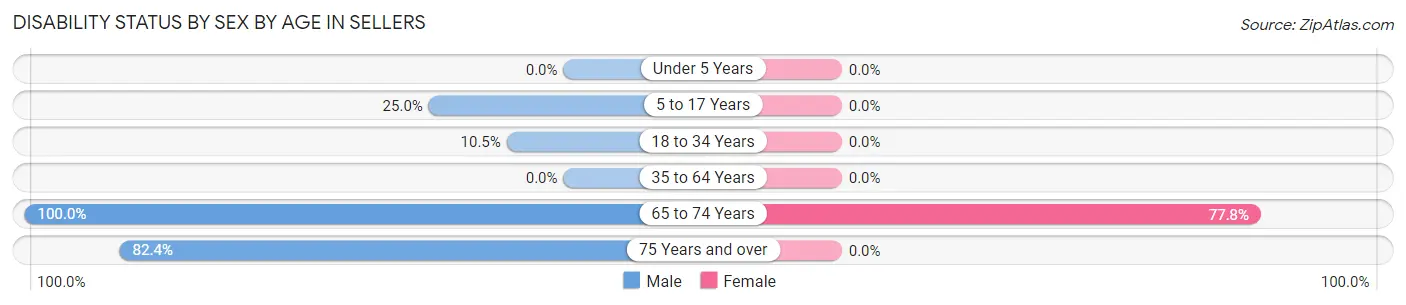
| Age Bracket | Male | Female |
| Under 5 Years | 0 (0.0%) | 0 (0.0%) |
| 5 to 17 Years | 2 (25.0%) | 0 (0.0%) |
| 18 to 34 Years | 2 (10.5%) | 0 (0.0%) |
| 35 to 64 Years | 0 (0.0%) | 0 (0.0%) |
| 65 to 74 Years | 4 (100.0%) | 7 (77.8%) |
| 75 Years and over | 14 (82.4%) | 0 (0.0%) |
Disability Class by Sex by Age in Sellers
Disability Class: Hearing Difficulty
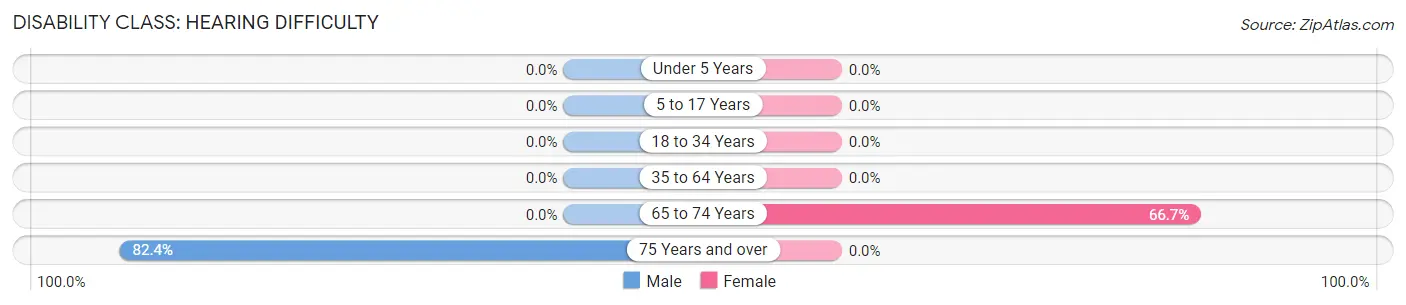
| Age Bracket | Male | Female |
| Under 5 Years | 0 (0.0%) | 0 (0.0%) |
| 5 to 17 Years | 0 (0.0%) | 0 (0.0%) |
| 18 to 34 Years | 0 (0.0%) | 0 (0.0%) |
| 35 to 64 Years | 0 (0.0%) | 0 (0.0%) |
| 65 to 74 Years | 0 (0.0%) | 6 (66.7%) |
| 75 Years and over | 14 (82.4%) | 0 (0.0%) |
Disability Class: Vision Difficulty
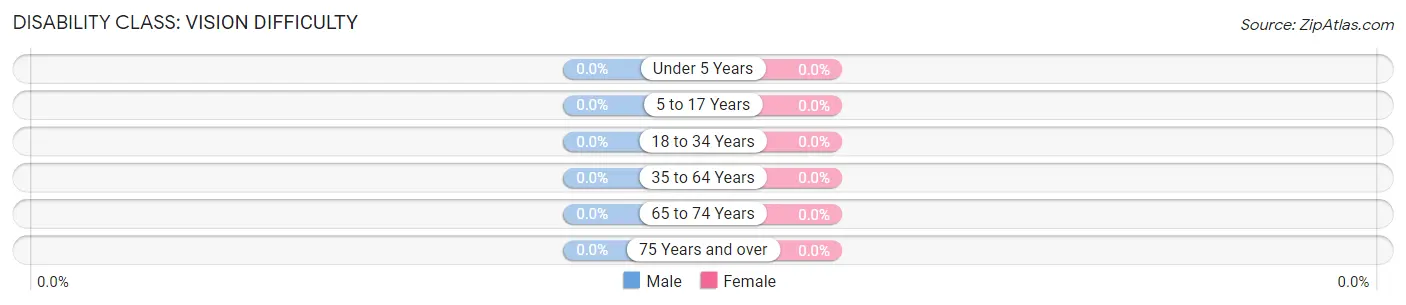
| Age Bracket | Male | Female |
| Under 5 Years | 0 (0.0%) | 0 (0.0%) |
| 5 to 17 Years | 0 (0.0%) | 0 (0.0%) |
| 18 to 34 Years | 0 (0.0%) | 0 (0.0%) |
| 35 to 64 Years | 0 (0.0%) | 0 (0.0%) |
| 65 to 74 Years | 0 (0.0%) | 0 (0.0%) |
| 75 Years and over | 0 (0.0%) | 0 (0.0%) |
Disability Class: Cognitive Difficulty
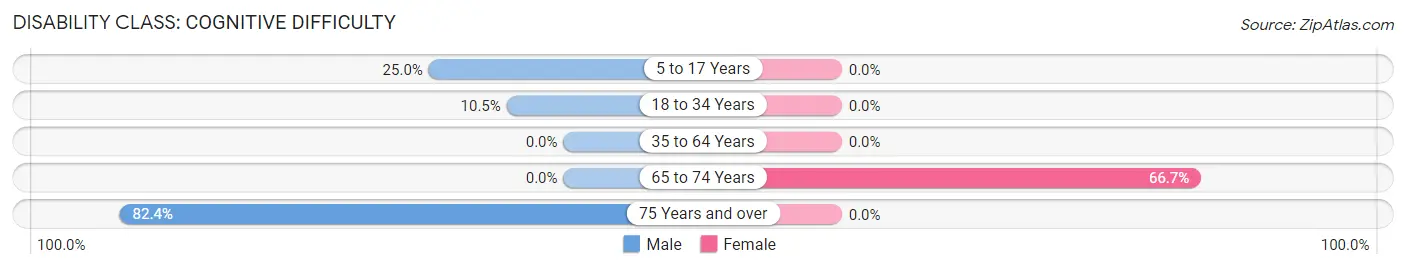
| Age Bracket | Male | Female |
| 5 to 17 Years | 2 (25.0%) | 0 (0.0%) |
| 18 to 34 Years | 2 (10.5%) | 0 (0.0%) |
| 35 to 64 Years | 0 (0.0%) | 0 (0.0%) |
| 65 to 74 Years | 0 (0.0%) | 6 (66.7%) |
| 75 Years and over | 14 (82.4%) | 0 (0.0%) |
Disability Class: Ambulatory Difficulty
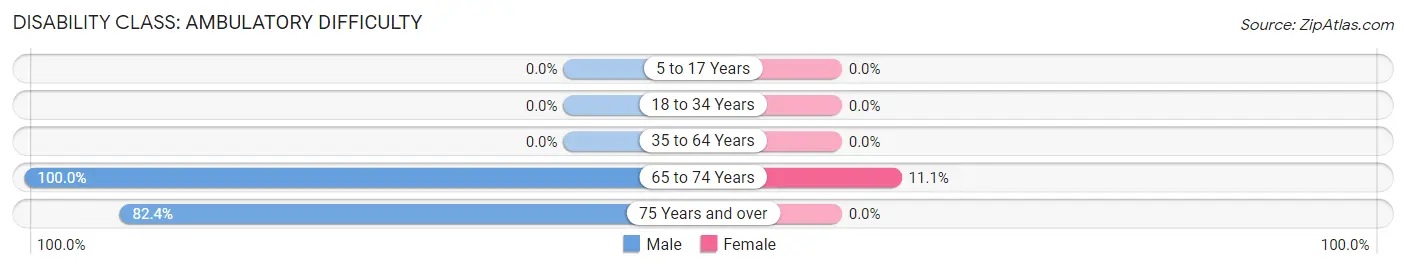
| Age Bracket | Male | Female |
| 5 to 17 Years | 0 (0.0%) | 0 (0.0%) |
| 18 to 34 Years | 0 (0.0%) | 0 (0.0%) |
| 35 to 64 Years | 0 (0.0%) | 0 (0.0%) |
| 65 to 74 Years | 4 (100.0%) | 1 (11.1%) |
| 75 Years and over | 14 (82.4%) | 0 (0.0%) |
Disability Class: Self-Care Difficulty
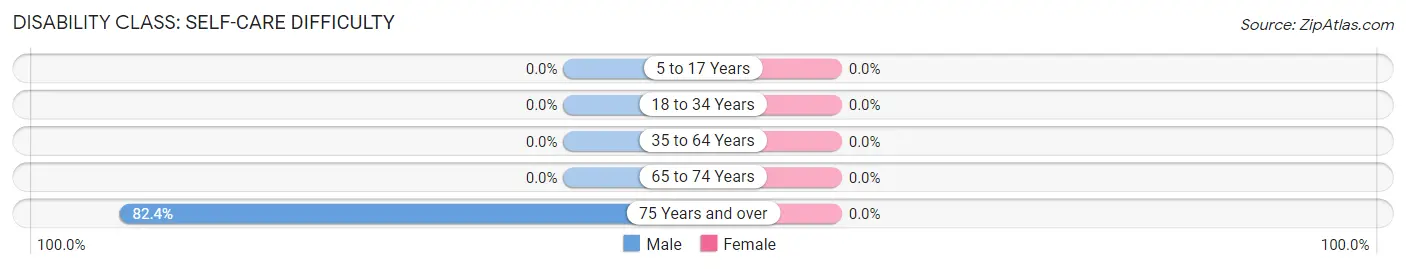
| Age Bracket | Male | Female |
| 5 to 17 Years | 0 (0.0%) | 0 (0.0%) |
| 18 to 34 Years | 0 (0.0%) | 0 (0.0%) |
| 35 to 64 Years | 0 (0.0%) | 0 (0.0%) |
| 65 to 74 Years | 0 (0.0%) | 0 (0.0%) |
| 75 Years and over | 14 (82.4%) | 0 (0.0%) |
Technology Access in Sellers
Computing Device Access in Sellers
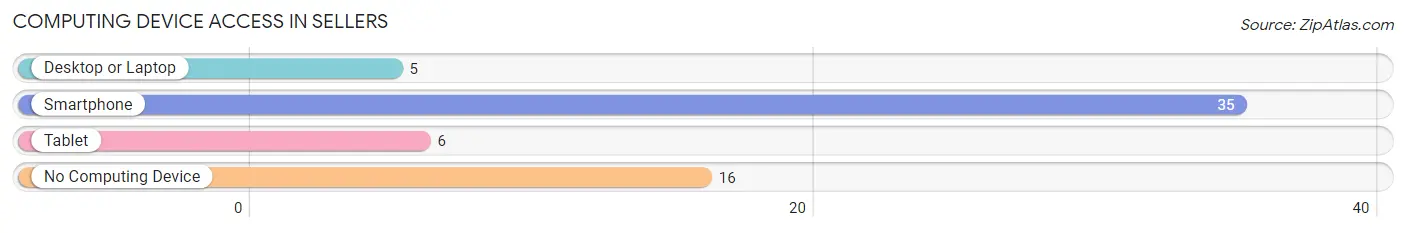
| Device Type | # Households | % Households |
| Desktop or Laptop | 5 | 9.6% |
| Smartphone | 35 | 67.3% |
| Tablet | 6 | 11.5% |
| No Computing Device | 16 | 30.8% |
| Total | 52 | 100.0% |
Internet Access in Sellers
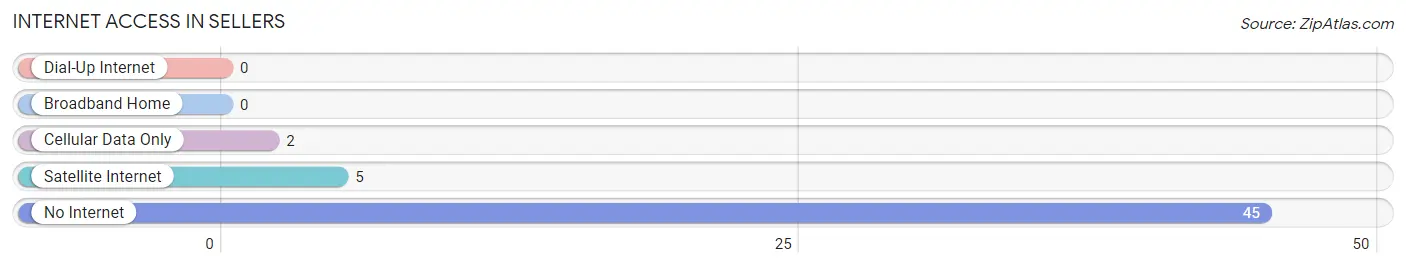
| Internet Type | # Households | % Households |
| Dial-Up Internet | 0 | 0.0% |
| Broadband Home | 0 | 0.0% |
| Cellular Data Only | 2 | 3.8% |
| Satellite Internet | 5 | 9.6% |
| No Internet | 45 | 86.5% |
| Total | 52 | 100.0% |
Sellers Summary
Sellers, South Carolina is a small town located in the Pee Dee region of the state. It is situated in Marion County, approximately 20 miles south of Florence and 40 miles north of Myrtle Beach. The town was founded in 1891 and named after the Sellers family, who were among the first settlers in the area. As of the 2010 census, the population of Sellers was 1,072.
History
The area that is now Sellers was first settled in the late 1700s by the Sellers family, who were among the first settlers in the area. The town was officially founded in 1891 and named after the Sellers family. The town was originally a farming community, with cotton and tobacco being the main crops. In the early 1900s, the town began to grow and develop, with the construction of a railroad line and the opening of a post office.
In the 1920s, Sellers began to experience a period of growth and prosperity. The town was home to several businesses, including a cotton gin, a sawmill, a grist mill, and a general store. The town also had a school, a bank, and a hotel.
Geography
Sellers is located in the Pee Dee region of South Carolina, approximately 20 miles south of Florence and 40 miles north of Myrtle Beach. The town is situated in Marion County, and is bordered by the towns of Mullins, Marion, and Nichols. The town is located on the banks of the Great Pee Dee River, and is surrounded by a number of small lakes and ponds.
Economy
The economy of Sellers is largely based on agriculture. The town is home to several farms, which produce a variety of crops, including cotton, tobacco, soybeans, corn, and peanuts. The town is also home to several small businesses, including a grocery store, a hardware store, and a gas station.
Demographics
As of the 2010 census, the population of Sellers was 1,072. The racial makeup of the town was 79.2% White, 17.7% African American, 0.3% Native American, 0.2% Asian, 0.1% Pacific Islander, 1.2% from other races, and 1.5% from two or more races. Hispanic or Latino of any race were 2.2% of the population.
The median income for a household in Sellers was $25,938, and the median income for a family was $31,250. The per capita income for the town was $13,845. About 18.2% of families and 22.2% of the population were below the poverty line, including 28.3% of those under age 18 and 16.7% of those age 65 or over.
Common Questions
What is Per Capita Income in Sellers?
Per Capita income in Sellers is $13,838.
What is the Median Household income in Sellers?
Median Household Income in Sellers is $31,667.
What is Inequality or Gini Index in Sellers?
Inequality or Gini Index in Sellers is 0.36.
What is the Total Population of Sellers?
Total Population of Sellers is 133.
What is the Total Male Population of Sellers?
Total Male Population of Sellers is 94.
What is the Total Female Population of Sellers?
Total Female Population of Sellers is 39.
What is the Ratio of Males per 100 Females in Sellers?
There are 241.03 Males per 100 Females in Sellers.
What is the Ratio of Females per 100 Males in Sellers?
There are 41.49 Females per 100 Males in Sellers.
What is the Median Population Age in Sellers?
Median Population Age in Sellers is 42.6 Years.
What is the Average Family Size in Sellers
Average Family Size in Sellers is 3.0 People.
What is the Average Household Size in Sellers
Average Household Size in Sellers is 2.6 People.
How Large is the Labor Force in Sellers?
There are 36 People in the Labor Forcein in Sellers.
What is the Percentage of People in the Labor Force in Sellers?
32.7% of People are in the Labor Force in Sellers.