Dillon, SC Map & Demographics
Dillon Map
Dillon Overview
$23,122
PER CAPITA INCOME
$33,686
AVG FAMILY INCOME
$34,086
AVG HOUSEHOLD INCOME
40.5%
WAGE / INCOME GAP [ % ]
59.5¢/ $1
WAGE / INCOME GAP [ $ ]
$9,335
FAMILY INCOME DEFICIT
0.50
INEQUALITY / GINI INDEX
6,454
TOTAL POPULATION
3,205
MALE POPULATION
3,249
FEMALE POPULATION
98.65
MALES / 100 FEMALES
101.37
FEMALES / 100 MALES
30.7
MEDIAN AGE
3.0
AVG FAMILY SIZE
2.6
AVG HOUSEHOLD SIZE
2,677
LABOR FORCE [ PEOPLE ]
57.5%
PERCENT IN LABOR FORCE
3.9%
UNEMPLOYMENT RATE
Dillon Zip Codes
Dillon Area Codes
Income in Dillon
Income Overview in Dillon
Per Capita Income in Dillon is $23,122, while median incomes of families and households are $33,686 and $34,086 respectively.
| Characteristic | Number | Measure |
| Per Capita Income | 6,454 | $23,122 |
| Median Family Income | 1,804 | $33,686 |
| Mean Family Income | 1,804 | $64,441 |
| Median Household Income | 2,376 | $34,086 |
| Mean Household Income | 2,376 | $57,871 |
| Income Deficit | 1,804 | $9,335 |
| Wage / Income Gap (%) | 6,454 | 40.46% |
| Wage / Income Gap ($) | 6,454 | 59.54¢ per $1 |
| Gini / Inequality Index | 6,454 | 0.50 |
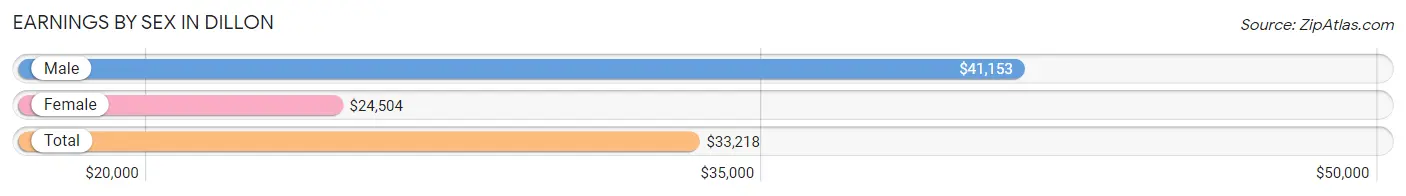
Earnings by Sex in Dillon
Average Earnings in Dillon are $33,218, $41,153 for men and $24,504 for women, a difference of 40.5%.
| Sex | Number | Average Earnings |
| Male | 1,224 (43.0%) | $41,153 |
| Female | 1,620 (57.0%) | $24,504 |
| Total | 2,844 (100.0%) | $33,218 |
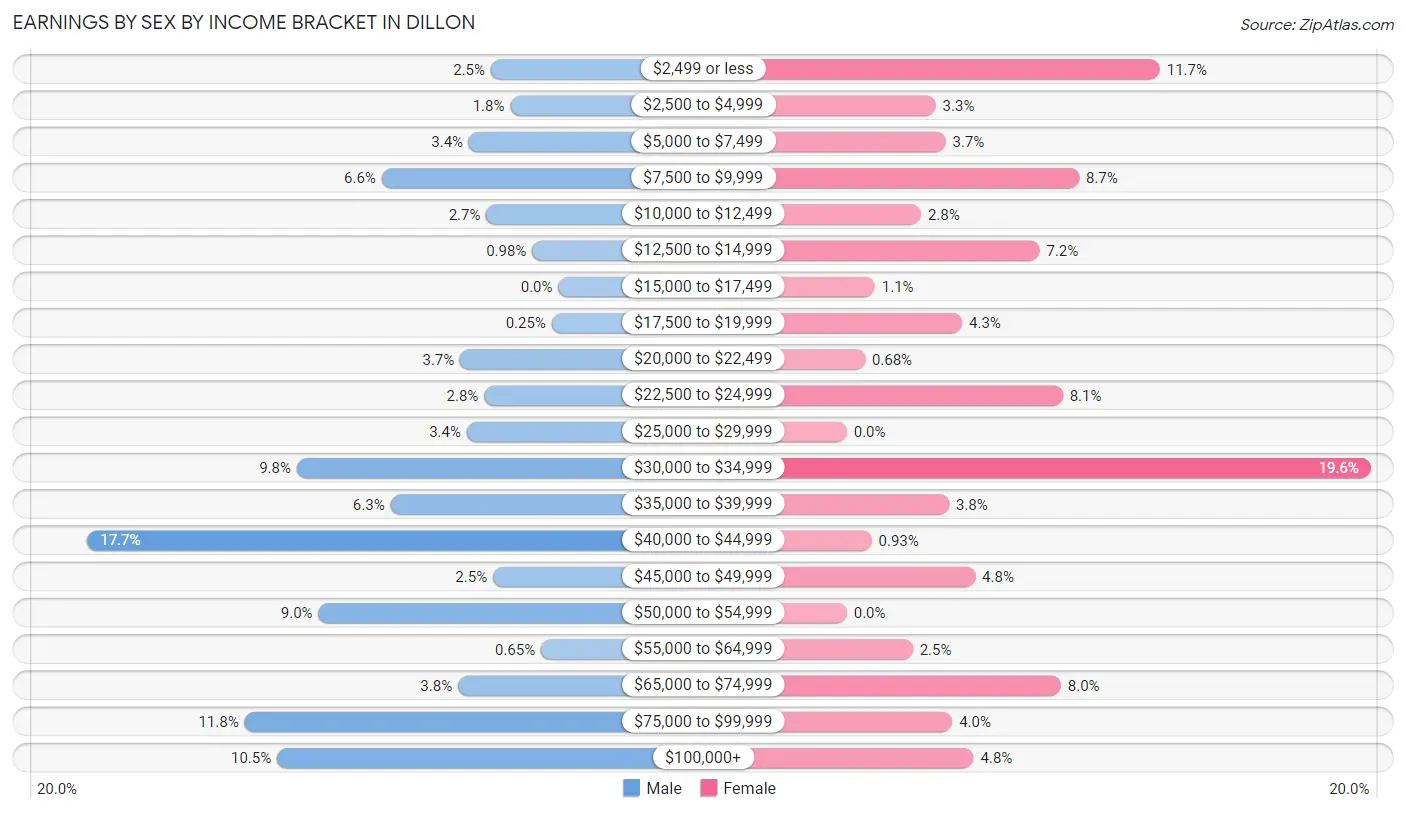
Earnings by Sex by Income Bracket in Dillon
The most common earnings brackets in Dillon are $40,000 to $44,999 for men (216 | 17.6%) and $30,000 to $34,999 for women (318 | 19.6%).
| Income | Male | Female |
| $2,499 or less | 31 (2.5%) | 190 (11.7%) |
| $2,500 to $4,999 | 22 (1.8%) | 54 (3.3%) |
| $5,000 to $7,499 | 41 (3.4%) | 60 (3.7%) |
| $7,500 to $9,999 | 81 (6.6%) | 141 (8.7%) |
| $10,000 to $12,499 | 33 (2.7%) | 45 (2.8%) |
| $12,500 to $14,999 | 12 (1.0%) | 117 (7.2%) |
| $15,000 to $17,499 | 0 (0.0%) | 17 (1.1%) |
| $17,500 to $19,999 | 3 (0.3%) | 70 (4.3%) |
| $20,000 to $22,499 | 45 (3.7%) | 11 (0.7%) |
| $22,500 to $24,999 | 34 (2.8%) | 131 (8.1%) |
| $25,000 to $29,999 | 42 (3.4%) | 0 (0.0%) |
| $30,000 to $34,999 | 120 (9.8%) | 318 (19.6%) |
| $35,000 to $39,999 | 77 (6.3%) | 62 (3.8%) |
| $40,000 to $44,999 | 216 (17.6%) | 15 (0.9%) |
| $45,000 to $49,999 | 30 (2.5%) | 78 (4.8%) |
| $50,000 to $54,999 | 110 (9.0%) | 0 (0.0%) |
| $55,000 to $64,999 | 8 (0.6%) | 40 (2.5%) |
| $65,000 to $74,999 | 46 (3.8%) | 130 (8.0%) |
| $75,000 to $99,999 | 144 (11.8%) | 64 (4.0%) |
| $100,000+ | 129 (10.5%) | 77 (4.8%) |
| Total | 1,224 (100.0%) | 1,620 (100.0%) |
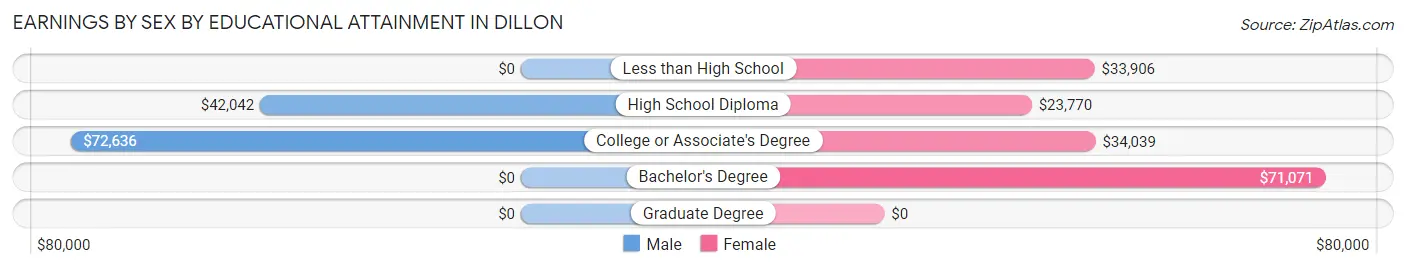
Earnings by Sex by Educational Attainment in Dillon
Average earnings in Dillon are $41,388 for men and $33,636 for women, a difference of 18.7%. Men with an educational attainment of college or associate's degree enjoy the highest average annual earnings of $72,636, while those with high school diploma education earn the least with $42,042. Women with an educational attainment of bachelor's degree earn the most with the average annual earnings of $71,071, while those with high school diploma education have the smallest earnings of $23,770.
| Educational Attainment | Male Income | Female Income |
| Less than High School | - | - |
| High School Diploma | $42,042 | $23,770 |
| College or Associate's Degree | $72,636 | $34,039 |
| Bachelor's Degree | - | - |
| Graduate Degree | - | - |
| Total | $41,388 | $33,636 |
Family Income in Dillon
Family Income Brackets in Dillon
According to the Dillon family income data, there are 375 families falling into the $10,000 to $14,999 income range, which is the most common income bracket and makes up 20.8% of all families. Conversely, the $35,000 to $49,999 income bracket is the least frequent group with only 85 families (4.7%) belonging to this category.
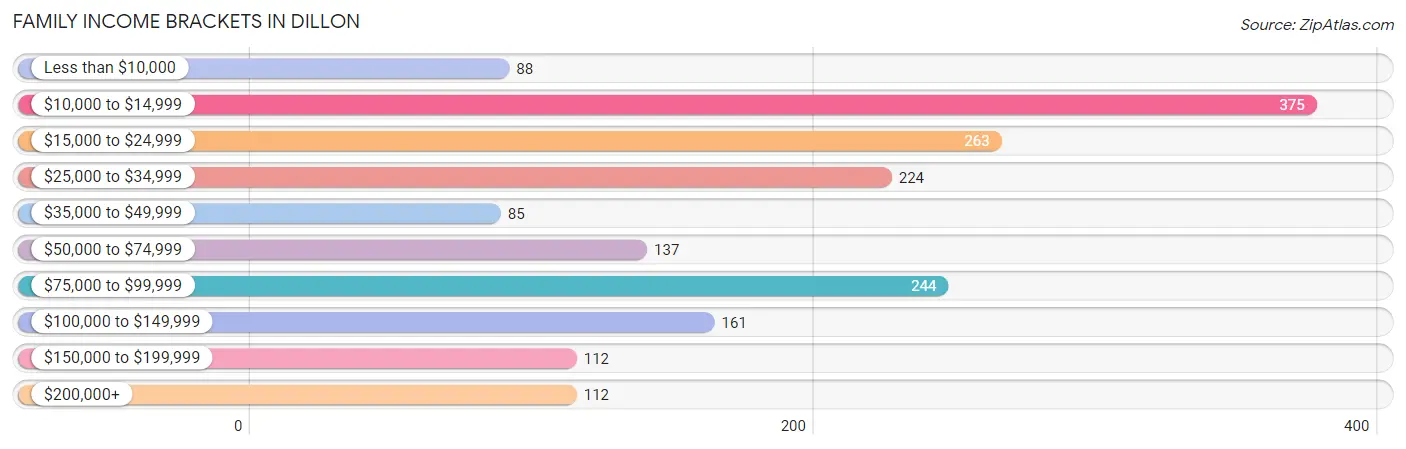
| Income Bracket | # Families | % Families |
| Less than $10,000 | 88 | 4.9% |
| $10,000 to $14,999 | 375 | 20.8% |
| $15,000 to $24,999 | 263 | 14.6% |
| $25,000 to $34,999 | 224 | 12.4% |
| $35,000 to $49,999 | 85 | 4.7% |
| $50,000 to $74,999 | 137 | 7.6% |
| $75,000 to $99,999 | 244 | 13.5% |
| $100,000 to $149,999 | 161 | 8.9% |
| $150,000 to $199,999 | 112 | 6.2% |
| $200,000+ | 112 | 6.2% |
Family Income by Famaliy Size in Dillon
5-person families (128 | 7.1%) account for the highest median family income in Dillon with $82,619 per family, while 2-person families (858 | 47.6%) have the highest median income of $19,306 per family member.
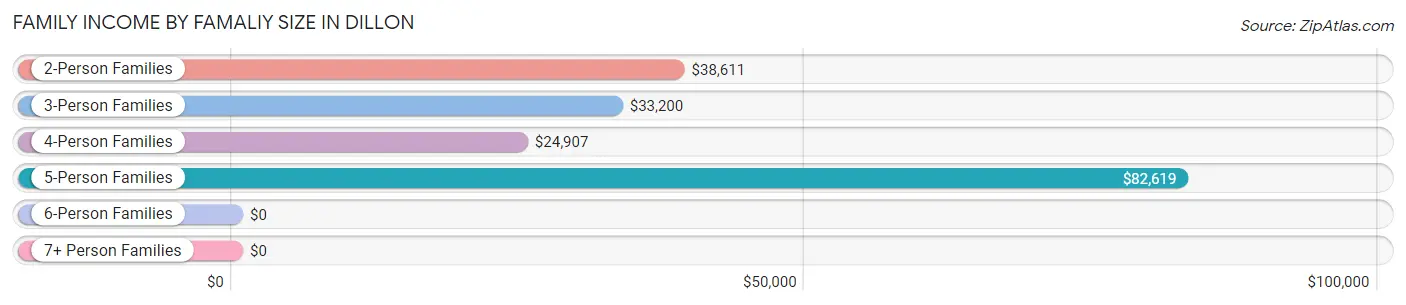
| Income Bracket | # Families | Median Income |
| 2-Person Families | 858 (47.6%) | $38,611 |
| 3-Person Families | 458 (25.4%) | $33,200 |
| 4-Person Families | 338 (18.7%) | $24,907 |
| 5-Person Families | 128 (7.1%) | $82,619 |
| 6-Person Families | 22 (1.2%) | $0 |
| 7+ Person Families | 0 (0.0%) | $0 |
| Total | 1,804 (100.0%) | $33,686 |
Family Income by Number of Earners in Dillon
The median family income in Dillon is $33,686, with families comprising 3+ earners (149) having the highest median family income of $250,001, while families with 1 earner (1,036) have the lowest median family income of $23,515, accounting for 8.3% and 57.4% of families, respectively.
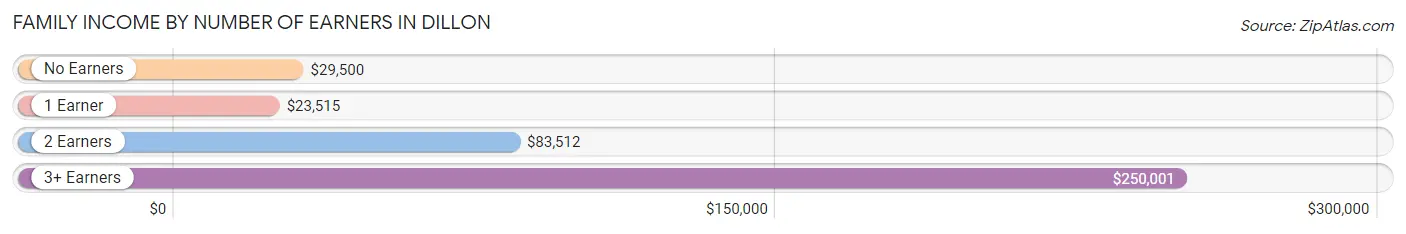
| Number of Earners | # Families | Median Income |
| No Earners | 256 (14.2%) | $29,500 |
| 1 Earner | 1,036 (57.4%) | $23,515 |
| 2 Earners | 363 (20.1%) | $83,512 |
| 3+ Earners | 149 (8.3%) | $250,001 |
| Total | 1,804 (100.0%) | $33,686 |
Household Income in Dillon
Household Income Brackets in Dillon
With 423 households falling in the category, the $25,000 to $34,999 income range is the most frequent in Dillon, accounting for 17.8% of all households. In contrast, only 112 households (4.7%) fall into the $150,000 to $199,999 income bracket, making it the least populous group.
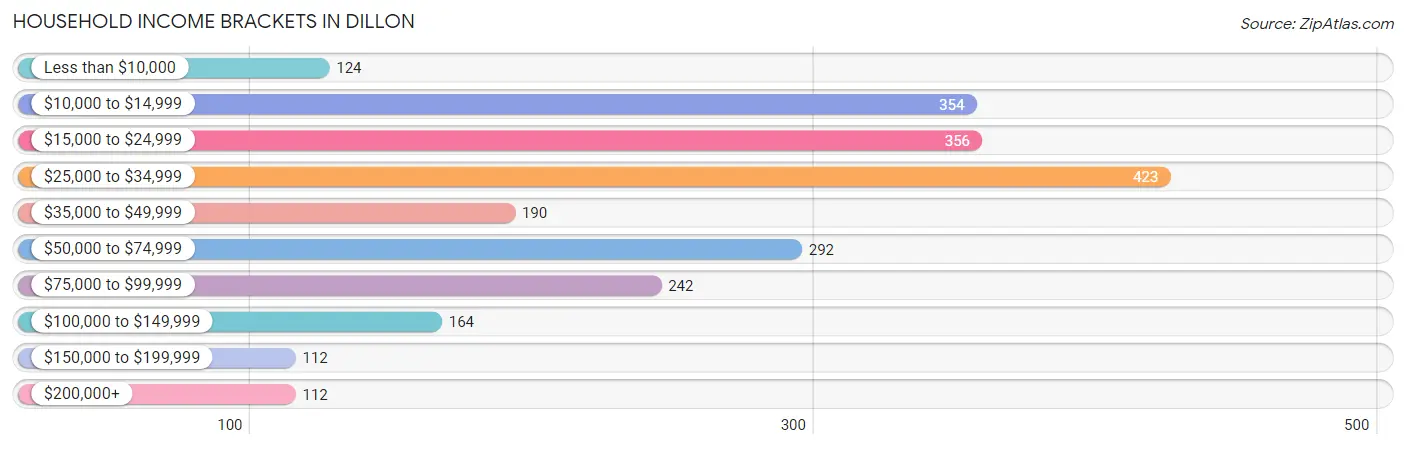
| Income Bracket | # Households | % Households |
| Less than $10,000 | 124 | 5.2% |
| $10,000 to $14,999 | 354 | 14.9% |
| $15,000 to $24,999 | 356 | 15.0% |
| $25,000 to $34,999 | 423 | 17.8% |
| $35,000 to $49,999 | 190 | 8.0% |
| $50,000 to $74,999 | 292 | 12.3% |
| $75,000 to $99,999 | 242 | 10.2% |
| $100,000 to $149,999 | 164 | 6.9% |
| $150,000 to $199,999 | 112 | 4.7% |
| $200,000+ | 112 | 4.7% |
Household Income by Householder Age in Dillon
The median household income in Dillon is $34,086, with the highest median household income of $42,788 found in the 65+ years age bracket for the primary householder. A total of 586 households (24.7%) fall into this category. Meanwhile, the 15 to 24 years age bracket for the primary householder has the lowest median household income of $0, with 178 households (7.5%) in this group.
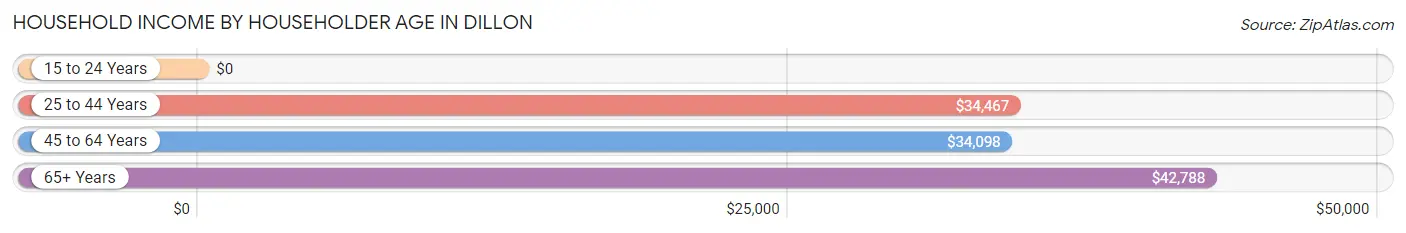
| Income Bracket | # Households | Median Income |
| 15 to 24 Years | 178 (7.5%) | $0 |
| 25 to 44 Years | 826 (34.8%) | $34,467 |
| 45 to 64 Years | 786 (33.1%) | $34,098 |
| 65+ Years | 586 (24.7%) | $42,788 |
| Total | 2,376 (100.0%) | $34,086 |
Poverty in Dillon
Income Below Poverty by Sex and Age in Dillon
With 44.7% poverty level for males and 34.6% for females among the residents of Dillon, 12 to 14 year old males and 5 year old females are the most vulnerable to poverty, with 65 males (100.0%) and 6 females (100.0%) in their respective age groups living below the poverty level.
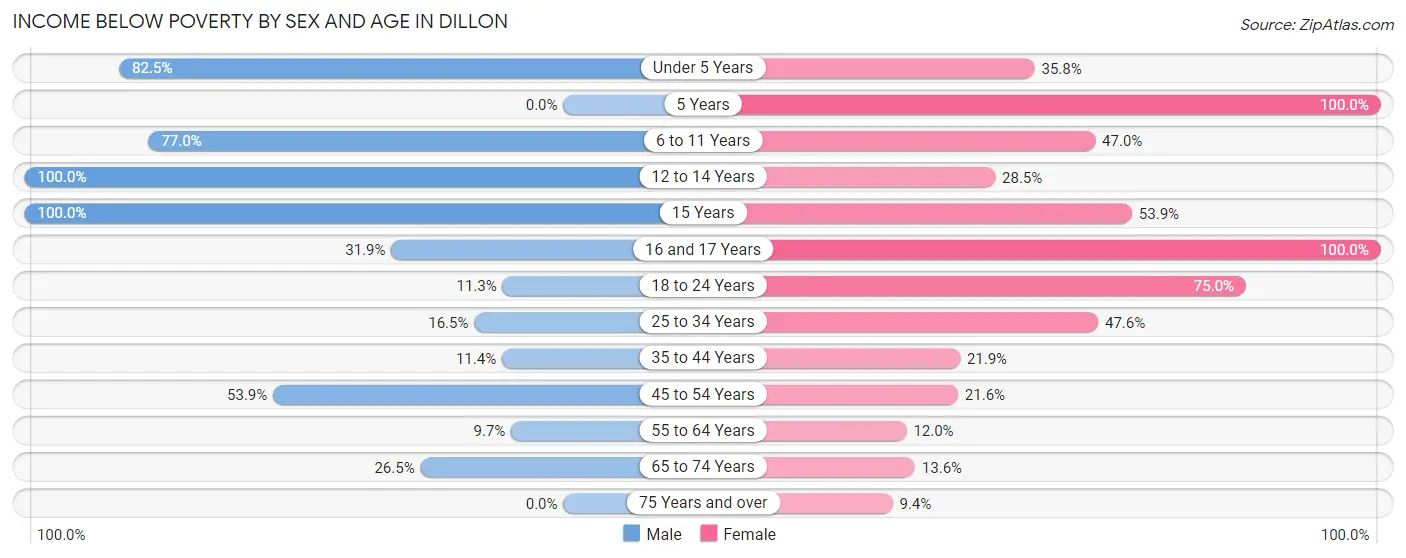
| Age Bracket | Male | Female |
| Under 5 Years | 559 (82.5%) | 83 (35.8%) |
| 5 Years | 0 (0.0%) | 6 (100.0%) |
| 6 to 11 Years | 288 (77.0%) | 95 (47.0%) |
| 12 to 14 Years | 65 (100.0%) | 37 (28.5%) |
| 15 Years | 11 (100.0%) | 35 (53.8%) |
| 16 and 17 Years | 53 (31.9%) | 13 (100.0%) |
| 18 to 24 Years | 7 (11.3%) | 363 (75.0%) |
| 25 to 34 Years | 80 (16.5%) | 215 (47.6%) |
| 35 to 44 Years | 27 (11.4%) | 82 (21.9%) |
| 45 to 54 Years | 195 (53.9%) | 50 (21.5%) |
| 55 to 64 Years | 24 (9.7%) | 57 (12.0%) |
| 65 to 74 Years | 70 (26.5%) | 38 (13.6%) |
| 75 Years and over | 0 (0.0%) | 21 (9.4%) |
| Total | 1,379 (44.7%) | 1,095 (34.6%) |
Income Above Poverty by Sex and Age in Dillon
According to the poverty statistics in Dillon, males aged 5 years and females aged 75 years and over are the age groups that are most secure financially, with 100.0% of males and 90.6% of females in these age groups living above the poverty line.
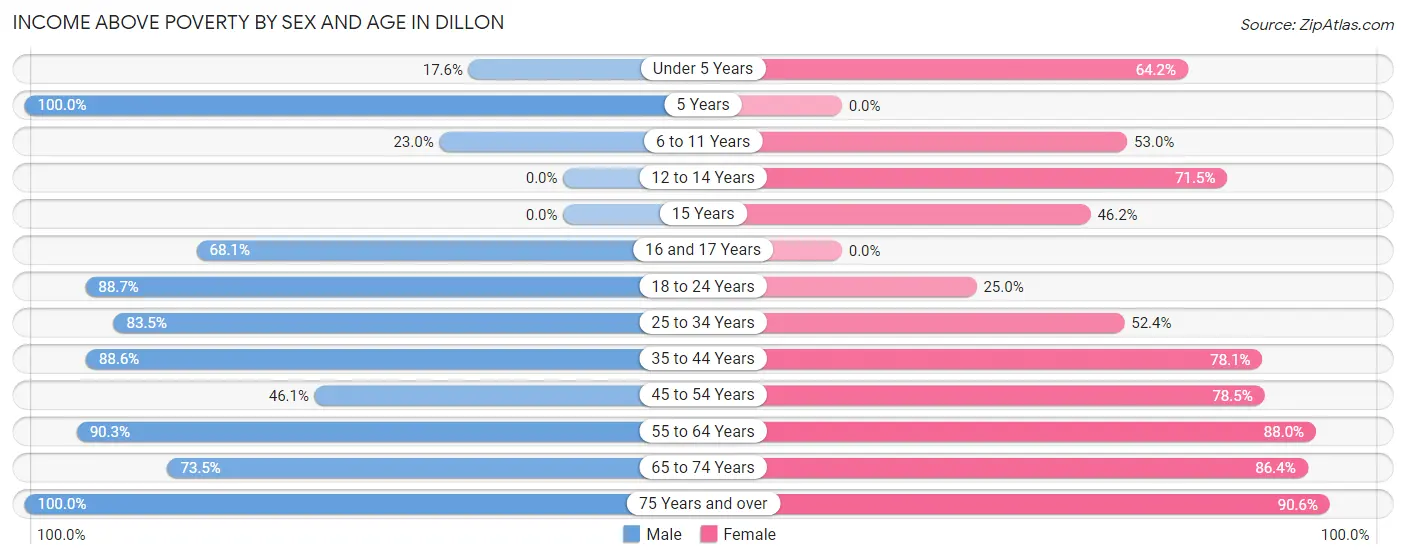
| Age Bracket | Male | Female |
| Under 5 Years | 119 (17.5%) | 149 (64.2%) |
| 5 Years | 11 (100.0%) | 0 (0.0%) |
| 6 to 11 Years | 86 (23.0%) | 107 (53.0%) |
| 12 to 14 Years | 0 (0.0%) | 93 (71.5%) |
| 15 Years | 0 (0.0%) | 30 (46.2%) |
| 16 and 17 Years | 113 (68.1%) | 0 (0.0%) |
| 18 to 24 Years | 55 (88.7%) | 121 (25.0%) |
| 25 to 34 Years | 404 (83.5%) | 237 (52.4%) |
| 35 to 44 Years | 210 (88.6%) | 292 (78.1%) |
| 45 to 54 Years | 167 (46.1%) | 182 (78.4%) |
| 55 to 64 Years | 224 (90.3%) | 418 (88.0%) |
| 65 to 74 Years | 194 (73.5%) | 242 (86.4%) |
| 75 Years and over | 120 (100.0%) | 202 (90.6%) |
| Total | 1,703 (55.3%) | 2,073 (65.4%) |
Income Below Poverty Among Married-Couple Families in Dillon
The poverty statistics for married-couple families in Dillon show that 24.6% or 238 of the total 968 families live below the poverty line. Families with 3 or 4 children have the highest poverty rate of 100.0%, comprising of 12 families. On the other hand, families with no children have the lowest poverty rate of 22.8%, which includes 151 families.
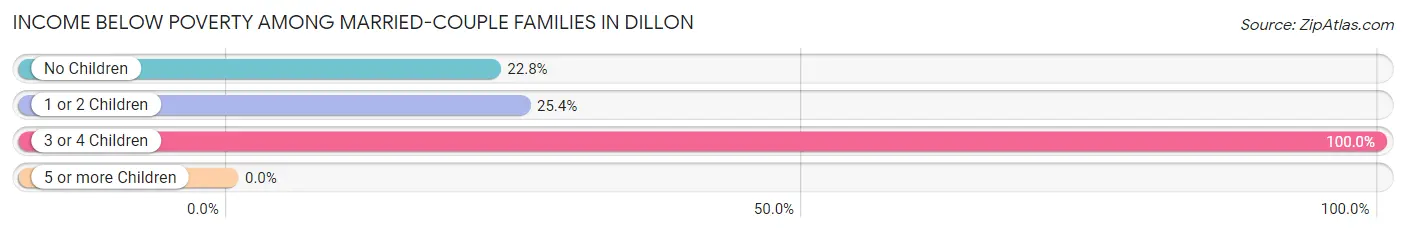
| Children | Above Poverty | Below Poverty |
| No Children | 510 (77.2%) | 151 (22.8%) |
| 1 or 2 Children | 220 (74.6%) | 75 (25.4%) |
| 3 or 4 Children | 0 (0.0%) | 12 (100.0%) |
| 5 or more Children | 0 (0.0%) | 0 (0.0%) |
| Total | 730 (75.4%) | 238 (24.6%) |
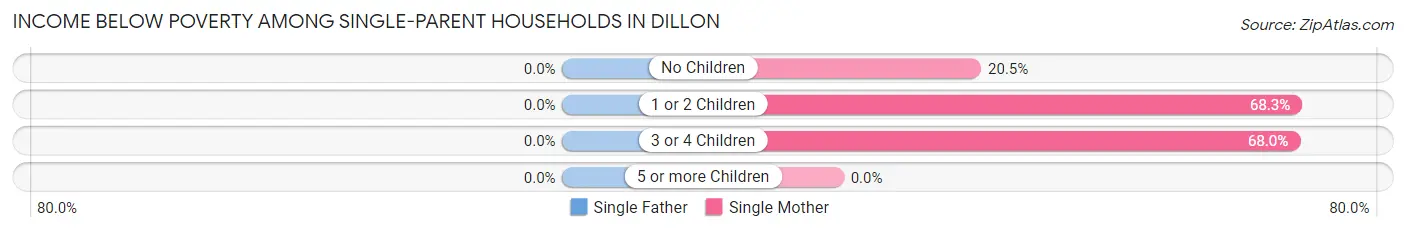
Income Below Poverty Among Single-Parent Households in Dillon
| Children | Single Father | Single Mother |
| No Children | 0 (0.0%) | 34 (20.5%) |
| 1 or 2 Children | 0 (0.0%) | 278 (68.3%) |
| 3 or 4 Children | 0 (0.0%) | 136 (68.0%) |
| 5 or more Children | 0 (0.0%) | 0 (0.0%) |
| Total | 0 (0.0%) | 448 (58.0%) |
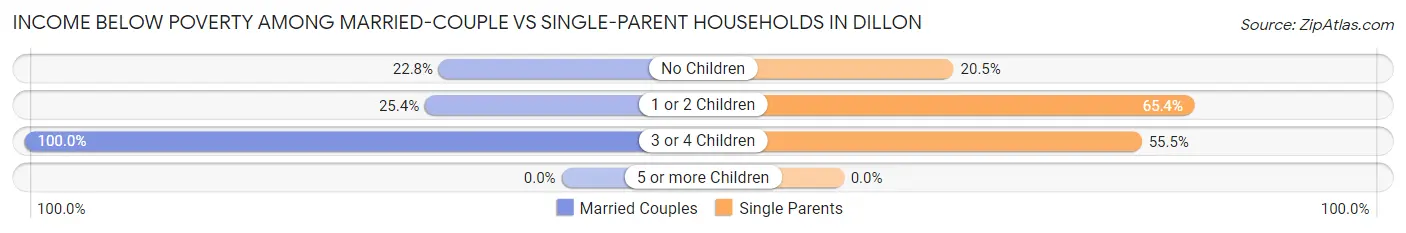
Income Below Poverty Among Married-Couple vs Single-Parent Households in Dillon
The poverty data for Dillon shows that 238 of the married-couple family households (24.6%) and 448 of the single-parent households (53.6%) are living below the poverty level. Within the married-couple family households, those with 3 or 4 children have the highest poverty rate, with 12 households (100.0%) falling below the poverty line. Among the single-parent households, those with 1 or 2 children have the highest poverty rate, with 278 household (65.4%) living below poverty.
| Children | Married-Couple Families | Single-Parent Households |
| No Children | 151 (22.8%) | 34 (20.5%) |
| 1 or 2 Children | 75 (25.4%) | 278 (65.4%) |
| 3 or 4 Children | 12 (100.0%) | 136 (55.5%) |
| 5 or more Children | 0 (0.0%) | 0 (0.0%) |
| Total | 238 (24.6%) | 448 (53.6%) |
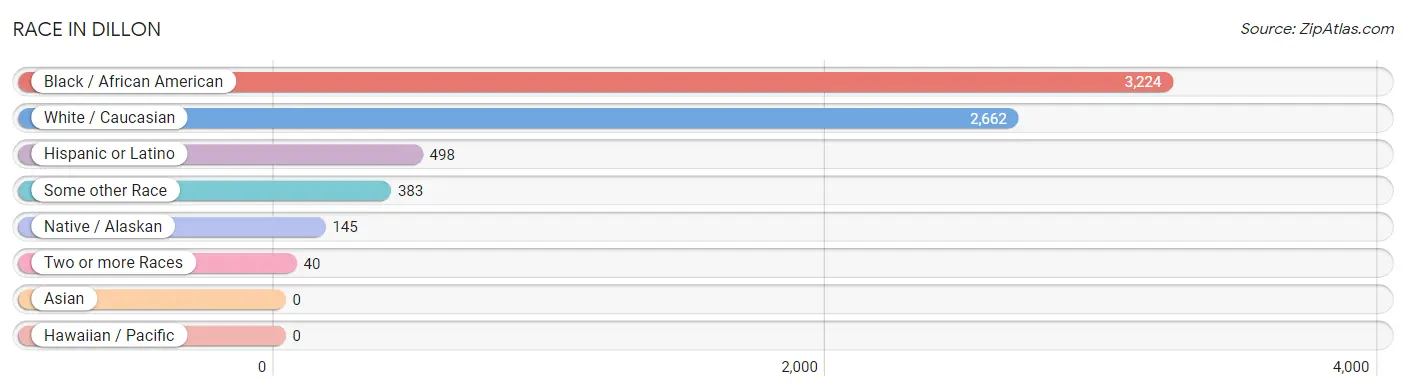
Race in Dillon
The most populous races in Dillon are Black / African American (3,224 | 49.9%), White / Caucasian (2,662 | 41.2%), and Hispanic or Latino (498 | 7.7%).
| Race | # Population | % Population |
| Asian | 0 | 0.0% |
| Black / African American | 3,224 | 49.9% |
| Hawaiian / Pacific | 0 | 0.0% |
| Hispanic or Latino | 498 | 7.7% |
| Native / Alaskan | 145 | 2.2% |
| White / Caucasian | 2,662 | 41.2% |
| Two or more Races | 40 | 0.6% |
| Some other Race | 383 | 5.9% |
| Total | 6,454 | 100.0% |
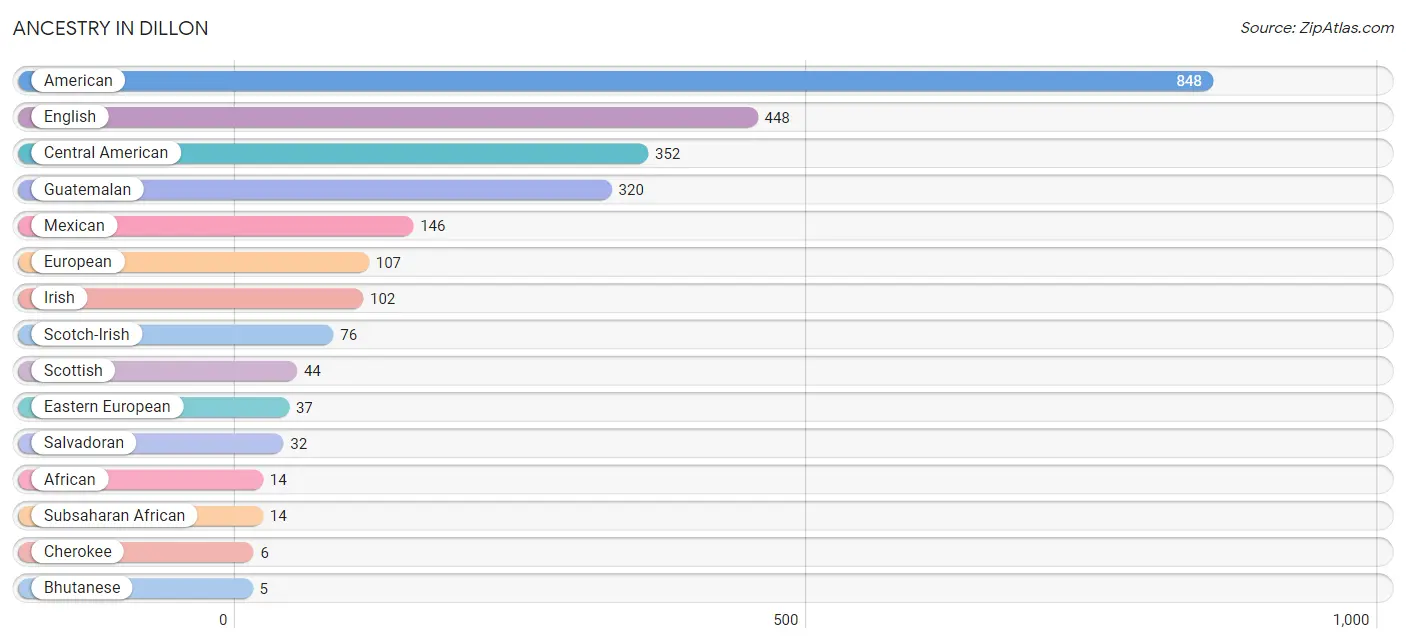
Ancestry in Dillon
The most populous ancestries reported in Dillon are American (848 | 13.1%), English (448 | 6.9%), Central American (352 | 5.4%), Guatemalan (320 | 5.0%), and Mexican (146 | 2.3%), together accounting for 32.7% of all Dillon residents.
| Ancestry | # Population | % Population |
| African | 14 | 0.2% |
| American | 848 | 13.1% |
| Bhutanese | 5 | 0.1% |
| Blackfeet | 4 | 0.1% |
| Central American | 352 | 5.4% |
| Cherokee | 6 | 0.1% |
| Eastern European | 37 | 0.6% |
| English | 448 | 6.9% |
| European | 107 | 1.7% |
| Guatemalan | 320 | 5.0% |
| Irish | 102 | 1.6% |
| Jamaican | 4 | 0.1% |
| Mexican | 146 | 2.3% |
| Salvadoran | 32 | 0.5% |
| Scotch-Irish | 76 | 1.2% |
| Scottish | 44 | 0.7% |
| Subsaharan African | 14 | 0.2% | View All 17 Rows |
Immigrants in Dillon
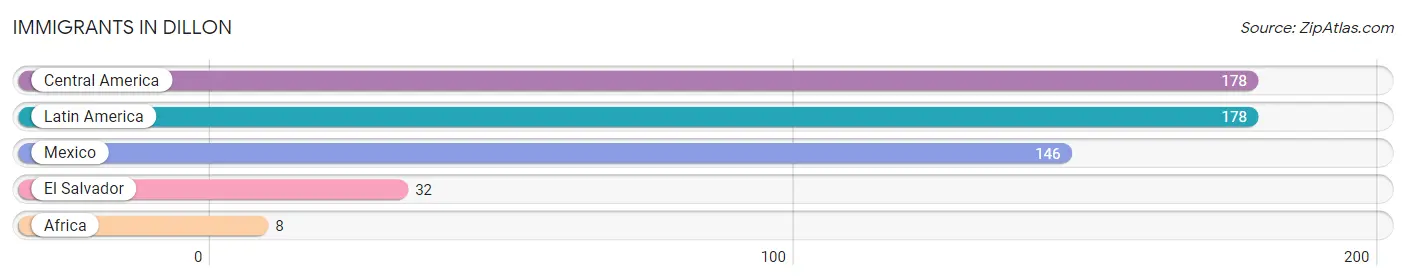
The most numerous immigrant groups reported in Dillon came from Central America (178 | 2.8%), Latin America (178 | 2.8%), Mexico (146 | 2.3%), El Salvador (32 | 0.5%), and Africa (8 | 0.1%), together accounting for 8.4% of all Dillon residents.
| Immigration Origin | # Population | % Population |
| Africa | 8 | 0.1% |
| Central America | 178 | 2.8% |
| El Salvador | 32 | 0.5% |
| Latin America | 178 | 2.8% |
| Mexico | 146 | 2.3% | View All 5 Rows |
Sex and Age in Dillon
Sex and Age in Dillon
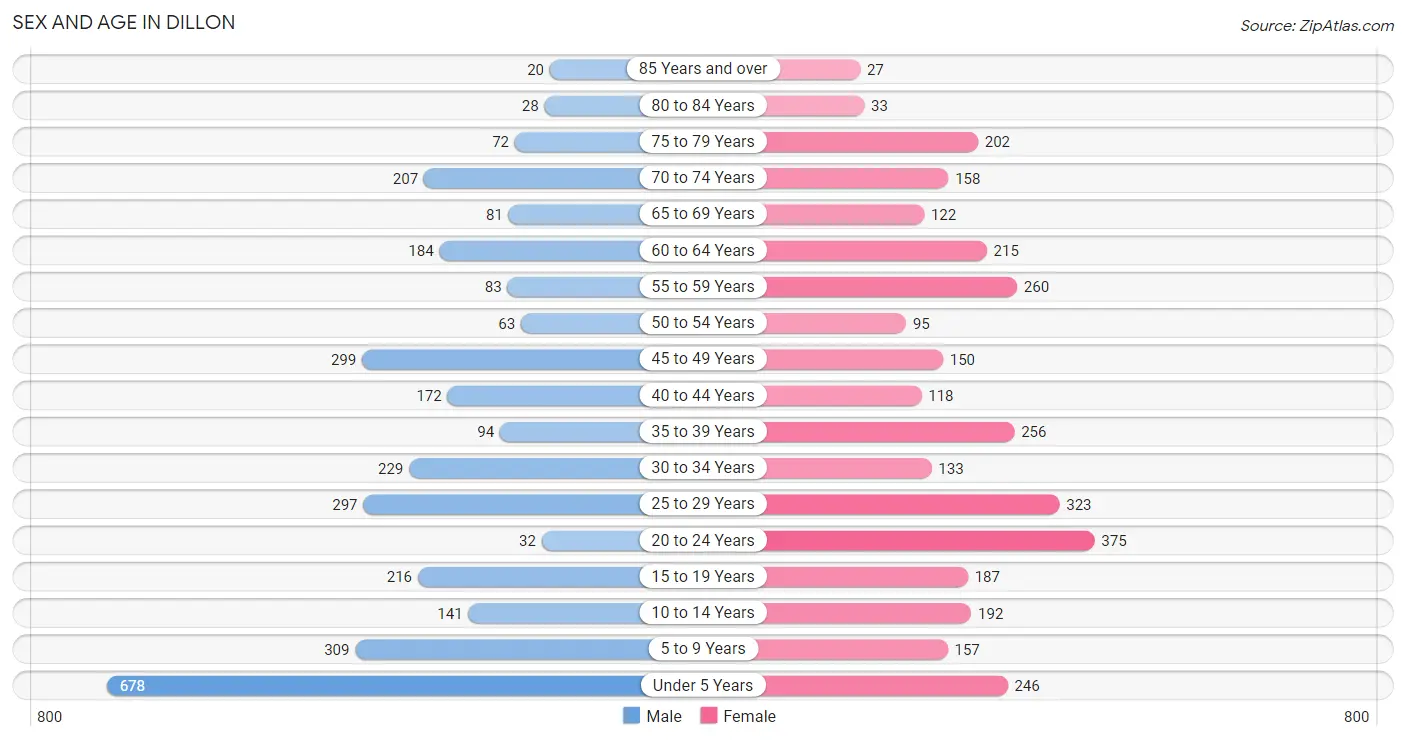
The most populous age groups in Dillon are Under 5 Years (678 | 21.1%) for men and 20 to 24 Years (375 | 11.5%) for women.
| Age Bracket | Male | Female |
| Under 5 Years | 678 (21.1%) | 246 (7.6%) |
| 5 to 9 Years | 309 (9.6%) | 157 (4.8%) |
| 10 to 14 Years | 141 (4.4%) | 192 (5.9%) |
| 15 to 19 Years | 216 (6.7%) | 187 (5.8%) |
| 20 to 24 Years | 32 (1.0%) | 375 (11.5%) |
| 25 to 29 Years | 297 (9.3%) | 323 (9.9%) |
| 30 to 34 Years | 229 (7.1%) | 133 (4.1%) |
| 35 to 39 Years | 94 (2.9%) | 256 (7.9%) |
| 40 to 44 Years | 172 (5.4%) | 118 (3.6%) |
| 45 to 49 Years | 299 (9.3%) | 150 (4.6%) |
| 50 to 54 Years | 63 (2.0%) | 95 (2.9%) |
| 55 to 59 Years | 83 (2.6%) | 260 (8.0%) |
| 60 to 64 Years | 184 (5.7%) | 215 (6.6%) |
| 65 to 69 Years | 81 (2.5%) | 122 (3.8%) |
| 70 to 74 Years | 207 (6.5%) | 158 (4.9%) |
| 75 to 79 Years | 72 (2.2%) | 202 (6.2%) |
| 80 to 84 Years | 28 (0.9%) | 33 (1.0%) |
| 85 Years and over | 20 (0.6%) | 27 (0.8%) |
| Total | 3,205 (100.0%) | 3,249 (100.0%) |
Families and Households in Dillon
Median Family Size in Dillon
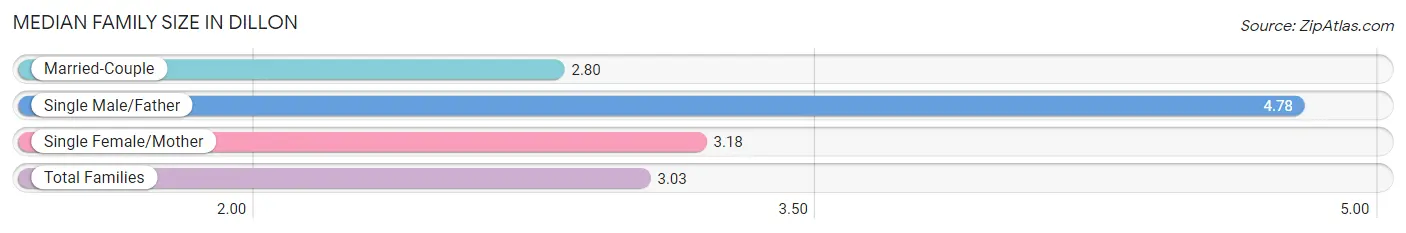
The median family size in Dillon is 3.03 persons per family, with single male/father families (63 | 3.5%) accounting for the largest median family size of 4.78 persons per family. On the other hand, married-couple families (968 | 53.7%) represent the smallest median family size with 2.80 persons per family.
| Family Type | # Families | Family Size |
| Married-Couple | 968 (53.7%) | 2.80 |
| Single Male/Father | 63 (3.5%) | 4.78 |
| Single Female/Mother | 773 (42.8%) | 3.18 |
| Total Families | 1,804 (100.0%) | 3.03 |
Median Household Size in Dillon
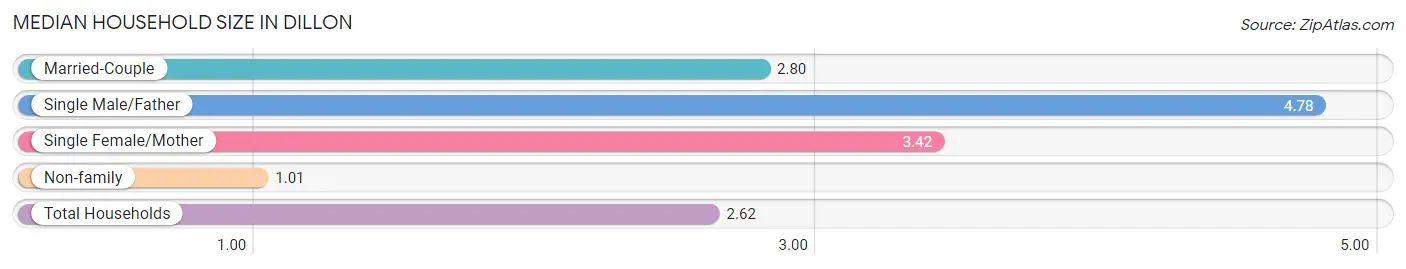
The median household size in Dillon is 2.62 persons per household, with single male/father households (63 | 2.6%) accounting for the largest median household size of 4.78 persons per household. non-family households (572 | 24.1%) represent the smallest median household size with 1.01 persons per household.
| Household Type | # Households | Household Size |
| Married-Couple | 968 (40.7%) | 2.80 |
| Single Male/Father | 63 (2.6%) | 4.78 |
| Single Female/Mother | 773 (32.5%) | 3.42 |
| Non-family | 572 (24.1%) | 1.01 |
| Total Households | 2,376 (100.0%) | 2.62 |
Household Size by Marriage Status in Dillon
Out of a total of 2,376 households in Dillon, 1,804 (75.9%) are family households, while 572 (24.1%) are nonfamily households. The most numerous type of family households are 2-person households, comprising 752, and the most common type of nonfamily households are 1-person households, comprising 568.
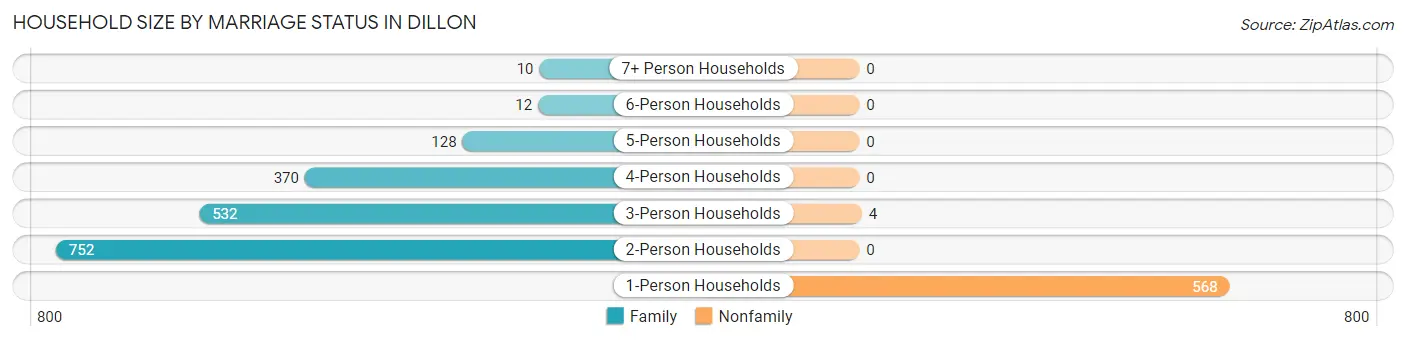
| Household Size | Family Households | Nonfamily Households |
| 1-Person Households | - | 568 (23.9%) |
| 2-Person Households | 752 (31.7%) | 0 (0.0%) |
| 3-Person Households | 532 (22.4%) | 4 (0.2%) |
| 4-Person Households | 370 (15.6%) | 0 (0.0%) |
| 5-Person Households | 128 (5.4%) | 0 (0.0%) |
| 6-Person Households | 12 (0.5%) | 0 (0.0%) |
| 7+ Person Households | 10 (0.4%) | 0 (0.0%) |
| Total | 1,804 (75.9%) | 572 (24.1%) |
Female Fertility in Dillon
Fertility by Age in Dillon
Average fertility rate in Dillon is 48.0 births per 1,000 women. Women in the age bracket of 20 to 34 years have the highest fertility rate with 89.0 births per 1,000 women. Women in the age bracket of 20 to 34 years acount for 100.0% of all women with births.
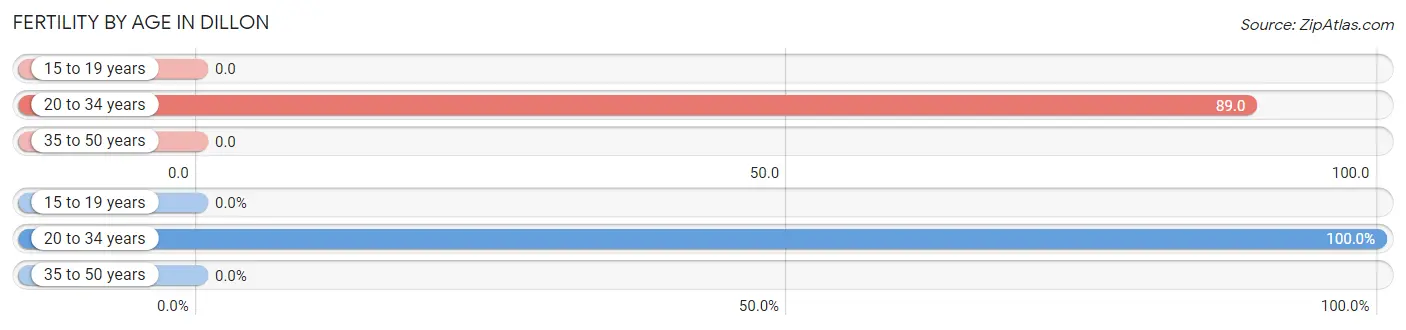
| Age Bracket | Women with Births | Births / 1,000 Women |
| 15 to 19 years | 0 (0.0%) | 0.0 |
| 20 to 34 years | 74 (100.0%) | 89.0 |
| 35 to 50 years | 0 (0.0%) | 0.0 |
| Total | 74 (100.0%) | 48.0 |
Fertility by Age by Marriage Status in Dillon
78.4% of women with births (74) in Dillon are married. The highest percentage of unmarried women with births falls into 20 to 34 years age bracket with 21.6% of them unmarried at the time of birth, while the lowest percentage of unmarried women with births belong to 20 to 34 years age bracket with 21.6% of them unmarried.
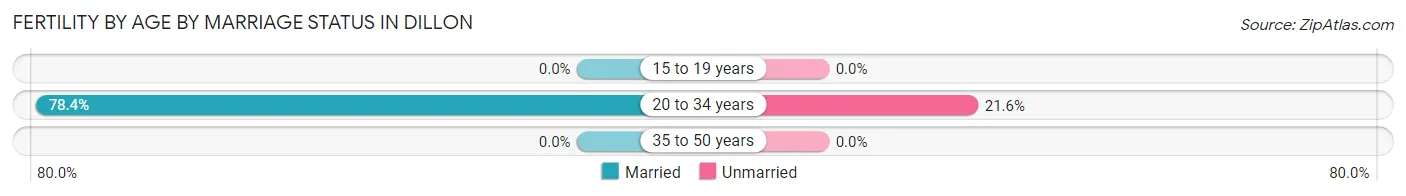
| Age Bracket | Married | Unmarried |
| 15 to 19 years | 0 (0.0%) | 0 (0.0%) |
| 20 to 34 years | 58 (78.4%) | 16 (21.6%) |
| 35 to 50 years | 0 (0.0%) | 0 (0.0%) |
| Total | 58 (78.4%) | 16 (21.6%) |
Fertility by Education in Dillon
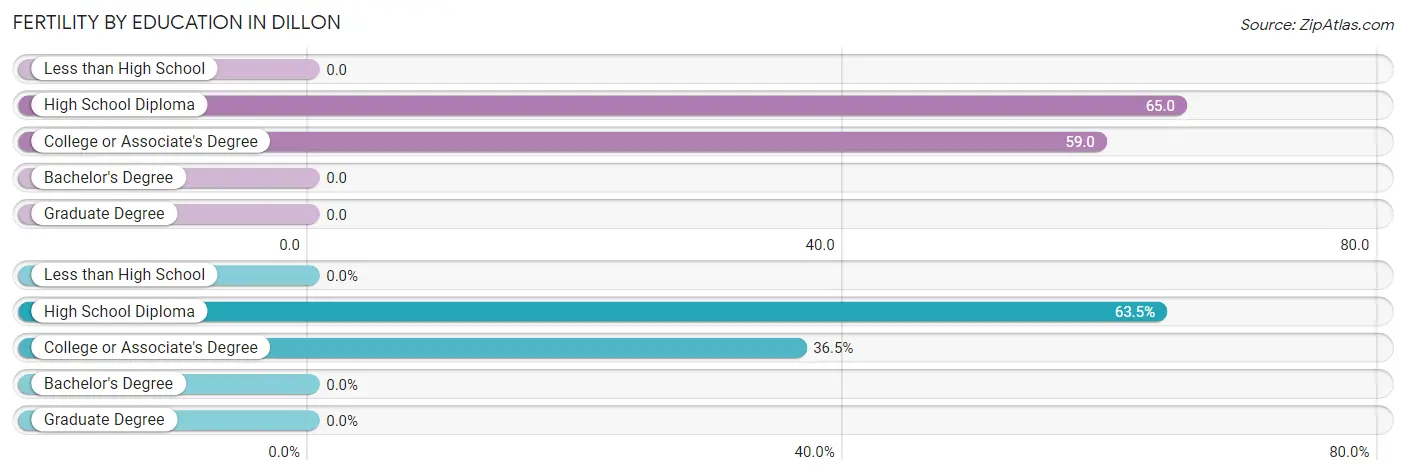
| Educational Attainment | Women with Births | Births / 1,000 Women |
| Less than High School | 0 (0.0%) | 0.0 |
| High School Diploma | 47 (63.5%) | 65.0 |
| College or Associate's Degree | 27 (36.5%) | 59.0 |
| Bachelor's Degree | 0 (0.0%) | 0.0 |
| Graduate Degree | 0 (0.0%) | 0.0 |
| Total | 74 (100.0%) | 48.0 |
Fertility by Education by Marriage Status in Dillon
21.6% of women with births in Dillon are unmarried. Women with the educational attainment of college or associate's degree are most likely to be married with 100.0% of them married at childbirth, while women with the educational attainment of high school diploma are least likely to be married with 34.0% of them unmarried at childbirth.
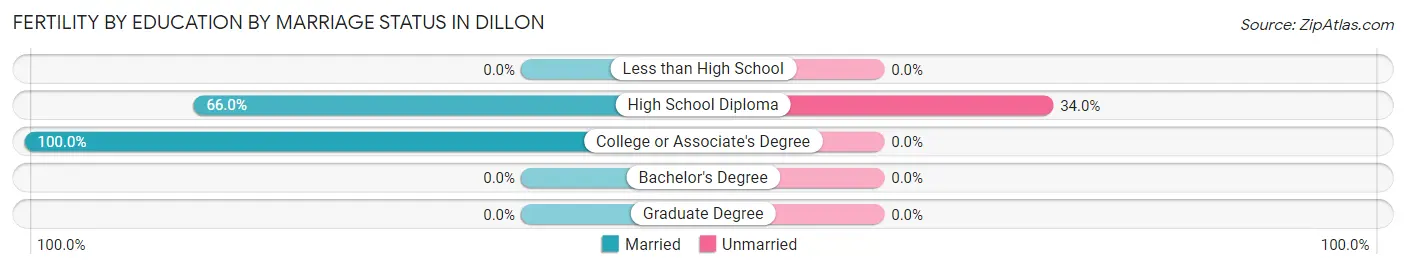
| Educational Attainment | Married | Unmarried |
| Less than High School | 0 (0.0%) | 0 (0.0%) |
| High School Diploma | 31 (66.0%) | 16 (34.0%) |
| College or Associate's Degree | 27 (100.0%) | 0 (0.0%) |
| Bachelor's Degree | 0 (0.0%) | 0 (0.0%) |
| Graduate Degree | 0 (0.0%) | 0 (0.0%) |
| Total | 58 (78.4%) | 16 (21.6%) |
Employment Characteristics in Dillon
Employment by Class of Employer in Dillon
Among the 2,572 employed individuals in Dillon, private company employees (1,986 | 77.2%), state government employees (258 | 10.0%), and not-for-profit organizations (140 | 5.4%) make up the most common classes of employment.
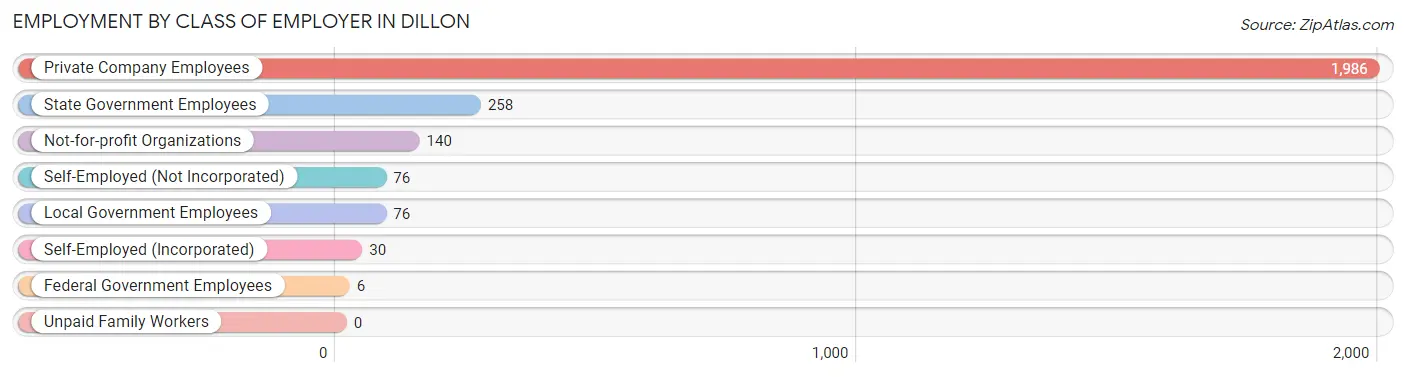
| Employer Class | # Employees | % Employees |
| Private Company Employees | 1,986 | 77.2% |
| Self-Employed (Incorporated) | 30 | 1.2% |
| Self-Employed (Not Incorporated) | 76 | 2.9% |
| Not-for-profit Organizations | 140 | 5.4% |
| Local Government Employees | 76 | 2.9% |
| State Government Employees | 258 | 10.0% |
| Federal Government Employees | 6 | 0.2% |
| Unpaid Family Workers | 0 | 0.0% |
| Total | 2,572 | 100.0% |
Employment Status by Age in Dillon
According to the labor force statistics for Dillon, out of the total population over 16 years of age (4,655), 57.5% or 2,677 individuals are in the labor force, with 3.9% or 104 of them unemployed. The age group with the highest labor force participation rate is 30 to 34 years, with 95.9% or 347 individuals in the labor force. Within the labor force, the 16 to 19 years age range has the highest percentage of unemployed individuals, with 18.9% or 33 of them being unemployed.
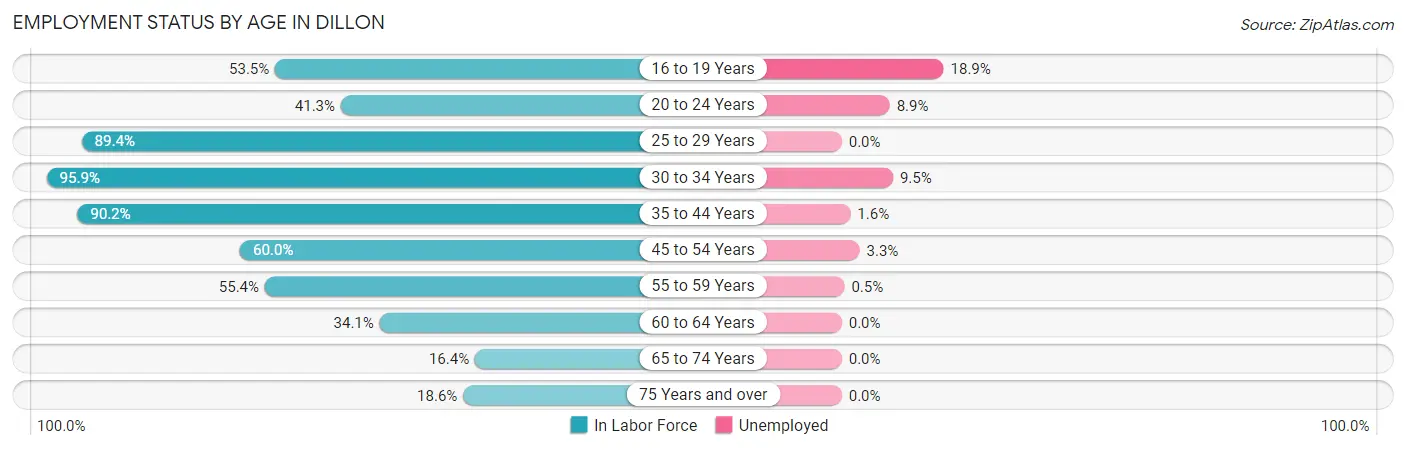
| Age Bracket | In Labor Force | Unemployed |
| 16 to 19 Years | 175 (53.5%) | 33 (18.9%) |
| 20 to 24 Years | 168 (41.3%) | 15 (8.9%) |
| 25 to 29 Years | 554 (89.4%) | 0 (0.0%) |
| 30 to 34 Years | 347 (95.9%) | 33 (9.5%) |
| 35 to 44 Years | 577 (90.2%) | 9 (1.6%) |
| 45 to 54 Years | 364 (60.0%) | 12 (3.3%) |
| 55 to 59 Years | 190 (55.4%) | 1 (0.5%) |
| 60 to 64 Years | 136 (34.1%) | 0 (0.0%) |
| 65 to 74 Years | 93 (16.4%) | 0 (0.0%) |
| 75 Years and over | 71 (18.6%) | 0 (0.0%) |
| Total | 2,677 (57.5%) | 104 (3.9%) |
Employment Status by Educational Attainment in Dillon
According to labor force statistics for Dillon, 73.0% of individuals (2,169) out of the total population between 25 and 64 years of age (2,971) are in the labor force, with 2.5% or 54 of them being unemployed. The group with the highest labor force participation rate are those with the educational attainment of bachelor's degree or higher, with 86.2% or 305 individuals in the labor force. Within the labor force, individuals with less than high school education have the highest percentage of unemployment, with 5.3% or 22 of them being unemployed.
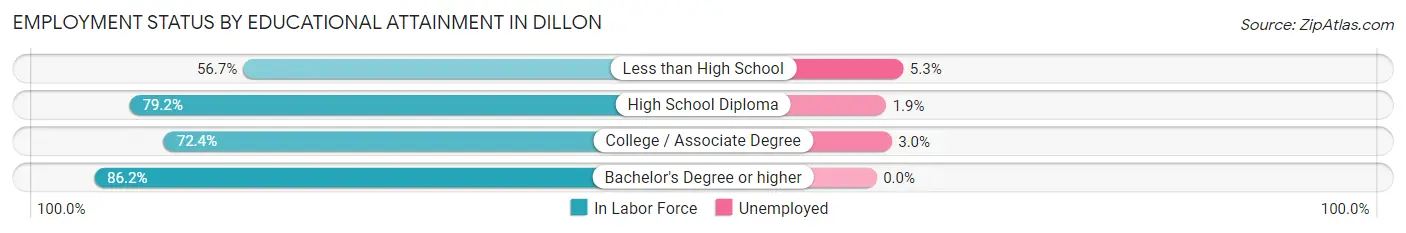
| Educational Attainment | In Labor Force | Unemployed |
| Less than High School | 412 (56.7%) | 38 (5.3%) |
| High School Diploma | 952 (79.2%) | 23 (1.9%) |
| College / Associate Degree | 499 (72.4%) | 21 (3.0%) |
| Bachelor's Degree or higher | 305 (86.2%) | 0 (0.0%) |
| Total | 2,169 (73.0%) | 74 (2.5%) |
Employment Occupations by Sex in Dillon
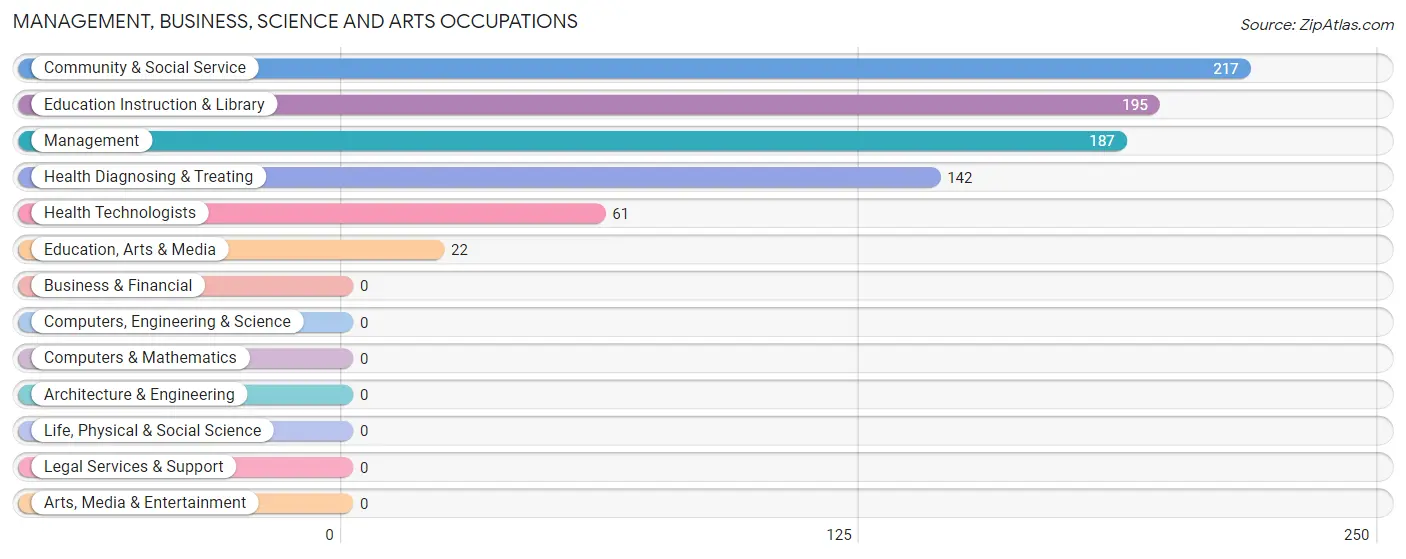
Management, Business, Science and Arts Occupations
The most common Management, Business, Science and Arts occupations in Dillon are Community & Social Service (217 | 8.4%), Education Instruction & Library (195 | 7.6%), Management (187 | 7.3%), Health Diagnosing & Treating (142 | 5.5%), and Health Technologists (61 | 2.4%).
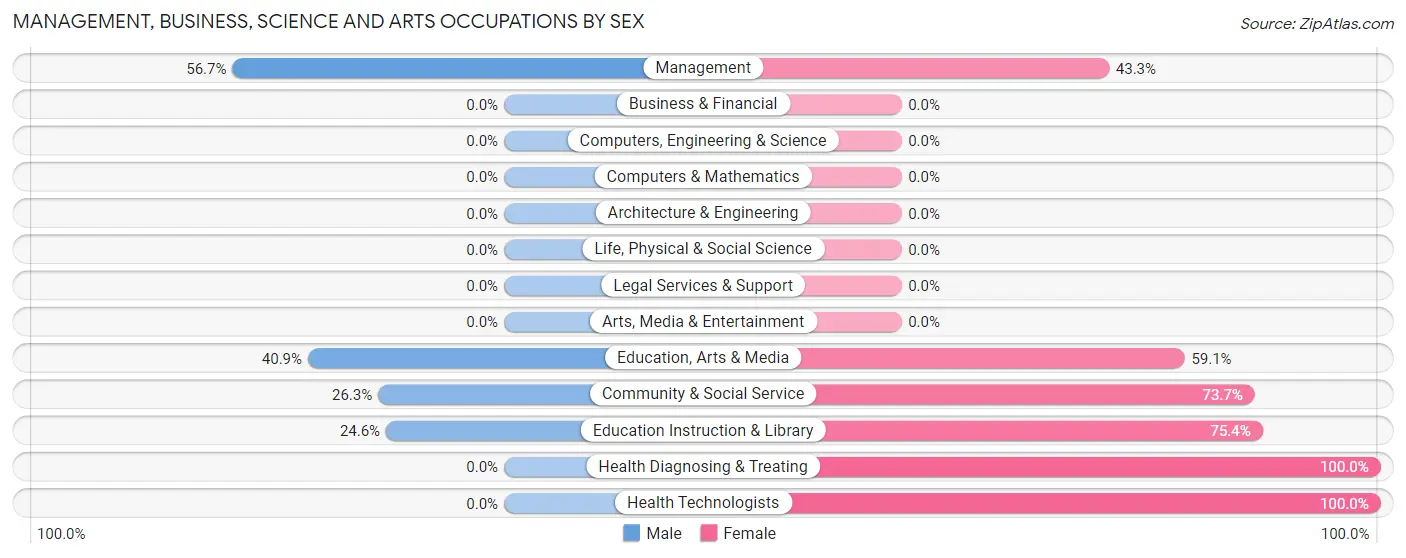
Management, Business, Science and Arts Occupations by Sex
Within the Management, Business, Science and Arts occupations in Dillon, the most male-oriented occupations are Management (56.7%), Education, Arts & Media (40.9%), and Community & Social Service (26.3%), while the most female-oriented occupations are Health Diagnosing & Treating (100.0%), Health Technologists (100.0%), and Education Instruction & Library (75.4%).
| Occupation | Male | Female |
| Management | 106 (56.7%) | 81 (43.3%) |
| Business & Financial | 0 (0.0%) | 0 (0.0%) |
| Computers, Engineering & Science | 0 (0.0%) | 0 (0.0%) |
| Computers & Mathematics | 0 (0.0%) | 0 (0.0%) |
| Architecture & Engineering | 0 (0.0%) | 0 (0.0%) |
| Life, Physical & Social Science | 0 (0.0%) | 0 (0.0%) |
| Community & Social Service | 57 (26.3%) | 160 (73.7%) |
| Education, Arts & Media | 9 (40.9%) | 13 (59.1%) |
| Legal Services & Support | 0 (0.0%) | 0 (0.0%) |
| Education Instruction & Library | 48 (24.6%) | 147 (75.4%) |
| Arts, Media & Entertainment | 0 (0.0%) | 0 (0.0%) |
| Health Diagnosing & Treating | 0 (0.0%) | 142 (100.0%) |
| Health Technologists | 0 (0.0%) | 61 (100.0%) |
| Total (Category) | 163 (29.8%) | 383 (70.2%) |
| Total (Overall) | 1,175 (45.7%) | 1,397 (54.3%) |
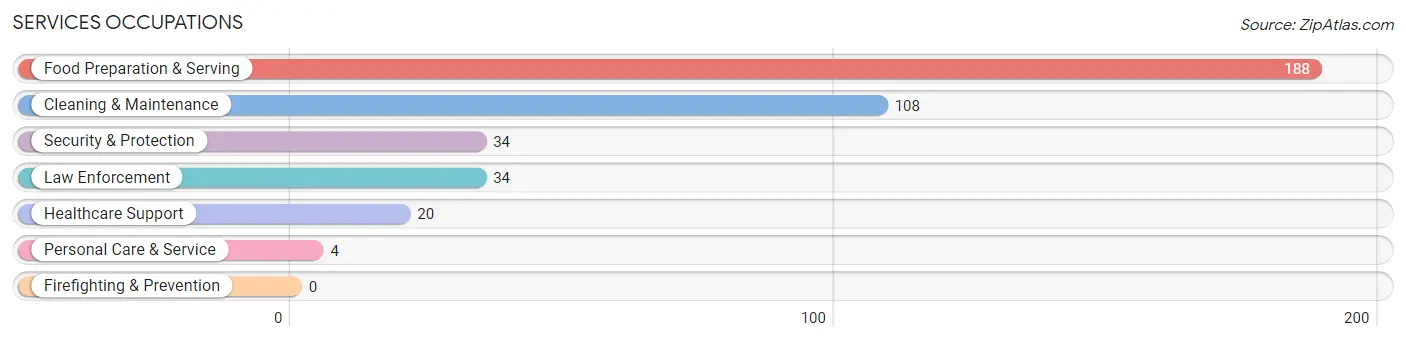
Services Occupations
The most common Services occupations in Dillon are Food Preparation & Serving (188 | 7.3%), Cleaning & Maintenance (108 | 4.2%), Security & Protection (34 | 1.3%), Law Enforcement (34 | 1.3%), and Healthcare Support (20 | 0.8%).
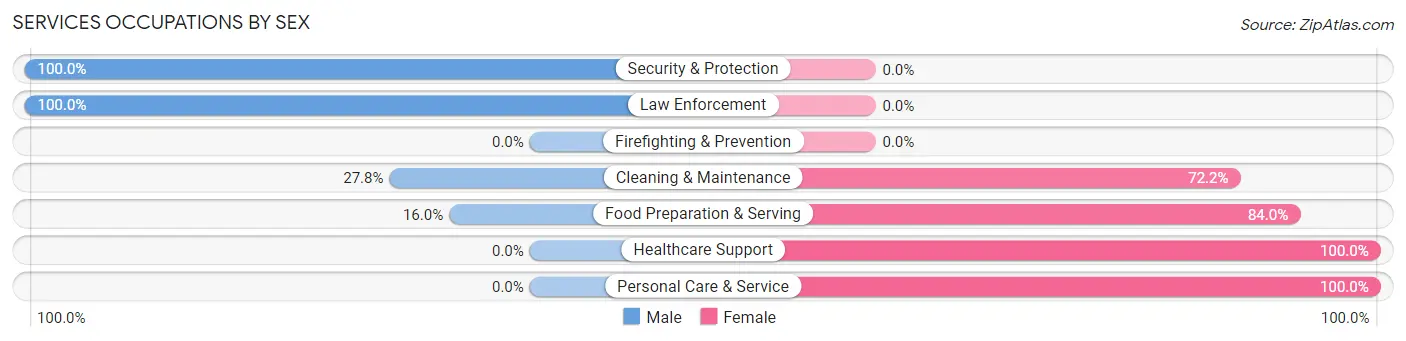
Services Occupations by Sex
Within the Services occupations in Dillon, the most male-oriented occupations are Security & Protection (100.0%), Law Enforcement (100.0%), and Cleaning & Maintenance (27.8%), while the most female-oriented occupations are Healthcare Support (100.0%), Personal Care & Service (100.0%), and Food Preparation & Serving (84.0%).
| Occupation | Male | Female |
| Healthcare Support | 0 (0.0%) | 20 (100.0%) |
| Security & Protection | 34 (100.0%) | 0 (0.0%) |
| Firefighting & Prevention | 0 (0.0%) | 0 (0.0%) |
| Law Enforcement | 34 (100.0%) | 0 (0.0%) |
| Food Preparation & Serving | 30 (16.0%) | 158 (84.0%) |
| Cleaning & Maintenance | 30 (27.8%) | 78 (72.2%) |
| Personal Care & Service | 0 (0.0%) | 4 (100.0%) |
| Total (Category) | 94 (26.6%) | 260 (73.5%) |
| Total (Overall) | 1,175 (45.7%) | 1,397 (54.3%) |
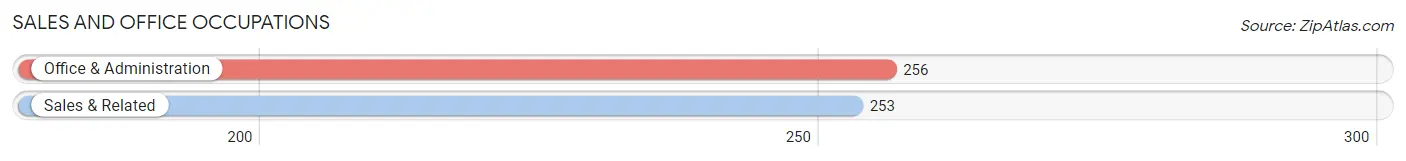
Sales and Office Occupations
The most common Sales and Office occupations in Dillon are Office & Administration (256 | 10.0%), and Sales & Related (253 | 9.8%).
Sales and Office Occupations by Sex
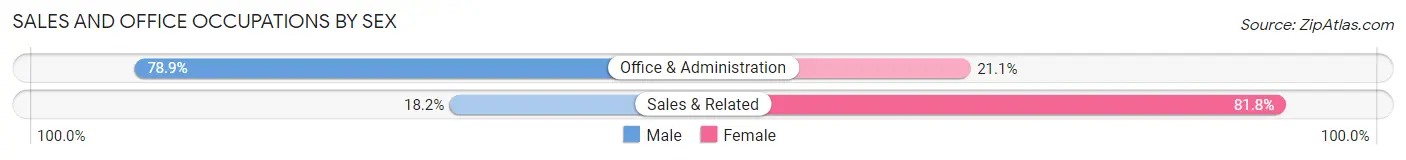
| Occupation | Male | Female |
| Sales & Related | 46 (18.2%) | 207 (81.8%) |
| Office & Administration | 202 (78.9%) | 54 (21.1%) |
| Total (Category) | 248 (48.7%) | 261 (51.3%) |
| Total (Overall) | 1,175 (45.7%) | 1,397 (54.3%) |
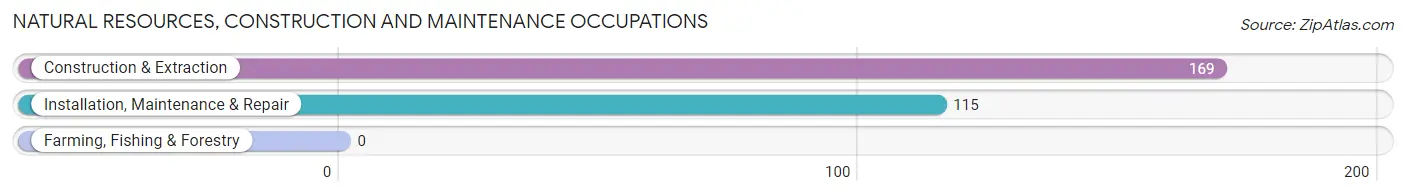
Natural Resources, Construction and Maintenance Occupations
The most common Natural Resources, Construction and Maintenance occupations in Dillon are Construction & Extraction (169 | 6.6%), and Installation, Maintenance & Repair (115 | 4.5%).
Natural Resources, Construction and Maintenance Occupations by Sex
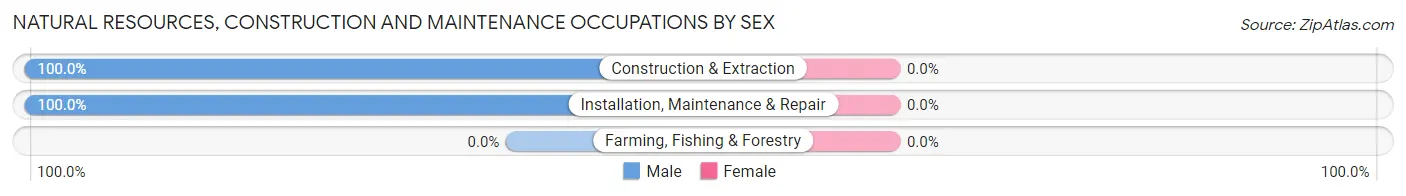
| Occupation | Male | Female |
| Farming, Fishing & Forestry | 0 (0.0%) | 0 (0.0%) |
| Construction & Extraction | 169 (100.0%) | 0 (0.0%) |
| Installation, Maintenance & Repair | 115 (100.0%) | 0 (0.0%) |
| Total (Category) | 284 (100.0%) | 0 (0.0%) |
| Total (Overall) | 1,175 (45.7%) | 1,397 (54.3%) |
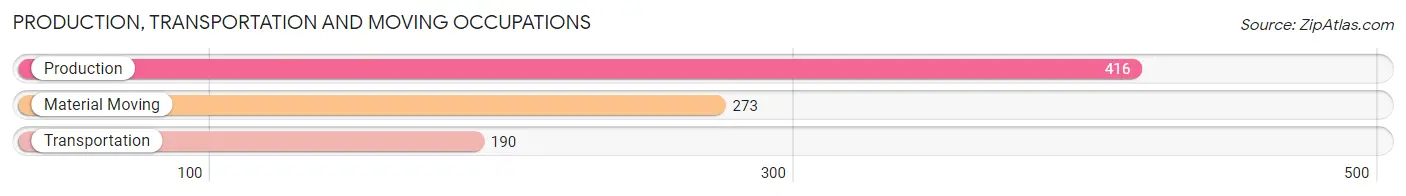
Production, Transportation and Moving Occupations
The most common Production, Transportation and Moving occupations in Dillon are Production (416 | 16.2%), Material Moving (273 | 10.6%), and Transportation (190 | 7.4%).
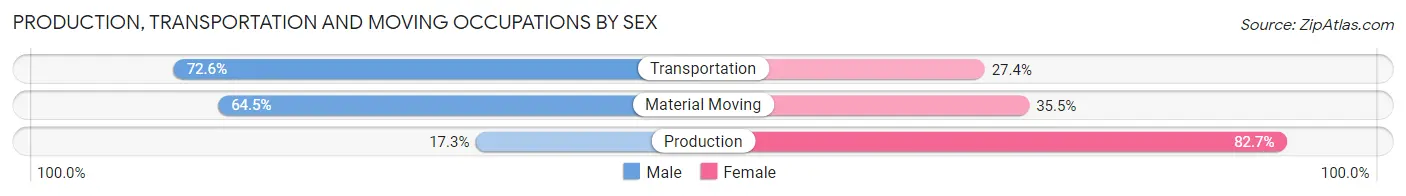
Production, Transportation and Moving Occupations by Sex
| Occupation | Male | Female |
| Production | 72 (17.3%) | 344 (82.7%) |
| Transportation | 138 (72.6%) | 52 (27.4%) |
| Material Moving | 176 (64.5%) | 97 (35.5%) |
| Total (Category) | 386 (43.9%) | 493 (56.1%) |
| Total (Overall) | 1,175 (45.7%) | 1,397 (54.3%) |
Employment Industries by Sex in Dillon
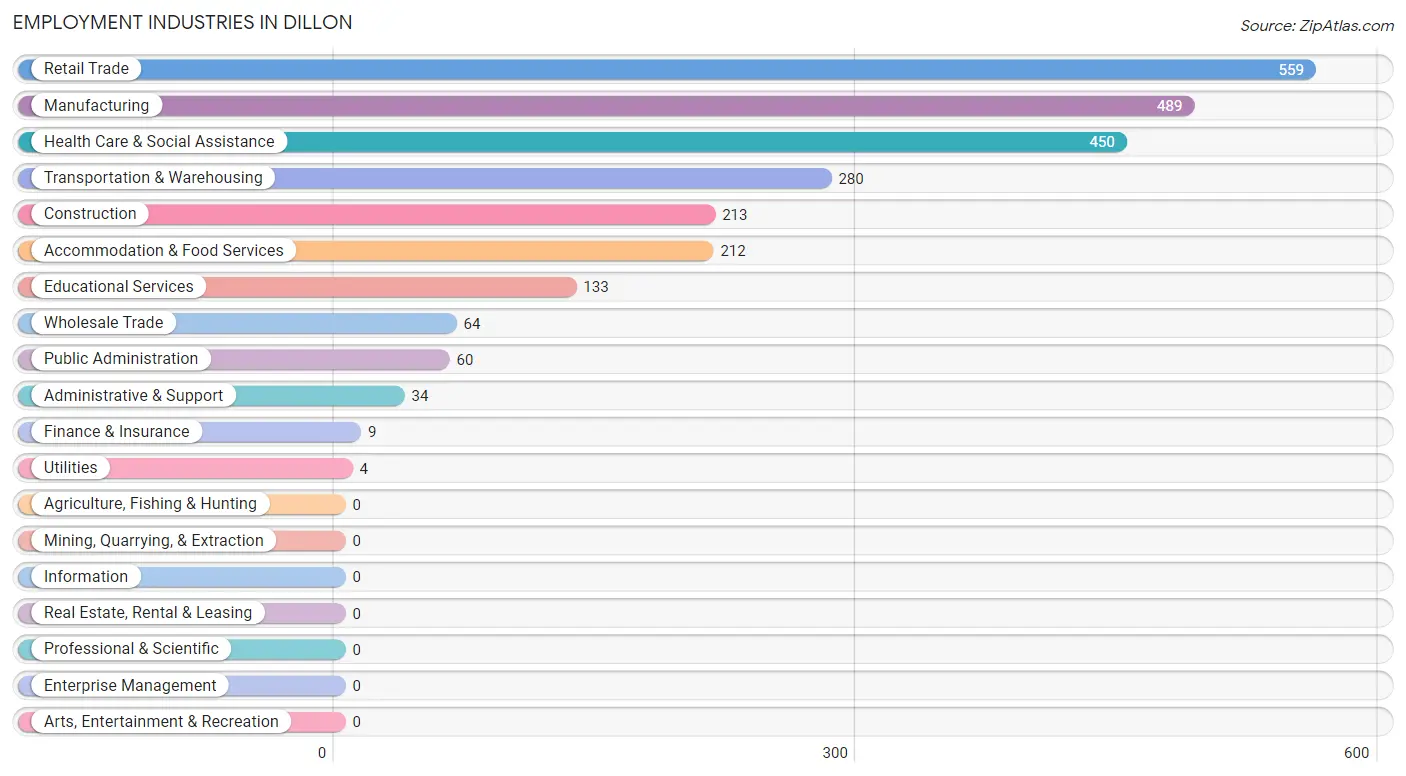
Employment Industries in Dillon
The major employment industries in Dillon include Retail Trade (559 | 21.7%), Manufacturing (489 | 19.0%), Health Care & Social Assistance (450 | 17.5%), Transportation & Warehousing (280 | 10.9%), and Construction (213 | 8.3%).
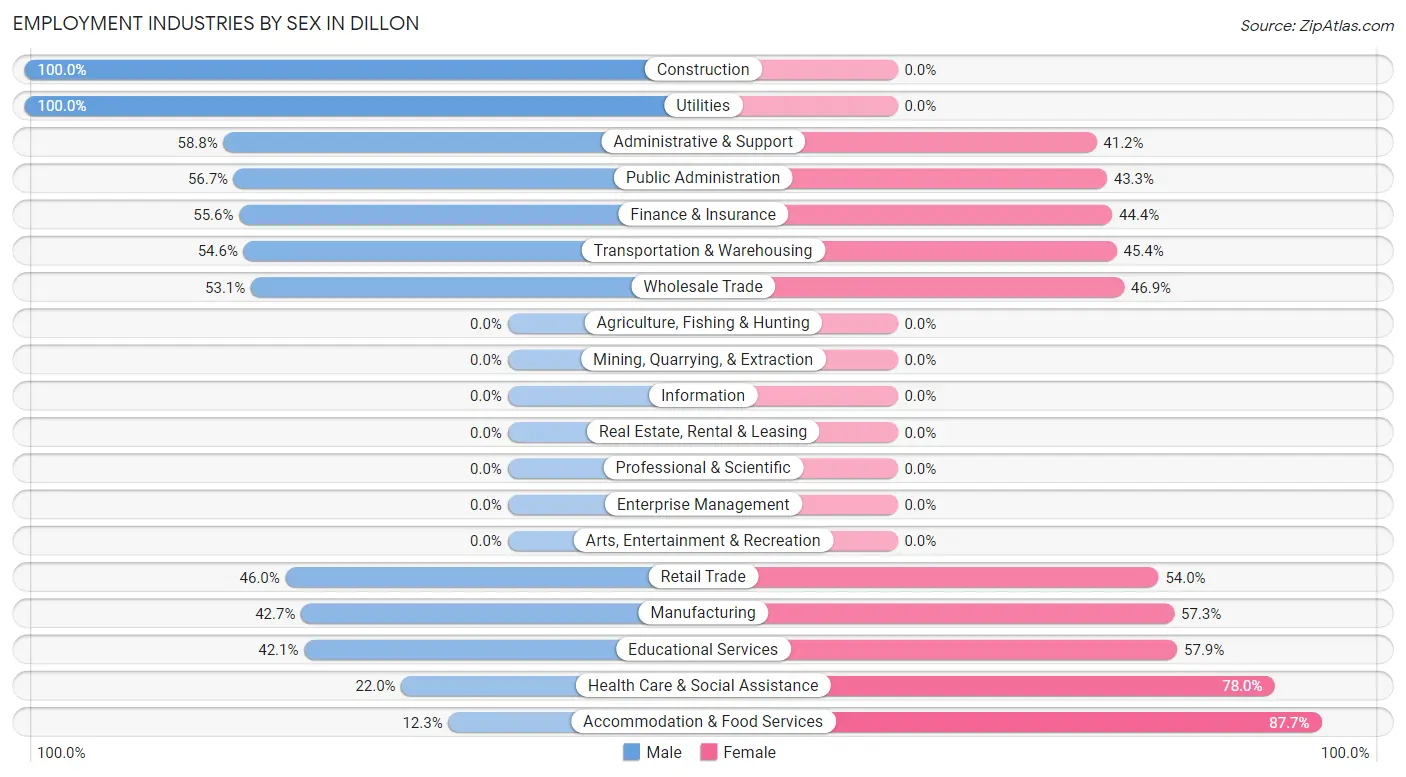
Employment Industries by Sex in Dillon
The Dillon industries that see more men than women are Construction (100.0%), Utilities (100.0%), and Administrative & Support (58.8%), whereas the industries that tend to have a higher number of women are Accommodation & Food Services (87.7%), Health Care & Social Assistance (78.0%), and Educational Services (57.9%).
| Industry | Male | Female |
| Agriculture, Fishing & Hunting | 0 (0.0%) | 0 (0.0%) |
| Mining, Quarrying, & Extraction | 0 (0.0%) | 0 (0.0%) |
| Construction | 213 (100.0%) | 0 (0.0%) |
| Manufacturing | 209 (42.7%) | 280 (57.3%) |
| Wholesale Trade | 34 (53.1%) | 30 (46.9%) |
| Retail Trade | 257 (46.0%) | 302 (54.0%) |
| Transportation & Warehousing | 153 (54.6%) | 127 (45.4%) |
| Utilities | 4 (100.0%) | 0 (0.0%) |
| Information | 0 (0.0%) | 0 (0.0%) |
| Finance & Insurance | 5 (55.6%) | 4 (44.4%) |
| Real Estate, Rental & Leasing | 0 (0.0%) | 0 (0.0%) |
| Professional & Scientific | 0 (0.0%) | 0 (0.0%) |
| Enterprise Management | 0 (0.0%) | 0 (0.0%) |
| Administrative & Support | 20 (58.8%) | 14 (41.2%) |
| Educational Services | 56 (42.1%) | 77 (57.9%) |
| Health Care & Social Assistance | 99 (22.0%) | 351 (78.0%) |
| Arts, Entertainment & Recreation | 0 (0.0%) | 0 (0.0%) |
| Accommodation & Food Services | 26 (12.3%) | 186 (87.7%) |
| Public Administration | 34 (56.7%) | 26 (43.3%) |
| Total | 1,175 (45.7%) | 1,397 (54.3%) |
Education in Dillon
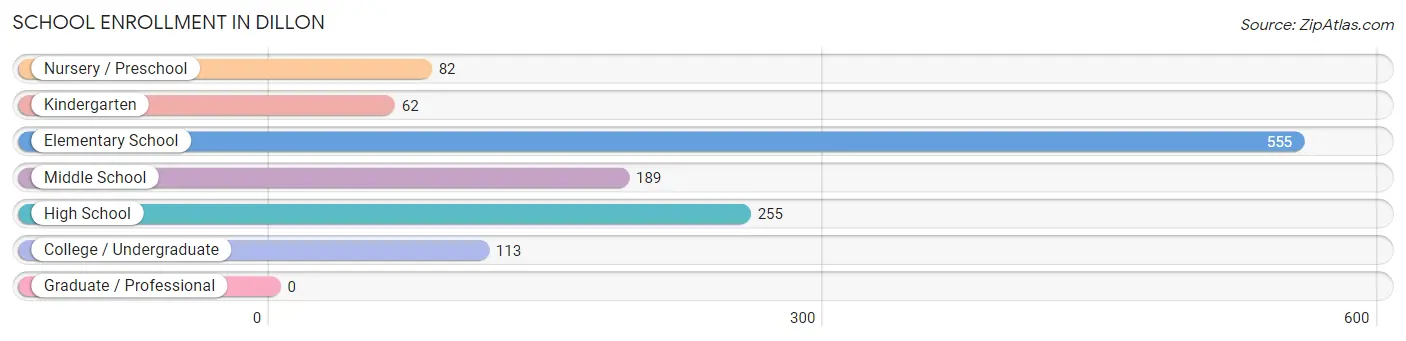
School Enrollment in Dillon
The most common levels of schooling among the 1,256 students in Dillon are elementary school (555 | 44.2%), high school (255 | 20.3%), and middle school (189 | 15.0%).
| School Level | # Students | % Students |
| Nursery / Preschool | 82 | 6.5% |
| Kindergarten | 62 | 4.9% |
| Elementary School | 555 | 44.2% |
| Middle School | 189 | 15.0% |
| High School | 255 | 20.3% |
| College / Undergraduate | 113 | 9.0% |
| Graduate / Professional | 0 | 0.0% |
| Total | 1,256 | 100.0% |
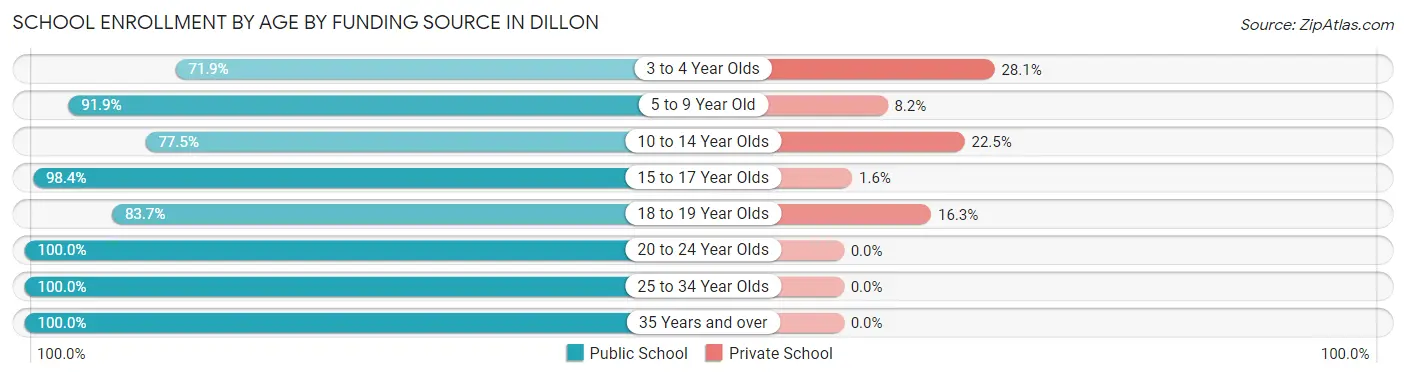
School Enrollment by Age by Funding Source in Dillon
Out of a total of 1,256 students who are enrolled in schools in Dillon, 156 (12.4%) attend a private institution, while the remaining 1,100 (87.6%) are enrolled in public schools. The age group of 3 to 4 year olds has the highest likelihood of being enrolled in private schools, with 25 (28.1% in the age bracket) enrolled. Conversely, the age group of 20 to 24 year olds has the lowest likelihood of being enrolled in a private school, with 13 (100.0% in the age bracket) attending a public institution.
| Age Bracket | Public School | Private School |
| 3 to 4 Year Olds | 64 (71.9%) | 25 (28.1%) |
| 5 to 9 Year Old | 428 (91.8%) | 38 (8.2%) |
| 10 to 14 Year Olds | 258 (77.5%) | 75 (22.5%) |
| 15 to 17 Year Olds | 251 (98.4%) | 4 (1.6%) |
| 18 to 19 Year Olds | 72 (83.7%) | 14 (16.3%) |
| 20 to 24 Year Olds | 13 (100.0%) | 0 (0.0%) |
| 25 to 34 Year Olds | 10 (100.0%) | 0 (0.0%) |
| 35 Years and over | 4 (100.0%) | 0 (0.0%) |
| Total | 1,100 (87.6%) | 156 (12.4%) |
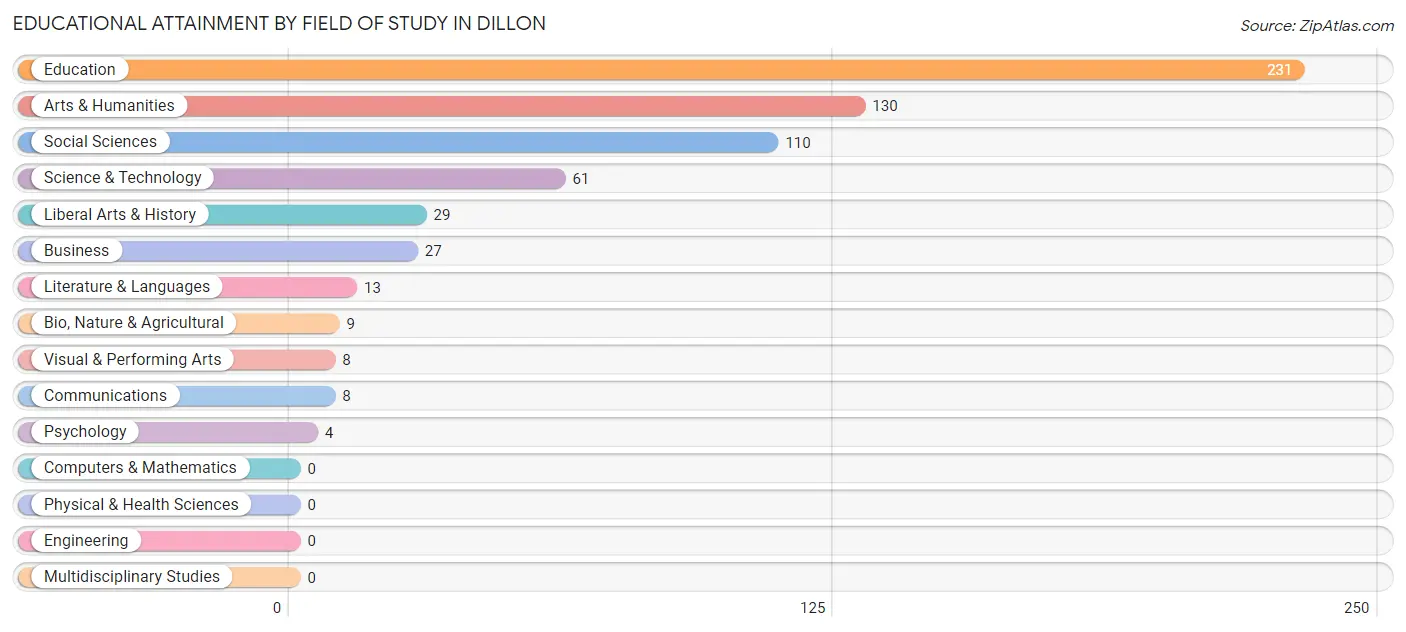
Educational Attainment by Field of Study in Dillon
Education (231 | 36.7%), arts & humanities (130 | 20.6%), social sciences (110 | 17.5%), science & technology (61 | 9.7%), and liberal arts & history (29 | 4.6%) are the most common fields of study among 630 individuals in Dillon who have obtained a bachelor's degree or higher.
| Field of Study | # Graduates | % Graduates |
| Computers & Mathematics | 0 | 0.0% |
| Bio, Nature & Agricultural | 9 | 1.4% |
| Physical & Health Sciences | 0 | 0.0% |
| Psychology | 4 | 0.6% |
| Social Sciences | 110 | 17.5% |
| Engineering | 0 | 0.0% |
| Multidisciplinary Studies | 0 | 0.0% |
| Science & Technology | 61 | 9.7% |
| Business | 27 | 4.3% |
| Education | 231 | 36.7% |
| Literature & Languages | 13 | 2.1% |
| Liberal Arts & History | 29 | 4.6% |
| Visual & Performing Arts | 8 | 1.3% |
| Communications | 8 | 1.3% |
| Arts & Humanities | 130 | 20.6% |
| Total | 630 | 100.0% |
Transportation & Commute in Dillon
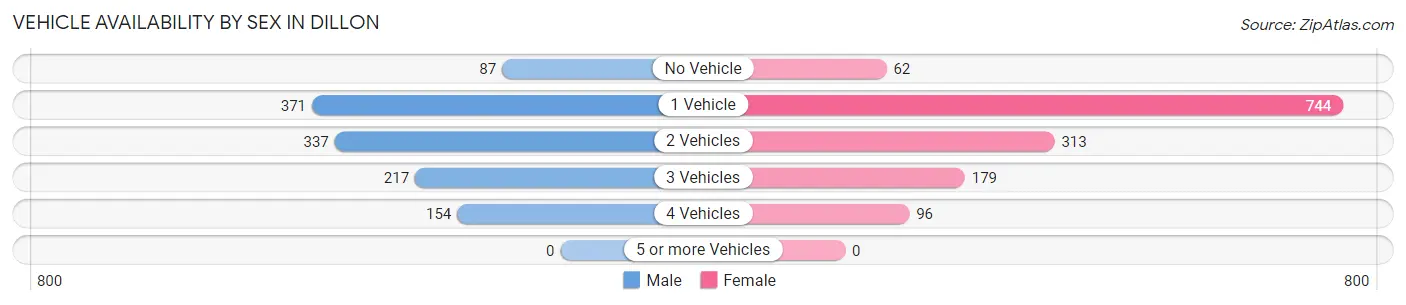
Vehicle Availability by Sex in Dillon
The most prevalent vehicle ownership categories in Dillon are males with 1 vehicle (371, accounting for 31.8%) and females with 1 vehicle (744, making up 26.6%).
| Vehicles Available | Male | Female |
| No Vehicle | 87 (7.5%) | 62 (4.4%) |
| 1 Vehicle | 371 (31.8%) | 744 (53.4%) |
| 2 Vehicles | 337 (28.9%) | 313 (22.5%) |
| 3 Vehicles | 217 (18.6%) | 179 (12.8%) |
| 4 Vehicles | 154 (13.2%) | 96 (6.9%) |
| 5 or more Vehicles | 0 (0.0%) | 0 (0.0%) |
| Total | 1,166 (100.0%) | 1,394 (100.0%) |
Commute Time in Dillon
The most frequently occuring commute durations in Dillon are 5 to 9 minutes (652 commuters, 25.5%), 10 to 14 minutes (504 commuters, 19.7%), and 45 to 59 minutes (432 commuters, 16.9%).
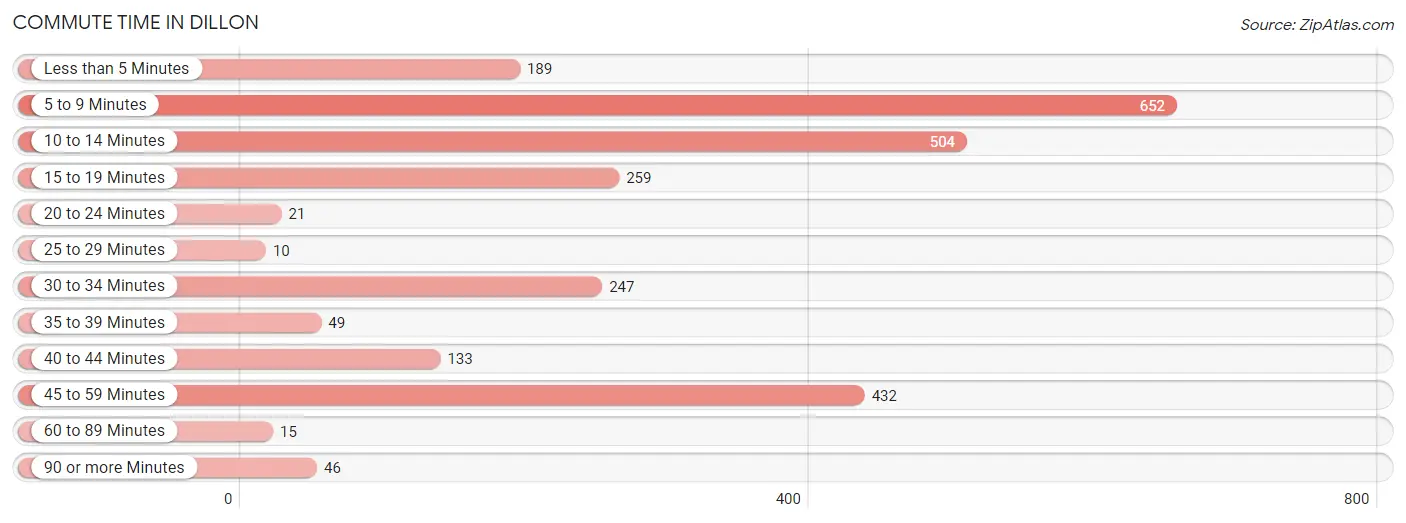
| Commute Time | # Commuters | % Commuters |
| Less than 5 Minutes | 189 | 7.4% |
| 5 to 9 Minutes | 652 | 25.5% |
| 10 to 14 Minutes | 504 | 19.7% |
| 15 to 19 Minutes | 259 | 10.1% |
| 20 to 24 Minutes | 21 | 0.8% |
| 25 to 29 Minutes | 10 | 0.4% |
| 30 to 34 Minutes | 247 | 9.7% |
| 35 to 39 Minutes | 49 | 1.9% |
| 40 to 44 Minutes | 133 | 5.2% |
| 45 to 59 Minutes | 432 | 16.9% |
| 60 to 89 Minutes | 15 | 0.6% |
| 90 or more Minutes | 46 | 1.8% |
Commute Time by Sex in Dillon
The most common commute times in Dillon are 5 to 9 minutes (379 commuters, 32.6%) for males and 5 to 9 minutes (273 commuters, 19.6%) for females.
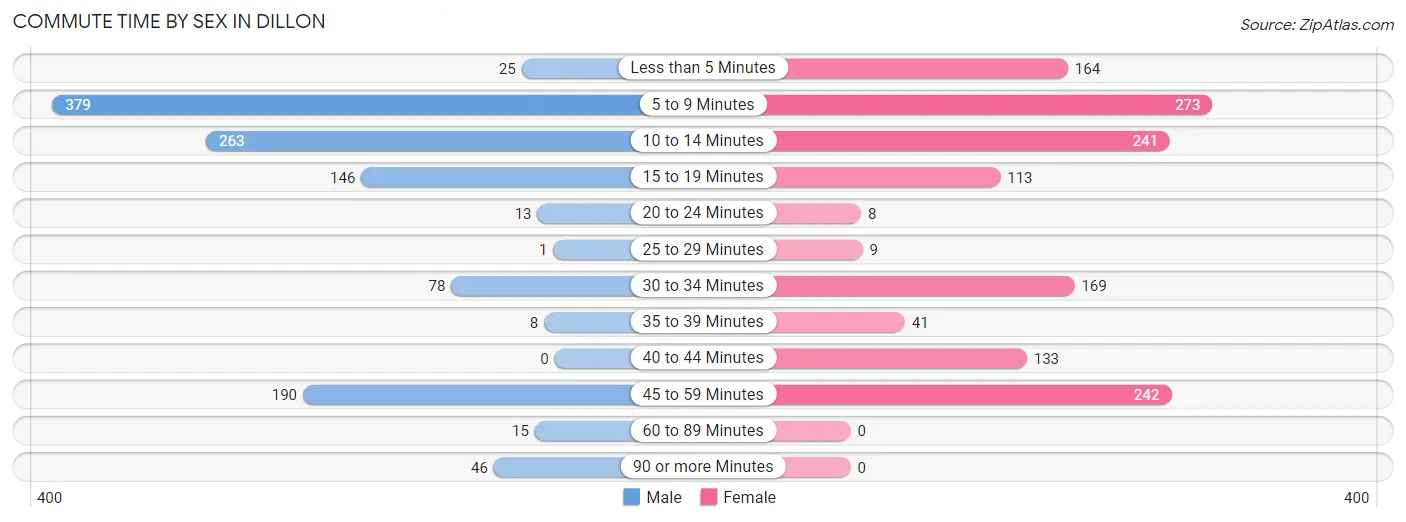
| Commute Time | Male | Female |
| Less than 5 Minutes | 25 (2.1%) | 164 (11.8%) |
| 5 to 9 Minutes | 379 (32.6%) | 273 (19.6%) |
| 10 to 14 Minutes | 263 (22.6%) | 241 (17.3%) |
| 15 to 19 Minutes | 146 (12.5%) | 113 (8.1%) |
| 20 to 24 Minutes | 13 (1.1%) | 8 (0.6%) |
| 25 to 29 Minutes | 1 (0.1%) | 9 (0.6%) |
| 30 to 34 Minutes | 78 (6.7%) | 169 (12.1%) |
| 35 to 39 Minutes | 8 (0.7%) | 41 (2.9%) |
| 40 to 44 Minutes | 0 (0.0%) | 133 (9.6%) |
| 45 to 59 Minutes | 190 (16.3%) | 242 (17.4%) |
| 60 to 89 Minutes | 15 (1.3%) | 0 (0.0%) |
| 90 or more Minutes | 46 (4.0%) | 0 (0.0%) |
Time of Departure to Work by Sex in Dillon
The most frequent times of departure to work in Dillon are 7:30 AM to 7:59 AM (454, 39.0%) for males and 4:00 PM to 11:59 PM (348, 25.0%) for females.
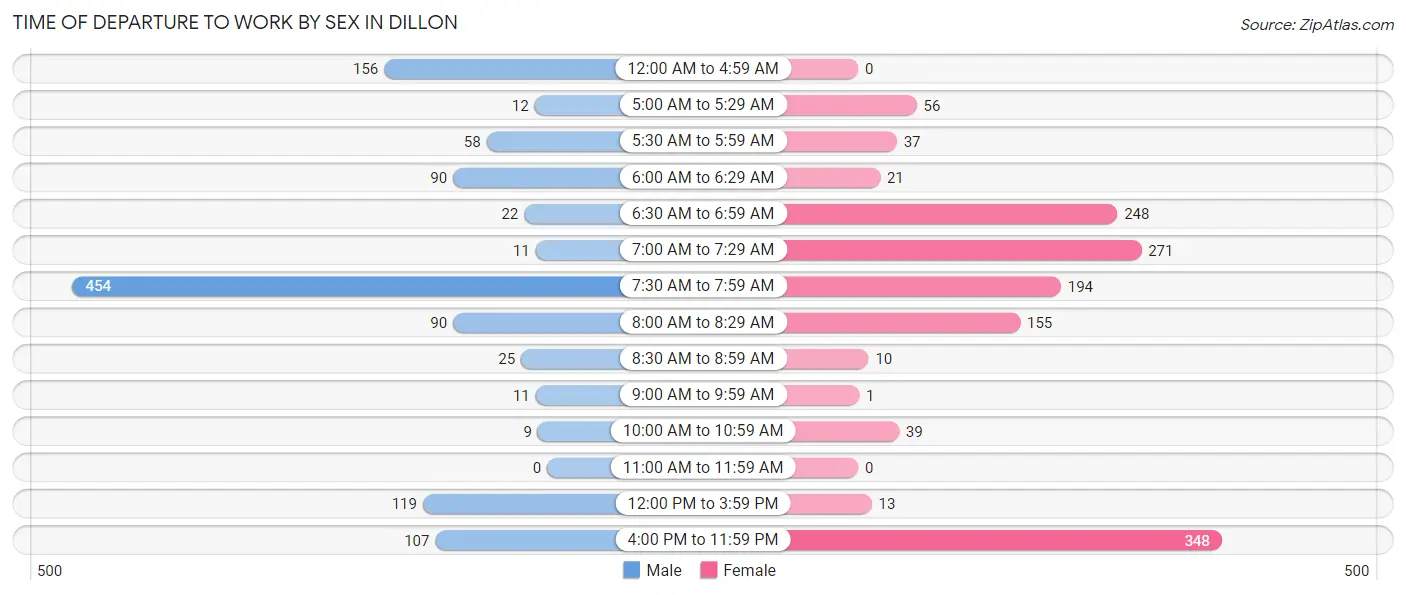
| Time of Departure | Male | Female |
| 12:00 AM to 4:59 AM | 156 (13.4%) | 0 (0.0%) |
| 5:00 AM to 5:29 AM | 12 (1.0%) | 56 (4.0%) |
| 5:30 AM to 5:59 AM | 58 (5.0%) | 37 (2.7%) |
| 6:00 AM to 6:29 AM | 90 (7.7%) | 21 (1.5%) |
| 6:30 AM to 6:59 AM | 22 (1.9%) | 248 (17.8%) |
| 7:00 AM to 7:29 AM | 11 (0.9%) | 271 (19.5%) |
| 7:30 AM to 7:59 AM | 454 (39.0%) | 194 (13.9%) |
| 8:00 AM to 8:29 AM | 90 (7.7%) | 155 (11.1%) |
| 8:30 AM to 8:59 AM | 25 (2.1%) | 10 (0.7%) |
| 9:00 AM to 9:59 AM | 11 (0.9%) | 1 (0.1%) |
| 10:00 AM to 10:59 AM | 9 (0.8%) | 39 (2.8%) |
| 11:00 AM to 11:59 AM | 0 (0.0%) | 0 (0.0%) |
| 12:00 PM to 3:59 PM | 119 (10.2%) | 13 (0.9%) |
| 4:00 PM to 11:59 PM | 107 (9.2%) | 348 (25.0%) |
| Total | 1,164 (100.0%) | 1,393 (100.0%) |
Housing Occupancy in Dillon
Occupancy by Ownership in Dillon
Of the total 2,376 dwellings in Dillon, owner-occupied units account for 1,010 (42.5%), while renter-occupied units make up 1,366 (57.5%).
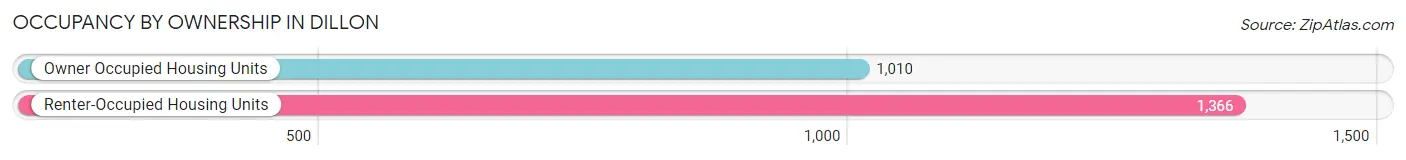
| Occupancy | # Housing Units | % Housing Units |
| Owner Occupied Housing Units | 1,010 | 42.5% |
| Renter-Occupied Housing Units | 1,366 | 57.5% |
| Total Occupied Housing Units | 2,376 | 100.0% |
Occupancy by Household Size in Dillon
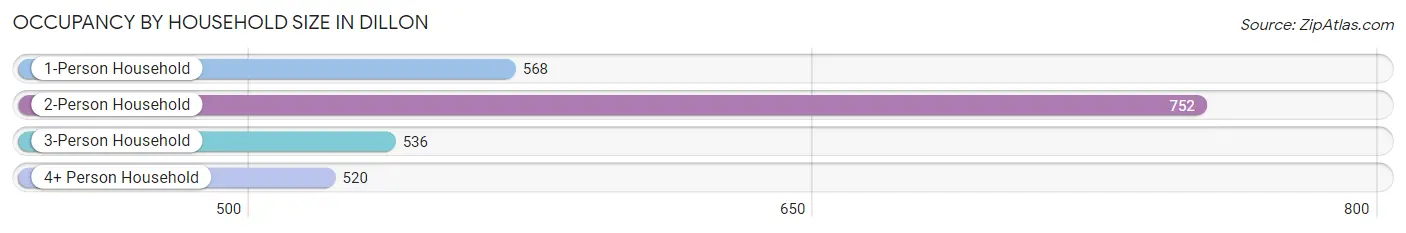
| Household Size | # Housing Units | % Housing Units |
| 1-Person Household | 568 | 23.9% |
| 2-Person Household | 752 | 31.7% |
| 3-Person Household | 536 | 22.6% |
| 4+ Person Household | 520 | 21.9% |
| Total Housing Units | 2,376 | 100.0% |
Occupancy by Ownership by Household Size in Dillon
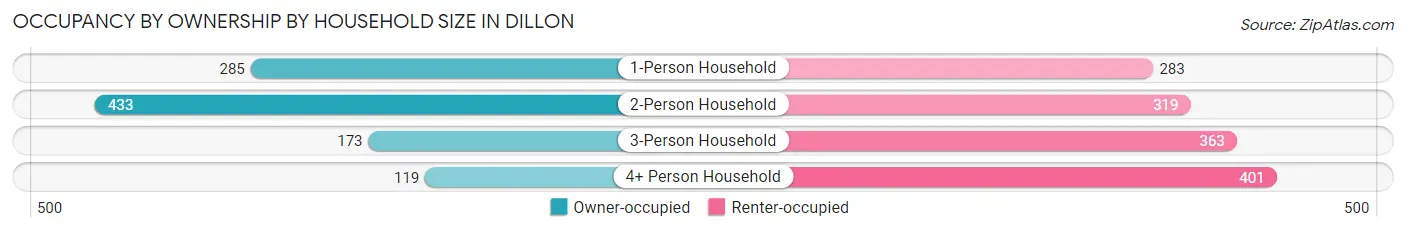
| Household Size | Owner-occupied | Renter-occupied |
| 1-Person Household | 285 (50.2%) | 283 (49.8%) |
| 2-Person Household | 433 (57.6%) | 319 (42.4%) |
| 3-Person Household | 173 (32.3%) | 363 (67.7%) |
| 4+ Person Household | 119 (22.9%) | 401 (77.1%) |
| Total Housing Units | 1,010 (42.5%) | 1,366 (57.5%) |
Occupancy by Educational Attainment in Dillon
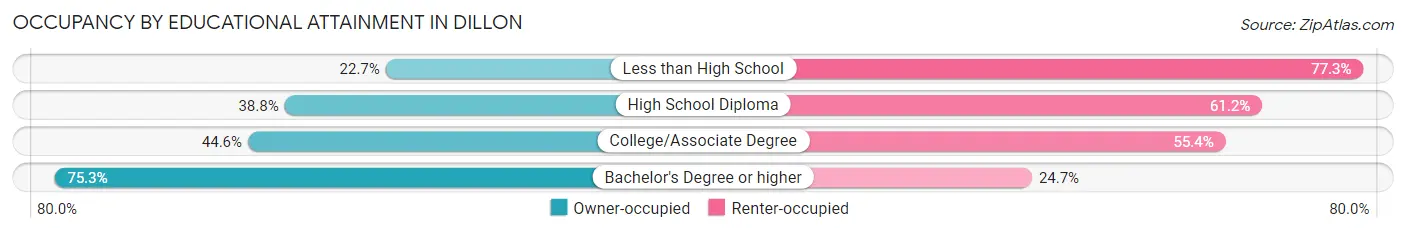
| Household Size | Owner-occupied | Renter-occupied |
| Less than High School | 108 (22.7%) | 367 (77.3%) |
| High School Diploma | 342 (38.8%) | 540 (61.2%) |
| College/Associate Degree | 301 (44.6%) | 374 (55.4%) |
| Bachelor's Degree or higher | 259 (75.3%) | 85 (24.7%) |
Occupancy by Age of Householder in Dillon
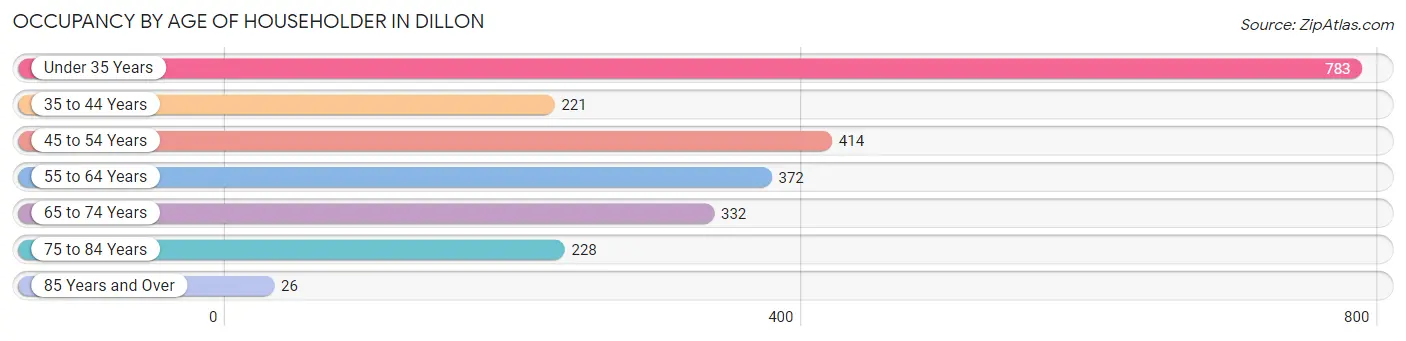
| Age Bracket | # Households | % Households |
| Under 35 Years | 783 | 33.0% |
| 35 to 44 Years | 221 | 9.3% |
| 45 to 54 Years | 414 | 17.4% |
| 55 to 64 Years | 372 | 15.7% |
| 65 to 74 Years | 332 | 14.0% |
| 75 to 84 Years | 228 | 9.6% |
| 85 Years and Over | 26 | 1.1% |
| Total | 2,376 | 100.0% |
Housing Finances in Dillon
Median Income by Occupancy in Dillon
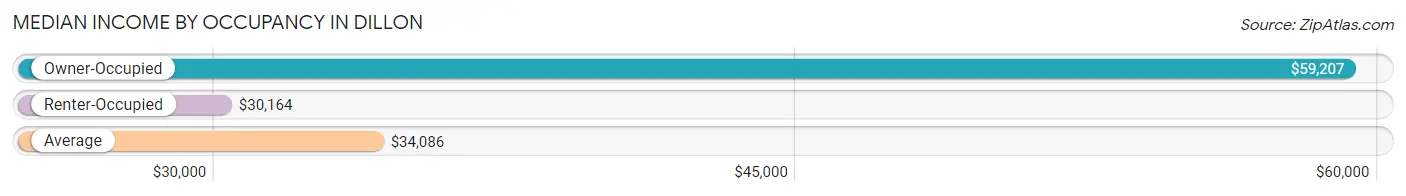
| Occupancy Type | # Households | Median Income |
| Owner-Occupied | 1,010 (42.5%) | $59,207 |
| Renter-Occupied | 1,366 (57.5%) | $30,164 |
| Average | 2,376 (100.0%) | $34,086 |
Occupancy by Householder Income Bracket in Dillon
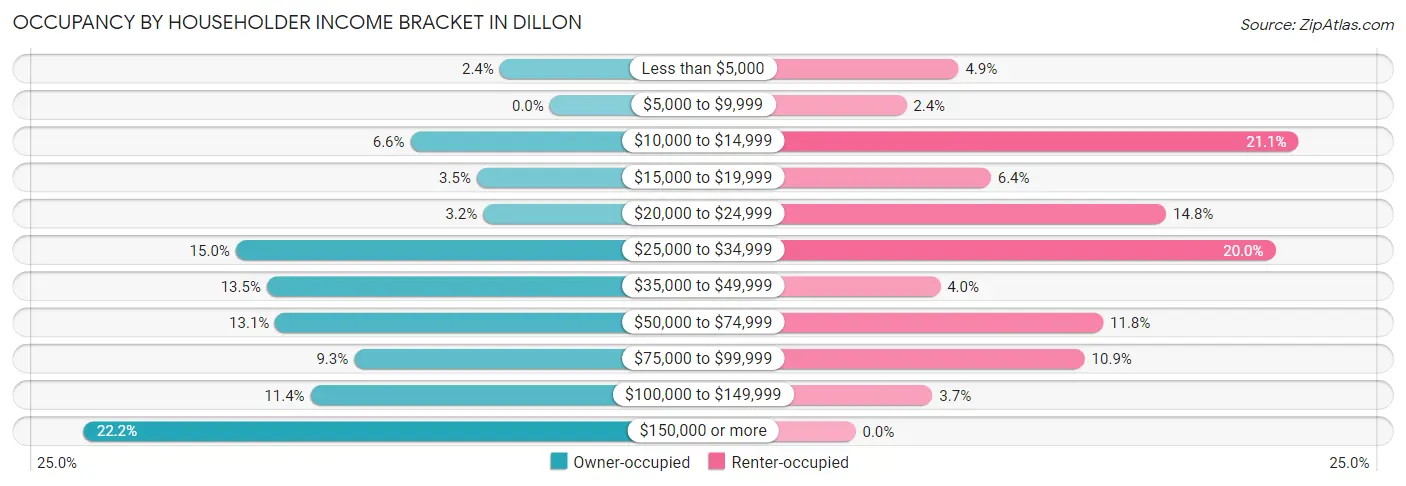
| Income Bracket | Owner-occupied | Renter-occupied |
| Less than $5,000 | 24 (2.4%) | 67 (4.9%) |
| $5,000 to $9,999 | 0 (0.0%) | 33 (2.4%) |
| $10,000 to $14,999 | 67 (6.6%) | 288 (21.1%) |
| $15,000 to $19,999 | 35 (3.5%) | 88 (6.4%) |
| $20,000 to $24,999 | 32 (3.2%) | 202 (14.8%) |
| $25,000 to $34,999 | 151 (14.9%) | 273 (20.0%) |
| $35,000 to $49,999 | 136 (13.5%) | 55 (4.0%) |
| $50,000 to $74,999 | 132 (13.1%) | 161 (11.8%) |
| $75,000 to $99,999 | 94 (9.3%) | 149 (10.9%) |
| $100,000 to $149,999 | 115 (11.4%) | 50 (3.7%) |
| $150,000 or more | 224 (22.2%) | 0 (0.0%) |
| Total | 1,010 (100.0%) | 1,366 (100.0%) |
Monthly Housing Cost Tiers in Dillon
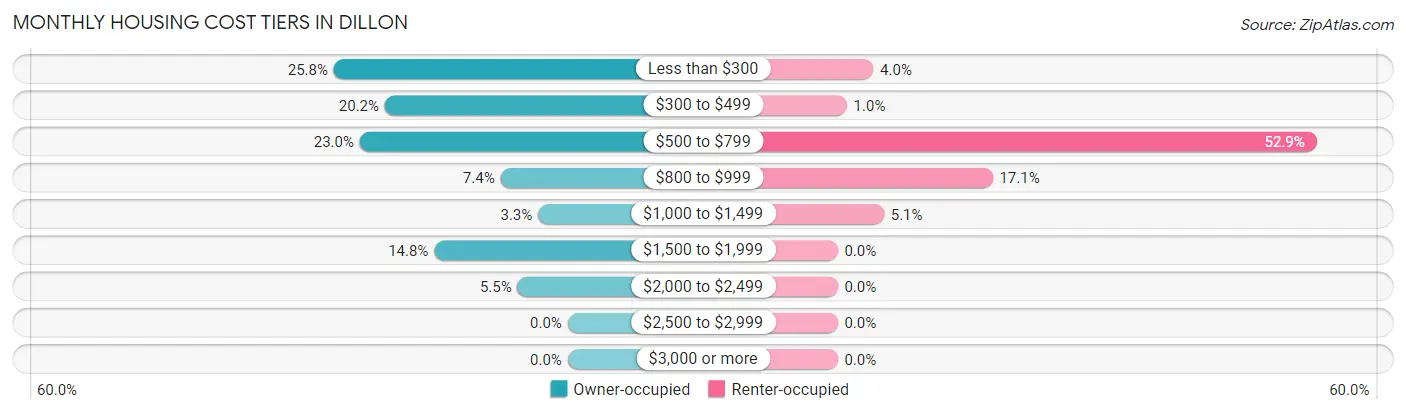
| Monthly Cost | Owner-occupied | Renter-occupied |
| Less than $300 | 261 (25.8%) | 54 (4.0%) |
| $300 to $499 | 204 (20.2%) | 14 (1.0%) |
| $500 to $799 | 232 (23.0%) | 723 (52.9%) |
| $800 to $999 | 75 (7.4%) | 234 (17.1%) |
| $1,000 to $1,499 | 33 (3.3%) | 70 (5.1%) |
| $1,500 to $1,999 | 149 (14.7%) | 0 (0.0%) |
| $2,000 to $2,499 | 56 (5.5%) | 0 (0.0%) |
| $2,500 to $2,999 | 0 (0.0%) | 0 (0.0%) |
| $3,000 or more | 0 (0.0%) | 0 (0.0%) |
| Total | 1,010 (100.0%) | 1,366 (100.0%) |
Physical Housing Characteristics in Dillon
Housing Structures in Dillon
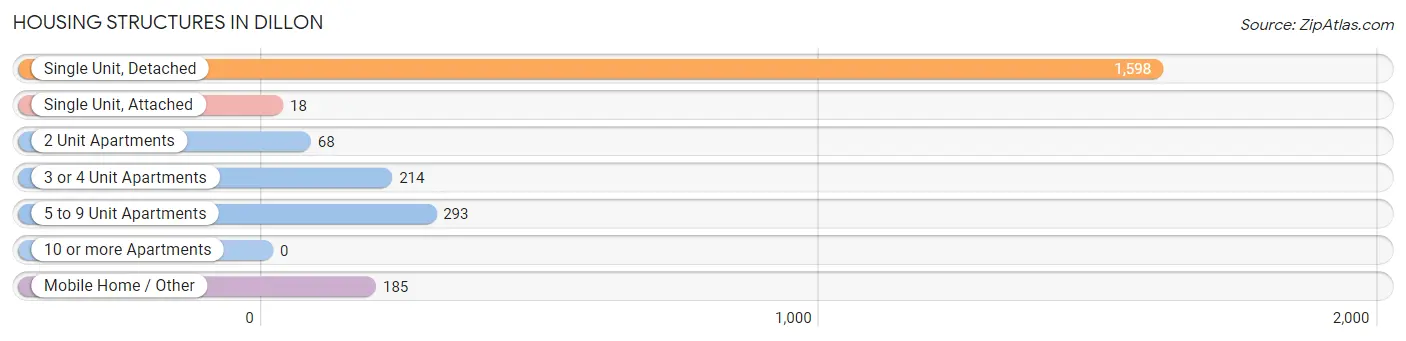
| Structure Type | # Housing Units | % Housing Units |
| Single Unit, Detached | 1,598 | 67.3% |
| Single Unit, Attached | 18 | 0.8% |
| 2 Unit Apartments | 68 | 2.9% |
| 3 or 4 Unit Apartments | 214 | 9.0% |
| 5 to 9 Unit Apartments | 293 | 12.3% |
| 10 or more Apartments | 0 | 0.0% |
| Mobile Home / Other | 185 | 7.8% |
| Total | 2,376 | 100.0% |
Housing Structures by Occupancy in Dillon
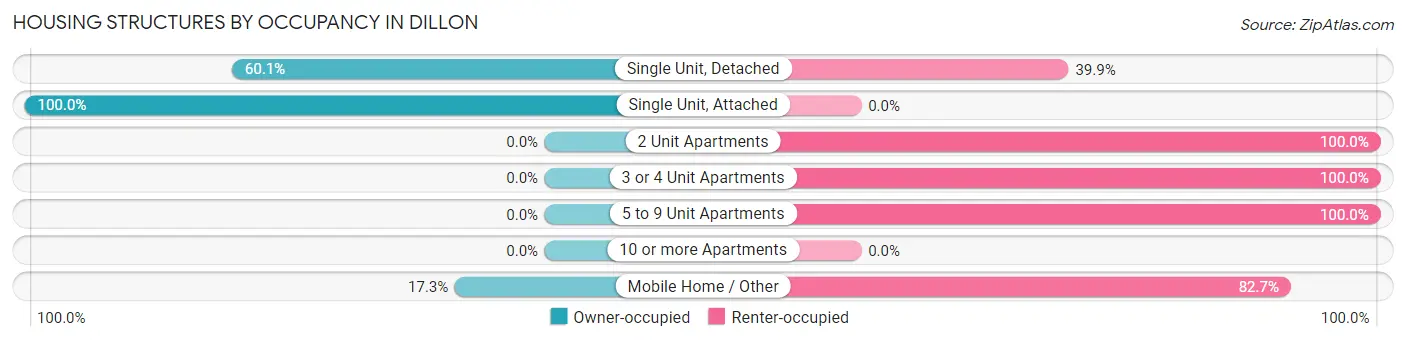
| Structure Type | Owner-occupied | Renter-occupied |
| Single Unit, Detached | 960 (60.1%) | 638 (39.9%) |
| Single Unit, Attached | 18 (100.0%) | 0 (0.0%) |
| 2 Unit Apartments | 0 (0.0%) | 68 (100.0%) |
| 3 or 4 Unit Apartments | 0 (0.0%) | 214 (100.0%) |
| 5 to 9 Unit Apartments | 0 (0.0%) | 293 (100.0%) |
| 10 or more Apartments | 0 (0.0%) | 0 (0.0%) |
| Mobile Home / Other | 32 (17.3%) | 153 (82.7%) |
| Total | 1,010 (42.5%) | 1,366 (57.5%) |
Housing Structures by Number of Rooms in Dillon
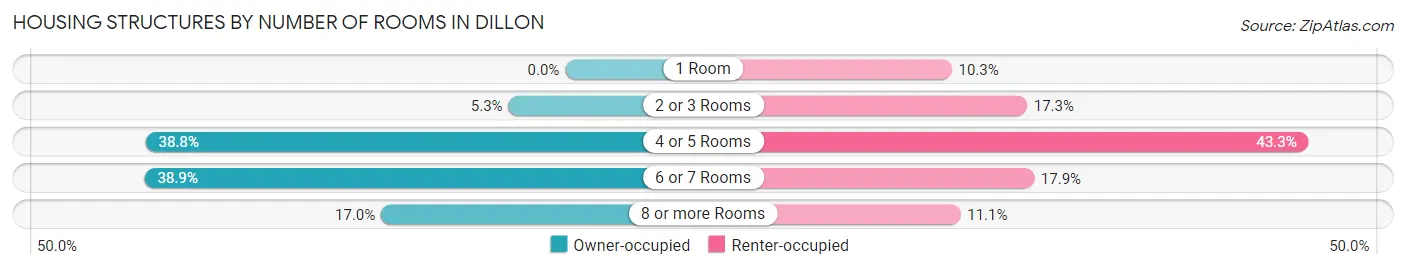
| Number of Rooms | Owner-occupied | Renter-occupied |
| 1 Room | 0 (0.0%) | 141 (10.3%) |
| 2 or 3 Rooms | 53 (5.2%) | 236 (17.3%) |
| 4 or 5 Rooms | 392 (38.8%) | 592 (43.3%) |
| 6 or 7 Rooms | 393 (38.9%) | 245 (17.9%) |
| 8 or more Rooms | 172 (17.0%) | 152 (11.1%) |
| Total | 1,010 (100.0%) | 1,366 (100.0%) |
Housing Structure by Heating Type in Dillon
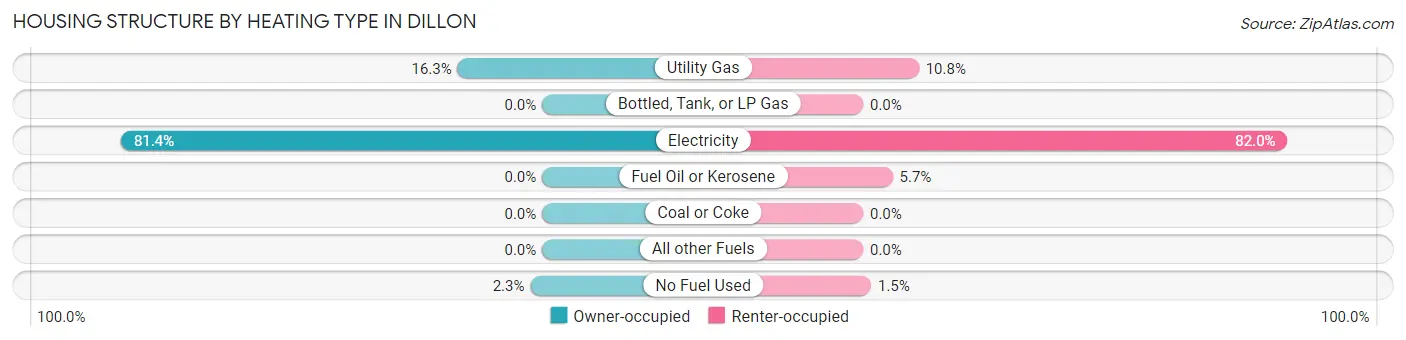
| Heating Type | Owner-occupied | Renter-occupied |
| Utility Gas | 165 (16.3%) | 147 (10.8%) |
| Bottled, Tank, or LP Gas | 0 (0.0%) | 0 (0.0%) |
| Electricity | 822 (81.4%) | 1,120 (82.0%) |
| Fuel Oil or Kerosene | 0 (0.0%) | 78 (5.7%) |
| Coal or Coke | 0 (0.0%) | 0 (0.0%) |
| All other Fuels | 0 (0.0%) | 0 (0.0%) |
| No Fuel Used | 23 (2.3%) | 21 (1.5%) |
| Total | 1,010 (100.0%) | 1,366 (100.0%) |
Household Vehicle Usage in Dillon
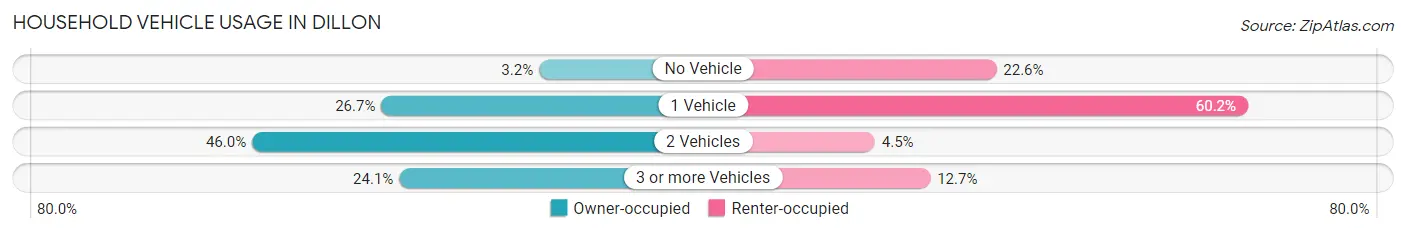
| Vehicles per Household | Owner-occupied | Renter-occupied |
| No Vehicle | 32 (3.2%) | 309 (22.6%) |
| 1 Vehicle | 270 (26.7%) | 822 (60.2%) |
| 2 Vehicles | 465 (46.0%) | 61 (4.5%) |
| 3 or more Vehicles | 243 (24.1%) | 174 (12.7%) |
| Total | 1,010 (100.0%) | 1,366 (100.0%) |
Real Estate & Mortgages in Dillon
Real Estate and Mortgage Overview in Dillon
| Characteristic | Without Mortgage | With Mortgage |
| Housing Units | 676 | 334 |
| Median Property Value | $110,200 | $163,200 |
| Median Household Income | $46,552 | $123 |
| Monthly Housing Costs | $380 | $0 |
| Real Estate Taxes | $478 | $0 |
Property Value by Mortgage Status in Dillon
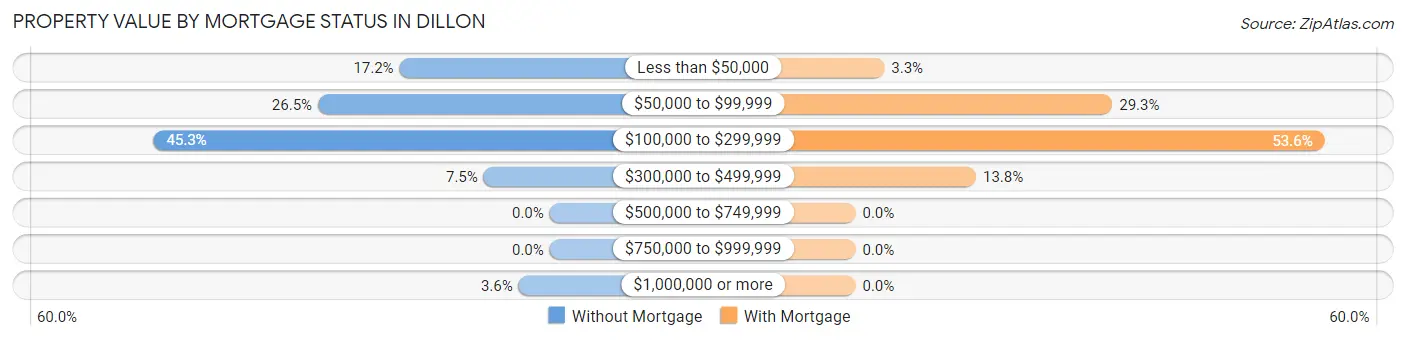
| Property Value | Without Mortgage | With Mortgage |
| Less than $50,000 | 116 (17.2%) | 11 (3.3%) |
| $50,000 to $99,999 | 179 (26.5%) | 98 (29.3%) |
| $100,000 to $299,999 | 306 (45.3%) | 179 (53.6%) |
| $300,000 to $499,999 | 51 (7.5%) | 46 (13.8%) |
| $500,000 to $749,999 | 0 (0.0%) | 0 (0.0%) |
| $750,000 to $999,999 | 0 (0.0%) | 0 (0.0%) |
| $1,000,000 or more | 24 (3.5%) | 0 (0.0%) |
| Total | 676 (100.0%) | 334 (100.0%) |
Household Income by Mortgage Status in Dillon
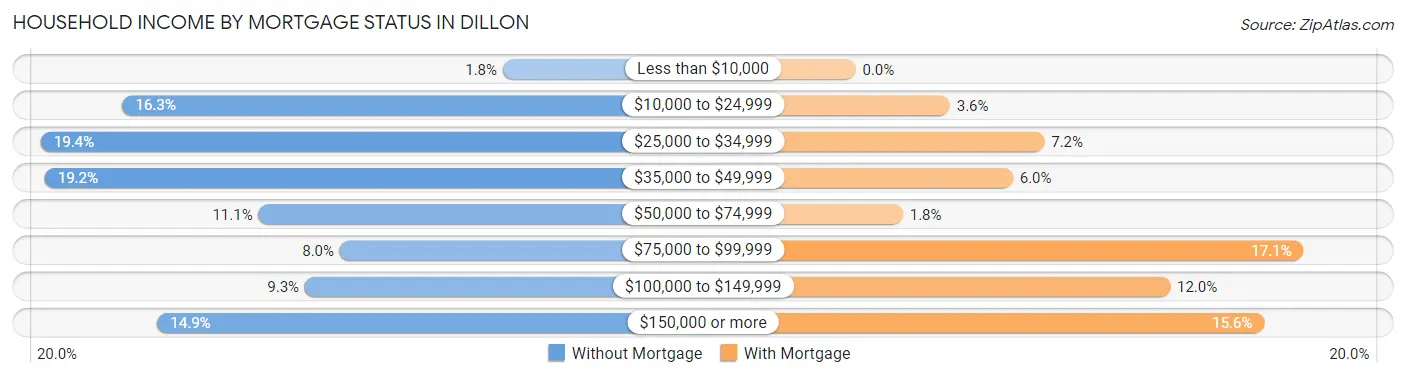
| Household Income | Without Mortgage | With Mortgage |
| Less than $10,000 | 12 (1.8%) | 0 (0.0%) |
| $10,000 to $24,999 | 110 (16.3%) | 12 (3.6%) |
| $25,000 to $34,999 | 131 (19.4%) | 24 (7.2%) |
| $35,000 to $49,999 | 130 (19.2%) | 20 (6.0%) |
| $50,000 to $74,999 | 75 (11.1%) | 6 (1.8%) |
| $75,000 to $99,999 | 54 (8.0%) | 57 (17.1%) |
| $100,000 to $149,999 | 63 (9.3%) | 40 (12.0%) |
| $150,000 or more | 101 (14.9%) | 52 (15.6%) |
| Total | 676 (100.0%) | 334 (100.0%) |
Property Value to Household Income Ratio in Dillon
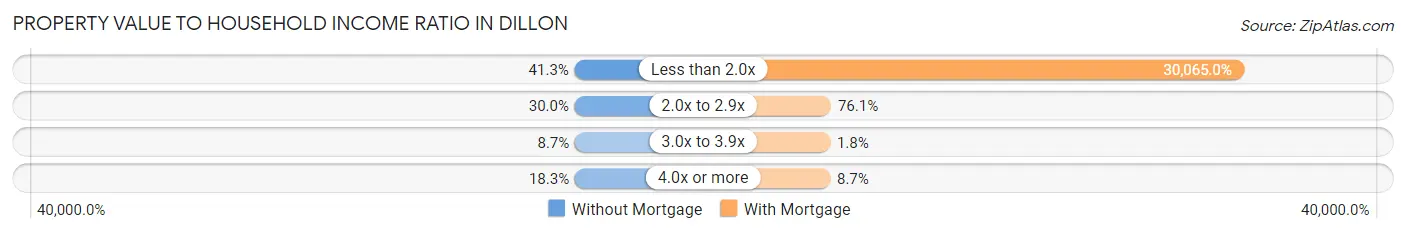
| Value-to-Income Ratio | Without Mortgage | With Mortgage |
| Less than 2.0x | 279 (41.3%) | 100,417 (30,065.0%) |
| 2.0x to 2.9x | 203 (30.0%) | 254 (76.0%) |
| 3.0x to 3.9x | 59 (8.7%) | 6 (1.8%) |
| 4.0x or more | 124 (18.3%) | 29 (8.7%) |
| Total | 676 (100.0%) | 334 (100.0%) |
Real Estate Taxes by Mortgage Status in Dillon
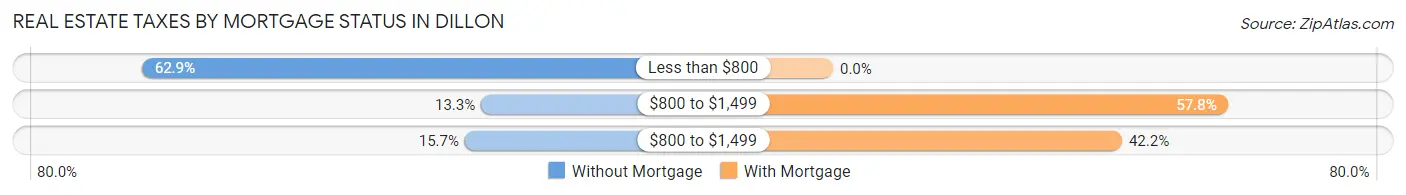
| Property Taxes | Without Mortgage | With Mortgage |
| Less than $800 | 425 (62.9%) | 0 (0.0%) |
| $800 to $1,499 | 90 (13.3%) | 193 (57.8%) |
| $800 to $1,499 | 106 (15.7%) | 141 (42.2%) |
| Total | 676 (100.0%) | 334 (100.0%) |
Health & Disability in Dillon
Health Insurance Coverage by Age in Dillon
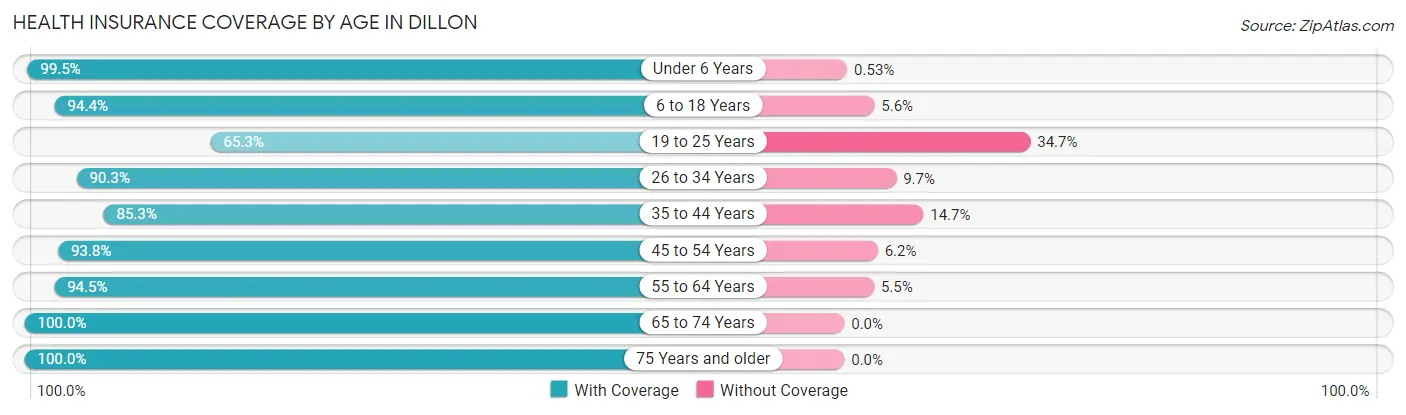
| Age Bracket | With Coverage | Without Coverage |
| Under 6 Years | 936 (99.5%) | 5 (0.5%) |
| 6 to 18 Years | 1,059 (94.4%) | 63 (5.6%) |
| 19 to 25 Years | 386 (65.3%) | 205 (34.7%) |
| 26 to 34 Years | 728 (90.3%) | 78 (9.7%) |
| 35 to 44 Years | 521 (85.3%) | 90 (14.7%) |
| 45 to 54 Years | 557 (93.8%) | 37 (6.2%) |
| 55 to 64 Years | 683 (94.5%) | 40 (5.5%) |
| 65 to 74 Years | 544 (100.0%) | 0 (0.0%) |
| 75 Years and older | 343 (100.0%) | 0 (0.0%) |
| Total | 5,757 (91.7%) | 518 (8.3%) |
Health Insurance Coverage by Citizenship Status in Dillon
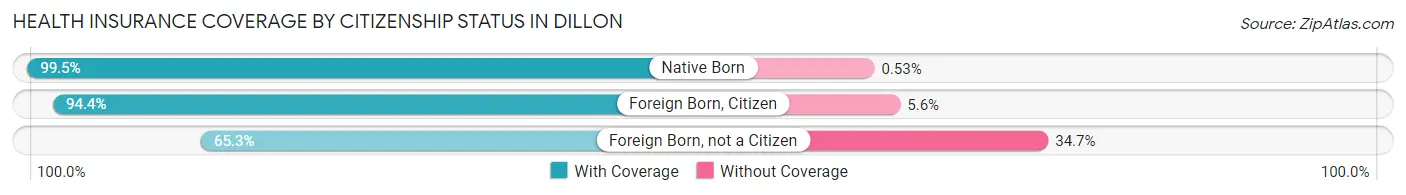
| Citizenship Status | With Coverage | Without Coverage |
| Native Born | 936 (99.5%) | 5 (0.5%) |
| Foreign Born, Citizen | 1,059 (94.4%) | 63 (5.6%) |
| Foreign Born, not a Citizen | 386 (65.3%) | 205 (34.7%) |
Health Insurance Coverage by Household Income in Dillon
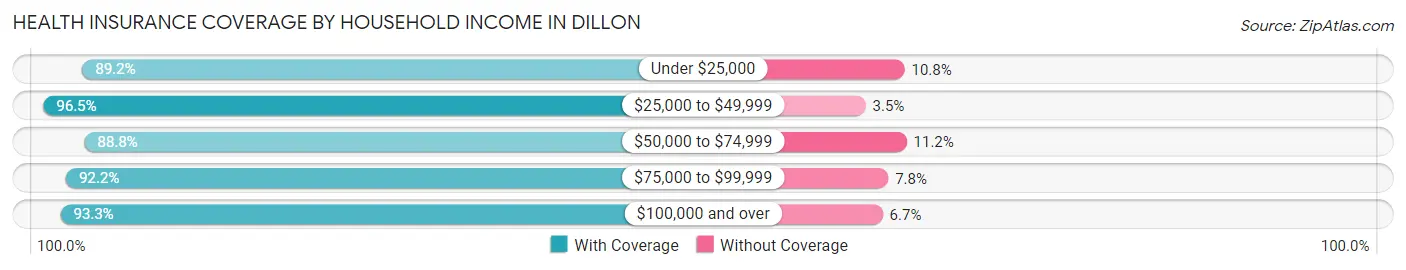
| Household Income | With Coverage | Without Coverage |
| Under $25,000 | 2,078 (89.2%) | 252 (10.8%) |
| $25,000 to $49,999 | 1,288 (96.5%) | 47 (3.5%) |
| $50,000 to $74,999 | 618 (88.8%) | 78 (11.2%) |
| $75,000 to $99,999 | 630 (92.2%) | 53 (7.8%) |
| $100,000 and over | 1,111 (93.3%) | 80 (6.7%) |
Public vs Private Health Insurance Coverage by Age in Dillon
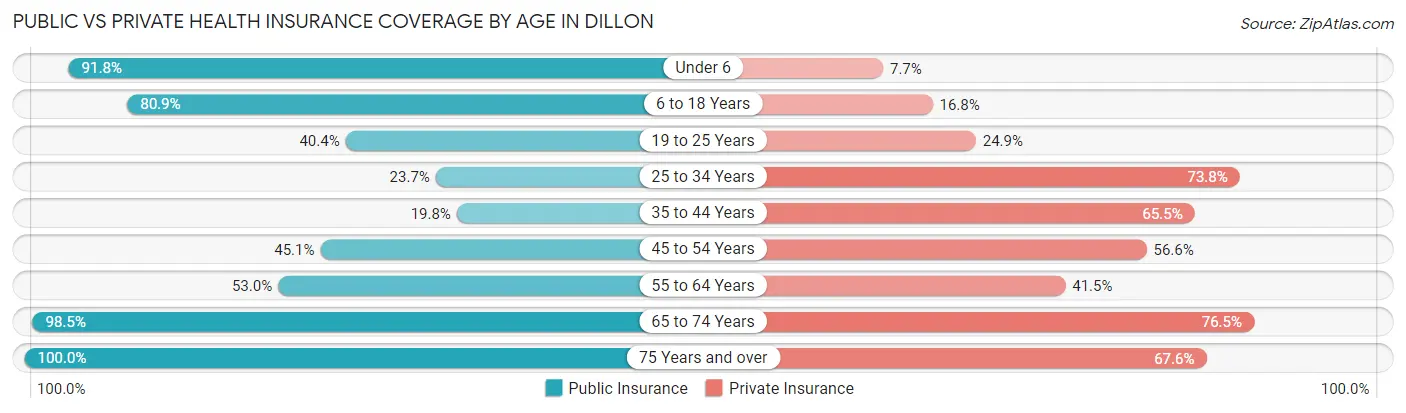
| Age Bracket | Public Insurance | Private Insurance |
| Under 6 | 864 (91.8%) | 72 (7.6%) |
| 6 to 18 Years | 908 (80.9%) | 189 (16.8%) |
| 19 to 25 Years | 239 (40.4%) | 147 (24.9%) |
| 25 to 34 Years | 191 (23.7%) | 595 (73.8%) |
| 35 to 44 Years | 121 (19.8%) | 400 (65.5%) |
| 45 to 54 Years | 268 (45.1%) | 336 (56.6%) |
| 55 to 64 Years | 383 (53.0%) | 300 (41.5%) |
| 65 to 74 Years | 536 (98.5%) | 416 (76.5%) |
| 75 Years and over | 343 (100.0%) | 232 (67.6%) |
| Total | 3,853 (61.4%) | 2,687 (42.8%) |
Disability Status by Sex by Age in Dillon
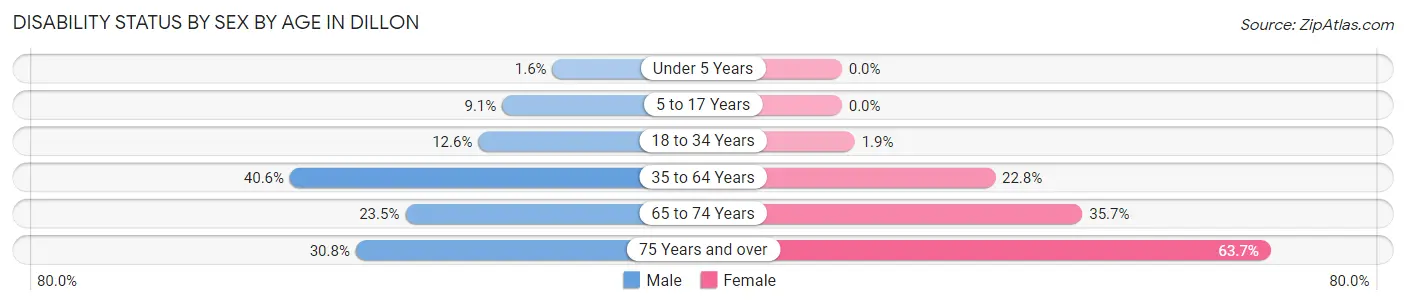
| Age Bracket | Male | Female |
| Under 5 Years | 11 (1.6%) | 0 (0.0%) |
| 5 to 17 Years | 57 (9.1%) | 0 (0.0%) |
| 18 to 34 Years | 69 (12.6%) | 18 (1.9%) |
| 35 to 64 Years | 344 (40.6%) | 246 (22.8%) |
| 65 to 74 Years | 62 (23.5%) | 100 (35.7%) |
| 75 Years and over | 37 (30.8%) | 142 (63.7%) |
Disability Class by Sex by Age in Dillon
Disability Class: Hearing Difficulty
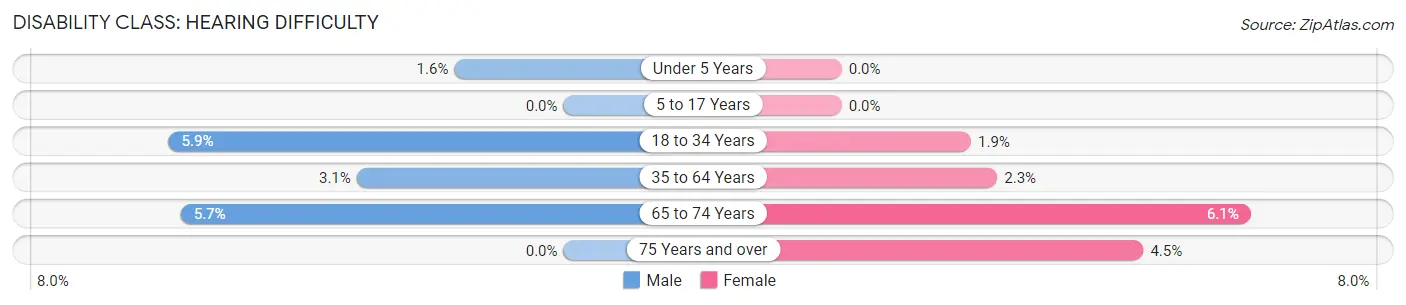
| Age Bracket | Male | Female |
| Under 5 Years | 11 (1.6%) | 0 (0.0%) |
| 5 to 17 Years | 0 (0.0%) | 0 (0.0%) |
| 18 to 34 Years | 32 (5.9%) | 18 (1.9%) |
| 35 to 64 Years | 26 (3.1%) | 25 (2.3%) |
| 65 to 74 Years | 15 (5.7%) | 17 (6.1%) |
| 75 Years and over | 0 (0.0%) | 10 (4.5%) |
Disability Class: Vision Difficulty
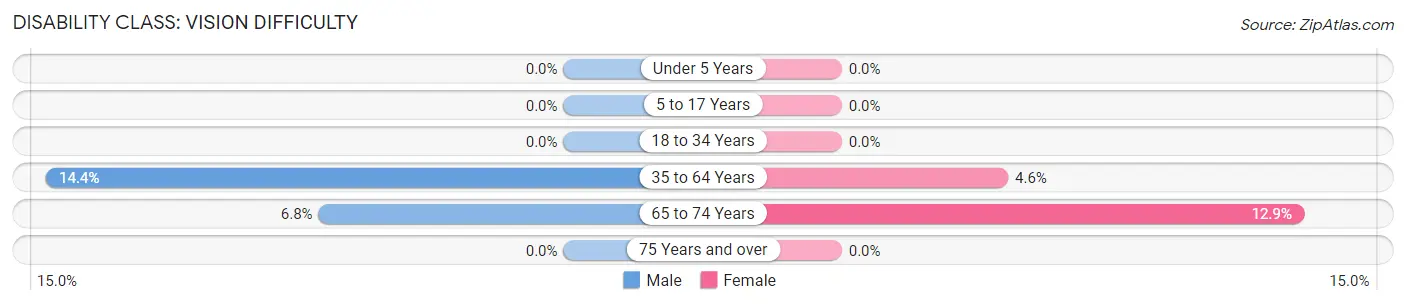
| Age Bracket | Male | Female |
| Under 5 Years | 0 (0.0%) | 0 (0.0%) |
| 5 to 17 Years | 0 (0.0%) | 0 (0.0%) |
| 18 to 34 Years | 0 (0.0%) | 0 (0.0%) |
| 35 to 64 Years | 122 (14.4%) | 50 (4.6%) |
| 65 to 74 Years | 18 (6.8%) | 36 (12.9%) |
| 75 Years and over | 0 (0.0%) | 0 (0.0%) |
Disability Class: Cognitive Difficulty
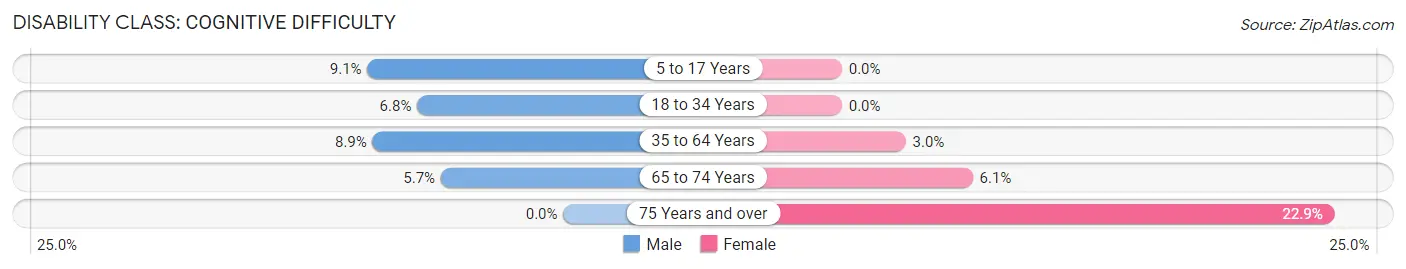
| Age Bracket | Male | Female |
| 5 to 17 Years | 57 (9.1%) | 0 (0.0%) |
| 18 to 34 Years | 37 (6.8%) | 0 (0.0%) |
| 35 to 64 Years | 75 (8.8%) | 32 (3.0%) |
| 65 to 74 Years | 15 (5.7%) | 17 (6.1%) |
| 75 Years and over | 0 (0.0%) | 51 (22.9%) |
Disability Class: Ambulatory Difficulty
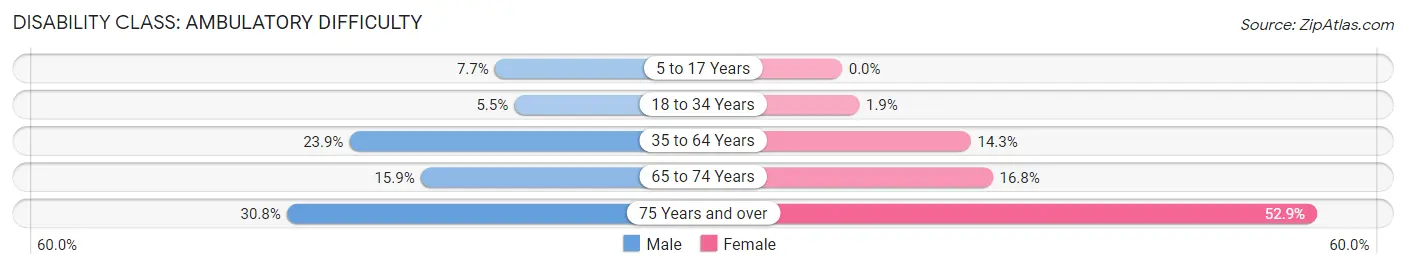
| Age Bracket | Male | Female |
| 5 to 17 Years | 48 (7.7%) | 0 (0.0%) |
| 18 to 34 Years | 30 (5.5%) | 18 (1.9%) |
| 35 to 64 Years | 202 (23.8%) | 155 (14.3%) |
| 65 to 74 Years | 42 (15.9%) | 47 (16.8%) |
| 75 Years and over | 37 (30.8%) | 118 (52.9%) |
Disability Class: Self-Care Difficulty
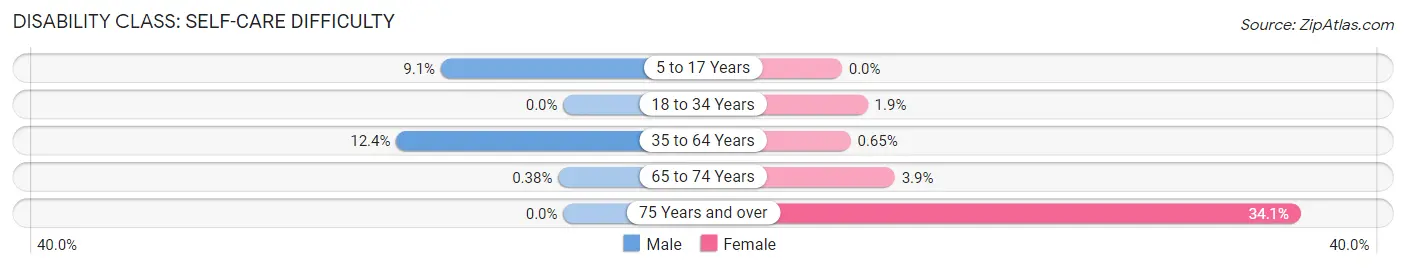
| Age Bracket | Male | Female |
| 5 to 17 Years | 57 (9.1%) | 0 (0.0%) |
| 18 to 34 Years | 0 (0.0%) | 18 (1.9%) |
| 35 to 64 Years | 105 (12.4%) | 7 (0.6%) |
| 65 to 74 Years | 1 (0.4%) | 11 (3.9%) |
| 75 Years and over | 0 (0.0%) | 76 (34.1%) |
Technology Access in Dillon
Computing Device Access in Dillon
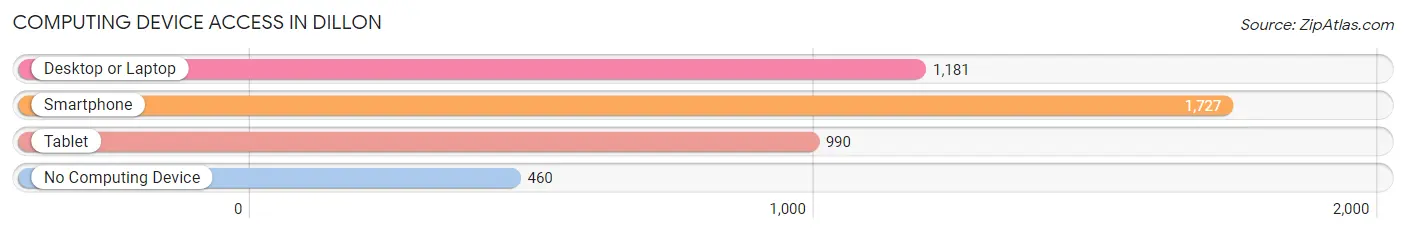
| Device Type | # Households | % Households |
| Desktop or Laptop | 1,181 | 49.7% |
| Smartphone | 1,727 | 72.7% |
| Tablet | 990 | 41.7% |
| No Computing Device | 460 | 19.4% |
| Total | 2,376 | 100.0% |
Internet Access in Dillon
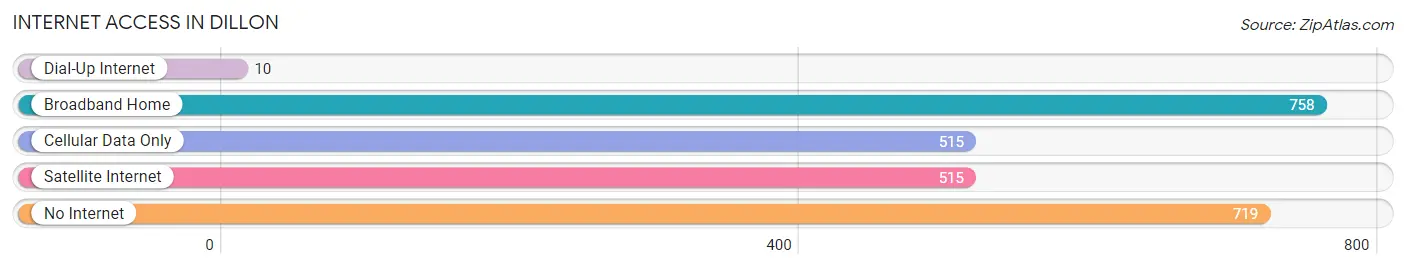
| Internet Type | # Households | % Households |
| Dial-Up Internet | 10 | 0.4% |
| Broadband Home | 758 | 31.9% |
| Cellular Data Only | 515 | 21.7% |
| Satellite Internet | 515 | 21.7% |
| No Internet | 719 | 30.3% |
| Total | 2,376 | 100.0% |
Dillon Summary
Dillon, South Carolina is a small town located in the northeastern corner of the state, near the border with North Carolina. It is the county seat of Dillon County and is part of the Florence Metropolitan Statistical Area. The town has a population of approximately 6,000 people and is known for its rich history, diverse geography, and vibrant economy.
History
Dillon was founded in 1888 by the Dillon Land and Improvement Company, which was formed by a group of investors from Charleston. The town was named after James W. Dillon, a prominent local businessman and politician. The town quickly grew and by the early 1900s, it had become a major center for the lumber and turpentine industries. In the 1920s, the town was home to several cotton mills, which provided employment for many of the town’s residents.
In the 1950s, the town began to experience a decline in its economy as the lumber and turpentine industries began to decline. However, the town was able to rebound in the 1960s and 1970s with the development of the local tobacco industry. The town also experienced a population boom during this time, as many people moved to the area to take advantage of the new job opportunities.
Geography
Dillon is located in the northeastern corner of South Carolina, near the border with North Carolina. The town is situated on the banks of the Little Pee Dee River, which flows through the town and provides a scenic backdrop. The town is surrounded by a variety of natural features, including the Great Pee Dee National Wildlife Refuge, the Waccamaw National Wildlife Refuge, and the Francis Marion National Forest.
The town is located in a humid subtropical climate zone, which means that it experiences hot, humid summers and mild winters. The average annual temperature is around 70 degrees Fahrenheit, with the hottest months being July and August. The town receives an average of 48 inches of precipitation per year, with the wettest months being April and May.
Economy
Dillon’s economy is largely based on agriculture and manufacturing. The town is home to several large agricultural operations, including poultry farms, hog farms, and cotton farms. The town is also home to several manufacturing companies, including a paper mill, a furniture factory, and a plastics factory.
The town is also home to several retail stores, restaurants, and other businesses. The town is served by several major highways, including Interstate 95 and US Highway 301, which provide access to nearby cities and towns.
Demographics
As of the 2010 census, the population of Dillon was 6,068. The town is predominantly white, with African Americans making up the largest minority group at 28.3%. The median household income in the town is $30,945, and the median age is 37.7 years.
Dillon is a small town with a rich history, diverse geography, and vibrant economy. The town is home to a variety of businesses and industries, and its population is diverse and growing. The town is a great place to live, work, and raise a family.
Common Questions
What is Per Capita Income in Dillon?
Per Capita income in Dillon is $23,122.
What is the Median Family Income in Dillon?
Median Family Income in Dillon is $33,686.
What is the Median Household income in Dillon?
Median Household Income in Dillon is $34,086.
What is Income or Wage Gap in Dillon?
Income or Wage Gap in Dillon is 40.5%.
Women in Dillon earn 59.5 cents for every dollar earned by a man.
What is Family Income Deficit in Dillon?
Family Income Deficit in Dillon is $9,335.
Families that are below poverty line in Dillon earn $9,335 less on average than the poverty threshold level.
What is Inequality or Gini Index in Dillon?
Inequality or Gini Index in Dillon is 0.50.
What is the Total Population of Dillon?
Total Population of Dillon is 6,454.
What is the Total Male Population of Dillon?
Total Male Population of Dillon is 3,205.
What is the Total Female Population of Dillon?
Total Female Population of Dillon is 3,249.
What is the Ratio of Males per 100 Females in Dillon?
There are 98.65 Males per 100 Females in Dillon.
What is the Ratio of Females per 100 Males in Dillon?
There are 101.37 Females per 100 Males in Dillon.
What is the Median Population Age in Dillon?
Median Population Age in Dillon is 30.7 Years.
What is the Average Family Size in Dillon
Average Family Size in Dillon is 3.0 People.
What is the Average Household Size in Dillon
Average Household Size in Dillon is 2.6 People.
How Large is the Labor Force in Dillon?
There are 2,677 People in the Labor Forcein in Dillon.
What is the Percentage of People in the Labor Force in Dillon?
57.5% of People are in the Labor Force in Dillon.
What is the Unemployment Rate in Dillon?
Unemployment Rate in Dillon is 3.9%.