Judson, SC Map & Demographics
Judson Map
Judson Overview
$16,442
PER CAPITA INCOME
$28,497
AVG FAMILY INCOME
$28,207
AVG HOUSEHOLD INCOME
23.6%
WAGE / INCOME GAP [ % ]
76.4¢/ $1
WAGE / INCOME GAP [ $ ]
0.46
INEQUALITY / GINI INDEX
1,879
TOTAL POPULATION
867
MALE POPULATION
1,012
FEMALE POPULATION
85.67
MALES / 100 FEMALES
116.72
FEMALES / 100 MALES
34.6
MEDIAN AGE
3.2
AVG FAMILY SIZE
2.7
AVG HOUSEHOLD SIZE
777
LABOR FORCE [ PEOPLE ]
55.0%
PERCENT IN LABOR FORCE
21.9%
UNEMPLOYMENT RATE
Income in Judson
Income Overview in Judson
Per Capita Income in Judson is $16,442, while median incomes of families and households are $28,497 and $28,207 respectively.
| Characteristic | Number | Measure |
| Per Capita Income | 1,879 | $16,442 |
| Median Family Income | 493 | $28,497 |
| Mean Family Income | 493 | $45,294 |
| Median Household Income | 690 | $28,207 |
| Mean Household Income | 690 | $44,503 |
| Income Deficit | 493 | $0 |
| Wage / Income Gap (%) | 1,879 | 23.60% |
| Wage / Income Gap ($) | 1,879 | 76.40¢ per $1 |
| Gini / Inequality Index | 1,879 | 0.46 |
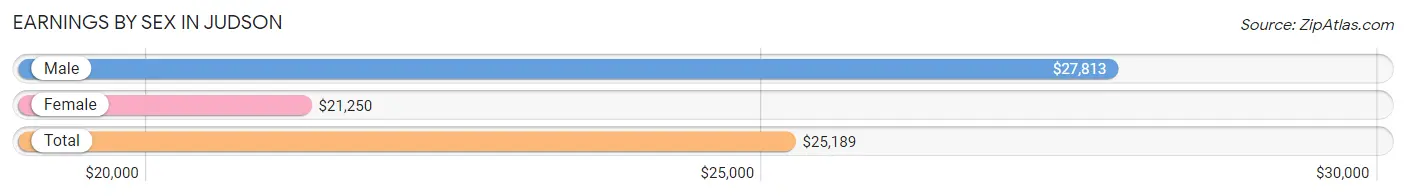
Earnings by Sex in Judson
Average Earnings in Judson are $25,189, $27,813 for men and $21,250 for women, a difference of 23.6%.
| Sex | Number | Average Earnings |
| Male | 328 (46.1%) | $27,813 |
| Female | 383 (53.9%) | $21,250 |
| Total | 711 (100.0%) | $25,189 |
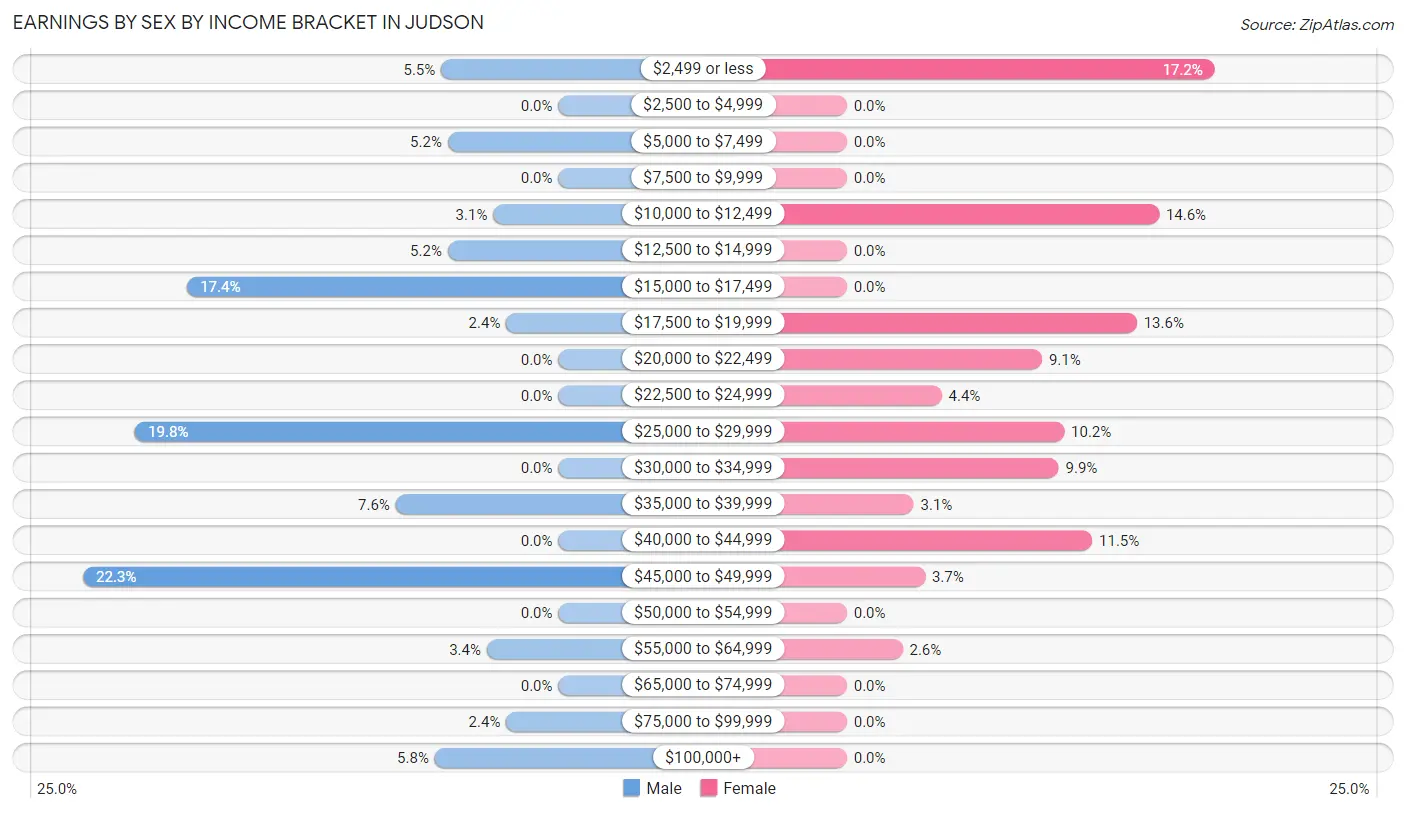
Earnings by Sex by Income Bracket in Judson
The most common earnings brackets in Judson are $45,000 to $49,999 for men (73 | 22.3%) and $2,499 or less for women (66 | 17.2%).
| Income | Male | Female |
| $2,499 or less | 18 (5.5%) | 66 (17.2%) |
| $2,500 to $4,999 | 0 (0.0%) | 0 (0.0%) |
| $5,000 to $7,499 | 17 (5.2%) | 0 (0.0%) |
| $7,500 to $9,999 | 0 (0.0%) | 0 (0.0%) |
| $10,000 to $12,499 | 10 (3.0%) | 56 (14.6%) |
| $12,500 to $14,999 | 17 (5.2%) | 0 (0.0%) |
| $15,000 to $17,499 | 57 (17.4%) | 0 (0.0%) |
| $17,500 to $19,999 | 8 (2.4%) | 52 (13.6%) |
| $20,000 to $22,499 | 0 (0.0%) | 35 (9.1%) |
| $22,500 to $24,999 | 0 (0.0%) | 17 (4.4%) |
| $25,000 to $29,999 | 65 (19.8%) | 39 (10.2%) |
| $30,000 to $34,999 | 0 (0.0%) | 38 (9.9%) |
| $35,000 to $39,999 | 25 (7.6%) | 12 (3.1%) |
| $40,000 to $44,999 | 0 (0.0%) | 44 (11.5%) |
| $45,000 to $49,999 | 73 (22.3%) | 14 (3.7%) |
| $50,000 to $54,999 | 0 (0.0%) | 0 (0.0%) |
| $55,000 to $64,999 | 11 (3.4%) | 10 (2.6%) |
| $65,000 to $74,999 | 0 (0.0%) | 0 (0.0%) |
| $75,000 to $99,999 | 8 (2.4%) | 0 (0.0%) |
| $100,000+ | 19 (5.8%) | 0 (0.0%) |
| Total | 328 (100.0%) | 383 (100.0%) |
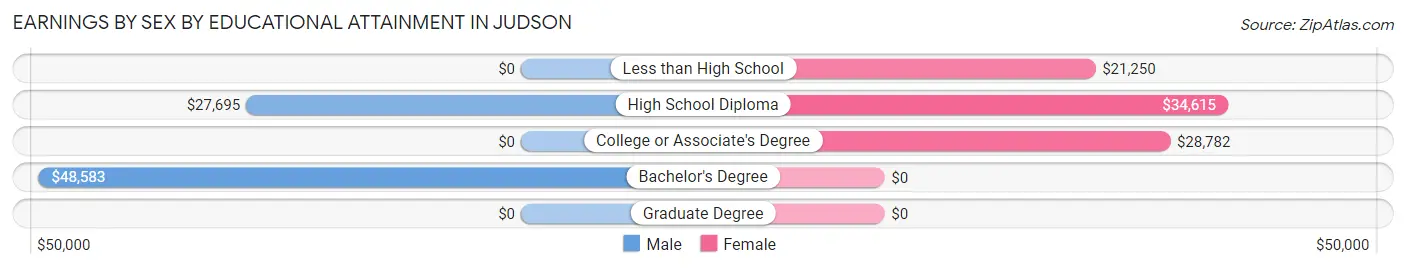
Earnings by Sex by Educational Attainment in Judson
Average earnings in Judson are $29,258 for men and $29,167 for women, a difference of 0.3%. Men with an educational attainment of bachelor's degree enjoy the highest average annual earnings of $48,583, while those with high school diploma education earn the least with $27,695. Women with an educational attainment of high school diploma earn the most with the average annual earnings of $34,615, while those with less than high school education have the smallest earnings of $21,250.
| Educational Attainment | Male Income | Female Income |
| Less than High School | - | - |
| High School Diploma | $27,695 | $34,615 |
| College or Associate's Degree | - | - |
| Bachelor's Degree | $48,583 | $0 |
| Graduate Degree | - | - |
| Total | $29,258 | $29,167 |
Family Income in Judson
Family Income Brackets in Judson
According to the Judson family income data, there are 174 families falling into the $25,000 to $34,999 income range, which is the most common income bracket and makes up 35.3% of all families.
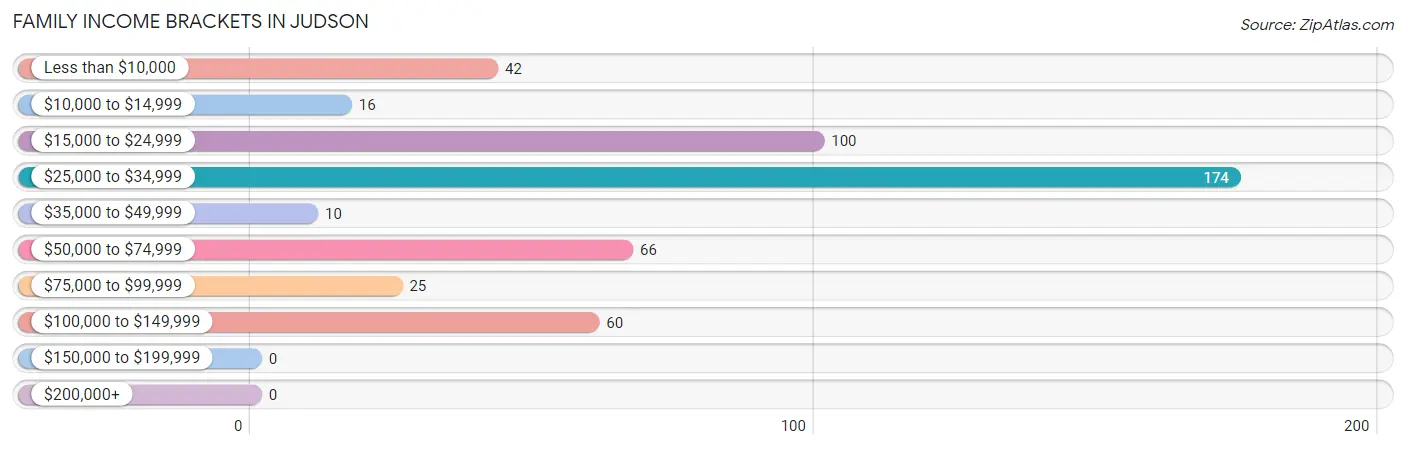
| Income Bracket | # Families | % Families |
| Less than $10,000 | 42 | 8.5% |
| $10,000 to $14,999 | 16 | 3.2% |
| $15,000 to $24,999 | 100 | 20.3% |
| $25,000 to $34,999 | 174 | 35.3% |
| $35,000 to $49,999 | 10 | 2.0% |
| $50,000 to $74,999 | 66 | 13.4% |
| $75,000 to $99,999 | 25 | 5.1% |
| $100,000 to $149,999 | 60 | 12.2% |
| $150,000 to $199,999 | 0 | 0.0% |
| $200,000+ | 0 | 0.0% |
Family Income by Famaliy Size in Judson
3-person families (201 | 40.8%) account for the highest median family income in Judson with $27,137 per family, while 3-person families (201 | 40.8%) have the highest median income of $9,046 per family member.
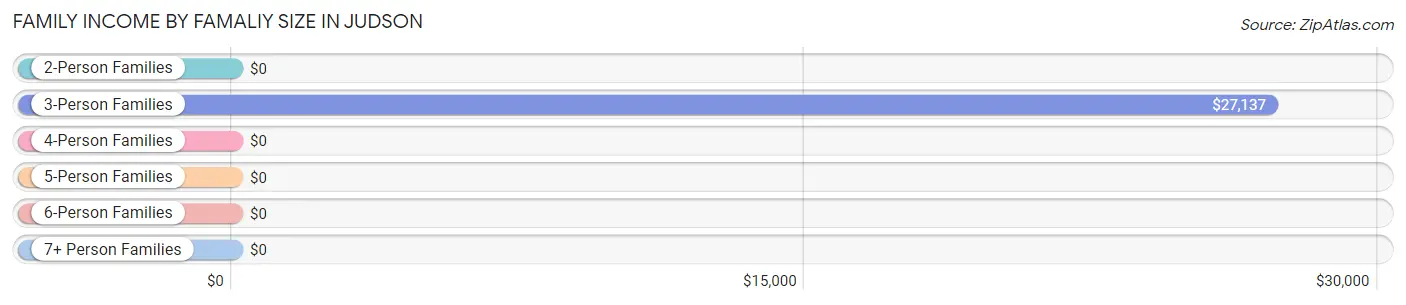
| Income Bracket | # Families | Median Income |
| 2-Person Families | 176 (35.7%) | $0 |
| 3-Person Families | 201 (40.8%) | $27,137 |
| 4-Person Families | 44 (8.9%) | $0 |
| 5-Person Families | 26 (5.3%) | $0 |
| 6-Person Families | 46 (9.3%) | $0 |
| 7+ Person Families | 0 (0.0%) | $0 |
| Total | 493 (100.0%) | $28,497 |
Family Income by Number of Earners in Judson
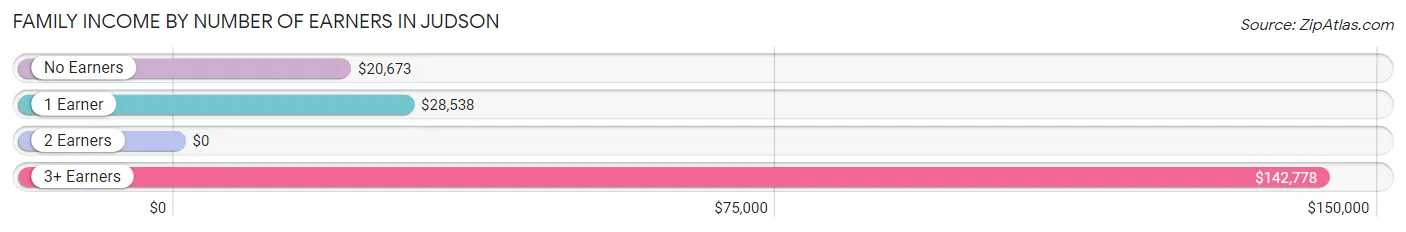
| Number of Earners | # Families | Median Income |
| No Earners | 123 (24.9%) | $20,673 |
| 1 Earner | 290 (58.8%) | $28,538 |
| 2 Earners | 0 (0.0%) | $0 |
| 3+ Earners | 80 (16.2%) | $142,778 |
| Total | 493 (100.0%) | $28,497 |
Household Income in Judson
Household Income Brackets in Judson
With 219 households falling in the category, the $25,000 to $34,999 income range is the most frequent in Judson, accounting for 31.7% of all households.
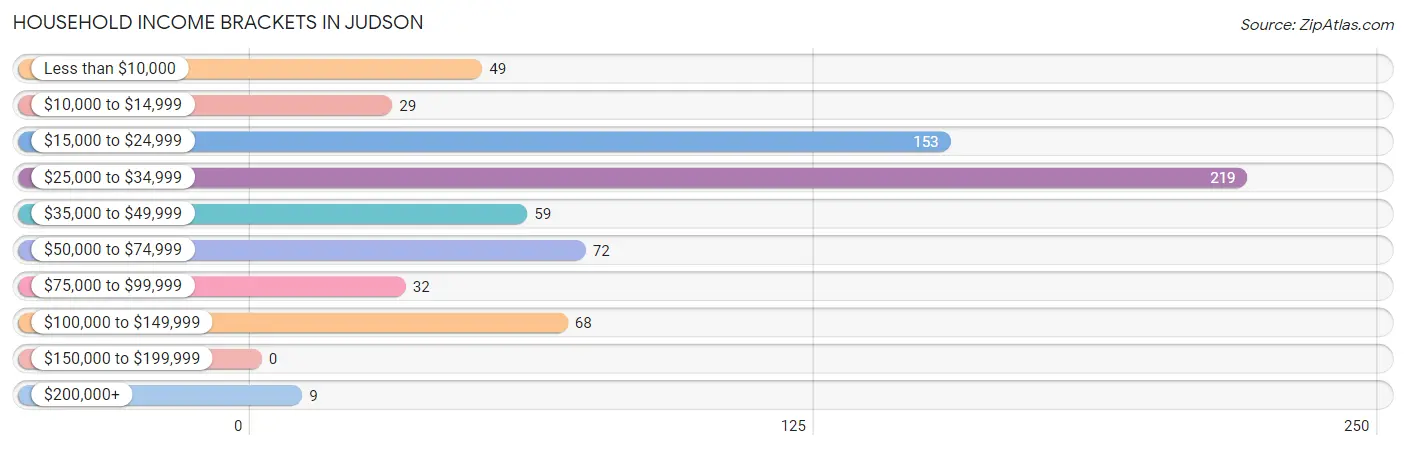
| Income Bracket | # Households | % Households |
| Less than $10,000 | 49 | 7.1% |
| $10,000 to $14,999 | 29 | 4.2% |
| $15,000 to $24,999 | 153 | 22.2% |
| $25,000 to $34,999 | 219 | 31.7% |
| $35,000 to $49,999 | 59 | 8.6% |
| $50,000 to $74,999 | 72 | 10.4% |
| $75,000 to $99,999 | 32 | 4.6% |
| $100,000 to $149,999 | 68 | 9.9% |
| $150,000 to $199,999 | 0 | 0.0% |
| $200,000+ | 9 | 1.3% |
Household Income by Householder Age in Judson
The median household income in Judson is $28,207, with the highest median household income of $29,598 found in the 45 to 64 years age bracket for the primary householder. A total of 260 households (37.7%) fall into this category. Meanwhile, the 15 to 24 years age bracket for the primary householder has the lowest median household income of $0, with 13 households (1.9%) in this group.
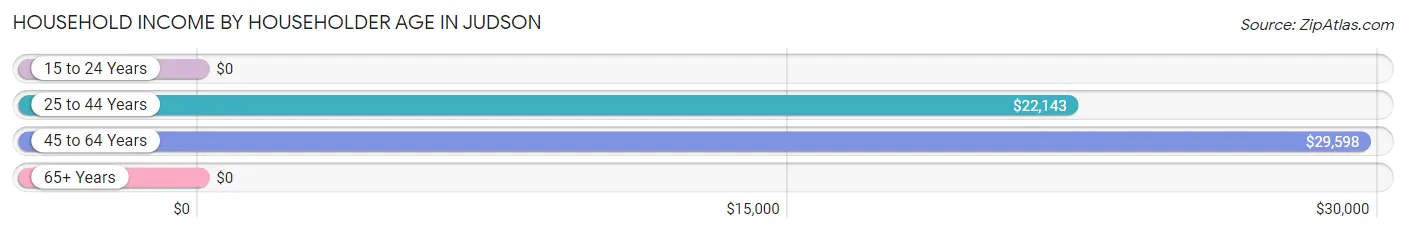
| Income Bracket | # Households | Median Income |
| 15 to 24 Years | 13 (1.9%) | $0 |
| 25 to 44 Years | 278 (40.3%) | $22,143 |
| 45 to 64 Years | 260 (37.7%) | $29,598 |
| 65+ Years | 139 (20.1%) | $0 |
| Total | 690 (100.0%) | $28,207 |
Poverty in Judson
Income Below Poverty by Sex and Age in Judson
With 40.7% poverty level for males and 48.2% for females among the residents of Judson, under 5 year old males and 35 to 44 year old females are the most vulnerable to poverty, with 26 males (100.0%) and 141 females (72.7%) in their respective age groups living below the poverty level.
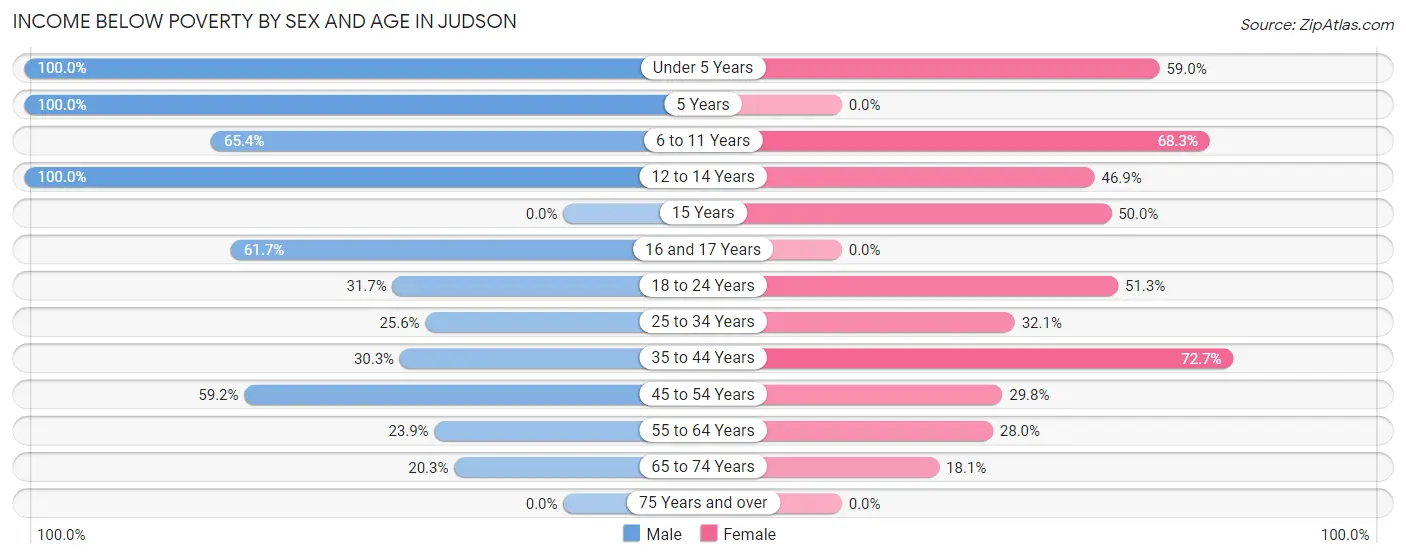
| Age Bracket | Male | Female |
| Under 5 Years | 26 (100.0%) | 46 (59.0%) |
| 5 Years | 33 (100.0%) | 0 (0.0%) |
| 6 to 11 Years | 51 (65.4%) | 56 (68.3%) |
| 12 to 14 Years | 32 (100.0%) | 38 (46.9%) |
| 15 Years | 0 (0.0%) | 28 (50.0%) |
| 16 and 17 Years | 29 (61.7%) | 0 (0.0%) |
| 18 to 24 Years | 13 (31.7%) | 80 (51.3%) |
| 25 to 34 Years | 43 (25.6%) | 26 (32.1%) |
| 35 to 44 Years | 37 (30.3%) | 141 (72.7%) |
| 45 to 54 Years | 45 (59.2%) | 28 (29.8%) |
| 55 to 64 Years | 28 (23.9%) | 30 (28.0%) |
| 65 to 74 Years | 16 (20.3%) | 15 (18.1%) |
| 75 Years and over | 0 (0.0%) | 0 (0.0%) |
| Total | 353 (40.7%) | 488 (48.2%) |
Income Above Poverty by Sex and Age in Judson
According to the poverty statistics in Judson, males aged 75 years and over and females aged 65 to 74 years are the age groups that are most secure financially, with 100.0% of males and 81.9% of females in these age groups living above the poverty line.
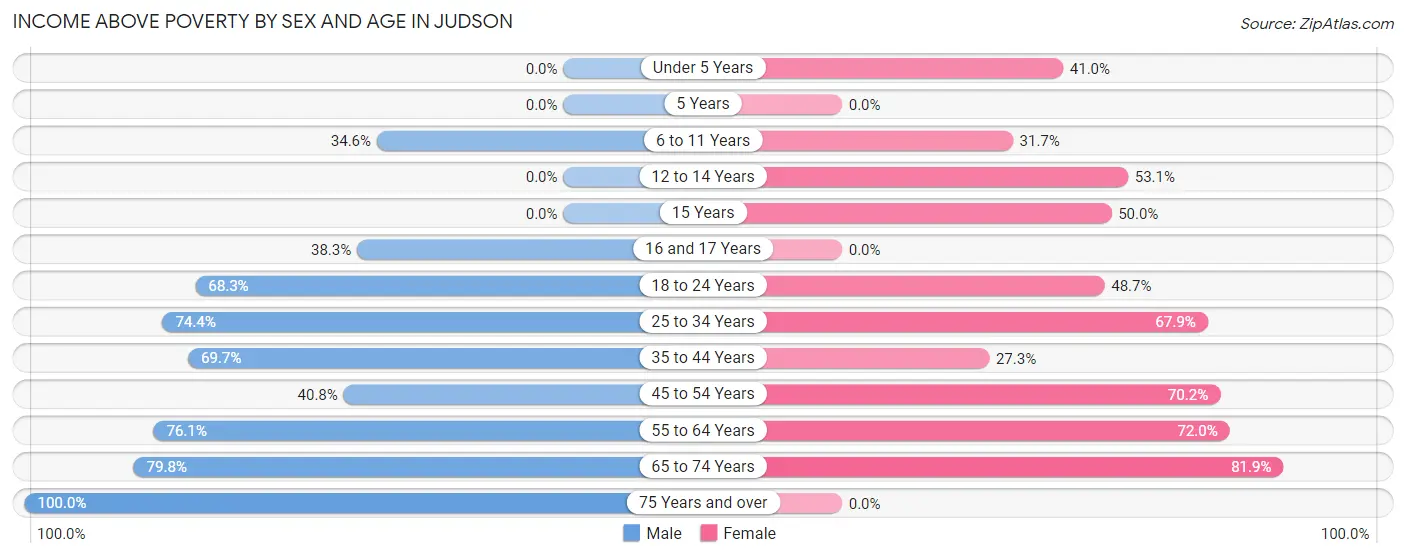
| Age Bracket | Male | Female |
| Under 5 Years | 0 (0.0%) | 32 (41.0%) |
| 5 Years | 0 (0.0%) | 0 (0.0%) |
| 6 to 11 Years | 27 (34.6%) | 26 (31.7%) |
| 12 to 14 Years | 0 (0.0%) | 43 (53.1%) |
| 15 Years | 0 (0.0%) | 28 (50.0%) |
| 16 and 17 Years | 18 (38.3%) | 0 (0.0%) |
| 18 to 24 Years | 28 (68.3%) | 76 (48.7%) |
| 25 to 34 Years | 125 (74.4%) | 55 (67.9%) |
| 35 to 44 Years | 85 (69.7%) | 53 (27.3%) |
| 45 to 54 Years | 31 (40.8%) | 66 (70.2%) |
| 55 to 64 Years | 89 (76.1%) | 77 (72.0%) |
| 65 to 74 Years | 63 (79.7%) | 68 (81.9%) |
| 75 Years and over | 48 (100.0%) | 0 (0.0%) |
| Total | 514 (59.3%) | 524 (51.8%) |
Income Below Poverty Among Married-Couple Families in Judson
The poverty statistics for married-couple families in Judson show that 37.2% or 109 of the total 293 families live below the poverty line. Families with 3 or 4 children have the highest poverty rate of 69.6%, comprising of 32 families. On the other hand, families with no children have the lowest poverty rate of 11.4%, which includes 16 families.
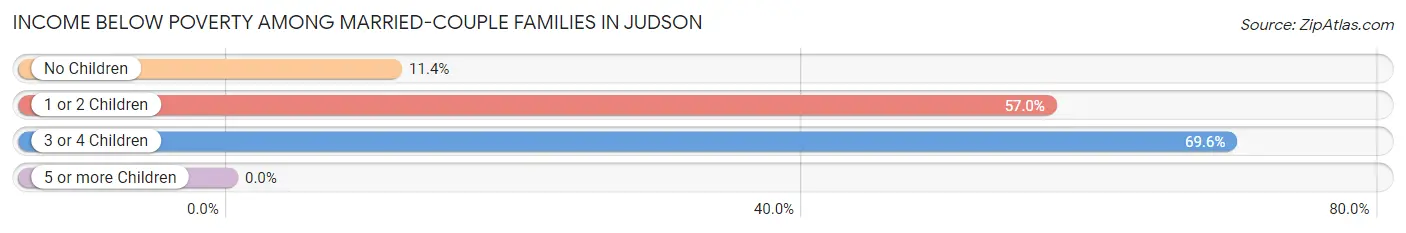
| Children | Above Poverty | Below Poverty |
| No Children | 124 (88.6%) | 16 (11.4%) |
| 1 or 2 Children | 46 (43.0%) | 61 (57.0%) |
| 3 or 4 Children | 14 (30.4%) | 32 (69.6%) |
| 5 or more Children | 0 (0.0%) | 0 (0.0%) |
| Total | 184 (62.8%) | 109 (37.2%) |
Income Below Poverty Among Single-Parent Households in Judson
According to the poverty data in Judson, 38.2% or 13 single-father households and 53.0% or 88 single-mother households are living below the poverty line. Among single-father households, those with 1 or 2 children have the highest poverty rate, with 13 households (100.0%) experiencing poverty. Likewise, among single-mother households, those with 3 or 4 children have the highest poverty rate, with 33 households (100.0%) falling below the poverty line.
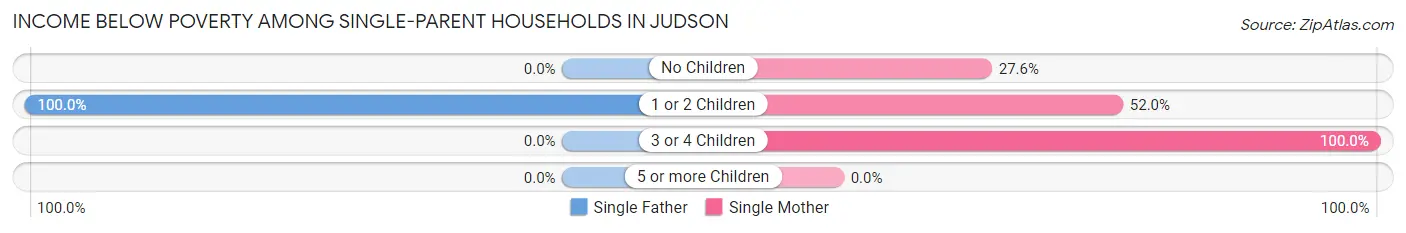
| Children | Single Father | Single Mother |
| No Children | 0 (0.0%) | 16 (27.6%) |
| 1 or 2 Children | 13 (100.0%) | 39 (52.0%) |
| 3 or 4 Children | 0 (0.0%) | 33 (100.0%) |
| 5 or more Children | 0 (0.0%) | 0 (0.0%) |
| Total | 13 (38.2%) | 88 (53.0%) |
Income Below Poverty Among Married-Couple vs Single-Parent Households in Judson
The poverty data for Judson shows that 109 of the married-couple family households (37.2%) and 101 of the single-parent households (50.5%) are living below the poverty level. Within the married-couple family households, those with 3 or 4 children have the highest poverty rate, with 32 households (69.6%) falling below the poverty line. Among the single-parent households, those with 3 or 4 children have the highest poverty rate, with 33 household (100.0%) living below poverty.
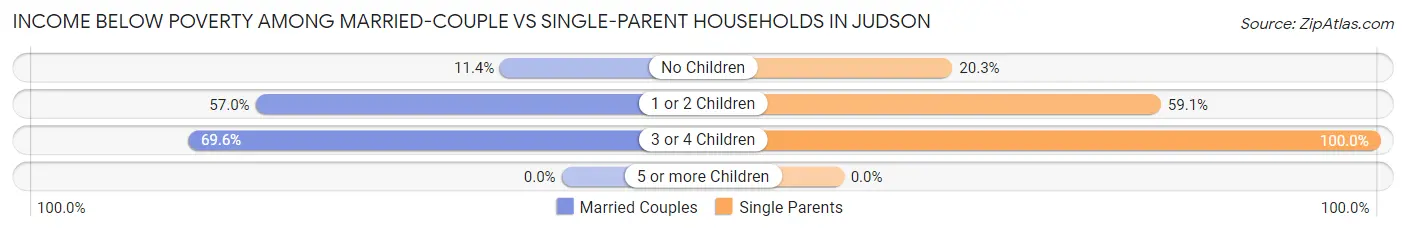
| Children | Married-Couple Families | Single-Parent Households |
| No Children | 16 (11.4%) | 16 (20.3%) |
| 1 or 2 Children | 61 (57.0%) | 52 (59.1%) |
| 3 or 4 Children | 32 (69.6%) | 33 (100.0%) |
| 5 or more Children | 0 (0.0%) | 0 (0.0%) |
| Total | 109 (37.2%) | 101 (50.5%) |
Race in Judson
The most populous races in Judson are Black / African American (960 | 51.1%), Hispanic or Latino (688 | 36.6%), and White / Caucasian (522 | 27.8%).
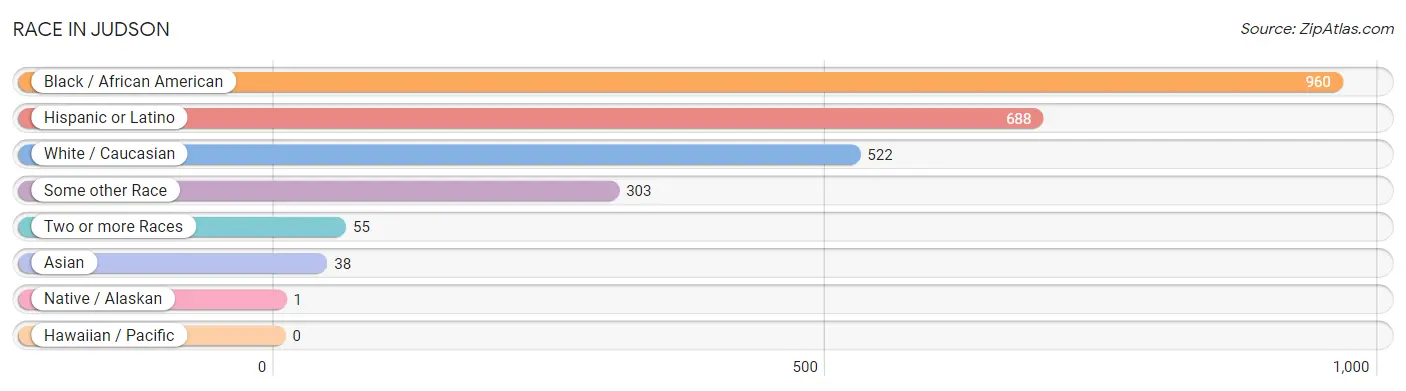
| Race | # Population | % Population |
| Asian | 38 | 2.0% |
| Black / African American | 960 | 51.1% |
| Hawaiian / Pacific | 0 | 0.0% |
| Hispanic or Latino | 688 | 36.6% |
| Native / Alaskan | 1 | 0.1% |
| White / Caucasian | 522 | 27.8% |
| Two or more Races | 55 | 2.9% |
| Some other Race | 303 | 16.1% |
| Total | 1,879 | 100.0% |
Ancestry in Judson
The most populous ancestries reported in Judson are Mexican (624 | 33.2%), American (169 | 9.0%), German (92 | 4.9%), English (49 | 2.6%), and Colombian (40 | 2.1%), together accounting for 51.8% of all Judson residents.
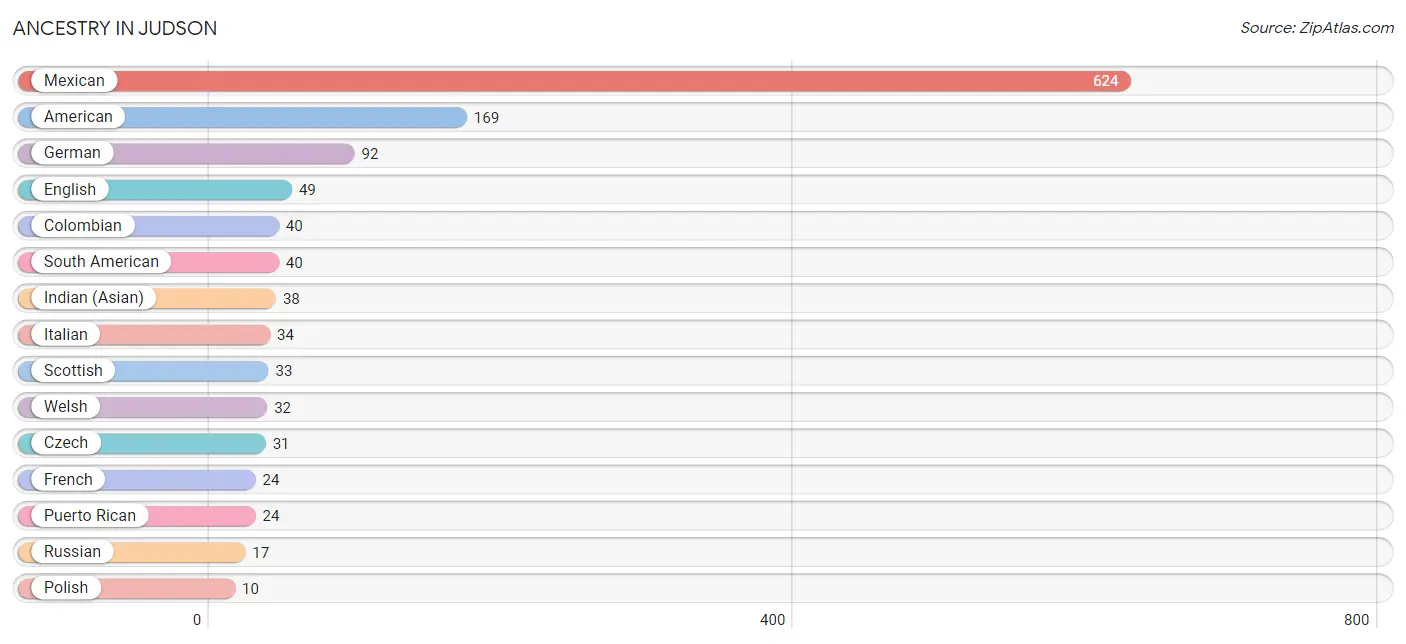
| Ancestry | # Population | % Population |
| American | 169 | 9.0% |
| Apache | 1 | 0.1% |
| Colombian | 40 | 2.1% |
| Czech | 31 | 1.7% |
| English | 49 | 2.6% |
| French | 24 | 1.3% |
| German | 92 | 4.9% |
| Indian (Asian) | 38 | 2.0% |
| Irish | 8 | 0.4% |
| Italian | 34 | 1.8% |
| Mexican | 624 | 33.2% |
| Polish | 10 | 0.5% |
| Puerto Rican | 24 | 1.3% |
| Russian | 17 | 0.9% |
| Scotch-Irish | 9 | 0.5% |
| Scottish | 33 | 1.8% |
| South American | 40 | 2.1% |
| Welsh | 32 | 1.7% | View All 18 Rows |
Immigrants in Judson
The most numerous immigrant groups reported in Judson came from Latin America (309 | 16.4%), Central America (281 | 14.9%), Mexico (180 | 9.6%), Honduras (101 | 5.4%), and Asia (38 | 2.0%), together accounting for 48.4% of all Judson residents.
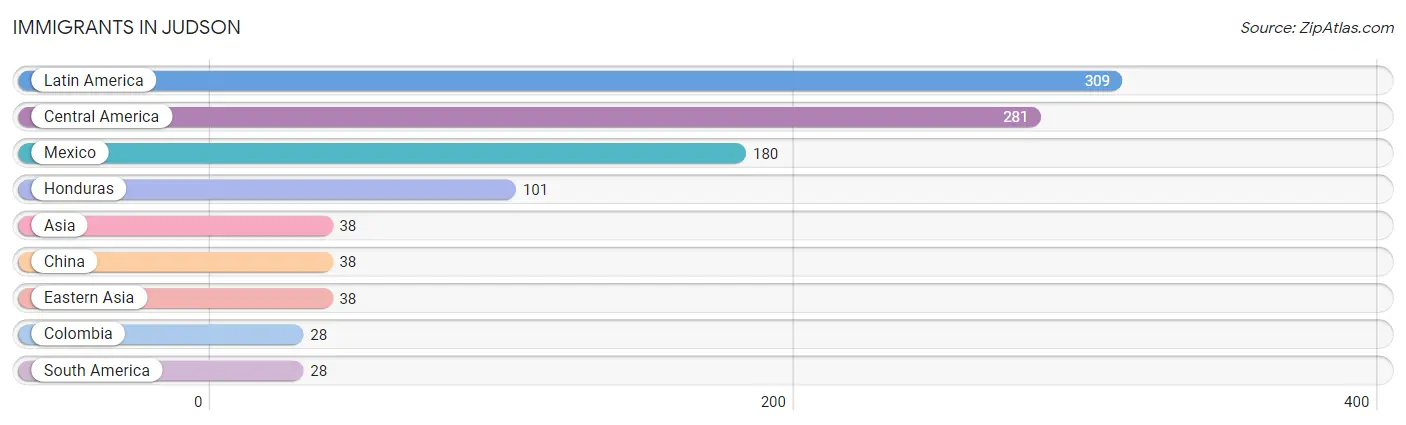
| Immigration Origin | # Population | % Population |
| Asia | 38 | 2.0% |
| Central America | 281 | 14.9% |
| China | 38 | 2.0% |
| Colombia | 28 | 1.5% |
| Eastern Asia | 38 | 2.0% |
| Honduras | 101 | 5.4% |
| Latin America | 309 | 16.4% |
| Mexico | 180 | 9.6% |
| South America | 28 | 1.5% | View All 9 Rows |
Sex and Age in Judson
Sex and Age in Judson
The most populous age groups in Judson are 30 to 34 Years (117 | 13.5%) for men and 15 to 19 Years (157 | 15.5%) for women.
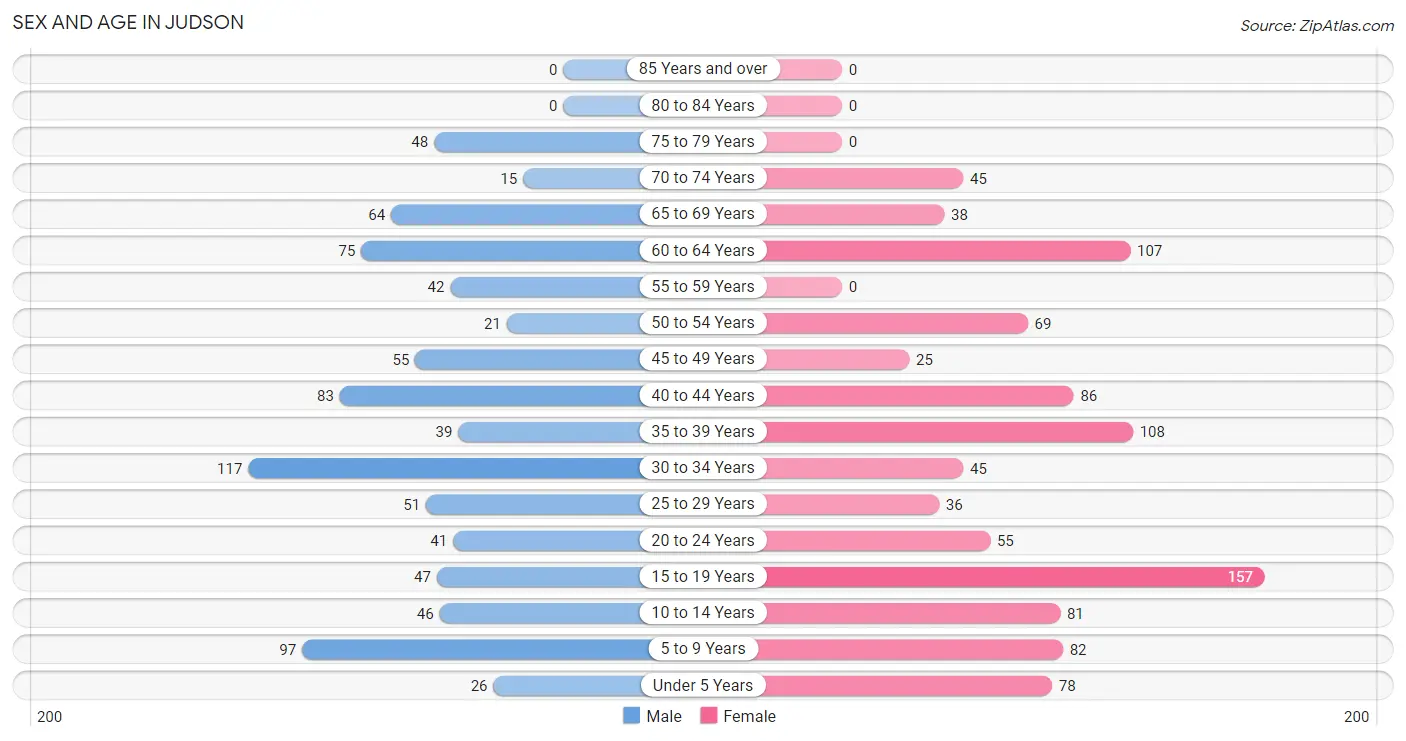
| Age Bracket | Male | Female |
| Under 5 Years | 26 (3.0%) | 78 (7.7%) |
| 5 to 9 Years | 97 (11.2%) | 82 (8.1%) |
| 10 to 14 Years | 46 (5.3%) | 81 (8.0%) |
| 15 to 19 Years | 47 (5.4%) | 157 (15.5%) |
| 20 to 24 Years | 41 (4.7%) | 55 (5.4%) |
| 25 to 29 Years | 51 (5.9%) | 36 (3.6%) |
| 30 to 34 Years | 117 (13.5%) | 45 (4.4%) |
| 35 to 39 Years | 39 (4.5%) | 108 (10.7%) |
| 40 to 44 Years | 83 (9.6%) | 86 (8.5%) |
| 45 to 49 Years | 55 (6.3%) | 25 (2.5%) |
| 50 to 54 Years | 21 (2.4%) | 69 (6.8%) |
| 55 to 59 Years | 42 (4.8%) | 0 (0.0%) |
| 60 to 64 Years | 75 (8.6%) | 107 (10.6%) |
| 65 to 69 Years | 64 (7.4%) | 38 (3.7%) |
| 70 to 74 Years | 15 (1.7%) | 45 (4.4%) |
| 75 to 79 Years | 48 (5.5%) | 0 (0.0%) |
| 80 to 84 Years | 0 (0.0%) | 0 (0.0%) |
| 85 Years and over | 0 (0.0%) | 0 (0.0%) |
| Total | 867 (100.0%) | 1,012 (100.0%) |
Families and Households in Judson
Median Family Size in Judson
The median family size in Judson is 3.21 persons per family, with married-couple families (293 | 59.4%) accounting for the largest median family size of 3.58 persons per family. On the other hand, single male/father families (34 | 6.9%) represent the smallest median family size with 1.74 persons per family.
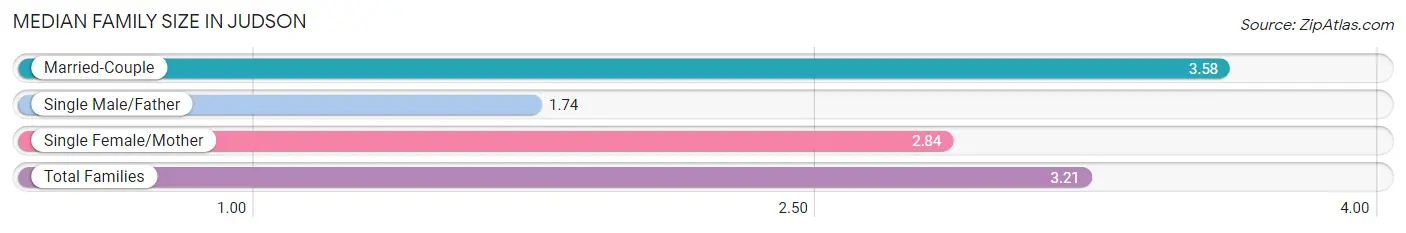
| Family Type | # Families | Family Size |
| Married-Couple | 293 (59.4%) | 3.58 |
| Single Male/Father | 34 (6.9%) | 1.74 |
| Single Female/Mother | 166 (33.7%) | 2.84 |
| Total Families | 493 (100.0%) | 3.21 |
Median Household Size in Judson
The median household size in Judson is 2.72 persons per household, with married-couple households (293 | 42.5%) accounting for the largest median household size of 3.58 persons per household. non-family households (197 | 28.5%) represent the smallest median household size with 1.39 persons per household.
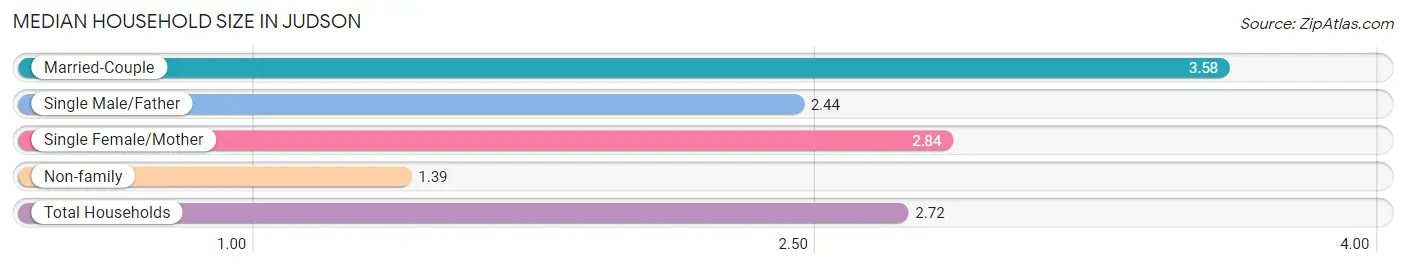
| Household Type | # Households | Household Size |
| Married-Couple | 293 (42.5%) | 3.58 |
| Single Male/Father | 34 (4.9%) | 2.44 |
| Single Female/Mother | 166 (24.1%) | 2.84 |
| Non-family | 197 (28.5%) | 1.39 |
| Total Households | 690 (100.0%) | 2.72 |
Household Size by Marriage Status in Judson
Out of a total of 690 households in Judson, 493 (71.5%) are family households, while 197 (28.5%) are nonfamily households. The most numerous type of family households are 3-person households, comprising 235, and the most common type of nonfamily households are 1-person households, comprising 138.
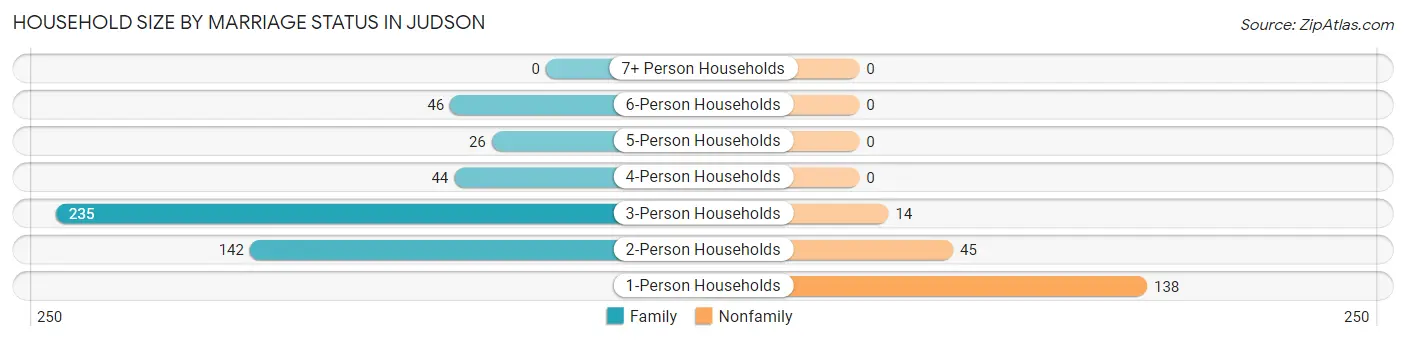
| Household Size | Family Households | Nonfamily Households |
| 1-Person Households | - | 138 (20.0%) |
| 2-Person Households | 142 (20.6%) | 45 (6.5%) |
| 3-Person Households | 235 (34.1%) | 14 (2.0%) |
| 4-Person Households | 44 (6.4%) | 0 (0.0%) |
| 5-Person Households | 26 (3.8%) | 0 (0.0%) |
| 6-Person Households | 46 (6.7%) | 0 (0.0%) |
| 7+ Person Households | 0 (0.0%) | 0 (0.0%) |
| Total | 493 (71.5%) | 197 (28.5%) |
Female Fertility in Judson
Fertility by Age in Judson
Average fertility rate in Judson is 78.0 births per 1,000 women. Women in the age bracket of 20 to 34 years have the highest fertility rate with 301.0 births per 1,000 women. Women in the age bracket of 20 to 34 years acount for 100.0% of all women with births.
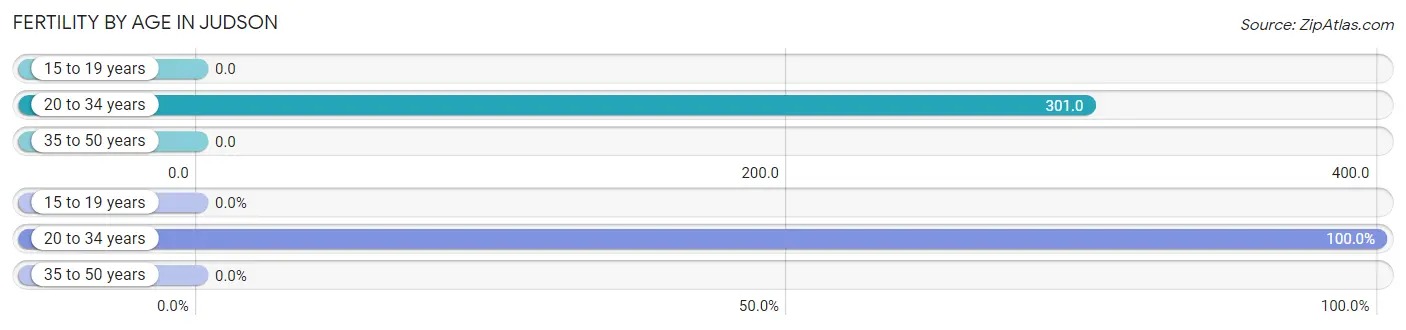
| Age Bracket | Women with Births | Births / 1,000 Women |
| 15 to 19 years | 0 (0.0%) | 0.0 |
| 20 to 34 years | 41 (100.0%) | 301.0 |
| 35 to 50 years | 0 (0.0%) | 0.0 |
| Total | 41 (100.0%) | 78.0 |
Fertility by Age by Marriage Status in Judson
75.6% of women with births (41) in Judson are married. The highest percentage of unmarried women with births falls into 20 to 34 years age bracket with 24.4% of them unmarried at the time of birth, while the lowest percentage of unmarried women with births belong to 20 to 34 years age bracket with 24.4% of them unmarried.
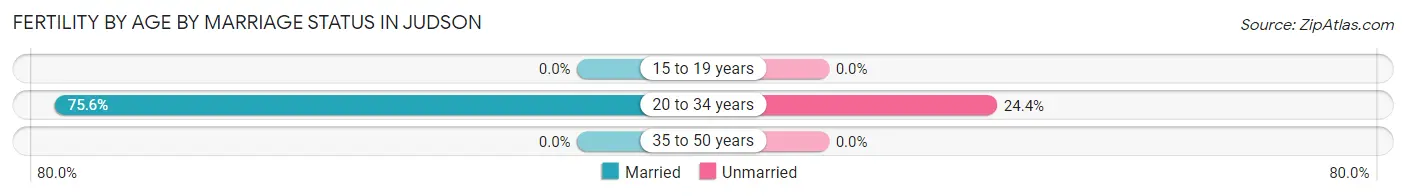
| Age Bracket | Married | Unmarried |
| 15 to 19 years | 0 (0.0%) | 0 (0.0%) |
| 20 to 34 years | 31 (75.6%) | 10 (24.4%) |
| 35 to 50 years | 0 (0.0%) | 0 (0.0%) |
| Total | 31 (75.6%) | 10 (24.4%) |
Fertility by Education in Judson
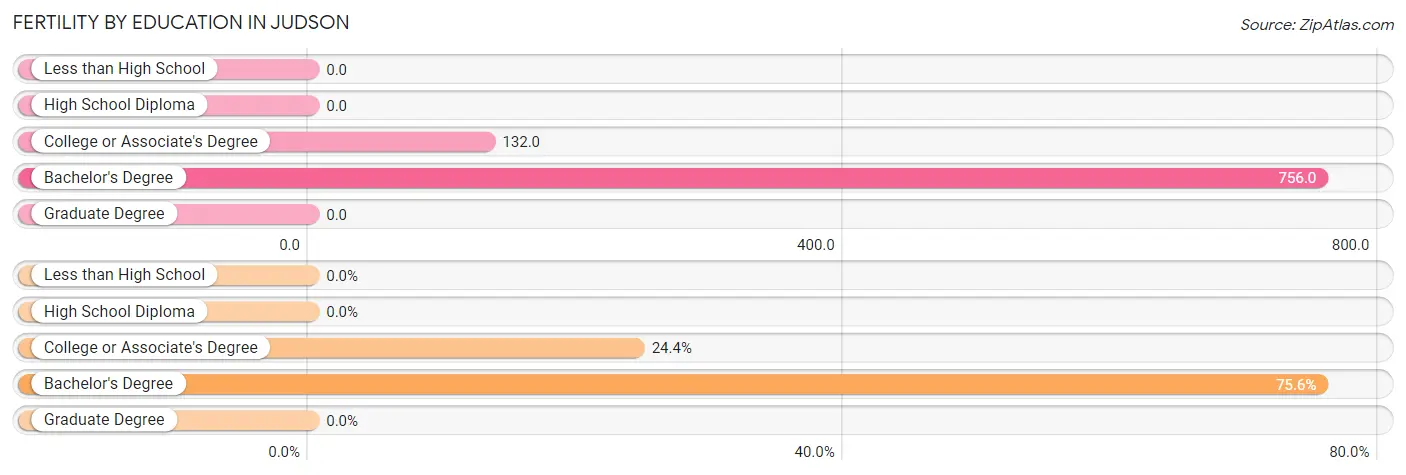
| Educational Attainment | Women with Births | Births / 1,000 Women |
| Less than High School | 0 (0.0%) | 0.0 |
| High School Diploma | 0 (0.0%) | 0.0 |
| College or Associate's Degree | 10 (24.4%) | 132.0 |
| Bachelor's Degree | 31 (75.6%) | 756.0 |
| Graduate Degree | 0 (0.0%) | 0.0 |
| Total | 41 (100.0%) | 78.0 |
Fertility by Education by Marriage Status in Judson
24.4% of women with births in Judson are unmarried. Women with the educational attainment of bachelor's degree are most likely to be married with 100.0% of them married at childbirth, while women with the educational attainment of college or associate's degree are least likely to be married with 100.0% of them unmarried at childbirth.
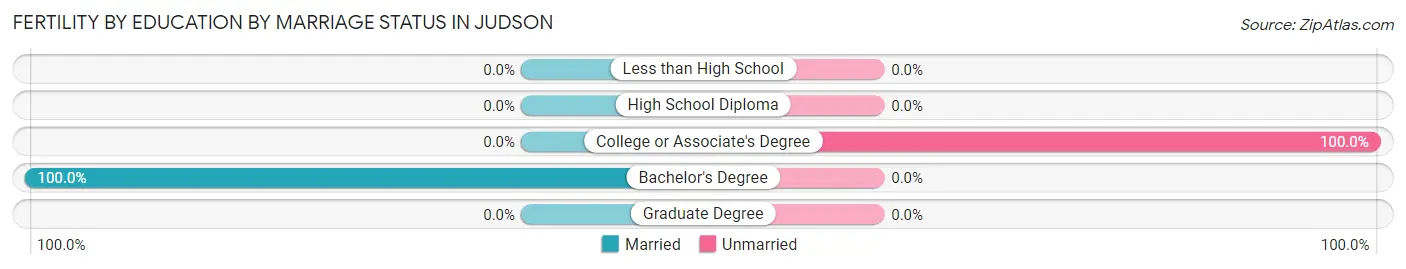
| Educational Attainment | Married | Unmarried |
| Less than High School | 0 (0.0%) | 0 (0.0%) |
| High School Diploma | 0 (0.0%) | 0 (0.0%) |
| College or Associate's Degree | 0 (0.0%) | 10 (100.0%) |
| Bachelor's Degree | 31 (100.0%) | 0 (0.0%) |
| Graduate Degree | 0 (0.0%) | 0 (0.0%) |
| Total | 31 (75.6%) | 10 (24.4%) |
Employment Characteristics in Judson
Employment by Class of Employer in Judson
Among the 556 employed individuals in Judson, private company employees (376 | 67.6%), federal government employees (66 | 11.9%), and not-for-profit organizations (52 | 9.3%) make up the most common classes of employment.
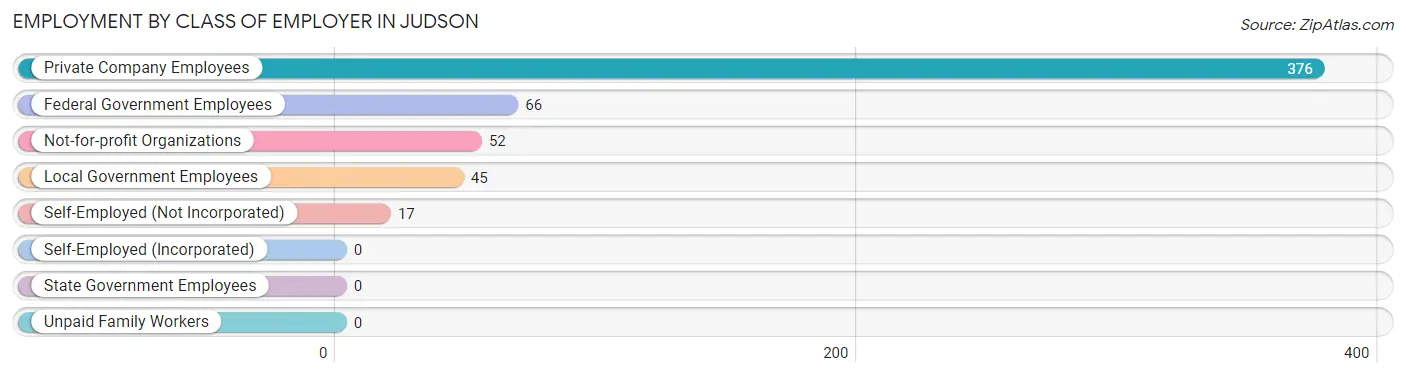
| Employer Class | # Employees | % Employees |
| Private Company Employees | 376 | 67.6% |
| Self-Employed (Incorporated) | 0 | 0.0% |
| Self-Employed (Not Incorporated) | 17 | 3.1% |
| Not-for-profit Organizations | 52 | 9.3% |
| Local Government Employees | 45 | 8.1% |
| State Government Employees | 0 | 0.0% |
| Federal Government Employees | 66 | 11.9% |
| Unpaid Family Workers | 0 | 0.0% |
| Total | 556 | 100.0% |
Employment Status by Age in Judson
According to the labor force statistics for Judson, out of the total population over 16 years of age (1,413), 55.0% or 777 individuals are in the labor force, with 21.9% or 170 of them unemployed. The age group with the highest labor force participation rate is 20 to 24 years, with 100.0% or 96 individuals in the labor force. Within the labor force, the 75 years and over age range has the highest percentage of unemployed individuals, with 100.0% or 43 of them being unemployed.
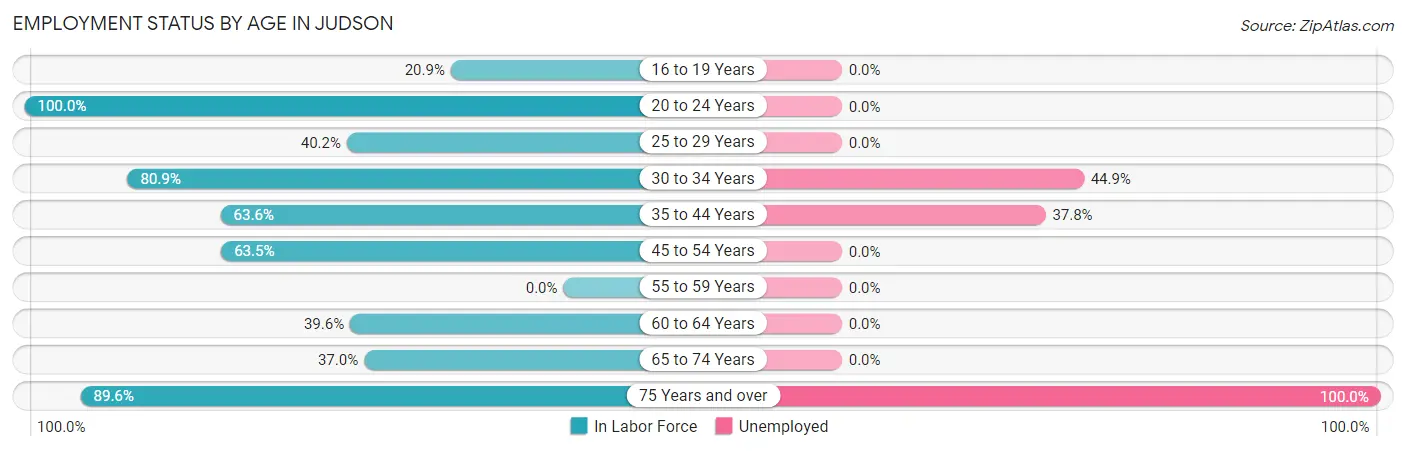
| Age Bracket | In Labor Force | Unemployed |
| 16 to 19 Years | 31 (20.9%) | 0 (0.0%) |
| 20 to 24 Years | 96 (100.0%) | 0 (0.0%) |
| 25 to 29 Years | 35 (40.2%) | 0 (0.0%) |
| 30 to 34 Years | 131 (80.9%) | 59 (44.9%) |
| 35 to 44 Years | 201 (63.6%) | 76 (37.8%) |
| 45 to 54 Years | 108 (63.5%) | 0 (0.0%) |
| 55 to 59 Years | 0 (0.0%) | 0 (0.0%) |
| 60 to 64 Years | 72 (39.6%) | 0 (0.0%) |
| 65 to 74 Years | 60 (37.0%) | 0 (0.0%) |
| 75 Years and over | 43 (89.6%) | 43 (100.0%) |
| Total | 777 (55.0%) | 170 (21.9%) |
Employment Status by Educational Attainment in Judson
According to labor force statistics for Judson, 57.0% of individuals (547) out of the total population between 25 and 64 years of age (959) are in the labor force, with 23.3% or 127 of them being unemployed. The group with the highest labor force participation rate are those with the educational attainment of bachelor's degree or higher, with 79.7% or 122 individuals in the labor force. Within the labor force, individuals with high school diploma education have the highest percentage of unemployment, with 44.1% or 120 of them being unemployed.
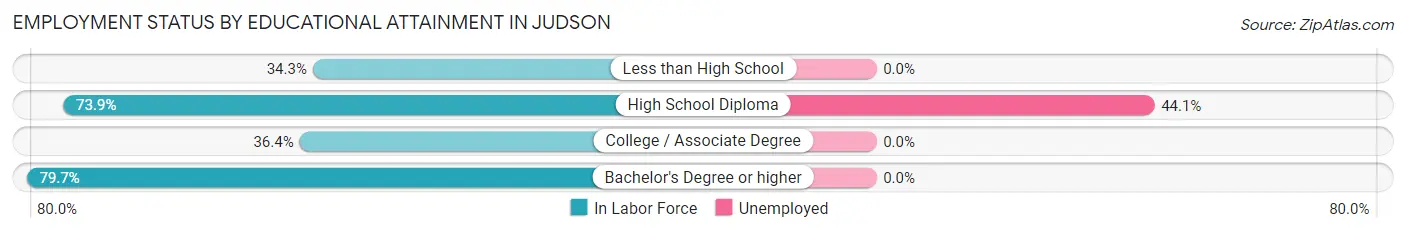
| Educational Attainment | In Labor Force | Unemployed |
| Less than High School | 105 (34.3%) | 0 (0.0%) |
| High School Diploma | 272 (73.9%) | 162 (44.1%) |
| College / Associate Degree | 48 (36.4%) | 0 (0.0%) |
| Bachelor's Degree or higher | 122 (79.7%) | 0 (0.0%) |
| Total | 547 (57.0%) | 223 (23.3%) |
Employment Occupations by Sex in Judson
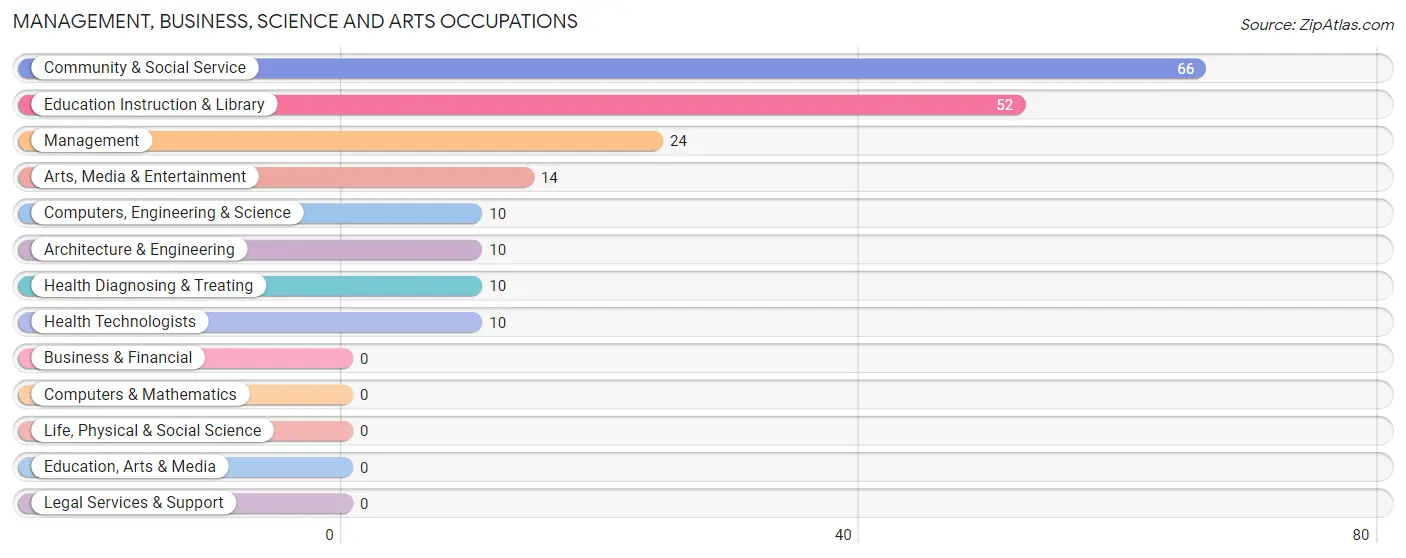
Management, Business, Science and Arts Occupations
The most common Management, Business, Science and Arts occupations in Judson are Community & Social Service (66 | 11.4%), Education Instruction & Library (52 | 8.9%), Management (24 | 4.1%), Arts, Media & Entertainment (14 | 2.4%), and Computers, Engineering & Science (10 | 1.7%).
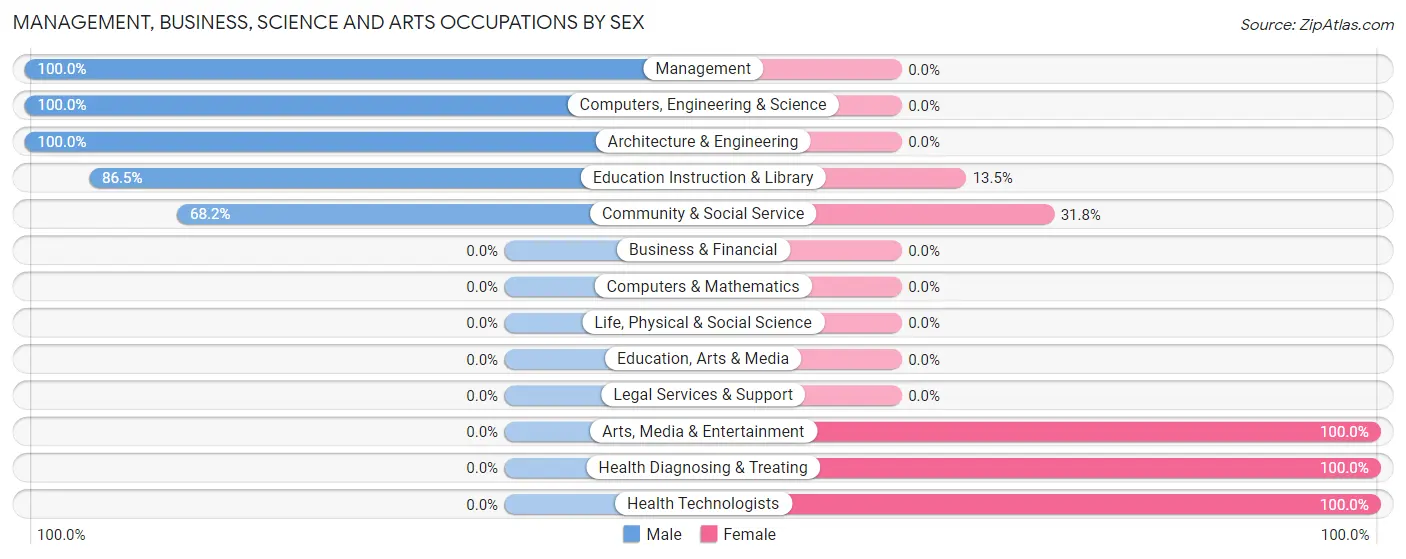
Management, Business, Science and Arts Occupations by Sex
Within the Management, Business, Science and Arts occupations in Judson, the most male-oriented occupations are Management (100.0%), Computers, Engineering & Science (100.0%), and Architecture & Engineering (100.0%), while the most female-oriented occupations are Arts, Media & Entertainment (100.0%), Health Diagnosing & Treating (100.0%), and Health Technologists (100.0%).
| Occupation | Male | Female |
| Management | 24 (100.0%) | 0 (0.0%) |
| Business & Financial | 0 (0.0%) | 0 (0.0%) |
| Computers, Engineering & Science | 10 (100.0%) | 0 (0.0%) |
| Computers & Mathematics | 0 (0.0%) | 0 (0.0%) |
| Architecture & Engineering | 10 (100.0%) | 0 (0.0%) |
| Life, Physical & Social Science | 0 (0.0%) | 0 (0.0%) |
| Community & Social Service | 45 (68.2%) | 21 (31.8%) |
| Education, Arts & Media | 0 (0.0%) | 0 (0.0%) |
| Legal Services & Support | 0 (0.0%) | 0 (0.0%) |
| Education Instruction & Library | 45 (86.5%) | 7 (13.5%) |
| Arts, Media & Entertainment | 0 (0.0%) | 14 (100.0%) |
| Health Diagnosing & Treating | 0 (0.0%) | 10 (100.0%) |
| Health Technologists | 0 (0.0%) | 10 (100.0%) |
| Total (Category) | 79 (71.8%) | 31 (28.2%) |
| Total (Overall) | 251 (43.2%) | 330 (56.8%) |
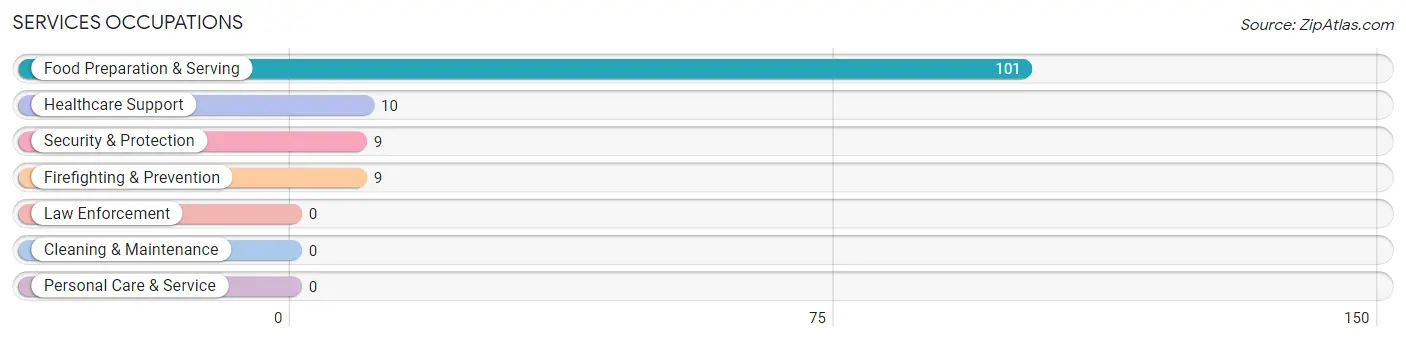
Services Occupations
The most common Services occupations in Judson are Food Preparation & Serving (101 | 17.4%), Healthcare Support (10 | 1.7%), Security & Protection (9 | 1.5%), and Firefighting & Prevention (9 | 1.5%).
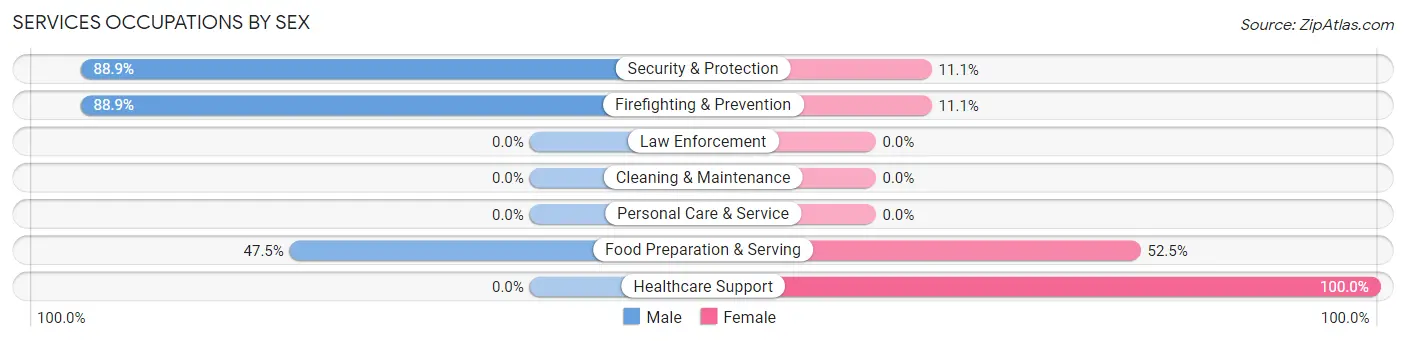
Services Occupations by Sex
Within the Services occupations in Judson, the most male-oriented occupations are Security & Protection (88.9%), Firefighting & Prevention (88.9%), and Food Preparation & Serving (47.5%), while the most female-oriented occupations are Healthcare Support (100.0%), Food Preparation & Serving (52.5%), and Security & Protection (11.1%).
| Occupation | Male | Female |
| Healthcare Support | 0 (0.0%) | 10 (100.0%) |
| Security & Protection | 8 (88.9%) | 1 (11.1%) |
| Firefighting & Prevention | 8 (88.9%) | 1 (11.1%) |
| Law Enforcement | 0 (0.0%) | 0 (0.0%) |
| Food Preparation & Serving | 48 (47.5%) | 53 (52.5%) |
| Cleaning & Maintenance | 0 (0.0%) | 0 (0.0%) |
| Personal Care & Service | 0 (0.0%) | 0 (0.0%) |
| Total (Category) | 56 (46.7%) | 64 (53.3%) |
| Total (Overall) | 251 (43.2%) | 330 (56.8%) |
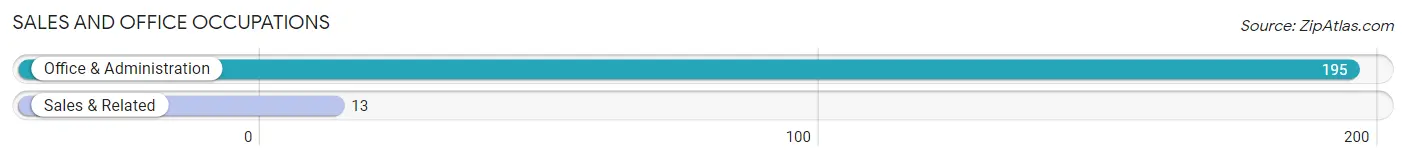
Sales and Office Occupations
The most common Sales and Office occupations in Judson are Office & Administration (195 | 33.6%), and Sales & Related (13 | 2.2%).
Sales and Office Occupations by Sex
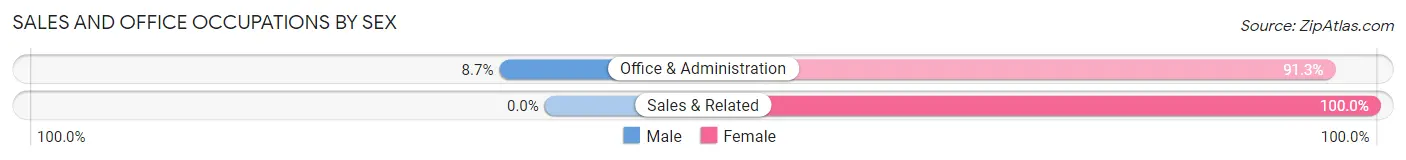
| Occupation | Male | Female |
| Sales & Related | 0 (0.0%) | 13 (100.0%) |
| Office & Administration | 17 (8.7%) | 178 (91.3%) |
| Total (Category) | 17 (8.2%) | 191 (91.8%) |
| Total (Overall) | 251 (43.2%) | 330 (56.8%) |
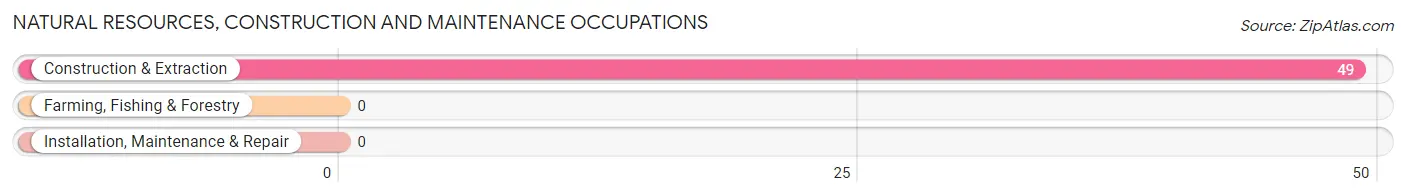
Natural Resources, Construction and Maintenance Occupations
The most common Natural Resources, Construction and Maintenance occupations in Judson are , and Construction & Extraction (49 | 8.4%).
Natural Resources, Construction and Maintenance Occupations by Sex
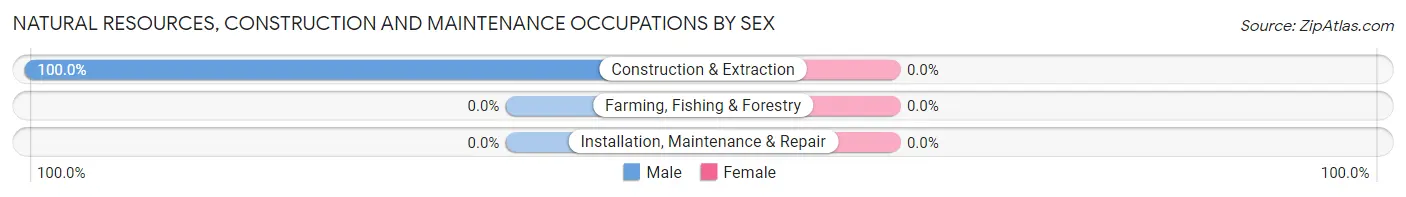
| Occupation | Male | Female |
| Farming, Fishing & Forestry | 0 (0.0%) | 0 (0.0%) |
| Construction & Extraction | 49 (100.0%) | 0 (0.0%) |
| Installation, Maintenance & Repair | 0 (0.0%) | 0 (0.0%) |
| Total (Category) | 49 (100.0%) | 0 (0.0%) |
| Total (Overall) | 251 (43.2%) | 330 (56.8%) |
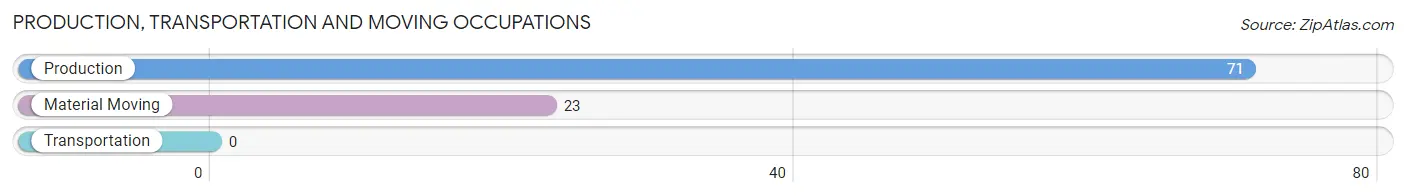
Production, Transportation and Moving Occupations
The most common Production, Transportation and Moving occupations in Judson are Production (71 | 12.2%), and Material Moving (23 | 4.0%).
Production, Transportation and Moving Occupations by Sex
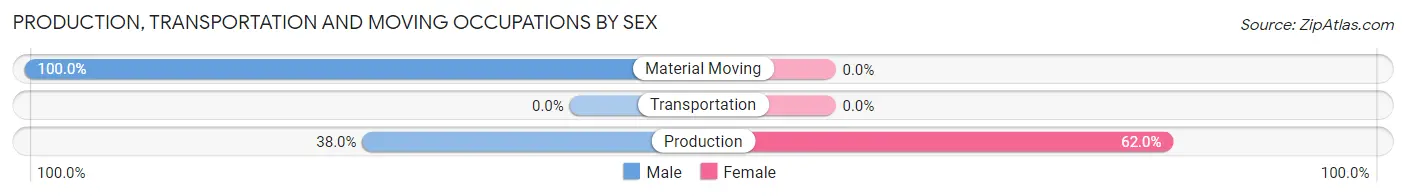
| Occupation | Male | Female |
| Production | 27 (38.0%) | 44 (62.0%) |
| Transportation | 0 (0.0%) | 0 (0.0%) |
| Material Moving | 23 (100.0%) | 0 (0.0%) |
| Total (Category) | 50 (53.2%) | 44 (46.8%) |
| Total (Overall) | 251 (43.2%) | 330 (56.8%) |
Employment Industries by Sex in Judson
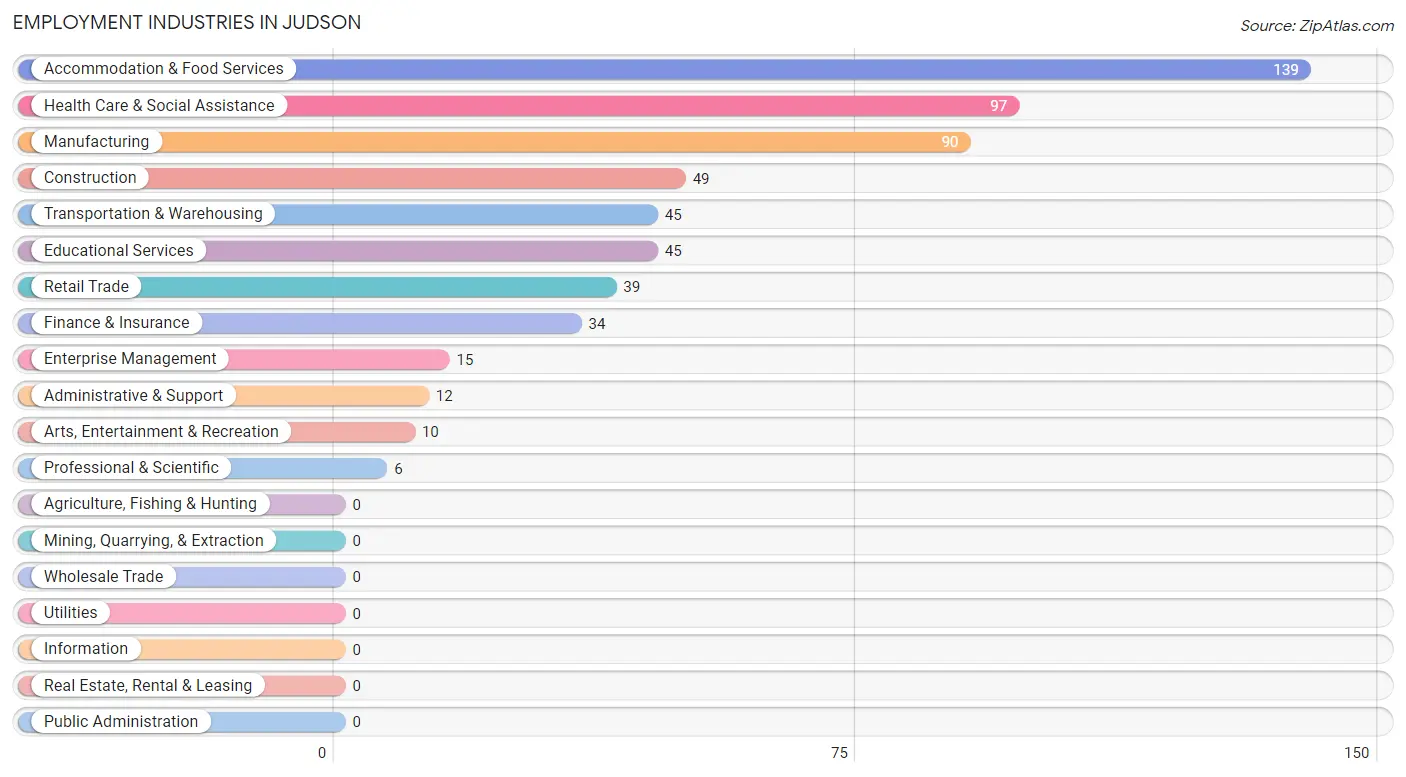
Employment Industries in Judson
The major employment industries in Judson include Accommodation & Food Services (139 | 23.9%), Health Care & Social Assistance (97 | 16.7%), Manufacturing (90 | 15.5%), Construction (49 | 8.4%), and Transportation & Warehousing (45 | 7.7%).
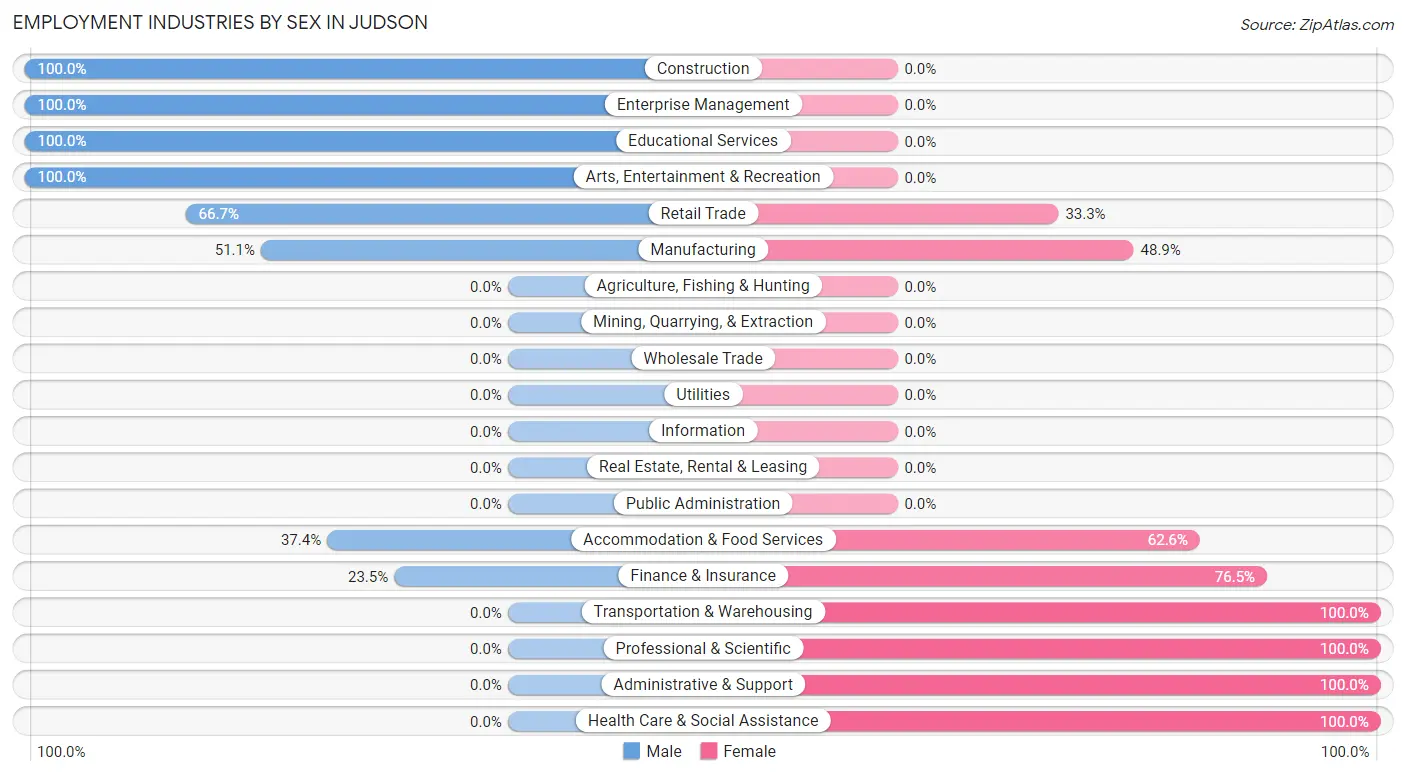
Employment Industries by Sex in Judson
The Judson industries that see more men than women are Construction (100.0%), Enterprise Management (100.0%), and Educational Services (100.0%), whereas the industries that tend to have a higher number of women are Transportation & Warehousing (100.0%), Professional & Scientific (100.0%), and Administrative & Support (100.0%).
| Industry | Male | Female |
| Agriculture, Fishing & Hunting | 0 (0.0%) | 0 (0.0%) |
| Mining, Quarrying, & Extraction | 0 (0.0%) | 0 (0.0%) |
| Construction | 49 (100.0%) | 0 (0.0%) |
| Manufacturing | 46 (51.1%) | 44 (48.9%) |
| Wholesale Trade | 0 (0.0%) | 0 (0.0%) |
| Retail Trade | 26 (66.7%) | 13 (33.3%) |
| Transportation & Warehousing | 0 (0.0%) | 45 (100.0%) |
| Utilities | 0 (0.0%) | 0 (0.0%) |
| Information | 0 (0.0%) | 0 (0.0%) |
| Finance & Insurance | 8 (23.5%) | 26 (76.5%) |
| Real Estate, Rental & Leasing | 0 (0.0%) | 0 (0.0%) |
| Professional & Scientific | 0 (0.0%) | 6 (100.0%) |
| Enterprise Management | 15 (100.0%) | 0 (0.0%) |
| Administrative & Support | 0 (0.0%) | 12 (100.0%) |
| Educational Services | 45 (100.0%) | 0 (0.0%) |
| Health Care & Social Assistance | 0 (0.0%) | 97 (100.0%) |
| Arts, Entertainment & Recreation | 10 (100.0%) | 0 (0.0%) |
| Accommodation & Food Services | 52 (37.4%) | 87 (62.6%) |
| Public Administration | 0 (0.0%) | 0 (0.0%) |
| Total | 251 (43.2%) | 330 (56.8%) |
Education in Judson
School Enrollment in Judson
The most common levels of schooling among the 549 students in Judson are high school (272 | 49.5%), elementary school (104 | 18.9%), and college / undergraduate (85 | 15.5%).
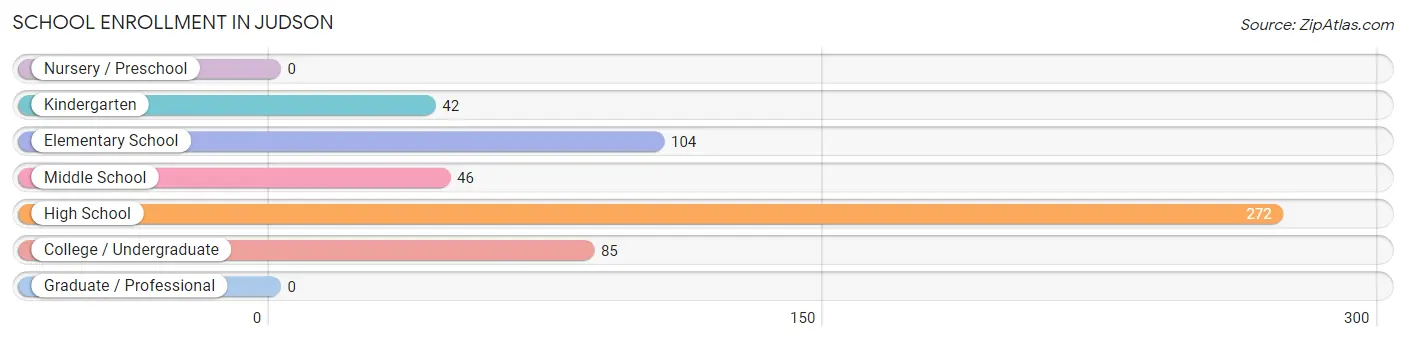
| School Level | # Students | % Students |
| Nursery / Preschool | 0 | 0.0% |
| Kindergarten | 42 | 7.6% |
| Elementary School | 104 | 18.9% |
| Middle School | 46 | 8.4% |
| High School | 272 | 49.5% |
| College / Undergraduate | 85 | 15.5% |
| Graduate / Professional | 0 | 0.0% |
| Total | 549 | 100.0% |
School Enrollment by Age by Funding Source in Judson
Out of a total of 549 students who are enrolled in schools in Judson, 13 (2.4%) attend a private institution, while the remaining 536 (97.6%) are enrolled in public schools. The age group of 35 years and over has the highest likelihood of being enrolled in private schools, with 13 (41.9% in the age bracket) enrolled. Conversely, the age group of 5 to 9 year old has the lowest likelihood of being enrolled in a private school, with 146 (100.0% in the age bracket) attending a public institution.
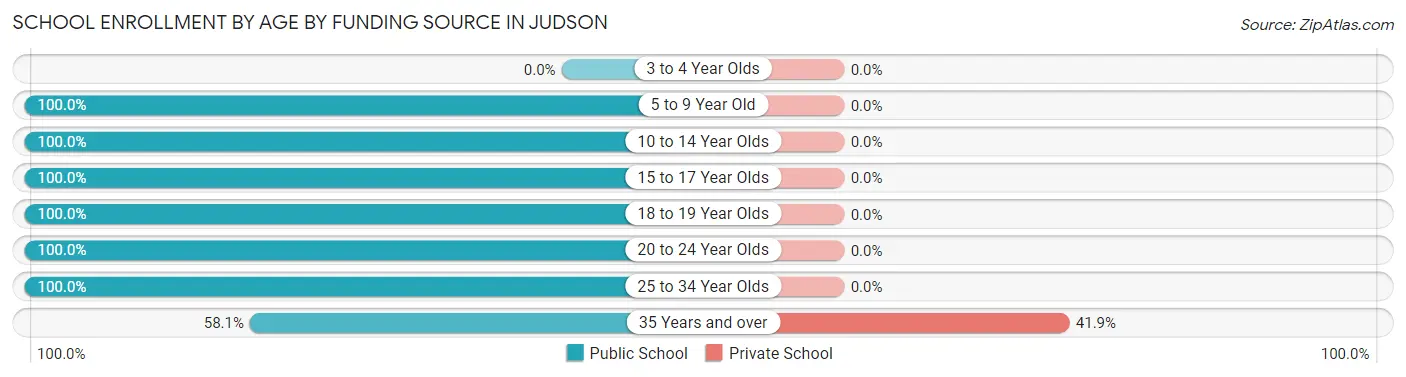
| Age Bracket | Public School | Private School |
| 3 to 4 Year Olds | 0 (0.0%) | 0 (0.0%) |
| 5 to 9 Year Old | 146 (100.0%) | 0 (0.0%) |
| 10 to 14 Year Olds | 127 (100.0%) | 0 (0.0%) |
| 15 to 17 Year Olds | 103 (100.0%) | 0 (0.0%) |
| 18 to 19 Year Olds | 101 (100.0%) | 0 (0.0%) |
| 20 to 24 Year Olds | 10 (100.0%) | 0 (0.0%) |
| 25 to 34 Year Olds | 31 (100.0%) | 0 (0.0%) |
| 35 Years and over | 18 (58.1%) | 13 (41.9%) |
| Total | 536 (97.6%) | 13 (2.4%) |
Educational Attainment by Field of Study in Judson
Communications (45 | 29.4%), arts & humanities (33 | 21.6%), psychology (31 | 20.3%), business (17 | 11.1%), and engineering (10 | 6.5%) are the most common fields of study among 153 individuals in Judson who have obtained a bachelor's degree or higher.
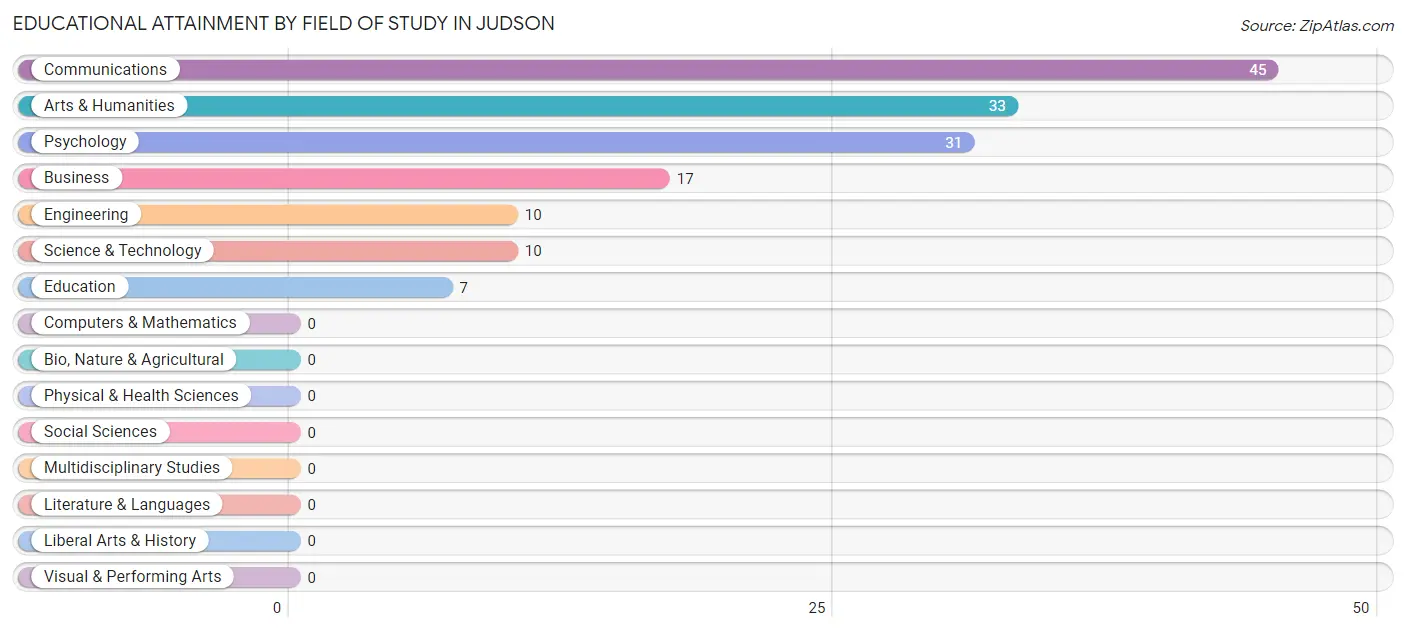
| Field of Study | # Graduates | % Graduates |
| Computers & Mathematics | 0 | 0.0% |
| Bio, Nature & Agricultural | 0 | 0.0% |
| Physical & Health Sciences | 0 | 0.0% |
| Psychology | 31 | 20.3% |
| Social Sciences | 0 | 0.0% |
| Engineering | 10 | 6.5% |
| Multidisciplinary Studies | 0 | 0.0% |
| Science & Technology | 10 | 6.5% |
| Business | 17 | 11.1% |
| Education | 7 | 4.6% |
| Literature & Languages | 0 | 0.0% |
| Liberal Arts & History | 0 | 0.0% |
| Visual & Performing Arts | 0 | 0.0% |
| Communications | 45 | 29.4% |
| Arts & Humanities | 33 | 21.6% |
| Total | 153 | 100.0% |
Transportation & Commute in Judson
Vehicle Availability by Sex in Judson
The most prevalent vehicle ownership categories in Judson are males with 2 vehicles (123, accounting for 45.4%) and females with 2 vehicles (95, making up 43.2%).
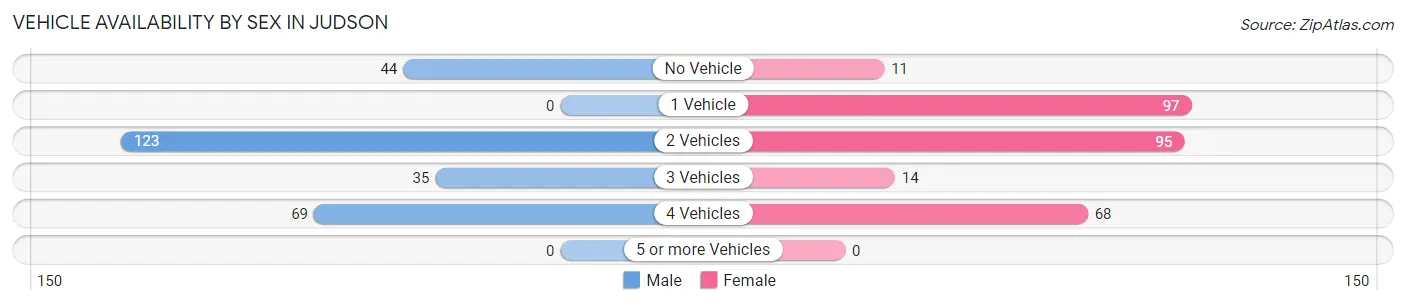
| Vehicles Available | Male | Female |
| No Vehicle | 44 (16.2%) | 11 (3.9%) |
| 1 Vehicle | 0 (0.0%) | 97 (34.0%) |
| 2 Vehicles | 123 (45.4%) | 95 (33.3%) |
| 3 Vehicles | 35 (12.9%) | 14 (4.9%) |
| 4 Vehicles | 69 (25.5%) | 68 (23.9%) |
| 5 or more Vehicles | 0 (0.0%) | 0 (0.0%) |
| Total | 271 (100.0%) | 285 (100.0%) |
Commute Time in Judson
The most frequently occuring commute durations in Judson are 15 to 19 minutes (142 commuters, 28.1%), 20 to 24 minutes (134 commuters, 26.5%), and less than 5 minutes (80 commuters, 15.8%).
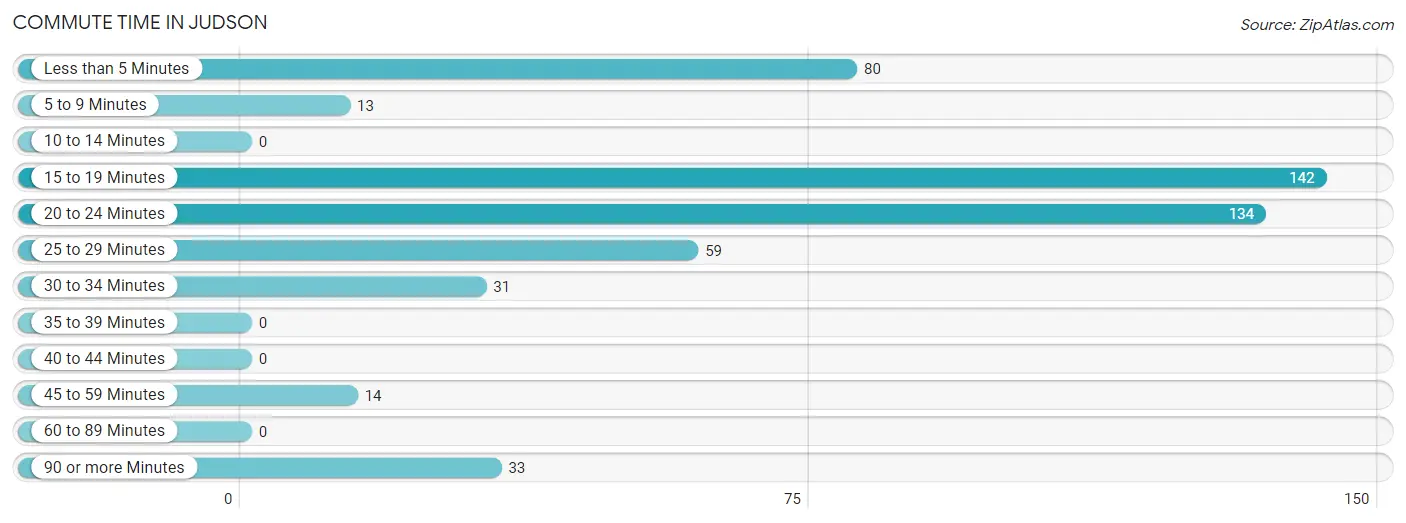
| Commute Time | # Commuters | % Commuters |
| Less than 5 Minutes | 80 | 15.8% |
| 5 to 9 Minutes | 13 | 2.6% |
| 10 to 14 Minutes | 0 | 0.0% |
| 15 to 19 Minutes | 142 | 28.1% |
| 20 to 24 Minutes | 134 | 26.5% |
| 25 to 29 Minutes | 59 | 11.7% |
| 30 to 34 Minutes | 31 | 6.1% |
| 35 to 39 Minutes | 0 | 0.0% |
| 40 to 44 Minutes | 0 | 0.0% |
| 45 to 59 Minutes | 14 | 2.8% |
| 60 to 89 Minutes | 0 | 0.0% |
| 90 or more Minutes | 33 | 6.5% |
Commute Time by Sex in Judson
The most common commute times in Judson are 25 to 29 minutes (59 commuters, 23.3%) for males and 15 to 19 minutes (114 commuters, 45.1%) for females.
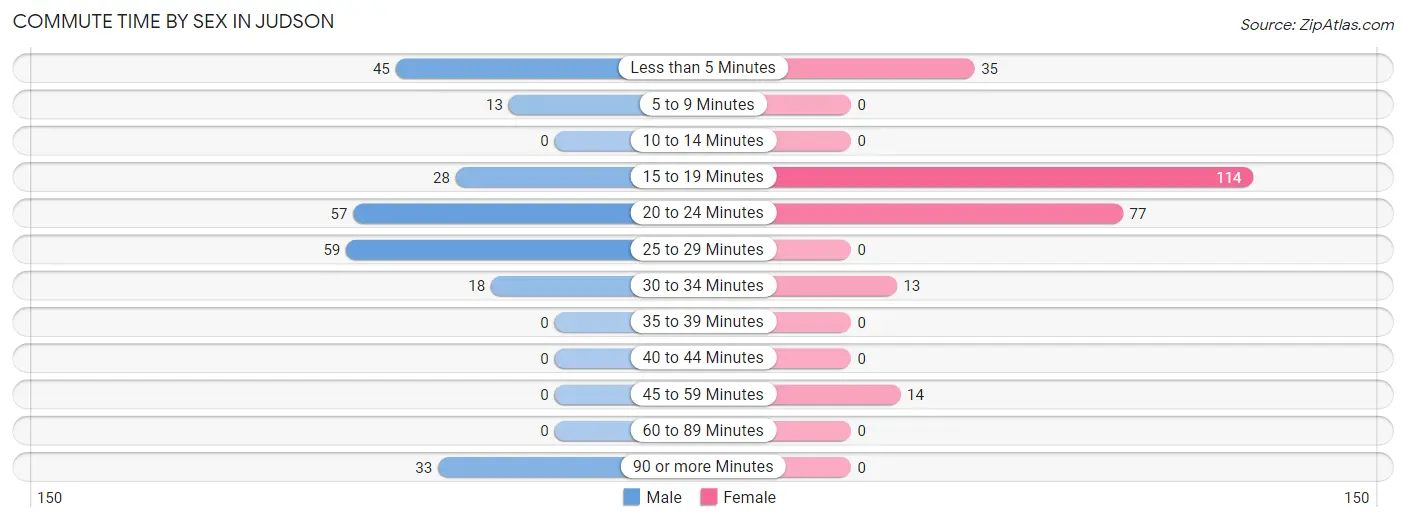
| Commute Time | Male | Female |
| Less than 5 Minutes | 45 (17.8%) | 35 (13.8%) |
| 5 to 9 Minutes | 13 (5.1%) | 0 (0.0%) |
| 10 to 14 Minutes | 0 (0.0%) | 0 (0.0%) |
| 15 to 19 Minutes | 28 (11.1%) | 114 (45.1%) |
| 20 to 24 Minutes | 57 (22.5%) | 77 (30.4%) |
| 25 to 29 Minutes | 59 (23.3%) | 0 (0.0%) |
| 30 to 34 Minutes | 18 (7.1%) | 13 (5.1%) |
| 35 to 39 Minutes | 0 (0.0%) | 0 (0.0%) |
| 40 to 44 Minutes | 0 (0.0%) | 0 (0.0%) |
| 45 to 59 Minutes | 0 (0.0%) | 14 (5.5%) |
| 60 to 89 Minutes | 0 (0.0%) | 0 (0.0%) |
| 90 or more Minutes | 33 (13.0%) | 0 (0.0%) |
Time of Departure to Work by Sex in Judson
The most frequent times of departure to work in Judson are 7:00 AM to 7:29 AM (100, 39.5%) for males and 6:00 AM to 6:29 AM (98, 38.7%) for females.
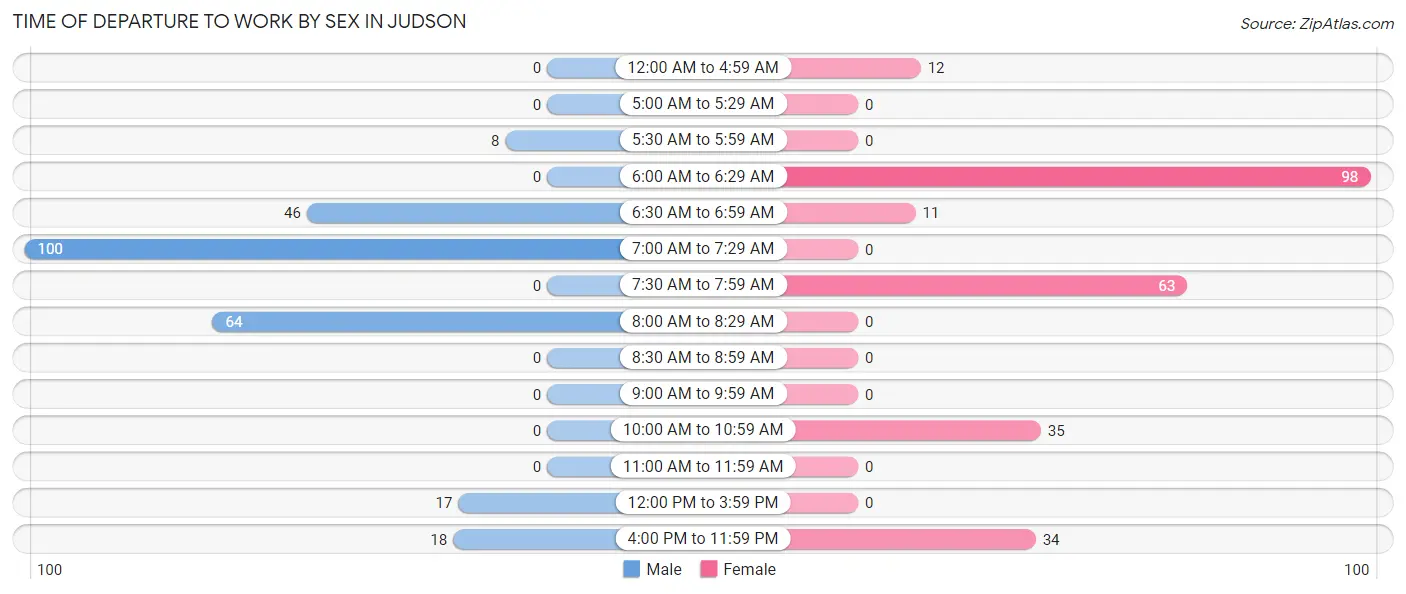
| Time of Departure | Male | Female |
| 12:00 AM to 4:59 AM | 0 (0.0%) | 12 (4.7%) |
| 5:00 AM to 5:29 AM | 0 (0.0%) | 0 (0.0%) |
| 5:30 AM to 5:59 AM | 8 (3.2%) | 0 (0.0%) |
| 6:00 AM to 6:29 AM | 0 (0.0%) | 98 (38.7%) |
| 6:30 AM to 6:59 AM | 46 (18.2%) | 11 (4.3%) |
| 7:00 AM to 7:29 AM | 100 (39.5%) | 0 (0.0%) |
| 7:30 AM to 7:59 AM | 0 (0.0%) | 63 (24.9%) |
| 8:00 AM to 8:29 AM | 64 (25.3%) | 0 (0.0%) |
| 8:30 AM to 8:59 AM | 0 (0.0%) | 0 (0.0%) |
| 9:00 AM to 9:59 AM | 0 (0.0%) | 0 (0.0%) |
| 10:00 AM to 10:59 AM | 0 (0.0%) | 35 (13.8%) |
| 11:00 AM to 11:59 AM | 0 (0.0%) | 0 (0.0%) |
| 12:00 PM to 3:59 PM | 17 (6.7%) | 0 (0.0%) |
| 4:00 PM to 11:59 PM | 18 (7.1%) | 34 (13.4%) |
| Total | 253 (100.0%) | 253 (100.0%) |
Housing Occupancy in Judson
Occupancy by Ownership in Judson
Of the total 690 dwellings in Judson, owner-occupied units account for 306 (44.4%), while renter-occupied units make up 384 (55.6%).
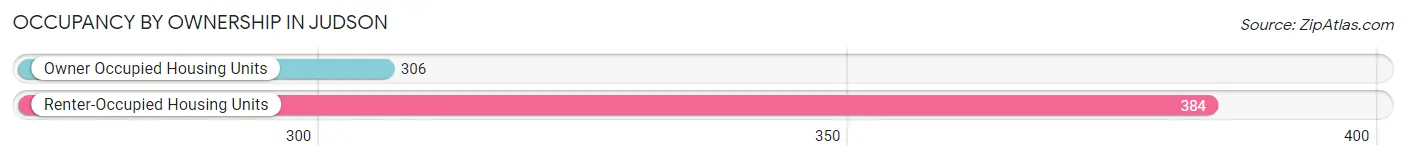
| Occupancy | # Housing Units | % Housing Units |
| Owner Occupied Housing Units | 306 | 44.4% |
| Renter-Occupied Housing Units | 384 | 55.6% |
| Total Occupied Housing Units | 690 | 100.0% |
Occupancy by Household Size in Judson
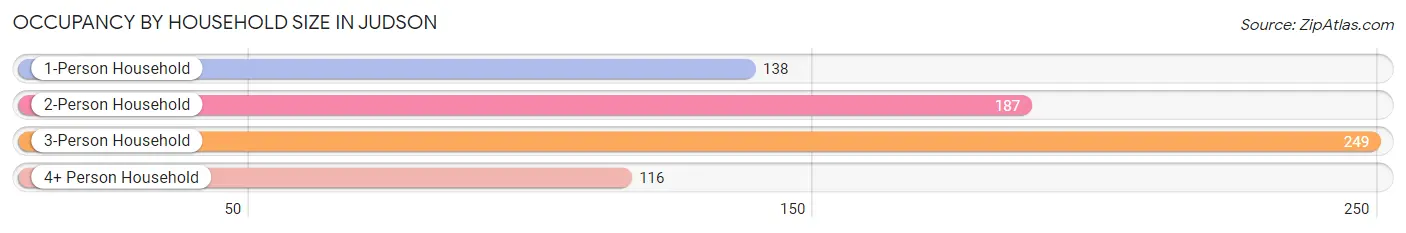
| Household Size | # Housing Units | % Housing Units |
| 1-Person Household | 138 | 20.0% |
| 2-Person Household | 187 | 27.1% |
| 3-Person Household | 249 | 36.1% |
| 4+ Person Household | 116 | 16.8% |
| Total Housing Units | 690 | 100.0% |
Occupancy by Ownership by Household Size in Judson
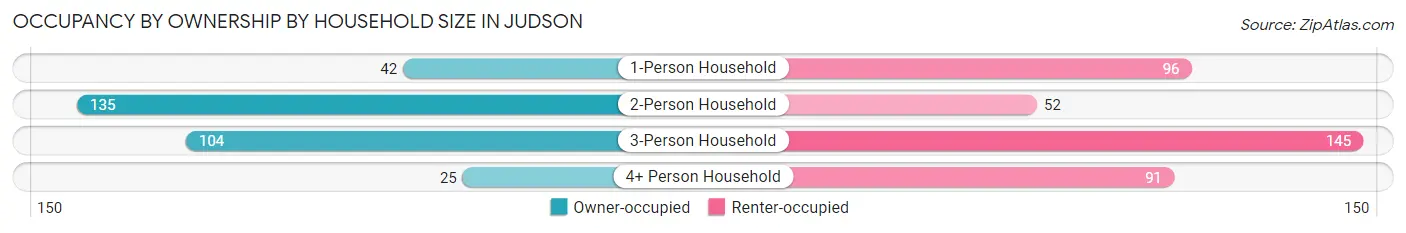
| Household Size | Owner-occupied | Renter-occupied |
| 1-Person Household | 42 (30.4%) | 96 (69.6%) |
| 2-Person Household | 135 (72.2%) | 52 (27.8%) |
| 3-Person Household | 104 (41.8%) | 145 (58.2%) |
| 4+ Person Household | 25 (21.5%) | 91 (78.4%) |
| Total Housing Units | 306 (44.4%) | 384 (55.6%) |
Occupancy by Educational Attainment in Judson
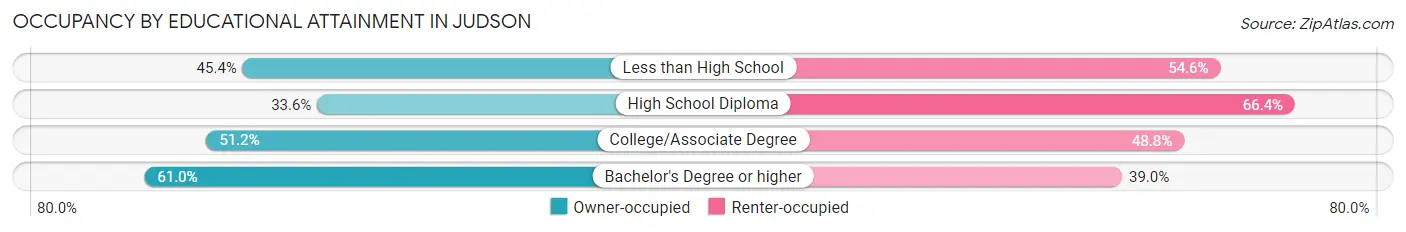
| Household Size | Owner-occupied | Renter-occupied |
| Less than High School | 94 (45.4%) | 113 (54.6%) |
| High School Diploma | 86 (33.6%) | 170 (66.4%) |
| College/Associate Degree | 65 (51.2%) | 62 (48.8%) |
| Bachelor's Degree or higher | 61 (61.0%) | 39 (39.0%) |
Occupancy by Age of Householder in Judson
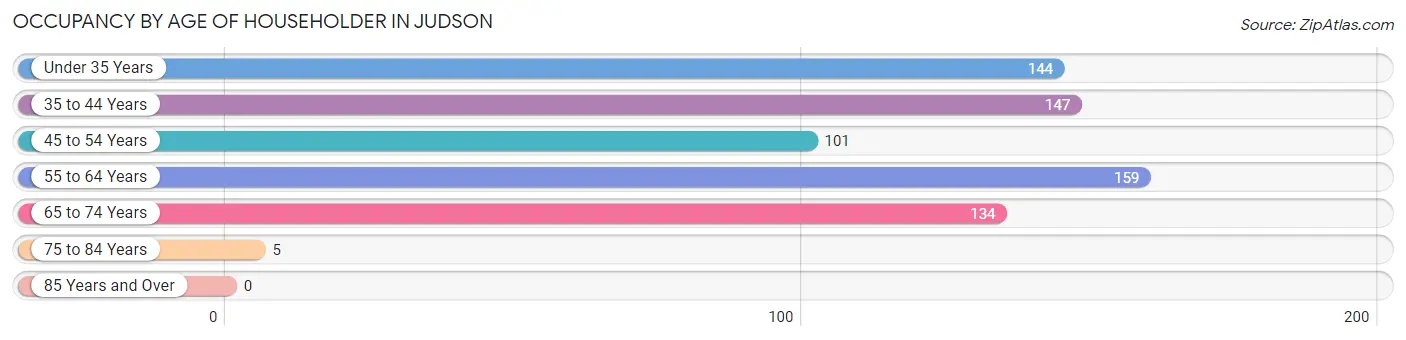
| Age Bracket | # Households | % Households |
| Under 35 Years | 144 | 20.9% |
| 35 to 44 Years | 147 | 21.3% |
| 45 to 54 Years | 101 | 14.6% |
| 55 to 64 Years | 159 | 23.0% |
| 65 to 74 Years | 134 | 19.4% |
| 75 to 84 Years | 5 | 0.7% |
| 85 Years and Over | 0 | 0.0% |
| Total | 690 | 100.0% |
Housing Finances in Judson
Median Income by Occupancy in Judson
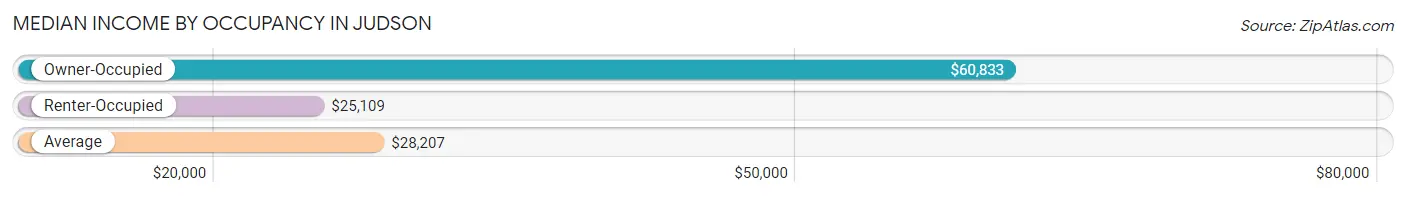
| Occupancy Type | # Households | Median Income |
| Owner-Occupied | 306 (44.4%) | $60,833 |
| Renter-Occupied | 384 (55.6%) | $25,109 |
| Average | 690 (100.0%) | $28,207 |
Occupancy by Householder Income Bracket in Judson
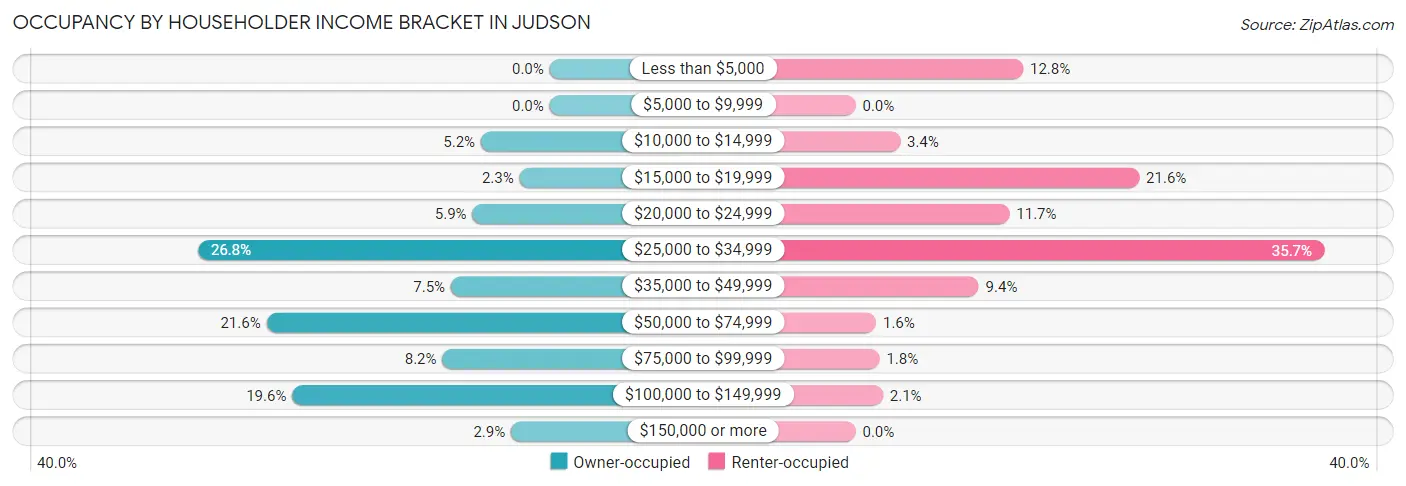
| Income Bracket | Owner-occupied | Renter-occupied |
| Less than $5,000 | 0 (0.0%) | 49 (12.8%) |
| $5,000 to $9,999 | 0 (0.0%) | 0 (0.0%) |
| $10,000 to $14,999 | 16 (5.2%) | 13 (3.4%) |
| $15,000 to $19,999 | 7 (2.3%) | 83 (21.6%) |
| $20,000 to $24,999 | 18 (5.9%) | 45 (11.7%) |
| $25,000 to $34,999 | 82 (26.8%) | 137 (35.7%) |
| $35,000 to $49,999 | 23 (7.5%) | 36 (9.4%) |
| $50,000 to $74,999 | 66 (21.6%) | 6 (1.6%) |
| $75,000 to $99,999 | 25 (8.2%) | 7 (1.8%) |
| $100,000 to $149,999 | 60 (19.6%) | 8 (2.1%) |
| $150,000 or more | 9 (2.9%) | 0 (0.0%) |
| Total | 306 (100.0%) | 384 (100.0%) |
Monthly Housing Cost Tiers in Judson
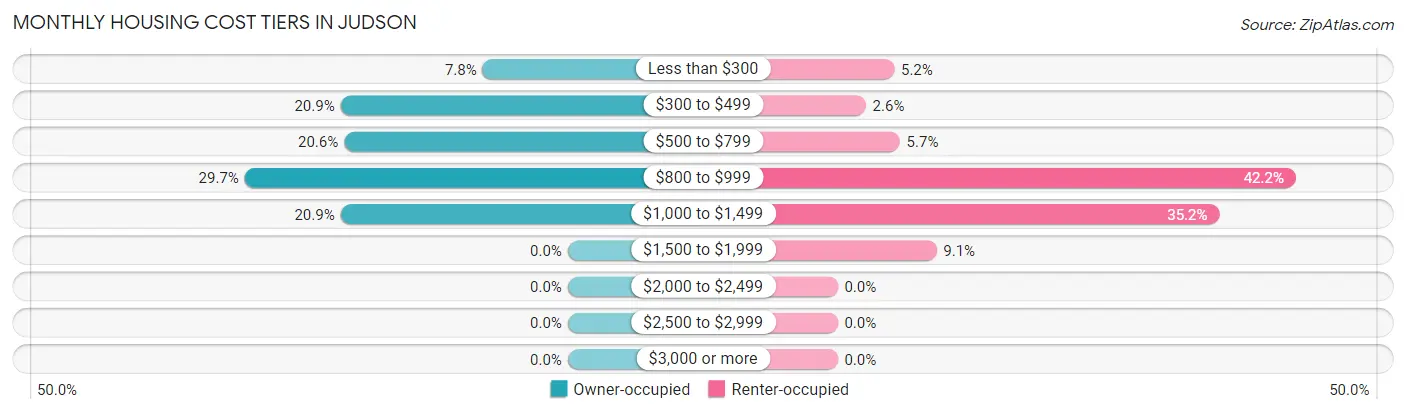
| Monthly Cost | Owner-occupied | Renter-occupied |
| Less than $300 | 24 (7.8%) | 20 (5.2%) |
| $300 to $499 | 64 (20.9%) | 10 (2.6%) |
| $500 to $799 | 63 (20.6%) | 22 (5.7%) |
| $800 to $999 | 91 (29.7%) | 162 (42.2%) |
| $1,000 to $1,499 | 64 (20.9%) | 135 (35.2%) |
| $1,500 to $1,999 | 0 (0.0%) | 35 (9.1%) |
| $2,000 to $2,499 | 0 (0.0%) | 0 (0.0%) |
| $2,500 to $2,999 | 0 (0.0%) | 0 (0.0%) |
| $3,000 or more | 0 (0.0%) | 0 (0.0%) |
| Total | 306 (100.0%) | 384 (100.0%) |
Physical Housing Characteristics in Judson
Housing Structures in Judson
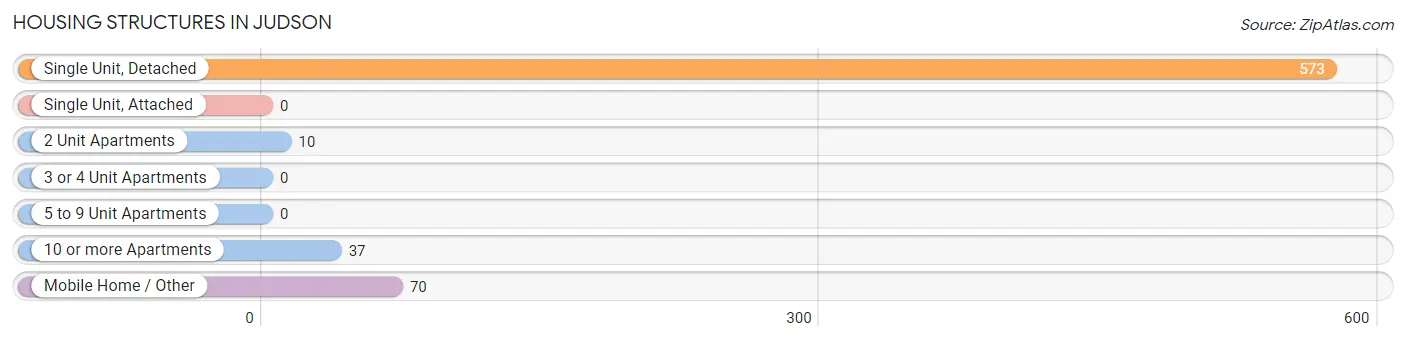
| Structure Type | # Housing Units | % Housing Units |
| Single Unit, Detached | 573 | 83.0% |
| Single Unit, Attached | 0 | 0.0% |
| 2 Unit Apartments | 10 | 1.5% |
| 3 or 4 Unit Apartments | 0 | 0.0% |
| 5 to 9 Unit Apartments | 0 | 0.0% |
| 10 or more Apartments | 37 | 5.4% |
| Mobile Home / Other | 70 | 10.1% |
| Total | 690 | 100.0% |
Housing Structures by Occupancy in Judson
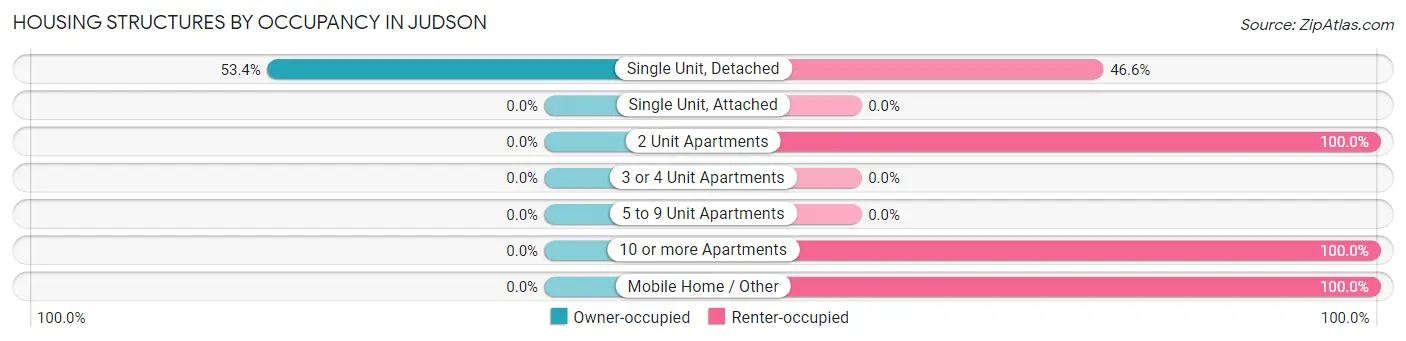
| Structure Type | Owner-occupied | Renter-occupied |
| Single Unit, Detached | 306 (53.4%) | 267 (46.6%) |
| Single Unit, Attached | 0 (0.0%) | 0 (0.0%) |
| 2 Unit Apartments | 0 (0.0%) | 10 (100.0%) |
| 3 or 4 Unit Apartments | 0 (0.0%) | 0 (0.0%) |
| 5 to 9 Unit Apartments | 0 (0.0%) | 0 (0.0%) |
| 10 or more Apartments | 0 (0.0%) | 37 (100.0%) |
| Mobile Home / Other | 0 (0.0%) | 70 (100.0%) |
| Total | 306 (44.4%) | 384 (55.6%) |
Housing Structures by Number of Rooms in Judson
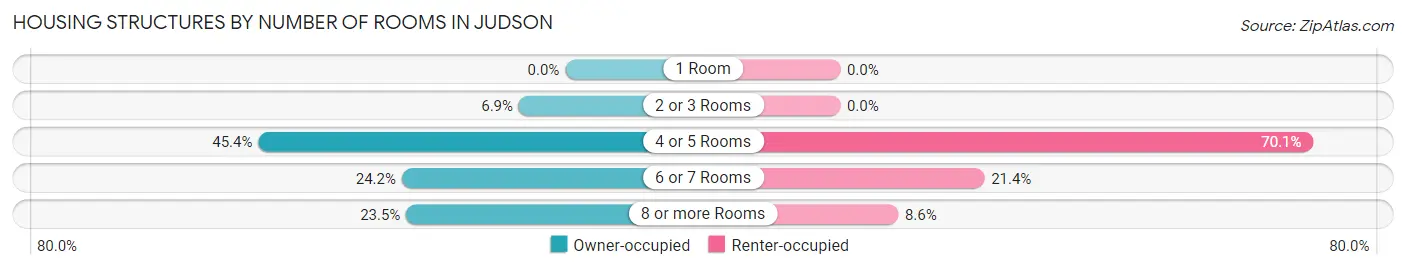
| Number of Rooms | Owner-occupied | Renter-occupied |
| 1 Room | 0 (0.0%) | 0 (0.0%) |
| 2 or 3 Rooms | 21 (6.9%) | 0 (0.0%) |
| 4 or 5 Rooms | 139 (45.4%) | 269 (70.1%) |
| 6 or 7 Rooms | 74 (24.2%) | 82 (21.3%) |
| 8 or more Rooms | 72 (23.5%) | 33 (8.6%) |
| Total | 306 (100.0%) | 384 (100.0%) |
Housing Structure by Heating Type in Judson
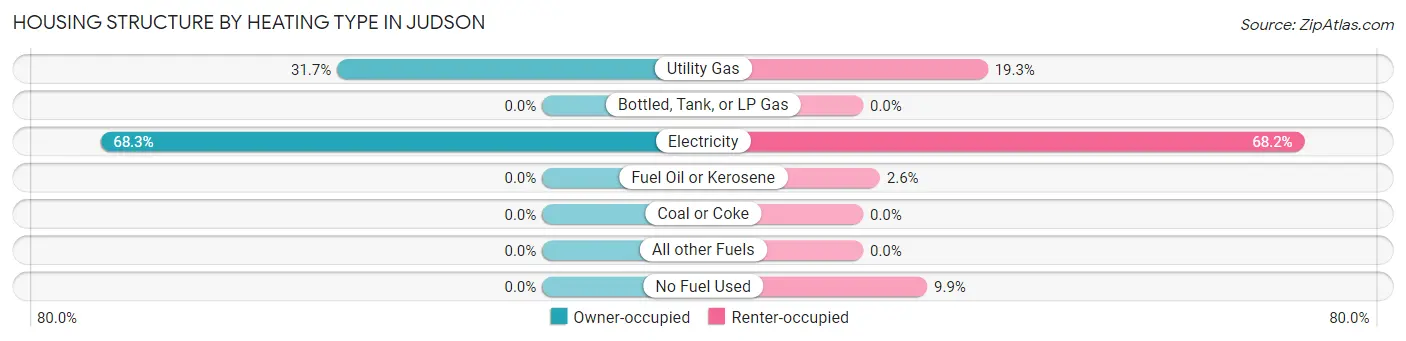
| Heating Type | Owner-occupied | Renter-occupied |
| Utility Gas | 97 (31.7%) | 74 (19.3%) |
| Bottled, Tank, or LP Gas | 0 (0.0%) | 0 (0.0%) |
| Electricity | 209 (68.3%) | 262 (68.2%) |
| Fuel Oil or Kerosene | 0 (0.0%) | 10 (2.6%) |
| Coal or Coke | 0 (0.0%) | 0 (0.0%) |
| All other Fuels | 0 (0.0%) | 0 (0.0%) |
| No Fuel Used | 0 (0.0%) | 38 (9.9%) |
| Total | 306 (100.0%) | 384 (100.0%) |
Household Vehicle Usage in Judson
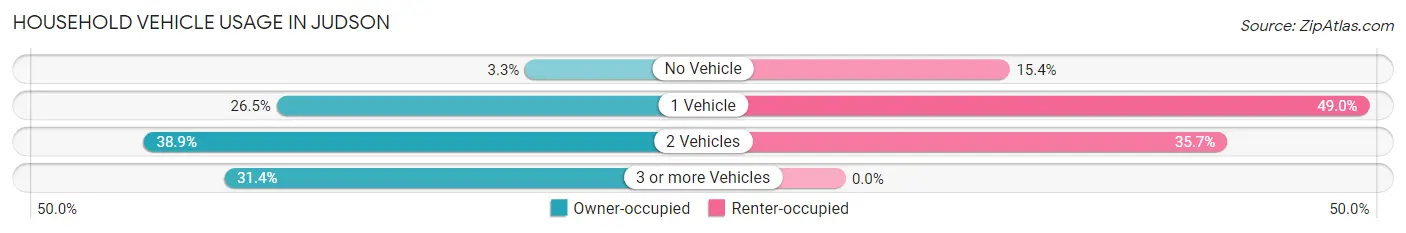
| Vehicles per Household | Owner-occupied | Renter-occupied |
| No Vehicle | 10 (3.3%) | 59 (15.4%) |
| 1 Vehicle | 81 (26.5%) | 188 (49.0%) |
| 2 Vehicles | 119 (38.9%) | 137 (35.7%) |
| 3 or more Vehicles | 96 (31.4%) | 0 (0.0%) |
| Total | 306 (100.0%) | 384 (100.0%) |
Real Estate & Mortgages in Judson
Real Estate and Mortgage Overview in Judson
| Characteristic | Without Mortgage | With Mortgage |
| Housing Units | 104 | 202 |
| Median Property Value | $104,500 | $61,500 |
| Median Household Income | - | - |
| Monthly Housing Costs | $416 | $0 |
| Real Estate Taxes | $963 | $0 |
Property Value by Mortgage Status in Judson
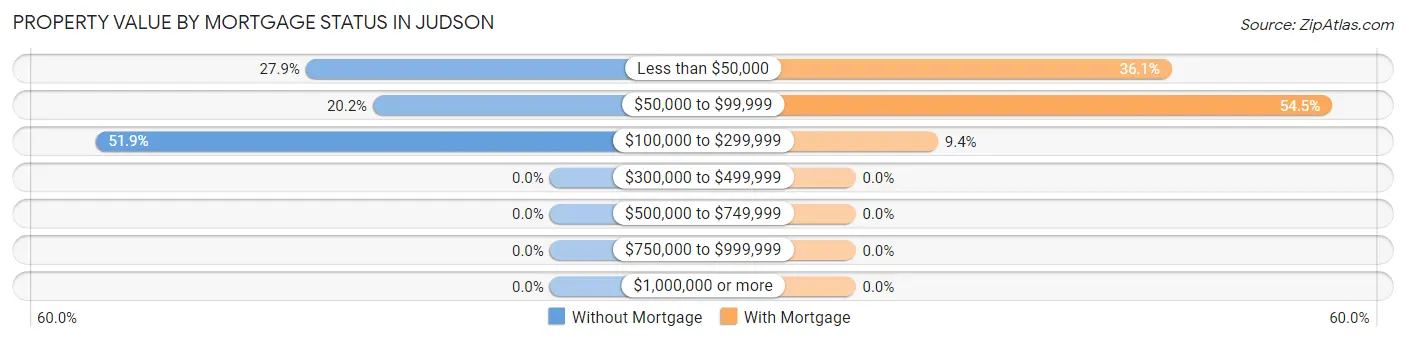
| Property Value | Without Mortgage | With Mortgage |
| Less than $50,000 | 29 (27.9%) | 73 (36.1%) |
| $50,000 to $99,999 | 21 (20.2%) | 110 (54.5%) |
| $100,000 to $299,999 | 54 (51.9%) | 19 (9.4%) |
| $300,000 to $499,999 | 0 (0.0%) | 0 (0.0%) |
| $500,000 to $749,999 | 0 (0.0%) | 0 (0.0%) |
| $750,000 to $999,999 | 0 (0.0%) | 0 (0.0%) |
| $1,000,000 or more | 0 (0.0%) | 0 (0.0%) |
| Total | 104 (100.0%) | 202 (100.0%) |
Household Income by Mortgage Status in Judson
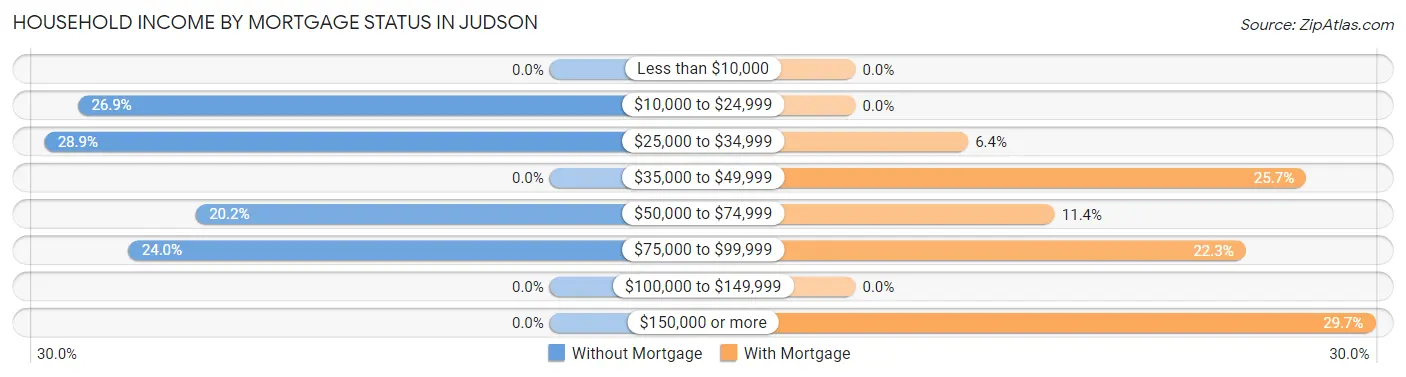
| Household Income | Without Mortgage | With Mortgage |
| Less than $10,000 | 0 (0.0%) | 0 (0.0%) |
| $10,000 to $24,999 | 28 (26.9%) | 0 (0.0%) |
| $25,000 to $34,999 | 30 (28.8%) | 13 (6.4%) |
| $35,000 to $49,999 | 0 (0.0%) | 52 (25.7%) |
| $50,000 to $74,999 | 21 (20.2%) | 23 (11.4%) |
| $75,000 to $99,999 | 25 (24.0%) | 45 (22.3%) |
| $100,000 to $149,999 | 0 (0.0%) | 0 (0.0%) |
| $150,000 or more | 0 (0.0%) | 60 (29.7%) |
| Total | 104 (100.0%) | 202 (100.0%) |
Property Value to Household Income Ratio in Judson
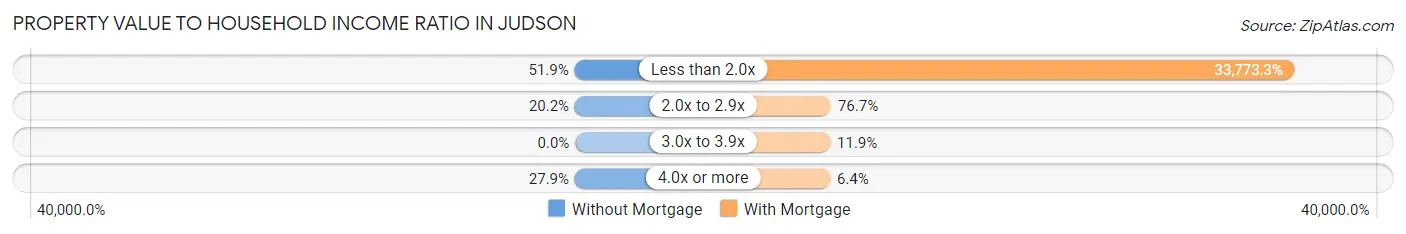
| Value-to-Income Ratio | Without Mortgage | With Mortgage |
| Less than 2.0x | 54 (51.9%) | 68,222 (33,773.3%) |
| 2.0x to 2.9x | 21 (20.2%) | 155 (76.7%) |
| 3.0x to 3.9x | 0 (0.0%) | 24 (11.9%) |
| 4.0x or more | 29 (27.9%) | 13 (6.4%) |
| Total | 104 (100.0%) | 202 (100.0%) |
Real Estate Taxes by Mortgage Status in Judson
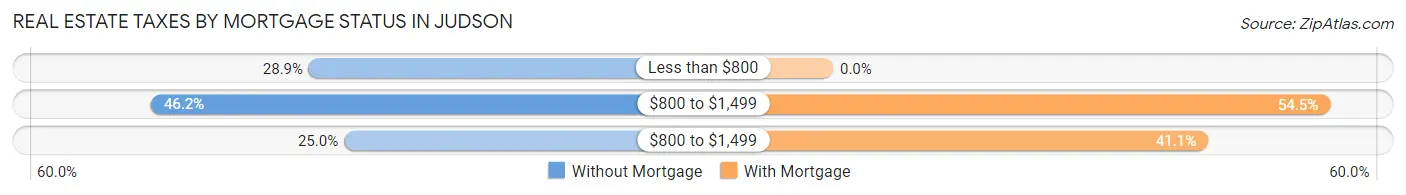
| Property Taxes | Without Mortgage | With Mortgage |
| Less than $800 | 30 (28.8%) | 0 (0.0%) |
| $800 to $1,499 | 48 (46.2%) | 110 (54.5%) |
| $800 to $1,499 | 26 (25.0%) | 83 (41.1%) |
| Total | 104 (100.0%) | 202 (100.0%) |
Health & Disability in Judson
Health Insurance Coverage by Age in Judson
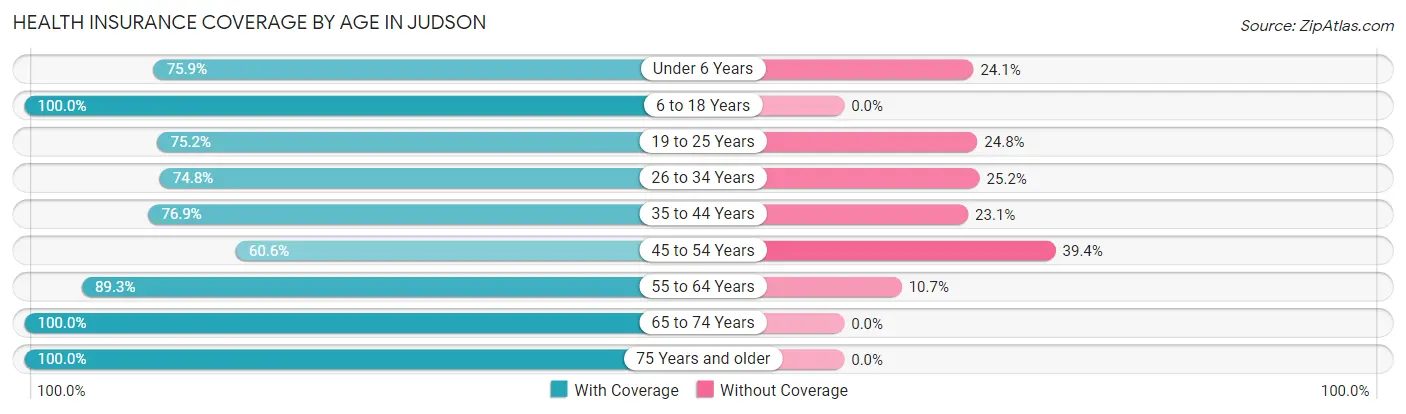
| Age Bracket | With Coverage | Without Coverage |
| Under 6 Years | 104 (75.9%) | 33 (24.1%) |
| 6 to 18 Years | 442 (100.0%) | 0 (0.0%) |
| 19 to 25 Years | 106 (75.2%) | 35 (24.8%) |
| 26 to 34 Years | 154 (74.8%) | 52 (25.2%) |
| 35 to 44 Years | 243 (76.9%) | 73 (23.1%) |
| 45 to 54 Years | 103 (60.6%) | 67 (39.4%) |
| 55 to 64 Years | 200 (89.3%) | 24 (10.7%) |
| 65 to 74 Years | 162 (100.0%) | 0 (0.0%) |
| 75 Years and older | 48 (100.0%) | 0 (0.0%) |
| Total | 1,562 (84.6%) | 284 (15.4%) |
Health Insurance Coverage by Citizenship Status in Judson
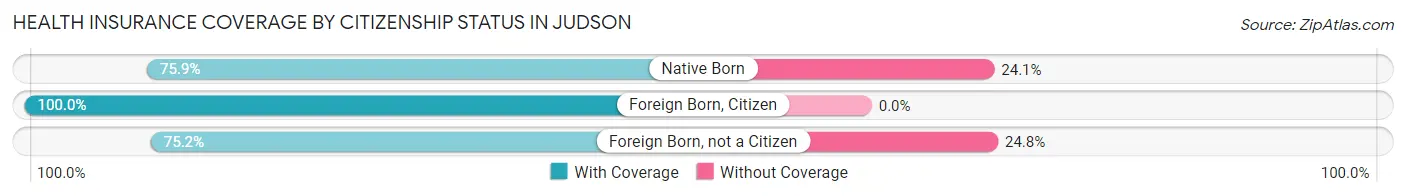
| Citizenship Status | With Coverage | Without Coverage |
| Native Born | 104 (75.9%) | 33 (24.1%) |
| Foreign Born, Citizen | 442 (100.0%) | 0 (0.0%) |
| Foreign Born, not a Citizen | 106 (75.2%) | 35 (24.8%) |
Health Insurance Coverage by Household Income in Judson
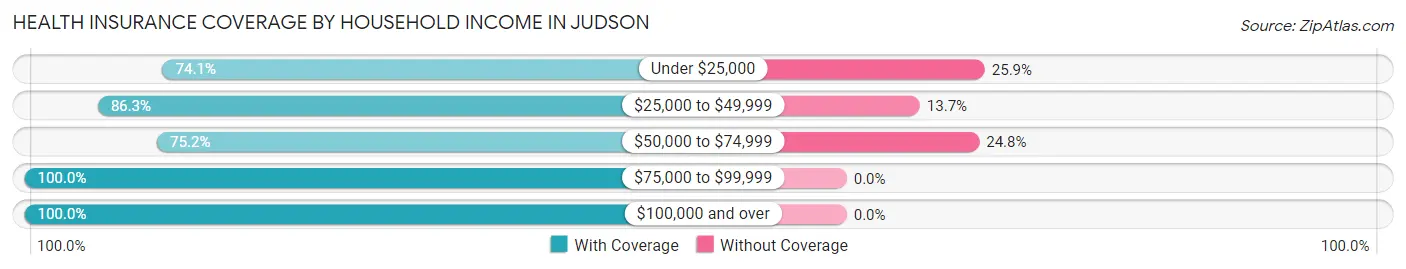
| Household Income | With Coverage | Without Coverage |
| Under $25,000 | 407 (74.1%) | 142 (25.9%) |
| $25,000 to $49,999 | 674 (86.3%) | 107 (13.7%) |
| $50,000 to $74,999 | 106 (75.2%) | 35 (24.8%) |
| $75,000 to $99,999 | 156 (100.0%) | 0 (0.0%) |
| $100,000 and over | 219 (100.0%) | 0 (0.0%) |
Public vs Private Health Insurance Coverage by Age in Judson
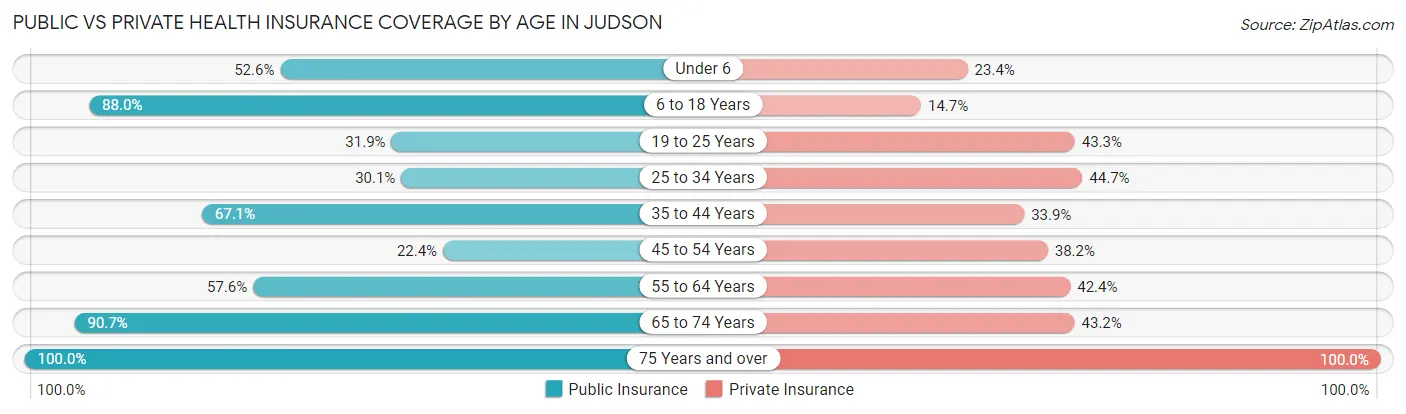
| Age Bracket | Public Insurance | Private Insurance |
| Under 6 | 72 (52.5%) | 32 (23.4%) |
| 6 to 18 Years | 389 (88.0%) | 65 (14.7%) |
| 19 to 25 Years | 45 (31.9%) | 61 (43.3%) |
| 25 to 34 Years | 62 (30.1%) | 92 (44.7%) |
| 35 to 44 Years | 212 (67.1%) | 107 (33.9%) |
| 45 to 54 Years | 38 (22.4%) | 65 (38.2%) |
| 55 to 64 Years | 129 (57.6%) | 95 (42.4%) |
| 65 to 74 Years | 147 (90.7%) | 70 (43.2%) |
| 75 Years and over | 48 (100.0%) | 48 (100.0%) |
| Total | 1,142 (61.9%) | 635 (34.4%) |
Disability Status by Sex by Age in Judson
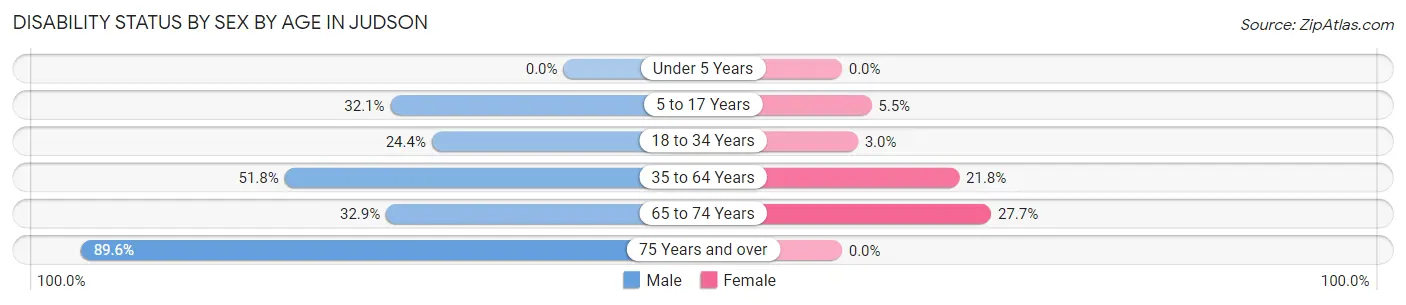
| Age Bracket | Male | Female |
| Under 5 Years | 0 (0.0%) | 0 (0.0%) |
| 5 to 17 Years | 61 (32.1%) | 12 (5.5%) |
| 18 to 34 Years | 43 (24.4%) | 7 (2.9%) |
| 35 to 64 Years | 163 (51.7%) | 86 (21.8%) |
| 65 to 74 Years | 26 (32.9%) | 23 (27.7%) |
| 75 Years and over | 43 (89.6%) | 0 (0.0%) |
Disability Class by Sex by Age in Judson
Disability Class: Hearing Difficulty
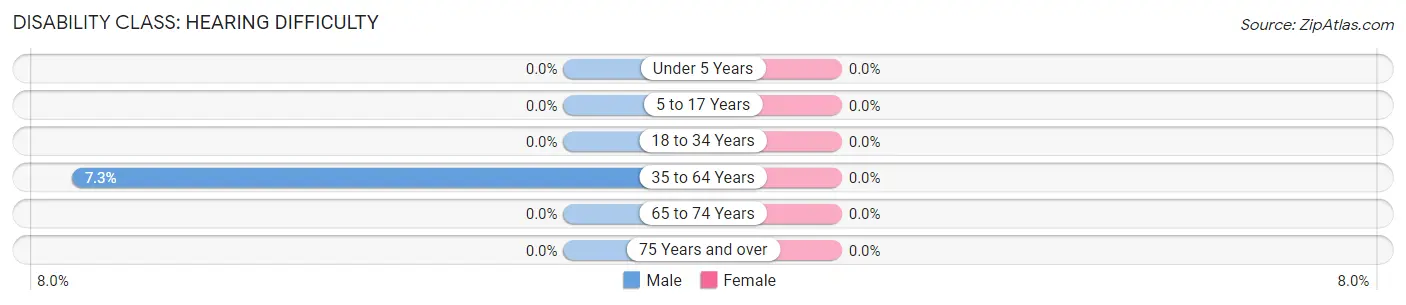
| Age Bracket | Male | Female |
| Under 5 Years | 0 (0.0%) | 0 (0.0%) |
| 5 to 17 Years | 0 (0.0%) | 0 (0.0%) |
| 18 to 34 Years | 0 (0.0%) | 0 (0.0%) |
| 35 to 64 Years | 23 (7.3%) | 0 (0.0%) |
| 65 to 74 Years | 0 (0.0%) | 0 (0.0%) |
| 75 Years and over | 0 (0.0%) | 0 (0.0%) |
Disability Class: Vision Difficulty
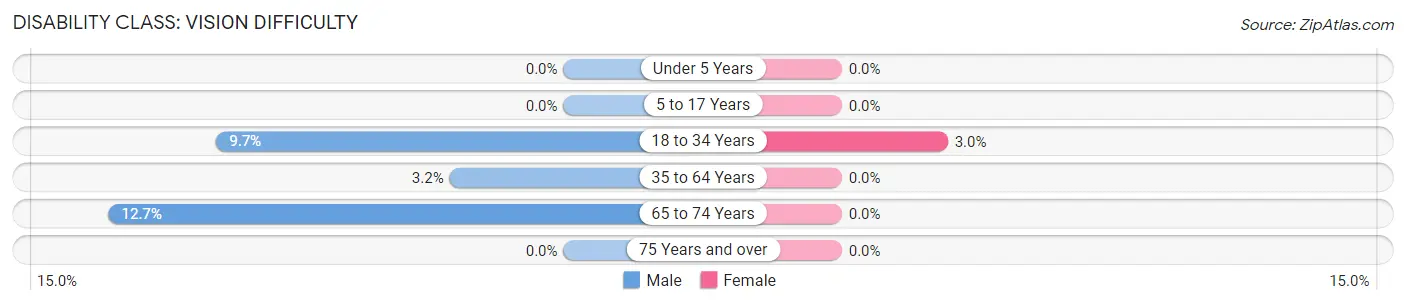
| Age Bracket | Male | Female |
| Under 5 Years | 0 (0.0%) | 0 (0.0%) |
| 5 to 17 Years | 0 (0.0%) | 0 (0.0%) |
| 18 to 34 Years | 17 (9.7%) | 7 (2.9%) |
| 35 to 64 Years | 10 (3.2%) | 0 (0.0%) |
| 65 to 74 Years | 10 (12.7%) | 0 (0.0%) |
| 75 Years and over | 0 (0.0%) | 0 (0.0%) |
Disability Class: Cognitive Difficulty
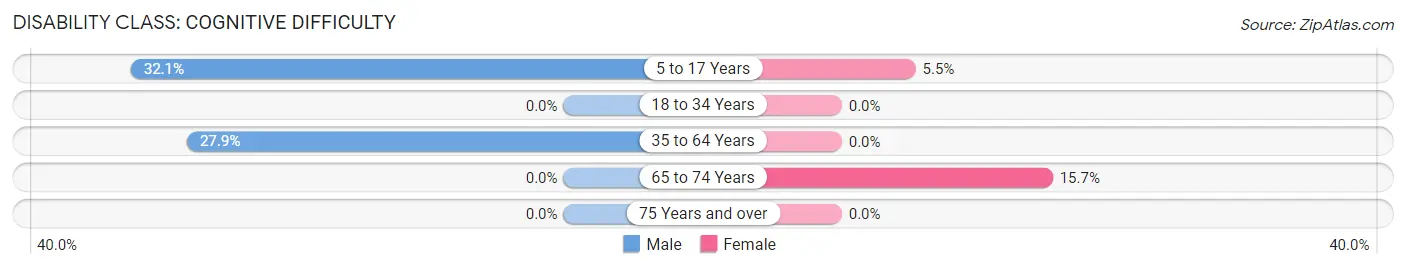
| Age Bracket | Male | Female |
| 5 to 17 Years | 61 (32.1%) | 12 (5.5%) |
| 18 to 34 Years | 0 (0.0%) | 0 (0.0%) |
| 35 to 64 Years | 88 (27.9%) | 0 (0.0%) |
| 65 to 74 Years | 0 (0.0%) | 13 (15.7%) |
| 75 Years and over | 0 (0.0%) | 0 (0.0%) |
Disability Class: Ambulatory Difficulty
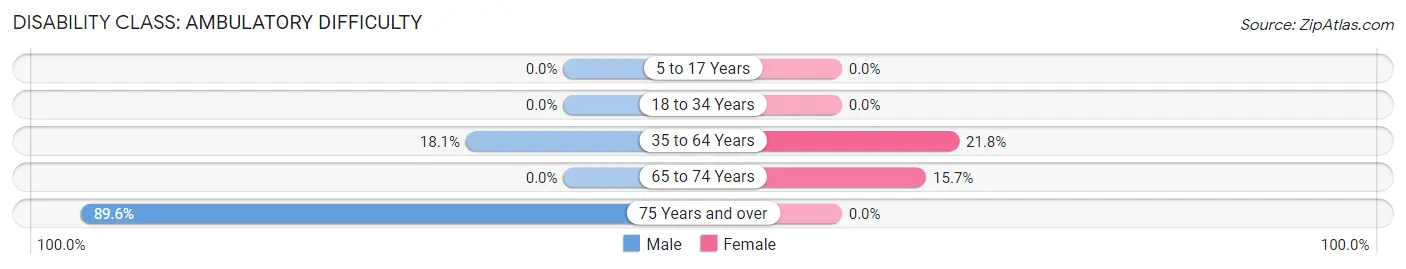
| Age Bracket | Male | Female |
| 5 to 17 Years | 0 (0.0%) | 0 (0.0%) |
| 18 to 34 Years | 0 (0.0%) | 0 (0.0%) |
| 35 to 64 Years | 57 (18.1%) | 86 (21.8%) |
| 65 to 74 Years | 0 (0.0%) | 13 (15.7%) |
| 75 Years and over | 43 (89.6%) | 0 (0.0%) |
Disability Class: Self-Care Difficulty
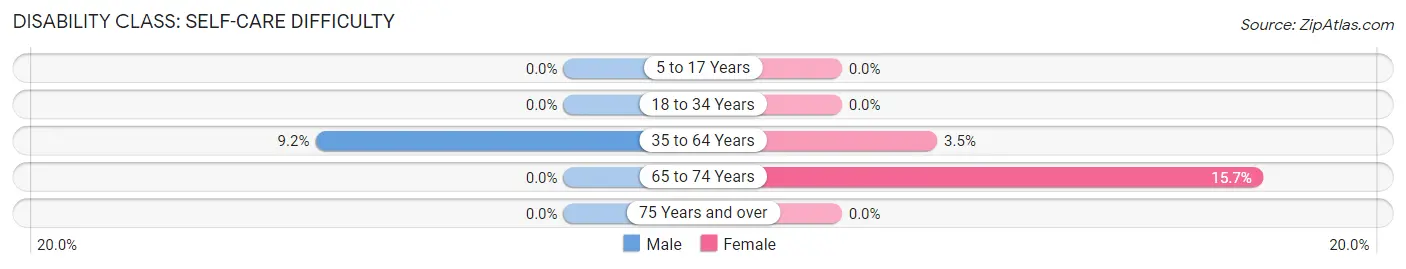
| Age Bracket | Male | Female |
| 5 to 17 Years | 0 (0.0%) | 0 (0.0%) |
| 18 to 34 Years | 0 (0.0%) | 0 (0.0%) |
| 35 to 64 Years | 29 (9.2%) | 14 (3.5%) |
| 65 to 74 Years | 0 (0.0%) | 13 (15.7%) |
| 75 Years and over | 0 (0.0%) | 0 (0.0%) |
Technology Access in Judson
Computing Device Access in Judson
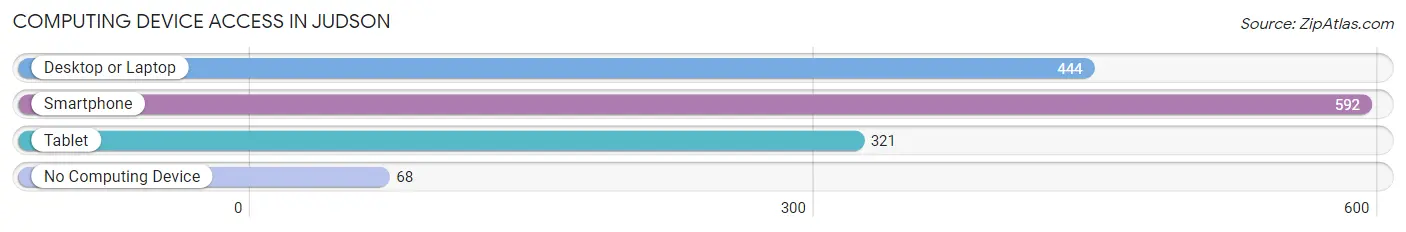
| Device Type | # Households | % Households |
| Desktop or Laptop | 444 | 64.3% |
| Smartphone | 592 | 85.8% |
| Tablet | 321 | 46.5% |
| No Computing Device | 68 | 9.9% |
| Total | 690 | 100.0% |
Internet Access in Judson
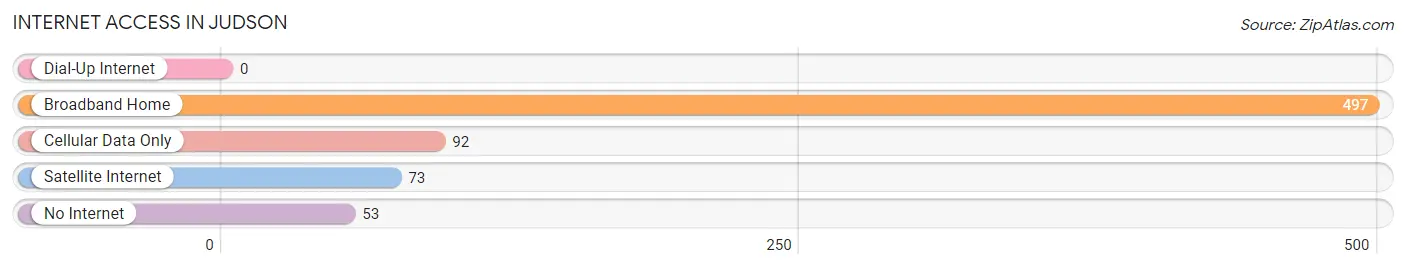
| Internet Type | # Households | % Households |
| Dial-Up Internet | 0 | 0.0% |
| Broadband Home | 497 | 72.0% |
| Cellular Data Only | 92 | 13.3% |
| Satellite Internet | 73 | 10.6% |
| No Internet | 53 | 7.7% |
| Total | 690 | 100.0% |
Judson Summary
Judson, South Carolina is a small town located in the northwestern corner of the state, near the border of North Carolina. It is part of the Greenville-Spartanburg-Anderson metropolitan area, and is situated in the foothills of the Blue Ridge Mountains. The town has a population of just over 1,000 people, and is known for its rural charm and friendly atmosphere.
Geography
Judson is located in the northwestern corner of South Carolina, near the border of North Carolina. It is situated in the foothills of the Blue Ridge Mountains, and is part of the Greenville-Spartanburg-Anderson metropolitan area. The town is located in Laurens County, and is bordered by the towns of Gray Court, Clinton, and Laurens. The town is situated on the Enoree River, and is surrounded by rolling hills and lush forests.
Economy
Judson’s economy is largely based on agriculture and manufacturing. The town is home to several small businesses, including a feed store, a hardware store, and a lumber yard. The town is also home to several farms, which produce a variety of crops, including corn, soybeans, and cotton. The town is also home to several manufacturing plants, which produce a variety of products, including furniture, textiles, and automotive parts.
Demographics
As of the 2010 census, Judson had a population of 1,072 people. The racial makeup of the town was 94.3% White, 3.2% African American, 0.3% Native American, 0.3% Asian, 0.2% from other races, and 1.7% from two or more races. Hispanic or Latino of any race were 1.2% of the population.
The median income for a household in the town was $31,250, and the median income for a family was $37,500. The per capita income for the town was $15,945. About 15.2% of families and 17.2% of the population were below the poverty line, including 22.2% of those under age 18 and 11.3% of those age 65 or over.
Conclusion
Judson, South Carolina is a small town located in the northwestern corner of the state, near the border of North Carolina. It is part of the Greenville-Spartanburg-Anderson metropolitan area, and is situated in the foothills of the Blue Ridge Mountains. The town has a population of just over 1,000 people, and is known for its rural charm and friendly atmosphere. The town’s economy is largely based on agriculture and manufacturing, and the town is home to several small businesses, farms, and manufacturing plants. The town’s population is predominantly White, with a small percentage of African Americans, Native Americans, Asians, and other races. The median income for a household in the town is $31,250, and the median income for a family is $37,500.
Common Questions
What is Per Capita Income in Judson?
Per Capita income in Judson is $16,442.
What is the Median Family Income in Judson?
Median Family Income in Judson is $28,497.
What is the Median Household income in Judson?
Median Household Income in Judson is $28,207.
What is Income or Wage Gap in Judson?
Income or Wage Gap in Judson is 23.6%.
Women in Judson earn 76.4 cents for every dollar earned by a man.
What is Inequality or Gini Index in Judson?
Inequality or Gini Index in Judson is 0.46.
What is the Total Population of Judson?
Total Population of Judson is 1,879.
What is the Total Male Population of Judson?
Total Male Population of Judson is 867.
What is the Total Female Population of Judson?
Total Female Population of Judson is 1,012.
What is the Ratio of Males per 100 Females in Judson?
There are 85.67 Males per 100 Females in Judson.
What is the Ratio of Females per 100 Males in Judson?
There are 116.72 Females per 100 Males in Judson.
What is the Median Population Age in Judson?
Median Population Age in Judson is 34.6 Years.
What is the Average Family Size in Judson
Average Family Size in Judson is 3.2 People.
What is the Average Household Size in Judson
Average Household Size in Judson is 2.7 People.
How Large is the Labor Force in Judson?
There are 777 People in the Labor Forcein in Judson.
What is the Percentage of People in the Labor Force in Judson?
55.0% of People are in the Labor Force in Judson.
What is the Unemployment Rate in Judson?
Unemployment Rate in Judson is 21.9%.