Andrews, SC Map & Demographics
Andrews Map
Andrews Overview
$25,008
PER CAPITA INCOME
$54,297
AVG FAMILY INCOME
$42,337
AVG HOUSEHOLD INCOME
0.46
INEQUALITY / GINI INDEX
3,617
TOTAL POPULATION
1,583
MALE POPULATION
2,034
FEMALE POPULATION
77.83
MALES / 100 FEMALES
128.49
FEMALES / 100 MALES
34.0
MEDIAN AGE
3.1
AVG FAMILY SIZE
2.8
AVG HOUSEHOLD SIZE
1,740
LABOR FORCE [ PEOPLE ]
64.5%
PERCENT IN LABOR FORCE
0.6%
UNEMPLOYMENT RATE
Andrews Zip Codes
Andrews Area Codes
Income in Andrews
Income Overview in Andrews
Per Capita Income in Andrews is $25,008, while median incomes of families and households are $54,297 and $42,337 respectively.
| Characteristic | Number | Measure |
| Per Capita Income | 3,617 | $25,008 |
| Median Family Income | 1,041 | $54,297 |
| Mean Family Income | 1,041 | $70,603 |
| Median Household Income | 1,273 | $42,337 |
| Mean Household Income | 1,273 | $69,711 |
| Income Deficit | 1,041 | $0 |
| Wage / Income Gap (%) | 3,617 | 0.00% |
| Wage / Income Gap ($) | 3,617 | 100.00¢ per $1 |
| Gini / Inequality Index | 3,617 | 0.46 |
Earnings by Sex in Andrews
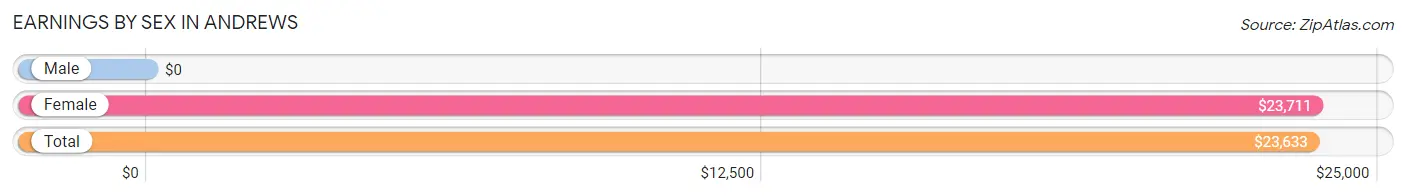
| Sex | Number | Average Earnings |
| Male | 878 (49.1%) | $0 |
| Female | 909 (50.9%) | $23,711 |
| Total | 1,787 (100.0%) | $23,633 |
Earnings by Sex by Income Bracket in Andrews
The most common earnings brackets in Andrews are $100,000+ for men (222 | 25.3%) and $22,500 to $24,999 for women (222 | 24.4%).
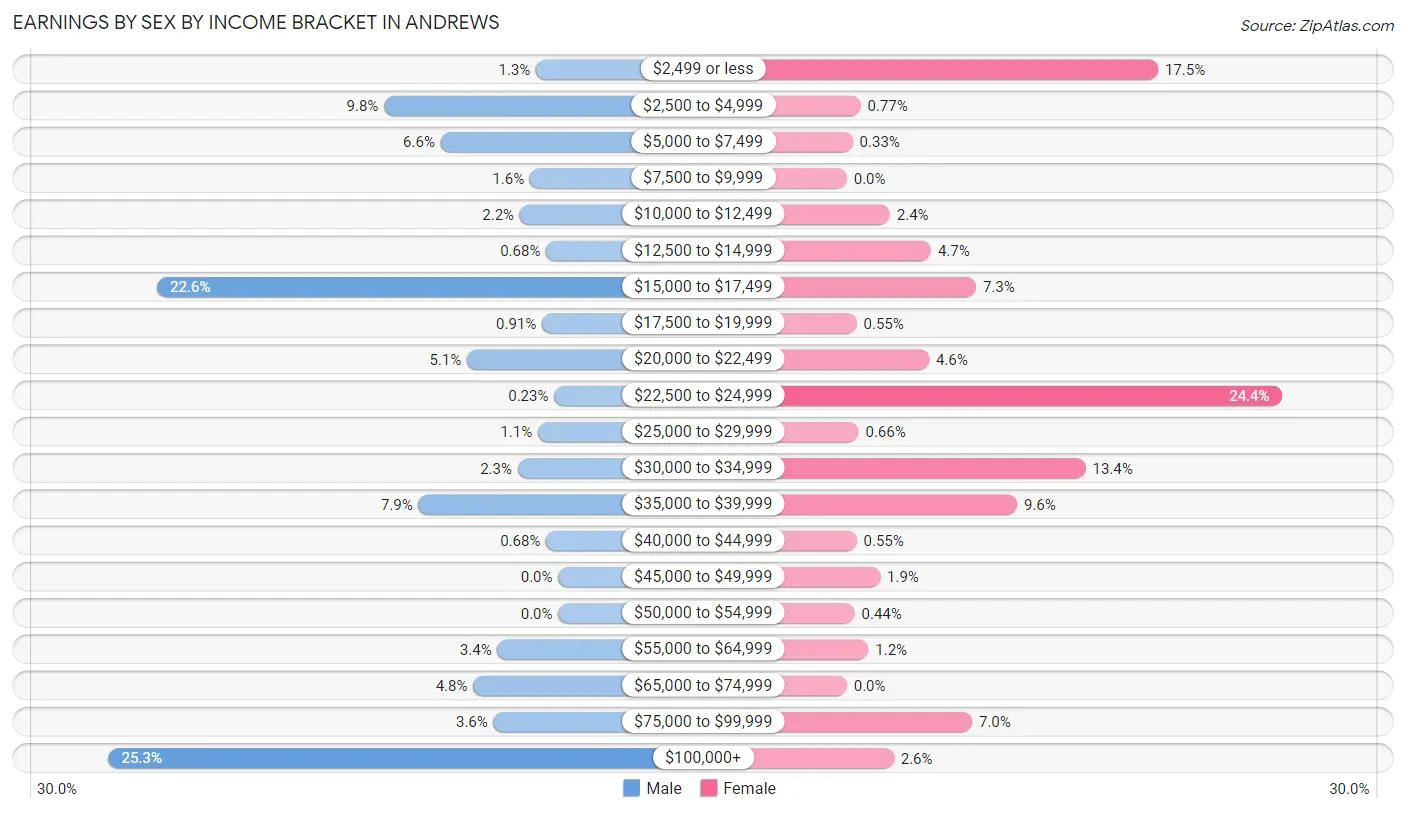
| Income | Male | Female |
| $2,499 or less | 11 (1.3%) | 159 (17.5%) |
| $2,500 to $4,999 | 86 (9.8%) | 7 (0.8%) |
| $5,000 to $7,499 | 58 (6.6%) | 3 (0.3%) |
| $7,500 to $9,999 | 14 (1.6%) | 0 (0.0%) |
| $10,000 to $12,499 | 19 (2.2%) | 22 (2.4%) |
| $12,500 to $14,999 | 6 (0.7%) | 43 (4.7%) |
| $15,000 to $17,499 | 198 (22.6%) | 66 (7.3%) |
| $17,500 to $19,999 | 8 (0.9%) | 5 (0.5%) |
| $20,000 to $22,499 | 45 (5.1%) | 42 (4.6%) |
| $22,500 to $24,999 | 2 (0.2%) | 222 (24.4%) |
| $25,000 to $29,999 | 10 (1.1%) | 6 (0.7%) |
| $30,000 to $34,999 | 20 (2.3%) | 122 (13.4%) |
| $35,000 to $39,999 | 69 (7.9%) | 87 (9.6%) |
| $40,000 to $44,999 | 6 (0.7%) | 5 (0.5%) |
| $45,000 to $49,999 | 0 (0.0%) | 17 (1.9%) |
| $50,000 to $54,999 | 0 (0.0%) | 4 (0.4%) |
| $55,000 to $64,999 | 30 (3.4%) | 11 (1.2%) |
| $65,000 to $74,999 | 42 (4.8%) | 0 (0.0%) |
| $75,000 to $99,999 | 32 (3.6%) | 64 (7.0%) |
| $100,000+ | 222 (25.3%) | 24 (2.6%) |
| Total | 878 (100.0%) | 909 (100.0%) |
Earnings by Sex by Educational Attainment in Andrews
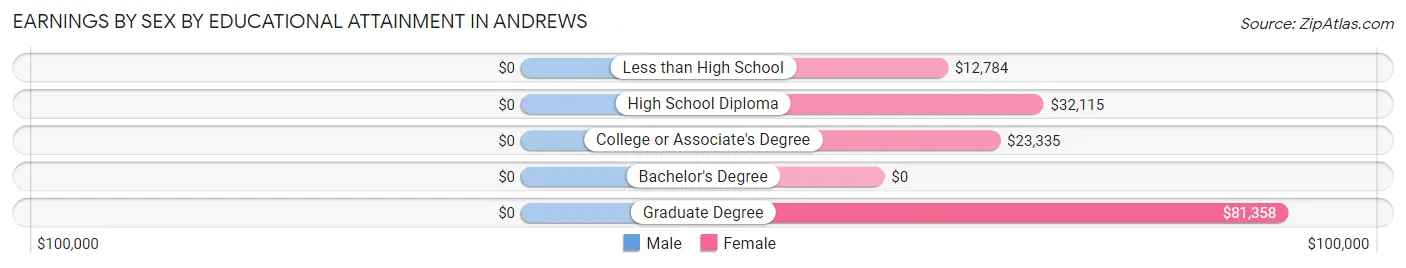
| Educational Attainment | Male Income | Female Income |
| Less than High School | - | - |
| High School Diploma | - | - |
| College or Associate's Degree | - | - |
| Bachelor's Degree | - | - |
| Graduate Degree | - | - |
| Total | - | - |
Family Income in Andrews
Family Income Brackets in Andrews
According to the Andrews family income data, there are 284 families falling into the $100,000 to $149,999 income range, which is the most common income bracket and makes up 27.3% of all families. Conversely, the $10,000 to $14,999 income bracket is the least frequent group with only 8 families (0.8%) belonging to this category.
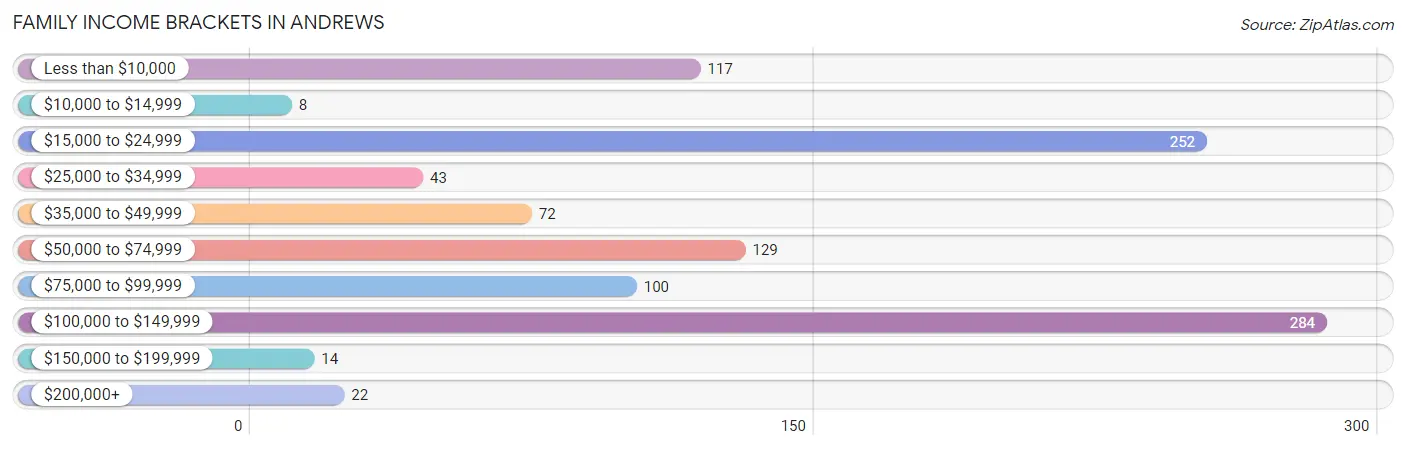
| Income Bracket | # Families | % Families |
| Less than $10,000 | 117 | 11.2% |
| $10,000 to $14,999 | 8 | 0.8% |
| $15,000 to $24,999 | 252 | 24.2% |
| $25,000 to $34,999 | 43 | 4.1% |
| $35,000 to $49,999 | 72 | 6.9% |
| $50,000 to $74,999 | 129 | 12.4% |
| $75,000 to $99,999 | 100 | 9.6% |
| $100,000 to $149,999 | 284 | 27.3% |
| $150,000 to $199,999 | 14 | 1.3% |
| $200,000+ | 22 | 2.1% |
Family Income by Famaliy Size in Andrews
5-person families (66 | 6.3%) account for the highest median family income in Andrews with $115,536 per family, while 2-person families (288 | 27.7%) have the highest median income of $26,030 per family member.

| Income Bracket | # Families | Median Income |
| 2-Person Families | 288 (27.7%) | $52,059 |
| 3-Person Families | 202 (19.4%) | $21,705 |
| 4-Person Families | 462 (44.4%) | $0 |
| 5-Person Families | 66 (6.3%) | $115,536 |
| 6-Person Families | 14 (1.3%) | $0 |
| 7+ Person Families | 9 (0.9%) | $0 |
| Total | 1,041 (100.0%) | $54,297 |
Family Income by Number of Earners in Andrews
The median family income in Andrews is $54,297, with families comprising 3+ earners (238) having the highest median family income of $146,020, while families with 1 earner (438) have the lowest median family income of $17,018, accounting for 22.9% and 42.1% of families, respectively.
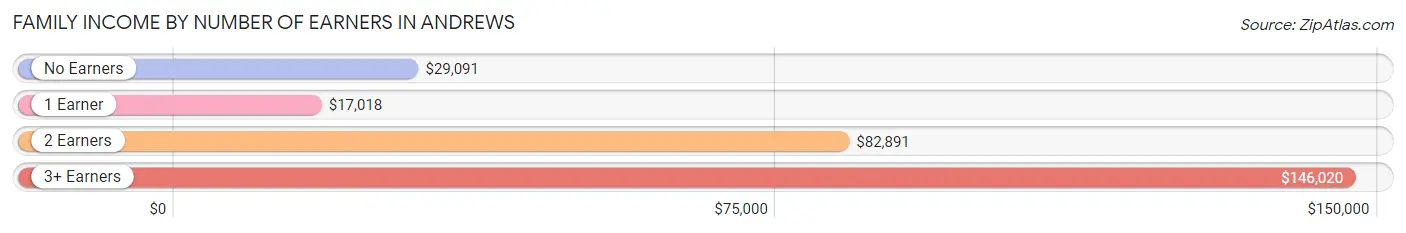
| Number of Earners | # Families | Median Income |
| No Earners | 162 (15.6%) | $29,091 |
| 1 Earner | 438 (42.1%) | $17,018 |
| 2 Earners | 203 (19.5%) | $82,891 |
| 3+ Earners | 238 (22.9%) | $146,020 |
| Total | 1,041 (100.0%) | $54,297 |
Household Income in Andrews
Household Income Brackets in Andrews
With 284 households falling in the category, the $100,000 to $149,999 income range is the most frequent in Andrews, accounting for 22.3% of all households. In contrast, only 14 households (1.1%) fall into the $150,000 to $199,999 income bracket, making it the least populous group.
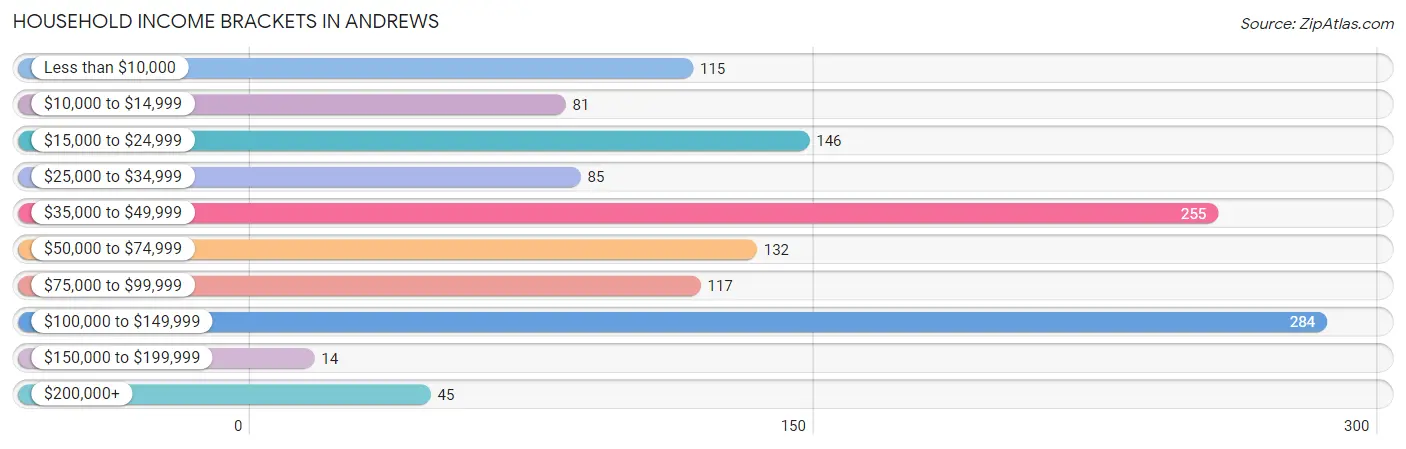
| Income Bracket | # Households | % Households |
| Less than $10,000 | 115 | 9.0% |
| $10,000 to $14,999 | 81 | 6.4% |
| $15,000 to $24,999 | 146 | 11.5% |
| $25,000 to $34,999 | 85 | 6.7% |
| $35,000 to $49,999 | 255 | 20.0% |
| $50,000 to $74,999 | 132 | 10.4% |
| $75,000 to $99,999 | 117 | 9.2% |
| $100,000 to $149,999 | 284 | 22.3% |
| $150,000 to $199,999 | 14 | 1.1% |
| $200,000+ | 45 | 3.5% |
Household Income by Householder Age in Andrews
The median household income in Andrews is $42,337, with the highest median household income of $44,688 found in the 65+ years age bracket for the primary householder. A total of 275 households (21.6%) fall into this category. Meanwhile, the 15 to 24 years age bracket for the primary householder has the lowest median household income of $0, with 5 households (0.4%) in this group.
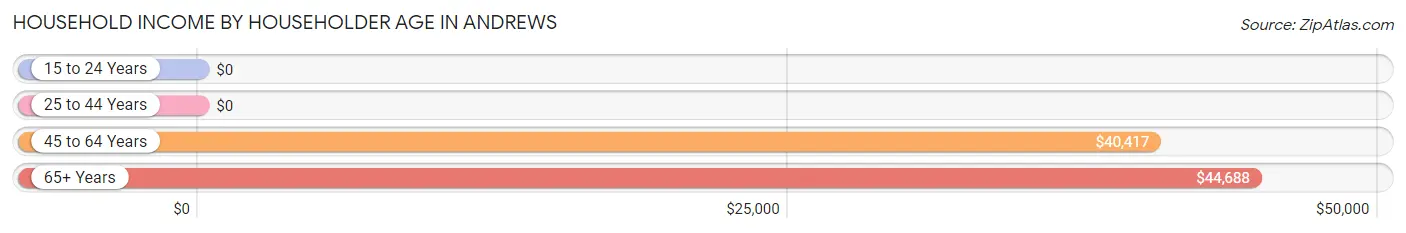
| Income Bracket | # Households | Median Income |
| 15 to 24 Years | 5 (0.4%) | $0 |
| 25 to 44 Years | 623 (48.9%) | $0 |
| 45 to 64 Years | 370 (29.1%) | $40,417 |
| 65+ Years | 275 (21.6%) | $44,688 |
| Total | 1,273 (100.0%) | $42,337 |
Poverty in Andrews
Income Below Poverty by Sex and Age in Andrews
With 29.5% poverty level for males and 40.2% for females among the residents of Andrews, 5 year old males and 6 to 11 year old females are the most vulnerable to poverty, with 7 males (100.0%) and 164 females (96.5%) in their respective age groups living below the poverty level.
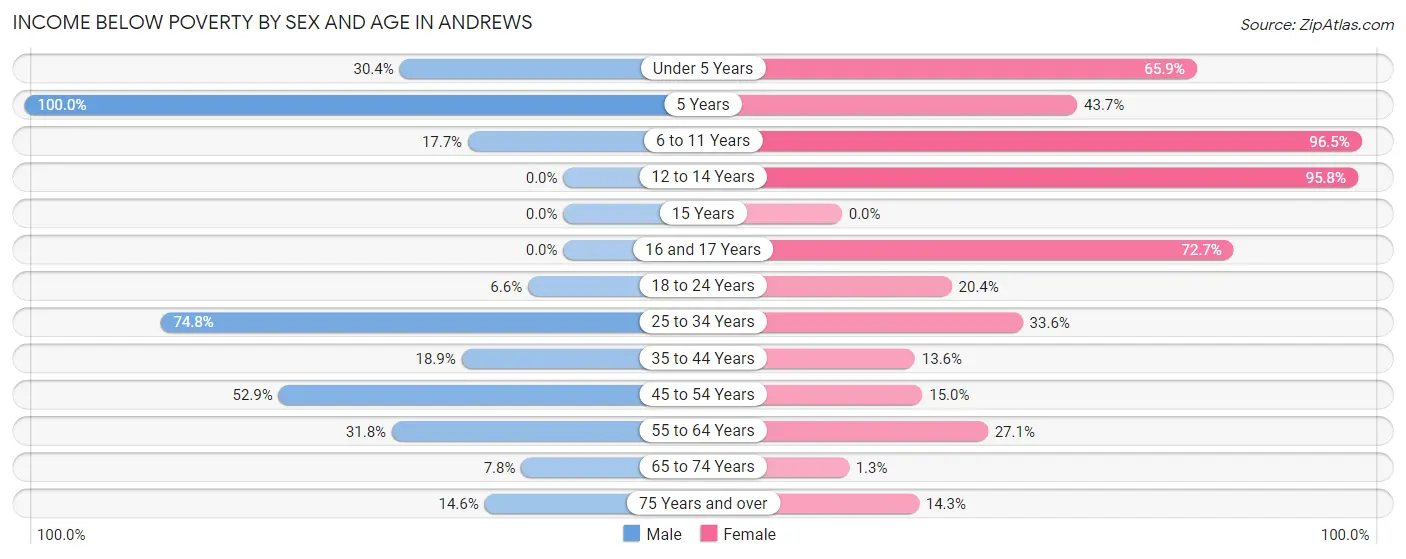
| Age Bracket | Male | Female |
| Under 5 Years | 45 (30.4%) | 81 (65.8%) |
| 5 Years | 7 (100.0%) | 38 (43.7%) |
| 6 to 11 Years | 17 (17.7%) | 164 (96.5%) |
| 12 to 14 Years | 0 (0.0%) | 204 (95.8%) |
| 15 Years | 0 (0.0%) | 0 (0.0%) |
| 16 and 17 Years | 0 (0.0%) | 40 (72.7%) |
| 18 to 24 Years | 12 (6.6%) | 32 (20.4%) |
| 25 to 34 Years | 172 (74.8%) | 142 (33.6%) |
| 35 to 44 Years | 61 (18.9%) | 8 (13.6%) |
| 45 to 54 Years | 83 (52.9%) | 45 (14.9%) |
| 55 to 64 Years | 49 (31.8%) | 55 (27.1%) |
| 65 to 74 Years | 15 (7.8%) | 2 (1.3%) |
| 75 Years and over | 6 (14.6%) | 7 (14.3%) |
| Total | 467 (29.5%) | 818 (40.2%) |
Income Above Poverty by Sex and Age in Andrews
According to the poverty statistics in Andrews, males aged 12 to 14 years and females aged 15 years are the age groups that are most secure financially, with 100.0% of males and 100.0% of females in these age groups living above the poverty line.
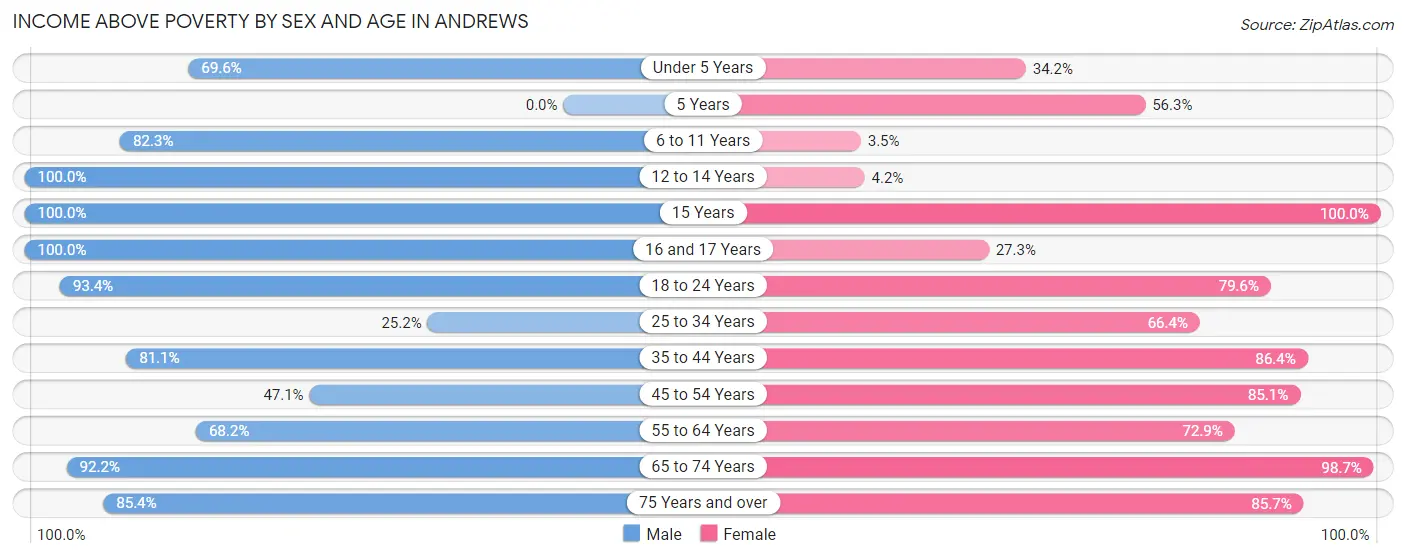
| Age Bracket | Male | Female |
| Under 5 Years | 103 (69.6%) | 42 (34.2%) |
| 5 Years | 0 (0.0%) | 49 (56.3%) |
| 6 to 11 Years | 79 (82.3%) | 6 (3.5%) |
| 12 to 14 Years | 20 (100.0%) | 9 (4.2%) |
| 15 Years | 18 (100.0%) | 38 (100.0%) |
| 16 and 17 Years | 14 (100.0%) | 15 (27.3%) |
| 18 to 24 Years | 171 (93.4%) | 125 (79.6%) |
| 25 to 34 Years | 58 (25.2%) | 281 (66.4%) |
| 35 to 44 Years | 262 (81.1%) | 51 (86.4%) |
| 45 to 54 Years | 74 (47.1%) | 256 (85.1%) |
| 55 to 64 Years | 105 (68.2%) | 148 (72.9%) |
| 65 to 74 Years | 177 (92.2%) | 154 (98.7%) |
| 75 Years and over | 35 (85.4%) | 42 (85.7%) |
| Total | 1,116 (70.5%) | 1,216 (59.8%) |
Income Below Poverty Among Married-Couple Families in Andrews
The poverty statistics for married-couple families in Andrews show that 1.6% or 8 of the total 501 families live below the poverty line. Families with 1 or 2 children have the highest poverty rate of 13.3%, comprising of 8 families. On the other hand, families with no children have the lowest poverty rate of 0.0%, which includes 0 families.
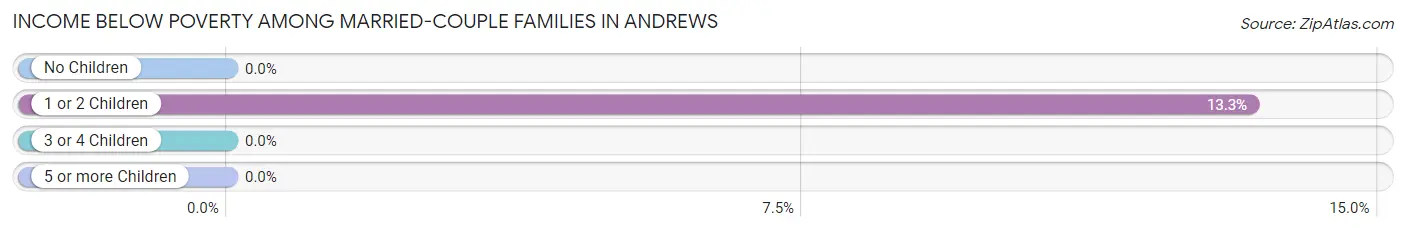
| Children | Above Poverty | Below Poverty |
| No Children | 432 (100.0%) | 0 (0.0%) |
| 1 or 2 Children | 52 (86.7%) | 8 (13.3%) |
| 3 or 4 Children | 9 (100.0%) | 0 (0.0%) |
| 5 or more Children | 0 (0.0%) | 0 (0.0%) |
| Total | 493 (98.4%) | 8 (1.6%) |
Income Below Poverty Among Single-Parent Households in Andrews
According to the poverty data in Andrews, 73.6% or 159 single-father households and 60.5% or 196 single-mother households are living below the poverty line. Among single-father households, those with 3 or 4 children have the highest poverty rate, with 159 households (100.0%) experiencing poverty. Likewise, among single-mother households, those with 1 or 2 children have the highest poverty rate, with 111 households (64.5%) falling below the poverty line.
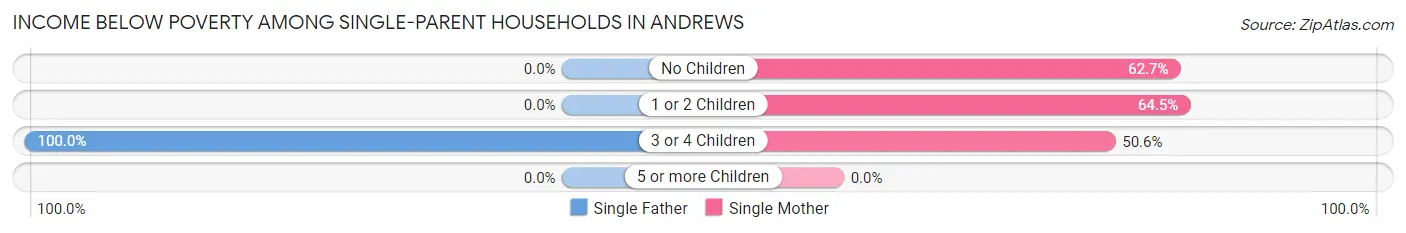
| Children | Single Father | Single Mother |
| No Children | 0 (0.0%) | 42 (62.7%) |
| 1 or 2 Children | 0 (0.0%) | 111 (64.5%) |
| 3 or 4 Children | 159 (100.0%) | 43 (50.6%) |
| 5 or more Children | 0 (0.0%) | 0 (0.0%) |
| Total | 159 (73.6%) | 196 (60.5%) |
Income Below Poverty Among Married-Couple vs Single-Parent Households in Andrews
The poverty data for Andrews shows that 8 of the married-couple family households (1.6%) and 355 of the single-parent households (65.7%) are living below the poverty level. Within the married-couple family households, those with 1 or 2 children have the highest poverty rate, with 8 households (13.3%) falling below the poverty line. Among the single-parent households, those with 3 or 4 children have the highest poverty rate, with 202 household (82.8%) living below poverty.
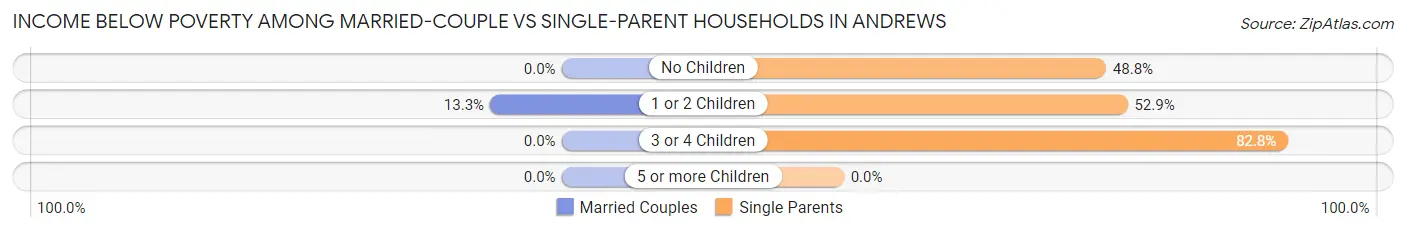
| Children | Married-Couple Families | Single-Parent Households |
| No Children | 0 (0.0%) | 42 (48.8%) |
| 1 or 2 Children | 8 (13.3%) | 111 (52.9%) |
| 3 or 4 Children | 0 (0.0%) | 202 (82.8%) |
| 5 or more Children | 0 (0.0%) | 0 (0.0%) |
| Total | 8 (1.6%) | 355 (65.7%) |
Race in Andrews
The most populous races in Andrews are Black / African American (2,199 | 60.8%), White / Caucasian (1,365 | 37.7%), and Two or more Races (44 | 1.2%).
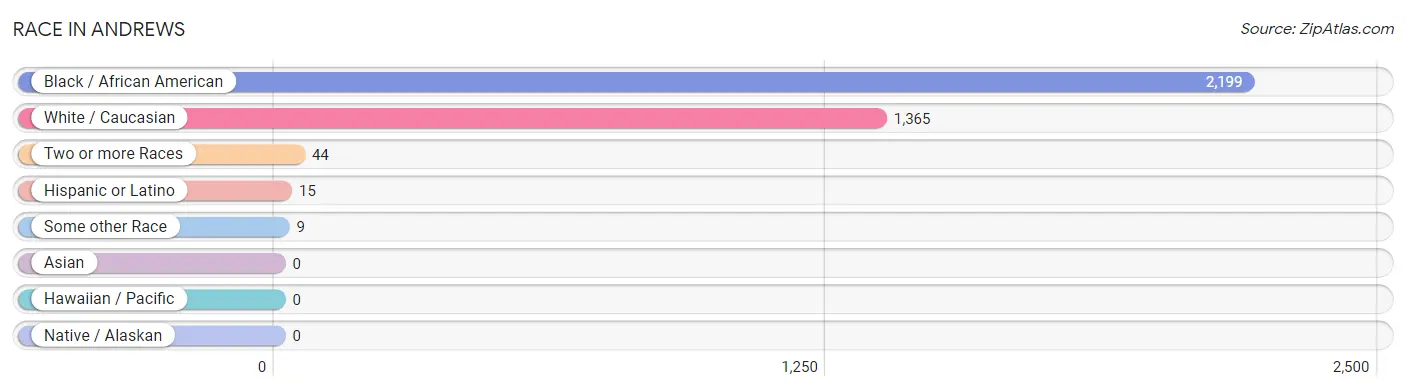
| Race | # Population | % Population |
| Asian | 0 | 0.0% |
| Black / African American | 2,199 | 60.8% |
| Hawaiian / Pacific | 0 | 0.0% |
| Hispanic or Latino | 15 | 0.4% |
| Native / Alaskan | 0 | 0.0% |
| White / Caucasian | 1,365 | 37.7% |
| Two or more Races | 44 | 1.2% |
| Some other Race | 9 | 0.3% |
| Total | 3,617 | 100.0% |
Ancestry in Andrews
The most populous ancestries reported in Andrews are American (258 | 7.1%), Irish (219 | 6.0%), French (147 | 4.1%), English (115 | 3.2%), and Scottish (107 | 3.0%), together accounting for 23.4% of all Andrews residents.
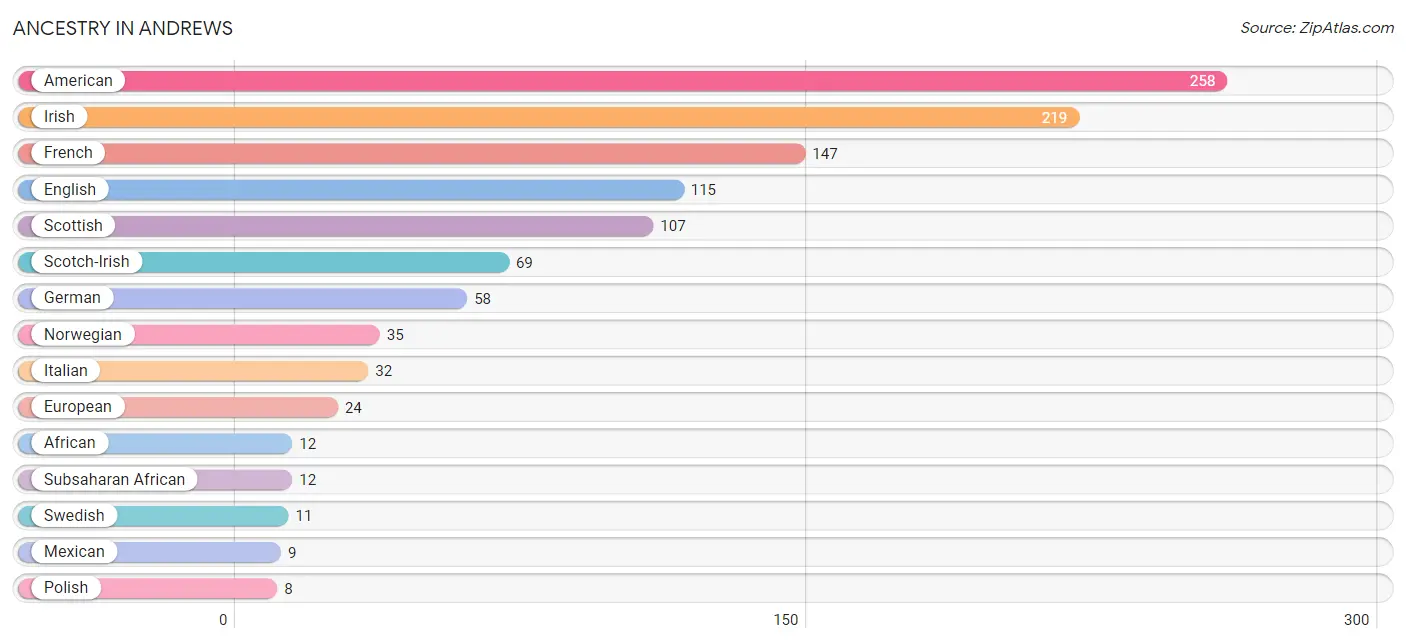
| Ancestry | # Population | % Population |
| African | 12 | 0.3% |
| American | 258 | 7.1% |
| Cherokee | 2 | 0.1% |
| Dominican | 6 | 0.2% |
| Dutch | 4 | 0.1% |
| English | 115 | 3.2% |
| European | 24 | 0.7% |
| French | 147 | 4.1% |
| German | 58 | 1.6% |
| Irish | 219 | 6.0% |
| Italian | 32 | 0.9% |
| Mexican | 9 | 0.3% |
| Norwegian | 35 | 1.0% |
| Polish | 8 | 0.2% |
| Scotch-Irish | 69 | 1.9% |
| Scottish | 107 | 3.0% |
| Subsaharan African | 12 | 0.3% |
| Swedish | 11 | 0.3% | View All 18 Rows |
Immigrants in Andrews
The most numerous immigrant groups reported in Andrews came from Central America (9 | 0.3%), Latin America (9 | 0.3%), Mexico (9 | 0.3%), England (5 | 0.1%), and Europe (5 | 0.1%), together accounting for 1.0% of all Andrews residents.
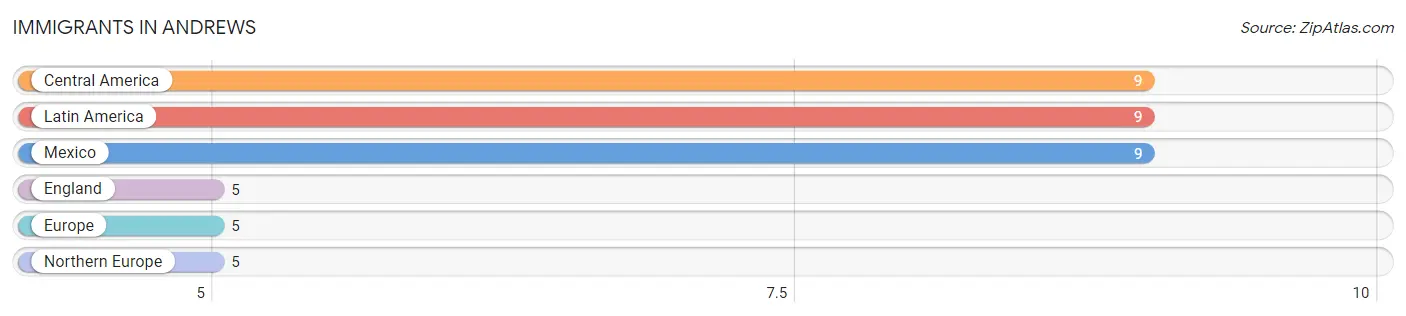
| Immigration Origin | # Population | % Population |
| Central America | 9 | 0.3% |
| England | 5 | 0.1% |
| Europe | 5 | 0.1% |
| Latin America | 9 | 0.3% |
| Mexico | 9 | 0.3% |
| Northern Europe | 5 | 0.1% | View All 6 Rows |
Sex and Age in Andrews
Sex and Age in Andrews
The most populous age groups in Andrews are 40 to 44 Years (272 | 17.2%) for men and 5 to 9 Years (257 | 12.6%) for women.
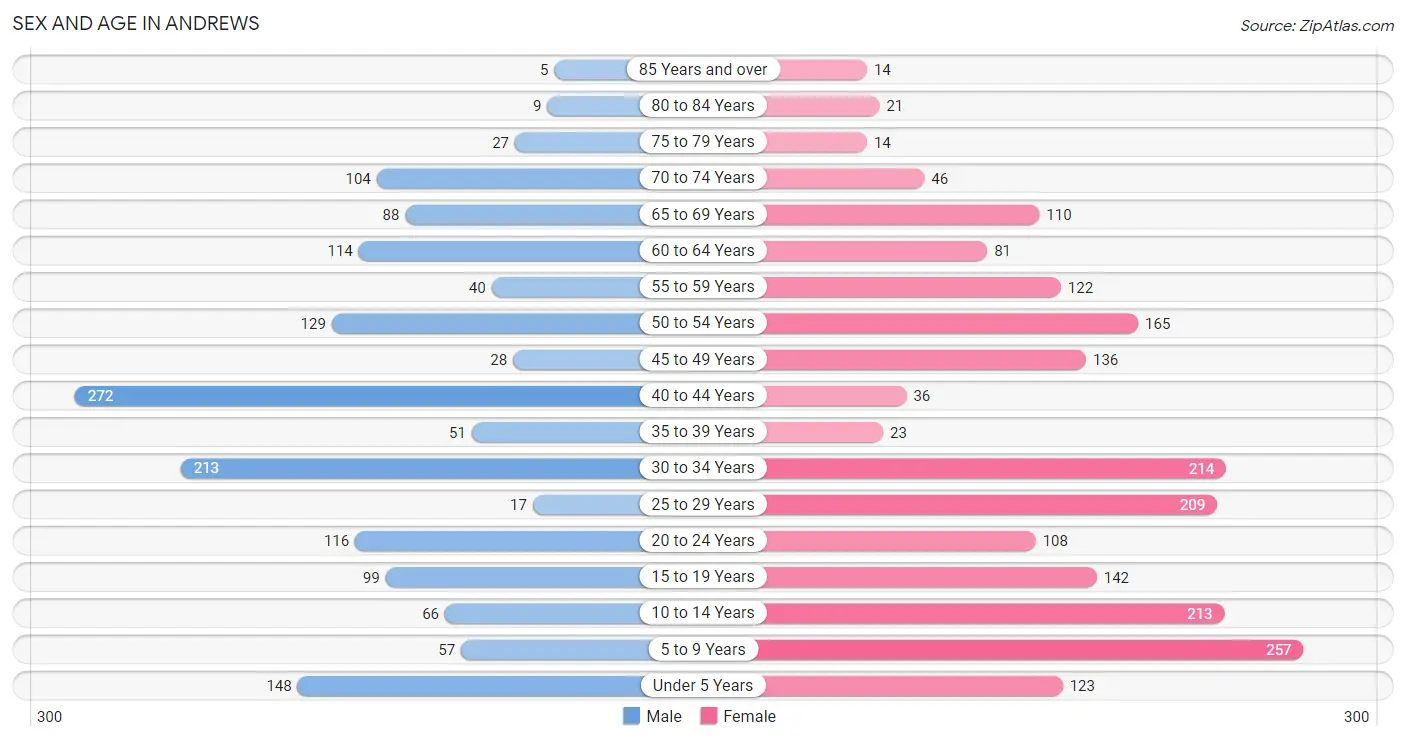
| Age Bracket | Male | Female |
| Under 5 Years | 148 (9.3%) | 123 (6.0%) |
| 5 to 9 Years | 57 (3.6%) | 257 (12.6%) |
| 10 to 14 Years | 66 (4.2%) | 213 (10.5%) |
| 15 to 19 Years | 99 (6.2%) | 142 (7.0%) |
| 20 to 24 Years | 116 (7.3%) | 108 (5.3%) |
| 25 to 29 Years | 17 (1.1%) | 209 (10.3%) |
| 30 to 34 Years | 213 (13.5%) | 214 (10.5%) |
| 35 to 39 Years | 51 (3.2%) | 23 (1.1%) |
| 40 to 44 Years | 272 (17.2%) | 36 (1.8%) |
| 45 to 49 Years | 28 (1.8%) | 136 (6.7%) |
| 50 to 54 Years | 129 (8.2%) | 165 (8.1%) |
| 55 to 59 Years | 40 (2.5%) | 122 (6.0%) |
| 60 to 64 Years | 114 (7.2%) | 81 (4.0%) |
| 65 to 69 Years | 88 (5.6%) | 110 (5.4%) |
| 70 to 74 Years | 104 (6.6%) | 46 (2.3%) |
| 75 to 79 Years | 27 (1.7%) | 14 (0.7%) |
| 80 to 84 Years | 9 (0.6%) | 21 (1.0%) |
| 85 Years and over | 5 (0.3%) | 14 (0.7%) |
| Total | 1,583 (100.0%) | 2,034 (100.0%) |
Families and Households in Andrews
Median Family Size in Andrews
The median family size in Andrews is 3.09 persons per family, with single female/mother families (324 | 31.1%) accounting for the largest median family size of 3.83 persons per family. On the other hand, married-couple families (501 | 48.1%) represent the smallest median family size with 2.67 persons per family.
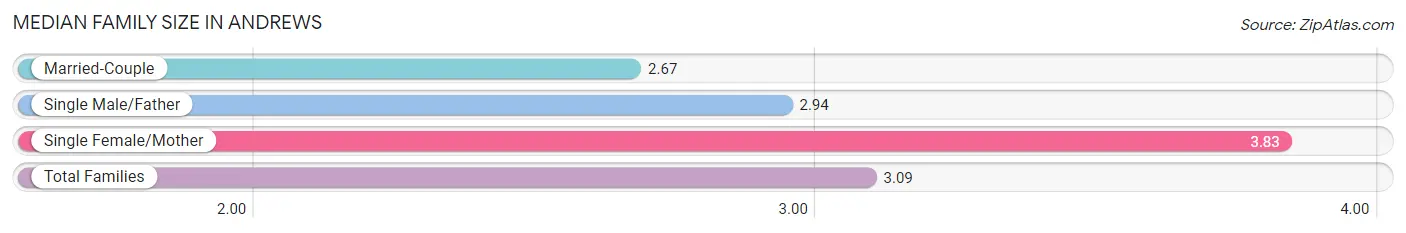
| Family Type | # Families | Family Size |
| Married-Couple | 501 (48.1%) | 2.67 |
| Single Male/Father | 216 (20.7%) | 2.94 |
| Single Female/Mother | 324 (31.1%) | 3.83 |
| Total Families | 1,041 (100.0%) | 3.09 |
Median Household Size in Andrews
The median household size in Andrews is 2.84 persons per household, with single female/mother households (324 | 25.5%) accounting for the largest median household size of 3.98 persons per household. non-family households (232 | 18.2%) represent the smallest median household size with 1.02 persons per household.
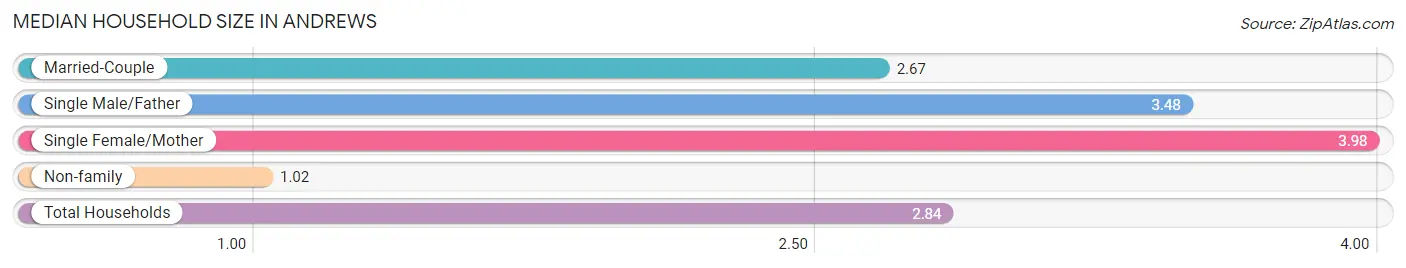
| Household Type | # Households | Household Size |
| Married-Couple | 501 (39.4%) | 2.67 |
| Single Male/Father | 216 (17.0%) | 3.48 |
| Single Female/Mother | 324 (25.5%) | 3.98 |
| Non-family | 232 (18.2%) | 1.02 |
| Total Households | 1,273 (100.0%) | 2.84 |
Household Size by Marriage Status in Andrews
Out of a total of 1,273 households in Andrews, 1,041 (81.8%) are family households, while 232 (18.2%) are nonfamily households. The most numerous type of family households are 4-person households, comprising 312, and the most common type of nonfamily households are 1-person households, comprising 226.
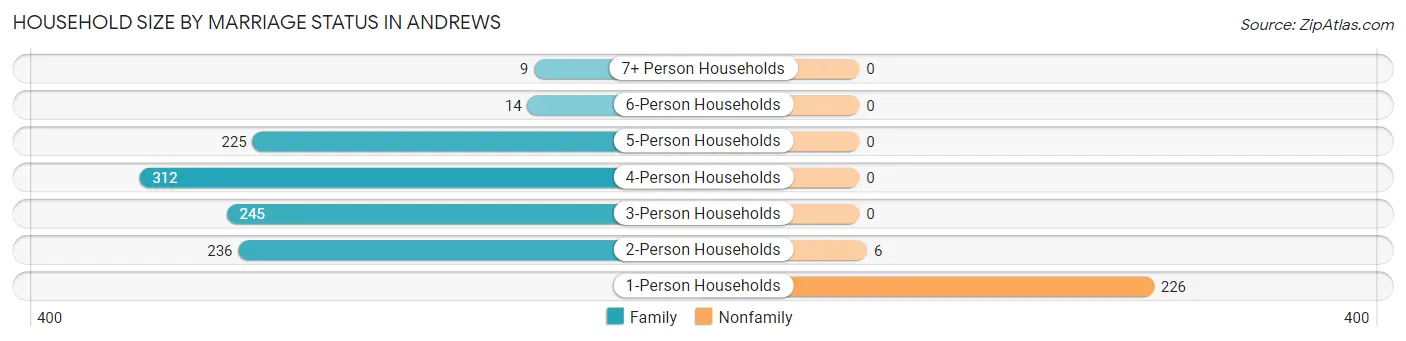
| Household Size | Family Households | Nonfamily Households |
| 1-Person Households | - | 226 (17.7%) |
| 2-Person Households | 236 (18.5%) | 6 (0.5%) |
| 3-Person Households | 245 (19.3%) | 0 (0.0%) |
| 4-Person Households | 312 (24.5%) | 0 (0.0%) |
| 5-Person Households | 225 (17.7%) | 0 (0.0%) |
| 6-Person Households | 14 (1.1%) | 0 (0.0%) |
| 7+ Person Households | 9 (0.7%) | 0 (0.0%) |
| Total | 1,041 (81.8%) | 232 (18.2%) |
Female Fertility in Andrews
Fertility by Age in Andrews
Average fertility rate in Andrews is 146.0 births per 1,000 women. Women in the age bracket of 20 to 34 years have the highest fertility rate with 254.0 births per 1,000 women. Women in the age bracket of 20 to 34 years acount for 100.0% of all women with births.
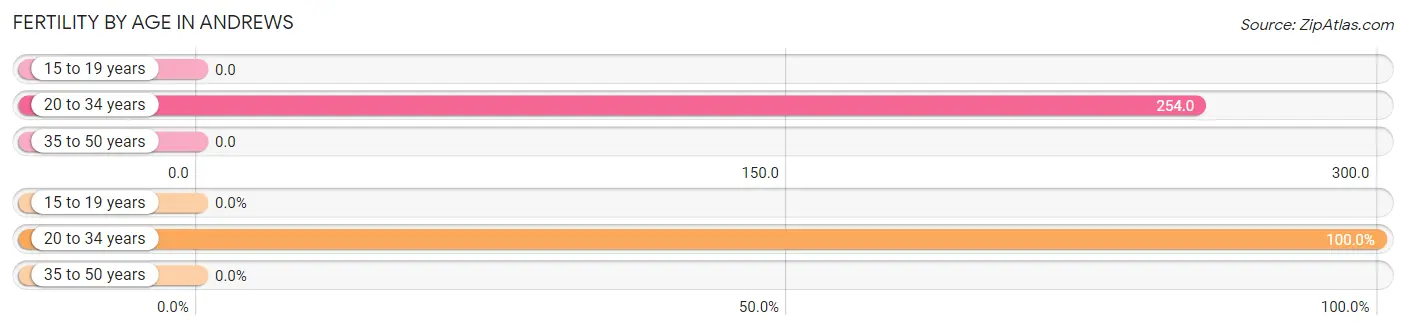
| Age Bracket | Women with Births | Births / 1,000 Women |
| 15 to 19 years | 0 (0.0%) | 0.0 |
| 20 to 34 years | 135 (100.0%) | 254.0 |
| 35 to 50 years | 0 (0.0%) | 0.0 |
| Total | 135 (100.0%) | 146.0 |
Fertility by Age by Marriage Status in Andrews
16.3% of women with births (135) in Andrews are married. The highest percentage of unmarried women with births falls into 20 to 34 years age bracket with 83.7% of them unmarried at the time of birth, while the lowest percentage of unmarried women with births belong to 20 to 34 years age bracket with 83.7% of them unmarried.
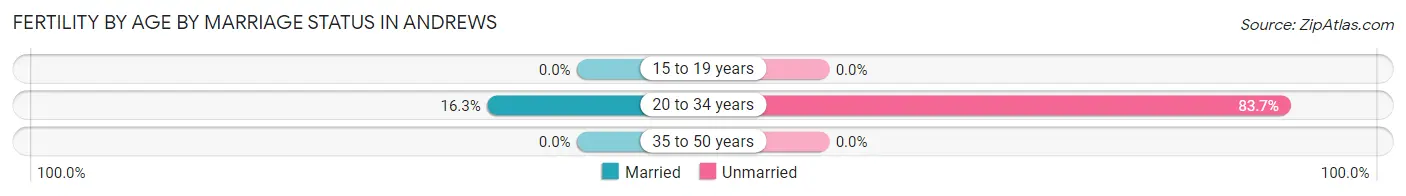
| Age Bracket | Married | Unmarried |
| 15 to 19 years | 0 (0.0%) | 0 (0.0%) |
| 20 to 34 years | 22 (16.3%) | 113 (83.7%) |
| 35 to 50 years | 0 (0.0%) | 0 (0.0%) |
| Total | 22 (16.3%) | 113 (83.7%) |
Fertility by Education in Andrews
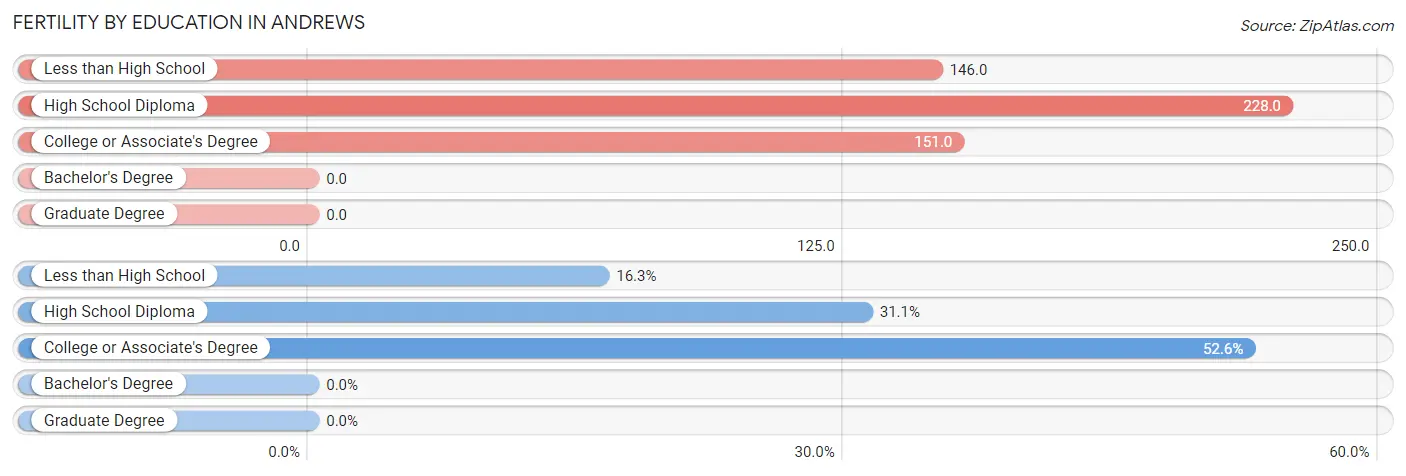
| Educational Attainment | Women with Births | Births / 1,000 Women |
| Less than High School | 22 (16.3%) | 146.0 |
| High School Diploma | 42 (31.1%) | 228.0 |
| College or Associate's Degree | 71 (52.6%) | 151.0 |
| Bachelor's Degree | 0 (0.0%) | 0.0 |
| Graduate Degree | 0 (0.0%) | 0.0 |
| Total | 135 (100.0%) | 146.0 |
Fertility by Education by Marriage Status in Andrews
83.7% of women with births in Andrews are unmarried. Women with the educational attainment of less than high school are most likely to be married with 100.0% of them married at childbirth, while women with the educational attainment of high school diploma are least likely to be married with 100.0% of them unmarried at childbirth.
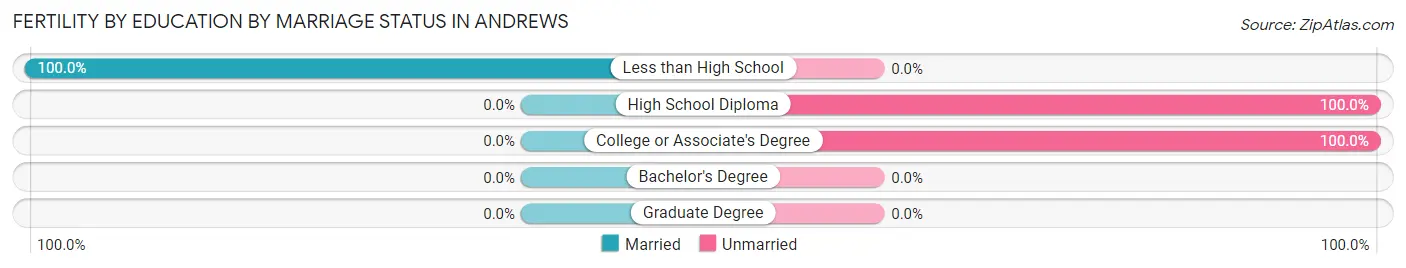
| Educational Attainment | Married | Unmarried |
| Less than High School | 22 (100.0%) | 0 (0.0%) |
| High School Diploma | 0 (0.0%) | 42 (100.0%) |
| College or Associate's Degree | 0 (0.0%) | 71 (100.0%) |
| Bachelor's Degree | 0 (0.0%) | 0 (0.0%) |
| Graduate Degree | 0 (0.0%) | 0 (0.0%) |
| Total | 22 (16.3%) | 113 (83.7%) |
Employment Characteristics in Andrews
Employment by Class of Employer in Andrews
Among the 1,601 employed individuals in Andrews, private company employees (1,089 | 68.0%), self-employed (not incorporated) (293 | 18.3%), and state government employees (98 | 6.1%) make up the most common classes of employment.
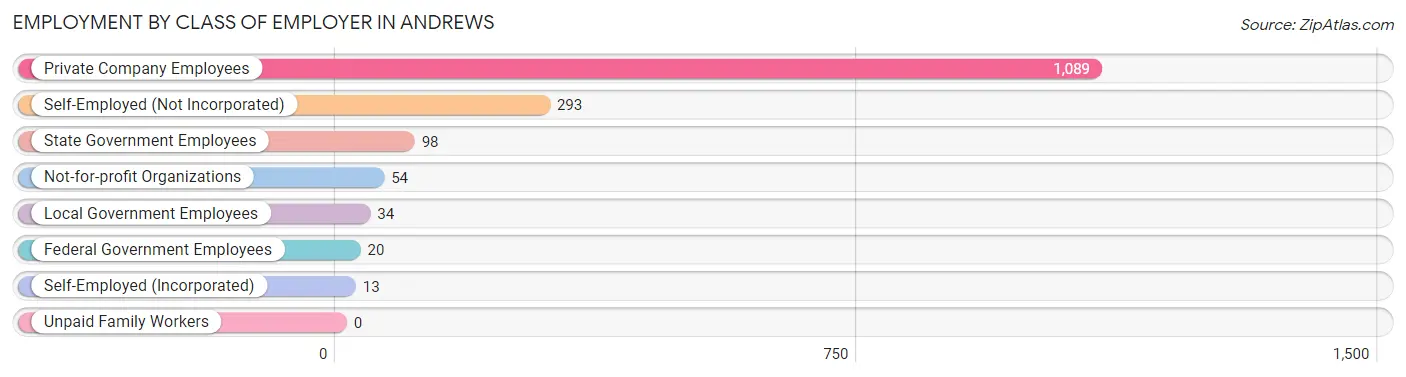
| Employer Class | # Employees | % Employees |
| Private Company Employees | 1,089 | 68.0% |
| Self-Employed (Incorporated) | 13 | 0.8% |
| Self-Employed (Not Incorporated) | 293 | 18.3% |
| Not-for-profit Organizations | 54 | 3.4% |
| Local Government Employees | 34 | 2.1% |
| State Government Employees | 98 | 6.1% |
| Federal Government Employees | 20 | 1.3% |
| Unpaid Family Workers | 0 | 0.0% |
| Total | 1,601 | 100.0% |
Employment Status by Age in Andrews
According to the labor force statistics for Andrews, out of the total population over 16 years of age (2,697), 64.5% or 1,740 individuals are in the labor force, with 0.6% or 10 of them unemployed. The age group with the highest labor force participation rate is 30 to 34 years, with 90.9% or 388 individuals in the labor force. Within the labor force, the 35 to 44 years age range has the highest percentage of unemployed individuals, with 3.0% or 10 of them being unemployed.
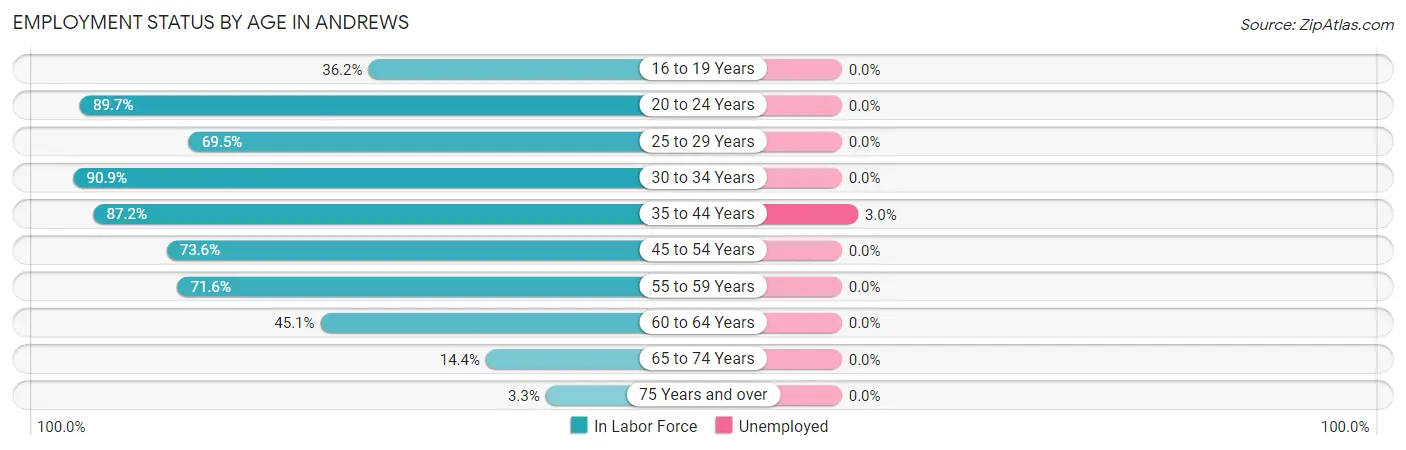
| Age Bracket | In Labor Force | Unemployed |
| 16 to 19 Years | 67 (36.2%) | 0 (0.0%) |
| 20 to 24 Years | 201 (89.7%) | 0 (0.0%) |
| 25 to 29 Years | 157 (69.5%) | 0 (0.0%) |
| 30 to 34 Years | 388 (90.9%) | 0 (0.0%) |
| 35 to 44 Years | 333 (87.2%) | 10 (3.0%) |
| 45 to 54 Years | 337 (73.6%) | 0 (0.0%) |
| 55 to 59 Years | 116 (71.6%) | 0 (0.0%) |
| 60 to 64 Years | 88 (45.1%) | 0 (0.0%) |
| 65 to 74 Years | 50 (14.4%) | 0 (0.0%) |
| 75 Years and over | 3 (3.3%) | 0 (0.0%) |
| Total | 1,740 (64.5%) | 10 (0.6%) |
Employment Status by Educational Attainment in Andrews
According to labor force statistics for Andrews, 76.7% of individuals (1,419) out of the total population between 25 and 64 years of age (1,850) are in the labor force, with 0.7% or 10 of them being unemployed. The group with the highest labor force participation rate are those with the educational attainment of bachelor's degree or higher, with 94.7% or 144 individuals in the labor force. Within the labor force, individuals with high school diploma education have the highest percentage of unemployment, with 2.9% or 10 of them being unemployed.
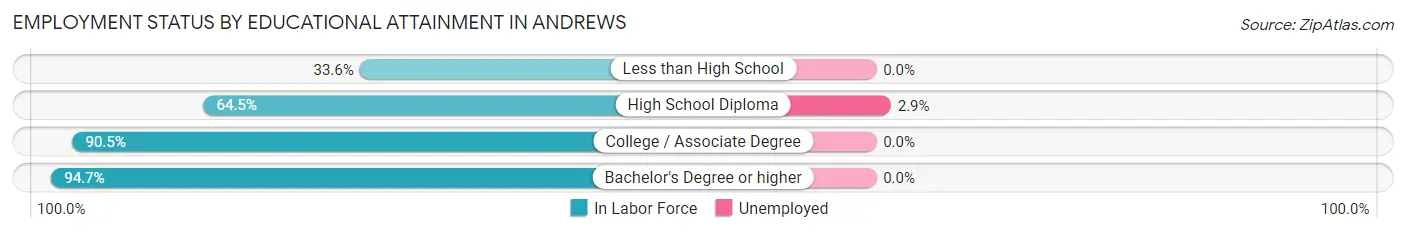
| Educational Attainment | In Labor Force | Unemployed |
| Less than High School | 72 (33.6%) | 0 (0.0%) |
| High School Diploma | 347 (64.5%) | 16 (2.9%) |
| College / Associate Degree | 856 (90.5%) | 0 (0.0%) |
| Bachelor's Degree or higher | 144 (94.7%) | 0 (0.0%) |
| Total | 1,419 (76.7%) | 13 (0.7%) |
Employment Occupations by Sex in Andrews
Management, Business, Science and Arts Occupations
The most common Management, Business, Science and Arts occupations in Andrews are Management (105 | 6.1%), Community & Social Service (83 | 4.8%), Education, Arts & Media (58 | 3.4%), Health Diagnosing & Treating (49 | 2.9%), and Business & Financial (26 | 1.5%).
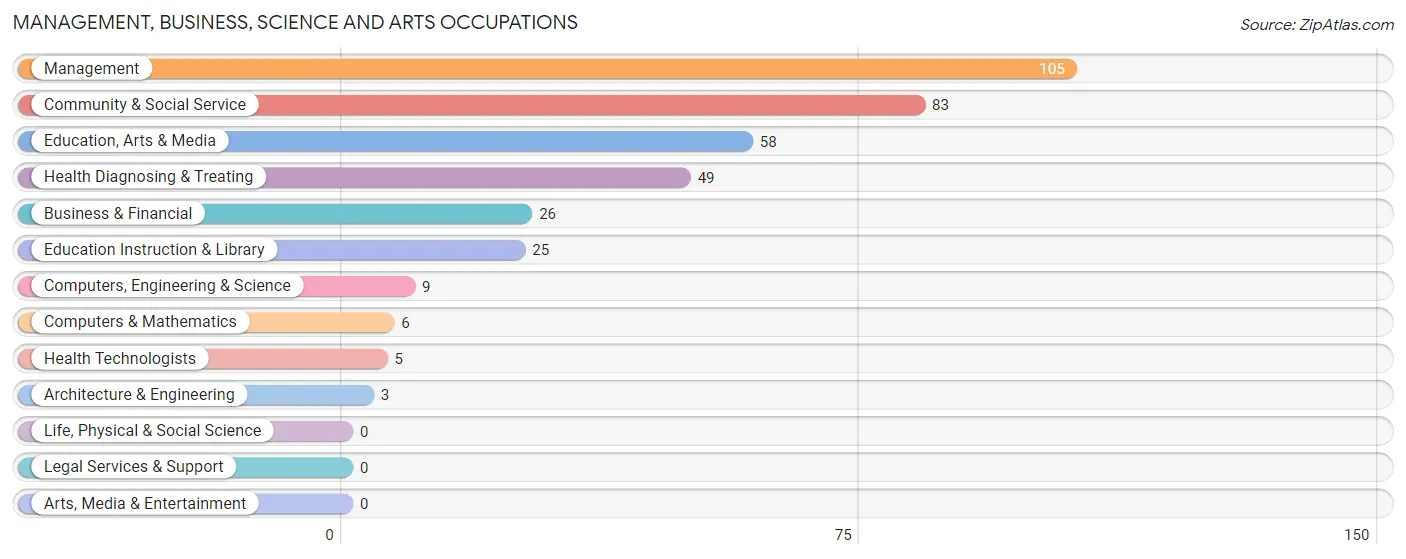
Management, Business, Science and Arts Occupations by Sex
Within the Management, Business, Science and Arts occupations in Andrews, the most male-oriented occupations are Architecture & Engineering (100.0%), Computers, Engineering & Science (33.3%), and Management (21.9%), while the most female-oriented occupations are Computers & Mathematics (100.0%), Education, Arts & Media (100.0%), and Health Diagnosing & Treating (100.0%).
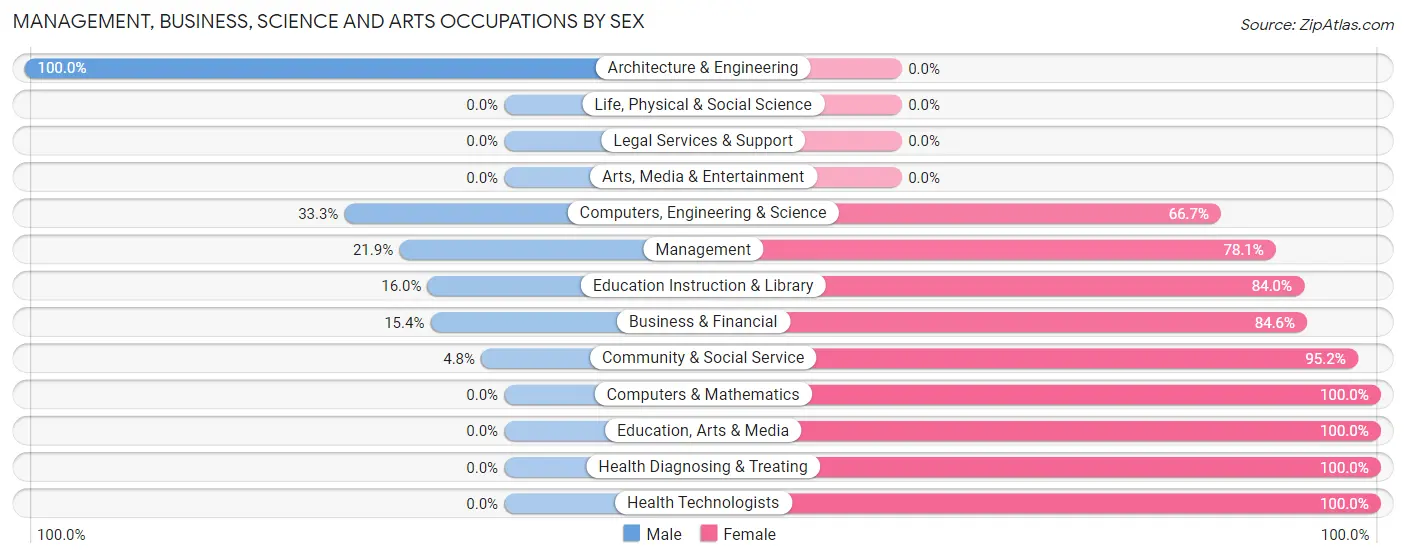
| Occupation | Male | Female |
| Management | 23 (21.9%) | 82 (78.1%) |
| Business & Financial | 4 (15.4%) | 22 (84.6%) |
| Computers, Engineering & Science | 3 (33.3%) | 6 (66.7%) |
| Computers & Mathematics | 0 (0.0%) | 6 (100.0%) |
| Architecture & Engineering | 3 (100.0%) | 0 (0.0%) |
| Life, Physical & Social Science | 0 (0.0%) | 0 (0.0%) |
| Community & Social Service | 4 (4.8%) | 79 (95.2%) |
| Education, Arts & Media | 0 (0.0%) | 58 (100.0%) |
| Legal Services & Support | 0 (0.0%) | 0 (0.0%) |
| Education Instruction & Library | 4 (16.0%) | 21 (84.0%) |
| Arts, Media & Entertainment | 0 (0.0%) | 0 (0.0%) |
| Health Diagnosing & Treating | 0 (0.0%) | 49 (100.0%) |
| Health Technologists | 0 (0.0%) | 5 (100.0%) |
| Total (Category) | 34 (12.5%) | 238 (87.5%) |
| Total (Overall) | 831 (48.3%) | 889 (51.7%) |
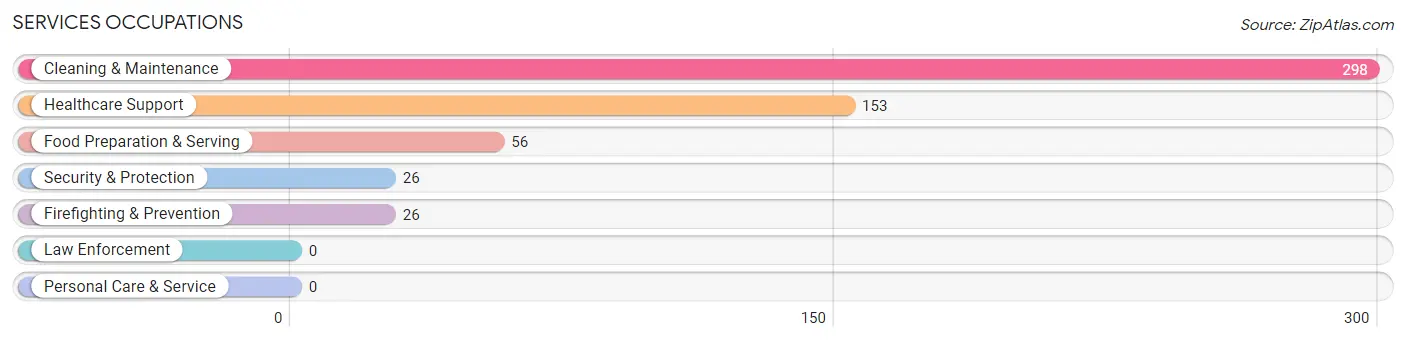
Services Occupations
The most common Services occupations in Andrews are Cleaning & Maintenance (298 | 17.3%), Healthcare Support (153 | 8.9%), Food Preparation & Serving (56 | 3.3%), Security & Protection (26 | 1.5%), and Firefighting & Prevention (26 | 1.5%).
Services Occupations by Sex
Within the Services occupations in Andrews, the most male-oriented occupations are Cleaning & Maintenance (78.2%), and Food Preparation & Serving (64.3%), while the most female-oriented occupations are Healthcare Support (100.0%), Security & Protection (100.0%), and Firefighting & Prevention (100.0%).
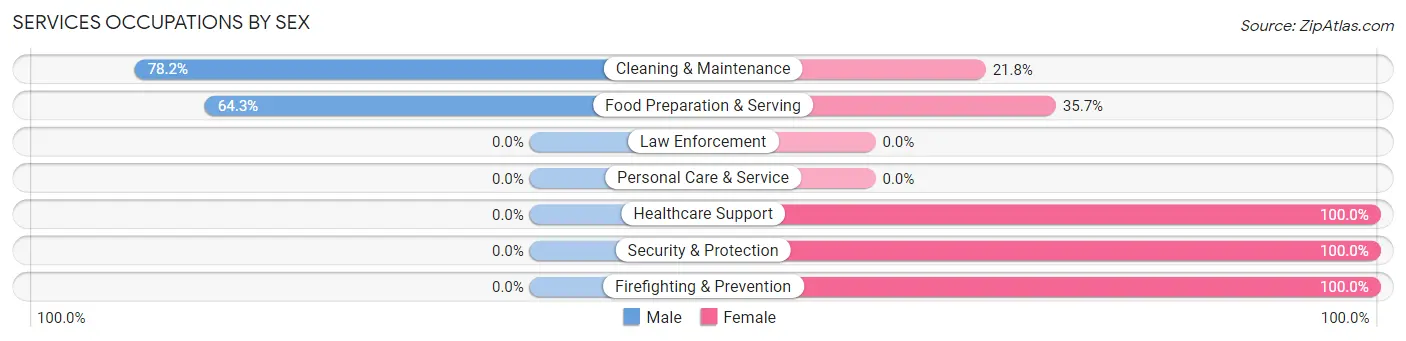
| Occupation | Male | Female |
| Healthcare Support | 0 (0.0%) | 153 (100.0%) |
| Security & Protection | 0 (0.0%) | 26 (100.0%) |
| Firefighting & Prevention | 0 (0.0%) | 26 (100.0%) |
| Law Enforcement | 0 (0.0%) | 0 (0.0%) |
| Food Preparation & Serving | 36 (64.3%) | 20 (35.7%) |
| Cleaning & Maintenance | 233 (78.2%) | 65 (21.8%) |
| Personal Care & Service | 0 (0.0%) | 0 (0.0%) |
| Total (Category) | 269 (50.5%) | 264 (49.5%) |
| Total (Overall) | 831 (48.3%) | 889 (51.7%) |
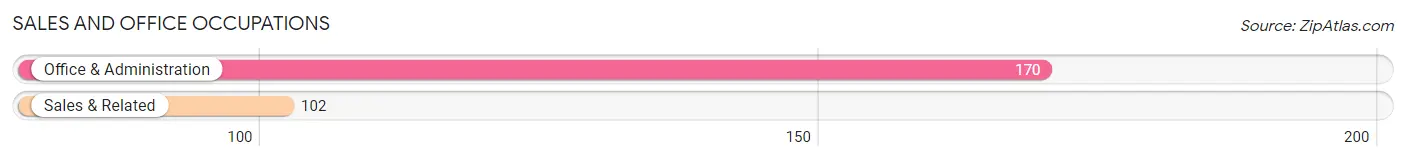
Sales and Office Occupations
The most common Sales and Office occupations in Andrews are Office & Administration (170 | 9.9%), and Sales & Related (102 | 5.9%).
Sales and Office Occupations by Sex
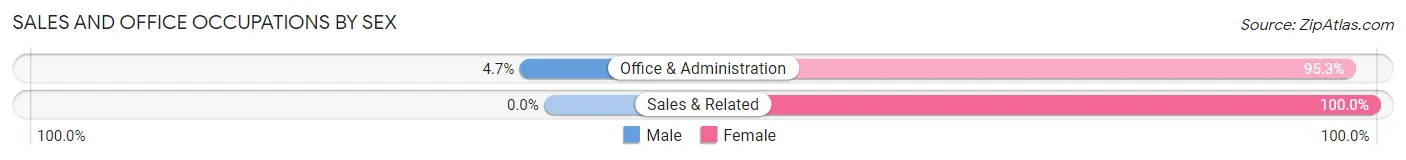
| Occupation | Male | Female |
| Sales & Related | 0 (0.0%) | 102 (100.0%) |
| Office & Administration | 8 (4.7%) | 162 (95.3%) |
| Total (Category) | 8 (2.9%) | 264 (97.1%) |
| Total (Overall) | 831 (48.3%) | 889 (51.7%) |
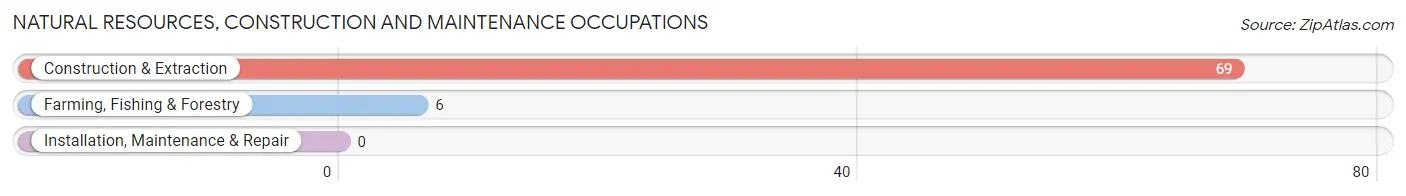
Natural Resources, Construction and Maintenance Occupations
The most common Natural Resources, Construction and Maintenance occupations in Andrews are Construction & Extraction (69 | 4.0%), and Farming, Fishing & Forestry (6 | 0.4%).
Natural Resources, Construction and Maintenance Occupations by Sex
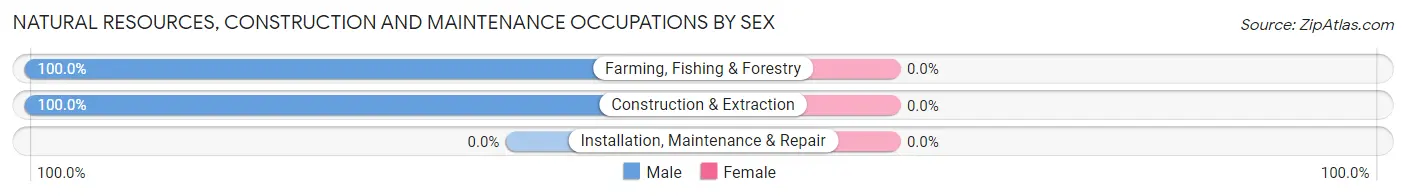
| Occupation | Male | Female |
| Farming, Fishing & Forestry | 6 (100.0%) | 0 (0.0%) |
| Construction & Extraction | 69 (100.0%) | 0 (0.0%) |
| Installation, Maintenance & Repair | 0 (0.0%) | 0 (0.0%) |
| Total (Category) | 75 (100.0%) | 0 (0.0%) |
| Total (Overall) | 831 (48.3%) | 889 (51.7%) |
Production, Transportation and Moving Occupations
The most common Production, Transportation and Moving occupations in Andrews are Material Moving (348 | 20.2%), Transportation (128 | 7.4%), and Production (92 | 5.3%).
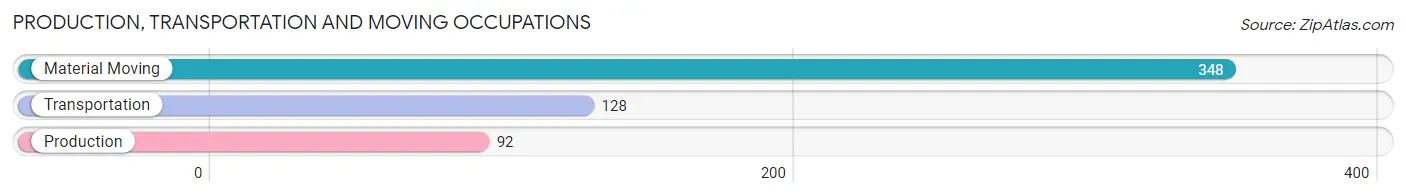
Production, Transportation and Moving Occupations by Sex
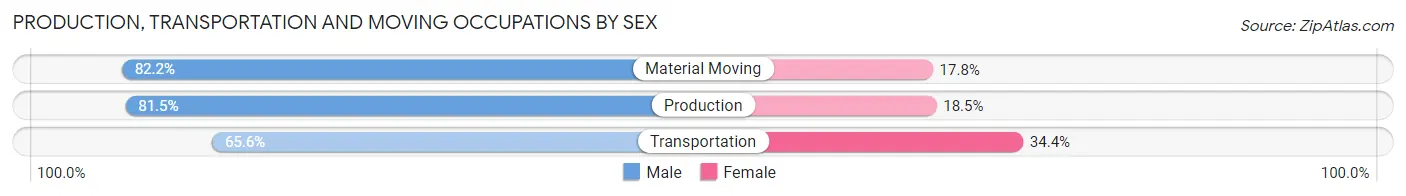
| Occupation | Male | Female |
| Production | 75 (81.5%) | 17 (18.5%) |
| Transportation | 84 (65.6%) | 44 (34.4%) |
| Material Moving | 286 (82.2%) | 62 (17.8%) |
| Total (Category) | 445 (78.3%) | 123 (21.6%) |
| Total (Overall) | 831 (48.3%) | 889 (51.7%) |
Employment Industries by Sex in Andrews
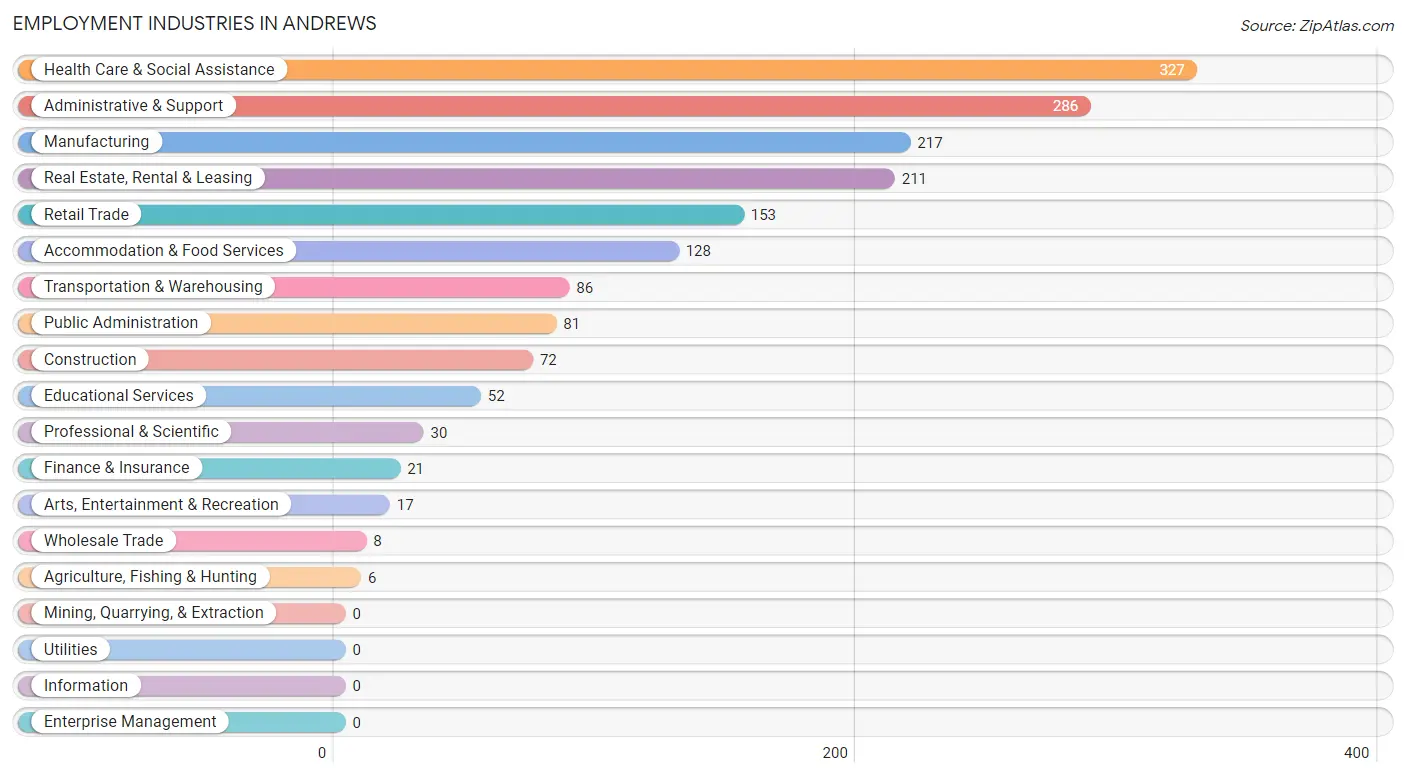
Employment Industries in Andrews
The major employment industries in Andrews include Health Care & Social Assistance (327 | 19.0%), Administrative & Support (286 | 16.6%), Manufacturing (217 | 12.6%), Real Estate, Rental & Leasing (211 | 12.3%), and Retail Trade (153 | 8.9%).
Employment Industries by Sex in Andrews
The Andrews industries that see more men than women are Agriculture, Fishing & Hunting (100.0%), Construction (100.0%), and Wholesale Trade (100.0%), whereas the industries that tend to have a higher number of women are Finance & Insurance (100.0%), Professional & Scientific (100.0%), and Health Care & Social Assistance (100.0%).
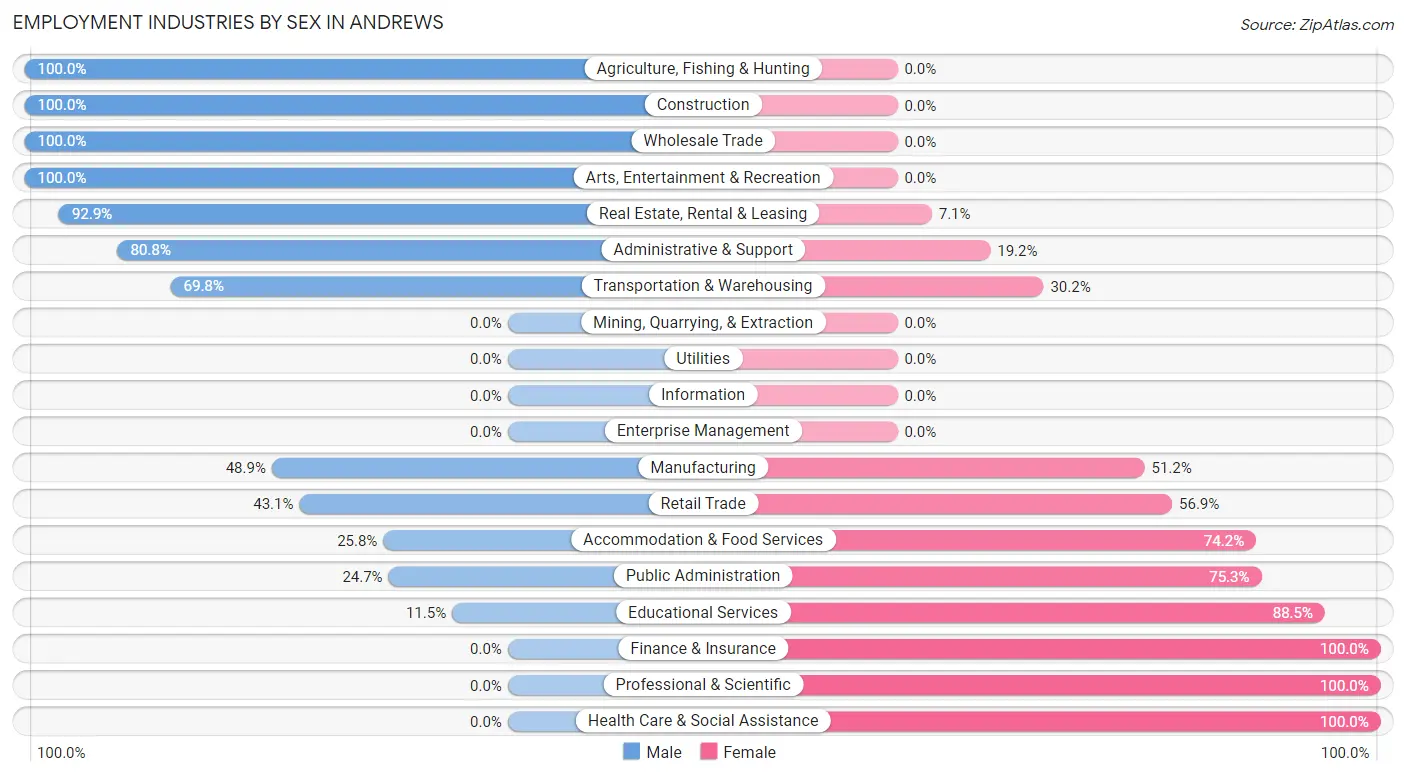
| Industry | Male | Female |
| Agriculture, Fishing & Hunting | 6 (100.0%) | 0 (0.0%) |
| Mining, Quarrying, & Extraction | 0 (0.0%) | 0 (0.0%) |
| Construction | 72 (100.0%) | 0 (0.0%) |
| Manufacturing | 106 (48.8%) | 111 (51.1%) |
| Wholesale Trade | 8 (100.0%) | 0 (0.0%) |
| Retail Trade | 66 (43.1%) | 87 (56.9%) |
| Transportation & Warehousing | 60 (69.8%) | 26 (30.2%) |
| Utilities | 0 (0.0%) | 0 (0.0%) |
| Information | 0 (0.0%) | 0 (0.0%) |
| Finance & Insurance | 0 (0.0%) | 21 (100.0%) |
| Real Estate, Rental & Leasing | 196 (92.9%) | 15 (7.1%) |
| Professional & Scientific | 0 (0.0%) | 30 (100.0%) |
| Enterprise Management | 0 (0.0%) | 0 (0.0%) |
| Administrative & Support | 231 (80.8%) | 55 (19.2%) |
| Educational Services | 6 (11.5%) | 46 (88.5%) |
| Health Care & Social Assistance | 0 (0.0%) | 327 (100.0%) |
| Arts, Entertainment & Recreation | 17 (100.0%) | 0 (0.0%) |
| Accommodation & Food Services | 33 (25.8%) | 95 (74.2%) |
| Public Administration | 20 (24.7%) | 61 (75.3%) |
| Total | 831 (48.3%) | 889 (51.7%) |
Education in Andrews
School Enrollment in Andrews
The most common levels of schooling among the 849 students in Andrews are middle school (302 | 35.6%), elementary school (193 | 22.7%), and high school (129 | 15.2%).
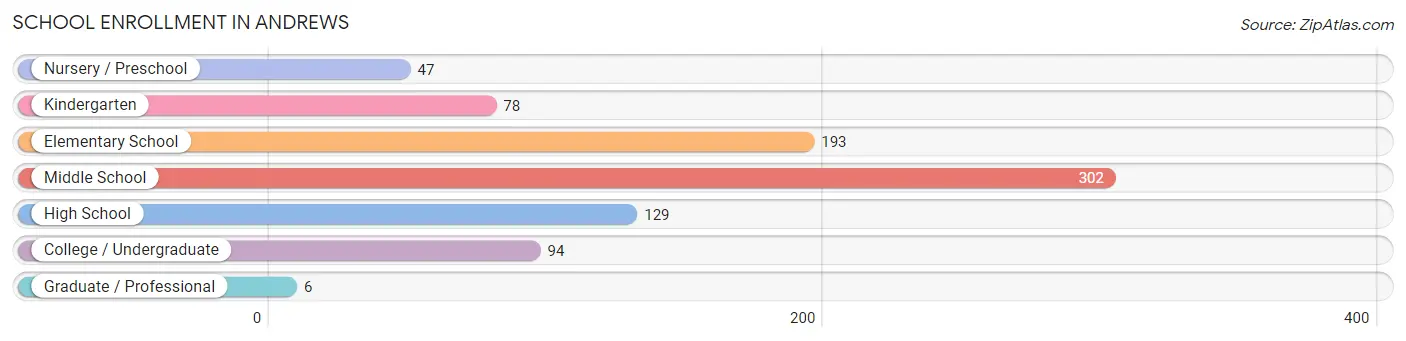
| School Level | # Students | % Students |
| Nursery / Preschool | 47 | 5.5% |
| Kindergarten | 78 | 9.2% |
| Elementary School | 193 | 22.7% |
| Middle School | 302 | 35.6% |
| High School | 129 | 15.2% |
| College / Undergraduate | 94 | 11.1% |
| Graduate / Professional | 6 | 0.7% |
| Total | 849 | 100.0% |
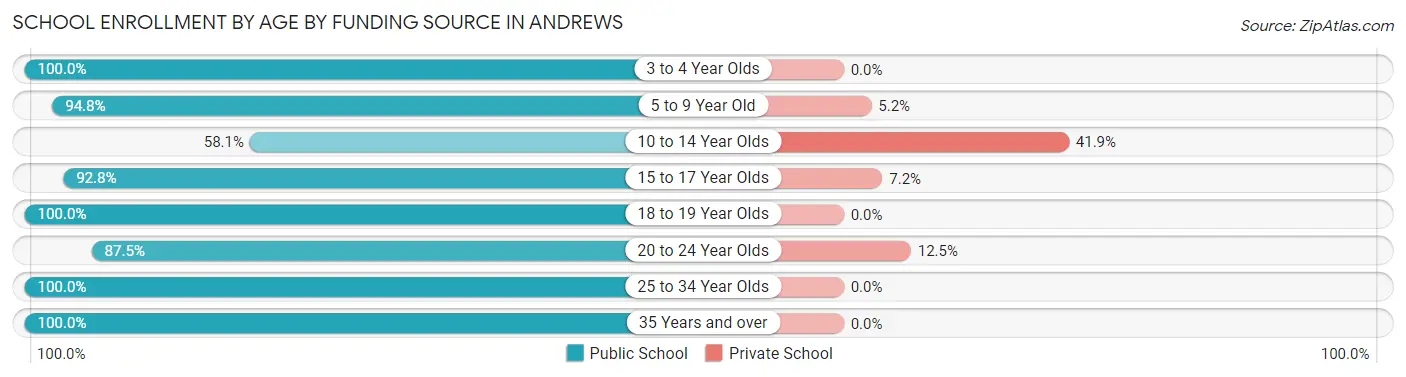
School Enrollment by Age by Funding Source in Andrews
Out of a total of 849 students who are enrolled in schools in Andrews, 145 (17.1%) attend a private institution, while the remaining 704 (82.9%) are enrolled in public schools. The age group of 10 to 14 year olds has the highest likelihood of being enrolled in private schools, with 117 (41.9% in the age bracket) enrolled. Conversely, the age group of 3 to 4 year olds has the lowest likelihood of being enrolled in a private school, with 47 (100.0% in the age bracket) attending a public institution.
| Age Bracket | Public School | Private School |
| 3 to 4 Year Olds | 47 (100.0%) | 0 (0.0%) |
| 5 to 9 Year Old | 239 (94.8%) | 13 (5.2%) |
| 10 to 14 Year Olds | 162 (58.1%) | 117 (41.9%) |
| 15 to 17 Year Olds | 116 (92.8%) | 9 (7.2%) |
| 18 to 19 Year Olds | 52 (100.0%) | 0 (0.0%) |
| 20 to 24 Year Olds | 42 (87.5%) | 6 (12.5%) |
| 25 to 34 Year Olds | 33 (100.0%) | 0 (0.0%) |
| 35 Years and over | 13 (100.0%) | 0 (0.0%) |
| Total | 704 (82.9%) | 145 (17.1%) |
Educational Attainment by Field of Study in Andrews
Education (128 | 55.9%), business (35 | 15.3%), social sciences (15 | 6.6%), physical & health sciences (13 | 5.7%), and arts & humanities (13 | 5.7%) are the most common fields of study among 229 individuals in Andrews who have obtained a bachelor's degree or higher.
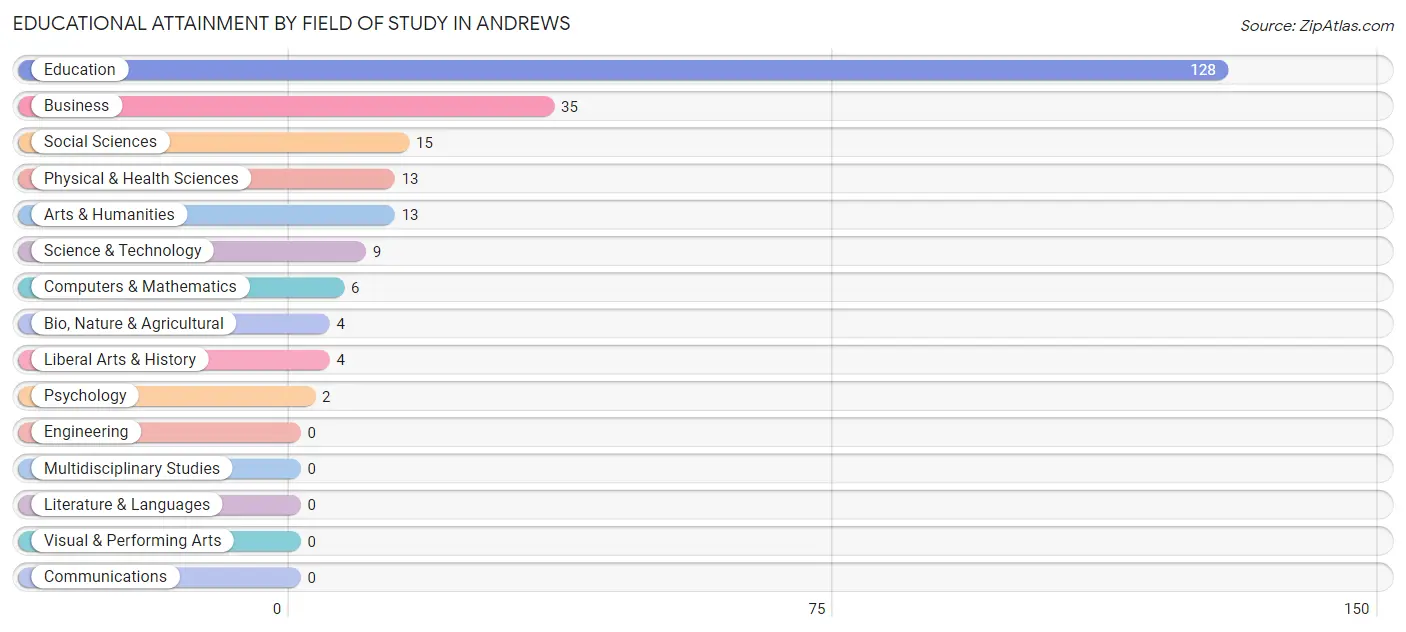
| Field of Study | # Graduates | % Graduates |
| Computers & Mathematics | 6 | 2.6% |
| Bio, Nature & Agricultural | 4 | 1.8% |
| Physical & Health Sciences | 13 | 5.7% |
| Psychology | 2 | 0.9% |
| Social Sciences | 15 | 6.6% |
| Engineering | 0 | 0.0% |
| Multidisciplinary Studies | 0 | 0.0% |
| Science & Technology | 9 | 3.9% |
| Business | 35 | 15.3% |
| Education | 128 | 55.9% |
| Literature & Languages | 0 | 0.0% |
| Liberal Arts & History | 4 | 1.8% |
| Visual & Performing Arts | 0 | 0.0% |
| Communications | 0 | 0.0% |
| Arts & Humanities | 13 | 5.7% |
| Total | 229 | 100.0% |
Transportation & Commute in Andrews
Vehicle Availability by Sex in Andrews
The most prevalent vehicle ownership categories in Andrews are males with 5 or more vehicles (304, accounting for 37.9%) and females with 5 or more vehicles (121, making up 38.1%).
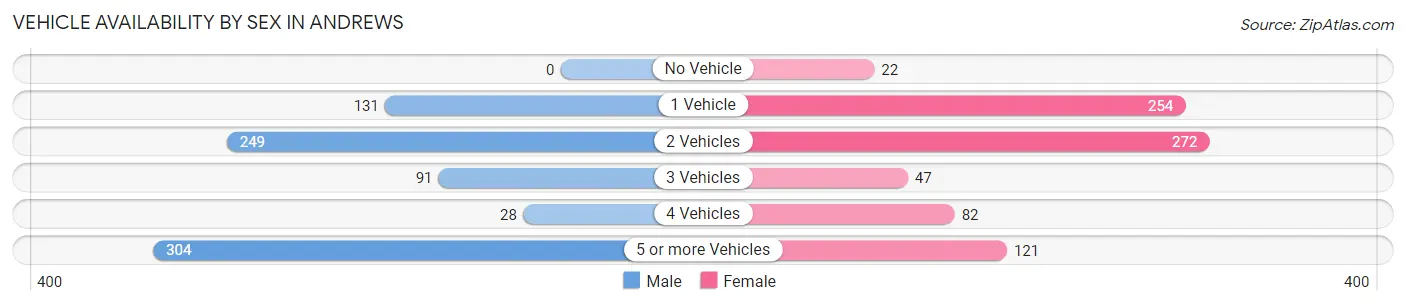
| Vehicles Available | Male | Female |
| No Vehicle | 0 (0.0%) | 22 (2.8%) |
| 1 Vehicle | 131 (16.3%) | 254 (31.8%) |
| 2 Vehicles | 249 (31.0%) | 272 (34.1%) |
| 3 Vehicles | 91 (11.3%) | 47 (5.9%) |
| 4 Vehicles | 28 (3.5%) | 82 (10.3%) |
| 5 or more Vehicles | 304 (37.9%) | 121 (15.2%) |
| Total | 803 (100.0%) | 798 (100.0%) |
Commute Time in Andrews
The most frequently occuring commute durations in Andrews are 60 to 89 minutes (380 commuters, 24.0%), 5 to 9 minutes (304 commuters, 19.2%), and 90 or more minutes (263 commuters, 16.6%).
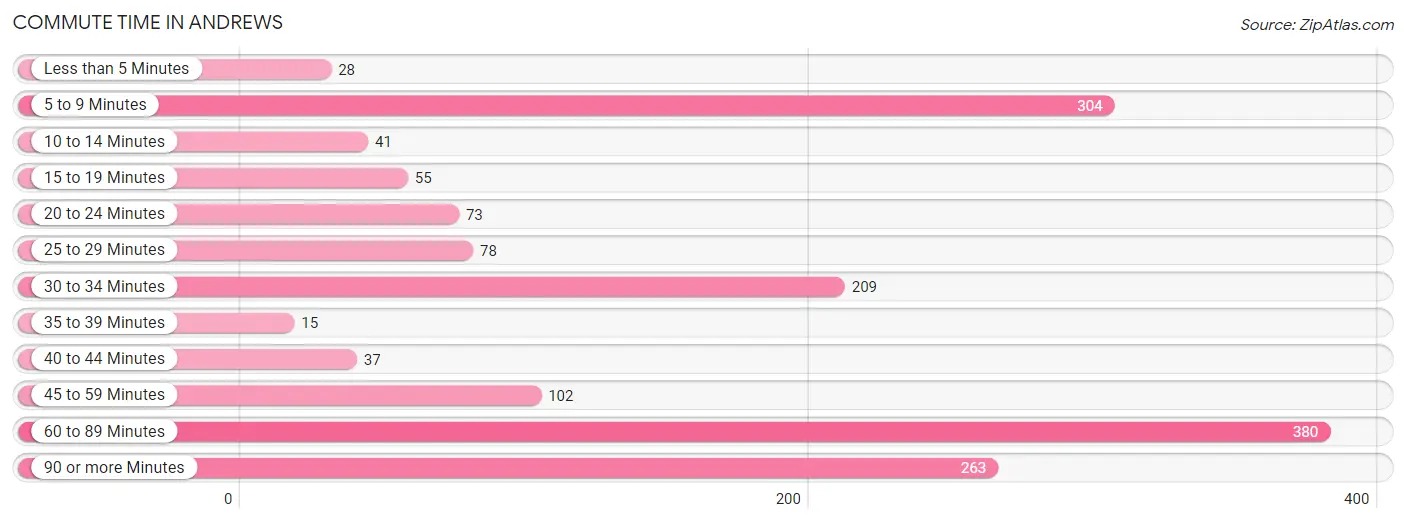
| Commute Time | # Commuters | % Commuters |
| Less than 5 Minutes | 28 | 1.8% |
| 5 to 9 Minutes | 304 | 19.2% |
| 10 to 14 Minutes | 41 | 2.6% |
| 15 to 19 Minutes | 55 | 3.5% |
| 20 to 24 Minutes | 73 | 4.6% |
| 25 to 29 Minutes | 78 | 4.9% |
| 30 to 34 Minutes | 209 | 13.2% |
| 35 to 39 Minutes | 15 | 0.9% |
| 40 to 44 Minutes | 37 | 2.3% |
| 45 to 59 Minutes | 102 | 6.4% |
| 60 to 89 Minutes | 380 | 24.0% |
| 90 or more Minutes | 263 | 16.6% |
Commute Time by Sex in Andrews
The most common commute times in Andrews are 60 to 89 minutes (217 commuters, 27.6%) for males and 5 to 9 minutes (224 commuters, 28.1%) for females.
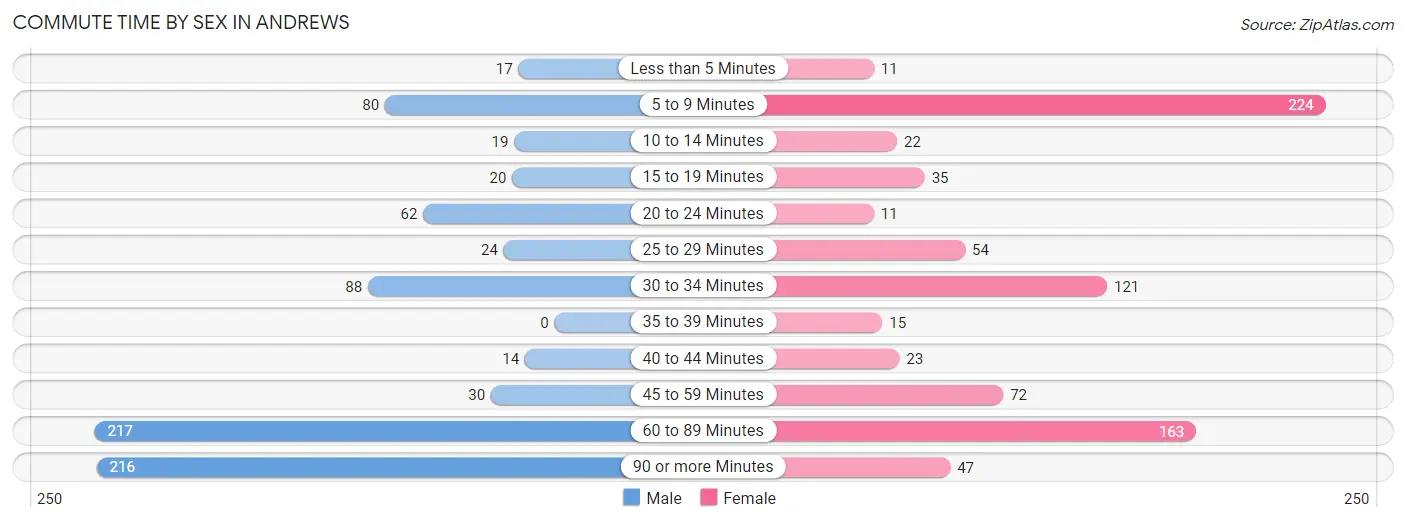
| Commute Time | Male | Female |
| Less than 5 Minutes | 17 (2.2%) | 11 (1.4%) |
| 5 to 9 Minutes | 80 (10.2%) | 224 (28.1%) |
| 10 to 14 Minutes | 19 (2.4%) | 22 (2.8%) |
| 15 to 19 Minutes | 20 (2.5%) | 35 (4.4%) |
| 20 to 24 Minutes | 62 (7.9%) | 11 (1.4%) |
| 25 to 29 Minutes | 24 (3.0%) | 54 (6.8%) |
| 30 to 34 Minutes | 88 (11.2%) | 121 (15.2%) |
| 35 to 39 Minutes | 0 (0.0%) | 15 (1.9%) |
| 40 to 44 Minutes | 14 (1.8%) | 23 (2.9%) |
| 45 to 59 Minutes | 30 (3.8%) | 72 (9.0%) |
| 60 to 89 Minutes | 217 (27.6%) | 163 (20.4%) |
| 90 or more Minutes | 216 (27.5%) | 47 (5.9%) |
Time of Departure to Work by Sex in Andrews
The most frequent times of departure to work in Andrews are 7:00 AM to 7:29 AM (204, 25.9%) for males and 9:00 AM to 9:59 AM (163, 20.4%) for females.
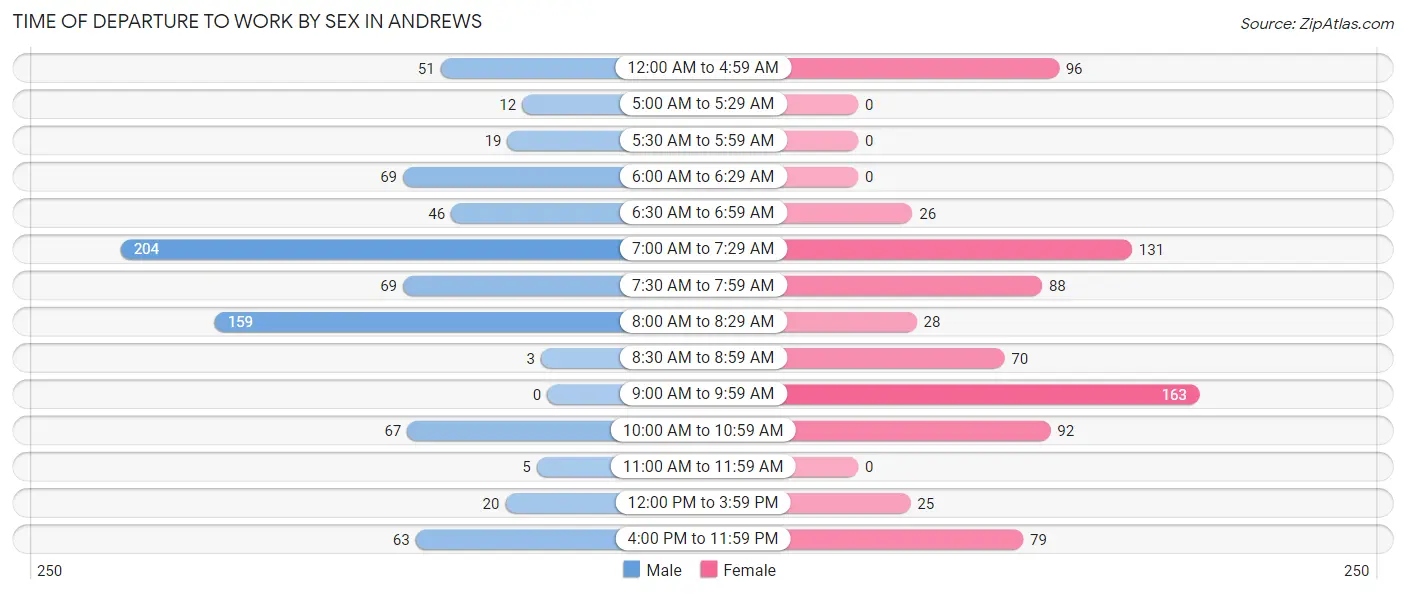
| Time of Departure | Male | Female |
| 12:00 AM to 4:59 AM | 51 (6.5%) | 96 (12.0%) |
| 5:00 AM to 5:29 AM | 12 (1.5%) | 0 (0.0%) |
| 5:30 AM to 5:59 AM | 19 (2.4%) | 0 (0.0%) |
| 6:00 AM to 6:29 AM | 69 (8.8%) | 0 (0.0%) |
| 6:30 AM to 6:59 AM | 46 (5.8%) | 26 (3.3%) |
| 7:00 AM to 7:29 AM | 204 (25.9%) | 131 (16.4%) |
| 7:30 AM to 7:59 AM | 69 (8.8%) | 88 (11.0%) |
| 8:00 AM to 8:29 AM | 159 (20.2%) | 28 (3.5%) |
| 8:30 AM to 8:59 AM | 3 (0.4%) | 70 (8.8%) |
| 9:00 AM to 9:59 AM | 0 (0.0%) | 163 (20.4%) |
| 10:00 AM to 10:59 AM | 67 (8.5%) | 92 (11.5%) |
| 11:00 AM to 11:59 AM | 5 (0.6%) | 0 (0.0%) |
| 12:00 PM to 3:59 PM | 20 (2.5%) | 25 (3.1%) |
| 4:00 PM to 11:59 PM | 63 (8.0%) | 79 (9.9%) |
| Total | 787 (100.0%) | 798 (100.0%) |
Housing Occupancy in Andrews
Occupancy by Ownership in Andrews
Of the total 1,273 dwellings in Andrews, owner-occupied units account for 696 (54.7%), while renter-occupied units make up 577 (45.3%).
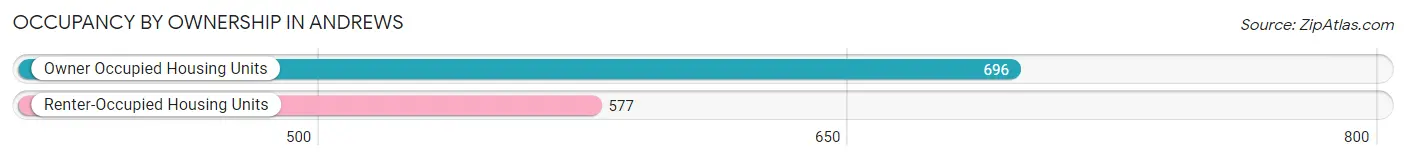
| Occupancy | # Housing Units | % Housing Units |
| Owner Occupied Housing Units | 696 | 54.7% |
| Renter-Occupied Housing Units | 577 | 45.3% |
| Total Occupied Housing Units | 1,273 | 100.0% |
Occupancy by Household Size in Andrews
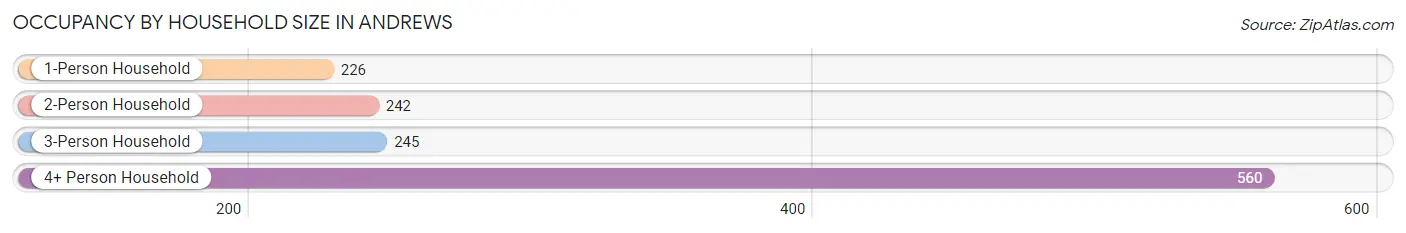
| Household Size | # Housing Units | % Housing Units |
| 1-Person Household | 226 | 17.7% |
| 2-Person Household | 242 | 19.0% |
| 3-Person Household | 245 | 19.3% |
| 4+ Person Household | 560 | 44.0% |
| Total Housing Units | 1,273 | 100.0% |
Occupancy by Ownership by Household Size in Andrews
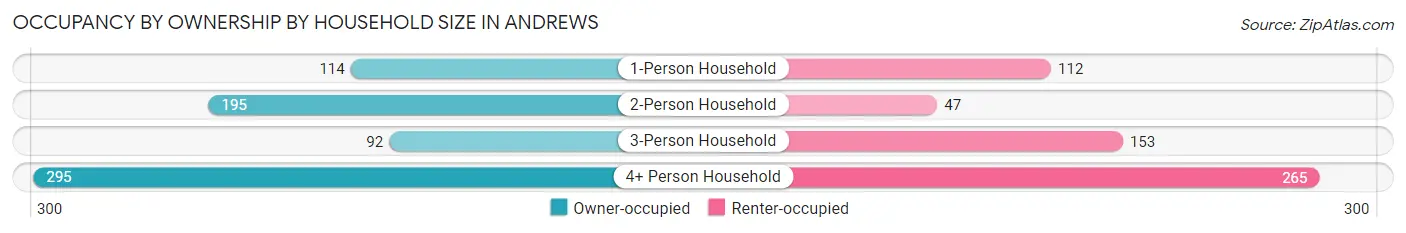
| Household Size | Owner-occupied | Renter-occupied |
| 1-Person Household | 114 (50.4%) | 112 (49.6%) |
| 2-Person Household | 195 (80.6%) | 47 (19.4%) |
| 3-Person Household | 92 (37.6%) | 153 (62.5%) |
| 4+ Person Household | 295 (52.7%) | 265 (47.3%) |
| Total Housing Units | 696 (54.7%) | 577 (45.3%) |
Occupancy by Educational Attainment in Andrews
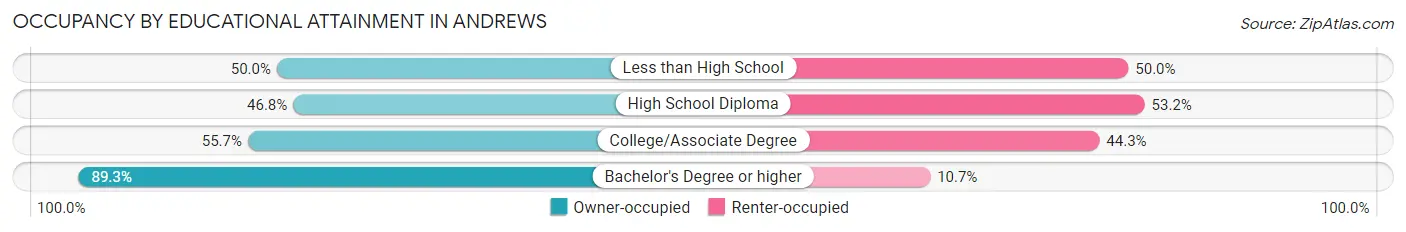
| Household Size | Owner-occupied | Renter-occupied |
| Less than High School | 73 (50.0%) | 73 (50.0%) |
| High School Diploma | 174 (46.8%) | 198 (53.2%) |
| College/Associate Degree | 374 (55.7%) | 297 (44.3%) |
| Bachelor's Degree or higher | 75 (89.3%) | 9 (10.7%) |
Occupancy by Age of Householder in Andrews
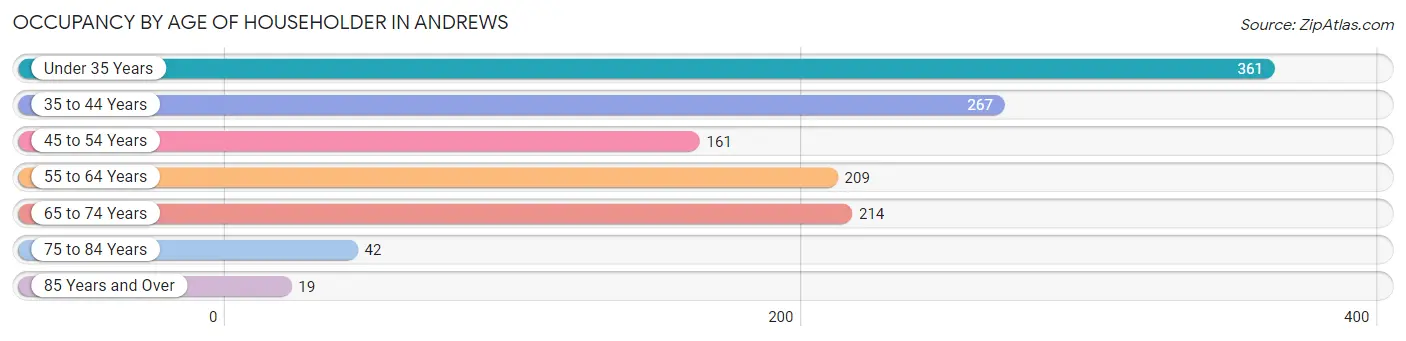
| Age Bracket | # Households | % Households |
| Under 35 Years | 361 | 28.4% |
| 35 to 44 Years | 267 | 21.0% |
| 45 to 54 Years | 161 | 12.7% |
| 55 to 64 Years | 209 | 16.4% |
| 65 to 74 Years | 214 | 16.8% |
| 75 to 84 Years | 42 | 3.3% |
| 85 Years and Over | 19 | 1.5% |
| Total | 1,273 | 100.0% |
Housing Finances in Andrews
Median Income by Occupancy in Andrews
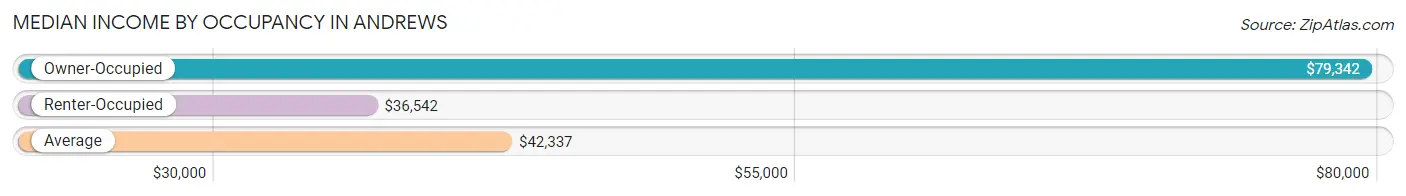
| Occupancy Type | # Households | Median Income |
| Owner-Occupied | 696 (54.7%) | $79,342 |
| Renter-Occupied | 577 (45.3%) | $36,542 |
| Average | 1,273 (100.0%) | $42,337 |
Occupancy by Householder Income Bracket in Andrews
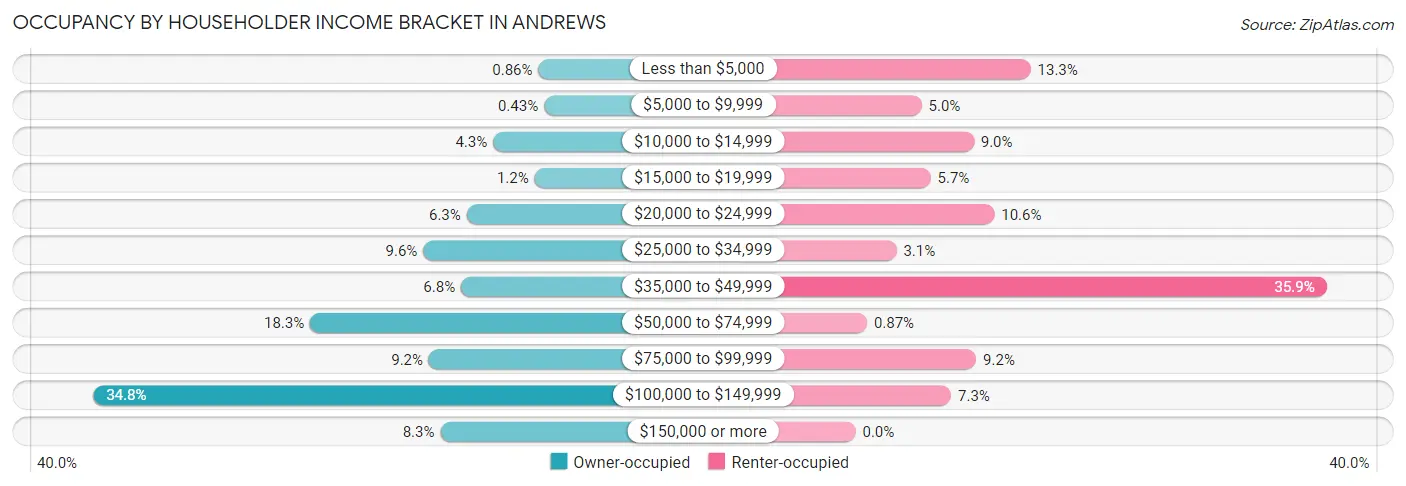
| Income Bracket | Owner-occupied | Renter-occupied |
| Less than $5,000 | 6 (0.9%) | 77 (13.3%) |
| $5,000 to $9,999 | 3 (0.4%) | 29 (5.0%) |
| $10,000 to $14,999 | 30 (4.3%) | 52 (9.0%) |
| $15,000 to $19,999 | 8 (1.1%) | 33 (5.7%) |
| $20,000 to $24,999 | 44 (6.3%) | 61 (10.6%) |
| $25,000 to $34,999 | 67 (9.6%) | 18 (3.1%) |
| $35,000 to $49,999 | 47 (6.8%) | 207 (35.9%) |
| $50,000 to $74,999 | 127 (18.2%) | 5 (0.9%) |
| $75,000 to $99,999 | 64 (9.2%) | 53 (9.2%) |
| $100,000 to $149,999 | 242 (34.8%) | 42 (7.3%) |
| $150,000 or more | 58 (8.3%) | 0 (0.0%) |
| Total | 696 (100.0%) | 577 (100.0%) |
Monthly Housing Cost Tiers in Andrews
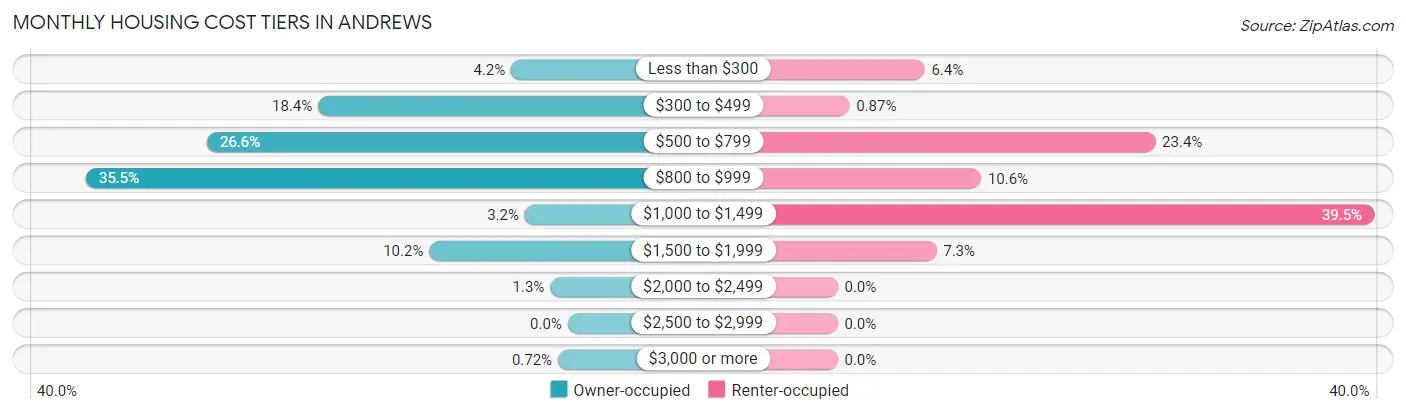
| Monthly Cost | Owner-occupied | Renter-occupied |
| Less than $300 | 29 (4.2%) | 37 (6.4%) |
| $300 to $499 | 128 (18.4%) | 5 (0.9%) |
| $500 to $799 | 185 (26.6%) | 135 (23.4%) |
| $800 to $999 | 247 (35.5%) | 61 (10.6%) |
| $1,000 to $1,499 | 22 (3.2%) | 228 (39.5%) |
| $1,500 to $1,999 | 71 (10.2%) | 42 (7.3%) |
| $2,000 to $2,499 | 9 (1.3%) | 0 (0.0%) |
| $2,500 to $2,999 | 0 (0.0%) | 0 (0.0%) |
| $3,000 or more | 5 (0.7%) | 0 (0.0%) |
| Total | 696 (100.0%) | 577 (100.0%) |
Physical Housing Characteristics in Andrews
Housing Structures in Andrews
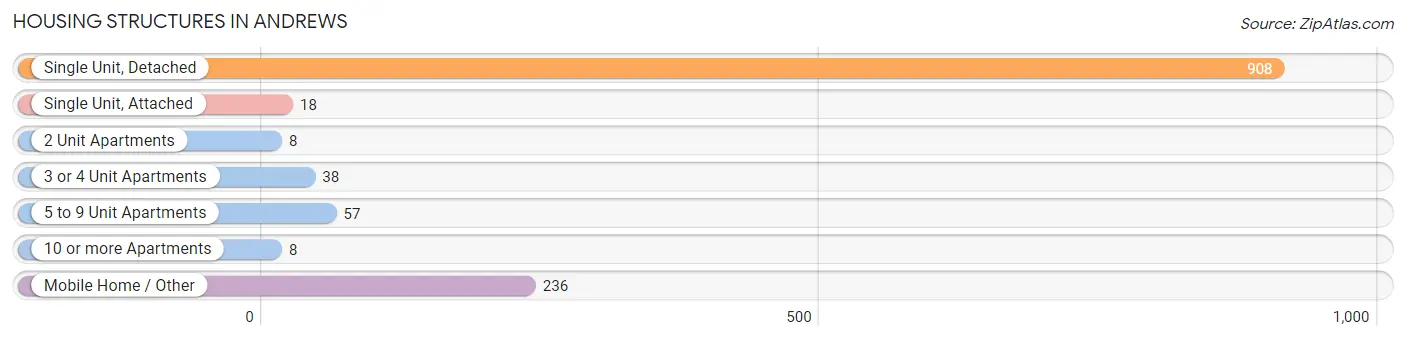
| Structure Type | # Housing Units | % Housing Units |
| Single Unit, Detached | 908 | 71.3% |
| Single Unit, Attached | 18 | 1.4% |
| 2 Unit Apartments | 8 | 0.6% |
| 3 or 4 Unit Apartments | 38 | 3.0% |
| 5 to 9 Unit Apartments | 57 | 4.5% |
| 10 or more Apartments | 8 | 0.6% |
| Mobile Home / Other | 236 | 18.5% |
| Total | 1,273 | 100.0% |
Housing Structures by Occupancy in Andrews
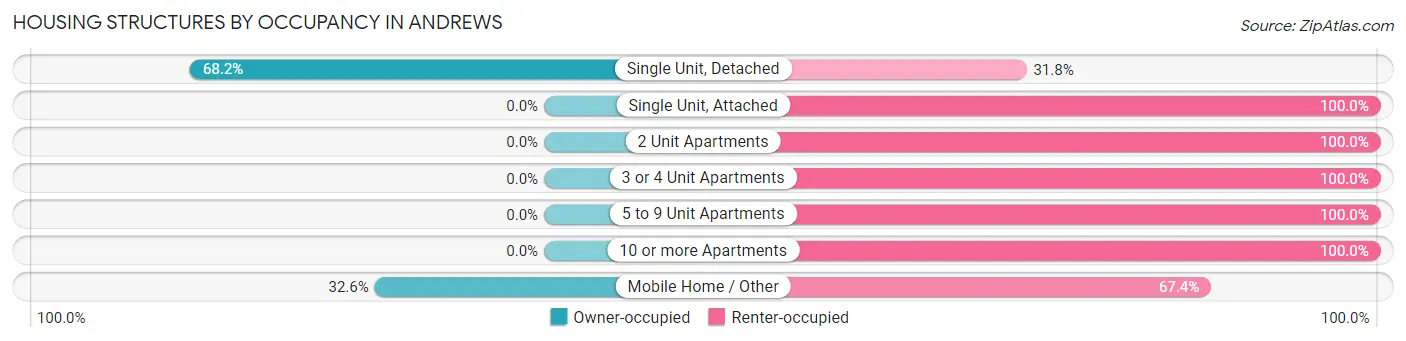
| Structure Type | Owner-occupied | Renter-occupied |
| Single Unit, Detached | 619 (68.2%) | 289 (31.8%) |
| Single Unit, Attached | 0 (0.0%) | 18 (100.0%) |
| 2 Unit Apartments | 0 (0.0%) | 8 (100.0%) |
| 3 or 4 Unit Apartments | 0 (0.0%) | 38 (100.0%) |
| 5 to 9 Unit Apartments | 0 (0.0%) | 57 (100.0%) |
| 10 or more Apartments | 0 (0.0%) | 8 (100.0%) |
| Mobile Home / Other | 77 (32.6%) | 159 (67.4%) |
| Total | 696 (54.7%) | 577 (45.3%) |
Housing Structures by Number of Rooms in Andrews
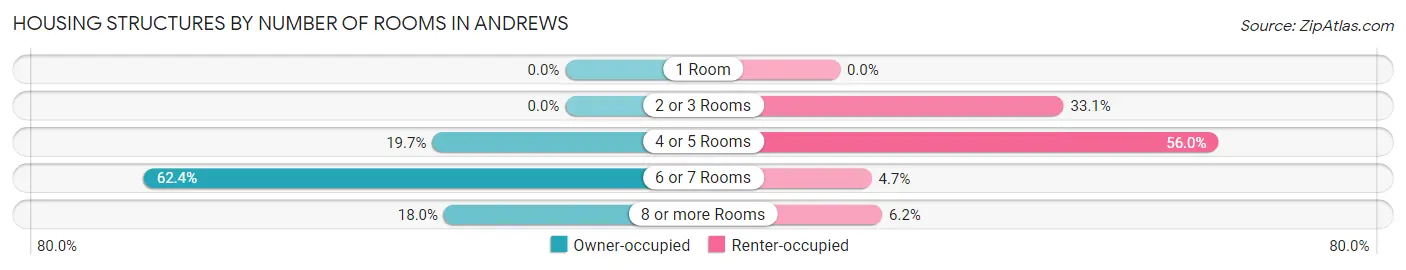
| Number of Rooms | Owner-occupied | Renter-occupied |
| 1 Room | 0 (0.0%) | 0 (0.0%) |
| 2 or 3 Rooms | 0 (0.0%) | 191 (33.1%) |
| 4 or 5 Rooms | 137 (19.7%) | 323 (56.0%) |
| 6 or 7 Rooms | 434 (62.4%) | 27 (4.7%) |
| 8 or more Rooms | 125 (18.0%) | 36 (6.2%) |
| Total | 696 (100.0%) | 577 (100.0%) |
Housing Structure by Heating Type in Andrews
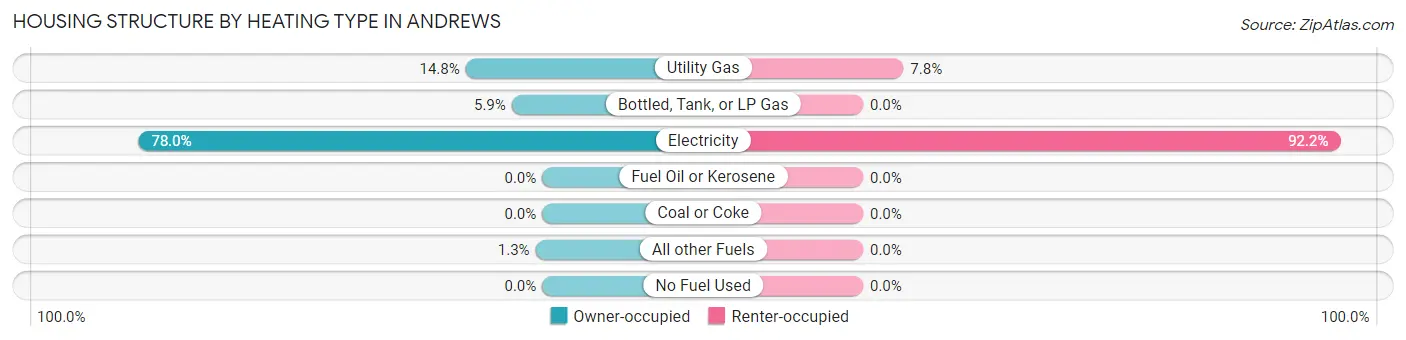
| Heating Type | Owner-occupied | Renter-occupied |
| Utility Gas | 103 (14.8%) | 45 (7.8%) |
| Bottled, Tank, or LP Gas | 41 (5.9%) | 0 (0.0%) |
| Electricity | 543 (78.0%) | 532 (92.2%) |
| Fuel Oil or Kerosene | 0 (0.0%) | 0 (0.0%) |
| Coal or Coke | 0 (0.0%) | 0 (0.0%) |
| All other Fuels | 9 (1.3%) | 0 (0.0%) |
| No Fuel Used | 0 (0.0%) | 0 (0.0%) |
| Total | 696 (100.0%) | 577 (100.0%) |
Household Vehicle Usage in Andrews
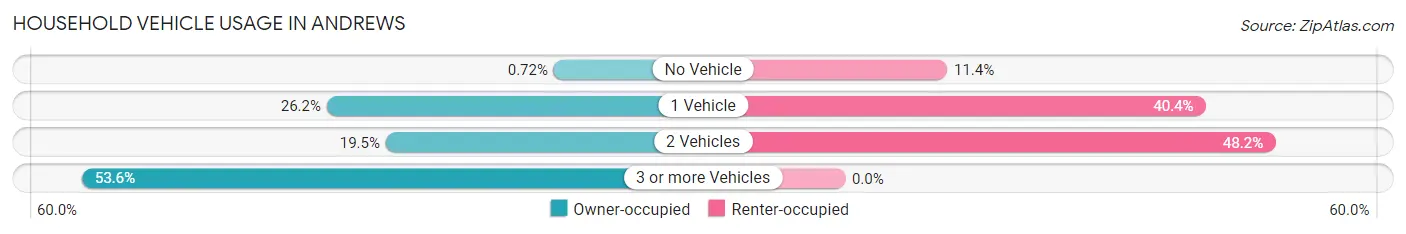
| Vehicles per Household | Owner-occupied | Renter-occupied |
| No Vehicle | 5 (0.7%) | 66 (11.4%) |
| 1 Vehicle | 182 (26.2%) | 233 (40.4%) |
| 2 Vehicles | 136 (19.5%) | 278 (48.2%) |
| 3 or more Vehicles | 373 (53.6%) | 0 (0.0%) |
| Total | 696 (100.0%) | 577 (100.0%) |
Real Estate & Mortgages in Andrews
Real Estate and Mortgage Overview in Andrews
| Characteristic | Without Mortgage | With Mortgage |
| Housing Units | 309 | 387 |
| Median Property Value | $94,700 | $114,900 |
| Median Household Income | $51,467 | $34 |
| Monthly Housing Costs | $496 | $5 |
| Real Estate Taxes | $635 | $0 |
Property Value by Mortgage Status in Andrews
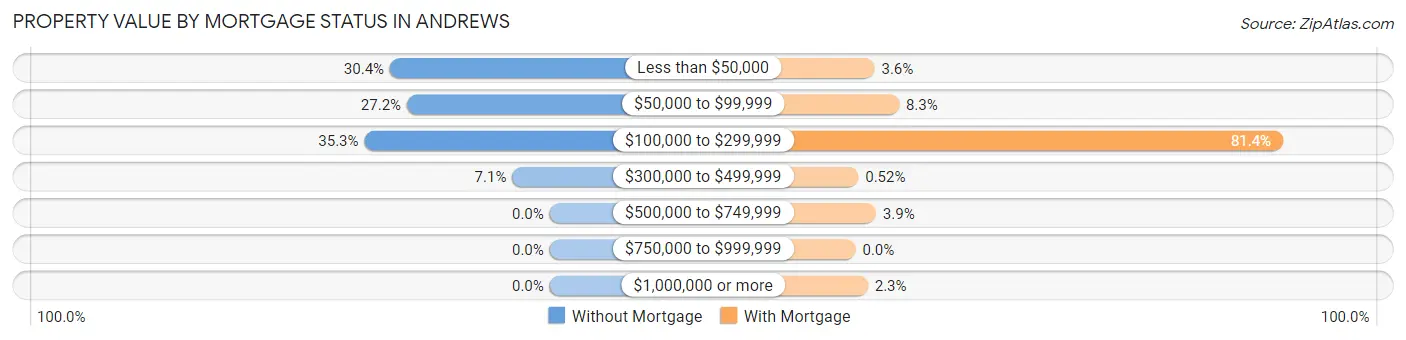
| Property Value | Without Mortgage | With Mortgage |
| Less than $50,000 | 94 (30.4%) | 14 (3.6%) |
| $50,000 to $99,999 | 84 (27.2%) | 32 (8.3%) |
| $100,000 to $299,999 | 109 (35.3%) | 315 (81.4%) |
| $300,000 to $499,999 | 22 (7.1%) | 2 (0.5%) |
| $500,000 to $749,999 | 0 (0.0%) | 15 (3.9%) |
| $750,000 to $999,999 | 0 (0.0%) | 0 (0.0%) |
| $1,000,000 or more | 0 (0.0%) | 9 (2.3%) |
| Total | 309 (100.0%) | 387 (100.0%) |
Household Income by Mortgage Status in Andrews
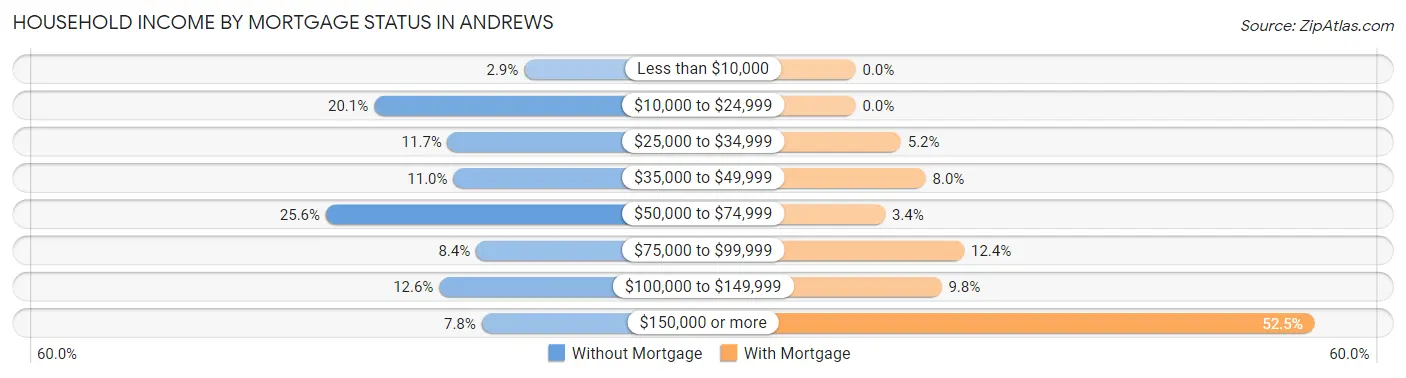
| Household Income | Without Mortgage | With Mortgage |
| Less than $10,000 | 9 (2.9%) | 0 (0.0%) |
| $10,000 to $24,999 | 62 (20.1%) | 0 (0.0%) |
| $25,000 to $34,999 | 36 (11.7%) | 20 (5.2%) |
| $35,000 to $49,999 | 34 (11.0%) | 31 (8.0%) |
| $50,000 to $74,999 | 79 (25.6%) | 13 (3.4%) |
| $75,000 to $99,999 | 26 (8.4%) | 48 (12.4%) |
| $100,000 to $149,999 | 39 (12.6%) | 38 (9.8%) |
| $150,000 or more | 24 (7.8%) | 203 (52.4%) |
| Total | 309 (100.0%) | 387 (100.0%) |
Property Value to Household Income Ratio in Andrews
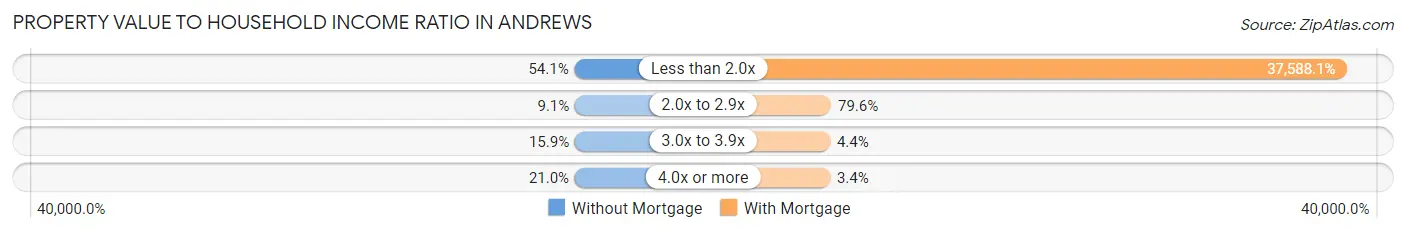
| Value-to-Income Ratio | Without Mortgage | With Mortgage |
| Less than 2.0x | 167 (54.0%) | 145,466 (37,588.1%) |
| 2.0x to 2.9x | 28 (9.1%) | 308 (79.6%) |
| 3.0x to 3.9x | 49 (15.9%) | 17 (4.4%) |
| 4.0x or more | 65 (21.0%) | 13 (3.4%) |
| Total | 309 (100.0%) | 387 (100.0%) |
Real Estate Taxes by Mortgage Status in Andrews
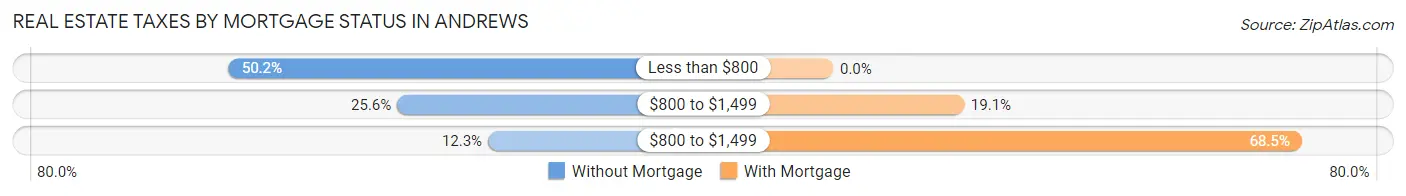
| Property Taxes | Without Mortgage | With Mortgage |
| Less than $800 | 155 (50.2%) | 0 (0.0%) |
| $800 to $1,499 | 79 (25.6%) | 74 (19.1%) |
| $800 to $1,499 | 38 (12.3%) | 265 (68.5%) |
| Total | 309 (100.0%) | 387 (100.0%) |
Health & Disability in Andrews
Health Insurance Coverage by Age in Andrews
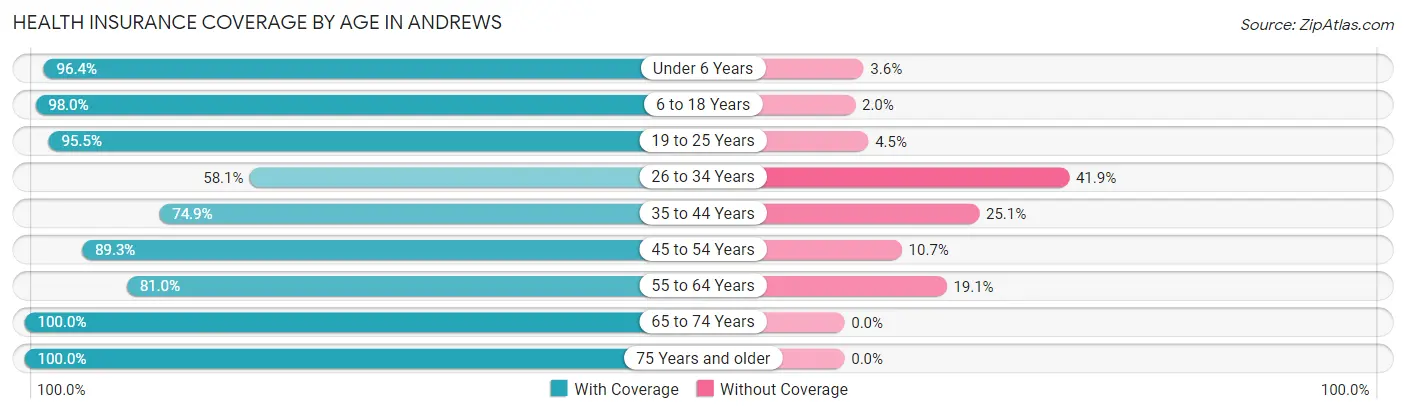
| Age Bracket | With Coverage | Without Coverage |
| Under 6 Years | 352 (96.4%) | 13 (3.6%) |
| 6 to 18 Years | 636 (98.0%) | 13 (2.0%) |
| 19 to 25 Years | 343 (95.5%) | 16 (4.5%) |
| 26 to 34 Years | 348 (58.1%) | 251 (41.9%) |
| 35 to 44 Years | 286 (74.9%) | 96 (25.1%) |
| 45 to 54 Years | 409 (89.3%) | 49 (10.7%) |
| 55 to 64 Years | 289 (80.9%) | 68 (19.1%) |
| 65 to 74 Years | 348 (100.0%) | 0 (0.0%) |
| 75 Years and older | 90 (100.0%) | 0 (0.0%) |
| Total | 3,101 (86.0%) | 506 (14.0%) |
Health Insurance Coverage by Citizenship Status in Andrews
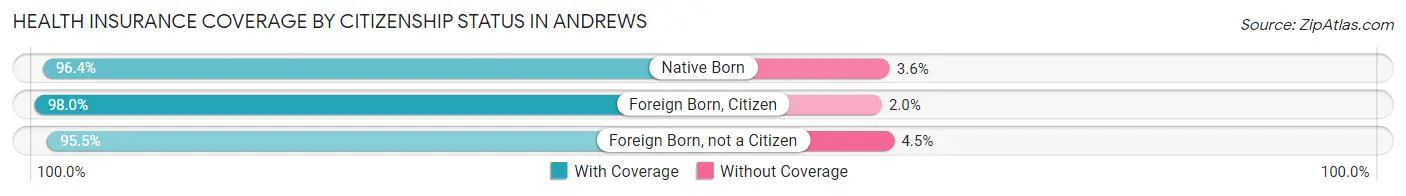
| Citizenship Status | With Coverage | Without Coverage |
| Native Born | 352 (96.4%) | 13 (3.6%) |
| Foreign Born, Citizen | 636 (98.0%) | 13 (2.0%) |
| Foreign Born, not a Citizen | 343 (95.5%) | 16 (4.5%) |
Health Insurance Coverage by Household Income in Andrews
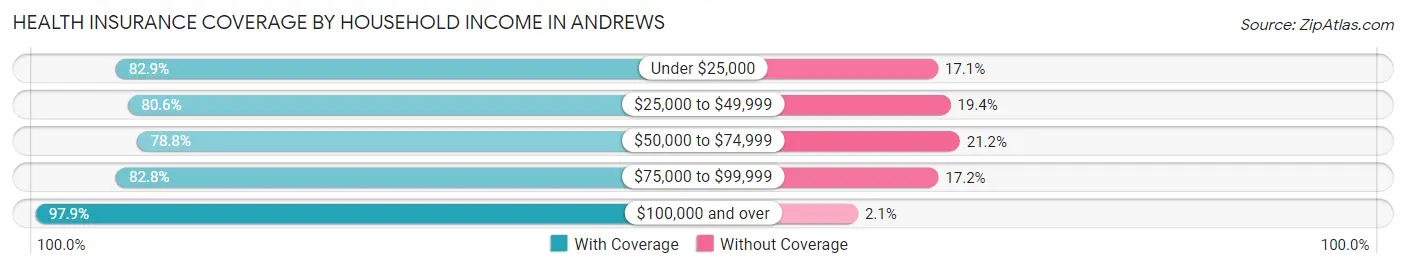
| Household Income | With Coverage | Without Coverage |
| Under $25,000 | 664 (82.9%) | 137 (17.1%) |
| $25,000 to $49,999 | 837 (80.6%) | 202 (19.4%) |
| $50,000 to $74,999 | 283 (78.8%) | 76 (21.2%) |
| $75,000 to $99,999 | 338 (82.8%) | 70 (17.2%) |
| $100,000 and over | 979 (97.9%) | 21 (2.1%) |
Public vs Private Health Insurance Coverage by Age in Andrews
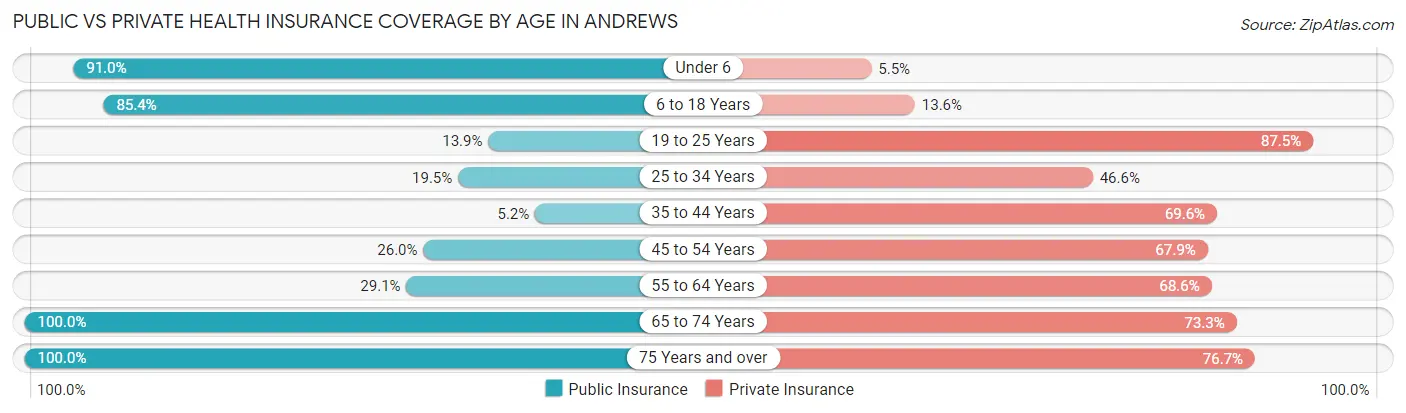
| Age Bracket | Public Insurance | Private Insurance |
| Under 6 | 332 (91.0%) | 20 (5.5%) |
| 6 to 18 Years | 554 (85.4%) | 88 (13.6%) |
| 19 to 25 Years | 50 (13.9%) | 314 (87.5%) |
| 25 to 34 Years | 117 (19.5%) | 279 (46.6%) |
| 35 to 44 Years | 20 (5.2%) | 266 (69.6%) |
| 45 to 54 Years | 119 (26.0%) | 311 (67.9%) |
| 55 to 64 Years | 104 (29.1%) | 245 (68.6%) |
| 65 to 74 Years | 348 (100.0%) | 255 (73.3%) |
| 75 Years and over | 90 (100.0%) | 69 (76.7%) |
| Total | 1,734 (48.1%) | 1,847 (51.2%) |
Disability Status by Sex by Age in Andrews
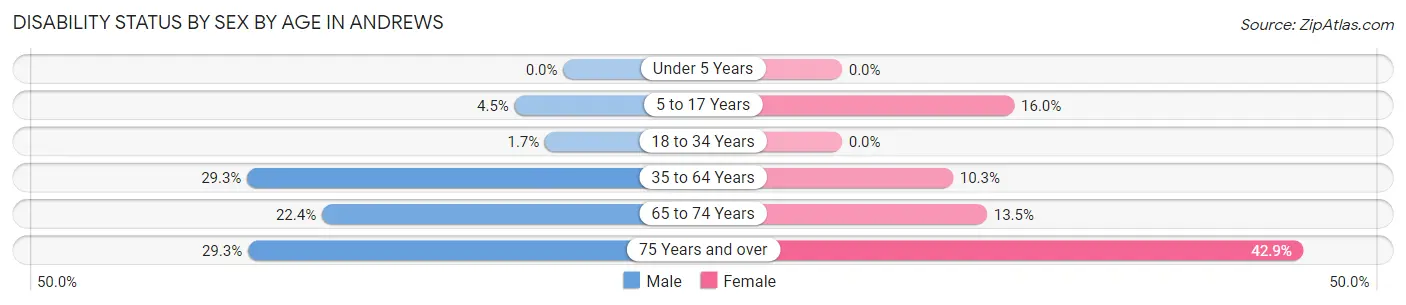
| Age Bracket | Male | Female |
| Under 5 Years | 0 (0.0%) | 0 (0.0%) |
| 5 to 17 Years | 7 (4.5%) | 90 (16.0%) |
| 18 to 34 Years | 7 (1.7%) | 0 (0.0%) |
| 35 to 64 Years | 186 (29.3%) | 58 (10.3%) |
| 65 to 74 Years | 43 (22.4%) | 21 (13.5%) |
| 75 Years and over | 12 (29.3%) | 21 (42.9%) |
Disability Class by Sex by Age in Andrews
Disability Class: Hearing Difficulty
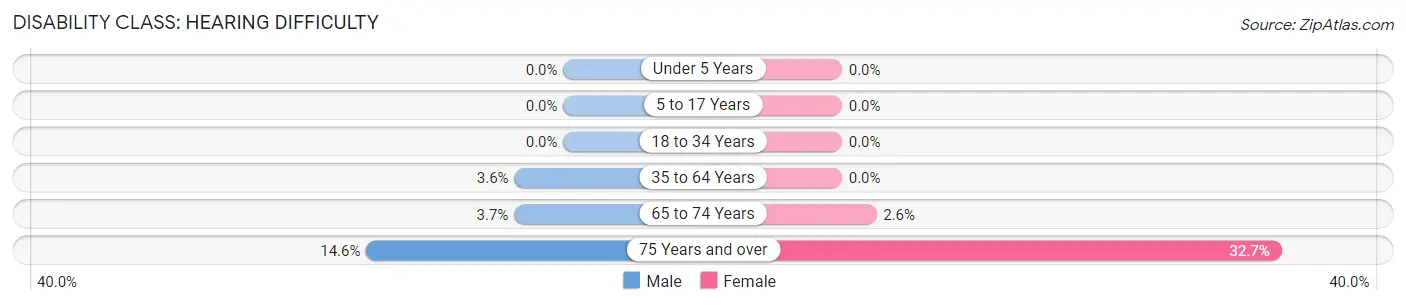
| Age Bracket | Male | Female |
| Under 5 Years | 0 (0.0%) | 0 (0.0%) |
| 5 to 17 Years | 0 (0.0%) | 0 (0.0%) |
| 18 to 34 Years | 0 (0.0%) | 0 (0.0%) |
| 35 to 64 Years | 23 (3.6%) | 0 (0.0%) |
| 65 to 74 Years | 7 (3.6%) | 4 (2.6%) |
| 75 Years and over | 6 (14.6%) | 16 (32.7%) |
Disability Class: Vision Difficulty
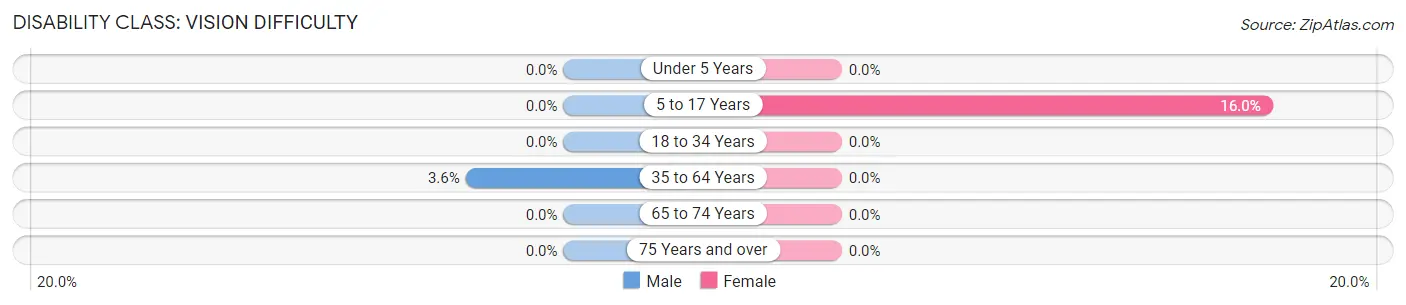
| Age Bracket | Male | Female |
| Under 5 Years | 0 (0.0%) | 0 (0.0%) |
| 5 to 17 Years | 0 (0.0%) | 90 (16.0%) |
| 18 to 34 Years | 0 (0.0%) | 0 (0.0%) |
| 35 to 64 Years | 23 (3.6%) | 0 (0.0%) |
| 65 to 74 Years | 0 (0.0%) | 0 (0.0%) |
| 75 Years and over | 0 (0.0%) | 0 (0.0%) |
Disability Class: Cognitive Difficulty
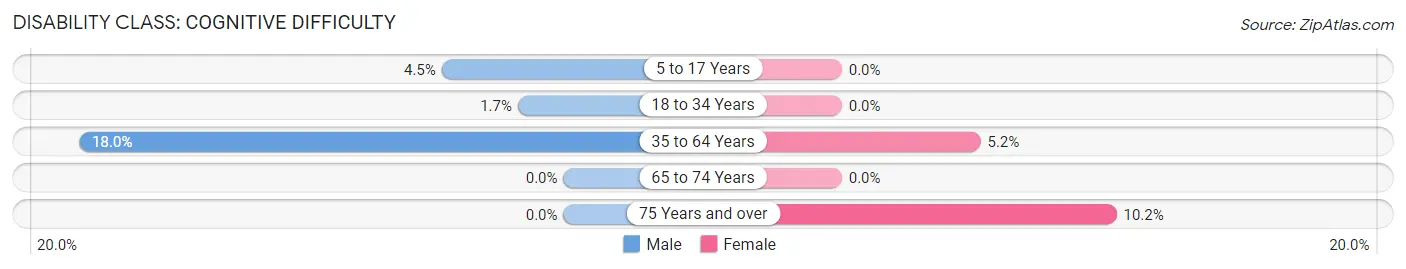
| Age Bracket | Male | Female |
| 5 to 17 Years | 7 (4.5%) | 0 (0.0%) |
| 18 to 34 Years | 7 (1.7%) | 0 (0.0%) |
| 35 to 64 Years | 114 (18.0%) | 29 (5.1%) |
| 65 to 74 Years | 0 (0.0%) | 0 (0.0%) |
| 75 Years and over | 0 (0.0%) | 5 (10.2%) |
Disability Class: Ambulatory Difficulty
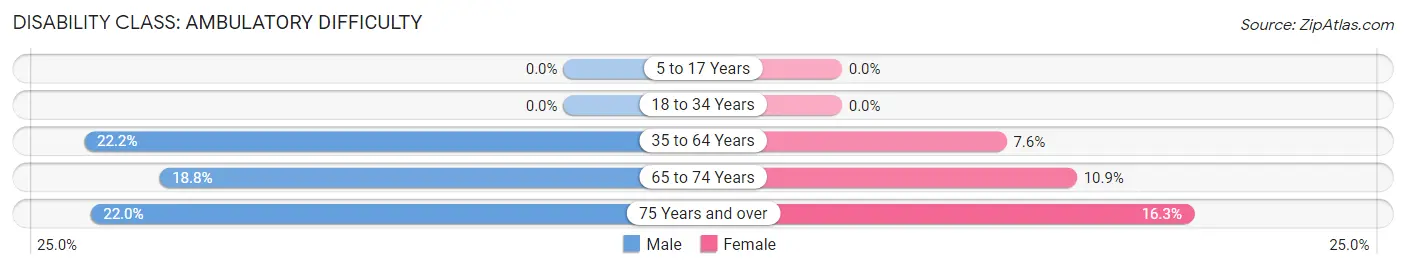
| Age Bracket | Male | Female |
| 5 to 17 Years | 0 (0.0%) | 0 (0.0%) |
| 18 to 34 Years | 0 (0.0%) | 0 (0.0%) |
| 35 to 64 Years | 141 (22.2%) | 43 (7.6%) |
| 65 to 74 Years | 36 (18.8%) | 17 (10.9%) |
| 75 Years and over | 9 (22.0%) | 8 (16.3%) |
Disability Class: Self-Care Difficulty
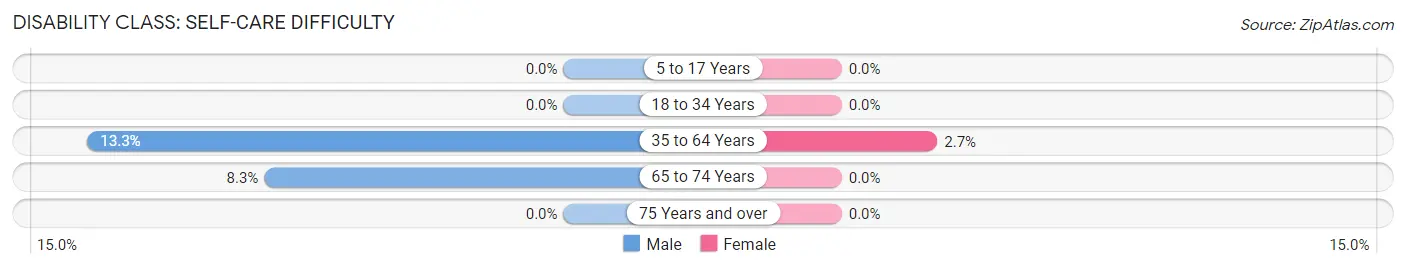
| Age Bracket | Male | Female |
| 5 to 17 Years | 0 (0.0%) | 0 (0.0%) |
| 18 to 34 Years | 0 (0.0%) | 0 (0.0%) |
| 35 to 64 Years | 84 (13.3%) | 15 (2.7%) |
| 65 to 74 Years | 16 (8.3%) | 0 (0.0%) |
| 75 Years and over | 0 (0.0%) | 0 (0.0%) |
Technology Access in Andrews
Computing Device Access in Andrews
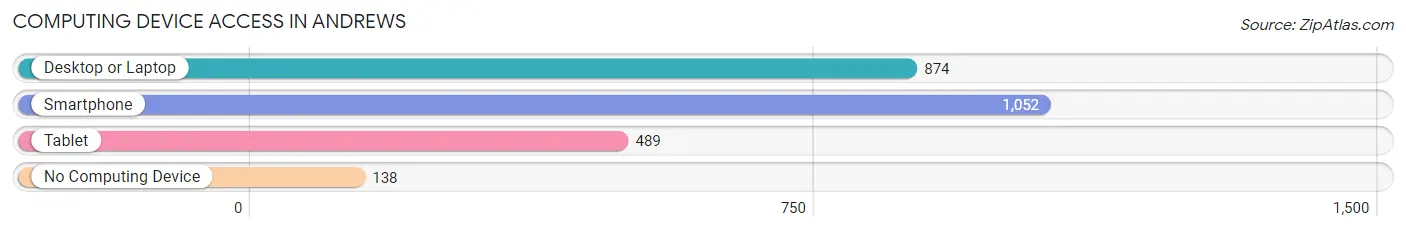
| Device Type | # Households | % Households |
| Desktop or Laptop | 874 | 68.7% |
| Smartphone | 1,052 | 82.6% |
| Tablet | 489 | 38.4% |
| No Computing Device | 138 | 10.8% |
| Total | 1,273 | 100.0% |
Internet Access in Andrews
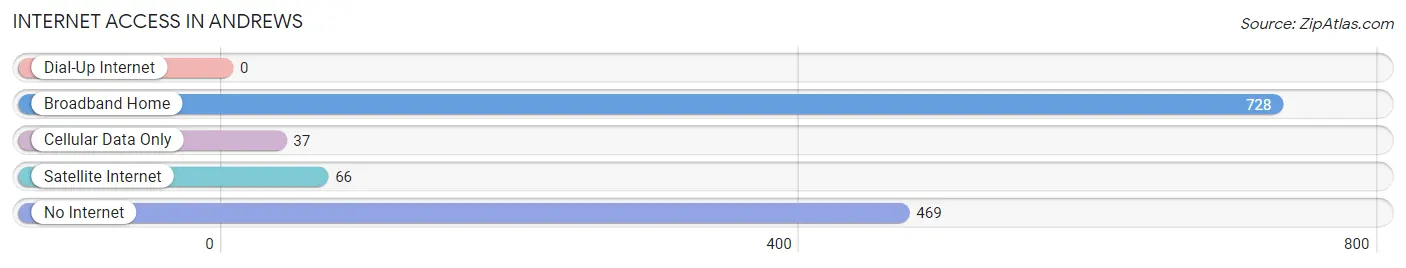
| Internet Type | # Households | % Households |
| Dial-Up Internet | 0 | 0.0% |
| Broadband Home | 728 | 57.2% |
| Cellular Data Only | 37 | 2.9% |
| Satellite Internet | 66 | 5.2% |
| No Internet | 469 | 36.8% |
| Total | 1,273 | 100.0% |
Andrews Summary
Andrews is a small town located in Georgetown County, South Carolina. It is situated on the banks of the Black River, approximately 25 miles from the Atlantic Ocean. The town has a population of approximately 2,000 people and is the county seat of Georgetown County.
History
Andrews was founded in 1786 by a group of settlers from the nearby town of Georgetown. The town was named after the Andrews family, who were among the first settlers. The town was incorporated in 1883 and has remained a small, rural community ever since.
The town was an important port during the Civil War, and was the site of several battles. After the war, the town experienced a period of growth and prosperity, with the establishment of several businesses and industries.
Geography
Andrews is located in the Lowcountry region of South Carolina, and is situated on the banks of the Black River. The town is surrounded by a number of small towns and villages, including Georgetown, Murrells Inlet, and Pawleys Island. The town is located approximately 25 miles from the Atlantic Ocean.
The climate in Andrews is humid subtropical, with hot, humid summers and mild winters. The average annual temperature is around 70 degrees Fahrenheit, with an average annual rainfall of around 50 inches.
Economy
The economy of Andrews is largely based on agriculture and tourism. The town is home to several farms, which produce a variety of crops, including corn, soybeans, and cotton. The town is also home to several seafood processing plants, which process and package seafood for local restaurants and markets.
Tourism is an important part of the local economy, with visitors coming to the area to enjoy the beaches, fishing, and other outdoor activities. The town is also home to several historic sites, including the Andrews Historic District, which is listed on the National Register of Historic Places.
Demographics
As of the 2010 census, the population of Andrews was 2,000. The racial makeup of the town was 79.2% White, 17.2% African American, 0.7% Native American, 0.3% Asian, and 2.6% from other races. The median household income was $30,000, and the median family income was $35,000.
The town is served by the Georgetown County School District, which includes two elementary schools, one middle school, and one high school. The town is also home to several churches, including the Andrews United Methodist Church, the Andrews Presbyterian Church, and the Andrews Baptist Church.
Andrews is a small, rural town with a rich history and a strong sense of community. The town is home to a variety of businesses and industries, and is a popular destination for tourists looking to enjoy the beaches, fishing, and other outdoor activities. The town is also home to several historic sites, making it a great place to visit and explore.
Common Questions
What is Per Capita Income in Andrews?
Per Capita income in Andrews is $25,008.
What is the Median Family Income in Andrews?
Median Family Income in Andrews is $54,297.
What is the Median Household income in Andrews?
Median Household Income in Andrews is $42,337.
What is Inequality or Gini Index in Andrews?
Inequality or Gini Index in Andrews is 0.46.
What is the Total Population of Andrews?
Total Population of Andrews is 3,617.
What is the Total Male Population of Andrews?
Total Male Population of Andrews is 1,583.
What is the Total Female Population of Andrews?
Total Female Population of Andrews is 2,034.
What is the Ratio of Males per 100 Females in Andrews?
There are 77.83 Males per 100 Females in Andrews.
What is the Ratio of Females per 100 Males in Andrews?
There are 128.49 Females per 100 Males in Andrews.
What is the Median Population Age in Andrews?
Median Population Age in Andrews is 34.0 Years.
What is the Average Family Size in Andrews
Average Family Size in Andrews is 3.1 People.
What is the Average Household Size in Andrews
Average Household Size in Andrews is 2.8 People.
How Large is the Labor Force in Andrews?
There are 1,740 People in the Labor Forcein in Andrews.
What is the Percentage of People in the Labor Force in Andrews?
64.5% of People are in the Labor Force in Andrews.
What is the Unemployment Rate in Andrews?
Unemployment Rate in Andrews is 0.6%.