Saluda, SC Map & Demographics
Saluda Map
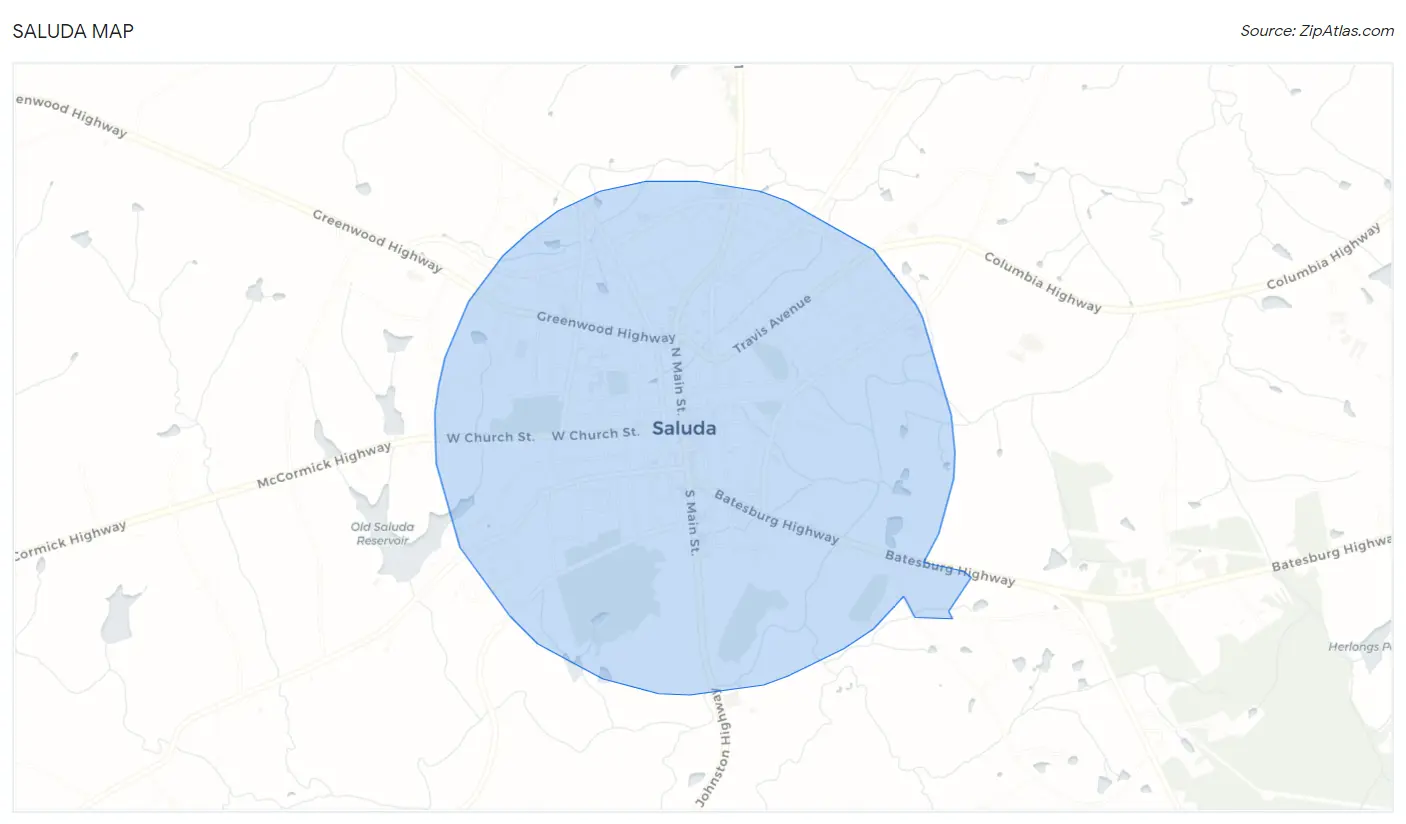
Saluda Overview
$14,634
PER CAPITA INCOME
$38,145
AVG FAMILY INCOME
$32,986
AVG HOUSEHOLD INCOME
41.1%
WAGE / INCOME GAP [ % ]
58.9¢/ $1
WAGE / INCOME GAP [ $ ]
$6,835
FAMILY INCOME DEFICIT
0.44
INEQUALITY / GINI INDEX
3,124
TOTAL POPULATION
1,877
MALE POPULATION
1,247
FEMALE POPULATION
150.52
MALES / 100 FEMALES
66.44
FEMALES / 100 MALES
35.1
MEDIAN AGE
3.3
AVG FAMILY SIZE
2.6
AVG HOUSEHOLD SIZE
1,191
LABOR FORCE [ PEOPLE ]
53.8%
PERCENT IN LABOR FORCE
4.6%
UNEMPLOYMENT RATE
Saluda Zip Codes
Saluda Area Codes
Income in Saluda
Income Overview in Saluda
Per Capita Income in Saluda is $14,634, while median incomes of families and households are $38,145 and $32,986 respectively.
| Characteristic | Number | Measure |
| Per Capita Income | 3,124 | $14,634 |
| Median Family Income | 798 | $38,145 |
| Mean Family Income | 798 | $47,047 |
| Median Household Income | 1,176 | $32,986 |
| Mean Household Income | 1,176 | $41,318 |
| Income Deficit | 798 | $6,835 |
| Wage / Income Gap (%) | 3,124 | 41.10% |
| Wage / Income Gap ($) | 3,124 | 58.90¢ per $1 |
| Gini / Inequality Index | 3,124 | 0.44 |
Earnings by Sex in Saluda
Average Earnings in Saluda are $17,708, $14,853 for men and $25,216 for women, a difference of 41.1%.
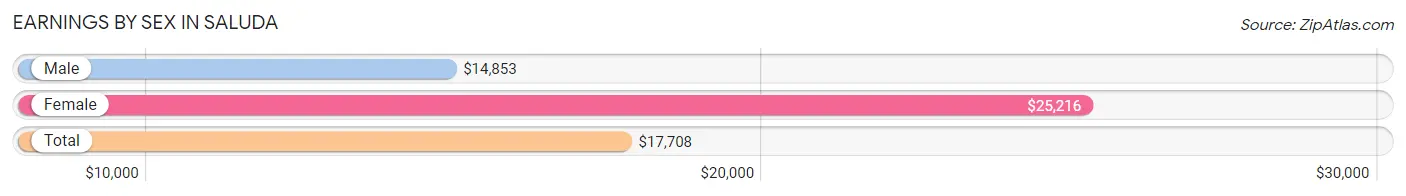
| Sex | Number | Average Earnings |
| Male | 816 (65.6%) | $14,853 |
| Female | 427 (34.4%) | $25,216 |
| Total | 1,243 (100.0%) | $17,708 |
Earnings by Sex by Income Bracket in Saluda
The most common earnings brackets in Saluda are $5,000 to $7,499 for men (283 | 34.7%) and $30,000 to $34,999 for women (76 | 17.8%).
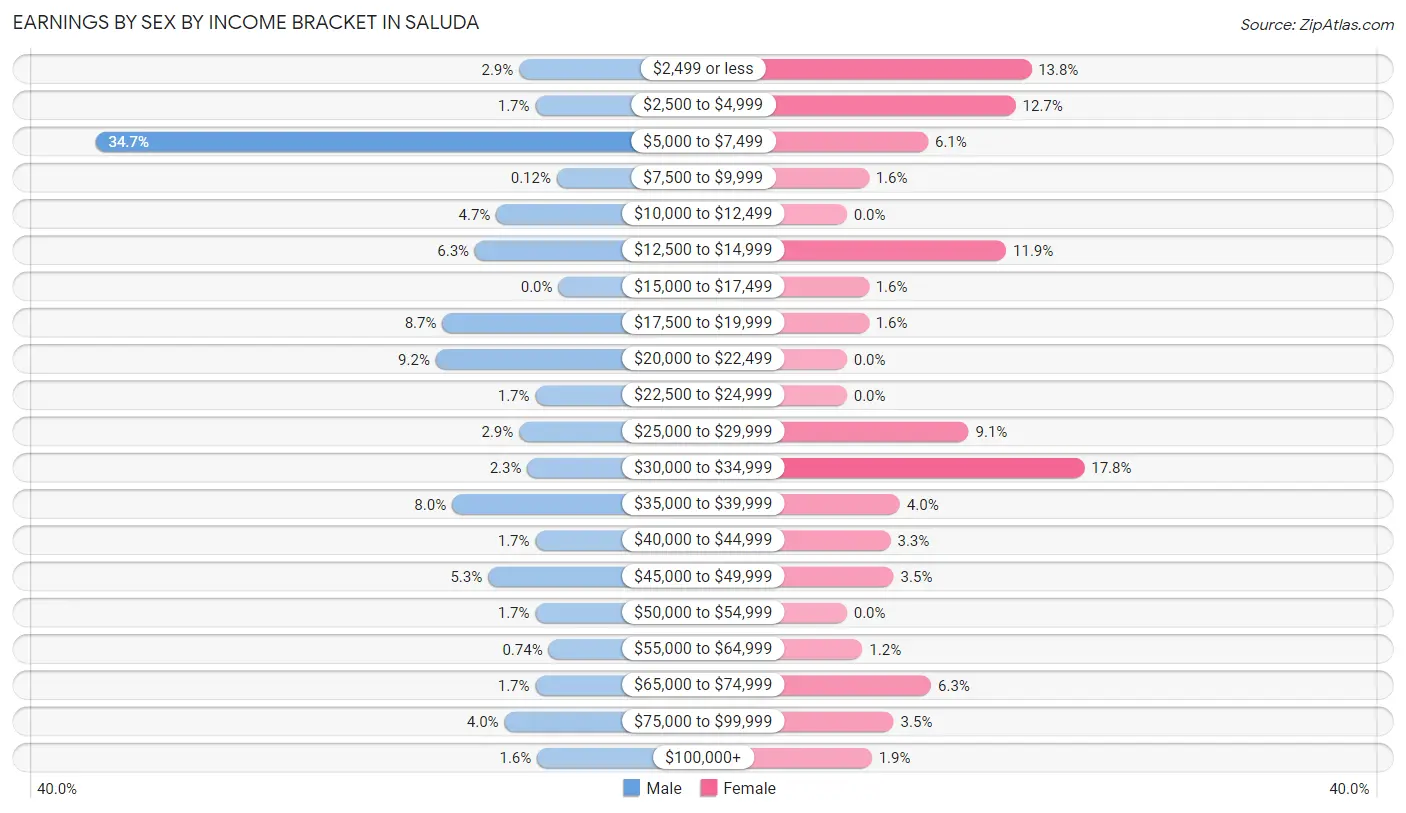
| Income | Male | Female |
| $2,499 or less | 24 (2.9%) | 59 (13.8%) |
| $2,500 to $4,999 | 14 (1.7%) | 54 (12.7%) |
| $5,000 to $7,499 | 283 (34.7%) | 26 (6.1%) |
| $7,500 to $9,999 | 1 (0.1%) | 7 (1.6%) |
| $10,000 to $12,499 | 38 (4.7%) | 0 (0.0%) |
| $12,500 to $14,999 | 51 (6.2%) | 51 (11.9%) |
| $15,000 to $17,499 | 0 (0.0%) | 7 (1.6%) |
| $17,500 to $19,999 | 71 (8.7%) | 7 (1.6%) |
| $20,000 to $22,499 | 75 (9.2%) | 0 (0.0%) |
| $22,500 to $24,999 | 14 (1.7%) | 0 (0.0%) |
| $25,000 to $29,999 | 24 (2.9%) | 39 (9.1%) |
| $30,000 to $34,999 | 19 (2.3%) | 76 (17.8%) |
| $35,000 to $39,999 | 65 (8.0%) | 17 (4.0%) |
| $40,000 to $44,999 | 14 (1.7%) | 14 (3.3%) |
| $45,000 to $49,999 | 43 (5.3%) | 15 (3.5%) |
| $50,000 to $54,999 | 14 (1.7%) | 0 (0.0%) |
| $55,000 to $64,999 | 6 (0.7%) | 5 (1.2%) |
| $65,000 to $74,999 | 14 (1.7%) | 27 (6.3%) |
| $75,000 to $99,999 | 33 (4.0%) | 15 (3.5%) |
| $100,000+ | 13 (1.6%) | 8 (1.9%) |
| Total | 816 (100.0%) | 427 (100.0%) |
Earnings by Sex by Educational Attainment in Saluda
Average earnings in Saluda are $17,694 for men and $28,875 for women, a difference of 38.7%. Men with an educational attainment of graduate degree enjoy the highest average annual earnings of $54,792, while those with college or associate's degree education earn the least with $6,953. Women with an educational attainment of college or associate's degree earn the most with the average annual earnings of $32,647, while those with high school diploma education have the smallest earnings of $26,336.
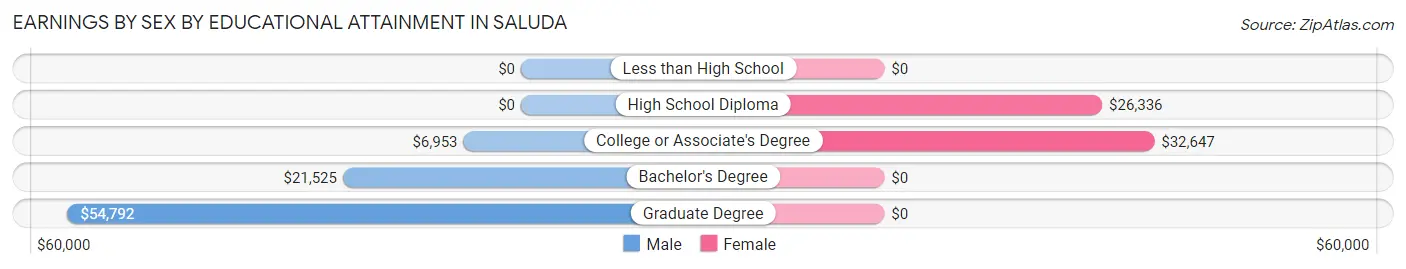
| Educational Attainment | Male Income | Female Income |
| Less than High School | - | - |
| High School Diploma | - | - |
| College or Associate's Degree | $6,953 | $32,647 |
| Bachelor's Degree | $21,525 | $0 |
| Graduate Degree | $54,792 | $0 |
| Total | $17,694 | $28,875 |
Family Income in Saluda
Family Income Brackets in Saluda
According to the Saluda family income data, there are 249 families falling into the $35,000 to $49,999 income range, which is the most common income bracket and makes up 31.2% of all families. Conversely, the $100,000 to $149,999 income bracket is the least frequent group with only 10 families (1.3%) belonging to this category.
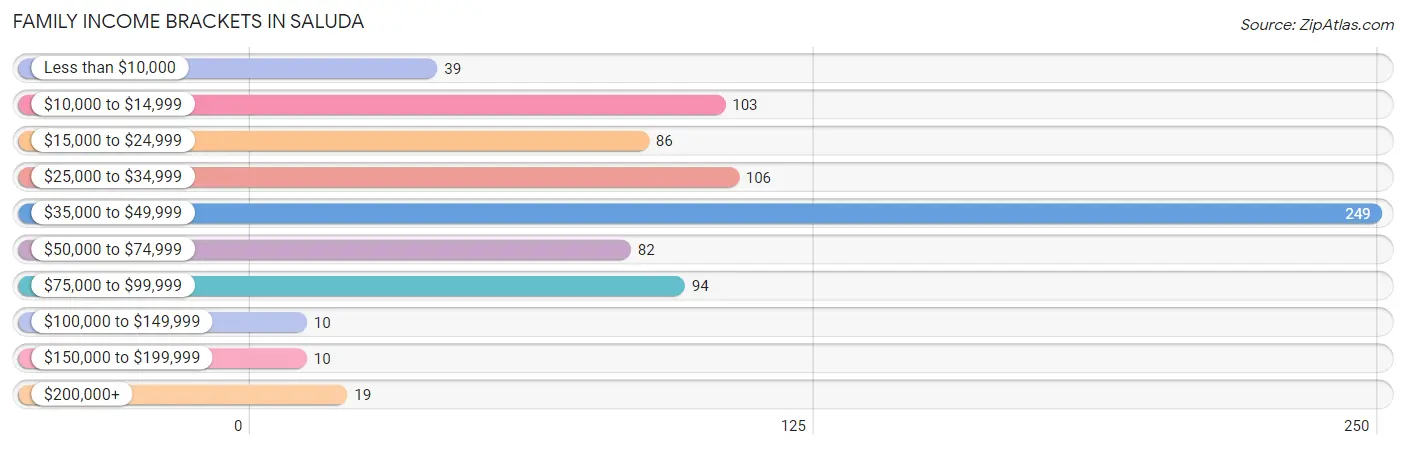
| Income Bracket | # Families | % Families |
| Less than $10,000 | 39 | 4.9% |
| $10,000 to $14,999 | 103 | 12.9% |
| $15,000 to $24,999 | 86 | 10.8% |
| $25,000 to $34,999 | 106 | 13.3% |
| $35,000 to $49,999 | 249 | 31.2% |
| $50,000 to $74,999 | 82 | 10.3% |
| $75,000 to $99,999 | 94 | 11.8% |
| $100,000 to $149,999 | 10 | 1.3% |
| $150,000 to $199,999 | 10 | 1.3% |
| $200,000+ | 19 | 2.4% |
Family Income by Famaliy Size in Saluda
5-person families (30 | 3.8%) account for the highest median family income in Saluda with $77,344 per family, while 2-person families (183 | 22.9%) have the highest median income of $21,678 per family member.
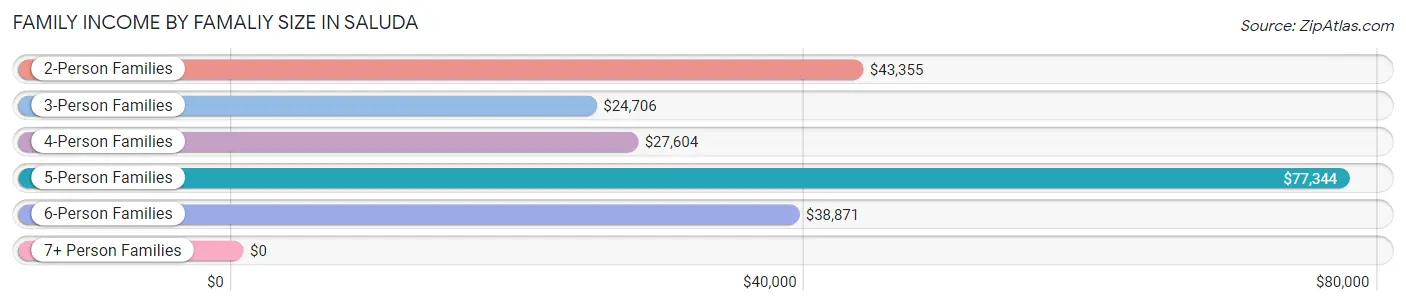
| Income Bracket | # Families | Median Income |
| 2-Person Families | 183 (22.9%) | $43,355 |
| 3-Person Families | 216 (27.1%) | $24,706 |
| 4-Person Families | 144 (18.0%) | $27,604 |
| 5-Person Families | 30 (3.8%) | $77,344 |
| 6-Person Families | 204 (25.6%) | $38,871 |
| 7+ Person Families | 21 (2.6%) | $0 |
| Total | 798 (100.0%) | $38,145 |
Family Income by Number of Earners in Saluda
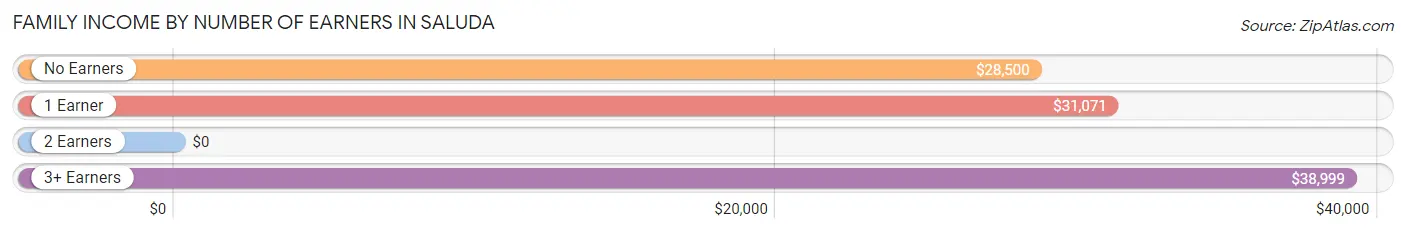
| Number of Earners | # Families | Median Income |
| No Earners | 130 (16.3%) | $28,500 |
| 1 Earner | 238 (29.8%) | $31,071 |
| 2 Earners | 207 (25.9%) | $0 |
| 3+ Earners | 223 (27.9%) | $38,999 |
| Total | 798 (100.0%) | $38,145 |
Household Income in Saluda
Household Income Brackets in Saluda
With 283 households falling in the category, the $35,000 to $49,999 income range is the most frequent in Saluda, accounting for 24.1% of all households. In contrast, only 11 households (0.9%) fall into the $150,000 to $199,999 income bracket, making it the least populous group.
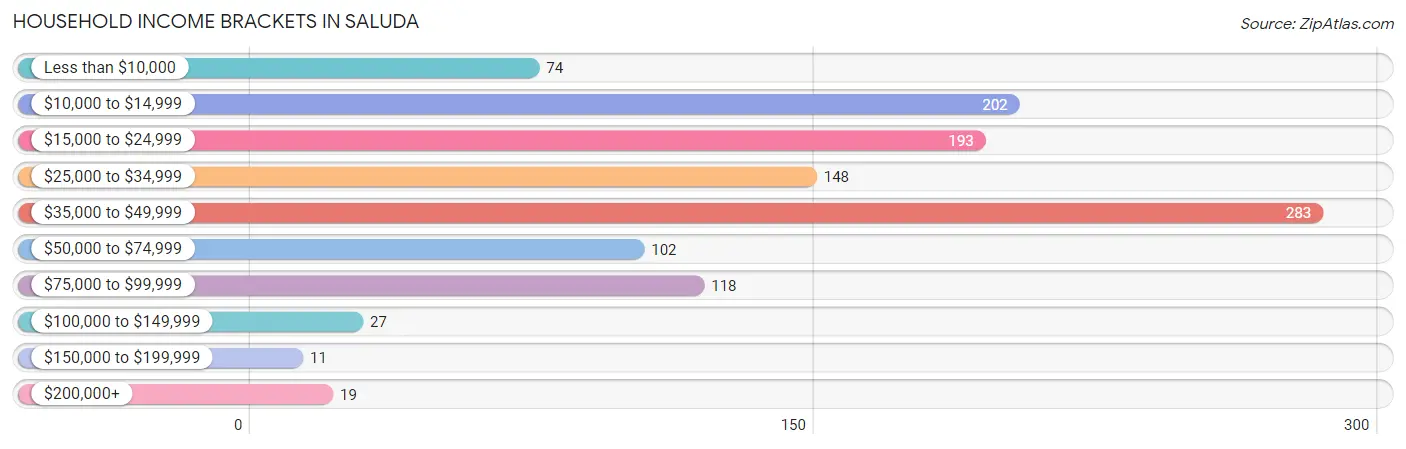
| Income Bracket | # Households | % Households |
| Less than $10,000 | 74 | 6.3% |
| $10,000 to $14,999 | 202 | 17.2% |
| $15,000 to $24,999 | 193 | 16.4% |
| $25,000 to $34,999 | 148 | 12.6% |
| $35,000 to $49,999 | 283 | 24.1% |
| $50,000 to $74,999 | 102 | 8.7% |
| $75,000 to $99,999 | 118 | 10.0% |
| $100,000 to $149,999 | 27 | 2.3% |
| $150,000 to $199,999 | 11 | 0.9% |
| $200,000+ | 19 | 1.6% |
Household Income by Householder Age in Saluda
The median household income in Saluda is $32,986, with the highest median household income of $38,226 found in the 25 to 44 years age bracket for the primary householder. A total of 478 households (40.6%) fall into this category. Meanwhile, the 15 to 24 years age bracket for the primary householder has the lowest median household income of $0, with 83 households (7.1%) in this group.
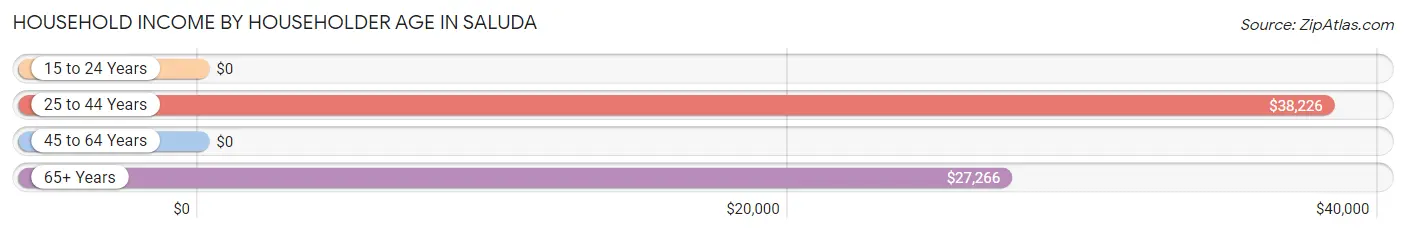
| Income Bracket | # Households | Median Income |
| 15 to 24 Years | 83 (7.1%) | $0 |
| 25 to 44 Years | 478 (40.6%) | $38,226 |
| 45 to 64 Years | 294 (25.0%) | $0 |
| 65+ Years | 321 (27.3%) | $27,266 |
| Total | 1,176 (100.0%) | $32,986 |
Poverty in Saluda
Income Below Poverty by Sex and Age in Saluda
With 46.6% poverty level for males and 30.2% for females among the residents of Saluda, 6 to 11 year old males and 15 year old females are the most vulnerable to poverty, with 194 males (68.8%) and 6 females (60.0%) in their respective age groups living below the poverty level.
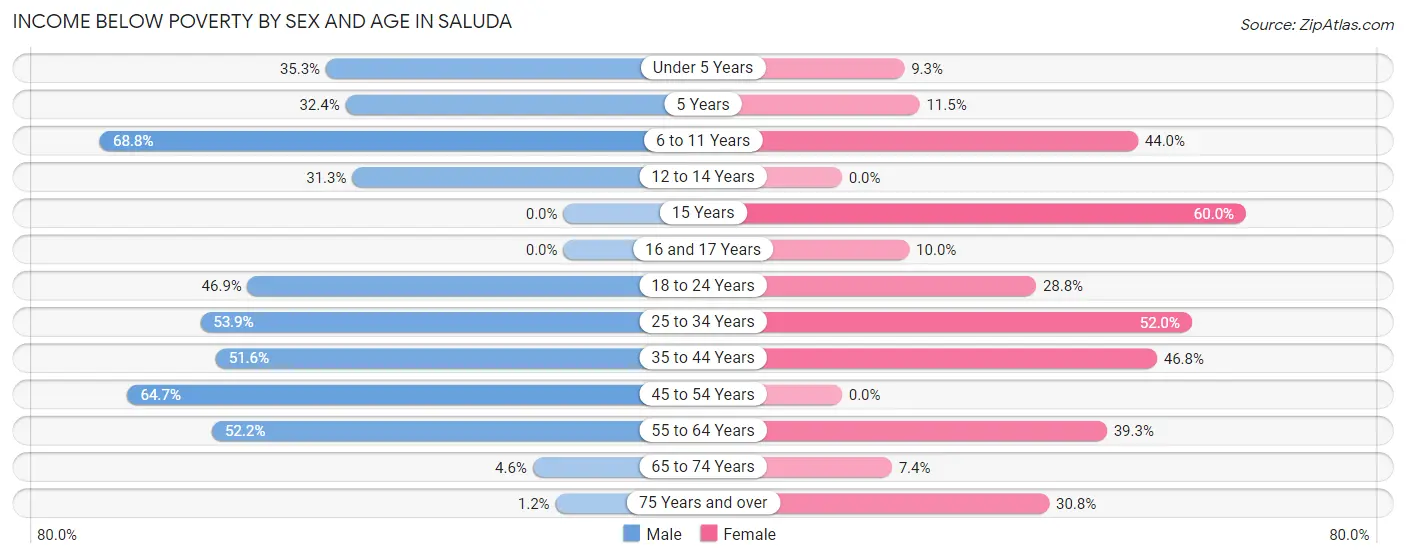
| Age Bracket | Male | Female |
| Under 5 Years | 86 (35.2%) | 14 (9.3%) |
| 5 Years | 11 (32.4%) | 3 (11.5%) |
| 6 to 11 Years | 194 (68.8%) | 40 (44.0%) |
| 12 to 14 Years | 21 (31.3%) | 0 (0.0%) |
| 15 Years | 0 (0.0%) | 6 (60.0%) |
| 16 and 17 Years | 0 (0.0%) | 3 (10.0%) |
| 18 to 24 Years | 75 (46.9%) | 32 (28.8%) |
| 25 to 34 Years | 62 (53.9%) | 105 (52.0%) |
| 35 to 44 Years | 193 (51.6%) | 80 (46.8%) |
| 45 to 54 Years | 143 (64.7%) | 0 (0.0%) |
| 55 to 64 Years | 84 (52.2%) | 48 (39.3%) |
| 65 to 74 Years | 5 (4.5%) | 10 (7.4%) |
| 75 Years and over | 1 (1.2%) | 36 (30.8%) |
| Total | 875 (46.6%) | 377 (30.2%) |
Income Above Poverty by Sex and Age in Saluda
According to the poverty statistics in Saluda, males aged 16 and 17 years and females aged 12 to 14 years are the age groups that are most secure financially, with 100.0% of males and 100.0% of females in these age groups living above the poverty line.
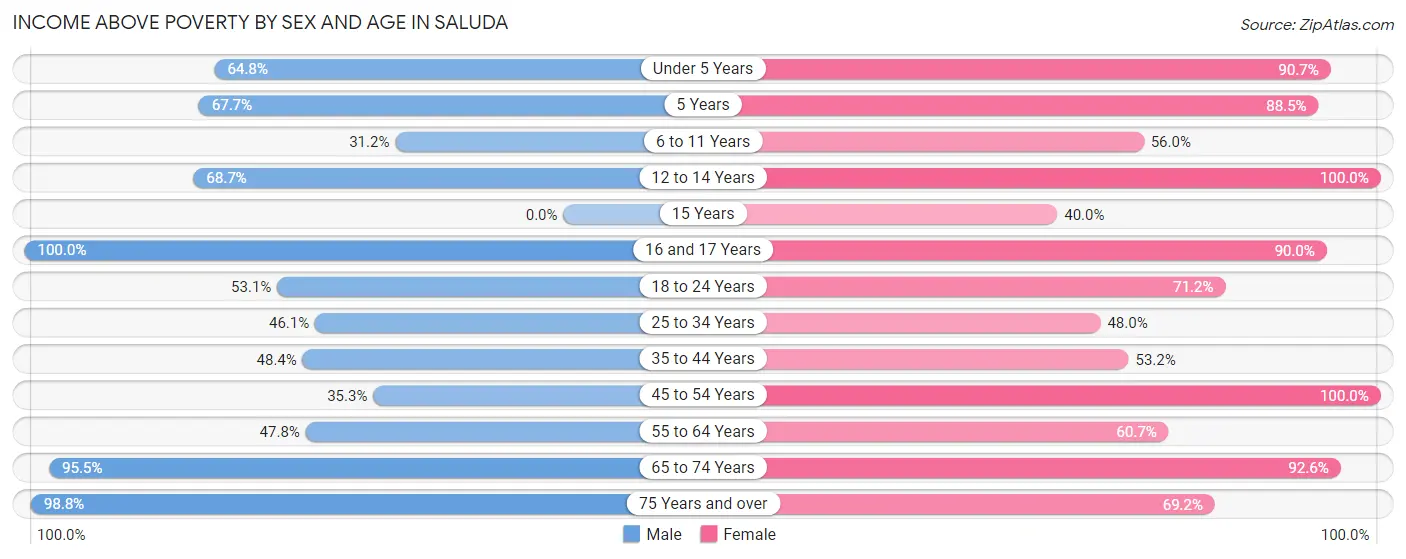
| Age Bracket | Male | Female |
| Under 5 Years | 158 (64.7%) | 137 (90.7%) |
| 5 Years | 23 (67.6%) | 23 (88.5%) |
| 6 to 11 Years | 88 (31.2%) | 51 (56.0%) |
| 12 to 14 Years | 46 (68.7%) | 6 (100.0%) |
| 15 Years | 0 (0.0%) | 4 (40.0%) |
| 16 and 17 Years | 24 (100.0%) | 27 (90.0%) |
| 18 to 24 Years | 85 (53.1%) | 79 (71.2%) |
| 25 to 34 Years | 53 (46.1%) | 97 (48.0%) |
| 35 to 44 Years | 181 (48.4%) | 91 (53.2%) |
| 45 to 54 Years | 78 (35.3%) | 75 (100.0%) |
| 55 to 64 Years | 77 (47.8%) | 74 (60.7%) |
| 65 to 74 Years | 105 (95.5%) | 125 (92.6%) |
| 75 Years and over | 84 (98.8%) | 81 (69.2%) |
| Total | 1,002 (53.4%) | 870 (69.8%) |
Income Below Poverty Among Married-Couple Families in Saluda
The poverty statistics for married-couple families in Saluda show that 48.0% or 221 of the total 460 families live below the poverty line. Families with 1 or 2 children have the highest poverty rate of 77.7%, comprising of 216 families. On the other hand, families with 5 or more children have the lowest poverty rate of 0.0%, which includes 0 families.
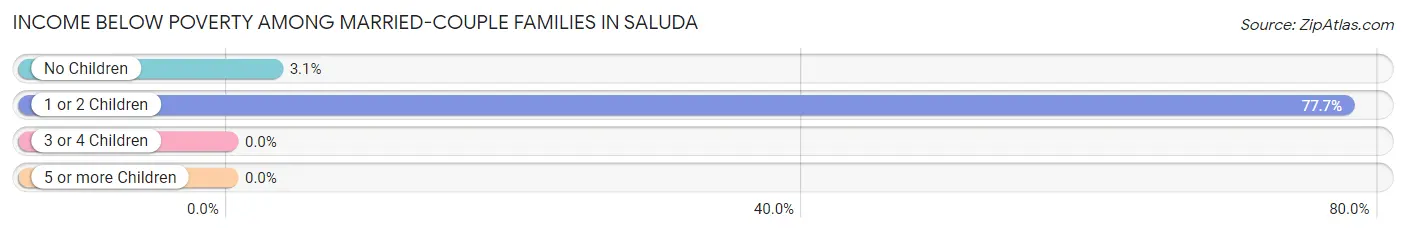
| Children | Above Poverty | Below Poverty |
| No Children | 156 (96.9%) | 5 (3.1%) |
| 1 or 2 Children | 62 (22.3%) | 216 (77.7%) |
| 3 or 4 Children | 0 (0.0%) | 0 (0.0%) |
| 5 or more Children | 21 (100.0%) | 0 (0.0%) |
| Total | 239 (52.0%) | 221 (48.0%) |
Income Below Poverty Among Single-Parent Households in Saluda
According to the poverty data in Saluda, 68.2% or 118 single-father households and 33.9% or 56 single-mother households are living below the poverty line. Among single-father households, those with 3 or 4 children have the highest poverty rate, with 3 households (100.0%) experiencing poverty. Likewise, among single-mother households, those with no children have the highest poverty rate, with 25 households (50.0%) falling below the poverty line.
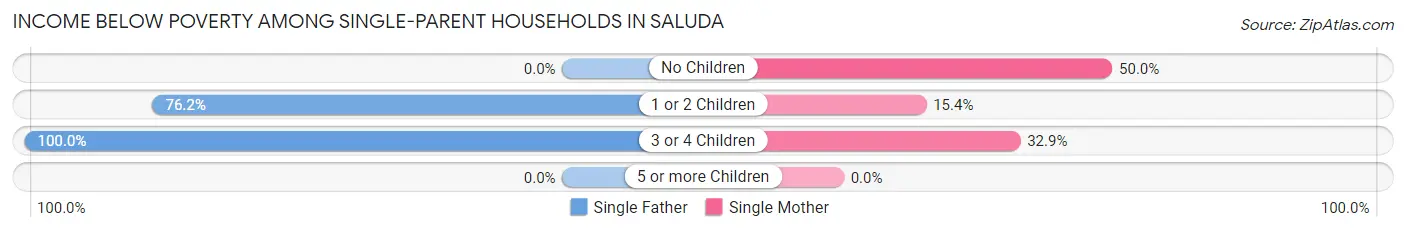
| Children | Single Father | Single Mother |
| No Children | 0 (0.0%) | 25 (50.0%) |
| 1 or 2 Children | 115 (76.2%) | 6 (15.4%) |
| 3 or 4 Children | 3 (100.0%) | 25 (32.9%) |
| 5 or more Children | 0 (0.0%) | 0 (0.0%) |
| Total | 118 (68.2%) | 56 (33.9%) |
Income Below Poverty Among Married-Couple vs Single-Parent Households in Saluda
The poverty data for Saluda shows that 221 of the married-couple family households (48.0%) and 174 of the single-parent households (51.5%) are living below the poverty level. Within the married-couple family households, those with 1 or 2 children have the highest poverty rate, with 216 households (77.7%) falling below the poverty line. Among the single-parent households, those with 1 or 2 children have the highest poverty rate, with 121 household (63.7%) living below poverty.
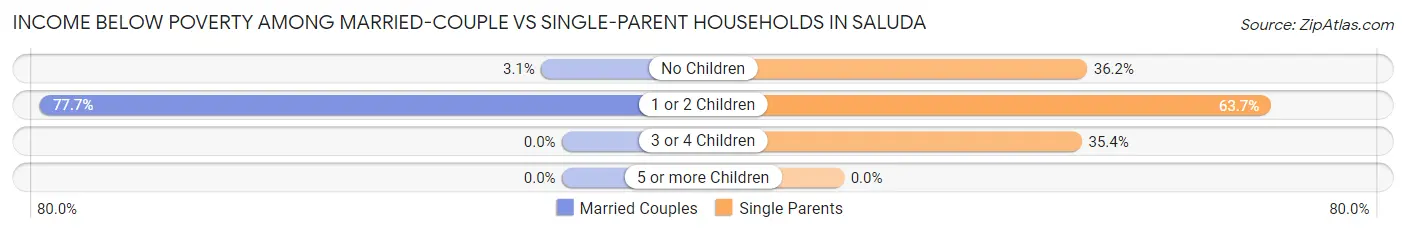
| Children | Married-Couple Families | Single-Parent Households |
| No Children | 5 (3.1%) | 25 (36.2%) |
| 1 or 2 Children | 216 (77.7%) | 121 (63.7%) |
| 3 or 4 Children | 0 (0.0%) | 28 (35.4%) |
| 5 or more Children | 0 (0.0%) | 0 (0.0%) |
| Total | 221 (48.0%) | 174 (51.5%) |
Race in Saluda
The most populous races in Saluda are Hispanic or Latino (1,663 | 53.2%), Two or more Races (1,219 | 39.0%), and Black / African American (929 | 29.7%).
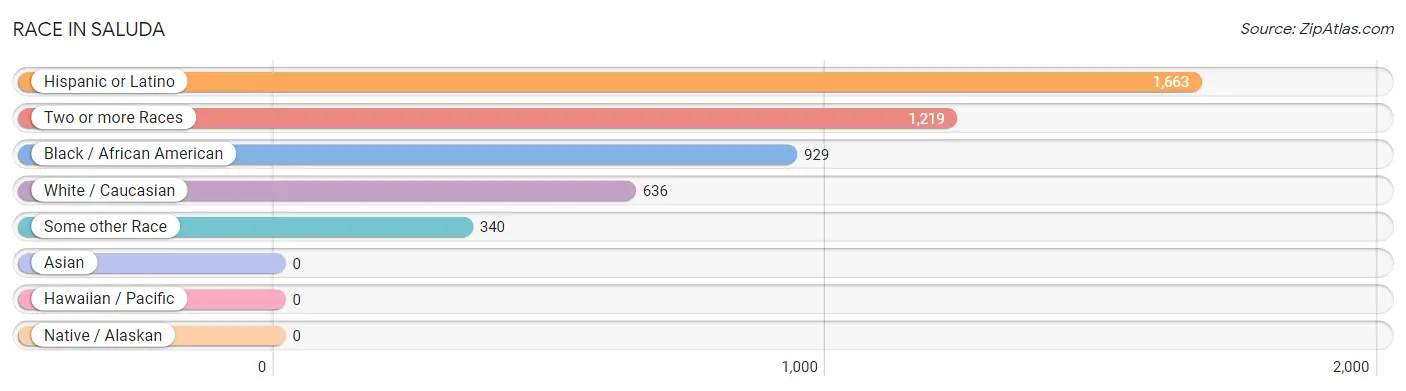
| Race | # Population | % Population |
| Asian | 0 | 0.0% |
| Black / African American | 929 | 29.7% |
| Hawaiian / Pacific | 0 | 0.0% |
| Hispanic or Latino | 1,663 | 53.2% |
| Native / Alaskan | 0 | 0.0% |
| White / Caucasian | 636 | 20.4% |
| Two or more Races | 1,219 | 39.0% |
| Some other Race | 340 | 10.9% |
| Total | 3,124 | 100.0% |
Ancestry in Saluda
The most populous ancestries reported in Saluda are Central American (1,073 | 34.4%), Guatemalan (1,073 | 34.4%), Mexican (590 | 18.9%), German (170 | 5.4%), and American (91 | 2.9%), together accounting for 95.9% of all Saluda residents.
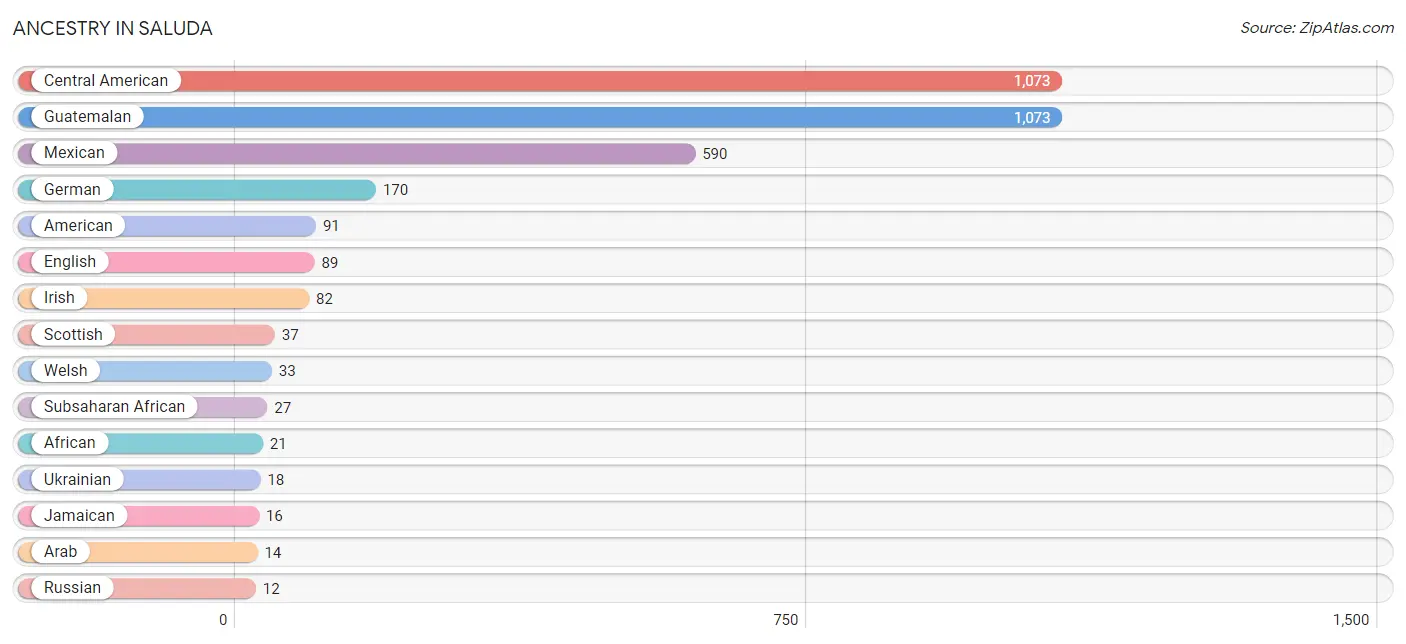
| Ancestry | # Population | % Population |
| African | 21 | 0.7% |
| American | 91 | 2.9% |
| Arab | 14 | 0.4% |
| Central American | 1,073 | 34.4% |
| English | 89 | 2.9% |
| French | 6 | 0.2% |
| German | 170 | 5.4% |
| Guatemalan | 1,073 | 34.4% |
| Irish | 82 | 2.6% |
| Jamaican | 16 | 0.5% |
| Mexican | 590 | 18.9% |
| Nigerian | 6 | 0.2% |
| Russian | 12 | 0.4% |
| Scotch-Irish | 7 | 0.2% |
| Scottish | 37 | 1.2% |
| Subsaharan African | 27 | 0.9% |
| Ukrainian | 18 | 0.6% |
| Welsh | 33 | 1.1% |
| West Indian | 5 | 0.2% | View All 19 Rows |
Immigrants in Saluda
The most numerous immigrant groups reported in Saluda came from Central America (553 | 17.7%), Latin America (553 | 17.7%), Mexico (282 | 9.0%), Guatemala (271 | 8.7%), and Eastern Europe (18 | 0.6%), together accounting for 53.7% of all Saluda residents.
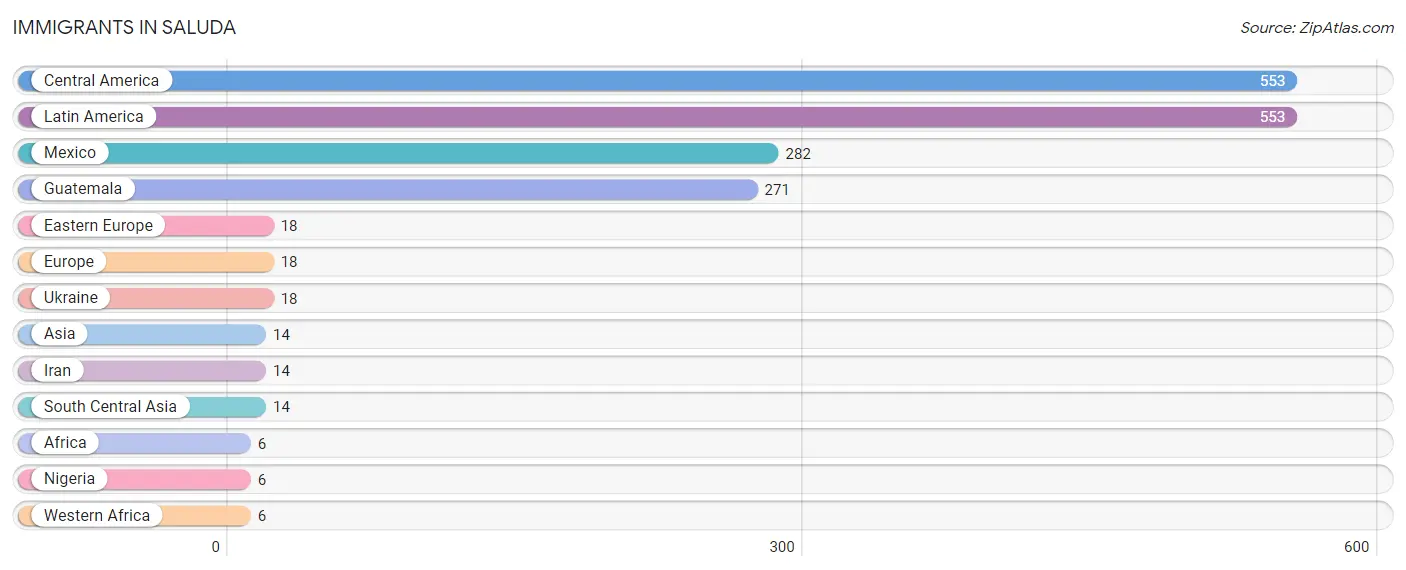
| Immigration Origin | # Population | % Population |
| Africa | 6 | 0.2% |
| Asia | 14 | 0.4% |
| Central America | 553 | 17.7% |
| Eastern Europe | 18 | 0.6% |
| Europe | 18 | 0.6% |
| Guatemala | 271 | 8.7% |
| Iran | 14 | 0.4% |
| Latin America | 553 | 17.7% |
| Mexico | 282 | 9.0% |
| Nigeria | 6 | 0.2% |
| South Central Asia | 14 | 0.4% |
| Ukraine | 18 | 0.6% |
| Western Africa | 6 | 0.2% | View All 13 Rows |
Sex and Age in Saluda
Sex and Age in Saluda
The most populous age groups in Saluda are 5 to 9 Years (316 | 16.8%) for men and Under 5 Years (151 | 12.1%) for women.
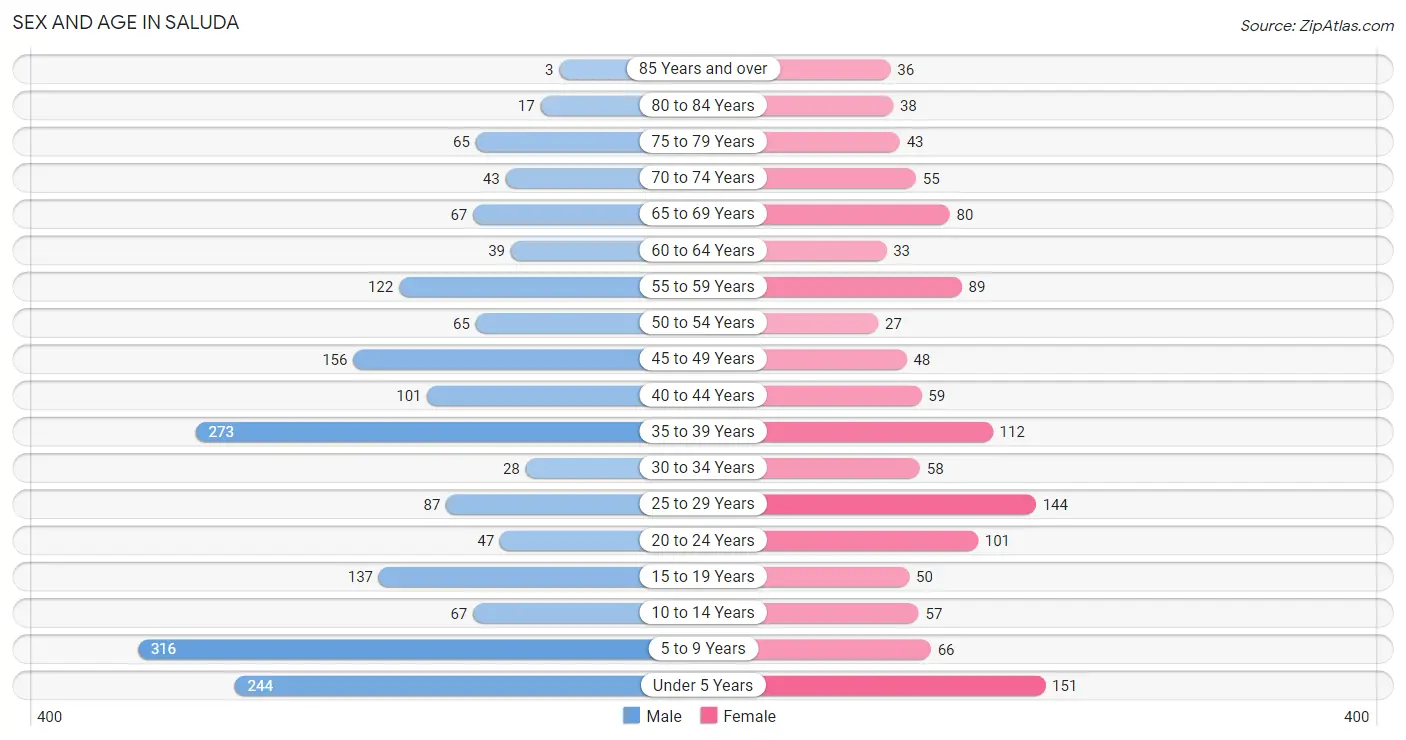
| Age Bracket | Male | Female |
| Under 5 Years | 244 (13.0%) | 151 (12.1%) |
| 5 to 9 Years | 316 (16.8%) | 66 (5.3%) |
| 10 to 14 Years | 67 (3.6%) | 57 (4.6%) |
| 15 to 19 Years | 137 (7.3%) | 50 (4.0%) |
| 20 to 24 Years | 47 (2.5%) | 101 (8.1%) |
| 25 to 29 Years | 87 (4.6%) | 144 (11.6%) |
| 30 to 34 Years | 28 (1.5%) | 58 (4.6%) |
| 35 to 39 Years | 273 (14.5%) | 112 (9.0%) |
| 40 to 44 Years | 101 (5.4%) | 59 (4.7%) |
| 45 to 49 Years | 156 (8.3%) | 48 (3.8%) |
| 50 to 54 Years | 65 (3.5%) | 27 (2.2%) |
| 55 to 59 Years | 122 (6.5%) | 89 (7.1%) |
| 60 to 64 Years | 39 (2.1%) | 33 (2.6%) |
| 65 to 69 Years | 67 (3.6%) | 80 (6.4%) |
| 70 to 74 Years | 43 (2.3%) | 55 (4.4%) |
| 75 to 79 Years | 65 (3.5%) | 43 (3.5%) |
| 80 to 84 Years | 17 (0.9%) | 38 (3.0%) |
| 85 Years and over | 3 (0.2%) | 36 (2.9%) |
| Total | 1,877 (100.0%) | 1,247 (100.0%) |
Families and Households in Saluda
Median Family Size in Saluda
The median family size in Saluda is 3.34 persons per family, with single female/mother families (165 | 20.7%) accounting for the largest median family size of 4.46 persons per family. On the other hand, married-couple families (460 | 57.6%) represent the smallest median family size with 2.98 persons per family.
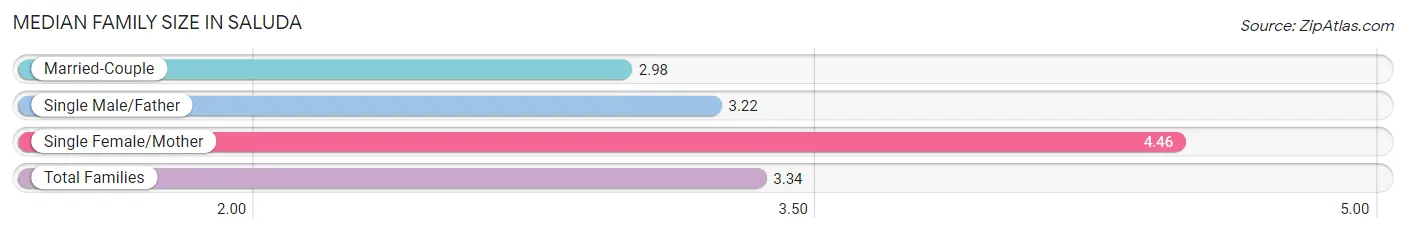
| Family Type | # Families | Family Size |
| Married-Couple | 460 (57.6%) | 2.98 |
| Single Male/Father | 173 (21.7%) | 3.22 |
| Single Female/Mother | 165 (20.7%) | 4.46 |
| Total Families | 798 (100.0%) | 3.34 |
Median Household Size in Saluda
The median household size in Saluda is 2.65 persons per household, with single female/mother households (165 | 14.0%) accounting for the largest median household size of 4.67 persons per household. non-family households (378 | 32.1%) represent the smallest median household size with 1.03 persons per household.
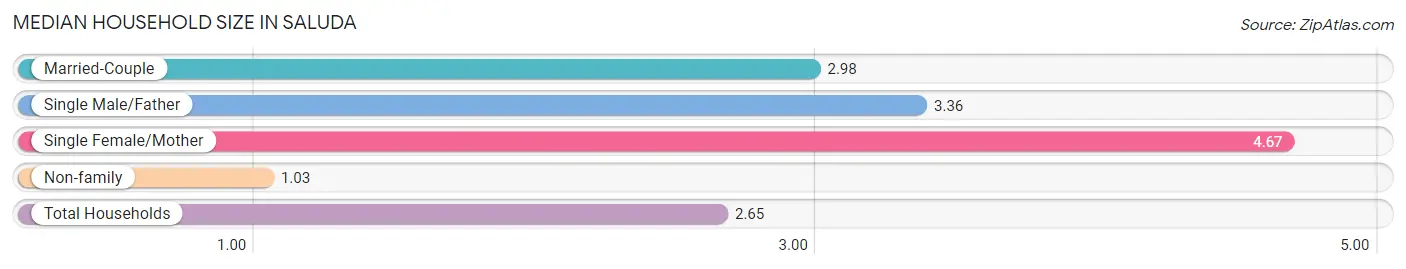
| Household Type | # Households | Household Size |
| Married-Couple | 460 (39.1%) | 2.98 |
| Single Male/Father | 173 (14.7%) | 3.36 |
| Single Female/Mother | 165 (14.0%) | 4.67 |
| Non-family | 378 (32.1%) | 1.03 |
| Total Households | 1,176 (100.0%) | 2.65 |
Household Size by Marriage Status in Saluda
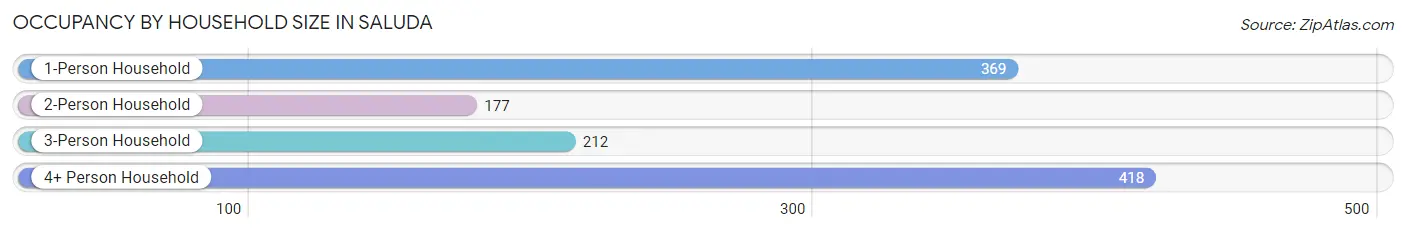
Out of a total of 1,176 households in Saluda, 798 (67.9%) are family households, while 378 (32.1%) are nonfamily households. The most numerous type of family households are 3-person households, comprising 212, and the most common type of nonfamily households are 1-person households, comprising 369.
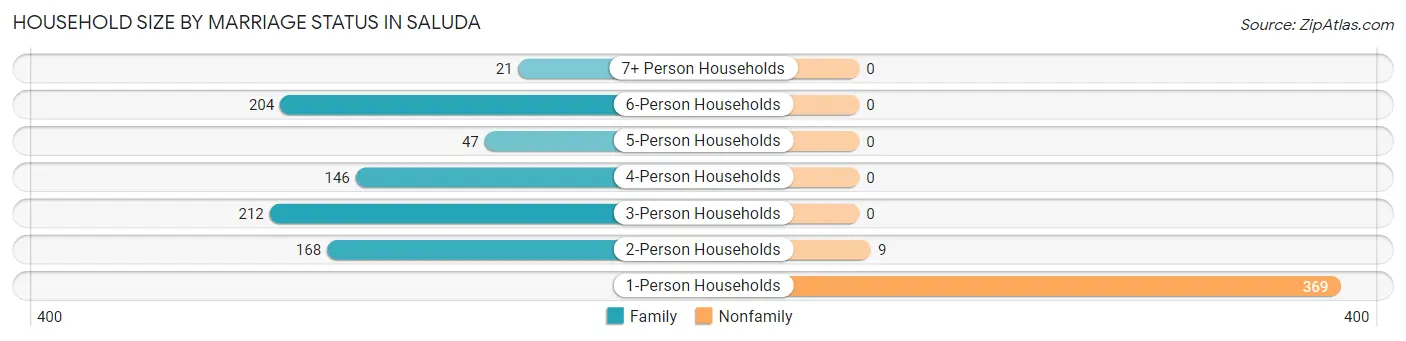
| Household Size | Family Households | Nonfamily Households |
| 1-Person Households | - | 369 (31.4%) |
| 2-Person Households | 168 (14.3%) | 9 (0.8%) |
| 3-Person Households | 212 (18.0%) | 0 (0.0%) |
| 4-Person Households | 146 (12.4%) | 0 (0.0%) |
| 5-Person Households | 47 (4.0%) | 0 (0.0%) |
| 6-Person Households | 204 (17.3%) | 0 (0.0%) |
| 7+ Person Households | 21 (1.8%) | 0 (0.0%) |
| Total | 798 (67.9%) | 378 (32.1%) |
Female Fertility in Saluda
Fertility by Age in Saluda
Average fertility rate in Saluda is 105.0 births per 1,000 women. Women in the age bracket of 20 to 34 years have the highest fertility rate with 132.0 births per 1,000 women. Women in the age bracket of 20 to 34 years acount for 65.6% of all women with births.
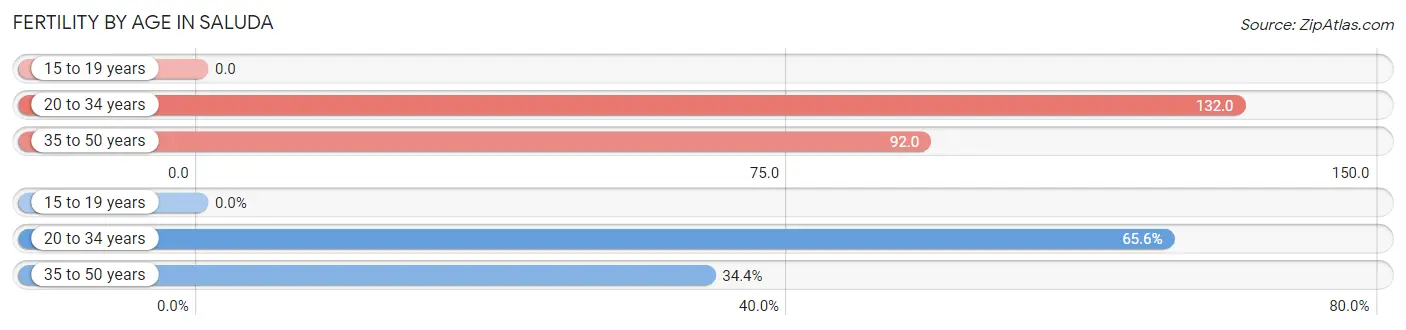
| Age Bracket | Women with Births | Births / 1,000 Women |
| 15 to 19 years | 0 (0.0%) | 0.0 |
| 20 to 34 years | 40 (65.6%) | 132.0 |
| 35 to 50 years | 21 (34.4%) | 92.0 |
| Total | 61 (100.0%) | 105.0 |
Fertility by Age by Marriage Status in Saluda
34.4% of women with births (61) in Saluda are married. The highest percentage of unmarried women with births falls into 20 to 34 years age bracket with 100.0% of them unmarried at the time of birth, while the lowest percentage of unmarried women with births belong to 35 to 50 years age bracket with 0.0% of them unmarried.
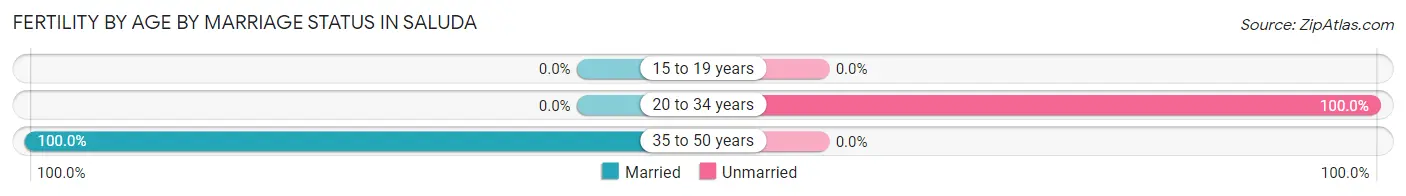
| Age Bracket | Married | Unmarried |
| 15 to 19 years | 0 (0.0%) | 0 (0.0%) |
| 20 to 34 years | 0 (0.0%) | 40 (100.0%) |
| 35 to 50 years | 21 (100.0%) | 0 (0.0%) |
| Total | 21 (34.4%) | 40 (65.6%) |
Fertility by Education in Saluda
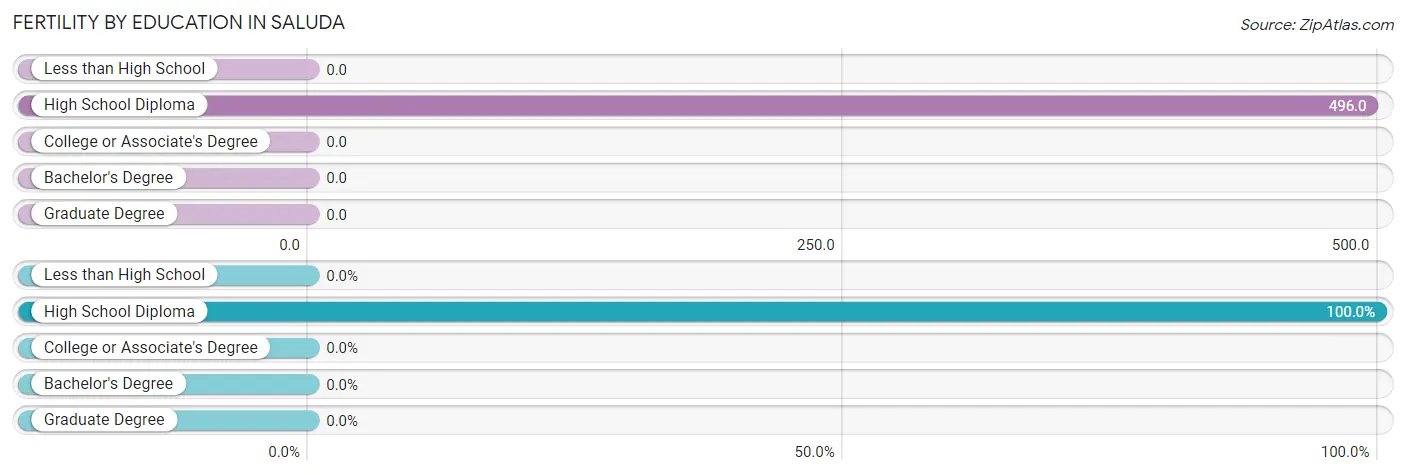
| Educational Attainment | Women with Births | Births / 1,000 Women |
| Less than High School | 0 (0.0%) | 0.0 |
| High School Diploma | 61 (100.0%) | 496.0 |
| College or Associate's Degree | 0 (0.0%) | 0.0 |
| Bachelor's Degree | 0 (0.0%) | 0.0 |
| Graduate Degree | 0 (0.0%) | 0.0 |
| Total | 61 (100.0%) | 105.0 |
Fertility by Education by Marriage Status in Saluda
65.6% of women with births in Saluda are unmarried. Women with the educational attainment of high school diploma are most likely to be married with 34.4% of them married at childbirth, while women with the educational attainment of high school diploma are least likely to be married with 65.6% of them unmarried at childbirth.
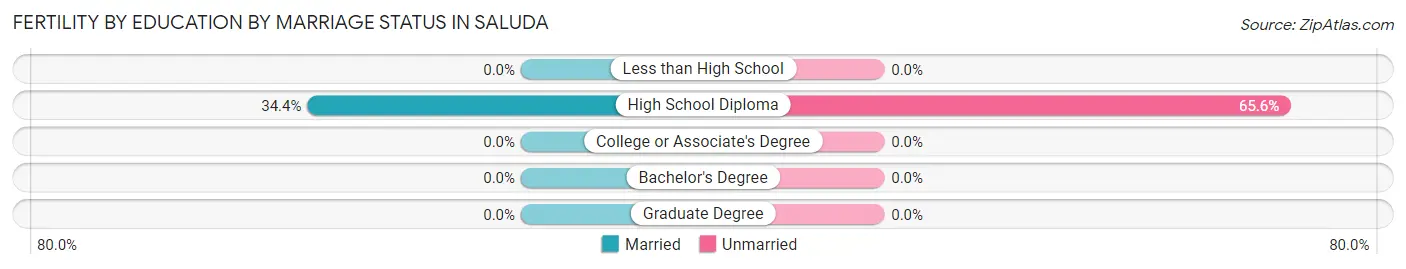
| Educational Attainment | Married | Unmarried |
| Less than High School | 0 (0.0%) | 0 (0.0%) |
| High School Diploma | 21 (34.4%) | 40 (65.6%) |
| College or Associate's Degree | 0 (0.0%) | 0 (0.0%) |
| Bachelor's Degree | 0 (0.0%) | 0 (0.0%) |
| Graduate Degree | 0 (0.0%) | 0 (0.0%) |
| Total | 21 (34.4%) | 40 (65.6%) |
Employment Characteristics in Saluda
Employment by Class of Employer in Saluda
Among the 1,039 employed individuals in Saluda, private company employees (675 | 65.0%), self-employed (not incorporated) (234 | 22.5%), and not-for-profit organizations (72 | 6.9%) make up the most common classes of employment.
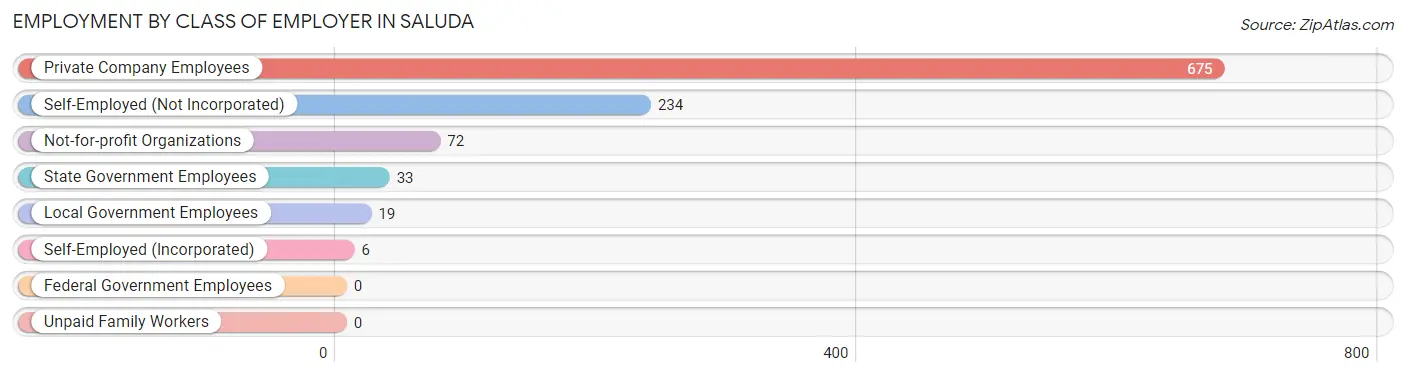
| Employer Class | # Employees | % Employees |
| Private Company Employees | 675 | 65.0% |
| Self-Employed (Incorporated) | 6 | 0.6% |
| Self-Employed (Not Incorporated) | 234 | 22.5% |
| Not-for-profit Organizations | 72 | 6.9% |
| Local Government Employees | 19 | 1.8% |
| State Government Employees | 33 | 3.2% |
| Federal Government Employees | 0 | 0.0% |
| Unpaid Family Workers | 0 | 0.0% |
| Total | 1,039 | 100.0% |
Employment Status by Age in Saluda
According to the labor force statistics for Saluda, out of the total population over 16 years of age (2,213), 53.8% or 1,191 individuals are in the labor force, with 4.6% or 55 of them unemployed. The age group with the highest labor force participation rate is 25 to 29 years, with 90.0% or 208 individuals in the labor force. Within the labor force, the 20 to 24 years age range has the highest percentage of unemployed individuals, with 22.3% or 27 of them being unemployed.
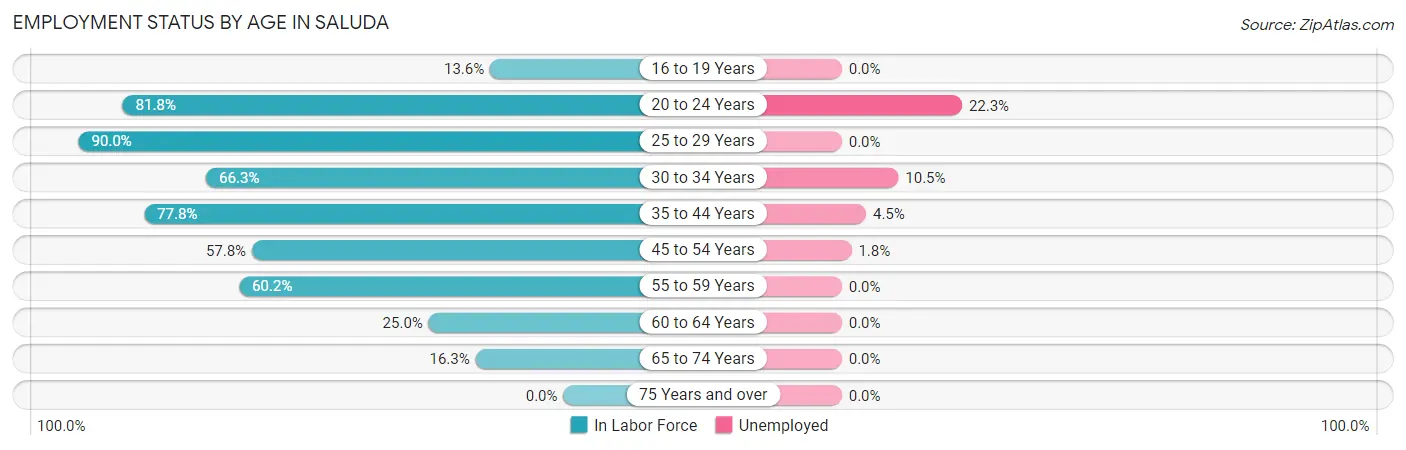
| Age Bracket | In Labor Force | Unemployed |
| 16 to 19 Years | 24 (13.6%) | 0 (0.0%) |
| 20 to 24 Years | 121 (81.8%) | 27 (22.3%) |
| 25 to 29 Years | 208 (90.0%) | 0 (0.0%) |
| 30 to 34 Years | 57 (66.3%) | 6 (10.5%) |
| 35 to 44 Years | 424 (77.8%) | 19 (4.5%) |
| 45 to 54 Years | 171 (57.8%) | 3 (1.8%) |
| 55 to 59 Years | 127 (60.2%) | 0 (0.0%) |
| 60 to 64 Years | 18 (25.0%) | 0 (0.0%) |
| 65 to 74 Years | 40 (16.3%) | 0 (0.0%) |
| 75 Years and over | 0 (0.0%) | 0 (0.0%) |
| Total | 1,191 (53.8%) | 55 (4.6%) |
Employment Status by Educational Attainment in Saluda
According to labor force statistics for Saluda, 69.7% of individuals (1,004) out of the total population between 25 and 64 years of age (1,441) are in the labor force, with 2.8% or 28 of them being unemployed. The group with the highest labor force participation rate are those with the educational attainment of college / associate degree, with 82.4% or 416 individuals in the labor force. Within the labor force, individuals with less than high school education have the highest percentage of unemployment, with 5.1% or 13 of them being unemployed.
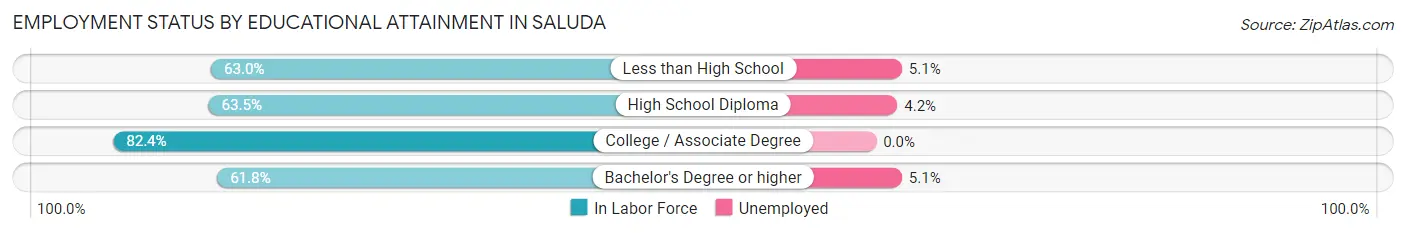
| Educational Attainment | In Labor Force | Unemployed |
| Less than High School | 255 (63.0%) | 21 (5.1%) |
| High School Diploma | 216 (63.5%) | 14 (4.2%) |
| College / Associate Degree | 416 (82.4%) | 0 (0.0%) |
| Bachelor's Degree or higher | 118 (61.8%) | 10 (5.1%) |
| Total | 1,004 (69.7%) | 40 (2.8%) |
Employment Occupations by Sex in Saluda
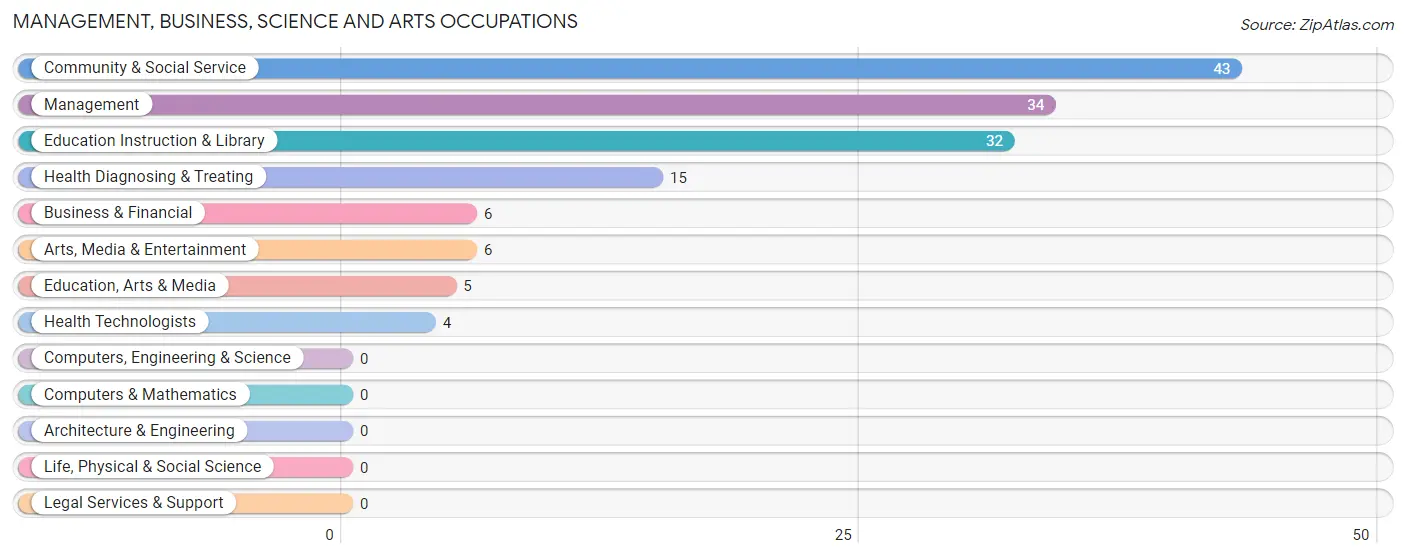
Management, Business, Science and Arts Occupations
The most common Management, Business, Science and Arts occupations in Saluda are Community & Social Service (43 | 3.8%), Management (34 | 3.0%), Education Instruction & Library (32 | 2.8%), Health Diagnosing & Treating (15 | 1.3%), and Business & Financial (6 | 0.5%).
Management, Business, Science and Arts Occupations by Sex
Within the Management, Business, Science and Arts occupations in Saluda, the most male-oriented occupations are Management (76.5%), Health Technologists (50.0%), and Education Instruction & Library (46.9%), while the most female-oriented occupations are Business & Financial (100.0%), Education, Arts & Media (100.0%), and Arts, Media & Entertainment (100.0%).
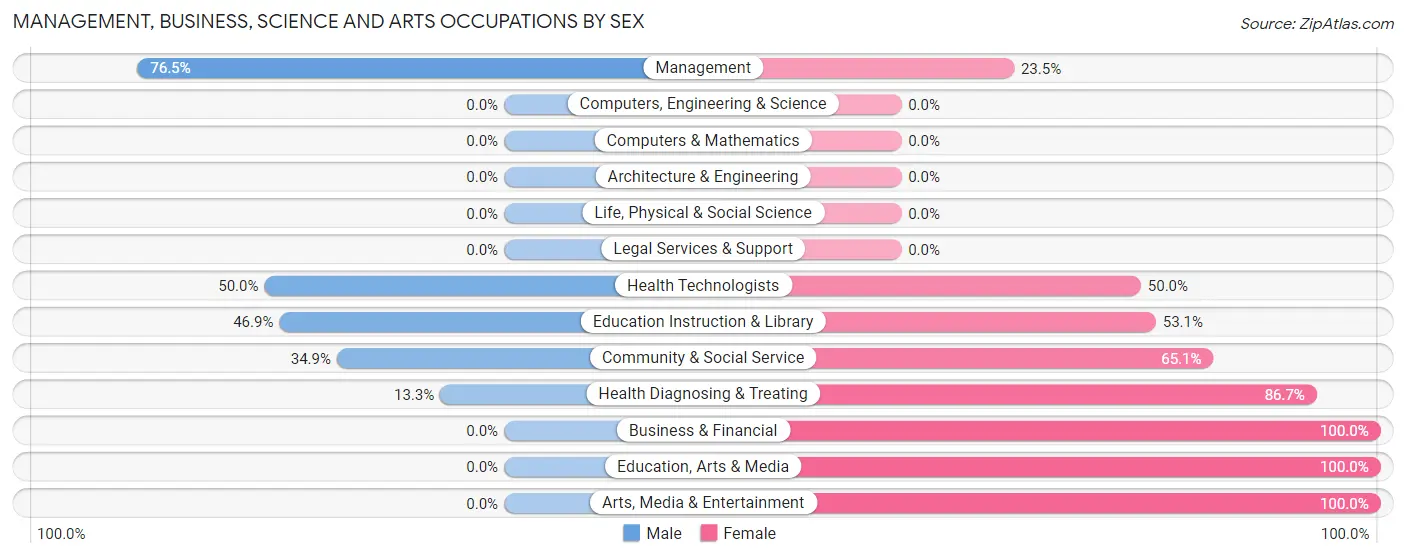
| Occupation | Male | Female |
| Management | 26 (76.5%) | 8 (23.5%) |
| Business & Financial | 0 (0.0%) | 6 (100.0%) |
| Computers, Engineering & Science | 0 (0.0%) | 0 (0.0%) |
| Computers & Mathematics | 0 (0.0%) | 0 (0.0%) |
| Architecture & Engineering | 0 (0.0%) | 0 (0.0%) |
| Life, Physical & Social Science | 0 (0.0%) | 0 (0.0%) |
| Community & Social Service | 15 (34.9%) | 28 (65.1%) |
| Education, Arts & Media | 0 (0.0%) | 5 (100.0%) |
| Legal Services & Support | 0 (0.0%) | 0 (0.0%) |
| Education Instruction & Library | 15 (46.9%) | 17 (53.1%) |
| Arts, Media & Entertainment | 0 (0.0%) | 6 (100.0%) |
| Health Diagnosing & Treating | 2 (13.3%) | 13 (86.7%) |
| Health Technologists | 2 (50.0%) | 2 (50.0%) |
| Total (Category) | 43 (43.9%) | 55 (56.1%) |
| Total (Overall) | 789 (69.5%) | 346 (30.5%) |
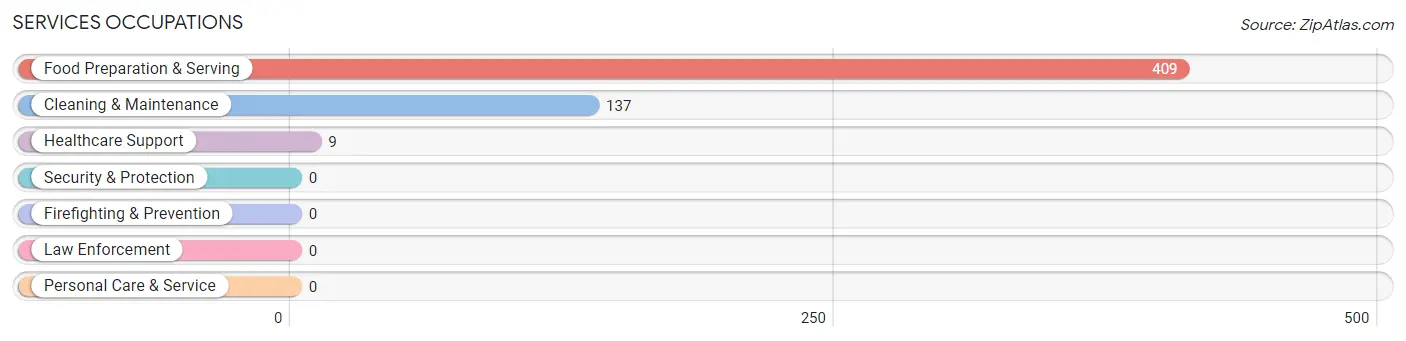
Services Occupations
The most common Services occupations in Saluda are Food Preparation & Serving (409 | 36.0%), Cleaning & Maintenance (137 | 12.1%), and Healthcare Support (9 | 0.8%).
Services Occupations by Sex
Within the Services occupations in Saluda, the most male-oriented occupations are Cleaning & Maintenance (83.9%), and Food Preparation & Serving (83.6%), while the most female-oriented occupations are Healthcare Support (100.0%), Food Preparation & Serving (16.4%), and Cleaning & Maintenance (16.1%).
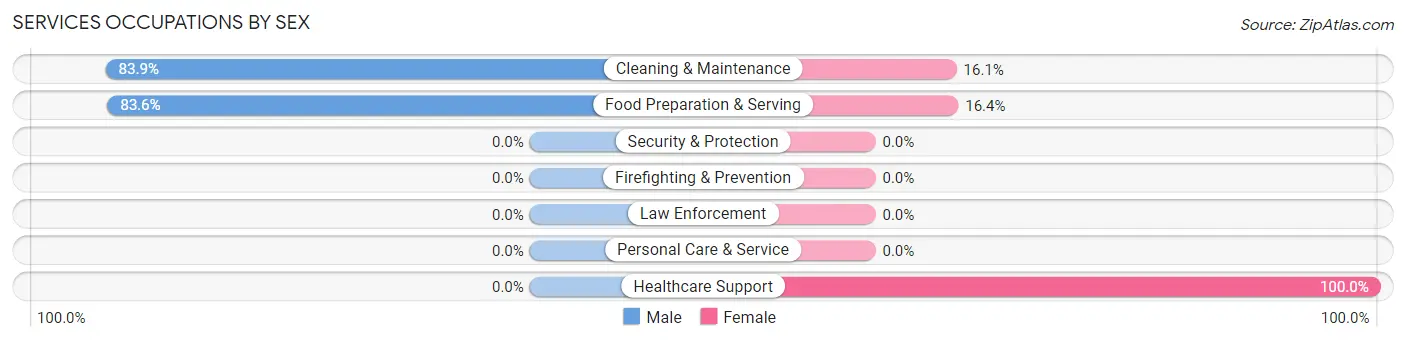
| Occupation | Male | Female |
| Healthcare Support | 0 (0.0%) | 9 (100.0%) |
| Security & Protection | 0 (0.0%) | 0 (0.0%) |
| Firefighting & Prevention | 0 (0.0%) | 0 (0.0%) |
| Law Enforcement | 0 (0.0%) | 0 (0.0%) |
| Food Preparation & Serving | 342 (83.6%) | 67 (16.4%) |
| Cleaning & Maintenance | 115 (83.9%) | 22 (16.1%) |
| Personal Care & Service | 0 (0.0%) | 0 (0.0%) |
| Total (Category) | 457 (82.3%) | 98 (17.7%) |
| Total (Overall) | 789 (69.5%) | 346 (30.5%) |
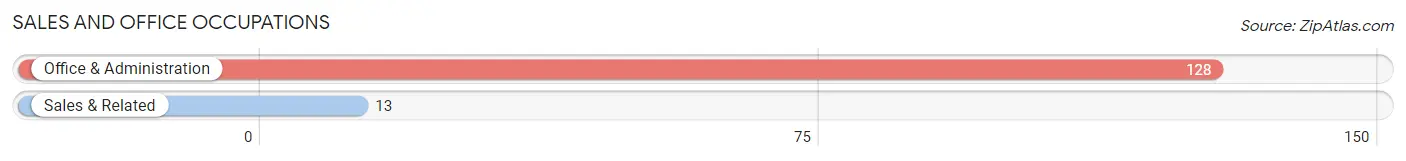
Sales and Office Occupations
The most common Sales and Office occupations in Saluda are Office & Administration (128 | 11.3%), and Sales & Related (13 | 1.1%).
Sales and Office Occupations by Sex
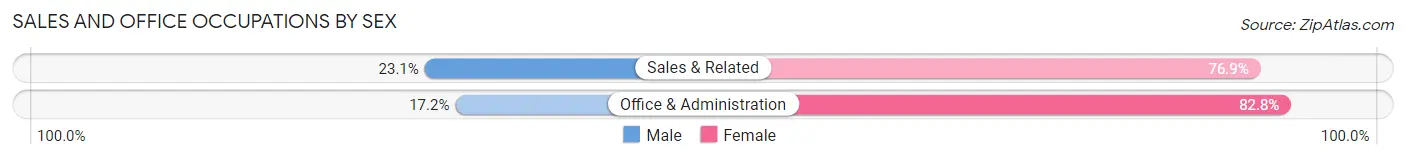
| Occupation | Male | Female |
| Sales & Related | 3 (23.1%) | 10 (76.9%) |
| Office & Administration | 22 (17.2%) | 106 (82.8%) |
| Total (Category) | 25 (17.7%) | 116 (82.3%) |
| Total (Overall) | 789 (69.5%) | 346 (30.5%) |
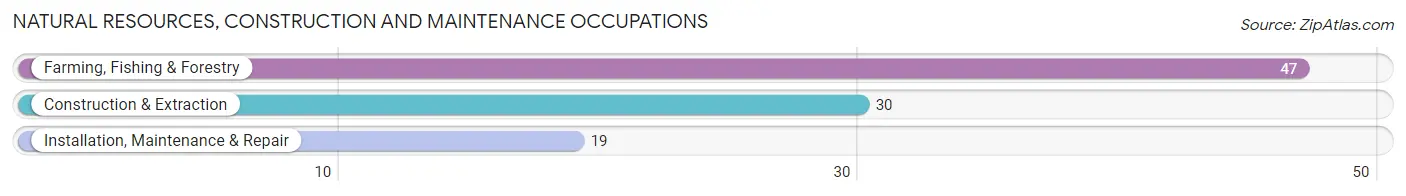
Natural Resources, Construction and Maintenance Occupations
The most common Natural Resources, Construction and Maintenance occupations in Saluda are Farming, Fishing & Forestry (47 | 4.1%), Construction & Extraction (30 | 2.6%), and Installation, Maintenance & Repair (19 | 1.7%).
Natural Resources, Construction and Maintenance Occupations by Sex
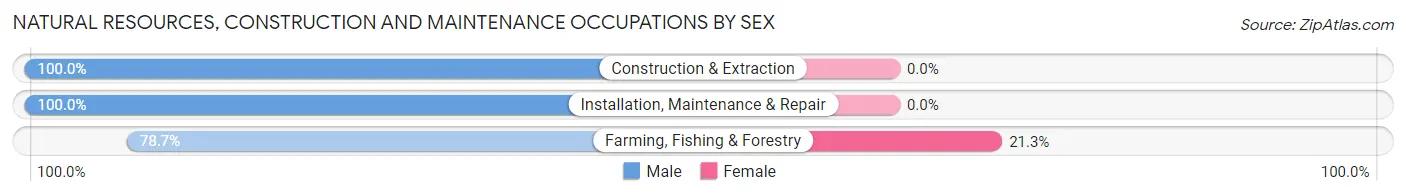
| Occupation | Male | Female |
| Farming, Fishing & Forestry | 37 (78.7%) | 10 (21.3%) |
| Construction & Extraction | 30 (100.0%) | 0 (0.0%) |
| Installation, Maintenance & Repair | 19 (100.0%) | 0 (0.0%) |
| Total (Category) | 86 (89.6%) | 10 (10.4%) |
| Total (Overall) | 789 (69.5%) | 346 (30.5%) |
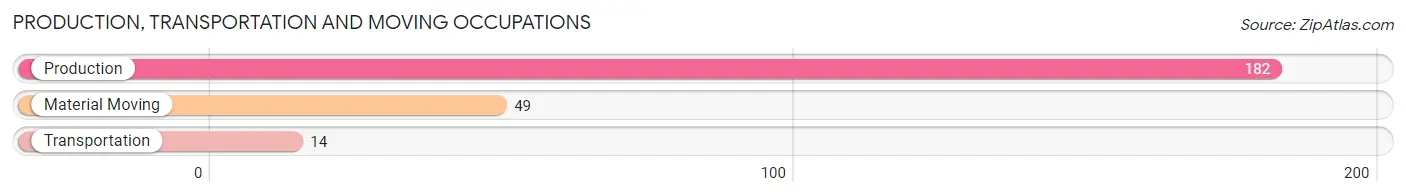
Production, Transportation and Moving Occupations
The most common Production, Transportation and Moving occupations in Saluda are Production (182 | 16.0%), Material Moving (49 | 4.3%), and Transportation (14 | 1.2%).
Production, Transportation and Moving Occupations by Sex
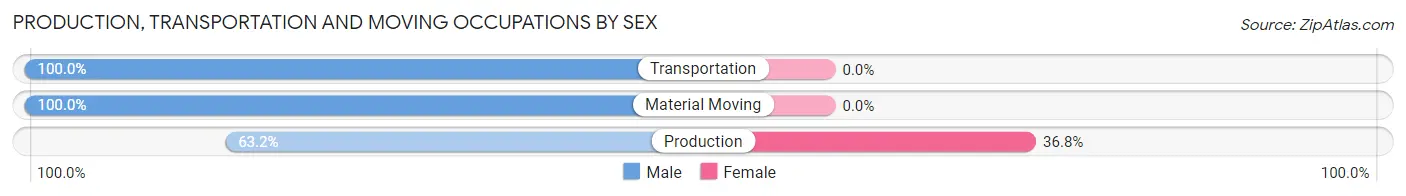
| Occupation | Male | Female |
| Production | 115 (63.2%) | 67 (36.8%) |
| Transportation | 14 (100.0%) | 0 (0.0%) |
| Material Moving | 49 (100.0%) | 0 (0.0%) |
| Total (Category) | 178 (72.7%) | 67 (27.4%) |
| Total (Overall) | 789 (69.5%) | 346 (30.5%) |
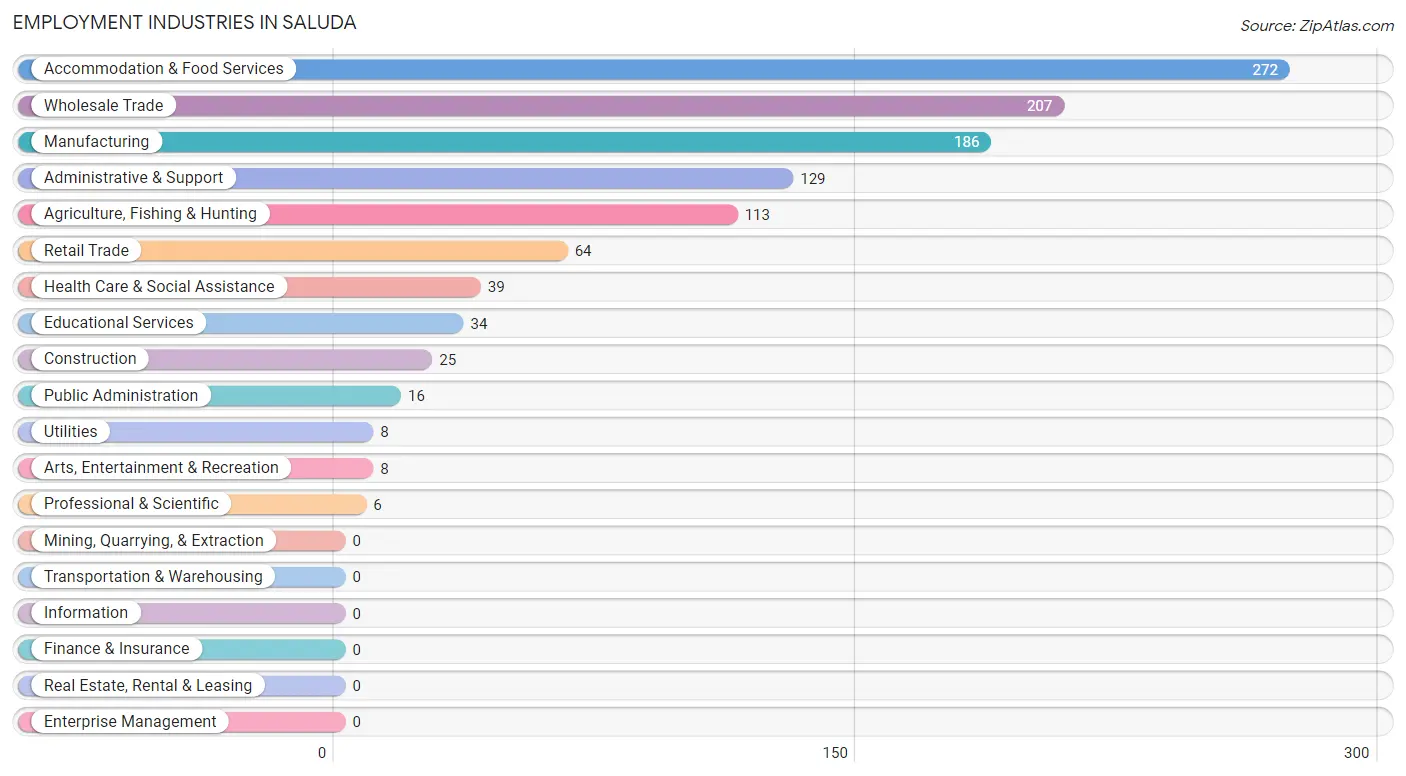
Employment Industries by Sex in Saluda
Employment Industries in Saluda
The major employment industries in Saluda include Accommodation & Food Services (272 | 24.0%), Wholesale Trade (207 | 18.2%), Manufacturing (186 | 16.4%), Administrative & Support (129 | 11.4%), and Agriculture, Fishing & Hunting (113 | 10.0%).
Employment Industries by Sex in Saluda
The Saluda industries that see more men than women are Construction (100.0%), Arts, Entertainment & Recreation (100.0%), and Accommodation & Food Services (99.3%), whereas the industries that tend to have a higher number of women are Utilities (100.0%), Professional & Scientific (100.0%), and Public Administration (100.0%).
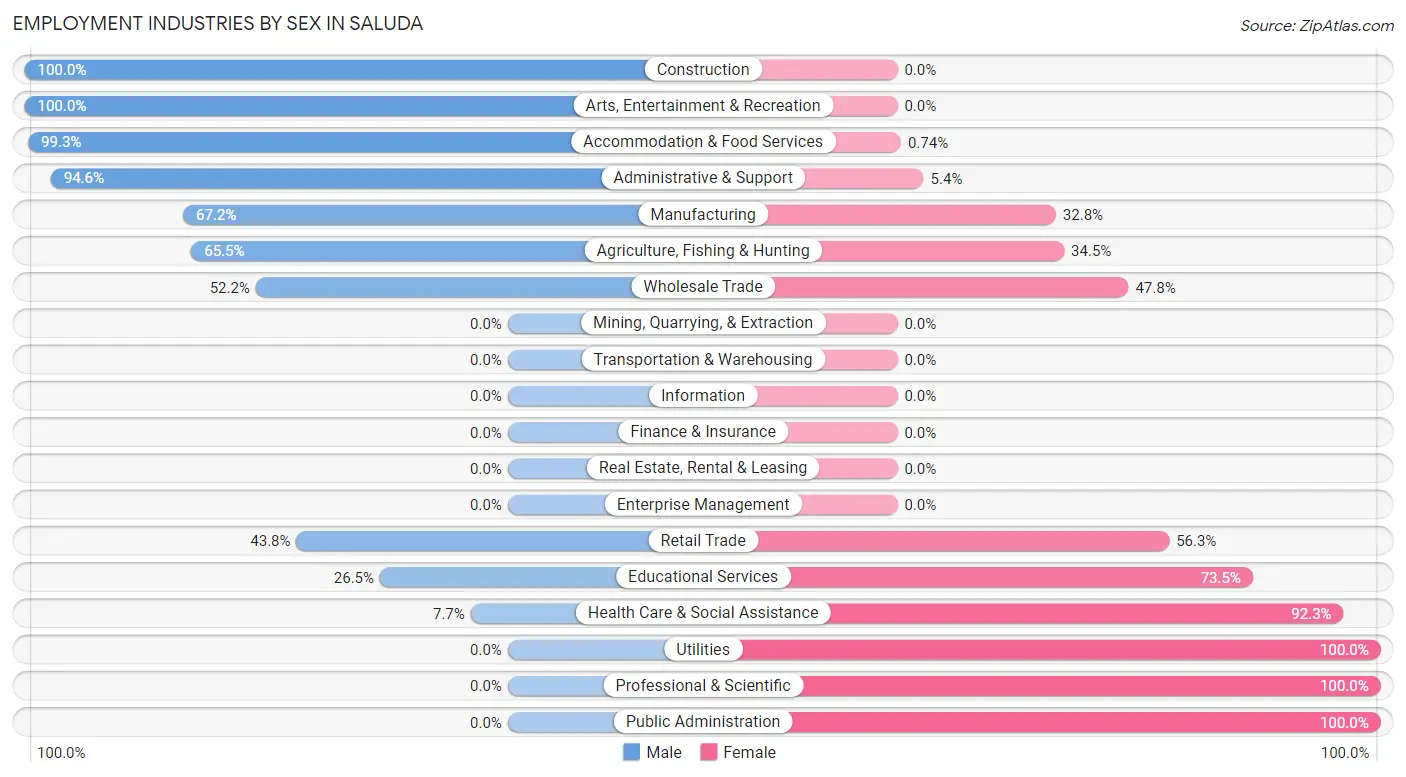
| Industry | Male | Female |
| Agriculture, Fishing & Hunting | 74 (65.5%) | 39 (34.5%) |
| Mining, Quarrying, & Extraction | 0 (0.0%) | 0 (0.0%) |
| Construction | 25 (100.0%) | 0 (0.0%) |
| Manufacturing | 125 (67.2%) | 61 (32.8%) |
| Wholesale Trade | 108 (52.2%) | 99 (47.8%) |
| Retail Trade | 28 (43.8%) | 36 (56.2%) |
| Transportation & Warehousing | 0 (0.0%) | 0 (0.0%) |
| Utilities | 0 (0.0%) | 8 (100.0%) |
| Information | 0 (0.0%) | 0 (0.0%) |
| Finance & Insurance | 0 (0.0%) | 0 (0.0%) |
| Real Estate, Rental & Leasing | 0 (0.0%) | 0 (0.0%) |
| Professional & Scientific | 0 (0.0%) | 6 (100.0%) |
| Enterprise Management | 0 (0.0%) | 0 (0.0%) |
| Administrative & Support | 122 (94.6%) | 7 (5.4%) |
| Educational Services | 9 (26.5%) | 25 (73.5%) |
| Health Care & Social Assistance | 3 (7.7%) | 36 (92.3%) |
| Arts, Entertainment & Recreation | 8 (100.0%) | 0 (0.0%) |
| Accommodation & Food Services | 270 (99.3%) | 2 (0.7%) |
| Public Administration | 0 (0.0%) | 16 (100.0%) |
| Total | 789 (69.5%) | 346 (30.5%) |
Education in Saluda
School Enrollment in Saluda
The most common levels of schooling among the 698 students in Saluda are elementary school (252 | 36.1%), high school (161 | 23.1%), and kindergarten (116 | 16.6%).
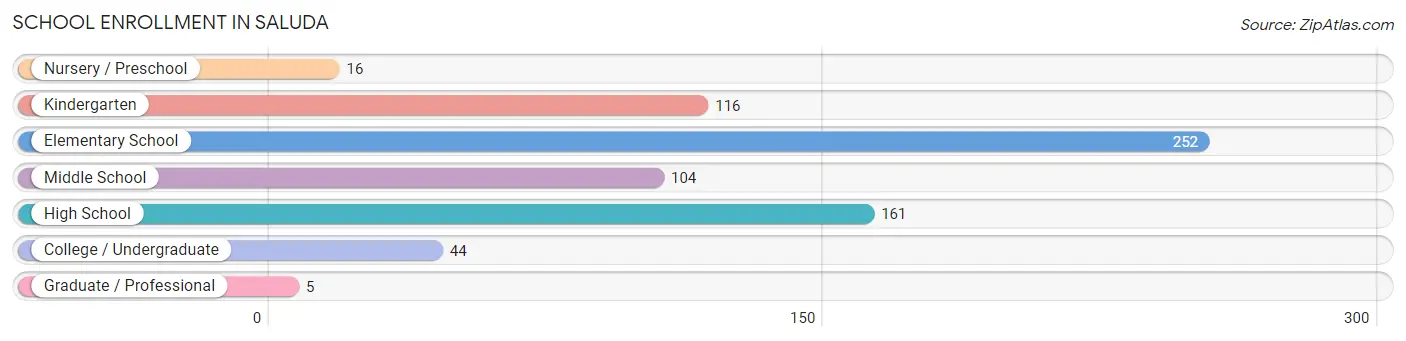
| School Level | # Students | % Students |
| Nursery / Preschool | 16 | 2.3% |
| Kindergarten | 116 | 16.6% |
| Elementary School | 252 | 36.1% |
| Middle School | 104 | 14.9% |
| High School | 161 | 23.1% |
| College / Undergraduate | 44 | 6.3% |
| Graduate / Professional | 5 | 0.7% |
| Total | 698 | 100.0% |
School Enrollment by Age by Funding Source in Saluda
Out of a total of 698 students who are enrolled in schools in Saluda, 24 (3.4%) attend a private institution, while the remaining 674 (96.6%) are enrolled in public schools. The age group of 35 years and over has the highest likelihood of being enrolled in private schools, with 16 (76.2% in the age bracket) enrolled. Conversely, the age group of 3 to 4 year olds has the lowest likelihood of being enrolled in a private school, with 21 (100.0% in the age bracket) attending a public institution.
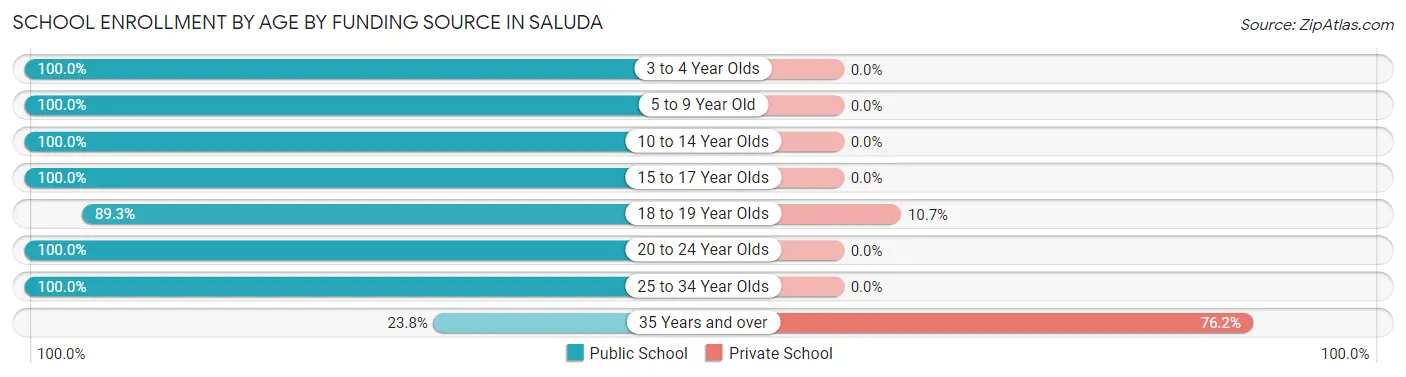
| Age Bracket | Public School | Private School |
| 3 to 4 Year Olds | 21 (100.0%) | 0 (0.0%) |
| 5 to 9 Year Old | 379 (100.0%) | 0 (0.0%) |
| 10 to 14 Year Olds | 110 (100.0%) | 0 (0.0%) |
| 15 to 17 Year Olds | 64 (100.0%) | 0 (0.0%) |
| 18 to 19 Year Olds | 67 (89.3%) | 8 (10.7%) |
| 20 to 24 Year Olds | 19 (100.0%) | 0 (0.0%) |
| 25 to 34 Year Olds | 9 (100.0%) | 0 (0.0%) |
| 35 Years and over | 5 (23.8%) | 16 (76.2%) |
| Total | 674 (96.6%) | 24 (3.4%) |
Educational Attainment by Field of Study in Saluda
Business (155 | 53.4%), social sciences (30 | 10.3%), education (22 | 7.6%), engineering (20 | 6.9%), and bio, nature & agricultural (18 | 6.2%) are the most common fields of study among 290 individuals in Saluda who have obtained a bachelor's degree or higher.
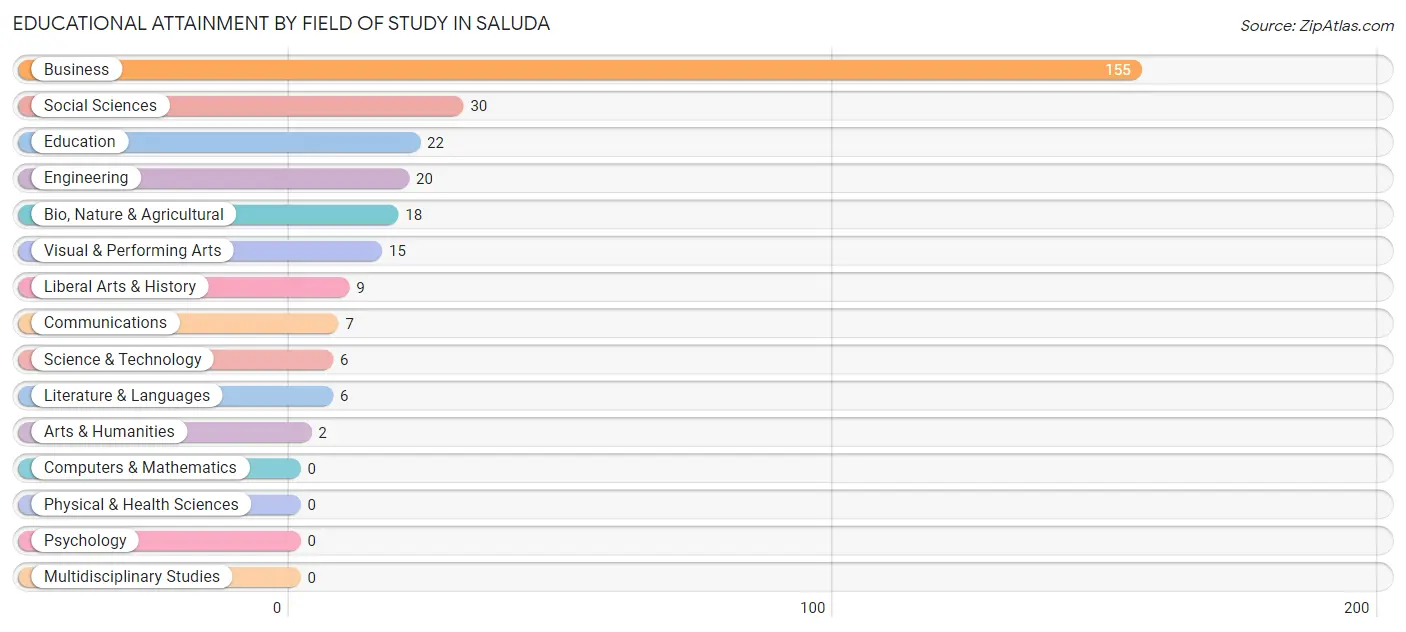
| Field of Study | # Graduates | % Graduates |
| Computers & Mathematics | 0 | 0.0% |
| Bio, Nature & Agricultural | 18 | 6.2% |
| Physical & Health Sciences | 0 | 0.0% |
| Psychology | 0 | 0.0% |
| Social Sciences | 30 | 10.3% |
| Engineering | 20 | 6.9% |
| Multidisciplinary Studies | 0 | 0.0% |
| Science & Technology | 6 | 2.1% |
| Business | 155 | 53.4% |
| Education | 22 | 7.6% |
| Literature & Languages | 6 | 2.1% |
| Liberal Arts & History | 9 | 3.1% |
| Visual & Performing Arts | 15 | 5.2% |
| Communications | 7 | 2.4% |
| Arts & Humanities | 2 | 0.7% |
| Total | 290 | 100.0% |
Transportation & Commute in Saluda
Vehicle Availability by Sex in Saluda
The most prevalent vehicle ownership categories in Saluda are males with 2 vehicles (421, accounting for 59.3%) and females with 2 vehicles (125, making up 130.3%).
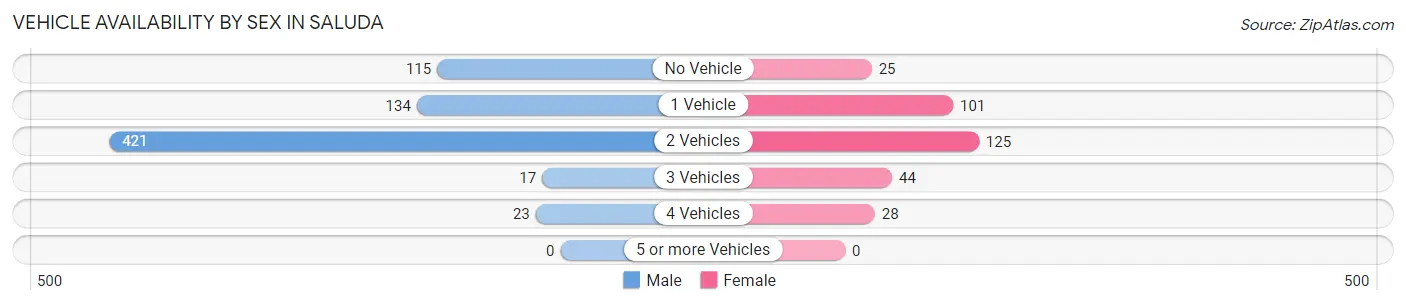
| Vehicles Available | Male | Female |
| No Vehicle | 115 (16.2%) | 25 (7.7%) |
| 1 Vehicle | 134 (18.9%) | 101 (31.3%) |
| 2 Vehicles | 421 (59.3%) | 125 (38.7%) |
| 3 Vehicles | 17 (2.4%) | 44 (13.6%) |
| 4 Vehicles | 23 (3.2%) | 28 (8.7%) |
| 5 or more Vehicles | 0 (0.0%) | 0 (0.0%) |
| Total | 710 (100.0%) | 323 (100.0%) |
Commute Time in Saluda
The most frequently occuring commute durations in Saluda are less than 5 minutes (224 commuters, 21.9%), 20 to 24 minutes (160 commuters, 15.7%), and 5 to 9 minutes (141 commuters, 13.8%).
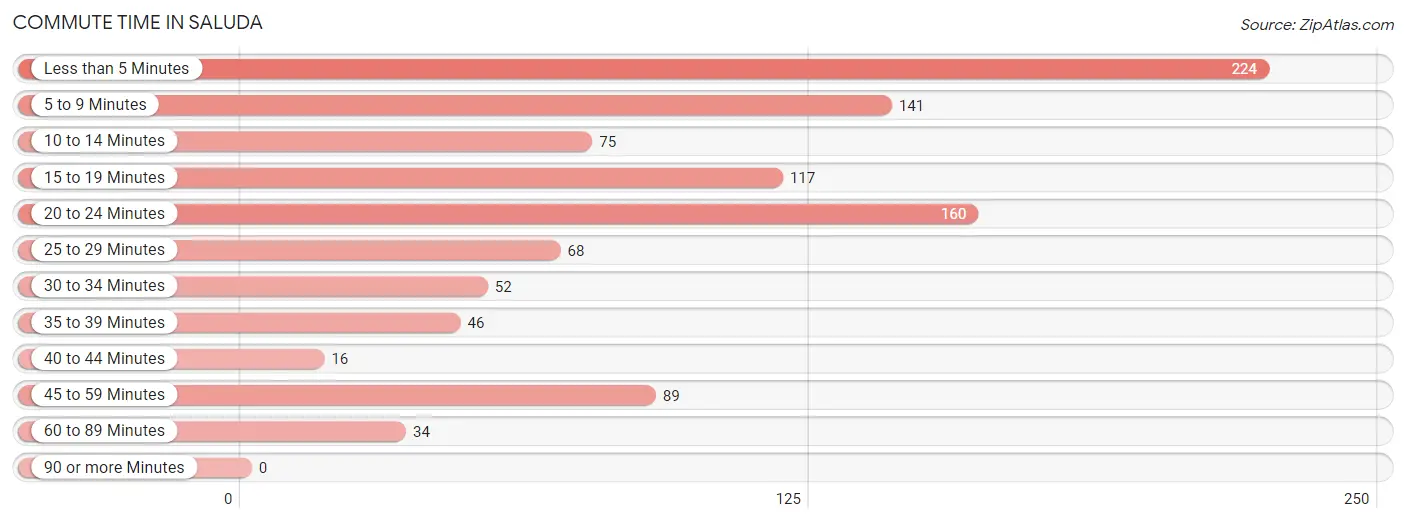
| Commute Time | # Commuters | % Commuters |
| Less than 5 Minutes | 224 | 21.9% |
| 5 to 9 Minutes | 141 | 13.8% |
| 10 to 14 Minutes | 75 | 7.3% |
| 15 to 19 Minutes | 117 | 11.5% |
| 20 to 24 Minutes | 160 | 15.7% |
| 25 to 29 Minutes | 68 | 6.7% |
| 30 to 34 Minutes | 52 | 5.1% |
| 35 to 39 Minutes | 46 | 4.5% |
| 40 to 44 Minutes | 16 | 1.6% |
| 45 to 59 Minutes | 89 | 8.7% |
| 60 to 89 Minutes | 34 | 3.3% |
| 90 or more Minutes | 0 | 0.0% |
Commute Time by Sex in Saluda
The most common commute times in Saluda are less than 5 minutes (194 commuters, 27.1%) for males and 5 to 9 minutes (115 commuters, 37.5%) for females.
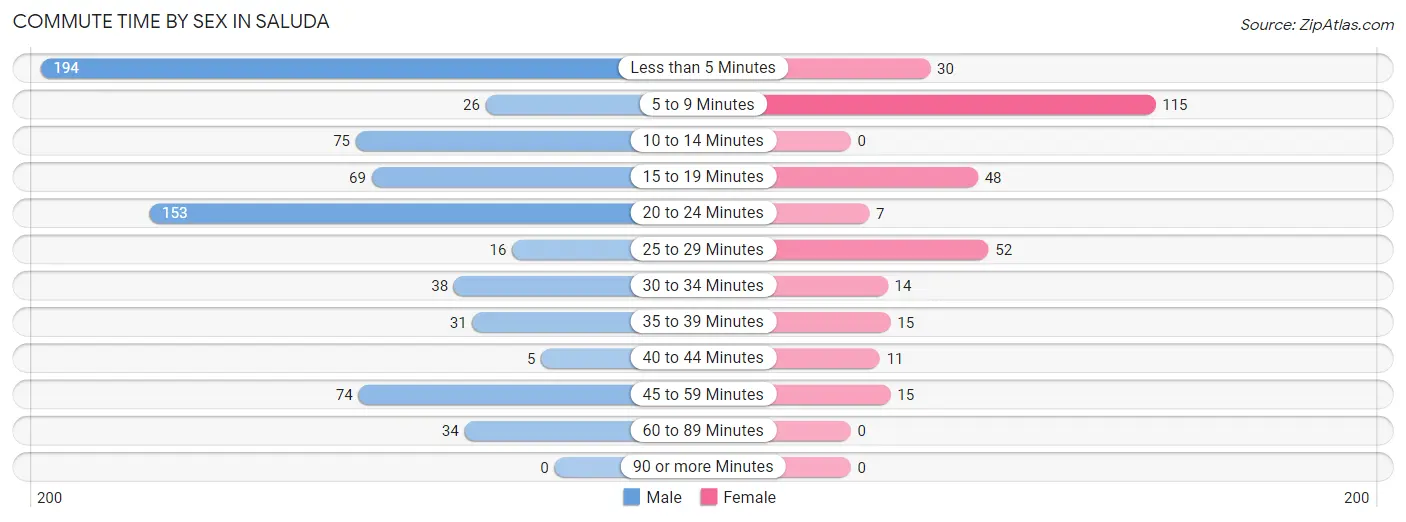
| Commute Time | Male | Female |
| Less than 5 Minutes | 194 (27.1%) | 30 (9.8%) |
| 5 to 9 Minutes | 26 (3.6%) | 115 (37.5%) |
| 10 to 14 Minutes | 75 (10.5%) | 0 (0.0%) |
| 15 to 19 Minutes | 69 (9.7%) | 48 (15.6%) |
| 20 to 24 Minutes | 153 (21.4%) | 7 (2.3%) |
| 25 to 29 Minutes | 16 (2.2%) | 52 (16.9%) |
| 30 to 34 Minutes | 38 (5.3%) | 14 (4.6%) |
| 35 to 39 Minutes | 31 (4.3%) | 15 (4.9%) |
| 40 to 44 Minutes | 5 (0.7%) | 11 (3.6%) |
| 45 to 59 Minutes | 74 (10.3%) | 15 (4.9%) |
| 60 to 89 Minutes | 34 (4.8%) | 0 (0.0%) |
| 90 or more Minutes | 0 (0.0%) | 0 (0.0%) |
Time of Departure to Work by Sex in Saluda
The most frequent times of departure to work in Saluda are 6:00 AM to 6:29 AM (190, 26.6%) for males and 7:00 AM to 7:29 AM (95, 30.9%) for females.
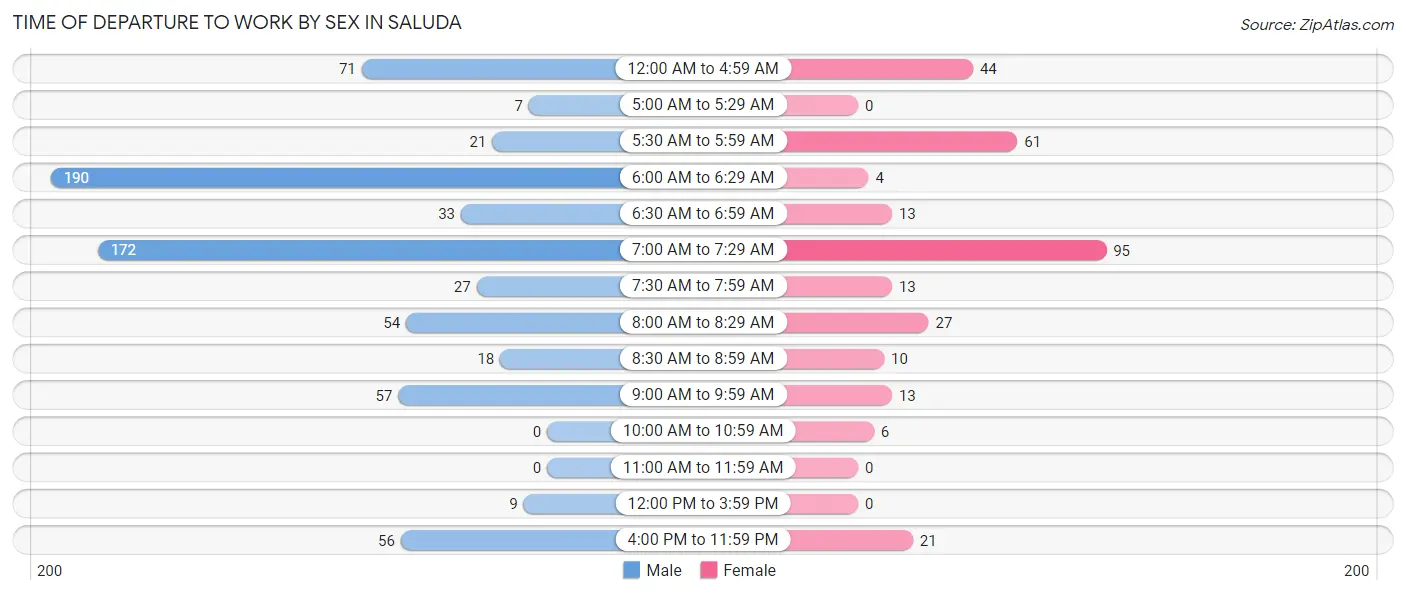
| Time of Departure | Male | Female |
| 12:00 AM to 4:59 AM | 71 (9.9%) | 44 (14.3%) |
| 5:00 AM to 5:29 AM | 7 (1.0%) | 0 (0.0%) |
| 5:30 AM to 5:59 AM | 21 (2.9%) | 61 (19.9%) |
| 6:00 AM to 6:29 AM | 190 (26.6%) | 4 (1.3%) |
| 6:30 AM to 6:59 AM | 33 (4.6%) | 13 (4.2%) |
| 7:00 AM to 7:29 AM | 172 (24.1%) | 95 (30.9%) |
| 7:30 AM to 7:59 AM | 27 (3.8%) | 13 (4.2%) |
| 8:00 AM to 8:29 AM | 54 (7.5%) | 27 (8.8%) |
| 8:30 AM to 8:59 AM | 18 (2.5%) | 10 (3.3%) |
| 9:00 AM to 9:59 AM | 57 (8.0%) | 13 (4.2%) |
| 10:00 AM to 10:59 AM | 0 (0.0%) | 6 (1.9%) |
| 11:00 AM to 11:59 AM | 0 (0.0%) | 0 (0.0%) |
| 12:00 PM to 3:59 PM | 9 (1.3%) | 0 (0.0%) |
| 4:00 PM to 11:59 PM | 56 (7.8%) | 21 (6.8%) |
| Total | 715 (100.0%) | 307 (100.0%) |
Housing Occupancy in Saluda
Occupancy by Ownership in Saluda
Of the total 1,176 dwellings in Saluda, owner-occupied units account for 572 (48.6%), while renter-occupied units make up 604 (51.4%).
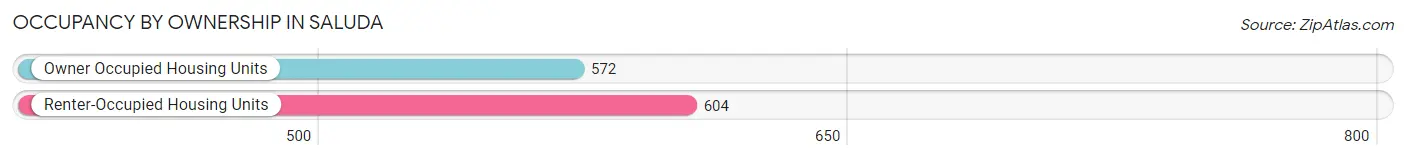
| Occupancy | # Housing Units | % Housing Units |
| Owner Occupied Housing Units | 572 | 48.6% |
| Renter-Occupied Housing Units | 604 | 51.4% |
| Total Occupied Housing Units | 1,176 | 100.0% |
Occupancy by Household Size in Saluda
| Household Size | # Housing Units | % Housing Units |
| 1-Person Household | 369 | 31.4% |
| 2-Person Household | 177 | 15.0% |
| 3-Person Household | 212 | 18.0% |
| 4+ Person Household | 418 | 35.5% |
| Total Housing Units | 1,176 | 100.0% |
Occupancy by Ownership by Household Size in Saluda
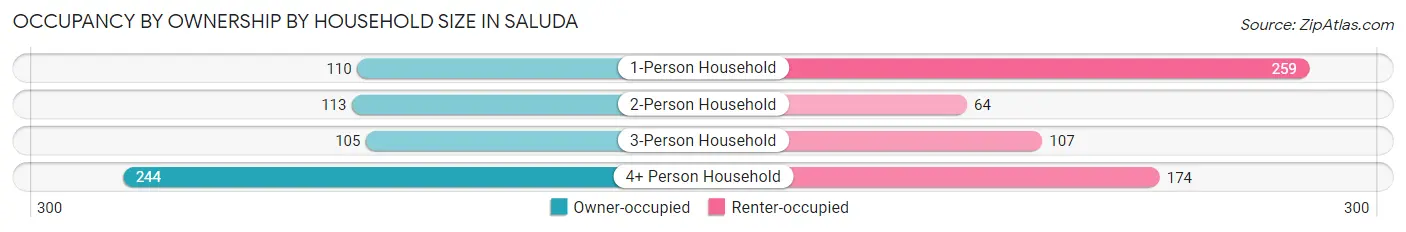
| Household Size | Owner-occupied | Renter-occupied |
| 1-Person Household | 110 (29.8%) | 259 (70.2%) |
| 2-Person Household | 113 (63.8%) | 64 (36.2%) |
| 3-Person Household | 105 (49.5%) | 107 (50.5%) |
| 4+ Person Household | 244 (58.4%) | 174 (41.6%) |
| Total Housing Units | 572 (48.6%) | 604 (51.4%) |
Occupancy by Educational Attainment in Saluda
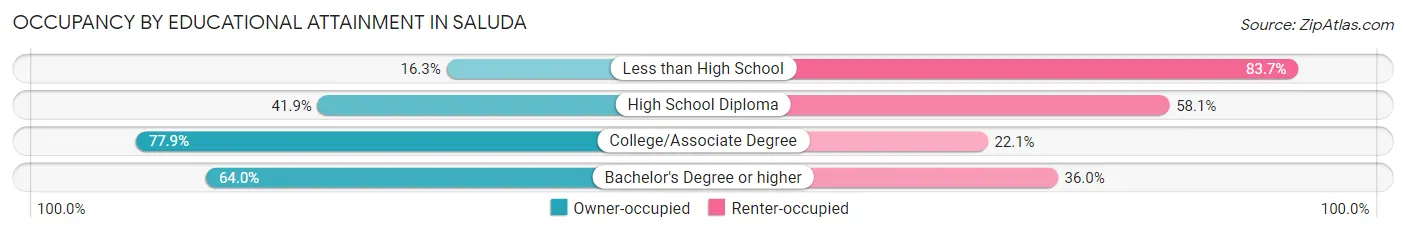
| Household Size | Owner-occupied | Renter-occupied |
| Less than High School | 58 (16.3%) | 297 (83.7%) |
| High School Diploma | 132 (41.9%) | 183 (58.1%) |
| College/Associate Degree | 325 (77.9%) | 92 (22.1%) |
| Bachelor's Degree or higher | 57 (64.0%) | 32 (36.0%) |
Occupancy by Age of Householder in Saluda
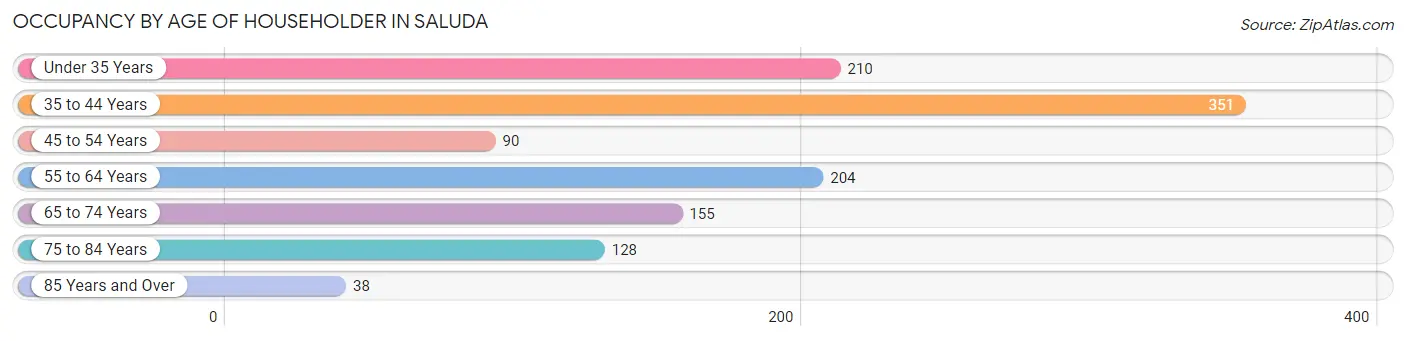
| Age Bracket | # Households | % Households |
| Under 35 Years | 210 | 17.9% |
| 35 to 44 Years | 351 | 29.8% |
| 45 to 54 Years | 90 | 7.6% |
| 55 to 64 Years | 204 | 17.3% |
| 65 to 74 Years | 155 | 13.2% |
| 75 to 84 Years | 128 | 10.9% |
| 85 Years and Over | 38 | 3.2% |
| Total | 1,176 | 100.0% |
Housing Finances in Saluda
Median Income by Occupancy in Saluda
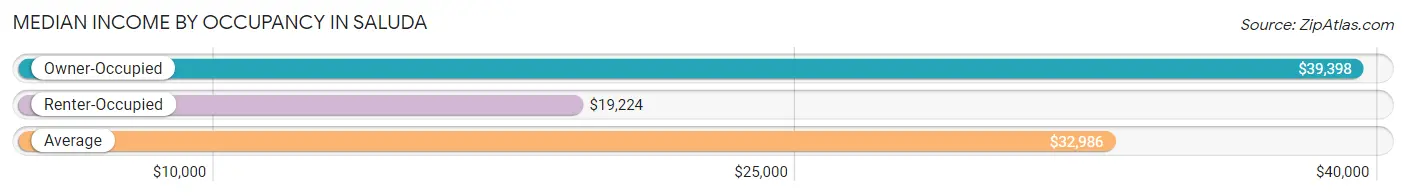
| Occupancy Type | # Households | Median Income |
| Owner-Occupied | 572 (48.6%) | $39,398 |
| Renter-Occupied | 604 (51.4%) | $19,224 |
| Average | 1,176 (100.0%) | $32,986 |
Occupancy by Householder Income Bracket in Saluda
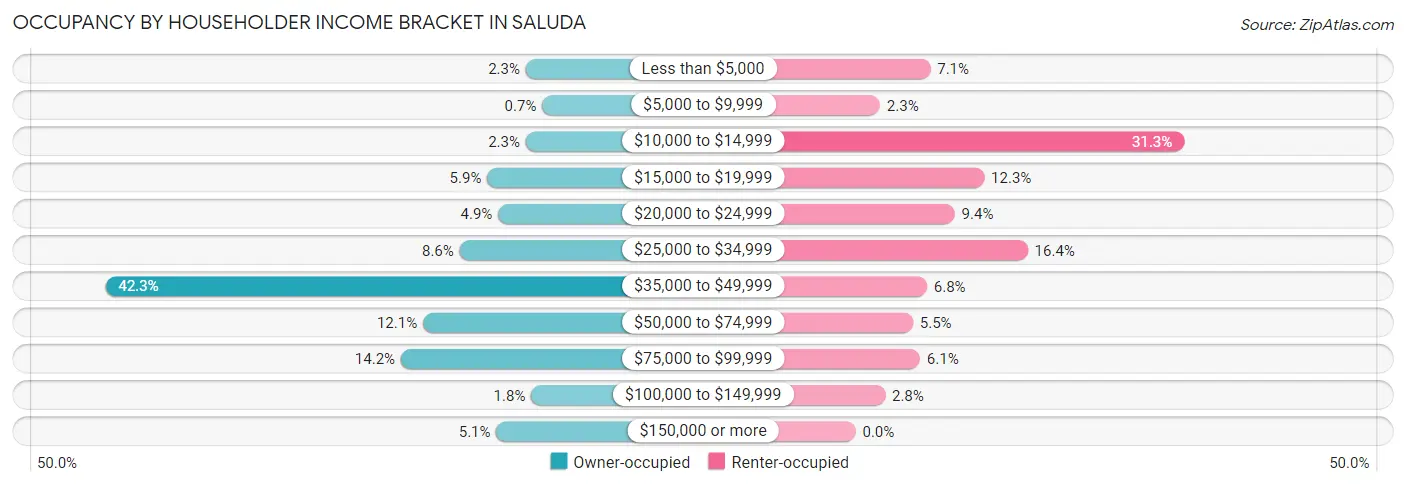
| Income Bracket | Owner-occupied | Renter-occupied |
| Less than $5,000 | 13 (2.3%) | 43 (7.1%) |
| $5,000 to $9,999 | 4 (0.7%) | 14 (2.3%) |
| $10,000 to $14,999 | 13 (2.3%) | 189 (31.3%) |
| $15,000 to $19,999 | 34 (5.9%) | 74 (12.2%) |
| $20,000 to $24,999 | 28 (4.9%) | 57 (9.4%) |
| $25,000 to $34,999 | 49 (8.6%) | 99 (16.4%) |
| $35,000 to $49,999 | 242 (42.3%) | 41 (6.8%) |
| $50,000 to $74,999 | 69 (12.1%) | 33 (5.5%) |
| $75,000 to $99,999 | 81 (14.2%) | 37 (6.1%) |
| $100,000 to $149,999 | 10 (1.8%) | 17 (2.8%) |
| $150,000 or more | 29 (5.1%) | 0 (0.0%) |
| Total | 572 (100.0%) | 604 (100.0%) |
Monthly Housing Cost Tiers in Saluda
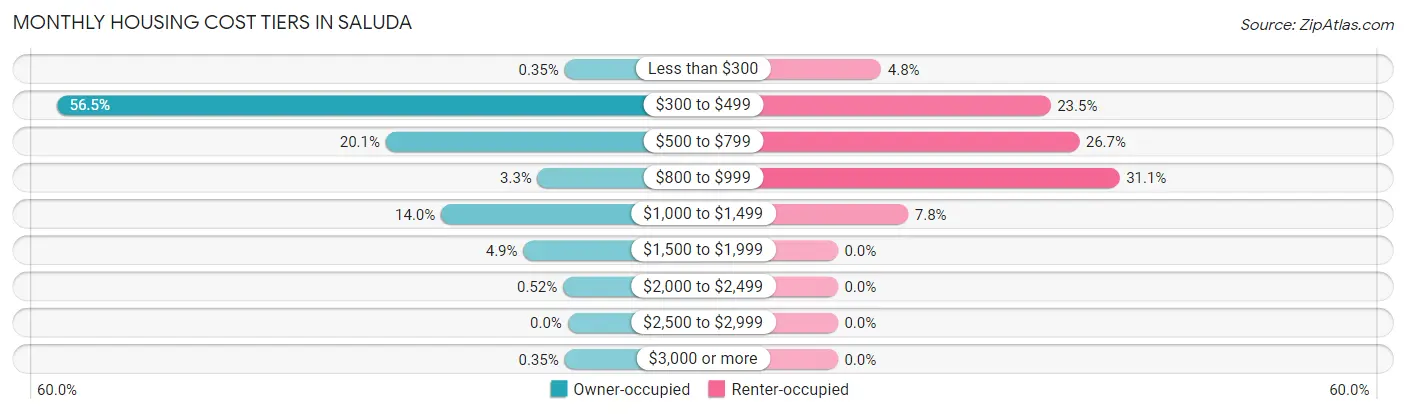
| Monthly Cost | Owner-occupied | Renter-occupied |
| Less than $300 | 2 (0.4%) | 29 (4.8%) |
| $300 to $499 | 323 (56.5%) | 142 (23.5%) |
| $500 to $799 | 115 (20.1%) | 161 (26.7%) |
| $800 to $999 | 19 (3.3%) | 188 (31.1%) |
| $1,000 to $1,499 | 80 (14.0%) | 47 (7.8%) |
| $1,500 to $1,999 | 28 (4.9%) | 0 (0.0%) |
| $2,000 to $2,499 | 3 (0.5%) | 0 (0.0%) |
| $2,500 to $2,999 | 0 (0.0%) | 0 (0.0%) |
| $3,000 or more | 2 (0.4%) | 0 (0.0%) |
| Total | 572 (100.0%) | 604 (100.0%) |
Physical Housing Characteristics in Saluda
Housing Structures in Saluda
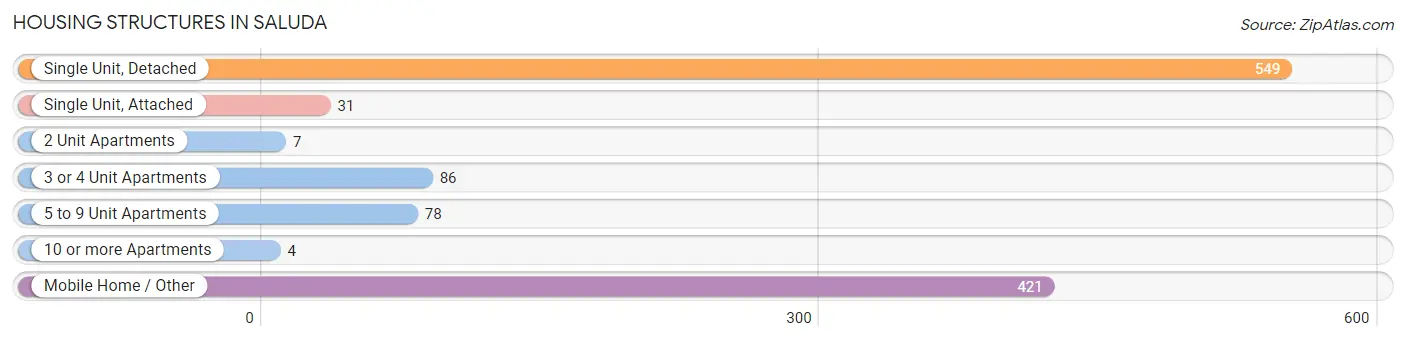
| Structure Type | # Housing Units | % Housing Units |
| Single Unit, Detached | 549 | 46.7% |
| Single Unit, Attached | 31 | 2.6% |
| 2 Unit Apartments | 7 | 0.6% |
| 3 or 4 Unit Apartments | 86 | 7.3% |
| 5 to 9 Unit Apartments | 78 | 6.6% |
| 10 or more Apartments | 4 | 0.3% |
| Mobile Home / Other | 421 | 35.8% |
| Total | 1,176 | 100.0% |
Housing Structures by Occupancy in Saluda
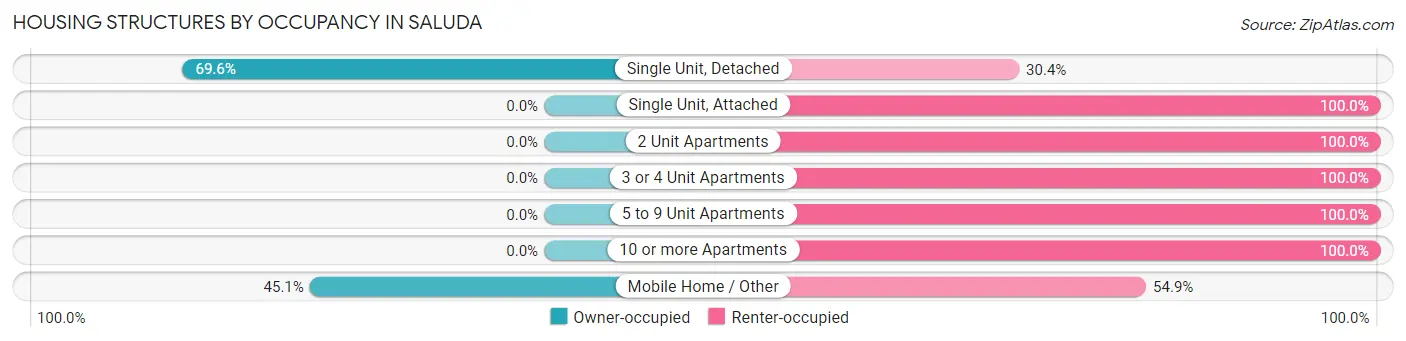
| Structure Type | Owner-occupied | Renter-occupied |
| Single Unit, Detached | 382 (69.6%) | 167 (30.4%) |
| Single Unit, Attached | 0 (0.0%) | 31 (100.0%) |
| 2 Unit Apartments | 0 (0.0%) | 7 (100.0%) |
| 3 or 4 Unit Apartments | 0 (0.0%) | 86 (100.0%) |
| 5 to 9 Unit Apartments | 0 (0.0%) | 78 (100.0%) |
| 10 or more Apartments | 0 (0.0%) | 4 (100.0%) |
| Mobile Home / Other | 190 (45.1%) | 231 (54.9%) |
| Total | 572 (48.6%) | 604 (51.4%) |
Housing Structures by Number of Rooms in Saluda
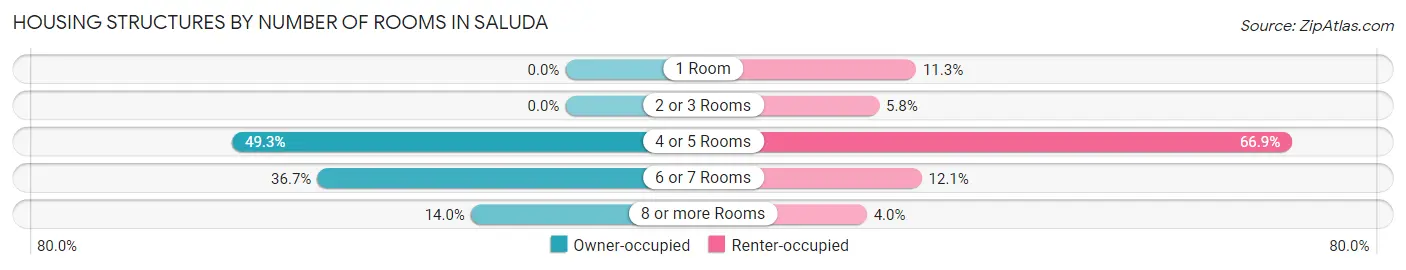
| Number of Rooms | Owner-occupied | Renter-occupied |
| 1 Room | 0 (0.0%) | 68 (11.3%) |
| 2 or 3 Rooms | 0 (0.0%) | 35 (5.8%) |
| 4 or 5 Rooms | 282 (49.3%) | 404 (66.9%) |
| 6 or 7 Rooms | 210 (36.7%) | 73 (12.1%) |
| 8 or more Rooms | 80 (14.0%) | 24 (4.0%) |
| Total | 572 (100.0%) | 604 (100.0%) |
Housing Structure by Heating Type in Saluda
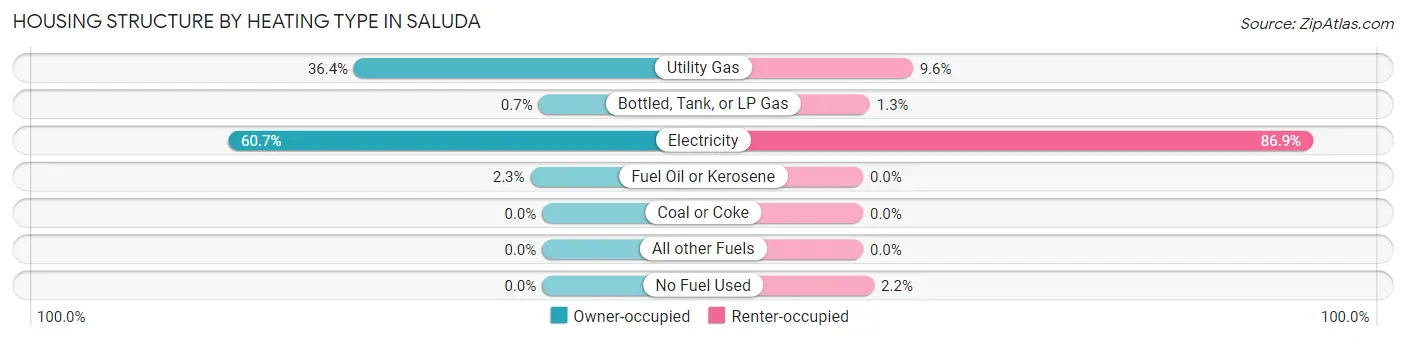
| Heating Type | Owner-occupied | Renter-occupied |
| Utility Gas | 208 (36.4%) | 58 (9.6%) |
| Bottled, Tank, or LP Gas | 4 (0.7%) | 8 (1.3%) |
| Electricity | 347 (60.7%) | 525 (86.9%) |
| Fuel Oil or Kerosene | 13 (2.3%) | 0 (0.0%) |
| Coal or Coke | 0 (0.0%) | 0 (0.0%) |
| All other Fuels | 0 (0.0%) | 0 (0.0%) |
| No Fuel Used | 0 (0.0%) | 13 (2.1%) |
| Total | 572 (100.0%) | 604 (100.0%) |
Household Vehicle Usage in Saluda
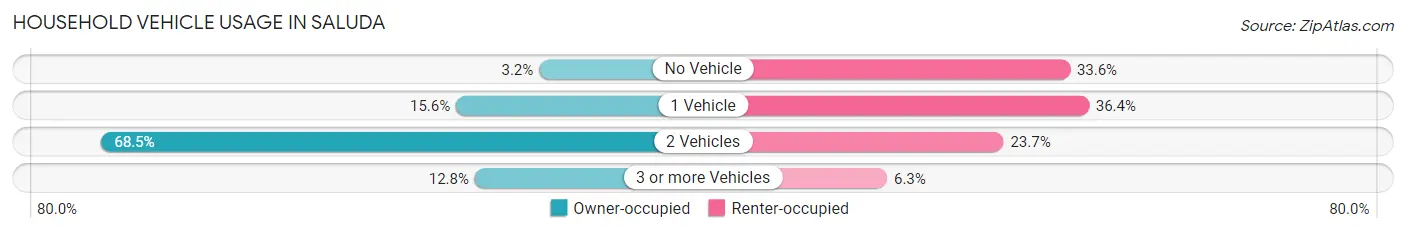
| Vehicles per Household | Owner-occupied | Renter-occupied |
| No Vehicle | 18 (3.2%) | 203 (33.6%) |
| 1 Vehicle | 89 (15.6%) | 220 (36.4%) |
| 2 Vehicles | 392 (68.5%) | 143 (23.7%) |
| 3 or more Vehicles | 73 (12.8%) | 38 (6.3%) |
| Total | 572 (100.0%) | 604 (100.0%) |
Real Estate & Mortgages in Saluda
Real Estate and Mortgage Overview in Saluda
| Characteristic | Without Mortgage | With Mortgage |
| Housing Units | 431 | 141 |
| Median Property Value | - | - |
| Median Household Income | $38,933 | $12 |
| Monthly Housing Costs | $389 | $2 |
| Real Estate Taxes | $284 | $0 |
Property Value by Mortgage Status in Saluda
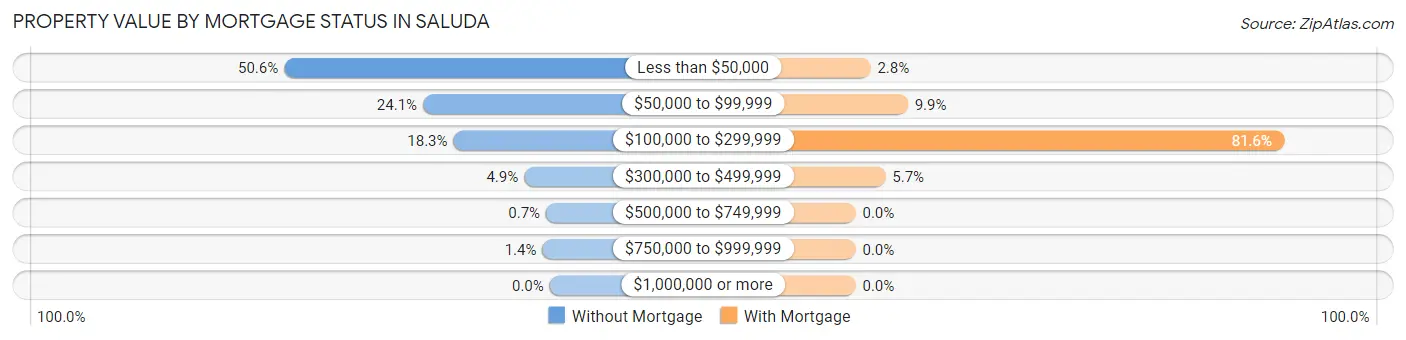
| Property Value | Without Mortgage | With Mortgage |
| Less than $50,000 | 218 (50.6%) | 4 (2.8%) |
| $50,000 to $99,999 | 104 (24.1%) | 14 (9.9%) |
| $100,000 to $299,999 | 79 (18.3%) | 115 (81.6%) |
| $300,000 to $499,999 | 21 (4.9%) | 8 (5.7%) |
| $500,000 to $749,999 | 3 (0.7%) | 0 (0.0%) |
| $750,000 to $999,999 | 6 (1.4%) | 0 (0.0%) |
| $1,000,000 or more | 0 (0.0%) | 0 (0.0%) |
| Total | 431 (100.0%) | 141 (100.0%) |
Household Income by Mortgage Status in Saluda
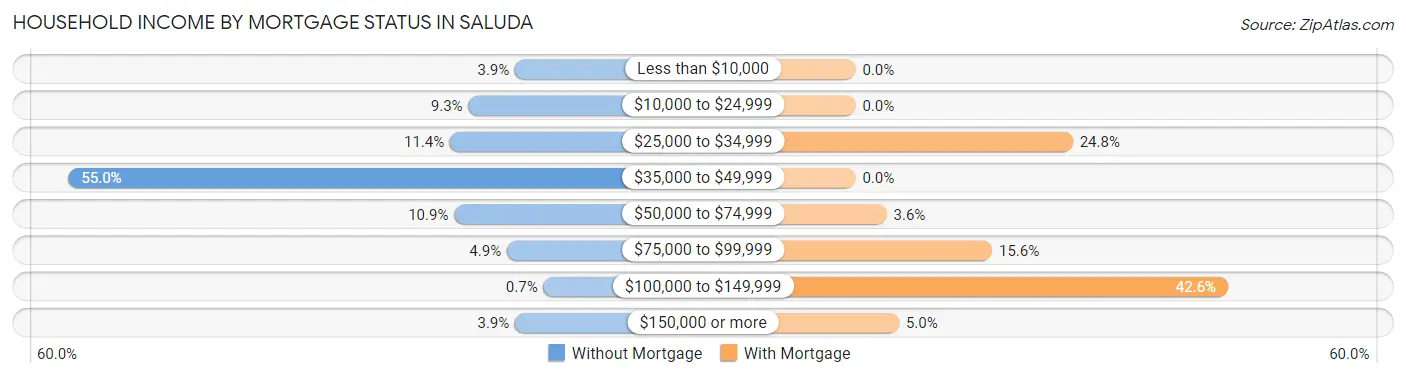
| Household Income | Without Mortgage | With Mortgage |
| Less than $10,000 | 17 (3.9%) | 0 (0.0%) |
| $10,000 to $24,999 | 40 (9.3%) | 0 (0.0%) |
| $25,000 to $34,999 | 49 (11.4%) | 35 (24.8%) |
| $35,000 to $49,999 | 237 (55.0%) | 0 (0.0%) |
| $50,000 to $74,999 | 47 (10.9%) | 5 (3.5%) |
| $75,000 to $99,999 | 21 (4.9%) | 22 (15.6%) |
| $100,000 to $149,999 | 3 (0.7%) | 60 (42.5%) |
| $150,000 or more | 17 (3.9%) | 7 (5.0%) |
| Total | 431 (100.0%) | 141 (100.0%) |
Property Value to Household Income Ratio in Saluda
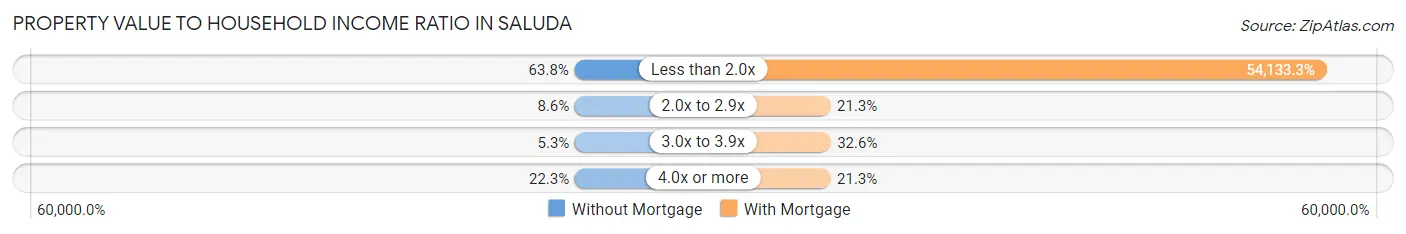
| Value-to-Income Ratio | Without Mortgage | With Mortgage |
| Less than 2.0x | 275 (63.8%) | 76,328 (54,133.3%) |
| 2.0x to 2.9x | 37 (8.6%) | 30 (21.3%) |
| 3.0x to 3.9x | 23 (5.3%) | 46 (32.6%) |
| 4.0x or more | 96 (22.3%) | 30 (21.3%) |
| Total | 431 (100.0%) | 141 (100.0%) |
Real Estate Taxes by Mortgage Status in Saluda
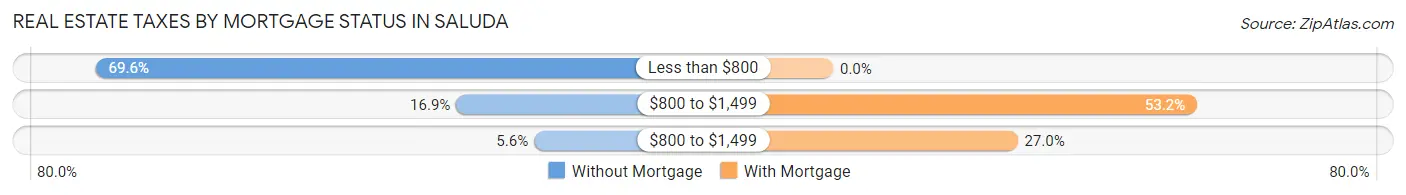
| Property Taxes | Without Mortgage | With Mortgage |
| Less than $800 | 300 (69.6%) | 0 (0.0%) |
| $800 to $1,499 | 73 (16.9%) | 75 (53.2%) |
| $800 to $1,499 | 24 (5.6%) | 38 (27.0%) |
| Total | 431 (100.0%) | 141 (100.0%) |
Health & Disability in Saluda
Health Insurance Coverage by Age in Saluda
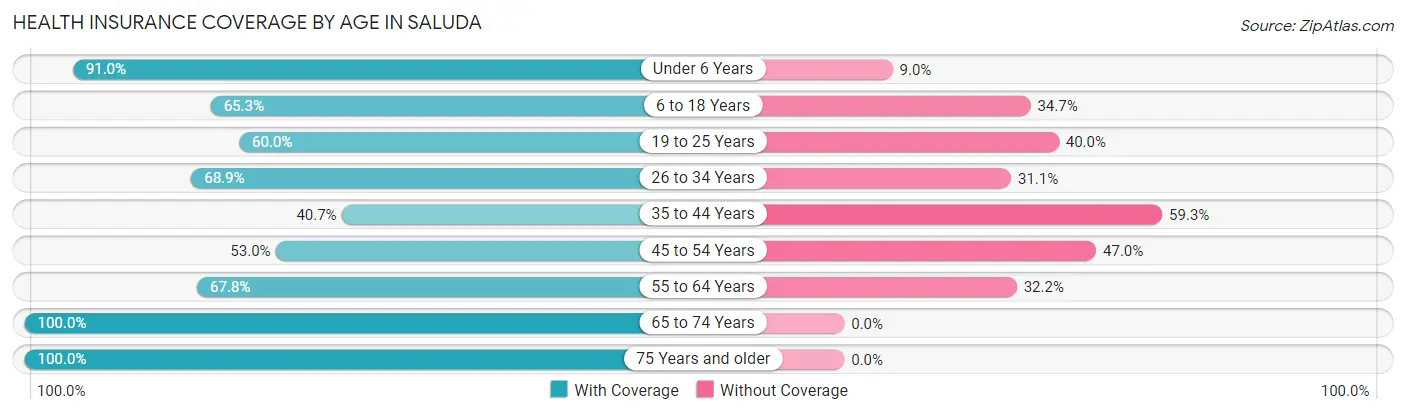
| Age Bracket | With Coverage | Without Coverage |
| Under 6 Years | 414 (91.0%) | 41 (9.0%) |
| 6 to 18 Years | 408 (65.3%) | 217 (34.7%) |
| 19 to 25 Years | 114 (60.0%) | 76 (40.0%) |
| 26 to 34 Years | 195 (68.9%) | 88 (31.1%) |
| 35 to 44 Years | 222 (40.7%) | 323 (59.3%) |
| 45 to 54 Years | 157 (53.0%) | 139 (47.0%) |
| 55 to 64 Years | 192 (67.8%) | 91 (32.2%) |
| 65 to 74 Years | 245 (100.0%) | 0 (0.0%) |
| 75 Years and older | 202 (100.0%) | 0 (0.0%) |
| Total | 2,149 (68.8%) | 975 (31.2%) |
Health Insurance Coverage by Citizenship Status in Saluda
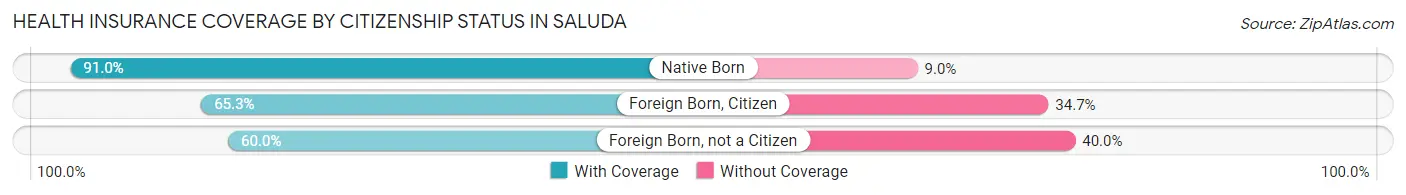
| Citizenship Status | With Coverage | Without Coverage |
| Native Born | 414 (91.0%) | 41 (9.0%) |
| Foreign Born, Citizen | 408 (65.3%) | 217 (34.7%) |
| Foreign Born, not a Citizen | 114 (60.0%) | 76 (40.0%) |
Health Insurance Coverage by Household Income in Saluda
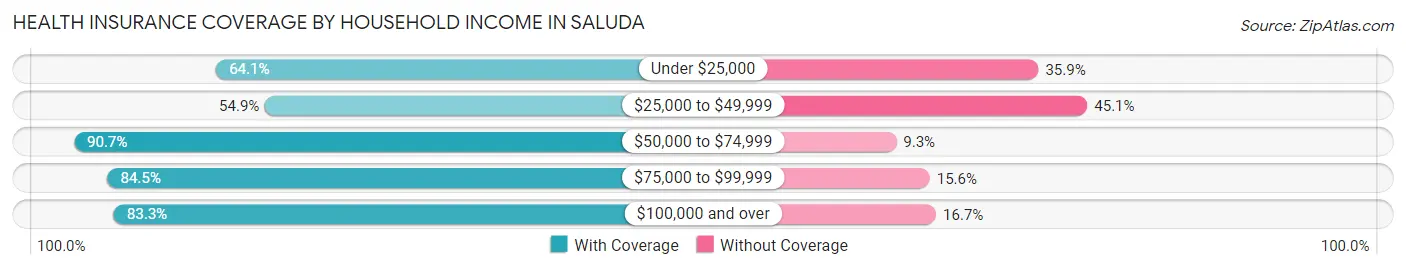
| Household Income | With Coverage | Without Coverage |
| Under $25,000 | 621 (64.1%) | 348 (35.9%) |
| $25,000 to $49,999 | 579 (54.9%) | 475 (45.1%) |
| $50,000 to $74,999 | 303 (90.7%) | 31 (9.3%) |
| $75,000 to $99,999 | 440 (84.5%) | 81 (15.5%) |
| $100,000 and over | 194 (83.3%) | 39 (16.7%) |
Public vs Private Health Insurance Coverage by Age in Saluda
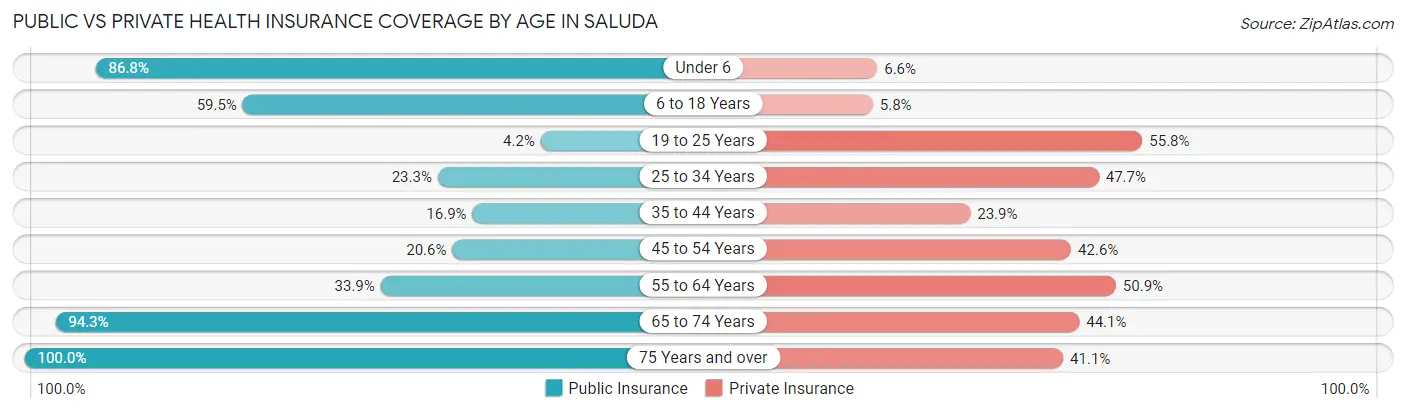
| Age Bracket | Public Insurance | Private Insurance |
| Under 6 | 395 (86.8%) | 30 (6.6%) |
| 6 to 18 Years | 372 (59.5%) | 36 (5.8%) |
| 19 to 25 Years | 8 (4.2%) | 106 (55.8%) |
| 25 to 34 Years | 66 (23.3%) | 135 (47.7%) |
| 35 to 44 Years | 92 (16.9%) | 130 (23.8%) |
| 45 to 54 Years | 61 (20.6%) | 126 (42.6%) |
| 55 to 64 Years | 96 (33.9%) | 144 (50.9%) |
| 65 to 74 Years | 231 (94.3%) | 108 (44.1%) |
| 75 Years and over | 202 (100.0%) | 83 (41.1%) |
| Total | 1,523 (48.7%) | 898 (28.7%) |
Disability Status by Sex by Age in Saluda
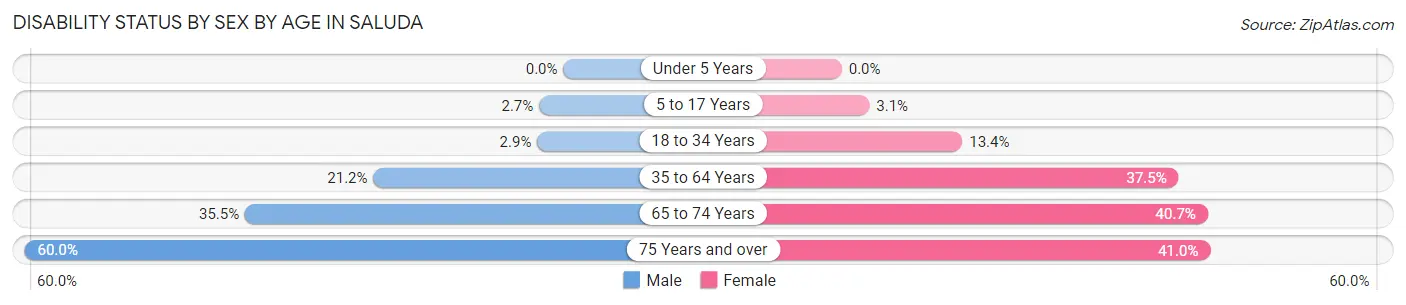
| Age Bracket | Male | Female |
| Under 5 Years | 0 (0.0%) | 0 (0.0%) |
| 5 to 17 Years | 11 (2.7%) | 5 (3.1%) |
| 18 to 34 Years | 8 (2.9%) | 42 (13.4%) |
| 35 to 64 Years | 160 (21.2%) | 138 (37.5%) |
| 65 to 74 Years | 39 (35.4%) | 55 (40.7%) |
| 75 Years and over | 51 (60.0%) | 48 (41.0%) |
Disability Class by Sex by Age in Saluda
Disability Class: Hearing Difficulty
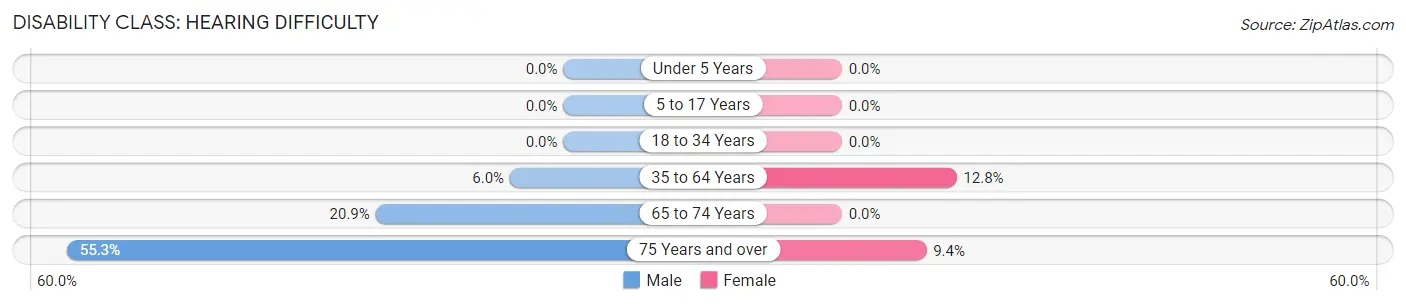
| Age Bracket | Male | Female |
| Under 5 Years | 0 (0.0%) | 0 (0.0%) |
| 5 to 17 Years | 0 (0.0%) | 0 (0.0%) |
| 18 to 34 Years | 0 (0.0%) | 0 (0.0%) |
| 35 to 64 Years | 45 (5.9%) | 47 (12.8%) |
| 65 to 74 Years | 23 (20.9%) | 0 (0.0%) |
| 75 Years and over | 47 (55.3%) | 11 (9.4%) |
Disability Class: Vision Difficulty
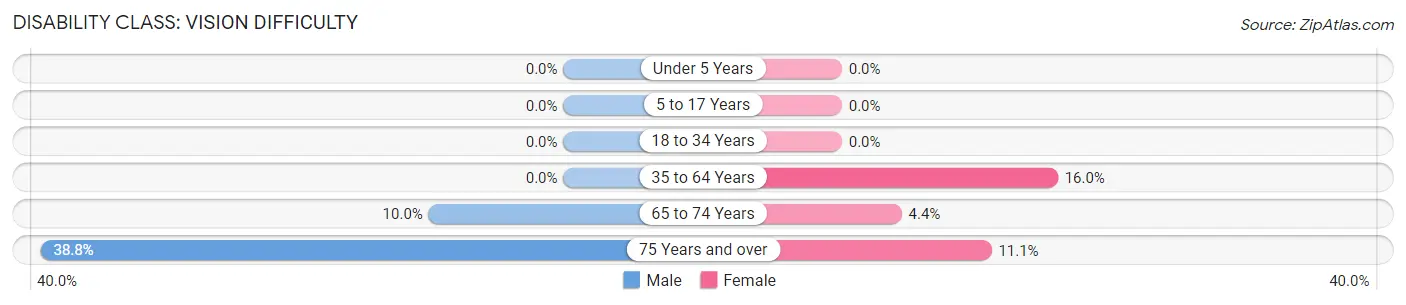
| Age Bracket | Male | Female |
| Under 5 Years | 0 (0.0%) | 0 (0.0%) |
| 5 to 17 Years | 0 (0.0%) | 0 (0.0%) |
| 18 to 34 Years | 0 (0.0%) | 0 (0.0%) |
| 35 to 64 Years | 0 (0.0%) | 59 (16.0%) |
| 65 to 74 Years | 11 (10.0%) | 6 (4.4%) |
| 75 Years and over | 33 (38.8%) | 13 (11.1%) |
Disability Class: Cognitive Difficulty
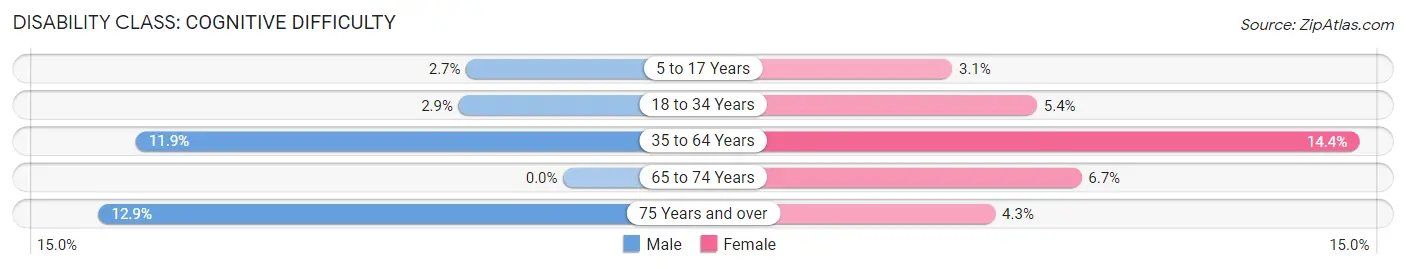
| Age Bracket | Male | Female |
| 5 to 17 Years | 11 (2.7%) | 5 (3.1%) |
| 18 to 34 Years | 8 (2.9%) | 17 (5.4%) |
| 35 to 64 Years | 90 (11.9%) | 53 (14.4%) |
| 65 to 74 Years | 0 (0.0%) | 9 (6.7%) |
| 75 Years and over | 11 (12.9%) | 5 (4.3%) |
Disability Class: Ambulatory Difficulty
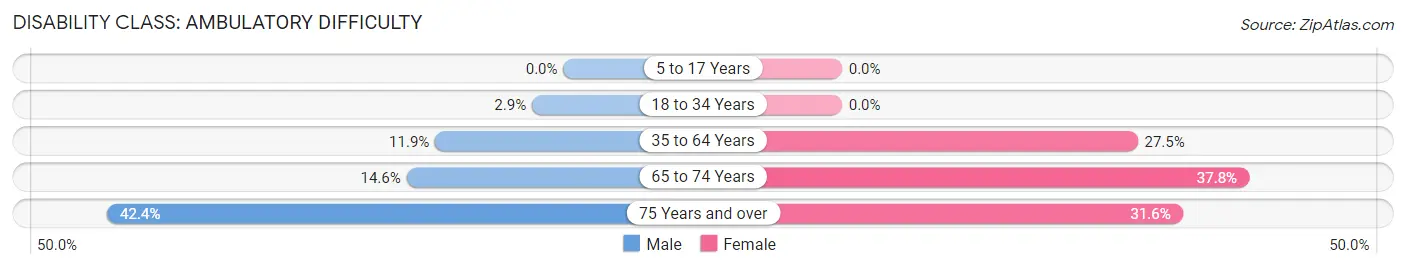
| Age Bracket | Male | Female |
| 5 to 17 Years | 0 (0.0%) | 0 (0.0%) |
| 18 to 34 Years | 8 (2.9%) | 0 (0.0%) |
| 35 to 64 Years | 90 (11.9%) | 101 (27.5%) |
| 65 to 74 Years | 16 (14.5%) | 51 (37.8%) |
| 75 Years and over | 36 (42.3%) | 37 (31.6%) |
Disability Class: Self-Care Difficulty
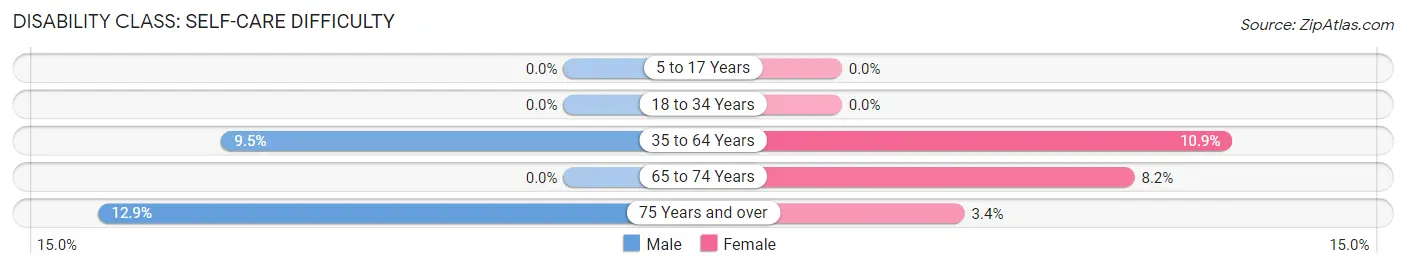
| Age Bracket | Male | Female |
| 5 to 17 Years | 0 (0.0%) | 0 (0.0%) |
| 18 to 34 Years | 0 (0.0%) | 0 (0.0%) |
| 35 to 64 Years | 72 (9.5%) | 40 (10.9%) |
| 65 to 74 Years | 0 (0.0%) | 11 (8.2%) |
| 75 Years and over | 11 (12.9%) | 4 (3.4%) |
Technology Access in Saluda
Computing Device Access in Saluda
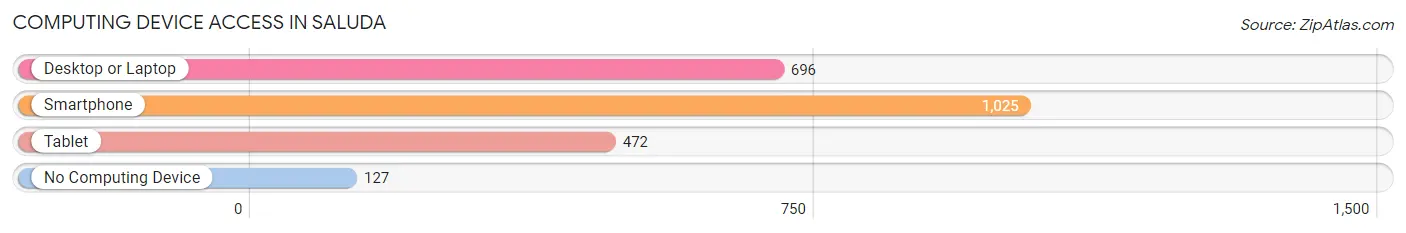
| Device Type | # Households | % Households |
| Desktop or Laptop | 696 | 59.2% |
| Smartphone | 1,025 | 87.2% |
| Tablet | 472 | 40.1% |
| No Computing Device | 127 | 10.8% |
| Total | 1,176 | 100.0% |
Internet Access in Saluda
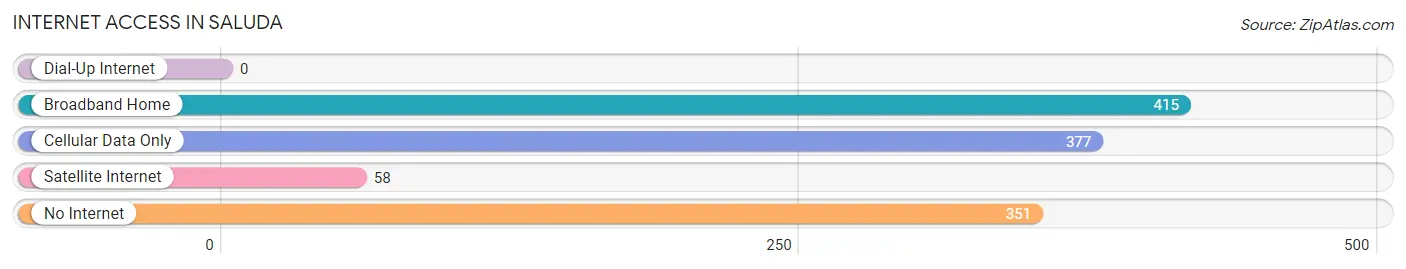
| Internet Type | # Households | % Households |
| Dial-Up Internet | 0 | 0.0% |
| Broadband Home | 415 | 35.3% |
| Cellular Data Only | 377 | 32.1% |
| Satellite Internet | 58 | 4.9% |
| No Internet | 351 | 29.8% |
| Total | 1,176 | 100.0% |
Saluda Summary
Saluda, South Carolina is a small town located in the northwestern corner of the state, near the border of North Carolina. It is part of the Greenville-Spartanburg-Anderson metropolitan area and is the county seat of Saluda County. The town has a population of approximately 2,000 people and is known for its rural charm and small-town atmosphere.
Geography
Saluda is located in the foothills of the Blue Ridge Mountains, at an elevation of 1,000 feet. The town is situated on the banks of the Saluda River, which flows through the center of town. The town is surrounded by rolling hills and forests, and is home to several parks and recreational areas. The climate in Saluda is mild, with temperatures ranging from the mid-50s in the winter to the mid-80s in the summer.
Economy
The economy of Saluda is largely based on agriculture and tourism. The town is home to several farms, which produce a variety of crops, including corn, soybeans, and tobacco. The town is also home to several wineries, which produce a variety of wines. Tourism is a major industry in Saluda, as the town is home to several historic sites, including the Saluda Historic District, which is listed on the National Register of Historic Places.
Demographics
As of the 2010 census, the population of Saluda was 2,039. The racial makeup of the town was 87.3% White, 9.2% African American, 0.3% Native American, 0.7% Asian, 0.1% Pacific Islander, 1.2% from other races, and 1.4% from two or more races. Hispanic or Latino of any race were 2.7% of the population.
The median income for a household in Saluda was $31,250, and the median income for a family was $37,500. The per capita income for the town was $17,845. About 15.2% of families and 18.2% of the population were below the poverty line, including 25.2% of those under age 18 and 11.2% of those age 65 or over.
Education
Saluda is served by the Saluda County School District, which operates four elementary schools, one middle school, and one high school. The town is also home to several private schools, including Saluda Academy, a private Christian school.
Conclusion
Saluda, South Carolina is a small town with a population of approximately 2,000 people. The town is situated in the foothills of the Blue Ridge Mountains and is known for its rural charm and small-town atmosphere. The economy of Saluda is largely based on agriculture and tourism, and the town is served by the Saluda County School District. Saluda is a great place to live, work, and raise a family, and is a great example of a small town in the South.
Common Questions
What is Per Capita Income in Saluda?
Per Capita income in Saluda is $14,634.
What is the Median Family Income in Saluda?
Median Family Income in Saluda is $38,145.
What is the Median Household income in Saluda?
Median Household Income in Saluda is $32,986.
What is Income or Wage Gap in Saluda?
Income or Wage Gap in Saluda is 41.1%.
Women in Saluda earn 58.9 cents for every dollar earned by a man.
What is Family Income Deficit in Saluda?
Family Income Deficit in Saluda is $6,835.
Families that are below poverty line in Saluda earn $6,835 less on average than the poverty threshold level.
What is Inequality or Gini Index in Saluda?
Inequality or Gini Index in Saluda is 0.44.
What is the Total Population of Saluda?
Total Population of Saluda is 3,124.
What is the Total Male Population of Saluda?
Total Male Population of Saluda is 1,877.
What is the Total Female Population of Saluda?
Total Female Population of Saluda is 1,247.
What is the Ratio of Males per 100 Females in Saluda?
There are 150.52 Males per 100 Females in Saluda.
What is the Ratio of Females per 100 Males in Saluda?
There are 66.44 Females per 100 Males in Saluda.
What is the Median Population Age in Saluda?
Median Population Age in Saluda is 35.1 Years.
What is the Average Family Size in Saluda
Average Family Size in Saluda is 3.3 People.
What is the Average Household Size in Saluda
Average Household Size in Saluda is 2.6 People.
How Large is the Labor Force in Saluda?
There are 1,191 People in the Labor Forcein in Saluda.
What is the Percentage of People in the Labor Force in Saluda?
53.8% of People are in the Labor Force in Saluda.
What is the Unemployment Rate in Saluda?
Unemployment Rate in Saluda is 4.6%.