Patrick, SC Map & Demographics
Patrick Map
Patrick Overview
$18,967
PER CAPITA INCOME
$32,083
AVG FAMILY INCOME
$30,263
AVG HOUSEHOLD INCOME
42.1%
WAGE / INCOME GAP [ % ]
57.9¢/ $1
WAGE / INCOME GAP [ $ ]
0.48
INEQUALITY / GINI INDEX
500
TOTAL POPULATION
284
MALE POPULATION
216
FEMALE POPULATION
131.48
MALES / 100 FEMALES
76.06
FEMALES / 100 MALES
46.8
MEDIAN AGE
3.1
AVG FAMILY SIZE
2.0
AVG HOUSEHOLD SIZE
185
LABOR FORCE [ PEOPLE ]
48.7%
PERCENT IN LABOR FORCE
14.6%
UNEMPLOYMENT RATE
Patrick Zip Codes
Patrick Area Codes
Income in Patrick
Income Overview in Patrick
Per Capita Income in Patrick is $18,967, while median incomes of families and households are $32,083 and $30,263 respectively.
| Characteristic | Number | Measure |
| Per Capita Income | 500 | $18,967 |
| Median Family Income | 111 | $32,083 |
| Mean Family Income | 111 | $51,702 |
| Median Household Income | 246 | $30,263 |
| Mean Household Income | 246 | $38,996 |
| Income Deficit | 111 | $0 |
| Wage / Income Gap (%) | 500 | 42.09% |
| Wage / Income Gap ($) | 500 | 57.91¢ per $1 |
| Gini / Inequality Index | 500 | 0.48 |
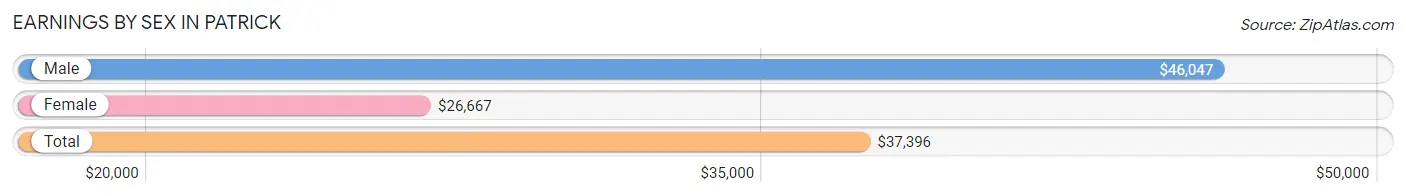
Earnings by Sex in Patrick
Average Earnings in Patrick are $37,396, $46,047 for men and $26,667 for women, a difference of 42.1%.
| Sex | Number | Average Earnings |
| Male | 103 (59.5%) | $46,047 |
| Female | 70 (40.5%) | $26,667 |
| Total | 173 (100.0%) | $37,396 |
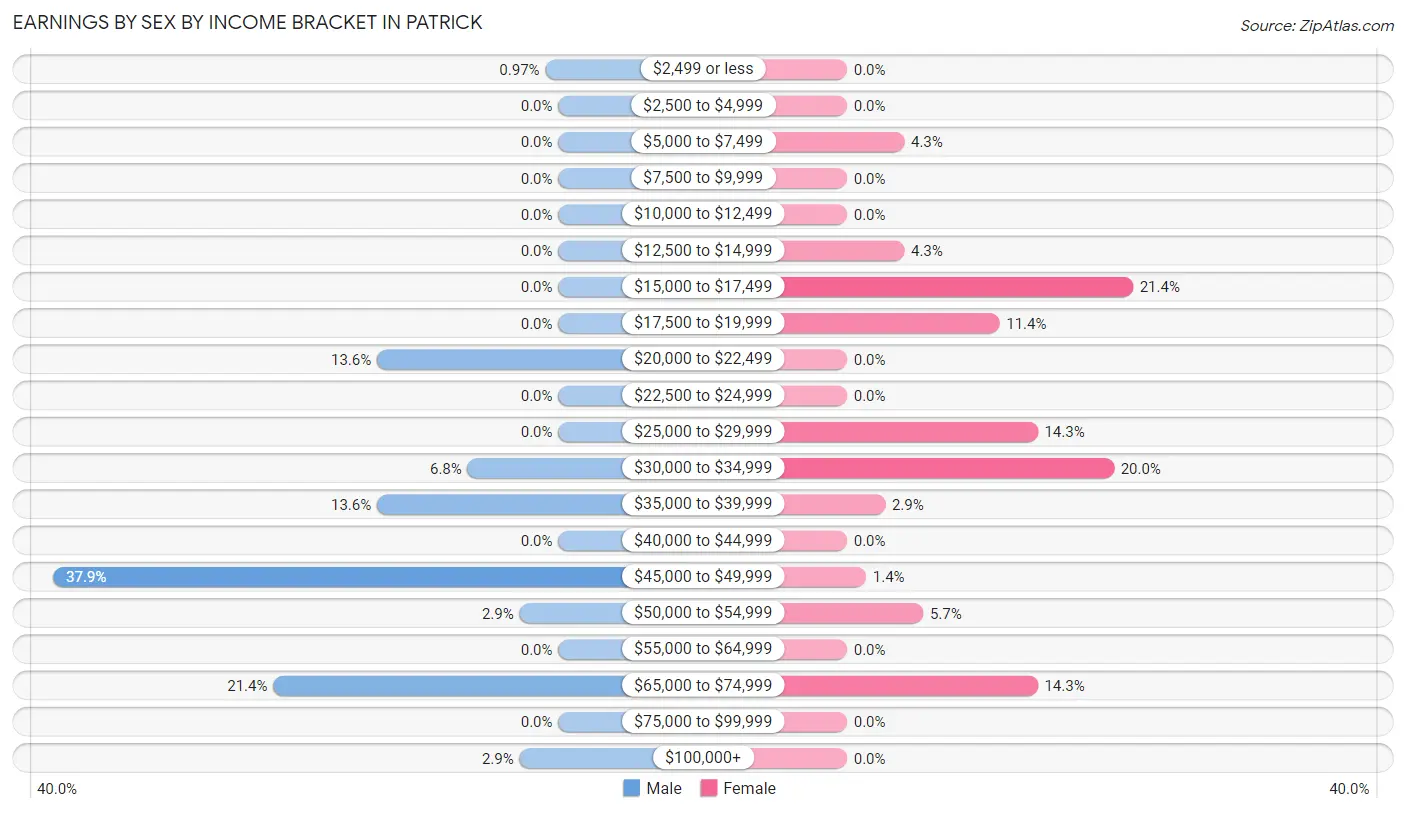
Earnings by Sex by Income Bracket in Patrick
The most common earnings brackets in Patrick are $45,000 to $49,999 for men (39 | 37.9%) and $15,000 to $17,499 for women (15 | 21.4%).
| Income | Male | Female |
| $2,499 or less | 1 (1.0%) | 0 (0.0%) |
| $2,500 to $4,999 | 0 (0.0%) | 0 (0.0%) |
| $5,000 to $7,499 | 0 (0.0%) | 3 (4.3%) |
| $7,500 to $9,999 | 0 (0.0%) | 0 (0.0%) |
| $10,000 to $12,499 | 0 (0.0%) | 0 (0.0%) |
| $12,500 to $14,999 | 0 (0.0%) | 3 (4.3%) |
| $15,000 to $17,499 | 0 (0.0%) | 15 (21.4%) |
| $17,500 to $19,999 | 0 (0.0%) | 8 (11.4%) |
| $20,000 to $22,499 | 14 (13.6%) | 0 (0.0%) |
| $22,500 to $24,999 | 0 (0.0%) | 0 (0.0%) |
| $25,000 to $29,999 | 0 (0.0%) | 10 (14.3%) |
| $30,000 to $34,999 | 7 (6.8%) | 14 (20.0%) |
| $35,000 to $39,999 | 14 (13.6%) | 2 (2.9%) |
| $40,000 to $44,999 | 0 (0.0%) | 0 (0.0%) |
| $45,000 to $49,999 | 39 (37.9%) | 1 (1.4%) |
| $50,000 to $54,999 | 3 (2.9%) | 4 (5.7%) |
| $55,000 to $64,999 | 0 (0.0%) | 0 (0.0%) |
| $65,000 to $74,999 | 22 (21.4%) | 10 (14.3%) |
| $75,000 to $99,999 | 0 (0.0%) | 0 (0.0%) |
| $100,000+ | 3 (2.9%) | 0 (0.0%) |
| Total | 103 (100.0%) | 70 (100.0%) |
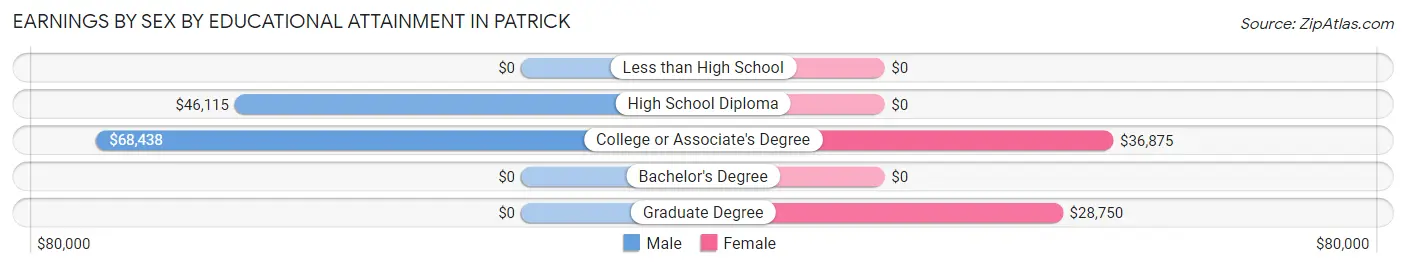
Earnings by Sex by Educational Attainment in Patrick
Average earnings in Patrick are $46,182 for men and $28,750 for women, a difference of 37.8%. Men with an educational attainment of college or associate's degree enjoy the highest average annual earnings of $68,438, while those with high school diploma education earn the least with $46,115. Women with an educational attainment of college or associate's degree earn the most with the average annual earnings of $36,875, while those with graduate degree education have the smallest earnings of $28,750.
| Educational Attainment | Male Income | Female Income |
| Less than High School | - | - |
| High School Diploma | $46,115 | $0 |
| College or Associate's Degree | $68,438 | $36,875 |
| Bachelor's Degree | - | - |
| Graduate Degree | - | - |
| Total | $46,182 | $28,750 |
Family Income in Patrick
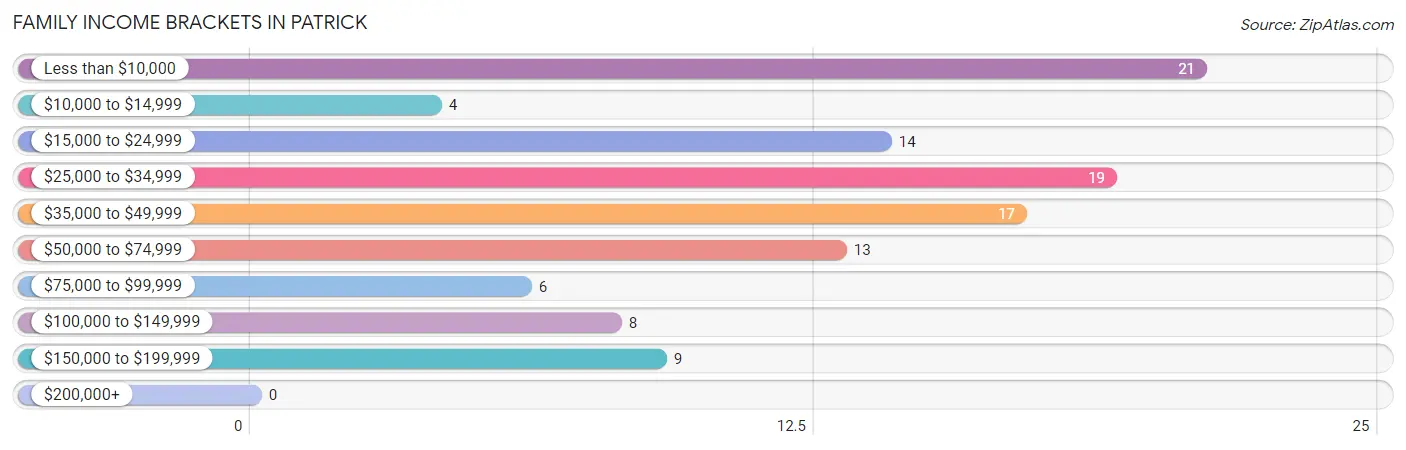
Family Income Brackets in Patrick
According to the Patrick family income data, there are 21 families falling into the less than $10,000 income range, which is the most common income bracket and makes up 18.9% of all families.
| Income Bracket | # Families | % Families |
| Less than $10,000 | 21 | 18.9% |
| $10,000 to $14,999 | 4 | 3.6% |
| $15,000 to $24,999 | 14 | 12.6% |
| $25,000 to $34,999 | 19 | 17.1% |
| $35,000 to $49,999 | 17 | 15.3% |
| $50,000 to $74,999 | 13 | 11.7% |
| $75,000 to $99,999 | 6 | 5.4% |
| $100,000 to $149,999 | 8 | 7.2% |
| $150,000 to $199,999 | 9 | 8.1% |
| $200,000+ | 0 | 0.0% |
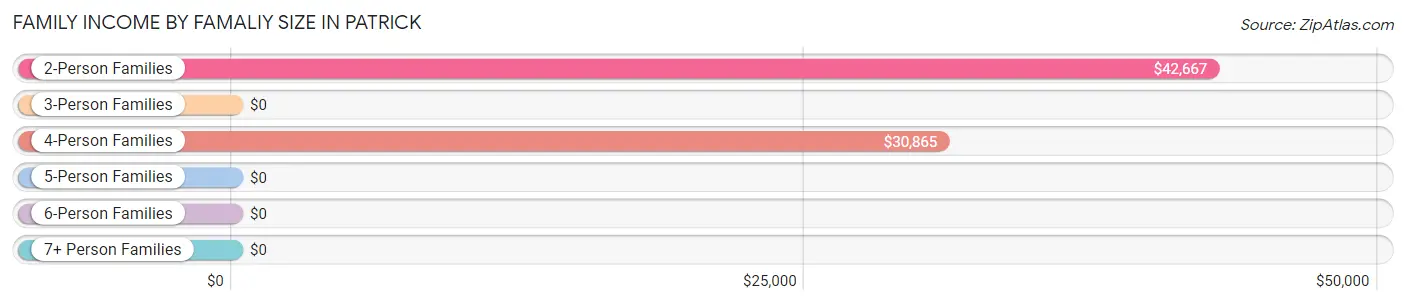
Family Income by Famaliy Size in Patrick
2-person families (56 | 50.4%) account for the highest median family income in Patrick with $42,667 per family, while 2-person families (56 | 50.4%) have the highest median income of $21,334 per family member.
| Income Bracket | # Families | Median Income |
| 2-Person Families | 56 (50.4%) | $42,667 |
| 3-Person Families | 31 (27.9%) | $0 |
| 4-Person Families | 19 (17.1%) | $30,865 |
| 5-Person Families | 4 (3.6%) | $0 |
| 6-Person Families | 1 (0.9%) | $0 |
| 7+ Person Families | 0 (0.0%) | $0 |
| Total | 111 (100.0%) | $32,083 |
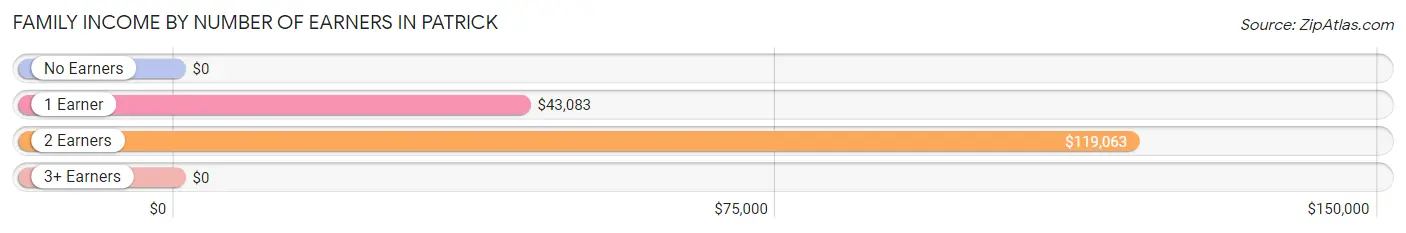
Family Income by Number of Earners in Patrick
| Number of Earners | # Families | Median Income |
| No Earners | 42 (37.8%) | $0 |
| 1 Earner | 45 (40.5%) | $43,083 |
| 2 Earners | 23 (20.7%) | $119,063 |
| 3+ Earners | 1 (0.9%) | $0 |
| Total | 111 (100.0%) | $32,083 |
Household Income in Patrick
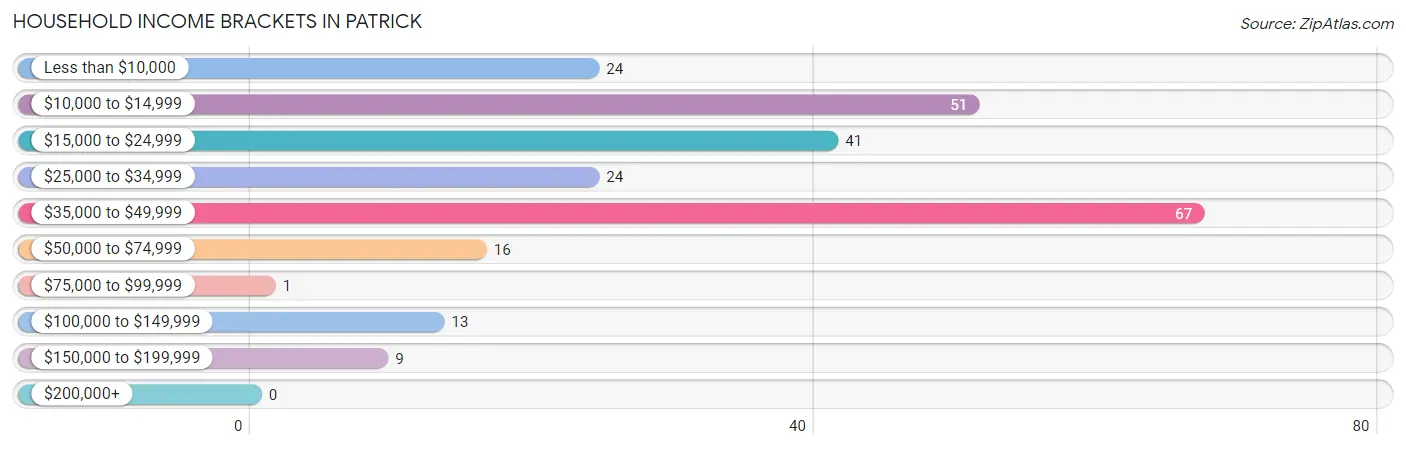
Household Income Brackets in Patrick
With 67 households falling in the category, the $35,000 to $49,999 income range is the most frequent in Patrick, accounting for 27.2% of all households.
| Income Bracket | # Households | % Households |
| Less than $10,000 | 24 | 9.8% |
| $10,000 to $14,999 | 51 | 20.7% |
| $15,000 to $24,999 | 41 | 16.7% |
| $25,000 to $34,999 | 24 | 9.8% |
| $35,000 to $49,999 | 67 | 27.2% |
| $50,000 to $74,999 | 16 | 6.5% |
| $75,000 to $99,999 | 1 | 0.4% |
| $100,000 to $149,999 | 13 | 5.3% |
| $150,000 to $199,999 | 9 | 3.7% |
| $200,000+ | 0 | 0.0% |
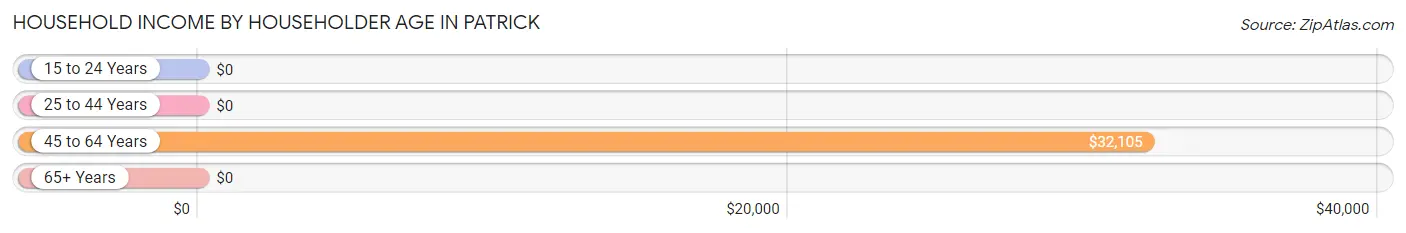
Household Income by Householder Age in Patrick
The median household income in Patrick is $30,263, with the highest median household income of $32,105 found in the 45 to 64 years age bracket for the primary householder. A total of 134 households (54.5%) fall into this category.
| Income Bracket | # Households | Median Income |
| 15 to 24 Years | 0 (0.0%) | $0 |
| 25 to 44 Years | 51 (20.7%) | $0 |
| 45 to 64 Years | 134 (54.5%) | $32,105 |
| 65+ Years | 61 (24.8%) | $0 |
| Total | 246 (100.0%) | $30,263 |
Poverty in Patrick
Income Below Poverty by Sex and Age in Patrick
With 25.4% poverty level for males and 37.0% for females among the residents of Patrick, 15 year old males and 5 year old females are the most vulnerable to poverty, with 6 males (85.7%) and 9 females (100.0%) in their respective age groups living below the poverty level.
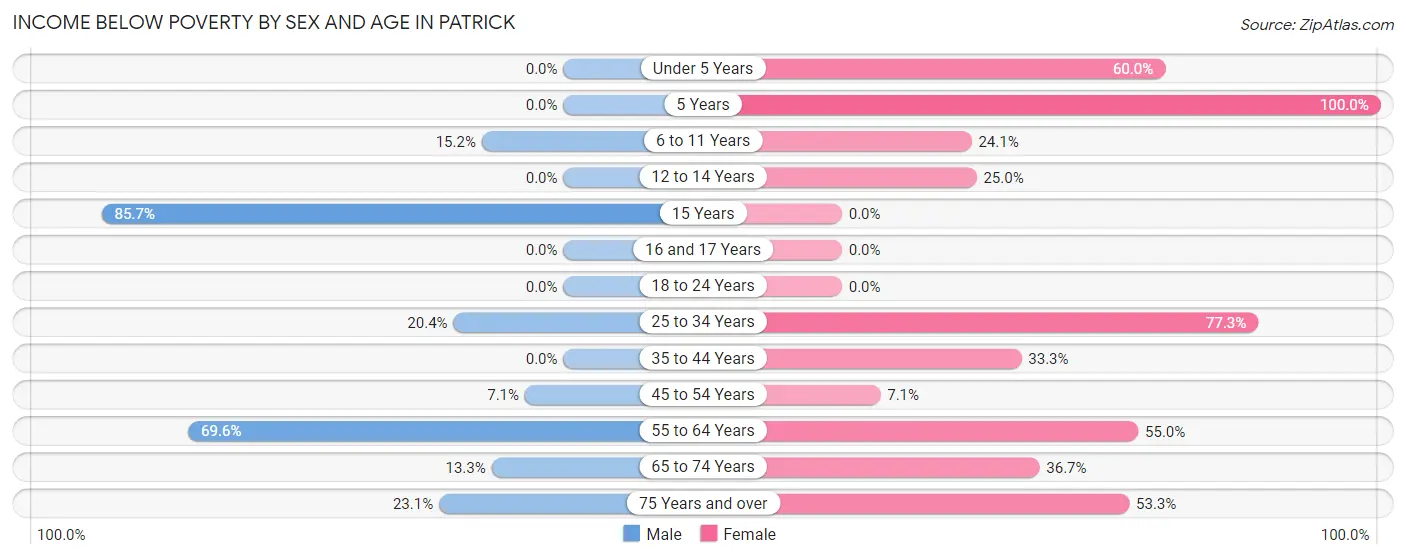
| Age Bracket | Male | Female |
| Under 5 Years | 0 (0.0%) | 3 (60.0%) |
| 5 Years | 0 (0.0%) | 9 (100.0%) |
| 6 to 11 Years | 5 (15.1%) | 13 (24.1%) |
| 12 to 14 Years | 0 (0.0%) | 2 (25.0%) |
| 15 Years | 6 (85.7%) | 0 (0.0%) |
| 16 and 17 Years | 0 (0.0%) | 0 (0.0%) |
| 18 to 24 Years | 0 (0.0%) | 0 (0.0%) |
| 25 to 34 Years | 10 (20.4%) | 17 (77.3%) |
| 35 to 44 Years | 0 (0.0%) | 4 (33.3%) |
| 45 to 54 Years | 5 (7.1%) | 2 (7.1%) |
| 55 to 64 Years | 39 (69.6%) | 11 (55.0%) |
| 65 to 74 Years | 4 (13.3%) | 11 (36.7%) |
| 75 Years and over | 3 (23.1%) | 8 (53.3%) |
| Total | 72 (25.4%) | 80 (37.0%) |
Income Above Poverty by Sex and Age in Patrick
According to the poverty statistics in Patrick, males aged 16 and 17 years and females aged 15 years are the age groups that are most secure financially, with 100.0% of males and 100.0% of females in these age groups living above the poverty line.
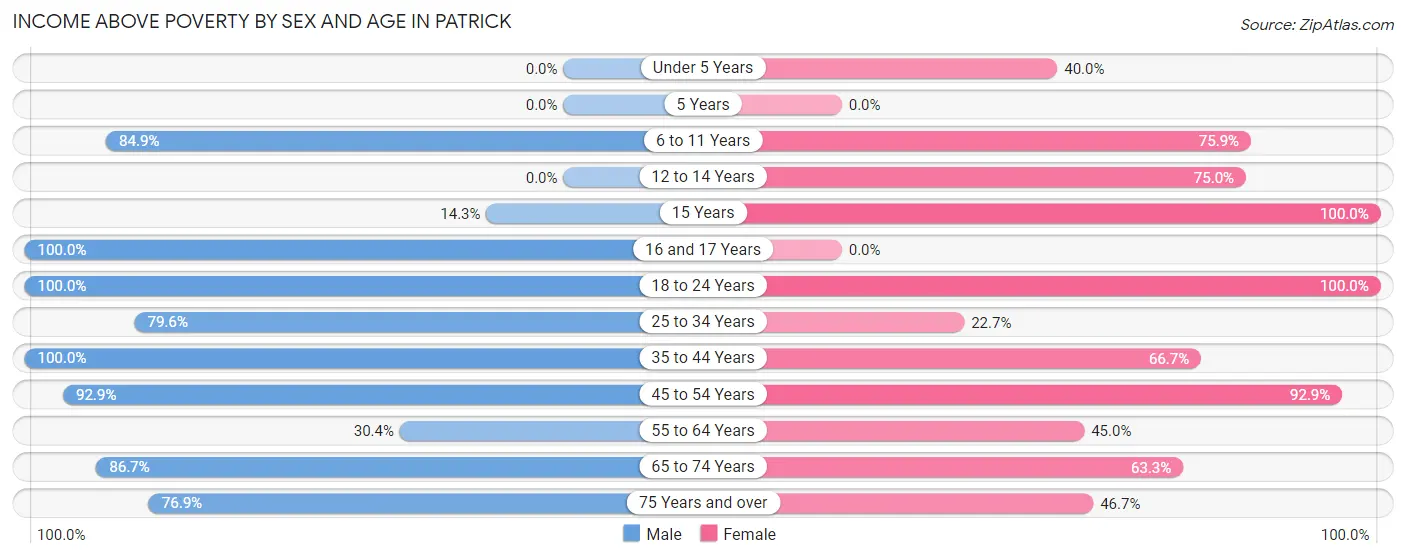
| Age Bracket | Male | Female |
| Under 5 Years | 0 (0.0%) | 2 (40.0%) |
| 5 Years | 0 (0.0%) | 0 (0.0%) |
| 6 to 11 Years | 28 (84.9%) | 41 (75.9%) |
| 12 to 14 Years | 0 (0.0%) | 6 (75.0%) |
| 15 Years | 1 (14.3%) | 4 (100.0%) |
| 16 and 17 Years | 14 (100.0%) | 0 (0.0%) |
| 18 to 24 Years | 8 (100.0%) | 9 (100.0%) |
| 25 to 34 Years | 39 (79.6%) | 5 (22.7%) |
| 35 to 44 Years | 4 (100.0%) | 8 (66.7%) |
| 45 to 54 Years | 65 (92.9%) | 26 (92.9%) |
| 55 to 64 Years | 17 (30.4%) | 9 (45.0%) |
| 65 to 74 Years | 26 (86.7%) | 19 (63.3%) |
| 75 Years and over | 10 (76.9%) | 7 (46.7%) |
| Total | 212 (74.7%) | 136 (63.0%) |
Income Below Poverty Among Married-Couple Families in Patrick
The poverty statistics for married-couple families in Patrick show that 4.3% or 2 of the total 46 families live below the poverty line. Families with no children have the highest poverty rate of 5.9%, comprising of 2 families. On the other hand, families with 1 or 2 children have the lowest poverty rate of 0.0%, which includes 0 families.
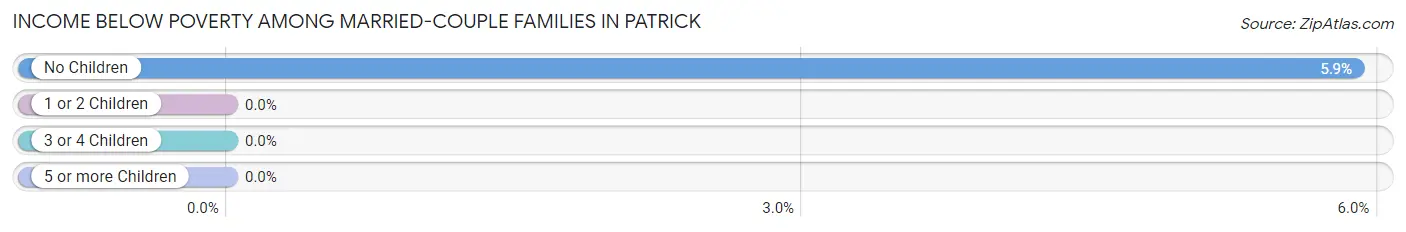
| Children | Above Poverty | Below Poverty |
| No Children | 32 (94.1%) | 2 (5.9%) |
| 1 or 2 Children | 11 (100.0%) | 0 (0.0%) |
| 3 or 4 Children | 1 (100.0%) | 0 (0.0%) |
| 5 or more Children | 0 (0.0%) | 0 (0.0%) |
| Total | 44 (95.7%) | 2 (4.3%) |
Income Below Poverty Among Single-Parent Households in Patrick
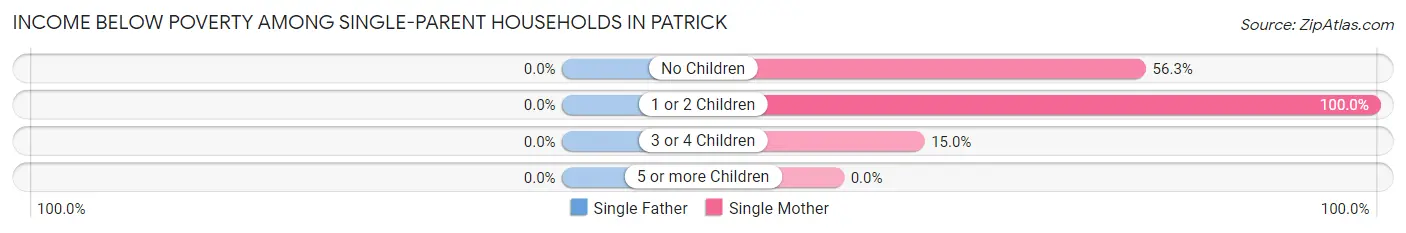
| Children | Single Father | Single Mother |
| No Children | 0 (0.0%) | 9 (56.2%) |
| 1 or 2 Children | 0 (0.0%) | 16 (100.0%) |
| 3 or 4 Children | 0 (0.0%) | 3 (15.0%) |
| 5 or more Children | 0 (0.0%) | 0 (0.0%) |
| Total | 0 (0.0%) | 28 (53.8%) |
Income Below Poverty Among Married-Couple vs Single-Parent Households in Patrick
The poverty data for Patrick shows that 2 of the married-couple family households (4.3%) and 28 of the single-parent households (43.1%) are living below the poverty level. Within the married-couple family households, those with no children have the highest poverty rate, with 2 households (5.9%) falling below the poverty line. Among the single-parent households, those with 1 or 2 children have the highest poverty rate, with 16 household (94.1%) living below poverty.
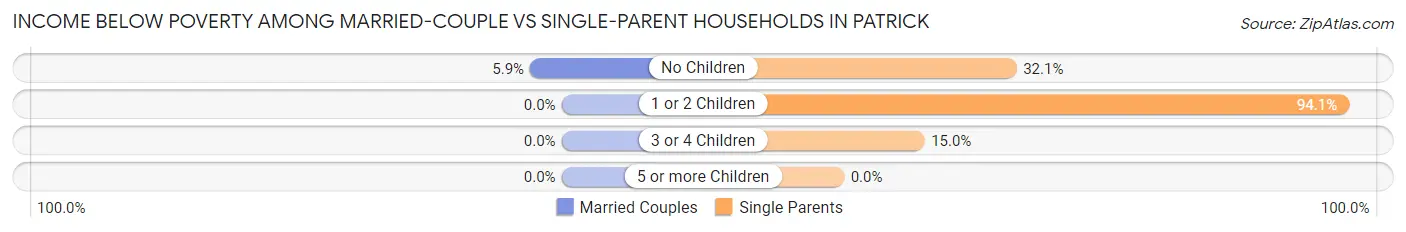
| Children | Married-Couple Families | Single-Parent Households |
| No Children | 2 (5.9%) | 9 (32.1%) |
| 1 or 2 Children | 0 (0.0%) | 16 (94.1%) |
| 3 or 4 Children | 0 (0.0%) | 3 (15.0%) |
| 5 or more Children | 0 (0.0%) | 0 (0.0%) |
| Total | 2 (4.3%) | 28 (43.1%) |
Race in Patrick
The most populous races in Patrick are White / Caucasian (355 | 71.0%), Black / African American (99 | 19.8%), and Two or more Races (42 | 8.4%).
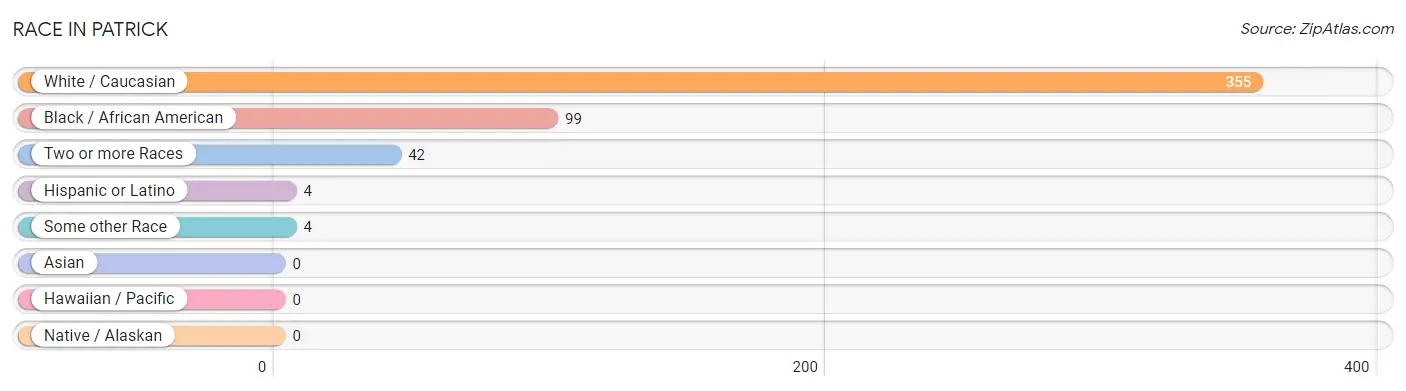
| Race | # Population | % Population |
| Asian | 0 | 0.0% |
| Black / African American | 99 | 19.8% |
| Hawaiian / Pacific | 0 | 0.0% |
| Hispanic or Latino | 4 | 0.8% |
| Native / Alaskan | 0 | 0.0% |
| White / Caucasian | 355 | 71.0% |
| Two or more Races | 42 | 8.4% |
| Some other Race | 4 | 0.8% |
| Total | 500 | 100.0% |
Ancestry in Patrick
The most populous ancestries reported in Patrick are Irish (38 | 7.6%), English (29 | 5.8%), German (29 | 5.8%), Nigerian (26 | 5.2%), and Subsaharan African (26 | 5.2%), together accounting for 29.6% of all Patrick residents.
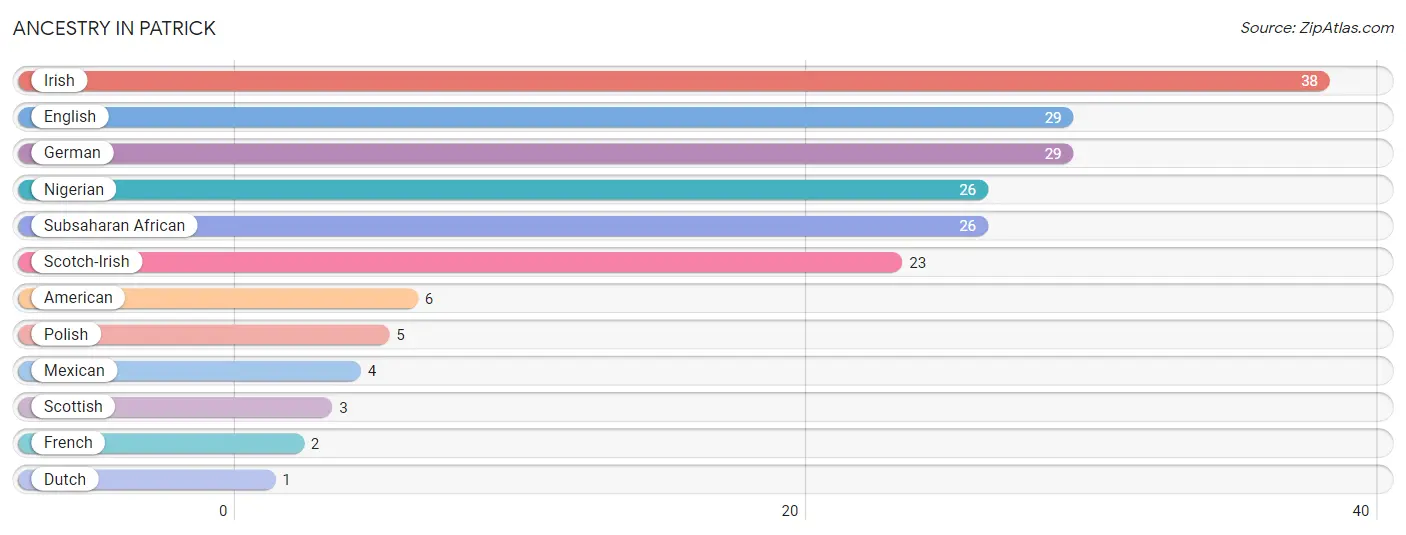
| Ancestry | # Population | % Population |
| American | 6 | 1.2% |
| Dutch | 1 | 0.2% |
| English | 29 | 5.8% |
| French | 2 | 0.4% |
| German | 29 | 5.8% |
| Irish | 38 | 7.6% |
| Mexican | 4 | 0.8% |
| Nigerian | 26 | 5.2% |
| Polish | 5 | 1.0% |
| Scotch-Irish | 23 | 4.6% |
| Scottish | 3 | 0.6% |
| Subsaharan African | 26 | 5.2% | View All 12 Rows |
Immigrants in Patrick

| Immigration Origin | # Population | % Population | View All 0 Rows |
Sex and Age in Patrick
Sex and Age in Patrick
The most populous age groups in Patrick are 45 to 49 Years (39 | 13.7%) for men and 5 to 9 Years (53 | 24.5%) for women.
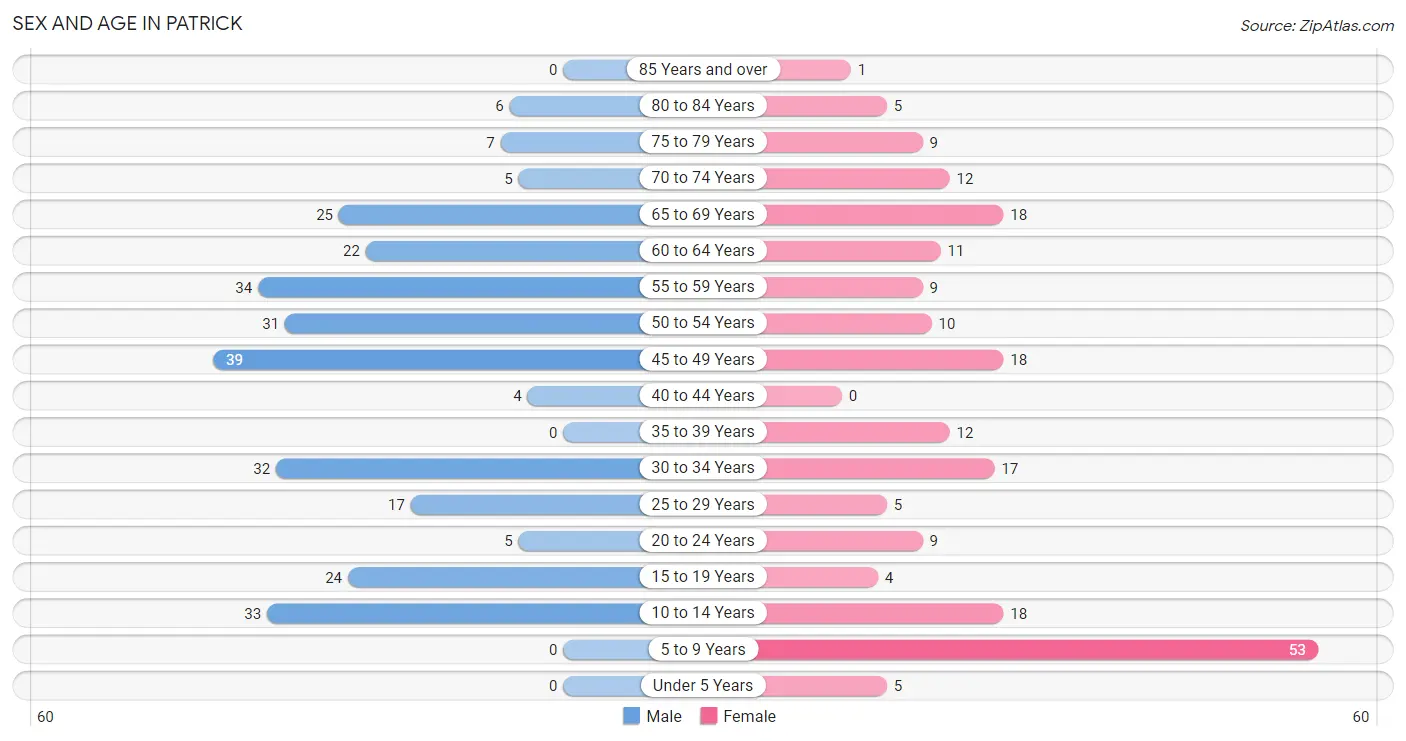
| Age Bracket | Male | Female |
| Under 5 Years | 0 (0.0%) | 5 (2.3%) |
| 5 to 9 Years | 0 (0.0%) | 53 (24.5%) |
| 10 to 14 Years | 33 (11.6%) | 18 (8.3%) |
| 15 to 19 Years | 24 (8.5%) | 4 (1.8%) |
| 20 to 24 Years | 5 (1.8%) | 9 (4.2%) |
| 25 to 29 Years | 17 (6.0%) | 5 (2.3%) |
| 30 to 34 Years | 32 (11.3%) | 17 (7.9%) |
| 35 to 39 Years | 0 (0.0%) | 12 (5.6%) |
| 40 to 44 Years | 4 (1.4%) | 0 (0.0%) |
| 45 to 49 Years | 39 (13.7%) | 18 (8.3%) |
| 50 to 54 Years | 31 (10.9%) | 10 (4.6%) |
| 55 to 59 Years | 34 (12.0%) | 9 (4.2%) |
| 60 to 64 Years | 22 (7.7%) | 11 (5.1%) |
| 65 to 69 Years | 25 (8.8%) | 18 (8.3%) |
| 70 to 74 Years | 5 (1.8%) | 12 (5.6%) |
| 75 to 79 Years | 7 (2.5%) | 9 (4.2%) |
| 80 to 84 Years | 6 (2.1%) | 5 (2.3%) |
| 85 Years and over | 0 (0.0%) | 1 (0.5%) |
| Total | 284 (100.0%) | 216 (100.0%) |
Families and Households in Patrick
Median Family Size in Patrick
The median family size in Patrick is 3.08 persons per family, with single female/mother families (52 | 46.9%) accounting for the largest median family size of 3.94 persons per family. On the other hand, single male/father families (13 | 11.7%) represent the smallest median family size with 2.31 persons per family.
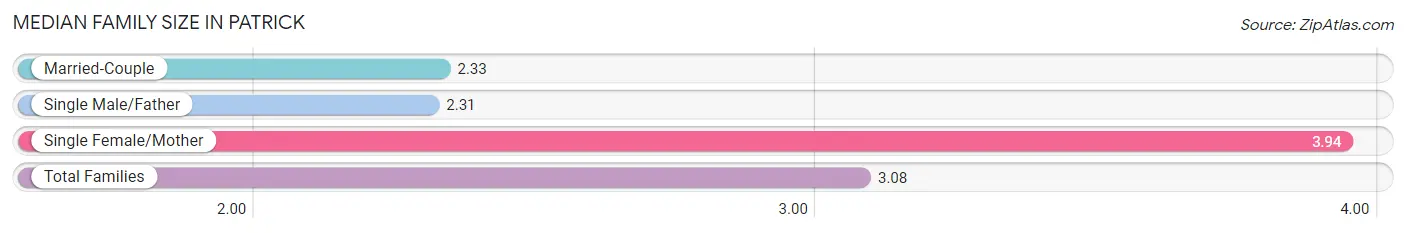
| Family Type | # Families | Family Size |
| Married-Couple | 46 (41.4%) | 2.33 |
| Single Male/Father | 13 (11.7%) | 2.31 |
| Single Female/Mother | 52 (46.9%) | 3.94 |
| Total Families | 111 (100.0%) | 3.08 |
Median Household Size in Patrick
The median household size in Patrick is 2.03 persons per household, with single female/mother households (52 | 21.1%) accounting for the largest median household size of 4.27 persons per household. non-family households (135 | 54.9%) represent the smallest median household size with 1.04 persons per household.
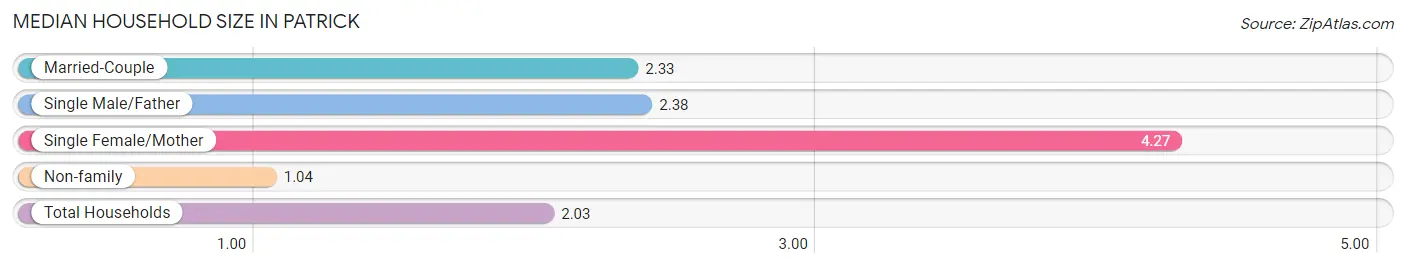
| Household Type | # Households | Household Size |
| Married-Couple | 46 (18.7%) | 2.33 |
| Single Male/Father | 13 (5.3%) | 2.38 |
| Single Female/Mother | 52 (21.1%) | 4.27 |
| Non-family | 135 (54.9%) | 1.04 |
| Total Households | 246 (100.0%) | 2.03 |
Household Size by Marriage Status in Patrick
Out of a total of 246 households in Patrick, 111 (45.1%) are family households, while 135 (54.9%) are nonfamily households. The most numerous type of family households are 2-person households, comprising 56, and the most common type of nonfamily households are 1-person households, comprising 131.
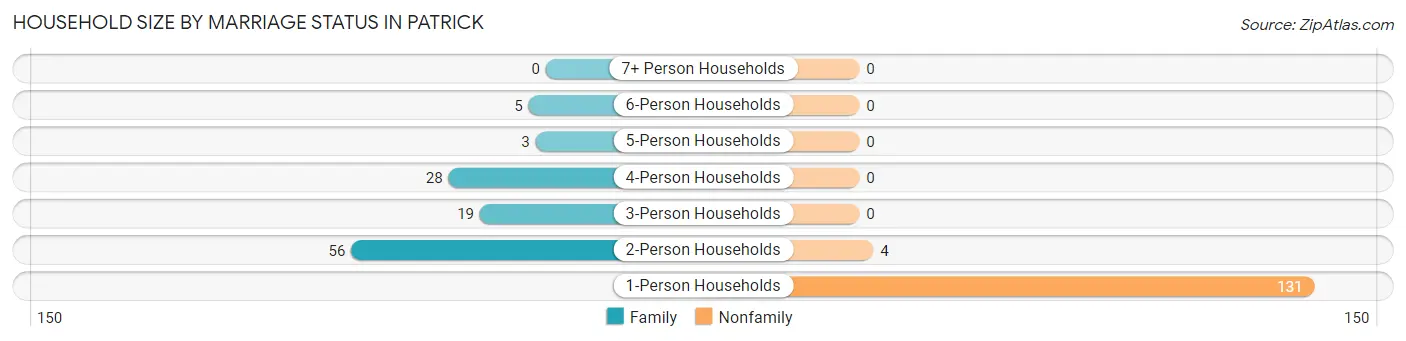
| Household Size | Family Households | Nonfamily Households |
| 1-Person Households | - | 131 (53.2%) |
| 2-Person Households | 56 (22.8%) | 4 (1.6%) |
| 3-Person Households | 19 (7.7%) | 0 (0.0%) |
| 4-Person Households | 28 (11.4%) | 0 (0.0%) |
| 5-Person Households | 3 (1.2%) | 0 (0.0%) |
| 6-Person Households | 5 (2.0%) | 0 (0.0%) |
| 7+ Person Households | 0 (0.0%) | 0 (0.0%) |
| Total | 111 (45.1%) | 135 (54.9%) |
Female Fertility in Patrick
Fertility by Age in Patrick
Average fertility rate in Patrick is 15.0 births per 1,000 women. Women in the age bracket of 20 to 34 years have the highest fertility rate with 32.0 births per 1,000 women. Women in the age bracket of 20 to 34 years acount for 100.0% of all women with births.
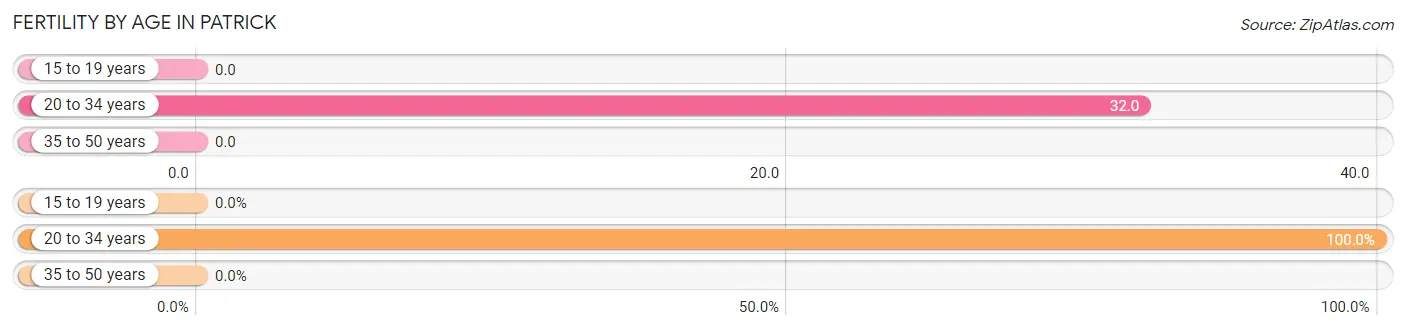
| Age Bracket | Women with Births | Births / 1,000 Women |
| 15 to 19 years | 0 (0.0%) | 0.0 |
| 20 to 34 years | 1 (100.0%) | 32.0 |
| 35 to 50 years | 0 (0.0%) | 0.0 |
| Total | 1 (100.0%) | 15.0 |
Fertility by Age by Marriage Status in Patrick
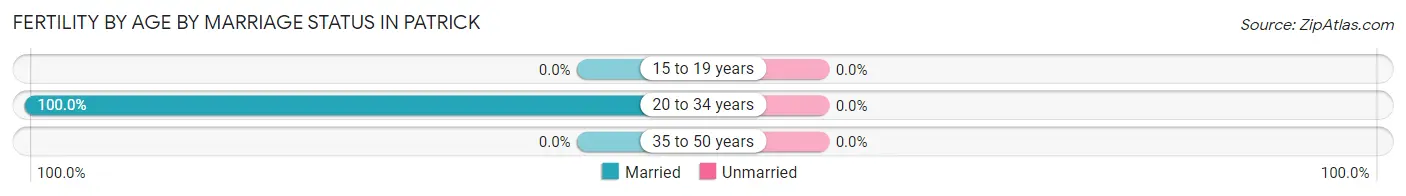
| Age Bracket | Married | Unmarried |
| 15 to 19 years | 0 (0.0%) | 0 (0.0%) |
| 20 to 34 years | 1 (100.0%) | 0 (0.0%) |
| 35 to 50 years | 0 (0.0%) | 0 (0.0%) |
| Total | 1 (100.0%) | 0 (0.0%) |
Fertility by Education in Patrick
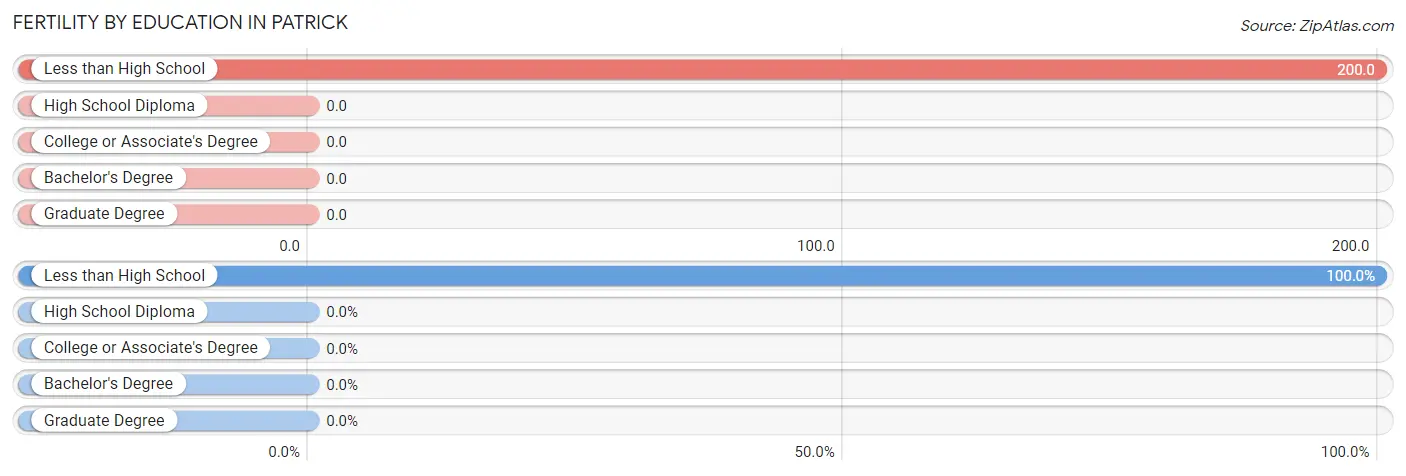
| Educational Attainment | Women with Births | Births / 1,000 Women |
| Less than High School | 1 (100.0%) | 200.0 |
| High School Diploma | 0 (0.0%) | 0.0 |
| College or Associate's Degree | 0 (0.0%) | 0.0 |
| Bachelor's Degree | 0 (0.0%) | 0.0 |
| Graduate Degree | 0 (0.0%) | 0.0 |
| Total | 1 (100.0%) | 15.0 |
Fertility by Education by Marriage Status in Patrick
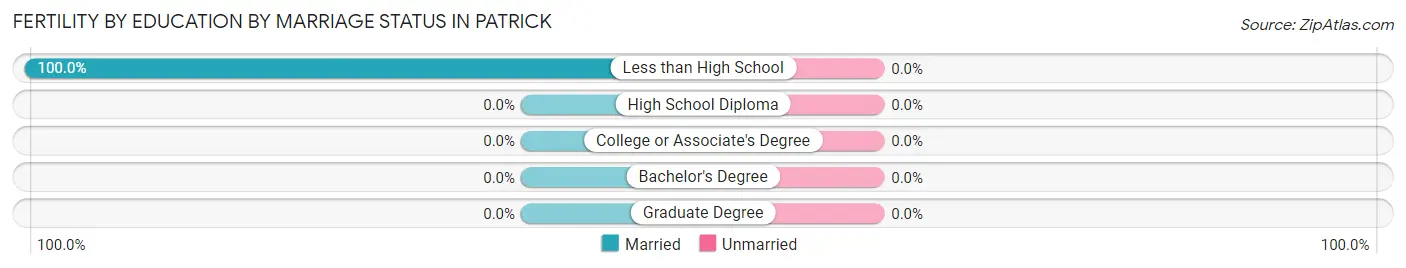
| Educational Attainment | Married | Unmarried |
| Less than High School | 1 (100.0%) | 0 (0.0%) |
| High School Diploma | 0 (0.0%) | 0 (0.0%) |
| College or Associate's Degree | 0 (0.0%) | 0 (0.0%) |
| Bachelor's Degree | 0 (0.0%) | 0 (0.0%) |
| Graduate Degree | 0 (0.0%) | 0 (0.0%) |
| Total | 1 (100.0%) | 0 (0.0%) |
Employment Characteristics in Patrick
Employment by Class of Employer in Patrick
Among the 154 employed individuals in Patrick, private company employees (120 | 77.9%), state government employees (19 | 12.3%), and not-for-profit organizations (6 | 3.9%) make up the most common classes of employment.
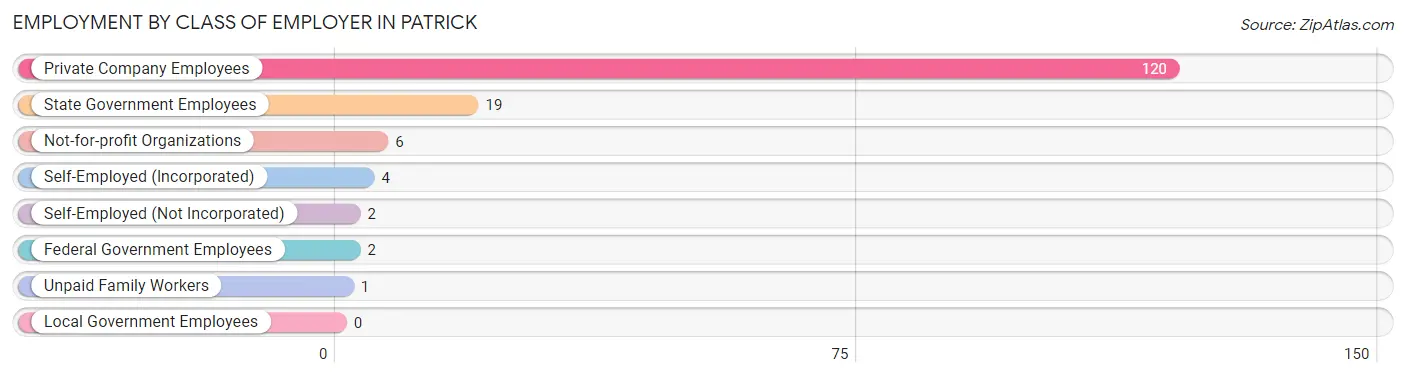
| Employer Class | # Employees | % Employees |
| Private Company Employees | 120 | 77.9% |
| Self-Employed (Incorporated) | 4 | 2.6% |
| Self-Employed (Not Incorporated) | 2 | 1.3% |
| Not-for-profit Organizations | 6 | 3.9% |
| Local Government Employees | 0 | 0.0% |
| State Government Employees | 19 | 12.3% |
| Federal Government Employees | 2 | 1.3% |
| Unpaid Family Workers | 1 | 0.6% |
| Total | 154 | 100.0% |
Employment Status by Age in Patrick
According to the labor force statistics for Patrick, out of the total population over 16 years of age (380), 48.7% or 185 individuals are in the labor force, with 14.6% or 27 of them unemployed. The age group with the highest labor force participation rate is 25 to 29 years, with 100.0% or 22 individuals in the labor force. Within the labor force, the 25 to 29 years age range has the highest percentage of unemployed individuals, with 63.6% or 14 of them being unemployed.
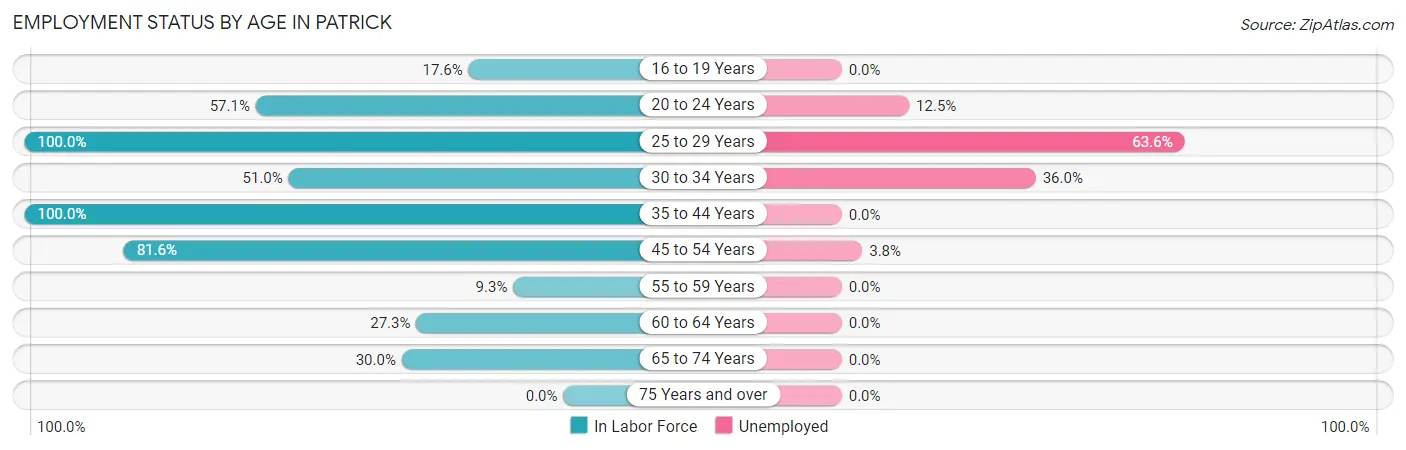
| Age Bracket | In Labor Force | Unemployed |
| 16 to 19 Years | 3 (17.6%) | 0 (0.0%) |
| 20 to 24 Years | 8 (57.1%) | 1 (12.5%) |
| 25 to 29 Years | 22 (100.0%) | 14 (63.6%) |
| 30 to 34 Years | 25 (51.0%) | 9 (36.0%) |
| 35 to 44 Years | 16 (100.0%) | 0 (0.0%) |
| 45 to 54 Years | 80 (81.6%) | 3 (3.8%) |
| 55 to 59 Years | 4 (9.3%) | 0 (0.0%) |
| 60 to 64 Years | 9 (27.3%) | 0 (0.0%) |
| 65 to 74 Years | 18 (30.0%) | 0 (0.0%) |
| 75 Years and over | 0 (0.0%) | 0 (0.0%) |
| Total | 185 (48.7%) | 27 (14.6%) |
Employment Status by Educational Attainment in Patrick
According to labor force statistics for Patrick, 59.8% of individuals (156) out of the total population between 25 and 64 years of age (261) are in the labor force, with 16.7% or 26 of them being unemployed. The group with the highest labor force participation rate are those with the educational attainment of bachelor's degree or higher, with 88.9% or 16 individuals in the labor force. Within the labor force, individuals with less than high school education have the highest percentage of unemployment, with 61.5% or 16 of them being unemployed.
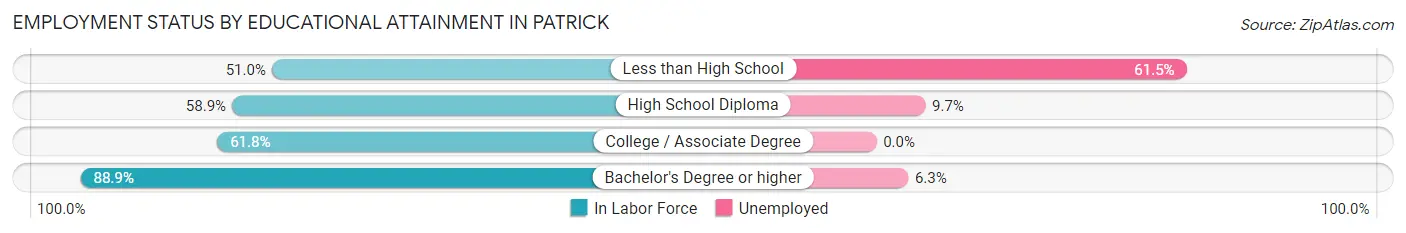
| Educational Attainment | In Labor Force | Unemployed |
| Less than High School | 26 (51.0%) | 31 (61.5%) |
| High School Diploma | 93 (58.9%) | 15 (9.7%) |
| College / Associate Degree | 21 (61.8%) | 0 (0.0%) |
| Bachelor's Degree or higher | 16 (88.9%) | 1 (6.3%) |
| Total | 156 (59.8%) | 44 (16.7%) |
Employment Occupations by Sex in Patrick
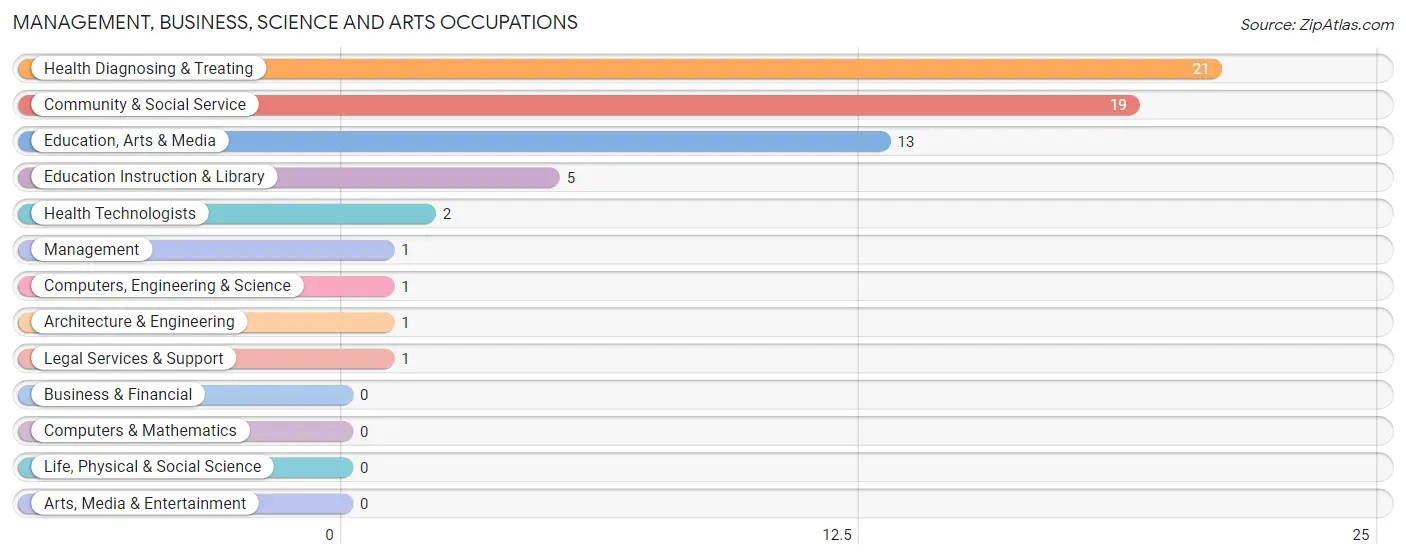
Management, Business, Science and Arts Occupations
The most common Management, Business, Science and Arts occupations in Patrick are Health Diagnosing & Treating (21 | 13.3%), Community & Social Service (19 | 12.0%), Education, Arts & Media (13 | 8.2%), Education Instruction & Library (5 | 3.2%), and Health Technologists (2 | 1.3%).
Management, Business, Science and Arts Occupations by Sex
Within the Management, Business, Science and Arts occupations in Patrick, the most male-oriented occupations are Management (100.0%), Computers, Engineering & Science (100.0%), and Architecture & Engineering (100.0%), while the most female-oriented occupations are Community & Social Service (100.0%), Education, Arts & Media (100.0%), and Legal Services & Support (100.0%).
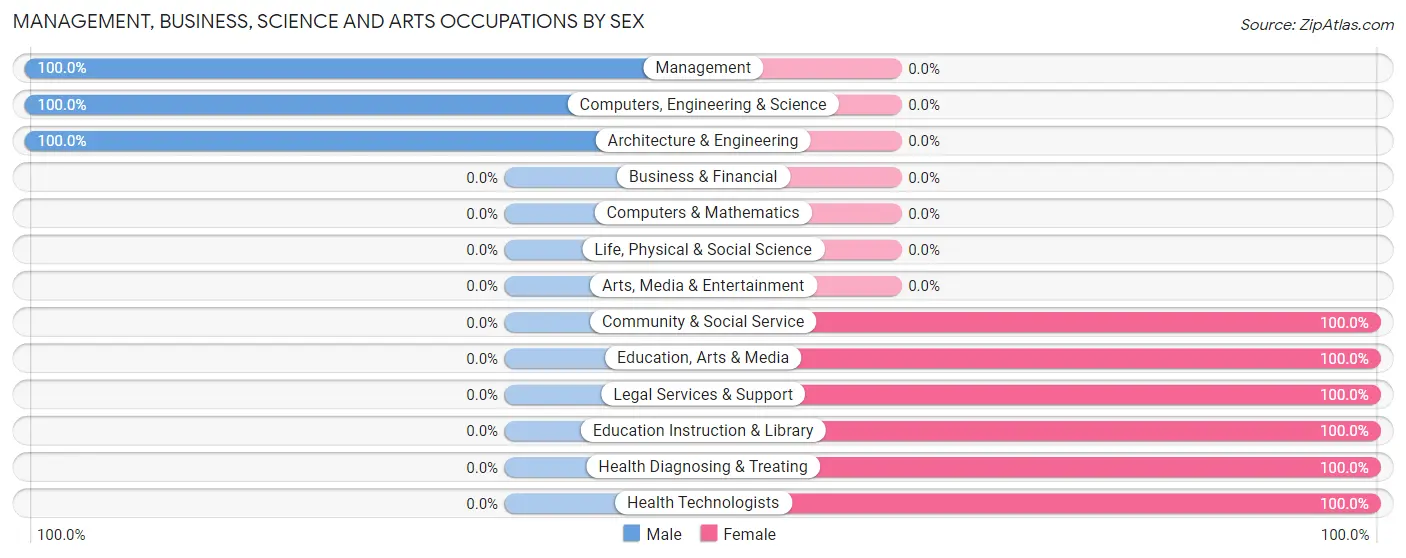
| Occupation | Male | Female |
| Management | 1 (100.0%) | 0 (0.0%) |
| Business & Financial | 0 (0.0%) | 0 (0.0%) |
| Computers, Engineering & Science | 1 (100.0%) | 0 (0.0%) |
| Computers & Mathematics | 0 (0.0%) | 0 (0.0%) |
| Architecture & Engineering | 1 (100.0%) | 0 (0.0%) |
| Life, Physical & Social Science | 0 (0.0%) | 0 (0.0%) |
| Community & Social Service | 0 (0.0%) | 19 (100.0%) |
| Education, Arts & Media | 0 (0.0%) | 13 (100.0%) |
| Legal Services & Support | 0 (0.0%) | 1 (100.0%) |
| Education Instruction & Library | 0 (0.0%) | 5 (100.0%) |
| Arts, Media & Entertainment | 0 (0.0%) | 0 (0.0%) |
| Health Diagnosing & Treating | 0 (0.0%) | 21 (100.0%) |
| Health Technologists | 0 (0.0%) | 2 (100.0%) |
| Total (Category) | 2 (4.8%) | 40 (95.2%) |
| Total (Overall) | 88 (55.7%) | 70 (44.3%) |
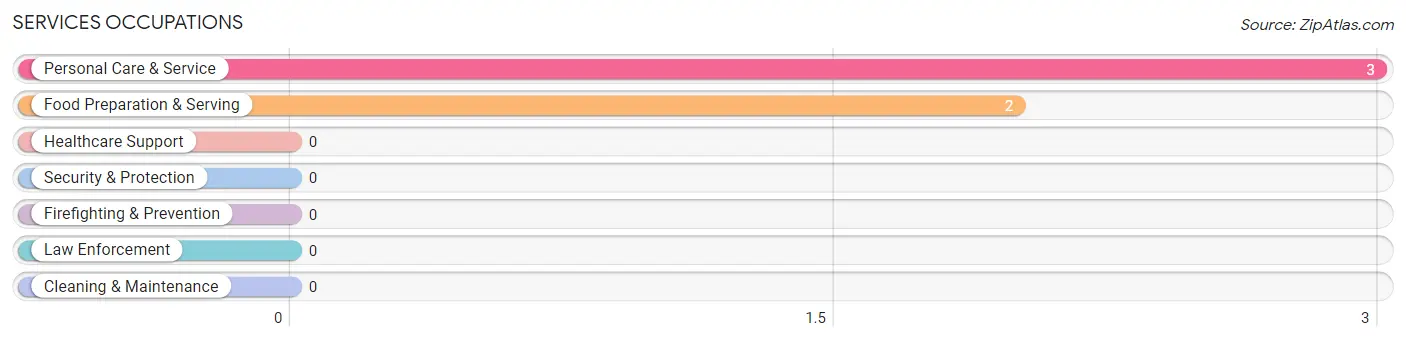
Services Occupations
The most common Services occupations in Patrick are Personal Care & Service (3 | 1.9%), and Food Preparation & Serving (2 | 1.3%).
Services Occupations by Sex
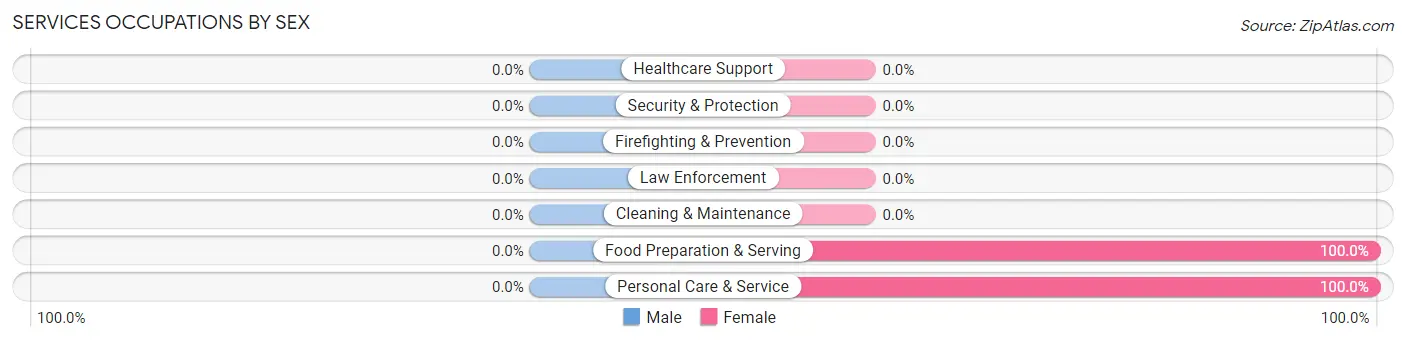
| Occupation | Male | Female |
| Healthcare Support | 0 (0.0%) | 0 (0.0%) |
| Security & Protection | 0 (0.0%) | 0 (0.0%) |
| Firefighting & Prevention | 0 (0.0%) | 0 (0.0%) |
| Law Enforcement | 0 (0.0%) | 0 (0.0%) |
| Food Preparation & Serving | 0 (0.0%) | 2 (100.0%) |
| Cleaning & Maintenance | 0 (0.0%) | 0 (0.0%) |
| Personal Care & Service | 0 (0.0%) | 3 (100.0%) |
| Total (Category) | 0 (0.0%) | 5 (100.0%) |
| Total (Overall) | 88 (55.7%) | 70 (44.3%) |
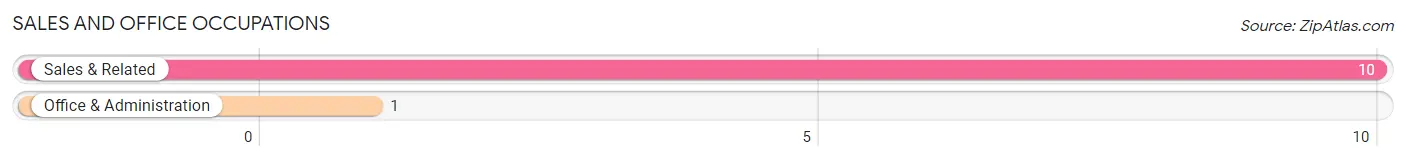
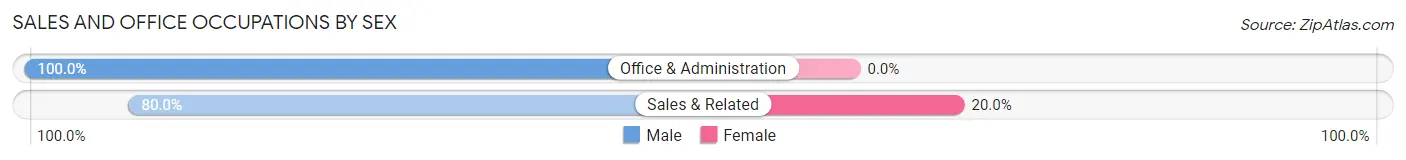
Sales and Office Occupations
The most common Sales and Office occupations in Patrick are Sales & Related (10 | 6.3%), and Office & Administration (1 | 0.6%).
Sales and Office Occupations by Sex
| Occupation | Male | Female |
| Sales & Related | 8 (80.0%) | 2 (20.0%) |
| Office & Administration | 1 (100.0%) | 0 (0.0%) |
| Total (Category) | 9 (81.8%) | 2 (18.2%) |
| Total (Overall) | 88 (55.7%) | 70 (44.3%) |
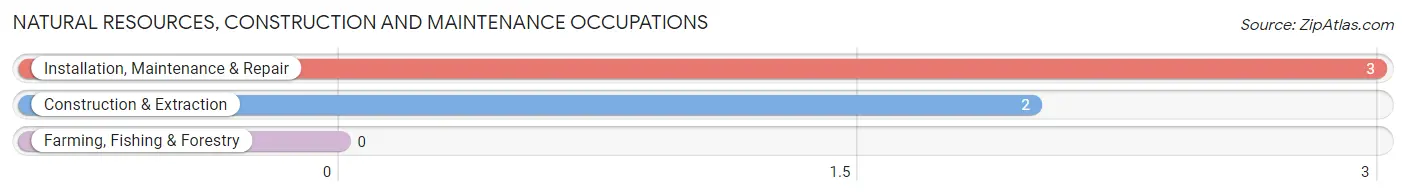
Natural Resources, Construction and Maintenance Occupations
The most common Natural Resources, Construction and Maintenance occupations in Patrick are Installation, Maintenance & Repair (3 | 1.9%), and Construction & Extraction (2 | 1.3%).
Natural Resources, Construction and Maintenance Occupations by Sex
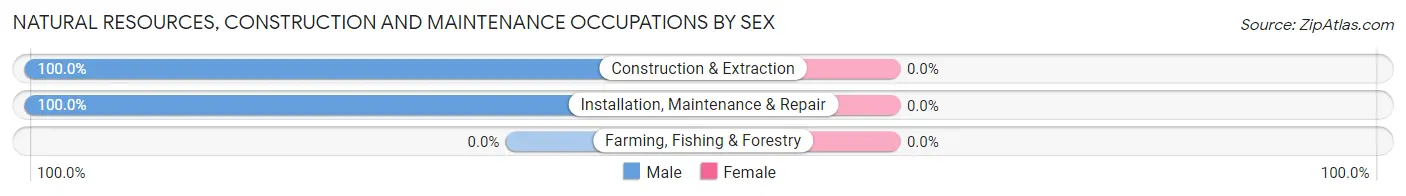
| Occupation | Male | Female |
| Farming, Fishing & Forestry | 0 (0.0%) | 0 (0.0%) |
| Construction & Extraction | 2 (100.0%) | 0 (0.0%) |
| Installation, Maintenance & Repair | 3 (100.0%) | 0 (0.0%) |
| Total (Category) | 5 (100.0%) | 0 (0.0%) |
| Total (Overall) | 88 (55.7%) | 70 (44.3%) |
Production, Transportation and Moving Occupations
The most common Production, Transportation and Moving occupations in Patrick are Production (47 | 29.7%), Material Moving (47 | 29.7%), and Transportation (1 | 0.6%).
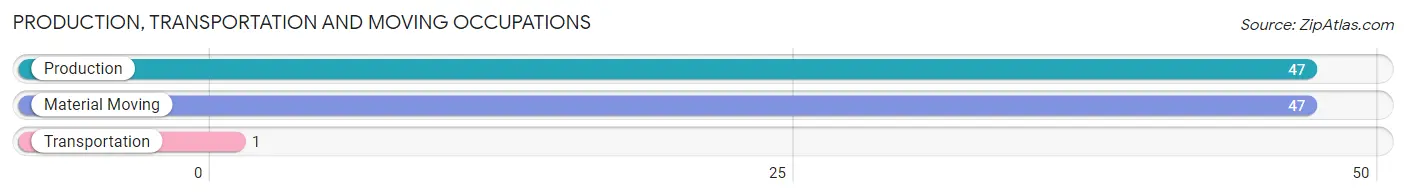
Production, Transportation and Moving Occupations by Sex
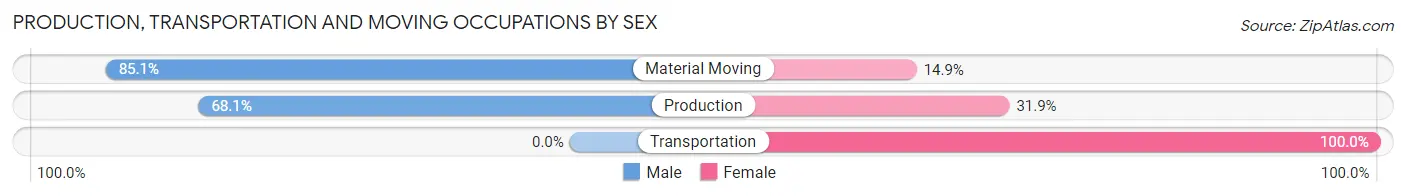
| Occupation | Male | Female |
| Production | 32 (68.1%) | 15 (31.9%) |
| Transportation | 0 (0.0%) | 1 (100.0%) |
| Material Moving | 40 (85.1%) | 7 (14.9%) |
| Total (Category) | 72 (75.8%) | 23 (24.2%) |
| Total (Overall) | 88 (55.7%) | 70 (44.3%) |
Employment Industries by Sex in Patrick
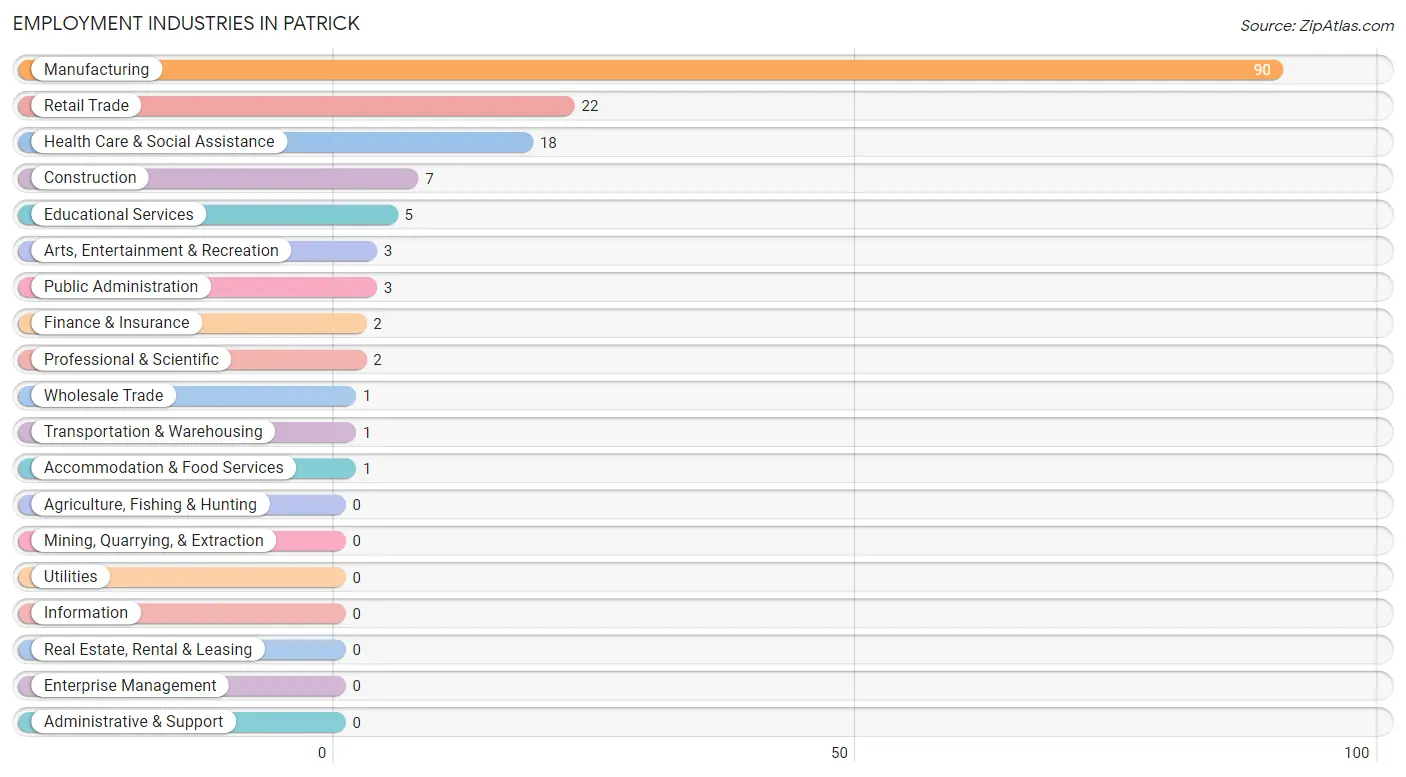
Employment Industries in Patrick
The major employment industries in Patrick include Manufacturing (90 | 57.0%), Retail Trade (22 | 13.9%), Health Care & Social Assistance (18 | 11.4%), Construction (7 | 4.4%), and Educational Services (5 | 3.2%).
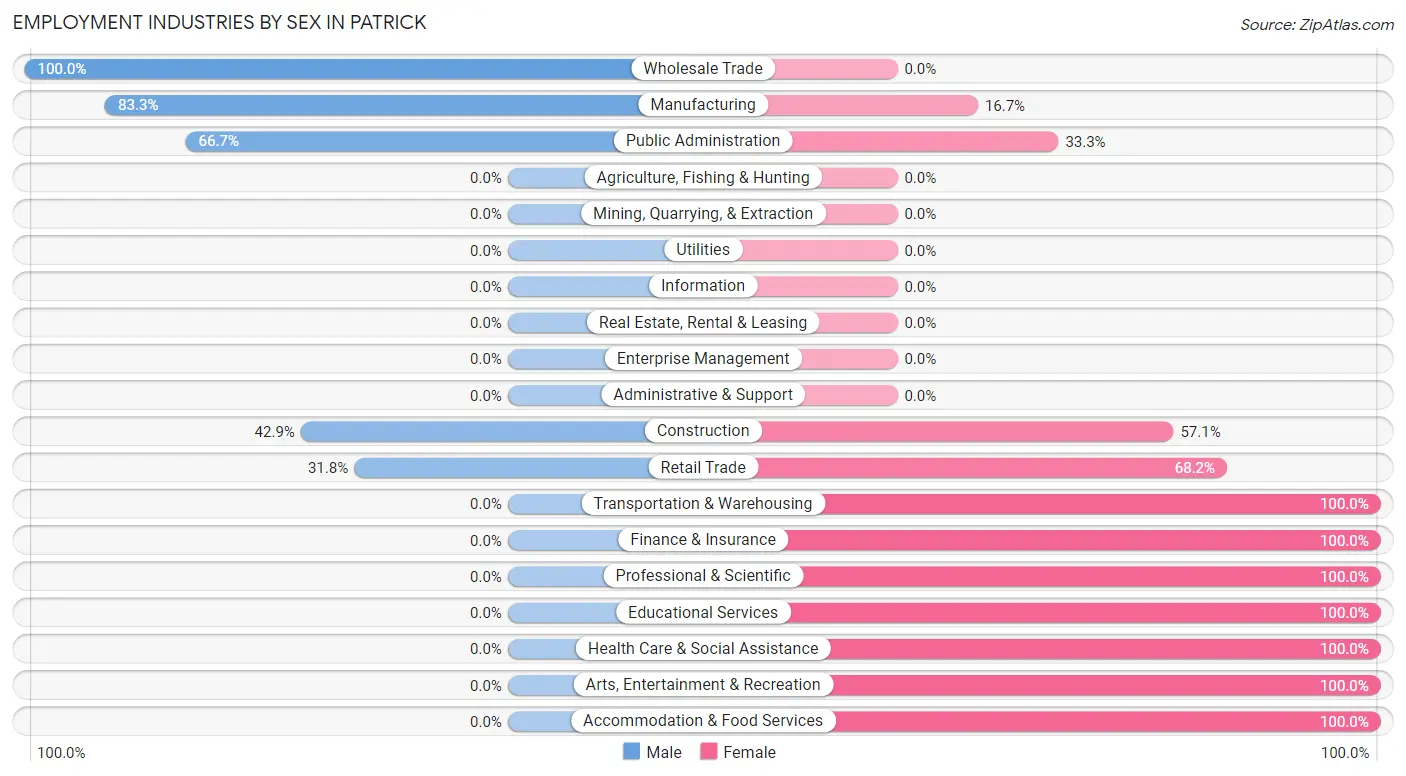
Employment Industries by Sex in Patrick
The Patrick industries that see more men than women are Wholesale Trade (100.0%), Manufacturing (83.3%), and Public Administration (66.7%), whereas the industries that tend to have a higher number of women are Transportation & Warehousing (100.0%), Finance & Insurance (100.0%), and Professional & Scientific (100.0%).
| Industry | Male | Female |
| Agriculture, Fishing & Hunting | 0 (0.0%) | 0 (0.0%) |
| Mining, Quarrying, & Extraction | 0 (0.0%) | 0 (0.0%) |
| Construction | 3 (42.9%) | 4 (57.1%) |
| Manufacturing | 75 (83.3%) | 15 (16.7%) |
| Wholesale Trade | 1 (100.0%) | 0 (0.0%) |
| Retail Trade | 7 (31.8%) | 15 (68.2%) |
| Transportation & Warehousing | 0 (0.0%) | 1 (100.0%) |
| Utilities | 0 (0.0%) | 0 (0.0%) |
| Information | 0 (0.0%) | 0 (0.0%) |
| Finance & Insurance | 0 (0.0%) | 2 (100.0%) |
| Real Estate, Rental & Leasing | 0 (0.0%) | 0 (0.0%) |
| Professional & Scientific | 0 (0.0%) | 2 (100.0%) |
| Enterprise Management | 0 (0.0%) | 0 (0.0%) |
| Administrative & Support | 0 (0.0%) | 0 (0.0%) |
| Educational Services | 0 (0.0%) | 5 (100.0%) |
| Health Care & Social Assistance | 0 (0.0%) | 18 (100.0%) |
| Arts, Entertainment & Recreation | 0 (0.0%) | 3 (100.0%) |
| Accommodation & Food Services | 0 (0.0%) | 1 (100.0%) |
| Public Administration | 2 (66.7%) | 1 (33.3%) |
| Total | 88 (55.7%) | 70 (44.3%) |
Education in Patrick
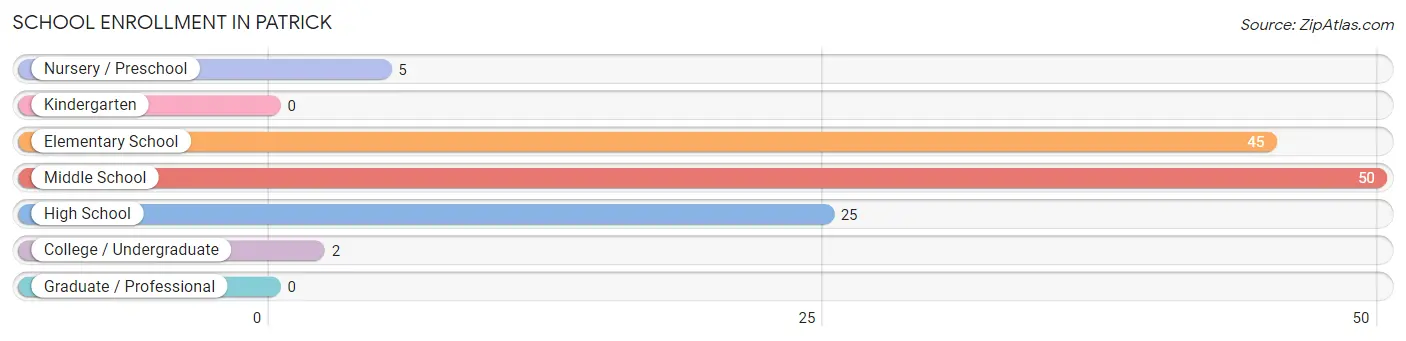
School Enrollment in Patrick
The most common levels of schooling among the 127 students in Patrick are middle school (50 | 39.4%), elementary school (45 | 35.4%), and high school (25 | 19.7%).
| School Level | # Students | % Students |
| Nursery / Preschool | 5 | 3.9% |
| Kindergarten | 0 | 0.0% |
| Elementary School | 45 | 35.4% |
| Middle School | 50 | 39.4% |
| High School | 25 | 19.7% |
| College / Undergraduate | 2 | 1.6% |
| Graduate / Professional | 0 | 0.0% |
| Total | 127 | 100.0% |
School Enrollment by Age by Funding Source in Patrick
Out of a total of 127 students who are enrolled in schools in Patrick, 2 (1.6%) attend a private institution, while the remaining 125 (98.4%) are enrolled in public schools. The age group of 3 to 4 year olds has the highest likelihood of being enrolled in private schools, with 2 (40.0% in the age bracket) enrolled. Conversely, the age group of 5 to 9 year old has the lowest likelihood of being enrolled in a private school, with 44 (100.0% in the age bracket) attending a public institution.
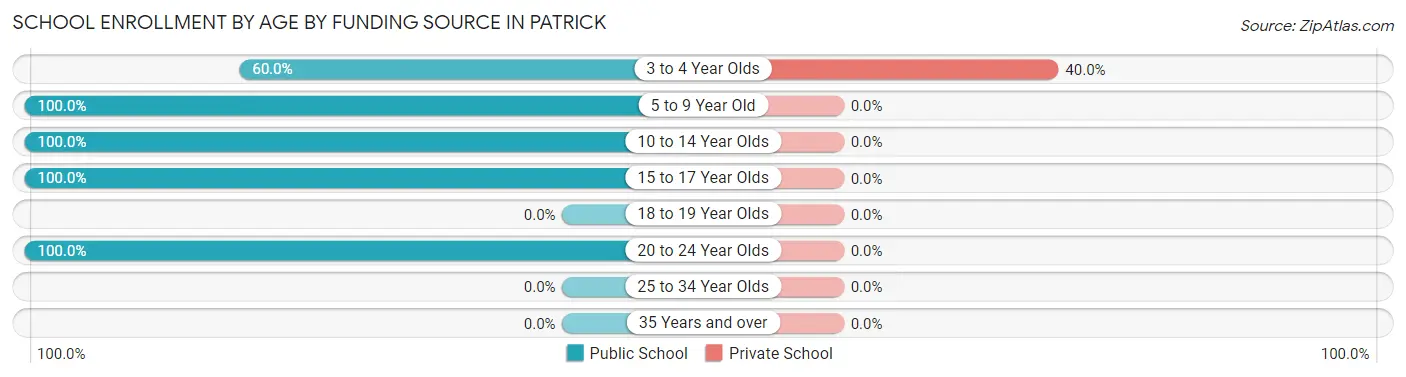
| Age Bracket | Public School | Private School |
| 3 to 4 Year Olds | 3 (60.0%) | 2 (40.0%) |
| 5 to 9 Year Old | 44 (100.0%) | 0 (0.0%) |
| 10 to 14 Year Olds | 51 (100.0%) | 0 (0.0%) |
| 15 to 17 Year Olds | 25 (100.0%) | 0 (0.0%) |
| 18 to 19 Year Olds | 0 (0.0%) | 0 (0.0%) |
| 20 to 24 Year Olds | 2 (100.0%) | 0 (0.0%) |
| 25 to 34 Year Olds | 0 (0.0%) | 0 (0.0%) |
| 35 Years and over | 0 (0.0%) | 0 (0.0%) |
| Total | 125 (98.4%) | 2 (1.6%) |
Educational Attainment by Field of Study in Patrick
Arts & humanities (13 | 59.1%), business (3 | 13.6%), education (2 | 9.1%), literature & languages (2 | 9.1%), and psychology (1 | 4.5%) are the most common fields of study among 22 individuals in Patrick who have obtained a bachelor's degree or higher.
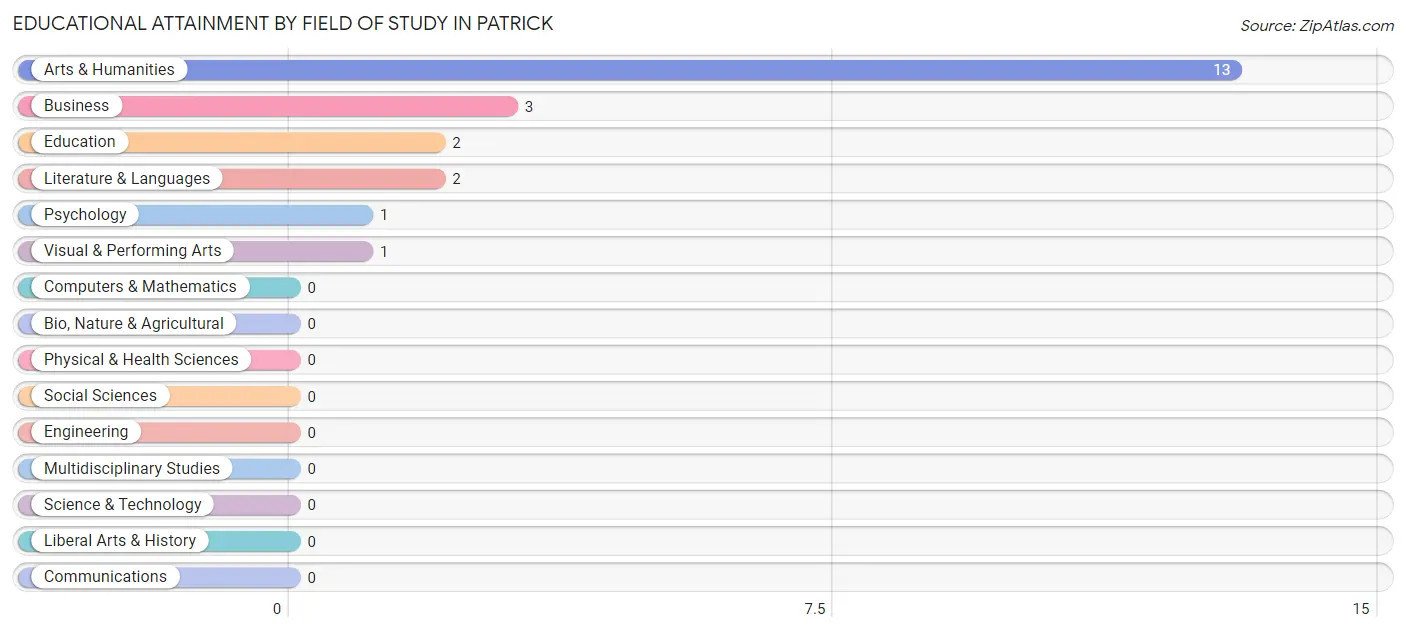
| Field of Study | # Graduates | % Graduates |
| Computers & Mathematics | 0 | 0.0% |
| Bio, Nature & Agricultural | 0 | 0.0% |
| Physical & Health Sciences | 0 | 0.0% |
| Psychology | 1 | 4.5% |
| Social Sciences | 0 | 0.0% |
| Engineering | 0 | 0.0% |
| Multidisciplinary Studies | 0 | 0.0% |
| Science & Technology | 0 | 0.0% |
| Business | 3 | 13.6% |
| Education | 2 | 9.1% |
| Literature & Languages | 2 | 9.1% |
| Liberal Arts & History | 0 | 0.0% |
| Visual & Performing Arts | 1 | 4.5% |
| Communications | 0 | 0.0% |
| Arts & Humanities | 13 | 59.1% |
| Total | 22 | 100.0% |
Transportation & Commute in Patrick
Vehicle Availability by Sex in Patrick
The most prevalent vehicle ownership categories in Patrick are males with 1 vehicle (51, accounting for 58.0%) and females with 1 vehicle (24, making up 77.3%).
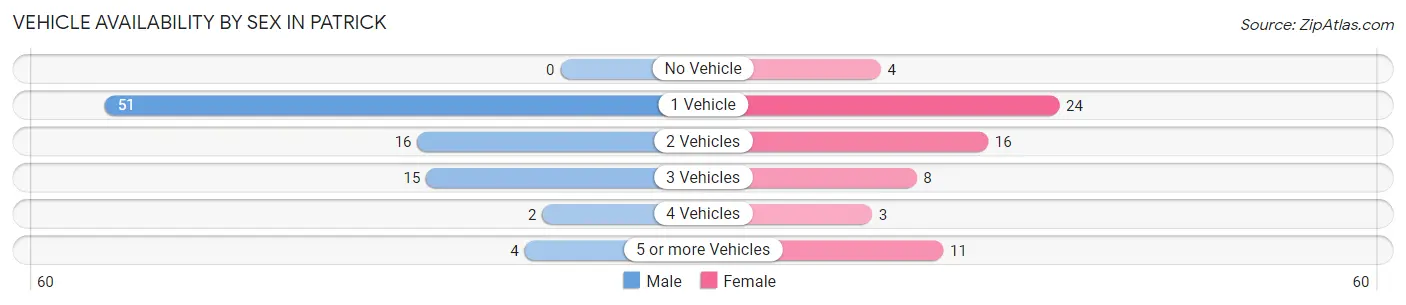
| Vehicles Available | Male | Female |
| No Vehicle | 0 (0.0%) | 4 (6.1%) |
| 1 Vehicle | 51 (58.0%) | 24 (36.4%) |
| 2 Vehicles | 16 (18.2%) | 16 (24.2%) |
| 3 Vehicles | 15 (17.1%) | 8 (12.1%) |
| 4 Vehicles | 2 (2.3%) | 3 (4.5%) |
| 5 or more Vehicles | 4 (4.5%) | 11 (16.7%) |
| Total | 88 (100.0%) | 66 (100.0%) |
Commute Time in Patrick
The most frequently occuring commute durations in Patrick are 20 to 24 minutes (71 commuters, 50.3%), 15 to 19 minutes (27 commuters, 19.2%), and 45 to 59 minutes (13 commuters, 9.2%).
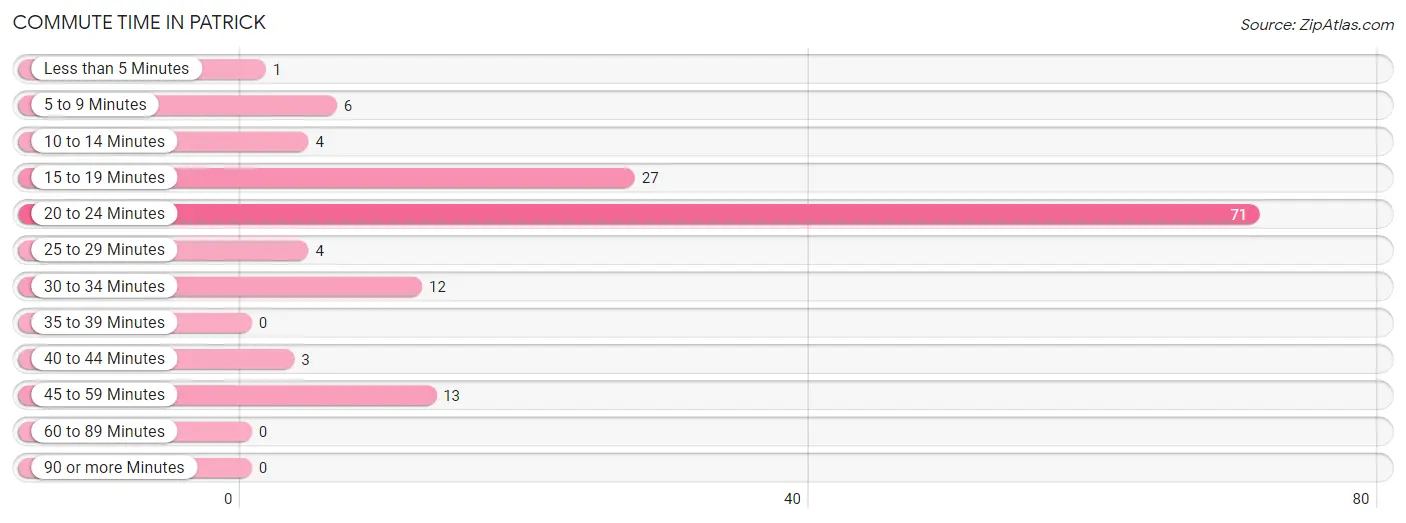
| Commute Time | # Commuters | % Commuters |
| Less than 5 Minutes | 1 | 0.7% |
| 5 to 9 Minutes | 6 | 4.3% |
| 10 to 14 Minutes | 4 | 2.8% |
| 15 to 19 Minutes | 27 | 19.2% |
| 20 to 24 Minutes | 71 | 50.3% |
| 25 to 29 Minutes | 4 | 2.8% |
| 30 to 34 Minutes | 12 | 8.5% |
| 35 to 39 Minutes | 0 | 0.0% |
| 40 to 44 Minutes | 3 | 2.1% |
| 45 to 59 Minutes | 13 | 9.2% |
| 60 to 89 Minutes | 0 | 0.0% |
| 90 or more Minutes | 0 | 0.0% |
Commute Time by Sex in Patrick
The most common commute times in Patrick are 20 to 24 minutes (54 commuters, 61.4%) for males and 15 to 19 minutes (19 commuters, 35.8%) for females.
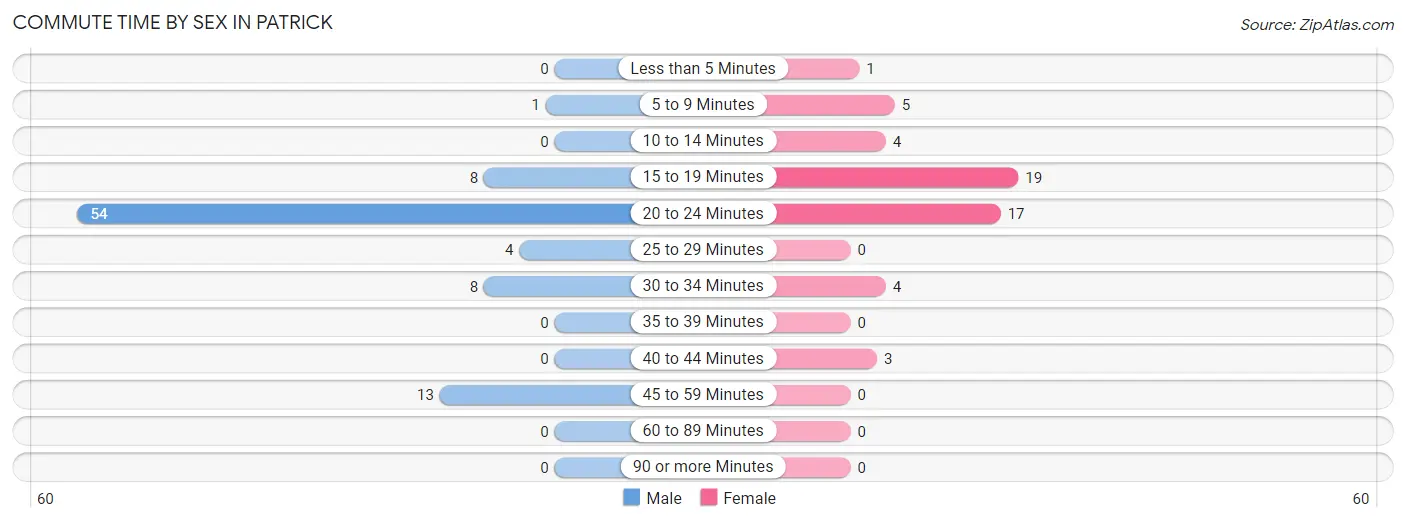
| Commute Time | Male | Female |
| Less than 5 Minutes | 0 (0.0%) | 1 (1.9%) |
| 5 to 9 Minutes | 1 (1.1%) | 5 (9.4%) |
| 10 to 14 Minutes | 0 (0.0%) | 4 (7.5%) |
| 15 to 19 Minutes | 8 (9.1%) | 19 (35.8%) |
| 20 to 24 Minutes | 54 (61.4%) | 17 (32.1%) |
| 25 to 29 Minutes | 4 (4.5%) | 0 (0.0%) |
| 30 to 34 Minutes | 8 (9.1%) | 4 (7.5%) |
| 35 to 39 Minutes | 0 (0.0%) | 0 (0.0%) |
| 40 to 44 Minutes | 0 (0.0%) | 3 (5.7%) |
| 45 to 59 Minutes | 13 (14.8%) | 0 (0.0%) |
| 60 to 89 Minutes | 0 (0.0%) | 0 (0.0%) |
| 90 or more Minutes | 0 (0.0%) | 0 (0.0%) |
Time of Departure to Work by Sex in Patrick
The most frequent times of departure to work in Patrick are 12:00 AM to 4:59 AM (37, 42.0%) for males and 9:00 AM to 9:59 AM (19, 35.8%) for females.
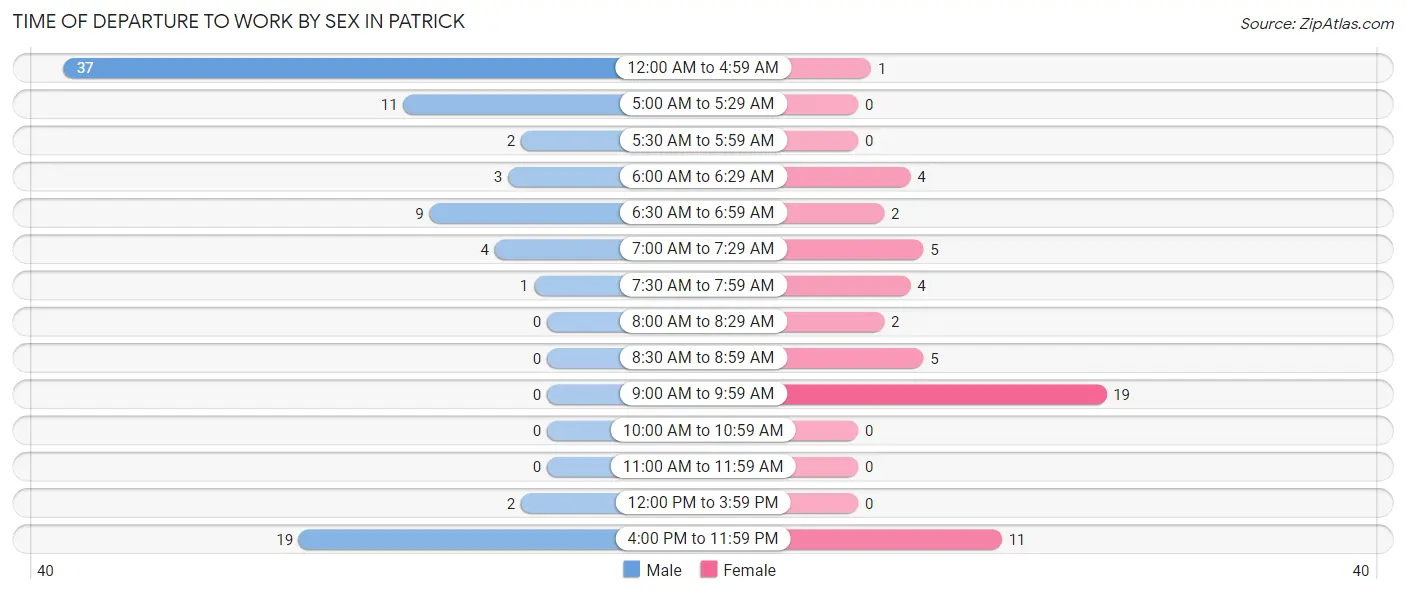
| Time of Departure | Male | Female |
| 12:00 AM to 4:59 AM | 37 (42.0%) | 1 (1.9%) |
| 5:00 AM to 5:29 AM | 11 (12.5%) | 0 (0.0%) |
| 5:30 AM to 5:59 AM | 2 (2.3%) | 0 (0.0%) |
| 6:00 AM to 6:29 AM | 3 (3.4%) | 4 (7.5%) |
| 6:30 AM to 6:59 AM | 9 (10.2%) | 2 (3.8%) |
| 7:00 AM to 7:29 AM | 4 (4.5%) | 5 (9.4%) |
| 7:30 AM to 7:59 AM | 1 (1.1%) | 4 (7.5%) |
| 8:00 AM to 8:29 AM | 0 (0.0%) | 2 (3.8%) |
| 8:30 AM to 8:59 AM | 0 (0.0%) | 5 (9.4%) |
| 9:00 AM to 9:59 AM | 0 (0.0%) | 19 (35.8%) |
| 10:00 AM to 10:59 AM | 0 (0.0%) | 0 (0.0%) |
| 11:00 AM to 11:59 AM | 0 (0.0%) | 0 (0.0%) |
| 12:00 PM to 3:59 PM | 2 (2.3%) | 0 (0.0%) |
| 4:00 PM to 11:59 PM | 19 (21.6%) | 11 (20.7%) |
| Total | 88 (100.0%) | 53 (100.0%) |
Housing Occupancy in Patrick
Occupancy by Ownership in Patrick
Of the total 246 dwellings in Patrick, owner-occupied units account for 169 (68.7%), while renter-occupied units make up 77 (31.3%).
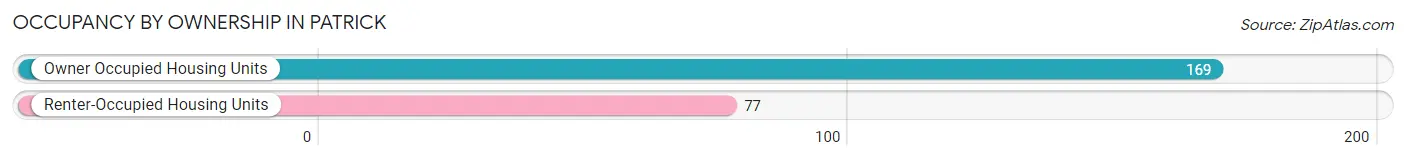
| Occupancy | # Housing Units | % Housing Units |
| Owner Occupied Housing Units | 169 | 68.7% |
| Renter-Occupied Housing Units | 77 | 31.3% |
| Total Occupied Housing Units | 246 | 100.0% |
Occupancy by Household Size in Patrick
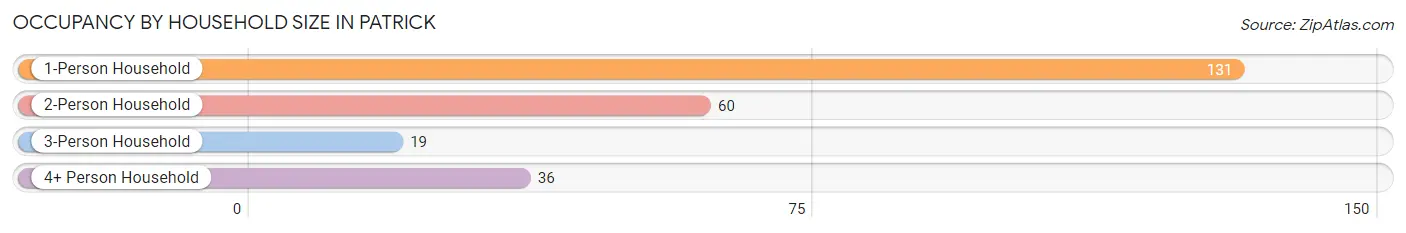
| Household Size | # Housing Units | % Housing Units |
| 1-Person Household | 131 | 53.2% |
| 2-Person Household | 60 | 24.4% |
| 3-Person Household | 19 | 7.7% |
| 4+ Person Household | 36 | 14.6% |
| Total Housing Units | 246 | 100.0% |
Occupancy by Ownership by Household Size in Patrick
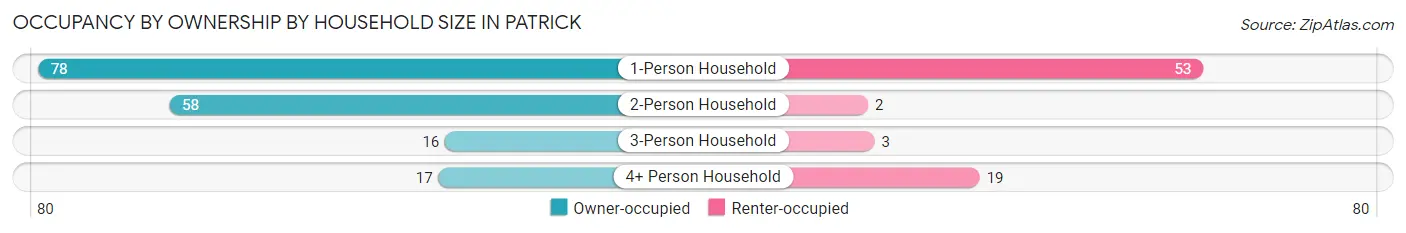
| Household Size | Owner-occupied | Renter-occupied |
| 1-Person Household | 78 (59.5%) | 53 (40.5%) |
| 2-Person Household | 58 (96.7%) | 2 (3.3%) |
| 3-Person Household | 16 (84.2%) | 3 (15.8%) |
| 4+ Person Household | 17 (47.2%) | 19 (52.8%) |
| Total Housing Units | 169 (68.7%) | 77 (31.3%) |
Occupancy by Educational Attainment in Patrick
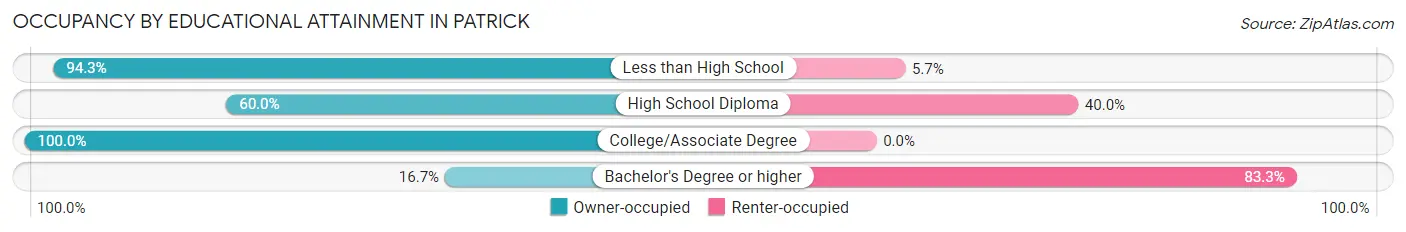
| Household Size | Owner-occupied | Renter-occupied |
| Less than High School | 66 (94.3%) | 4 (5.7%) |
| High School Diploma | 87 (60.0%) | 58 (40.0%) |
| College/Associate Degree | 13 (100.0%) | 0 (0.0%) |
| Bachelor's Degree or higher | 3 (16.7%) | 15 (83.3%) |
Occupancy by Age of Householder in Patrick
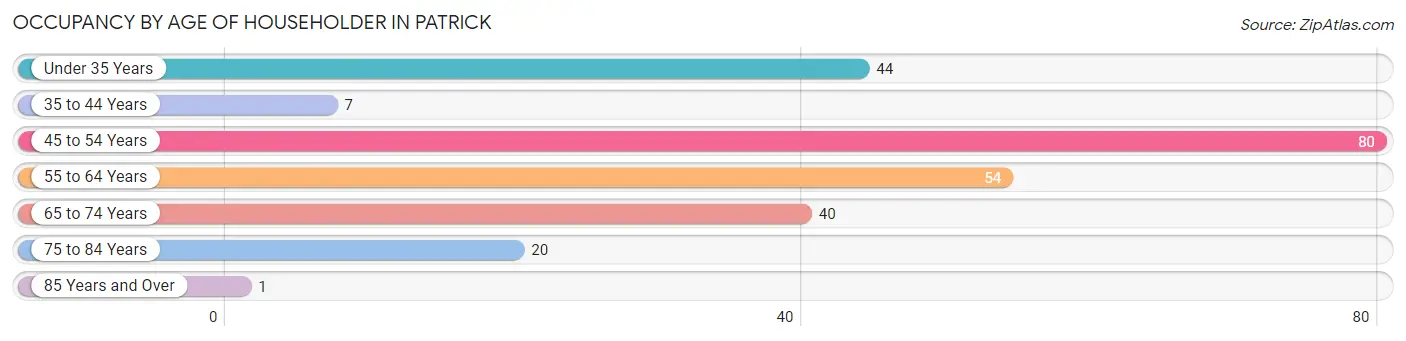
| Age Bracket | # Households | % Households |
| Under 35 Years | 44 | 17.9% |
| 35 to 44 Years | 7 | 2.9% |
| 45 to 54 Years | 80 | 32.5% |
| 55 to 64 Years | 54 | 22.0% |
| 65 to 74 Years | 40 | 16.3% |
| 75 to 84 Years | 20 | 8.1% |
| 85 Years and Over | 1 | 0.4% |
| Total | 246 | 100.0% |
Housing Finances in Patrick
Median Income by Occupancy in Patrick
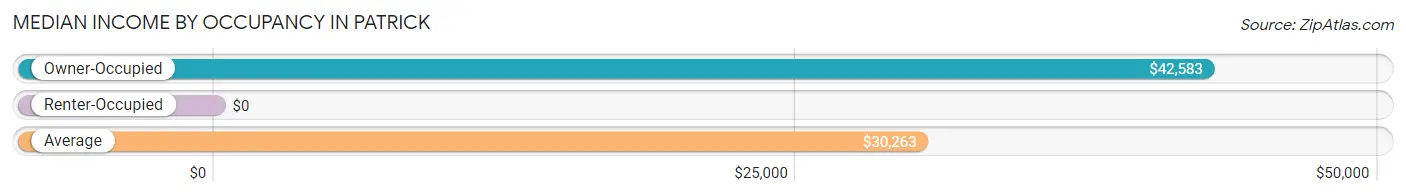
| Occupancy Type | # Households | Median Income |
| Owner-Occupied | 169 (68.7%) | $42,583 |
| Renter-Occupied | 77 (31.3%) | $0 |
| Average | 246 (100.0%) | $30,263 |
Occupancy by Householder Income Bracket in Patrick
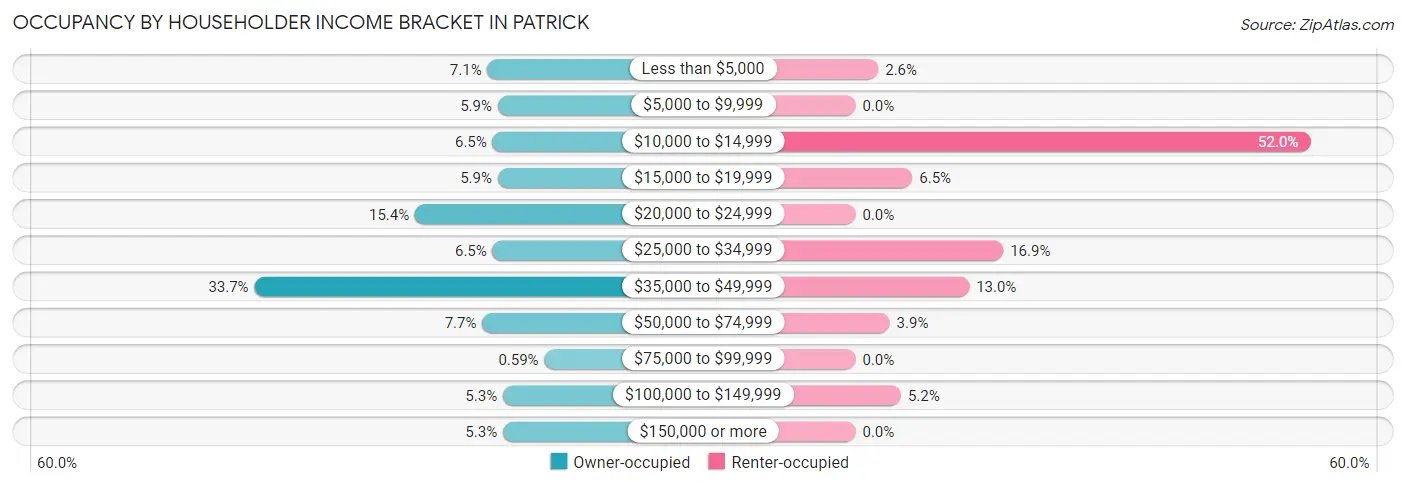
| Income Bracket | Owner-occupied | Renter-occupied |
| Less than $5,000 | 12 (7.1%) | 2 (2.6%) |
| $5,000 to $9,999 | 10 (5.9%) | 0 (0.0%) |
| $10,000 to $14,999 | 11 (6.5%) | 40 (51.9%) |
| $15,000 to $19,999 | 10 (5.9%) | 5 (6.5%) |
| $20,000 to $24,999 | 26 (15.4%) | 0 (0.0%) |
| $25,000 to $34,999 | 11 (6.5%) | 13 (16.9%) |
| $35,000 to $49,999 | 57 (33.7%) | 10 (13.0%) |
| $50,000 to $74,999 | 13 (7.7%) | 3 (3.9%) |
| $75,000 to $99,999 | 1 (0.6%) | 0 (0.0%) |
| $100,000 to $149,999 | 9 (5.3%) | 4 (5.2%) |
| $150,000 or more | 9 (5.3%) | 0 (0.0%) |
| Total | 169 (100.0%) | 77 (100.0%) |
Monthly Housing Cost Tiers in Patrick
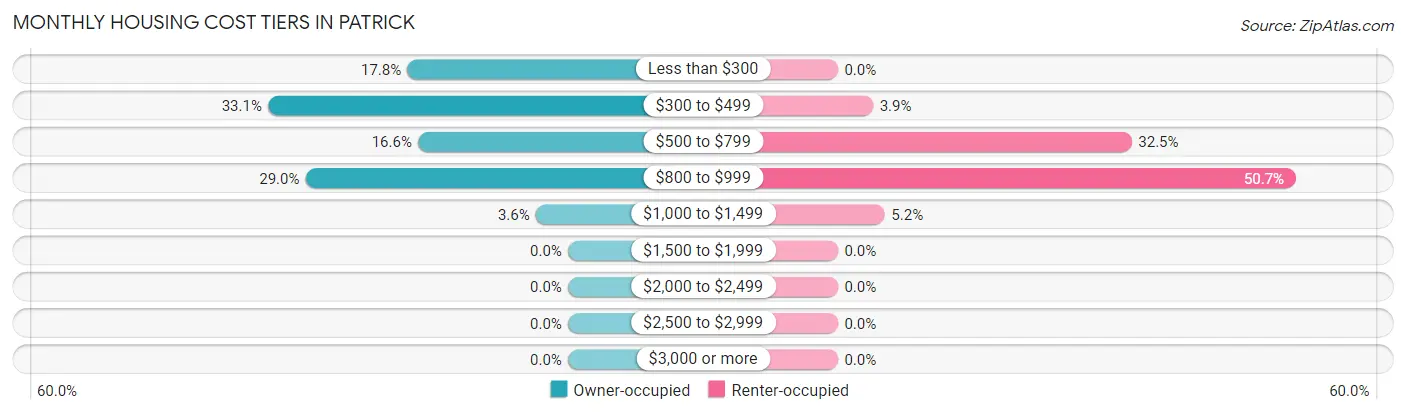
| Monthly Cost | Owner-occupied | Renter-occupied |
| Less than $300 | 30 (17.7%) | 0 (0.0%) |
| $300 to $499 | 56 (33.1%) | 3 (3.9%) |
| $500 to $799 | 28 (16.6%) | 25 (32.5%) |
| $800 to $999 | 49 (29.0%) | 39 (50.6%) |
| $1,000 to $1,499 | 6 (3.5%) | 4 (5.2%) |
| $1,500 to $1,999 | 0 (0.0%) | 0 (0.0%) |
| $2,000 to $2,499 | 0 (0.0%) | 0 (0.0%) |
| $2,500 to $2,999 | 0 (0.0%) | 0 (0.0%) |
| $3,000 or more | 0 (0.0%) | 0 (0.0%) |
| Total | 169 (100.0%) | 77 (100.0%) |
Physical Housing Characteristics in Patrick
Housing Structures in Patrick
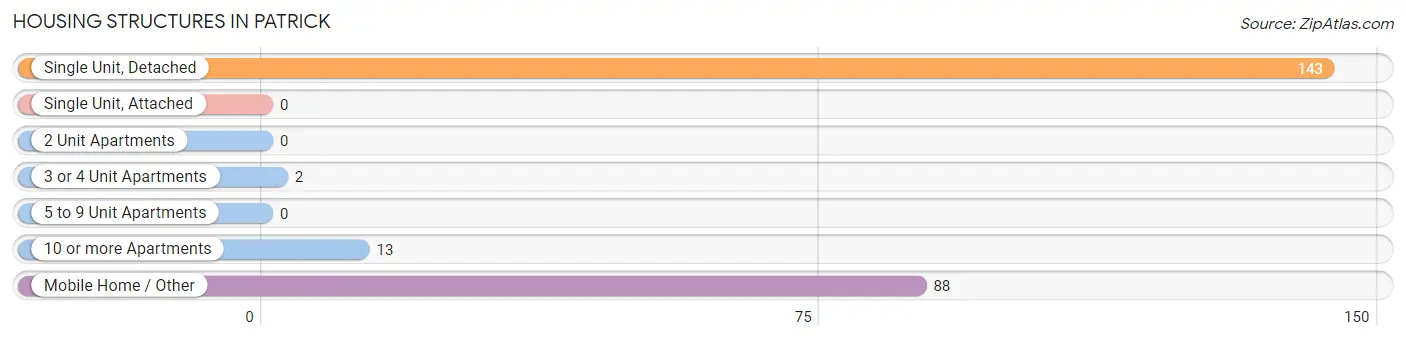
| Structure Type | # Housing Units | % Housing Units |
| Single Unit, Detached | 143 | 58.1% |
| Single Unit, Attached | 0 | 0.0% |
| 2 Unit Apartments | 0 | 0.0% |
| 3 or 4 Unit Apartments | 2 | 0.8% |
| 5 to 9 Unit Apartments | 0 | 0.0% |
| 10 or more Apartments | 13 | 5.3% |
| Mobile Home / Other | 88 | 35.8% |
| Total | 246 | 100.0% |
Housing Structures by Occupancy in Patrick
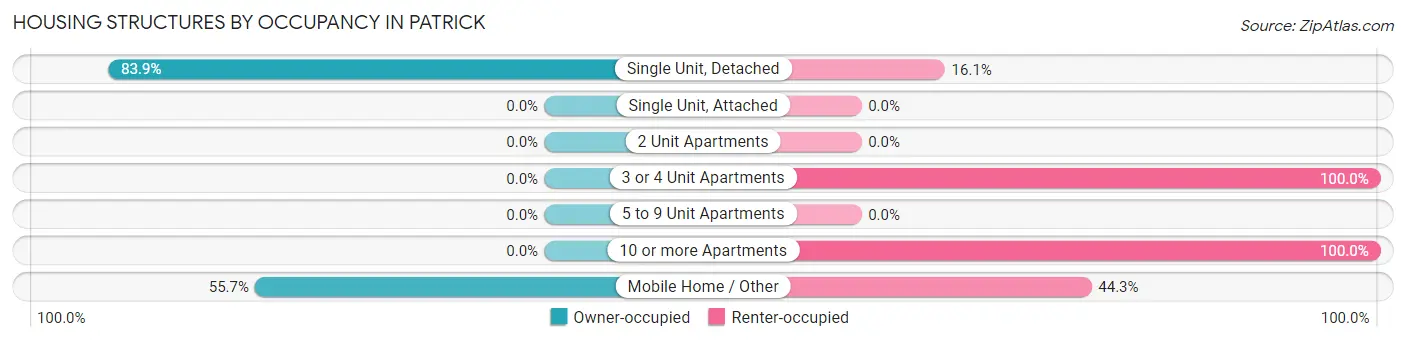
| Structure Type | Owner-occupied | Renter-occupied |
| Single Unit, Detached | 120 (83.9%) | 23 (16.1%) |
| Single Unit, Attached | 0 (0.0%) | 0 (0.0%) |
| 2 Unit Apartments | 0 (0.0%) | 0 (0.0%) |
| 3 or 4 Unit Apartments | 0 (0.0%) | 2 (100.0%) |
| 5 to 9 Unit Apartments | 0 (0.0%) | 0 (0.0%) |
| 10 or more Apartments | 0 (0.0%) | 13 (100.0%) |
| Mobile Home / Other | 49 (55.7%) | 39 (44.3%) |
| Total | 169 (68.7%) | 77 (31.3%) |
Housing Structures by Number of Rooms in Patrick
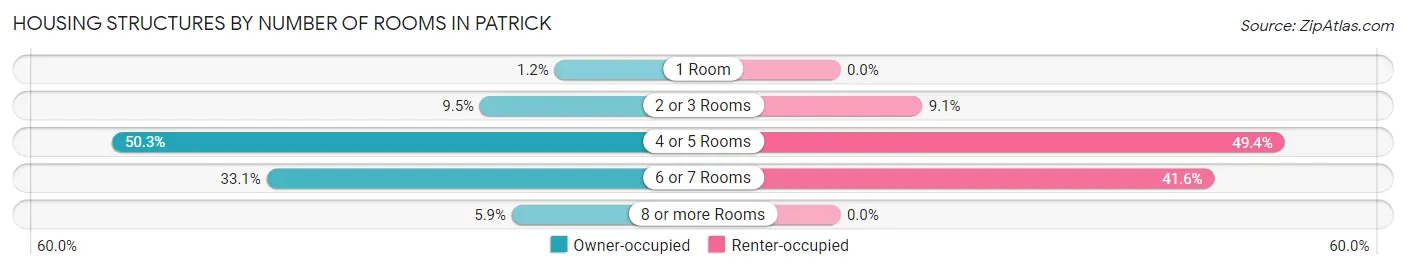
| Number of Rooms | Owner-occupied | Renter-occupied |
| 1 Room | 2 (1.2%) | 0 (0.0%) |
| 2 or 3 Rooms | 16 (9.5%) | 7 (9.1%) |
| 4 or 5 Rooms | 85 (50.3%) | 38 (49.3%) |
| 6 or 7 Rooms | 56 (33.1%) | 32 (41.6%) |
| 8 or more Rooms | 10 (5.9%) | 0 (0.0%) |
| Total | 169 (100.0%) | 77 (100.0%) |
Housing Structure by Heating Type in Patrick
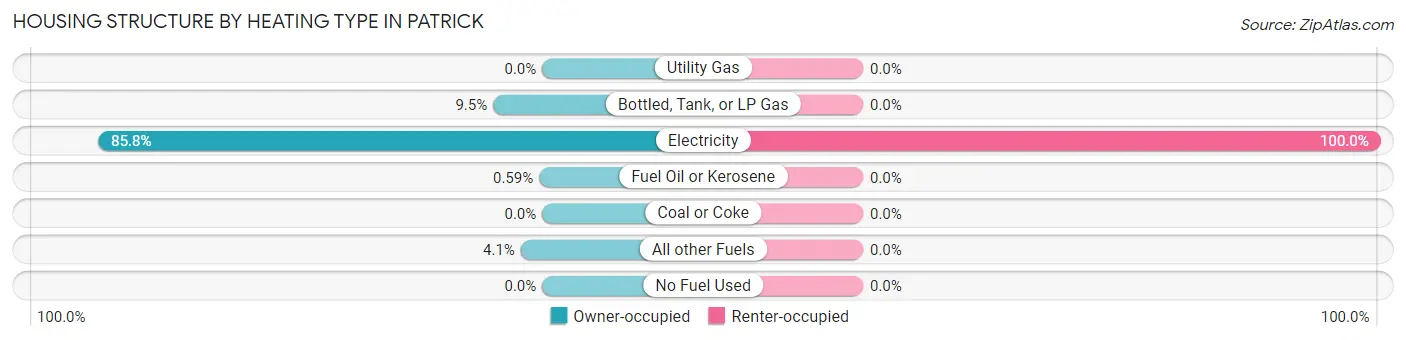
| Heating Type | Owner-occupied | Renter-occupied |
| Utility Gas | 0 (0.0%) | 0 (0.0%) |
| Bottled, Tank, or LP Gas | 16 (9.5%) | 0 (0.0%) |
| Electricity | 145 (85.8%) | 77 (100.0%) |
| Fuel Oil or Kerosene | 1 (0.6%) | 0 (0.0%) |
| Coal or Coke | 0 (0.0%) | 0 (0.0%) |
| All other Fuels | 7 (4.1%) | 0 (0.0%) |
| No Fuel Used | 0 (0.0%) | 0 (0.0%) |
| Total | 169 (100.0%) | 77 (100.0%) |
Household Vehicle Usage in Patrick
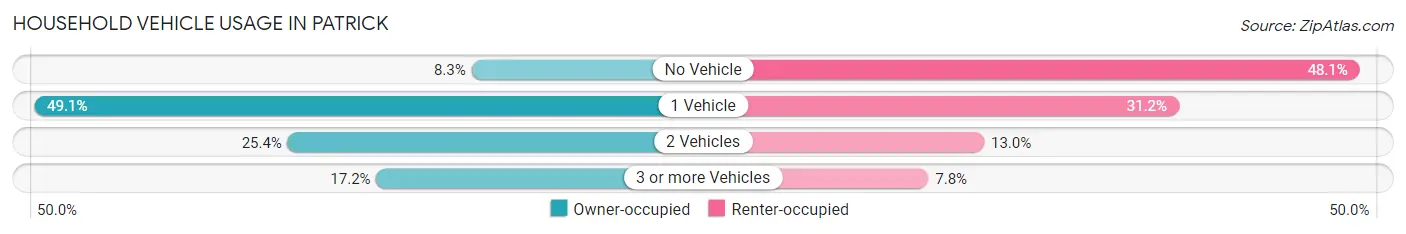
| Vehicles per Household | Owner-occupied | Renter-occupied |
| No Vehicle | 14 (8.3%) | 37 (48.0%) |
| 1 Vehicle | 83 (49.1%) | 24 (31.2%) |
| 2 Vehicles | 43 (25.4%) | 10 (13.0%) |
| 3 or more Vehicles | 29 (17.2%) | 6 (7.8%) |
| Total | 169 (100.0%) | 77 (100.0%) |
Real Estate & Mortgages in Patrick
Real Estate and Mortgage Overview in Patrick
| Characteristic | Without Mortgage | With Mortgage |
| Housing Units | 92 | 77 |
| Median Property Value | $56,100 | $47,700 |
| Median Household Income | $24,167 | $2 |
| Monthly Housing Costs | $322 | $0 |
| Real Estate Taxes | $232 | $3 |
Property Value by Mortgage Status in Patrick
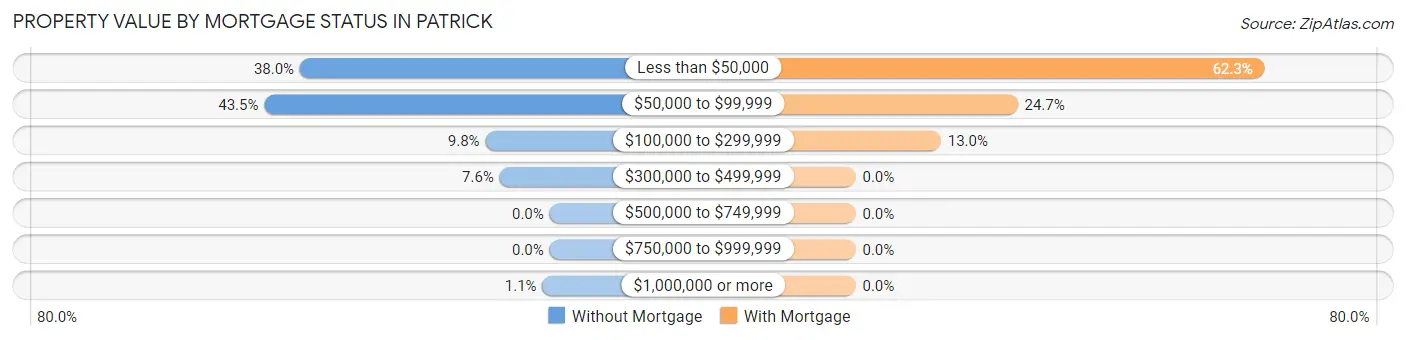
| Property Value | Without Mortgage | With Mortgage |
| Less than $50,000 | 35 (38.0%) | 48 (62.3%) |
| $50,000 to $99,999 | 40 (43.5%) | 19 (24.7%) |
| $100,000 to $299,999 | 9 (9.8%) | 10 (13.0%) |
| $300,000 to $499,999 | 7 (7.6%) | 0 (0.0%) |
| $500,000 to $749,999 | 0 (0.0%) | 0 (0.0%) |
| $750,000 to $999,999 | 0 (0.0%) | 0 (0.0%) |
| $1,000,000 or more | 1 (1.1%) | 0 (0.0%) |
| Total | 92 (100.0%) | 77 (100.0%) |
Household Income by Mortgage Status in Patrick
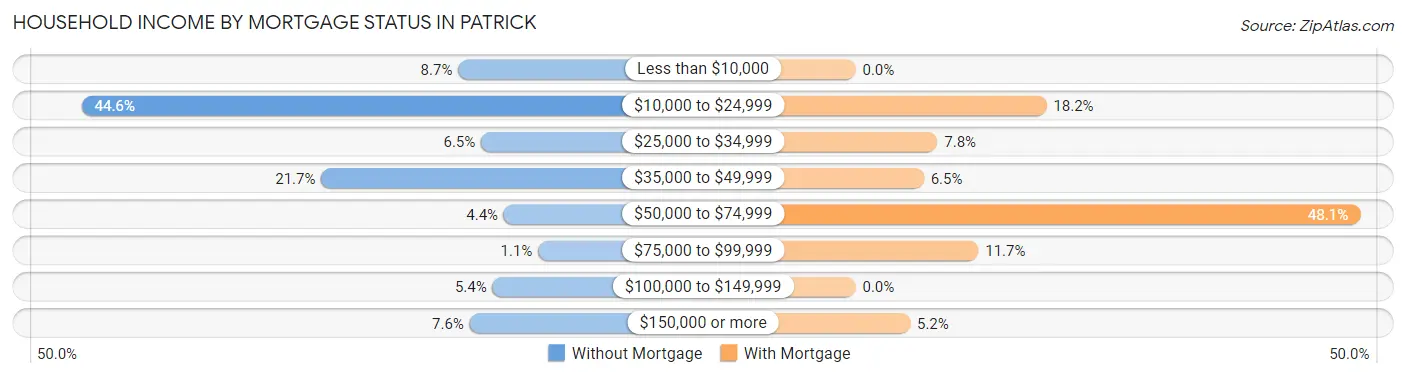
| Household Income | Without Mortgage | With Mortgage |
| Less than $10,000 | 8 (8.7%) | 0 (0.0%) |
| $10,000 to $24,999 | 41 (44.6%) | 14 (18.2%) |
| $25,000 to $34,999 | 6 (6.5%) | 6 (7.8%) |
| $35,000 to $49,999 | 20 (21.7%) | 5 (6.5%) |
| $50,000 to $74,999 | 4 (4.3%) | 37 (48.0%) |
| $75,000 to $99,999 | 1 (1.1%) | 9 (11.7%) |
| $100,000 to $149,999 | 5 (5.4%) | 0 (0.0%) |
| $150,000 or more | 7 (7.6%) | 4 (5.2%) |
| Total | 92 (100.0%) | 77 (100.0%) |
Property Value to Household Income Ratio in Patrick
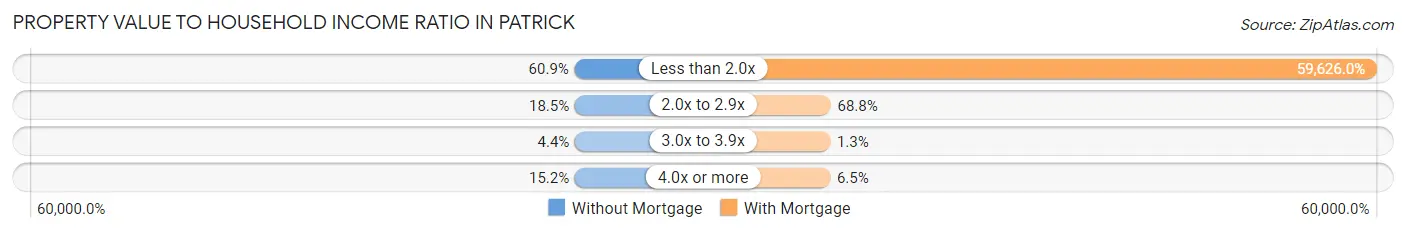
| Value-to-Income Ratio | Without Mortgage | With Mortgage |
| Less than 2.0x | 56 (60.9%) | 45,912 (59,626.0%) |
| 2.0x to 2.9x | 17 (18.5%) | 53 (68.8%) |
| 3.0x to 3.9x | 4 (4.3%) | 1 (1.3%) |
| 4.0x or more | 14 (15.2%) | 5 (6.5%) |
| Total | 92 (100.0%) | 77 (100.0%) |
Real Estate Taxes by Mortgage Status in Patrick
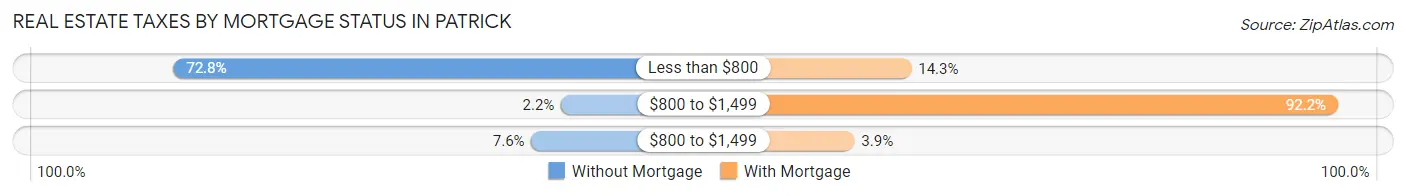
| Property Taxes | Without Mortgage | With Mortgage |
| Less than $800 | 67 (72.8%) | 11 (14.3%) |
| $800 to $1,499 | 2 (2.2%) | 71 (92.2%) |
| $800 to $1,499 | 7 (7.6%) | 3 (3.9%) |
| Total | 92 (100.0%) | 77 (100.0%) |
Health & Disability in Patrick
Health Insurance Coverage by Age in Patrick
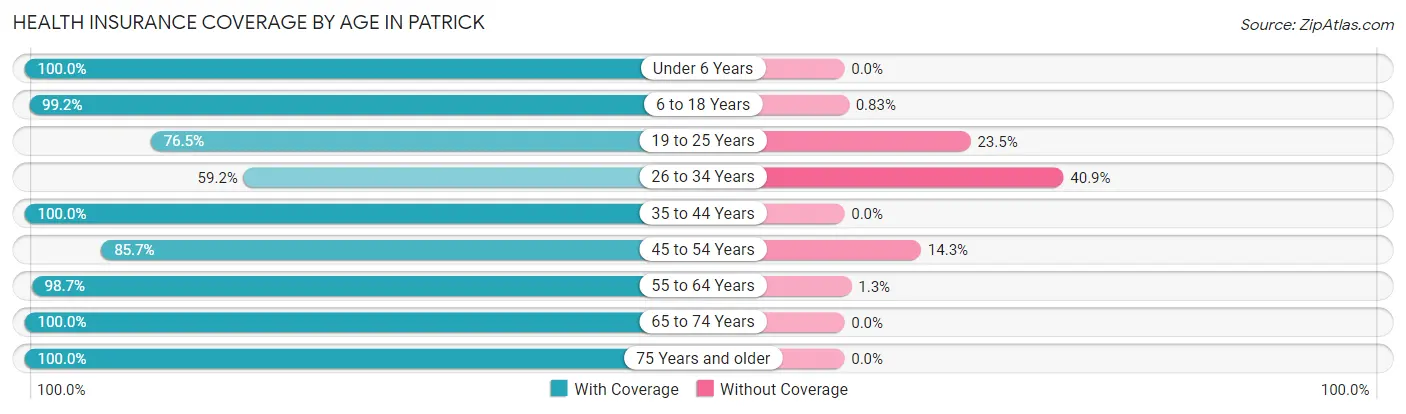
| Age Bracket | With Coverage | Without Coverage |
| Under 6 Years | 14 (100.0%) | 0 (0.0%) |
| 6 to 18 Years | 119 (99.2%) | 1 (0.8%) |
| 19 to 25 Years | 13 (76.5%) | 4 (23.5%) |
| 26 to 34 Years | 42 (59.2%) | 29 (40.8%) |
| 35 to 44 Years | 16 (100.0%) | 0 (0.0%) |
| 45 to 54 Years | 84 (85.7%) | 14 (14.3%) |
| 55 to 64 Years | 75 (98.7%) | 1 (1.3%) |
| 65 to 74 Years | 60 (100.0%) | 0 (0.0%) |
| 75 Years and older | 28 (100.0%) | 0 (0.0%) |
| Total | 451 (90.2%) | 49 (9.8%) |
Health Insurance Coverage by Citizenship Status in Patrick
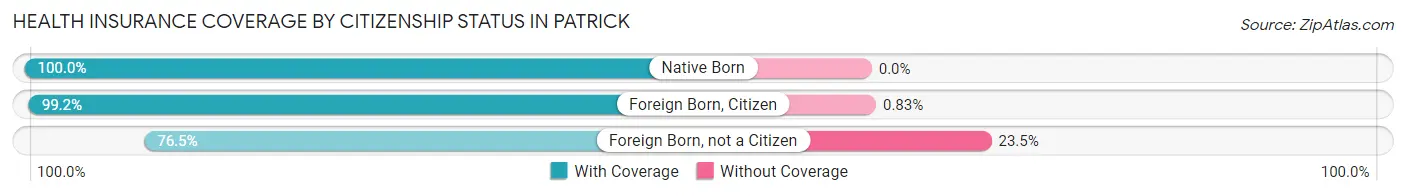
| Citizenship Status | With Coverage | Without Coverage |
| Native Born | 14 (100.0%) | 0 (0.0%) |
| Foreign Born, Citizen | 119 (99.2%) | 1 (0.8%) |
| Foreign Born, not a Citizen | 13 (76.5%) | 4 (23.5%) |
Health Insurance Coverage by Household Income in Patrick
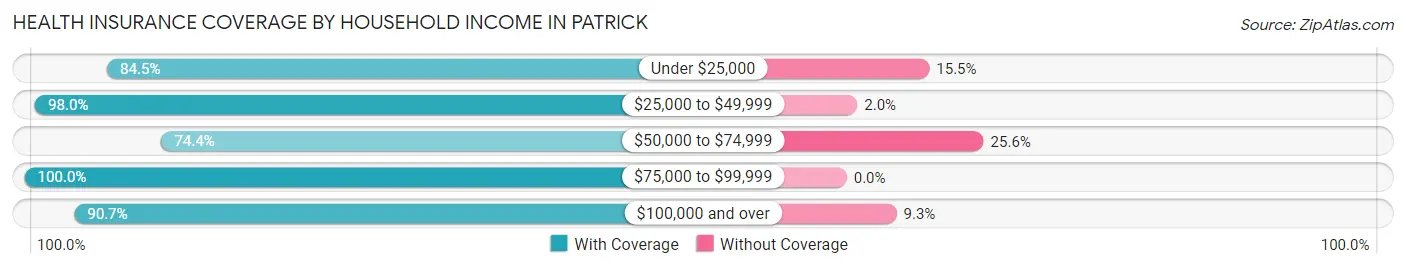
| Household Income | With Coverage | Without Coverage |
| Under $25,000 | 153 (84.5%) | 28 (15.5%) |
| $25,000 to $49,999 | 198 (98.0%) | 4 (2.0%) |
| $50,000 to $74,999 | 29 (74.4%) | 10 (25.6%) |
| $75,000 to $99,999 | 3 (100.0%) | 0 (0.0%) |
| $100,000 and over | 68 (90.7%) | 7 (9.3%) |
Public vs Private Health Insurance Coverage by Age in Patrick
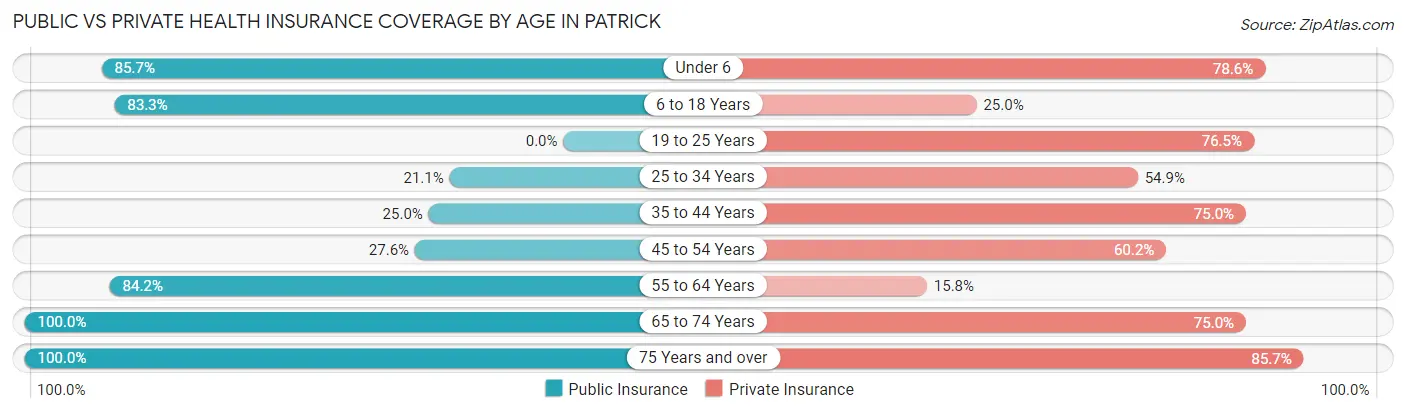
| Age Bracket | Public Insurance | Private Insurance |
| Under 6 | 12 (85.7%) | 11 (78.6%) |
| 6 to 18 Years | 100 (83.3%) | 30 (25.0%) |
| 19 to 25 Years | 0 (0.0%) | 13 (76.5%) |
| 25 to 34 Years | 15 (21.1%) | 39 (54.9%) |
| 35 to 44 Years | 4 (25.0%) | 12 (75.0%) |
| 45 to 54 Years | 27 (27.6%) | 59 (60.2%) |
| 55 to 64 Years | 64 (84.2%) | 12 (15.8%) |
| 65 to 74 Years | 60 (100.0%) | 45 (75.0%) |
| 75 Years and over | 28 (100.0%) | 24 (85.7%) |
| Total | 310 (62.0%) | 245 (49.0%) |
Disability Status by Sex by Age in Patrick
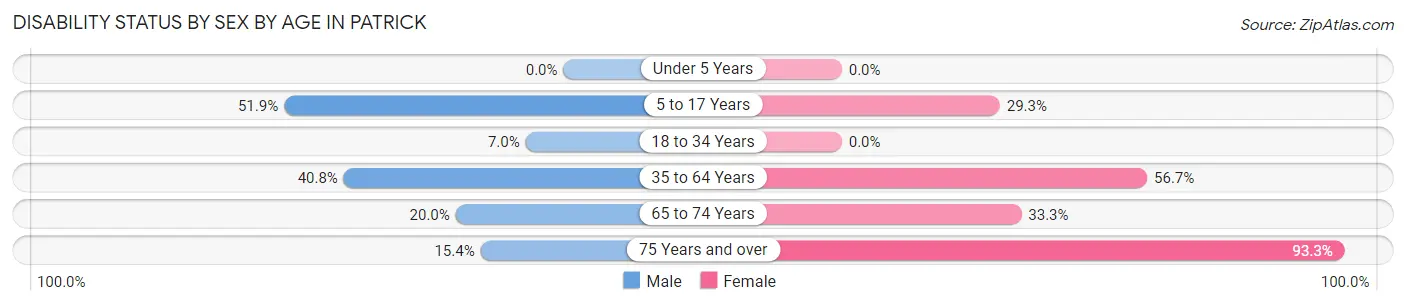
| Age Bracket | Male | Female |
| Under 5 Years | 0 (0.0%) | 0 (0.0%) |
| 5 to 17 Years | 28 (51.8%) | 22 (29.3%) |
| 18 to 34 Years | 4 (7.0%) | 0 (0.0%) |
| 35 to 64 Years | 53 (40.8%) | 34 (56.7%) |
| 65 to 74 Years | 6 (20.0%) | 10 (33.3%) |
| 75 Years and over | 2 (15.4%) | 14 (93.3%) |
Disability Class by Sex by Age in Patrick
Disability Class: Hearing Difficulty
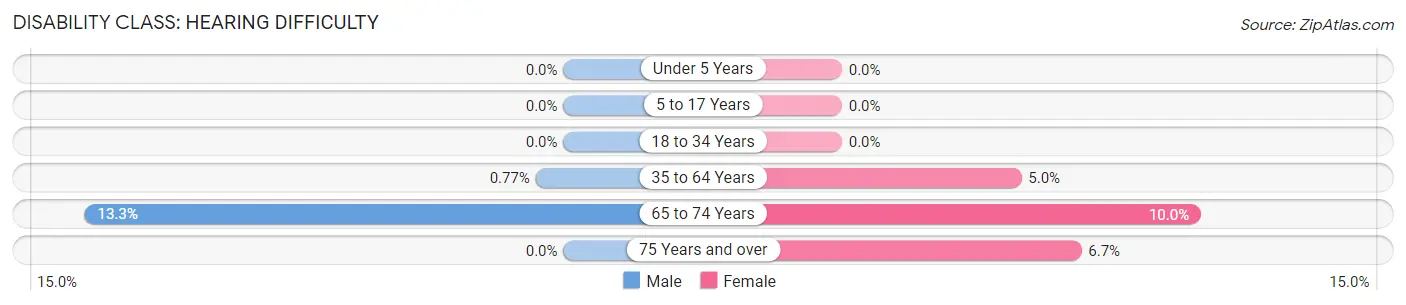
| Age Bracket | Male | Female |
| Under 5 Years | 0 (0.0%) | 0 (0.0%) |
| 5 to 17 Years | 0 (0.0%) | 0 (0.0%) |
| 18 to 34 Years | 0 (0.0%) | 0 (0.0%) |
| 35 to 64 Years | 1 (0.8%) | 3 (5.0%) |
| 65 to 74 Years | 4 (13.3%) | 3 (10.0%) |
| 75 Years and over | 0 (0.0%) | 1 (6.7%) |
Disability Class: Vision Difficulty
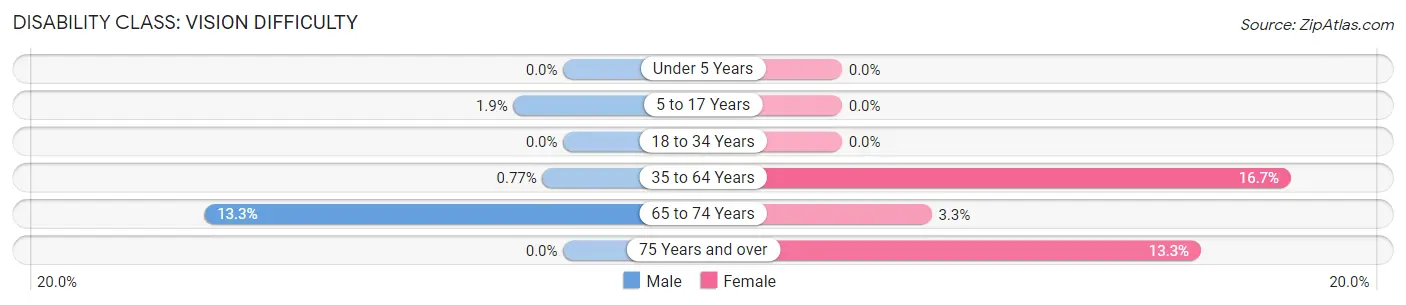
| Age Bracket | Male | Female |
| Under 5 Years | 0 (0.0%) | 0 (0.0%) |
| 5 to 17 Years | 1 (1.8%) | 0 (0.0%) |
| 18 to 34 Years | 0 (0.0%) | 0 (0.0%) |
| 35 to 64 Years | 1 (0.8%) | 10 (16.7%) |
| 65 to 74 Years | 4 (13.3%) | 1 (3.3%) |
| 75 Years and over | 0 (0.0%) | 2 (13.3%) |
Disability Class: Cognitive Difficulty
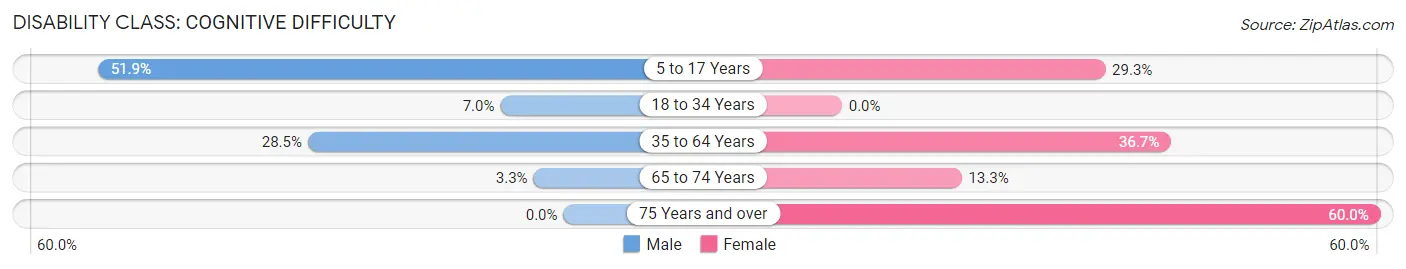
| Age Bracket | Male | Female |
| 5 to 17 Years | 28 (51.8%) | 22 (29.3%) |
| 18 to 34 Years | 4 (7.0%) | 0 (0.0%) |
| 35 to 64 Years | 37 (28.5%) | 22 (36.7%) |
| 65 to 74 Years | 1 (3.3%) | 4 (13.3%) |
| 75 Years and over | 0 (0.0%) | 9 (60.0%) |
Disability Class: Ambulatory Difficulty
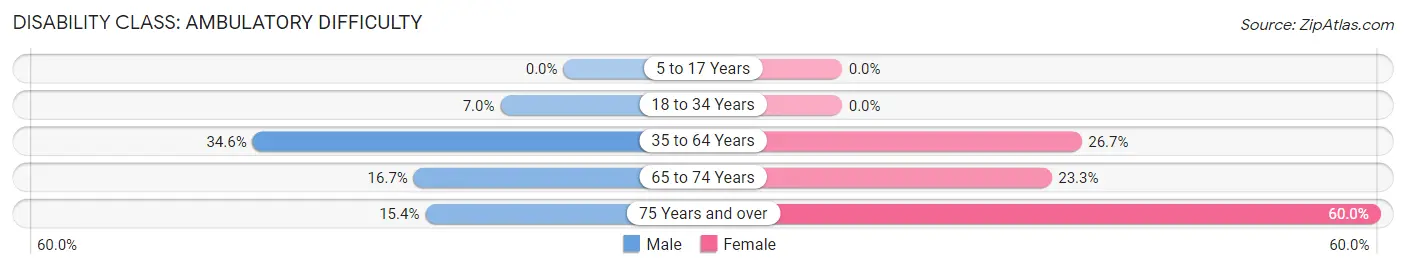
| Age Bracket | Male | Female |
| 5 to 17 Years | 0 (0.0%) | 0 (0.0%) |
| 18 to 34 Years | 4 (7.0%) | 0 (0.0%) |
| 35 to 64 Years | 45 (34.6%) | 16 (26.7%) |
| 65 to 74 Years | 5 (16.7%) | 7 (23.3%) |
| 75 Years and over | 2 (15.4%) | 9 (60.0%) |
Disability Class: Self-Care Difficulty
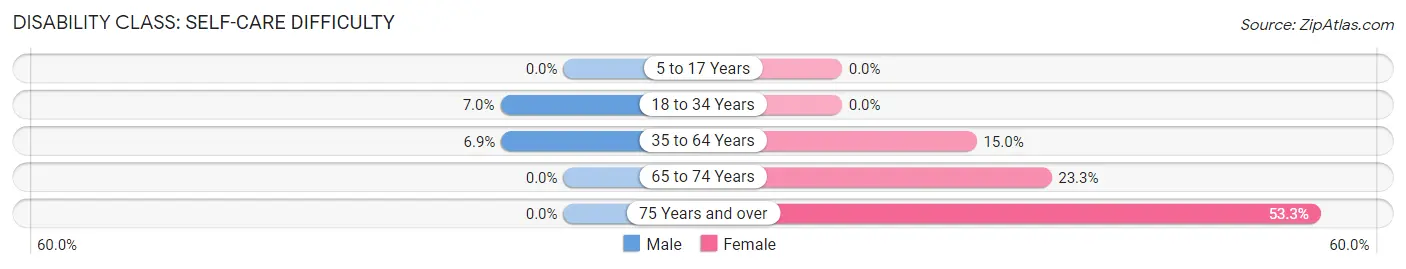
| Age Bracket | Male | Female |
| 5 to 17 Years | 0 (0.0%) | 0 (0.0%) |
| 18 to 34 Years | 4 (7.0%) | 0 (0.0%) |
| 35 to 64 Years | 9 (6.9%) | 9 (15.0%) |
| 65 to 74 Years | 0 (0.0%) | 7 (23.3%) |
| 75 Years and over | 0 (0.0%) | 8 (53.3%) |
Technology Access in Patrick
Computing Device Access in Patrick
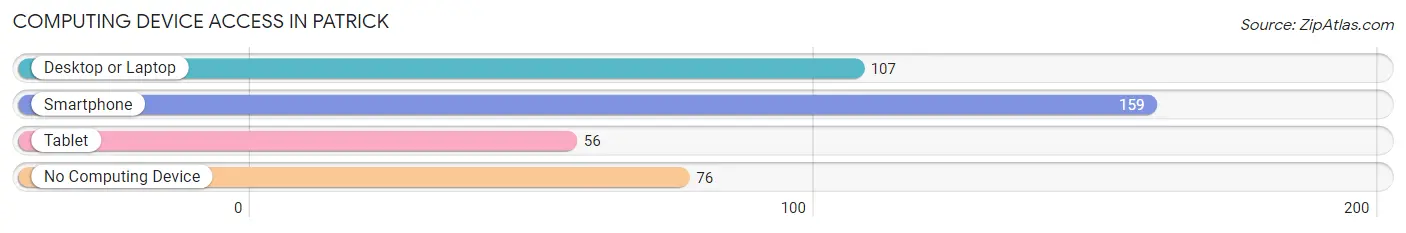
| Device Type | # Households | % Households |
| Desktop or Laptop | 107 | 43.5% |
| Smartphone | 159 | 64.6% |
| Tablet | 56 | 22.8% |
| No Computing Device | 76 | 30.9% |
| Total | 246 | 100.0% |
Internet Access in Patrick
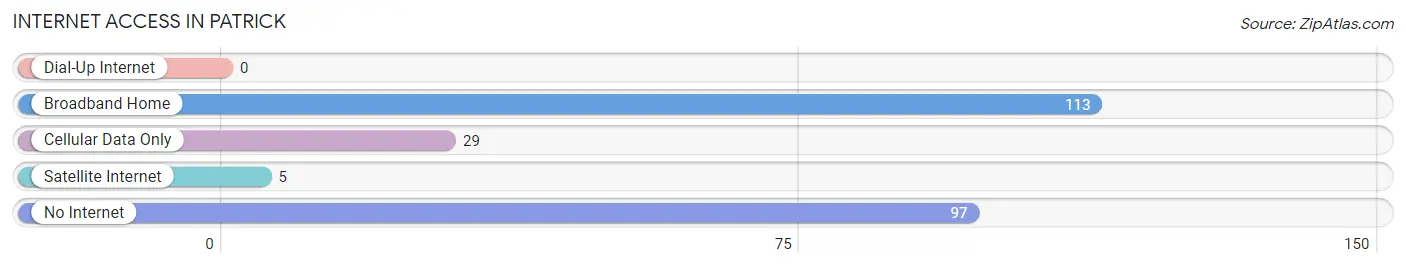
| Internet Type | # Households | % Households |
| Dial-Up Internet | 0 | 0.0% |
| Broadband Home | 113 | 45.9% |
| Cellular Data Only | 29 | 11.8% |
| Satellite Internet | 5 | 2.0% |
| No Internet | 97 | 39.4% |
| Total | 246 | 100.0% |
Patrick Summary
History
The history of Patrick, South Carolina dates back to the early 1700s when the area was first settled by Europeans. The first settlers were mostly Scots-Irish immigrants who came to the area in search of a better life. The area was originally part of the Ninety-Six District, which was created in 1769. The area was then divided into two counties, Edgefield and Abbeville, in 1785.
In the early 1800s, the area was home to a number of small farms and plantations. The economy of the area was largely based on cotton and tobacco production. The area was also home to a number of small businesses, such as sawmills, gristmills, and blacksmiths.
In 1820, the town of Patrick was founded and named after Patrick Calhoun, a prominent local politician. The town quickly grew and by the mid-1800s, it was home to a number of stores, churches, and other businesses.
In the late 1800s, the economy of the area shifted from agriculture to manufacturing. The town of Patrick became home to a number of factories, including a cotton mill, a furniture factory, and a shoe factory. The town also became home to a number of banks and other financial institutions.
In the early 1900s, the town of Patrick continued to grow and prosper. The town was home to a number of schools, churches, and other businesses. The town also became home to a number of fraternal organizations, such as the Masons and the Elks.
In the mid-1900s, the town of Patrick began to decline. The factories and other businesses began to close and the population began to decline. The town was also hit hard by the Great Depression.
In the late 1900s, the town of Patrick began to experience a resurgence. The town was home to a number of new businesses, including a number of restaurants and retail stores. The town also became home to a number of new schools and churches.
Geography
Patrick is located in the Piedmont region of South Carolina. The town is situated in the foothills of the Blue Ridge Mountains and is located about 25 miles northwest of the city of Greenville. The town is located in the Saluda River Valley and is surrounded by rolling hills and forests.
The town of Patrick covers an area of approximately 4.5 square miles and has a population of around 1,500 people. The town is located at an elevation of around 1,000 feet above sea level.
Economy
The economy of Patrick is largely based on agriculture and manufacturing. The town is home to a number of farms and ranches that produce a variety of crops, including corn, soybeans, and hay. The town is also home to a number of factories that produce a variety of products, including furniture, clothing, and shoes.
The town is also home to a number of small businesses, including restaurants, retail stores, and banks. The town is also home to a number of schools, churches, and other organizations.
Demographics
As of the 2010 census, the population of Patrick was 1,521. The racial makeup of the town was 94.3% White, 3.2% African American, 0.3% Native American, 0.2% Asian, 0.1% Pacific Islander, 0.7% from other races, and 1.4% from two or more races. Hispanic or Latino of any race were 1.7% of the population.
The median income for a household in Patrick was $35,938, and the median income for a family was $41,250. The per capita income for the town was $17,845. About 15.2% of families and 18.2% of the population were below the poverty line, including 25.2% of those under age 18 and 11.2% of those age 65 or over.
Common Questions
What is Per Capita Income in Patrick?
Per Capita income in Patrick is $18,967.
What is the Median Family Income in Patrick?
Median Family Income in Patrick is $32,083.
What is the Median Household income in Patrick?
Median Household Income in Patrick is $30,263.
What is Income or Wage Gap in Patrick?
Income or Wage Gap in Patrick is 42.1%.
Women in Patrick earn 57.9 cents for every dollar earned by a man.
What is Inequality or Gini Index in Patrick?
Inequality or Gini Index in Patrick is 0.48.
What is the Total Population of Patrick?
Total Population of Patrick is 500.
What is the Total Male Population of Patrick?
Total Male Population of Patrick is 284.
What is the Total Female Population of Patrick?
Total Female Population of Patrick is 216.
What is the Ratio of Males per 100 Females in Patrick?
There are 131.48 Males per 100 Females in Patrick.
What is the Ratio of Females per 100 Males in Patrick?
There are 76.06 Females per 100 Males in Patrick.
What is the Median Population Age in Patrick?
Median Population Age in Patrick is 46.8 Years.
What is the Average Family Size in Patrick
Average Family Size in Patrick is 3.1 People.
What is the Average Household Size in Patrick
Average Household Size in Patrick is 2.0 People.
How Large is the Labor Force in Patrick?
There are 185 People in the Labor Forcein in Patrick.
What is the Percentage of People in the Labor Force in Patrick?
48.7% of People are in the Labor Force in Patrick.
What is the Unemployment Rate in Patrick?
Unemployment Rate in Patrick is 14.6%.