Salley, SC Map & Demographics
Salley Map
Salley Overview
$17,300
PER CAPITA INCOME
$28,438
AVG FAMILY INCOME
$31,500
AVG HOUSEHOLD INCOME
0.34
INEQUALITY / GINI INDEX
297
TOTAL POPULATION
164
MALE POPULATION
133
FEMALE POPULATION
123.31
MALES / 100 FEMALES
81.10
FEMALES / 100 MALES
37.7
MEDIAN AGE
3.1
AVG FAMILY SIZE
2.1
AVG HOUSEHOLD SIZE
83
LABOR FORCE [ PEOPLE ]
39.9%
PERCENT IN LABOR FORCE
10.8%
UNEMPLOYMENT RATE
Salley Zip Codes
Salley Area Codes
Income in Salley
Income Overview in Salley
Per Capita Income in Salley is $17,300, while median incomes of families and households are $28,438 and $31,500 respectively.
| Characteristic | Number | Measure |
| Per Capita Income | 297 | $17,300 |
| Median Family Income | 71 | $28,438 |
| Mean Family Income | 71 | $37,065 |
| Median Household Income | 140 | $31,500 |
| Mean Household Income | 140 | $37,691 |
| Income Deficit | 71 | $0 |
| Wage / Income Gap (%) | 297 | 0.00% |
| Wage / Income Gap ($) | 297 | 100.00¢ per $1 |
| Gini / Inequality Index | 297 | 0.34 |
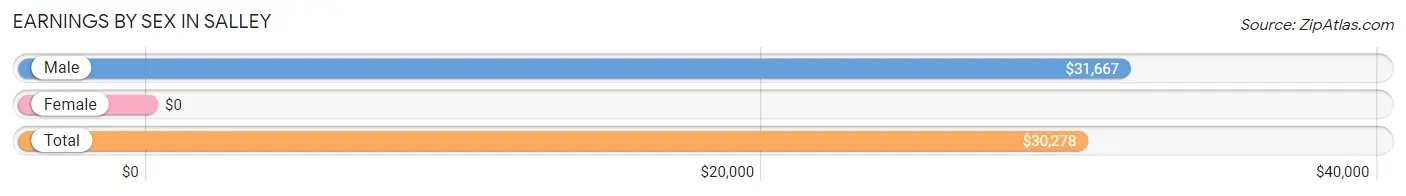
Earnings by Sex in Salley
| Sex | Number | Average Earnings |
| Male | 44 (48.9%) | $31,667 |
| Female | 46 (51.1%) | $0 |
| Total | 90 (100.0%) | $30,278 |
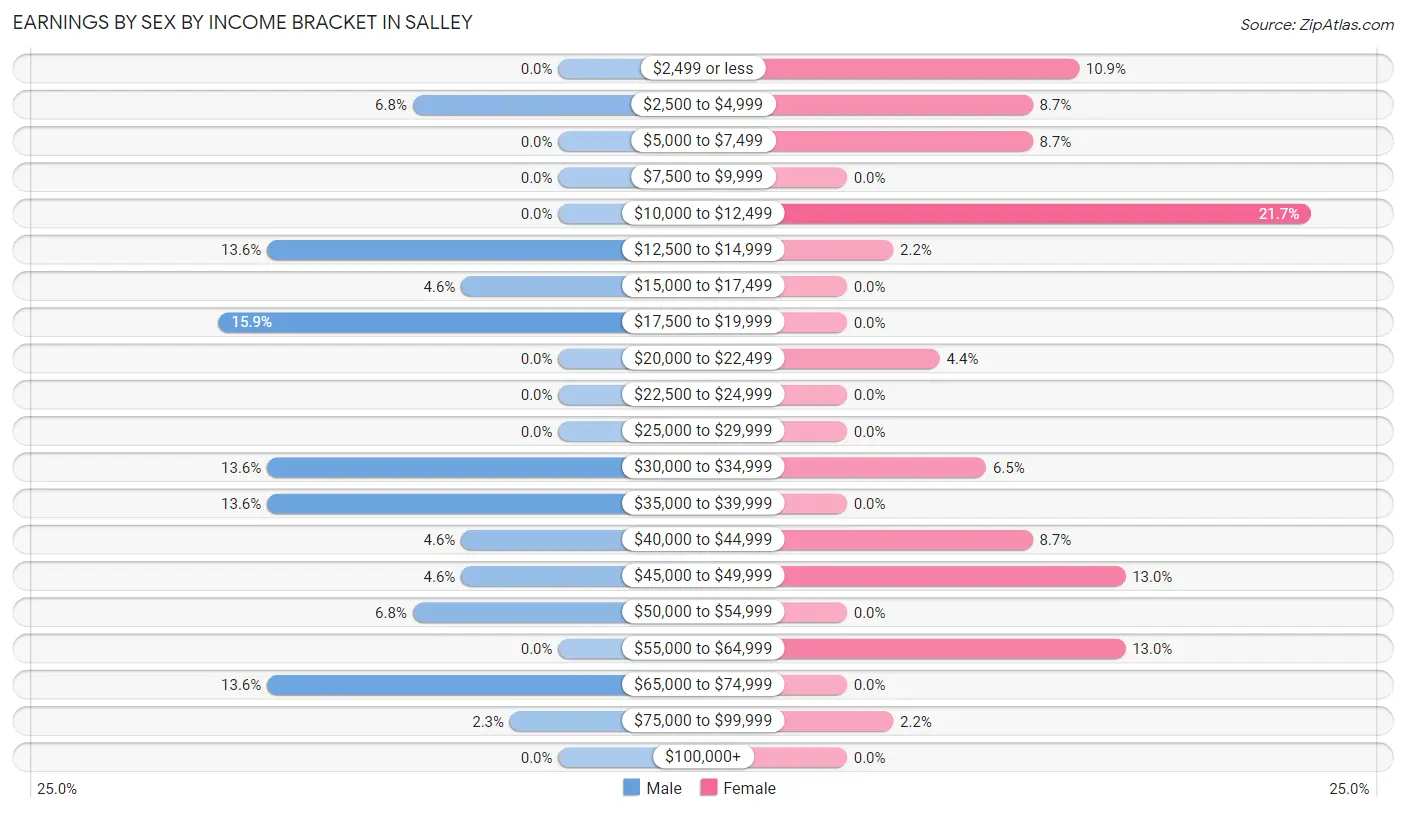
Earnings by Sex by Income Bracket in Salley
The most common earnings brackets in Salley are $17,500 to $19,999 for men (7 | 15.9%) and $10,000 to $12,499 for women (10 | 21.7%).
| Income | Male | Female |
| $2,499 or less | 0 (0.0%) | 5 (10.9%) |
| $2,500 to $4,999 | 3 (6.8%) | 4 (8.7%) |
| $5,000 to $7,499 | 0 (0.0%) | 4 (8.7%) |
| $7,500 to $9,999 | 0 (0.0%) | 0 (0.0%) |
| $10,000 to $12,499 | 0 (0.0%) | 10 (21.7%) |
| $12,500 to $14,999 | 6 (13.6%) | 1 (2.2%) |
| $15,000 to $17,499 | 2 (4.5%) | 0 (0.0%) |
| $17,500 to $19,999 | 7 (15.9%) | 0 (0.0%) |
| $20,000 to $22,499 | 0 (0.0%) | 2 (4.3%) |
| $22,500 to $24,999 | 0 (0.0%) | 0 (0.0%) |
| $25,000 to $29,999 | 0 (0.0%) | 0 (0.0%) |
| $30,000 to $34,999 | 6 (13.6%) | 3 (6.5%) |
| $35,000 to $39,999 | 6 (13.6%) | 0 (0.0%) |
| $40,000 to $44,999 | 2 (4.5%) | 4 (8.7%) |
| $45,000 to $49,999 | 2 (4.5%) | 6 (13.0%) |
| $50,000 to $54,999 | 3 (6.8%) | 0 (0.0%) |
| $55,000 to $64,999 | 0 (0.0%) | 6 (13.0%) |
| $65,000 to $74,999 | 6 (13.6%) | 0 (0.0%) |
| $75,000 to $99,999 | 1 (2.3%) | 1 (2.2%) |
| $100,000+ | 0 (0.0%) | 0 (0.0%) |
| Total | 44 (100.0%) | 46 (100.0%) |
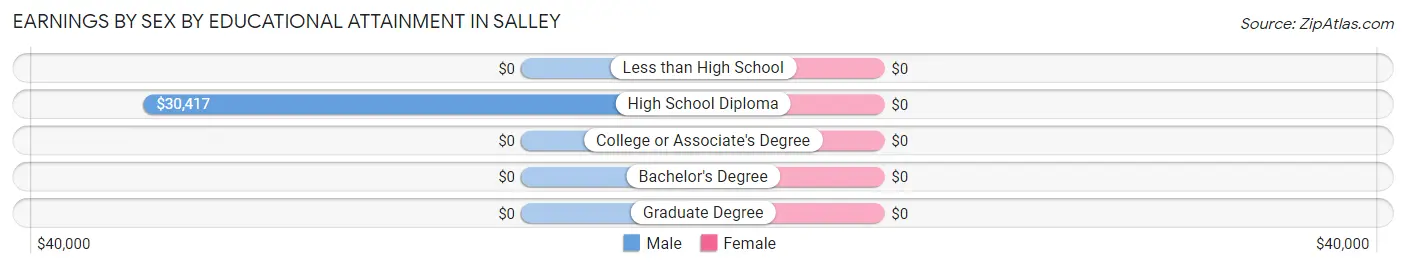
Earnings by Sex by Educational Attainment in Salley
| Educational Attainment | Male Income | Female Income |
| Less than High School | - | - |
| High School Diploma | $30,417 | $0 |
| College or Associate's Degree | - | - |
| Bachelor's Degree | - | - |
| Graduate Degree | - | - |
| Total | $32,292 | $0 |
Family Income in Salley
Family Income Brackets in Salley
According to the Salley family income data, there are 14 families falling into the $25,000 to $34,999 income range, which is the most common income bracket and makes up 19.7% of all families.
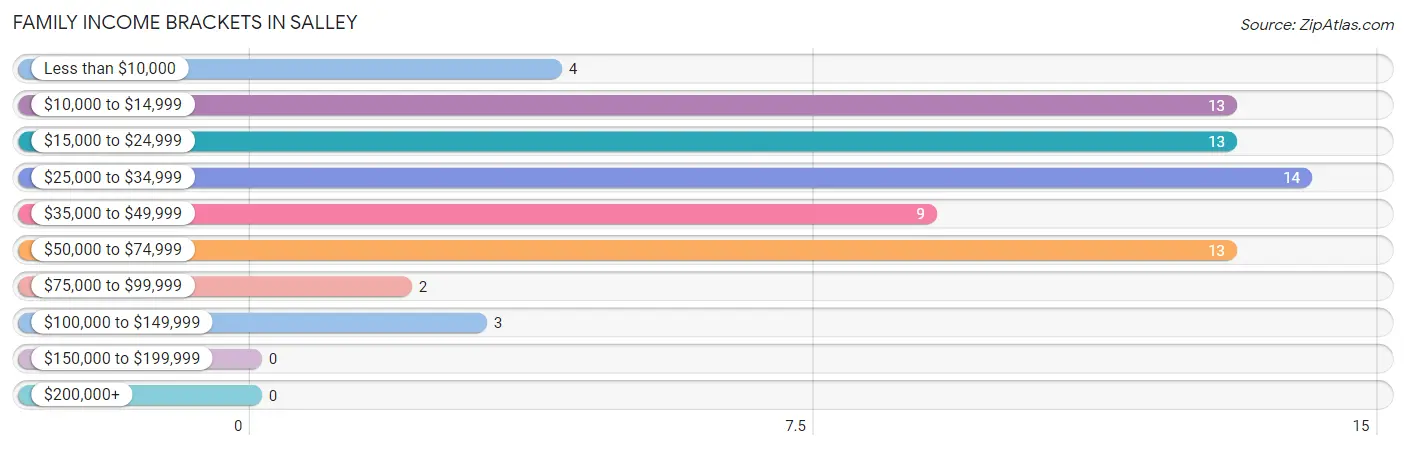
| Income Bracket | # Families | % Families |
| Less than $10,000 | 4 | 5.6% |
| $10,000 to $14,999 | 13 | 18.3% |
| $15,000 to $24,999 | 13 | 18.3% |
| $25,000 to $34,999 | 14 | 19.7% |
| $35,000 to $49,999 | 9 | 12.7% |
| $50,000 to $74,999 | 13 | 18.3% |
| $75,000 to $99,999 | 2 | 2.8% |
| $100,000 to $149,999 | 3 | 4.2% |
| $150,000 to $199,999 | 0 | 0.0% |
| $200,000+ | 0 | 0.0% |
Family Income by Famaliy Size in Salley
3-person families (6 | 8.5%) account for the highest median family income in Salley with $48,125 per family, while 3-person families (6 | 8.5%) have the highest median income of $16,042 per family member.
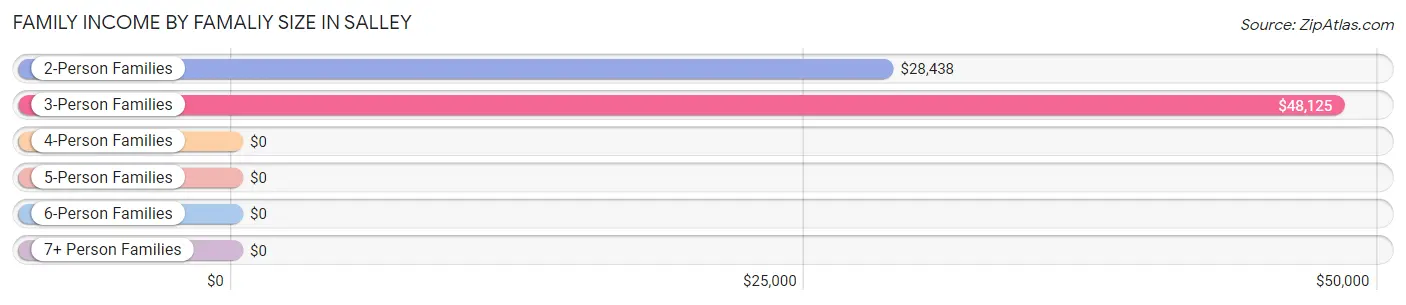
| Income Bracket | # Families | Median Income |
| 2-Person Families | 37 (52.1%) | $28,438 |
| 3-Person Families | 6 (8.5%) | $48,125 |
| 4-Person Families | 16 (22.5%) | $0 |
| 5-Person Families | 7 (9.9%) | $0 |
| 6-Person Families | 3 (4.2%) | $0 |
| 7+ Person Families | 2 (2.8%) | $0 |
| Total | 71 (100.0%) | $28,438 |
Family Income by Number of Earners in Salley
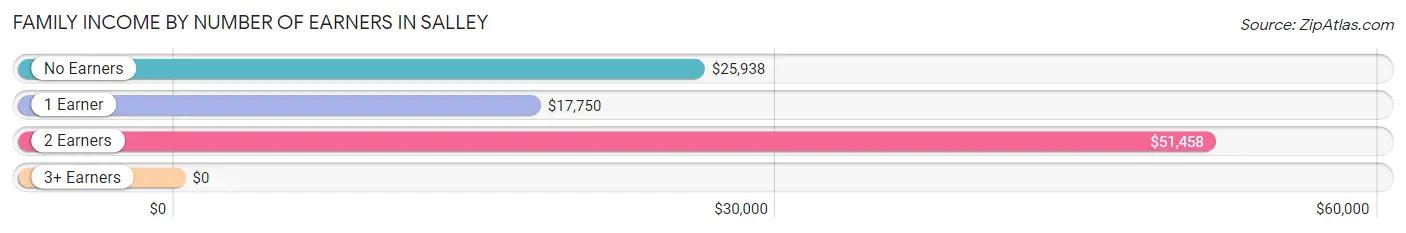
| Number of Earners | # Families | Median Income |
| No Earners | 21 (29.6%) | $25,938 |
| 1 Earner | 33 (46.5%) | $17,750 |
| 2 Earners | 15 (21.1%) | $51,458 |
| 3+ Earners | 2 (2.8%) | $0 |
| Total | 71 (100.0%) | $28,438 |
Household Income in Salley
Household Income Brackets in Salley
With 43 households falling in the category, the $25,000 to $34,999 income range is the most frequent in Salley, accounting for 30.7% of all households.
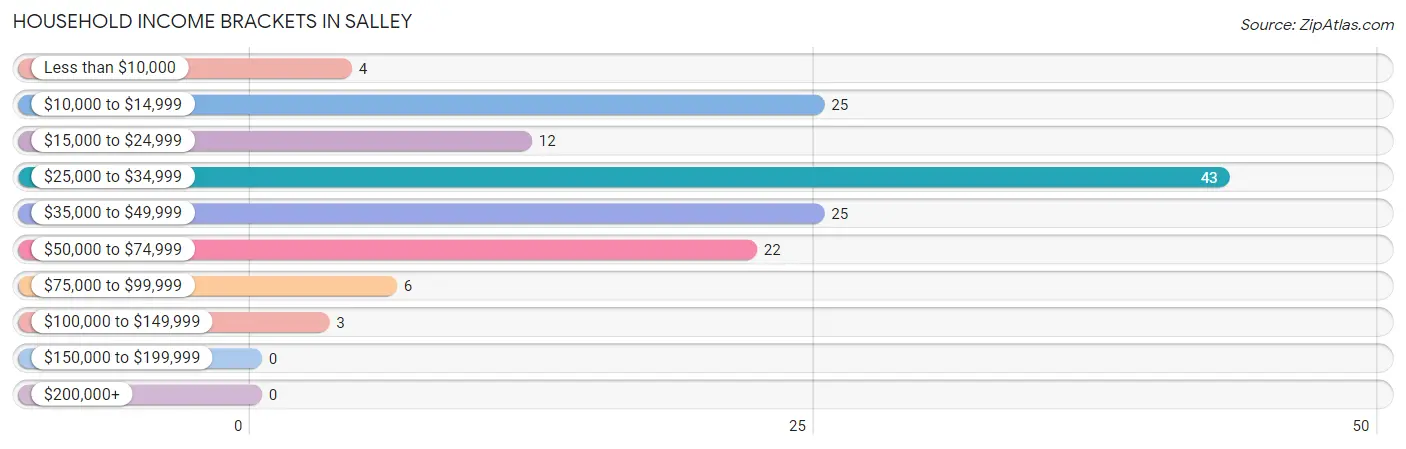
| Income Bracket | # Households | % Households |
| Less than $10,000 | 4 | 2.9% |
| $10,000 to $14,999 | 25 | 17.9% |
| $15,000 to $24,999 | 12 | 8.6% |
| $25,000 to $34,999 | 43 | 30.7% |
| $35,000 to $49,999 | 25 | 17.9% |
| $50,000 to $74,999 | 22 | 15.7% |
| $75,000 to $99,999 | 6 | 4.3% |
| $100,000 to $149,999 | 3 | 2.1% |
| $150,000 to $199,999 | 0 | 0.0% |
| $200,000+ | 0 | 0.0% |
Household Income by Householder Age in Salley
The median household income in Salley is $31,500, with the highest median household income of $52,500 found in the 45 to 64 years age bracket for the primary householder. A total of 28 households (20.0%) fall into this category.
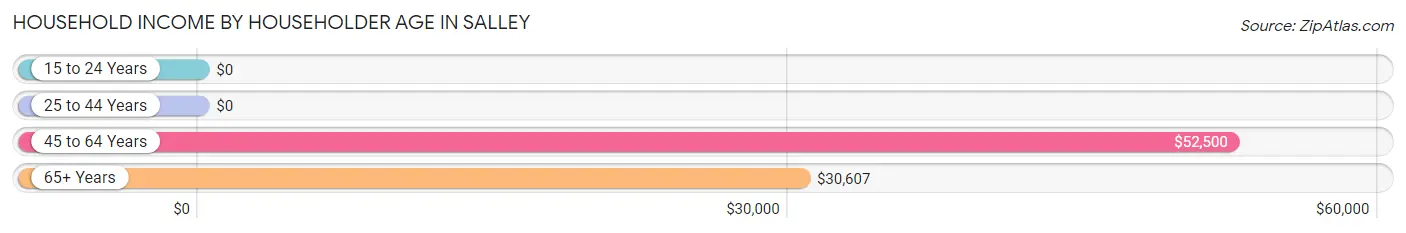
| Income Bracket | # Households | Median Income |
| 15 to 24 Years | 0 (0.0%) | $0 |
| 25 to 44 Years | 43 (30.7%) | $0 |
| 45 to 64 Years | 28 (20.0%) | $52,500 |
| 65+ Years | 69 (49.3%) | $30,607 |
| Total | 140 (100.0%) | $31,500 |
Poverty in Salley
Income Below Poverty by Sex and Age in Salley
With 30.5% poverty level for males and 45.1% for females among the residents of Salley, 5 year old males and under 5 year old females are the most vulnerable to poverty, with 12 males (100.0%) and 8 females (100.0%) in their respective age groups living below the poverty level.
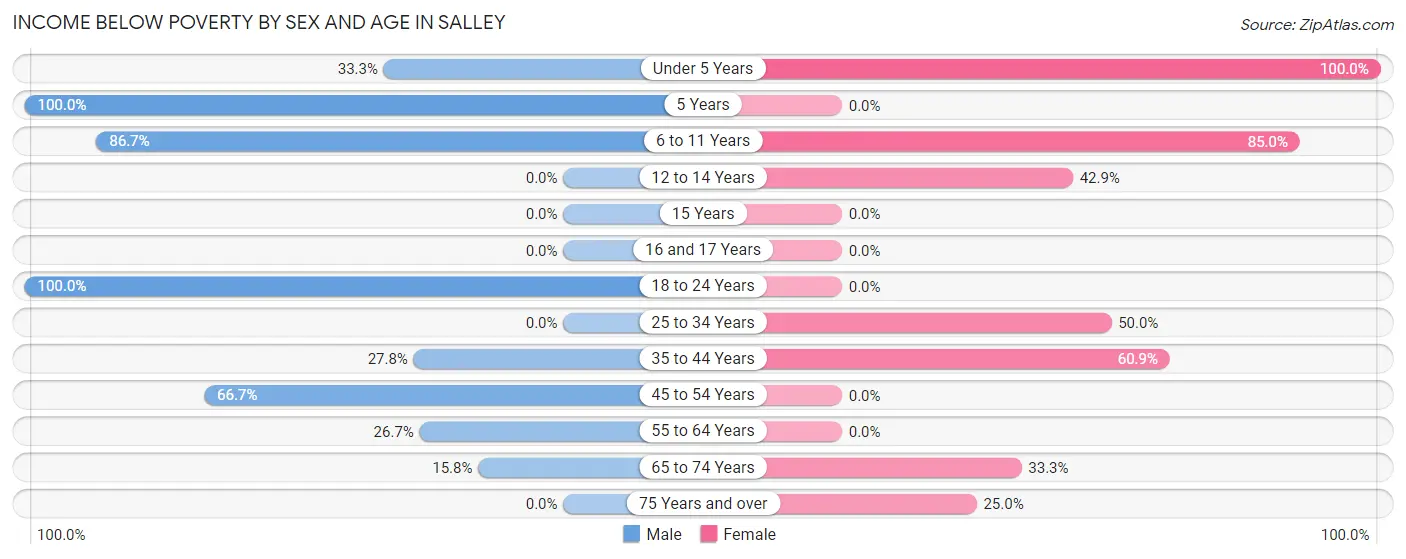
| Age Bracket | Male | Female |
| Under 5 Years | 4 (33.3%) | 8 (100.0%) |
| 5 Years | 12 (100.0%) | 0 (0.0%) |
| 6 to 11 Years | 13 (86.7%) | 17 (85.0%) |
| 12 to 14 Years | 0 (0.0%) | 6 (42.9%) |
| 15 Years | 0 (0.0%) | 0 (0.0%) |
| 16 and 17 Years | 0 (0.0%) | 0 (0.0%) |
| 18 to 24 Years | 3 (100.0%) | 0 (0.0%) |
| 25 to 34 Years | 0 (0.0%) | 7 (50.0%) |
| 35 to 44 Years | 5 (27.8%) | 14 (60.9%) |
| 45 to 54 Years | 6 (66.7%) | 0 (0.0%) |
| 55 to 64 Years | 4 (26.7%) | 0 (0.0%) |
| 65 to 74 Years | 3 (15.8%) | 6 (33.3%) |
| 75 Years and over | 0 (0.0%) | 2 (25.0%) |
| Total | 50 (30.5%) | 60 (45.1%) |
Income Above Poverty by Sex and Age in Salley
According to the poverty statistics in Salley, males aged 12 to 14 years and females aged 16 and 17 years are the age groups that are most secure financially, with 100.0% of males and 100.0% of females in these age groups living above the poverty line.
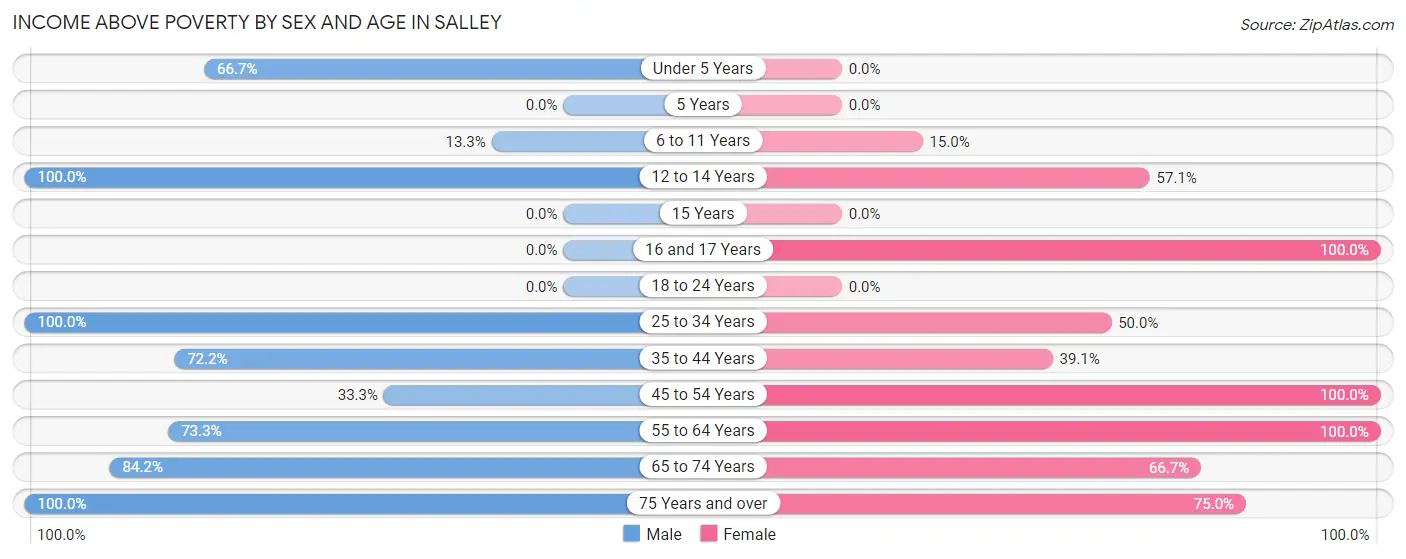
| Age Bracket | Male | Female |
| Under 5 Years | 8 (66.7%) | 0 (0.0%) |
| 5 Years | 0 (0.0%) | 0 (0.0%) |
| 6 to 11 Years | 2 (13.3%) | 3 (15.0%) |
| 12 to 14 Years | 8 (100.0%) | 8 (57.1%) |
| 15 Years | 0 (0.0%) | 0 (0.0%) |
| 16 and 17 Years | 0 (0.0%) | 7 (100.0%) |
| 18 to 24 Years | 0 (0.0%) | 0 (0.0%) |
| 25 to 34 Years | 9 (100.0%) | 7 (50.0%) |
| 35 to 44 Years | 13 (72.2%) | 9 (39.1%) |
| 45 to 54 Years | 3 (33.3%) | 4 (100.0%) |
| 55 to 64 Years | 11 (73.3%) | 17 (100.0%) |
| 65 to 74 Years | 16 (84.2%) | 12 (66.7%) |
| 75 Years and over | 44 (100.0%) | 6 (75.0%) |
| Total | 114 (69.5%) | 73 (54.9%) |
Income Below Poverty Among Married-Couple Families in Salley
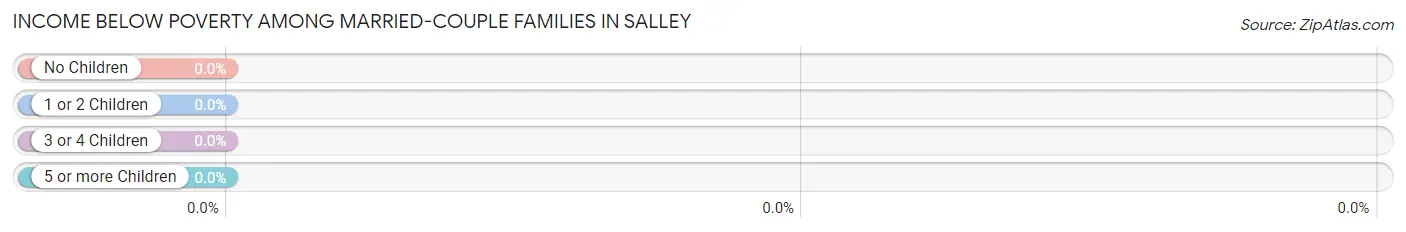
| Children | Above Poverty | Below Poverty |
| No Children | 28 (100.0%) | 0 (0.0%) |
| 1 or 2 Children | 0 (0.0%) | 0 (0.0%) |
| 3 or 4 Children | 6 (100.0%) | 0 (0.0%) |
| 5 or more Children | 0 (0.0%) | 0 (0.0%) |
| Total | 34 (100.0%) | 0 (0.0%) |
Income Below Poverty Among Single-Parent Households in Salley
According to the poverty data in Salley, 45.5% or 5 single-father households and 73.1% or 19 single-mother households are living below the poverty line. Among single-father households, those with 1 or 2 children have the highest poverty rate, with 5 households (100.0%) experiencing poverty. Likewise, among single-mother households, those with no children have the highest poverty rate, with 2 households (100.0%) falling below the poverty line.
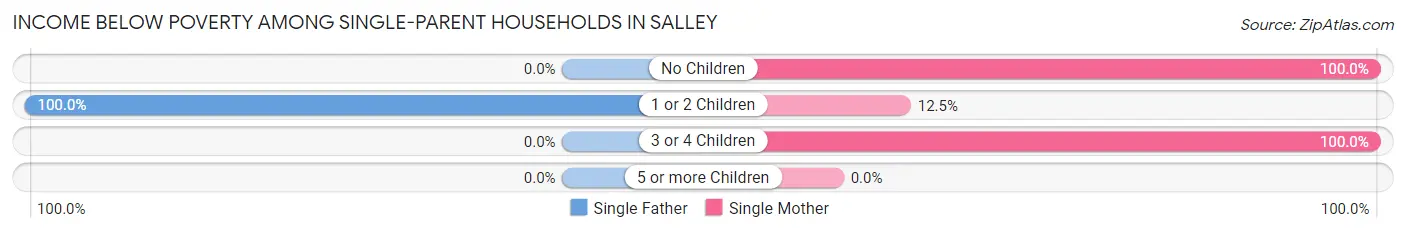
| Children | Single Father | Single Mother |
| No Children | 0 (0.0%) | 2 (100.0%) |
| 1 or 2 Children | 5 (100.0%) | 1 (12.5%) |
| 3 or 4 Children | 0 (0.0%) | 16 (100.0%) |
| 5 or more Children | 0 (0.0%) | 0 (0.0%) |
| Total | 5 (45.5%) | 19 (73.1%) |
Income Below Poverty Among Married-Couple vs Single-Parent Households in Salley
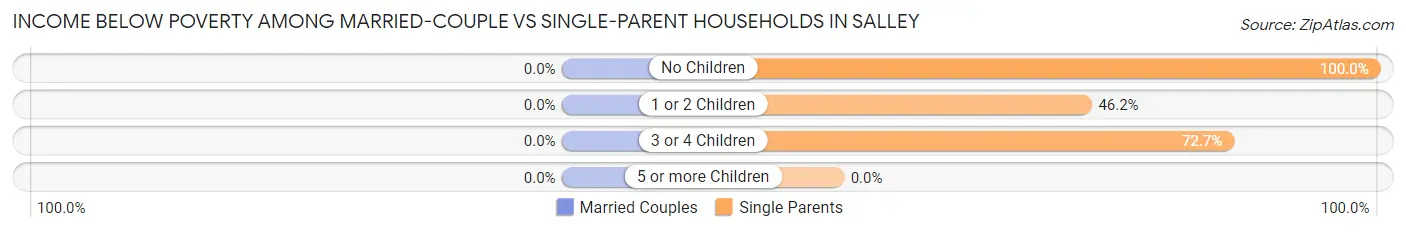
| Children | Married-Couple Families | Single-Parent Households |
| No Children | 0 (0.0%) | 2 (100.0%) |
| 1 or 2 Children | 0 (0.0%) | 6 (46.2%) |
| 3 or 4 Children | 0 (0.0%) | 16 (72.7%) |
| 5 or more Children | 0 (0.0%) | 0 (0.0%) |
| Total | 0 (0.0%) | 24 (64.9%) |
Race in Salley
The most populous races in Salley are Black / African American (167 | 56.2%), White / Caucasian (105 | 35.3%), and Two or more Races (22 | 7.4%).
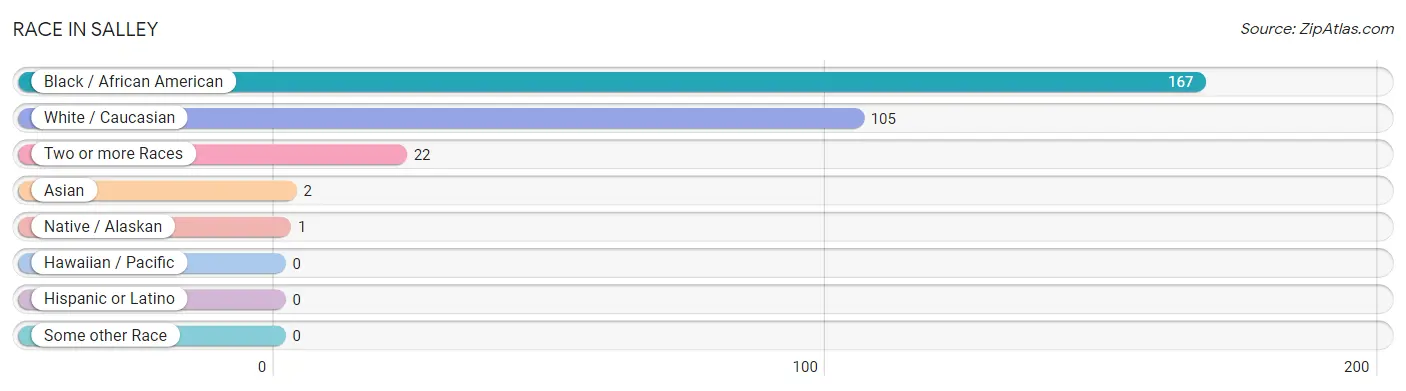
| Race | # Population | % Population |
| Asian | 2 | 0.7% |
| Black / African American | 167 | 56.2% |
| Hawaiian / Pacific | 0 | 0.0% |
| Hispanic or Latino | 0 | 0.0% |
| Native / Alaskan | 1 | 0.3% |
| White / Caucasian | 105 | 35.3% |
| Two or more Races | 22 | 7.4% |
| Some other Race | 0 | 0.0% |
| Total | 297 | 100.0% |
Ancestry in Salley
The most populous ancestries reported in Salley are African (50 | 16.8%), Subsaharan African (50 | 16.8%), American (41 | 13.8%), Irish (15 | 5.1%), and German (12 | 4.0%), together accounting for 56.6% of all Salley residents.
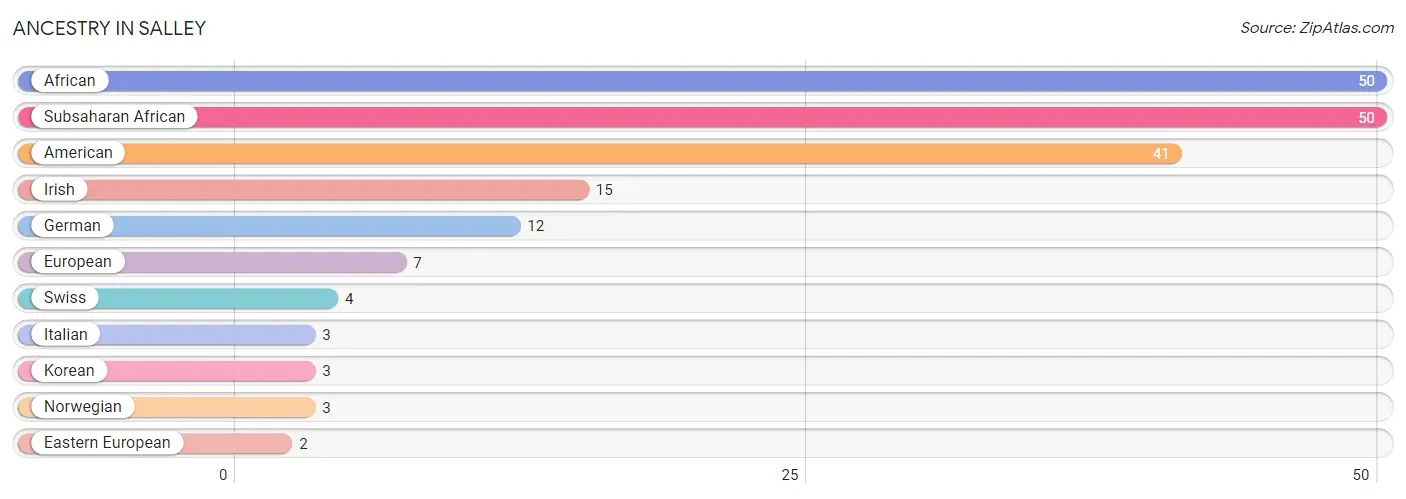
| Ancestry | # Population | % Population |
| African | 50 | 16.8% |
| American | 41 | 13.8% |
| Eastern European | 2 | 0.7% |
| European | 7 | 2.4% |
| German | 12 | 4.0% |
| Irish | 15 | 5.1% |
| Italian | 3 | 1.0% |
| Korean | 3 | 1.0% |
| Norwegian | 3 | 1.0% |
| Subsaharan African | 50 | 16.8% |
| Swiss | 4 | 1.3% | View All 11 Rows |
Immigrants in Salley
The most numerous immigrant groups reported in Salley came from Asia (2 | 0.7%), Philippines (2 | 0.7%), and South Eastern Asia (2 | 0.7%), together accounting for 2.0% of all Salley residents.
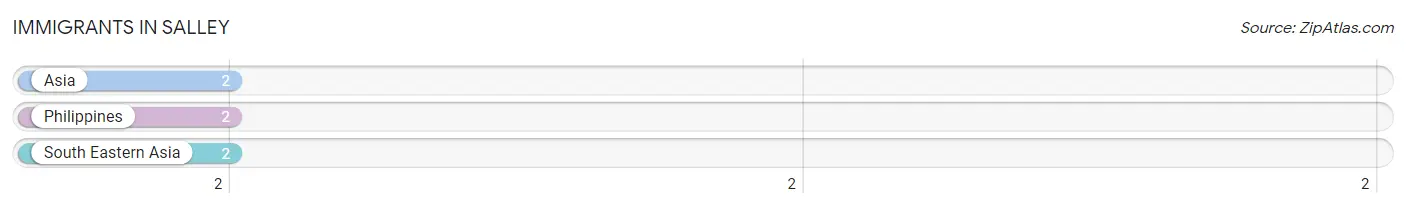
| Immigration Origin | # Population | % Population |
| Asia | 2 | 0.7% |
| Philippines | 2 | 0.7% |
| South Eastern Asia | 2 | 0.7% | View All 3 Rows |
Sex and Age in Salley
Sex and Age in Salley
The most populous age groups in Salley are 80 to 84 Years (40 | 24.4%) for men and 35 to 39 Years (23 | 17.3%) for women.
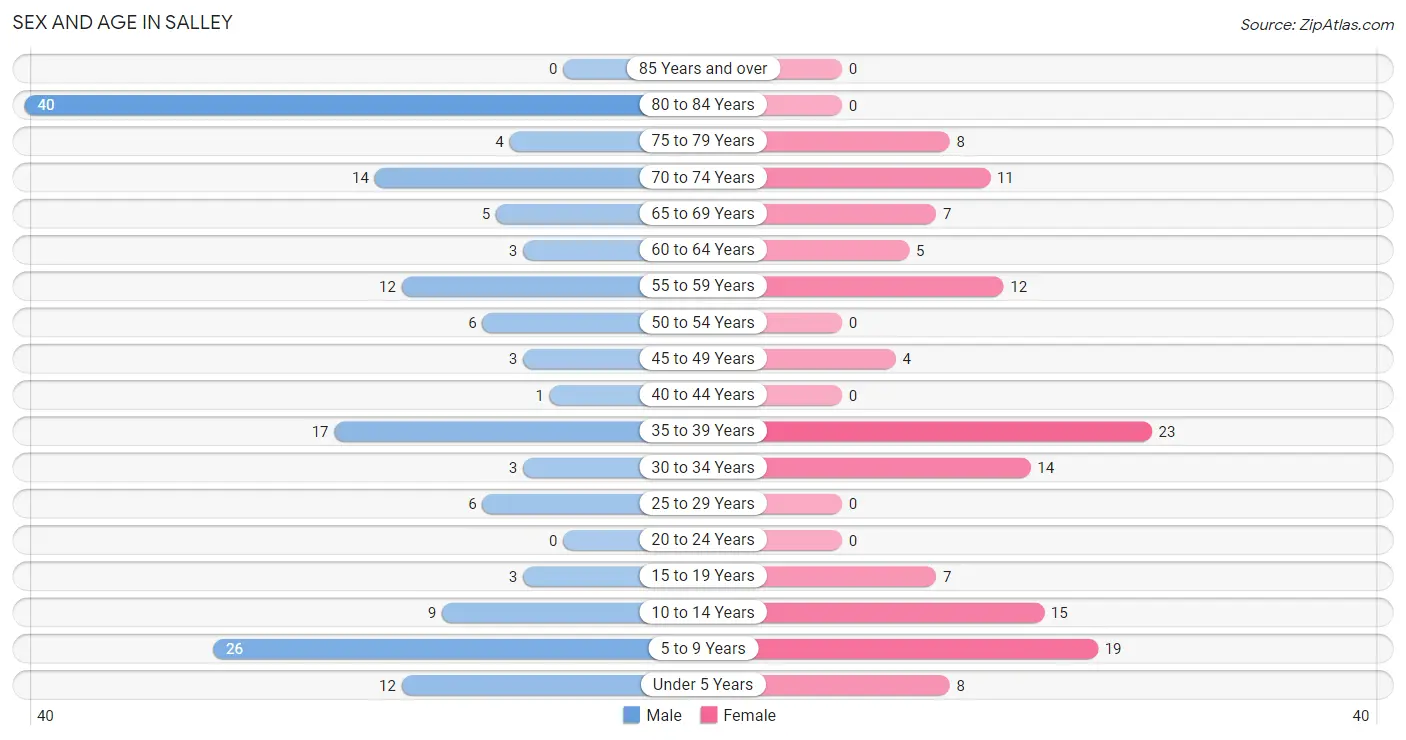
| Age Bracket | Male | Female |
| Under 5 Years | 12 (7.3%) | 8 (6.0%) |
| 5 to 9 Years | 26 (15.9%) | 19 (14.3%) |
| 10 to 14 Years | 9 (5.5%) | 15 (11.3%) |
| 15 to 19 Years | 3 (1.8%) | 7 (5.3%) |
| 20 to 24 Years | 0 (0.0%) | 0 (0.0%) |
| 25 to 29 Years | 6 (3.7%) | 0 (0.0%) |
| 30 to 34 Years | 3 (1.8%) | 14 (10.5%) |
| 35 to 39 Years | 17 (10.4%) | 23 (17.3%) |
| 40 to 44 Years | 1 (0.6%) | 0 (0.0%) |
| 45 to 49 Years | 3 (1.8%) | 4 (3.0%) |
| 50 to 54 Years | 6 (3.7%) | 0 (0.0%) |
| 55 to 59 Years | 12 (7.3%) | 12 (9.0%) |
| 60 to 64 Years | 3 (1.8%) | 5 (3.8%) |
| 65 to 69 Years | 5 (3.0%) | 7 (5.3%) |
| 70 to 74 Years | 14 (8.5%) | 11 (8.3%) |
| 75 to 79 Years | 4 (2.4%) | 8 (6.0%) |
| 80 to 84 Years | 40 (24.4%) | 0 (0.0%) |
| 85 Years and over | 0 (0.0%) | 0 (0.0%) |
| Total | 164 (100.0%) | 133 (100.0%) |
Families and Households in Salley
Median Family Size in Salley
The median family size in Salley is 3.07 persons per family, with single female/mother families (26 | 36.6%) accounting for the largest median family size of 3.77 persons per family. On the other hand, married-couple families (34 | 47.9%) represent the smallest median family size with 2.59 persons per family.
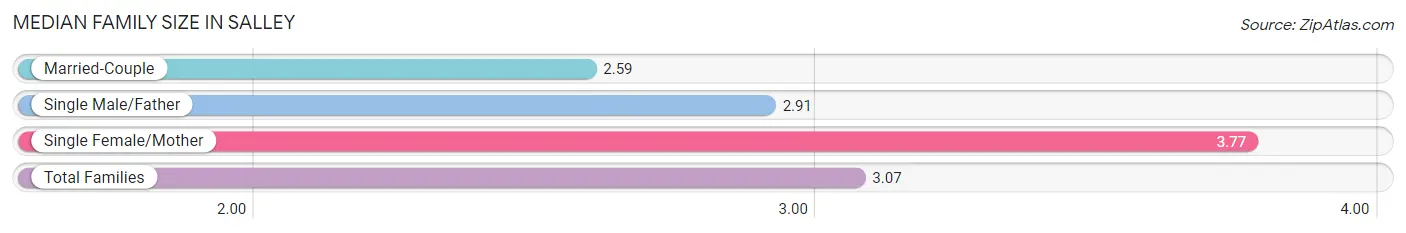
| Family Type | # Families | Family Size |
| Married-Couple | 34 (47.9%) | 2.59 |
| Single Male/Father | 11 (15.5%) | 2.91 |
| Single Female/Mother | 26 (36.6%) | 3.77 |
| Total Families | 71 (100.0%) | 3.07 |
Median Household Size in Salley
The median household size in Salley is 2.12 persons per household, with single female/mother households (26 | 18.6%) accounting for the largest median household size of 3.77 persons per household. non-family households (69 | 49.3%) represent the smallest median household size with 1.04 persons per household.
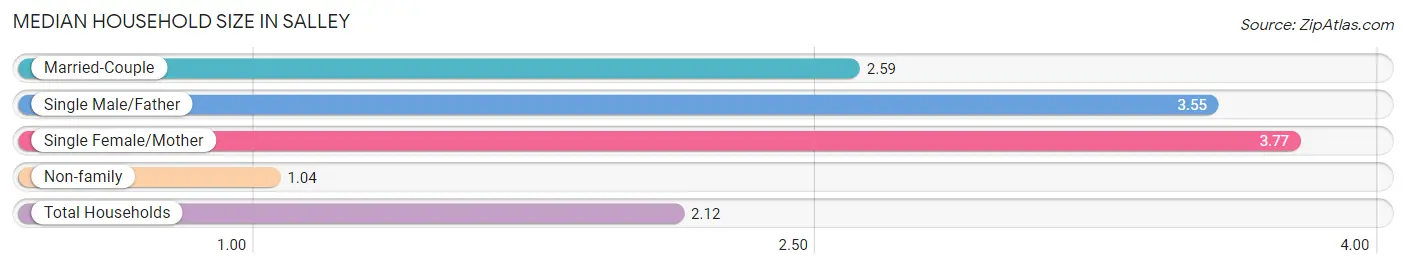
| Household Type | # Households | Household Size |
| Married-Couple | 34 (24.3%) | 2.59 |
| Single Male/Father | 11 (7.9%) | 3.55 |
| Single Female/Mother | 26 (18.6%) | 3.77 |
| Non-family | 69 (49.3%) | 1.04 |
| Total Households | 140 (100.0%) | 2.12 |
Household Size by Marriage Status in Salley
Out of a total of 140 households in Salley, 71 (50.7%) are family households, while 69 (49.3%) are nonfamily households. The most numerous type of family households are 2-person households, comprising 32, and the most common type of nonfamily households are 1-person households, comprising 67.
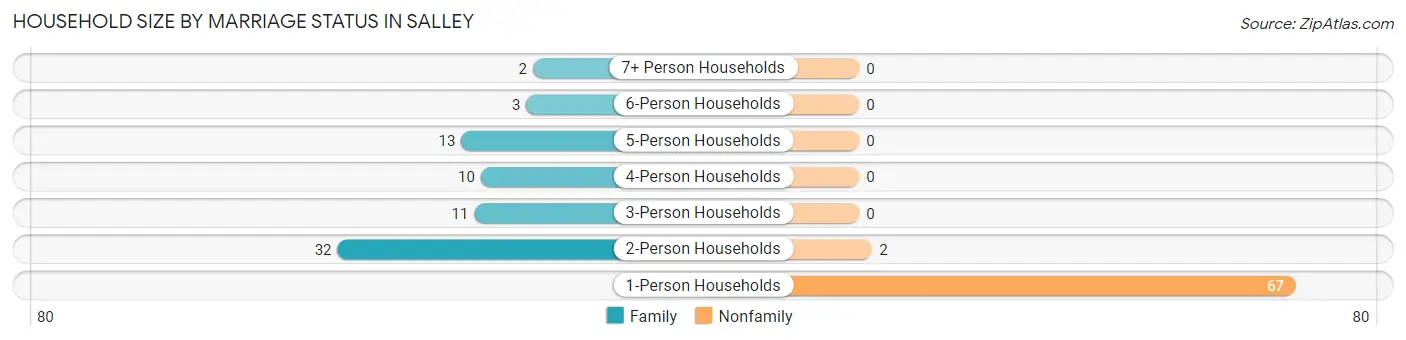
| Household Size | Family Households | Nonfamily Households |
| 1-Person Households | - | 67 (47.9%) |
| 2-Person Households | 32 (22.9%) | 2 (1.4%) |
| 3-Person Households | 11 (7.9%) | 0 (0.0%) |
| 4-Person Households | 10 (7.1%) | 0 (0.0%) |
| 5-Person Households | 13 (9.3%) | 0 (0.0%) |
| 6-Person Households | 3 (2.1%) | 0 (0.0%) |
| 7+ Person Households | 2 (1.4%) | 0 (0.0%) |
| Total | 71 (50.7%) | 69 (49.3%) |
Female Fertility in Salley
Fertility by Age in Salley
Average fertility rate in Salley is 63.0 births per 1,000 women. Women in the age bracket of 20 to 34 years have the highest fertility rate with 214.0 births per 1,000 women. Women in the age bracket of 20 to 34 years acount for 100.0% of all women with births.
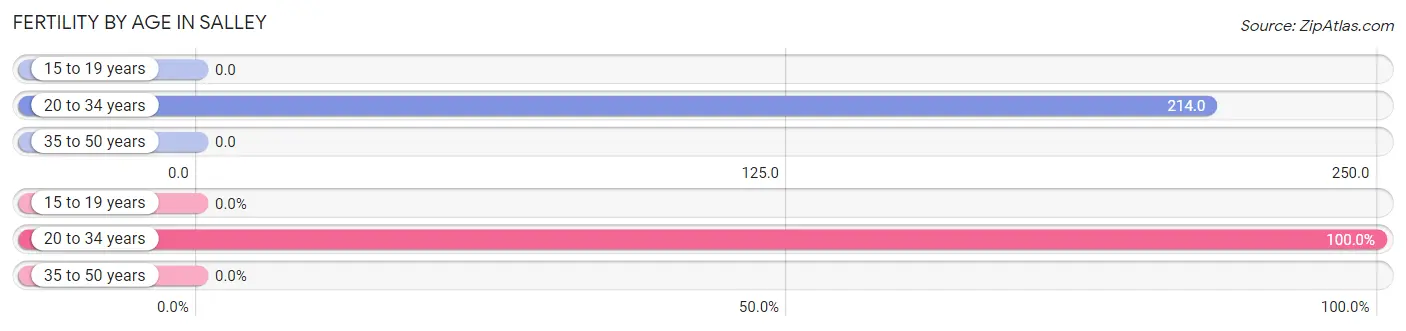
| Age Bracket | Women with Births | Births / 1,000 Women |
| 15 to 19 years | 0 (0.0%) | 0.0 |
| 20 to 34 years | 3 (100.0%) | 214.0 |
| 35 to 50 years | 0 (0.0%) | 0.0 |
| Total | 3 (100.0%) | 63.0 |
Fertility by Age by Marriage Status in Salley
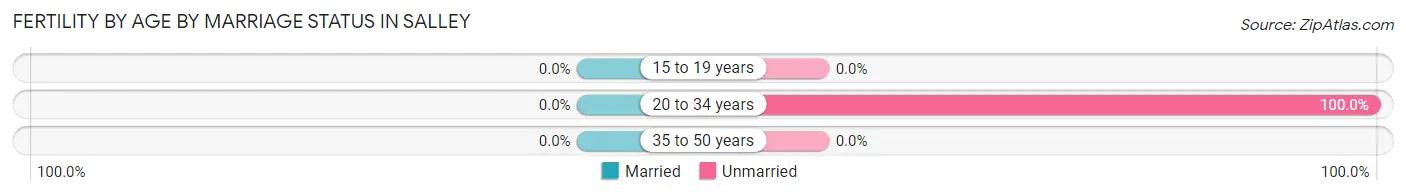
| Age Bracket | Married | Unmarried |
| 15 to 19 years | 0 (0.0%) | 0 (0.0%) |
| 20 to 34 years | 0 (0.0%) | 3 (100.0%) |
| 35 to 50 years | 0 (0.0%) | 0 (0.0%) |
| Total | 0 (0.0%) | 3 (100.0%) |
Fertility by Education in Salley
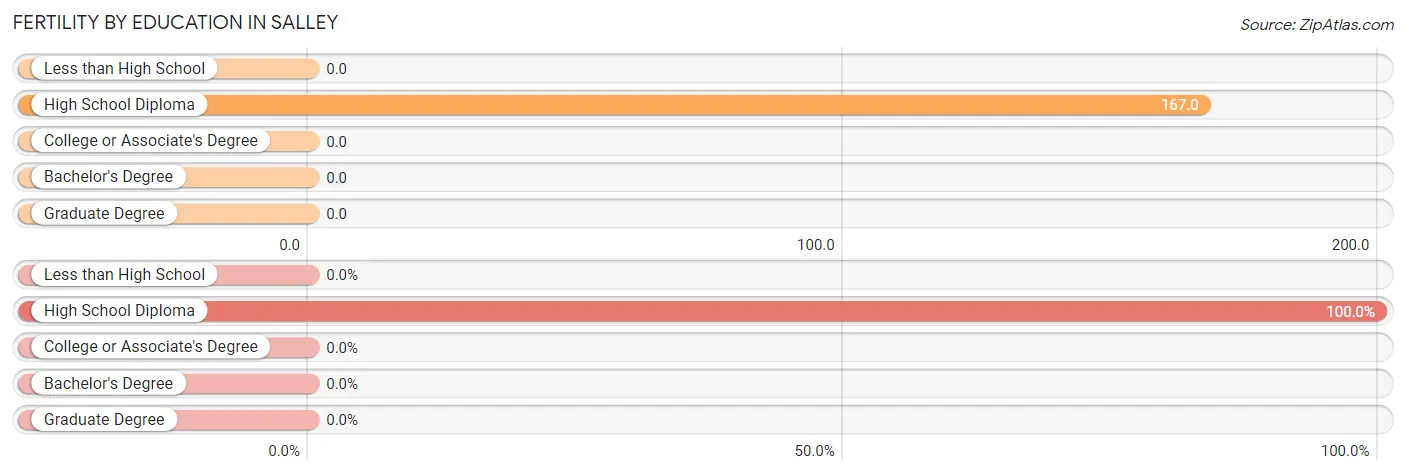
| Educational Attainment | Women with Births | Births / 1,000 Women |
| Less than High School | 0 (0.0%) | 0.0 |
| High School Diploma | 3 (100.0%) | 167.0 |
| College or Associate's Degree | 0 (0.0%) | 0.0 |
| Bachelor's Degree | 0 (0.0%) | 0.0 |
| Graduate Degree | 0 (0.0%) | 0.0 |
| Total | 3 (100.0%) | 63.0 |
Fertility by Education by Marriage Status in Salley
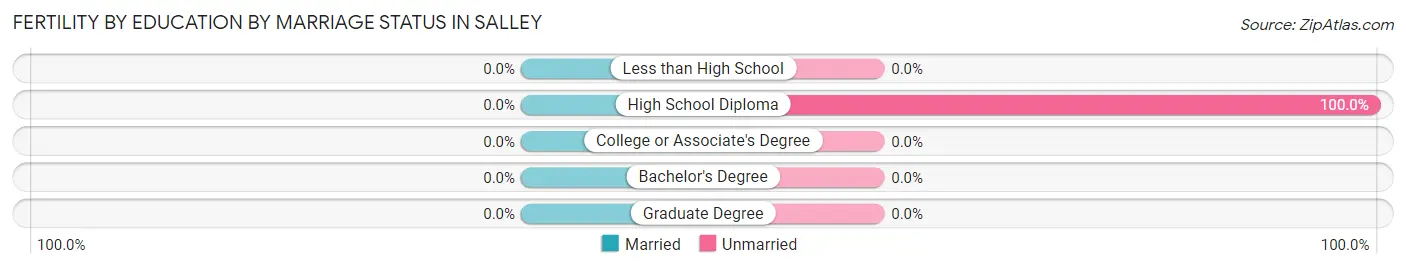
| Educational Attainment | Married | Unmarried |
| Less than High School | 0 (0.0%) | 0 (0.0%) |
| High School Diploma | 0 (0.0%) | 3 (100.0%) |
| College or Associate's Degree | 0 (0.0%) | 0 (0.0%) |
| Bachelor's Degree | 0 (0.0%) | 0 (0.0%) |
| Graduate Degree | 0 (0.0%) | 0 (0.0%) |
| Total | 0 (0.0%) | 3 (100.0%) |
Employment Characteristics in Salley
Employment by Class of Employer in Salley
Among the 74 employed individuals in Salley, private company employees (51 | 68.9%), federal government employees (12 | 16.2%), and self-employed (not incorporated) (4 | 5.4%) make up the most common classes of employment.
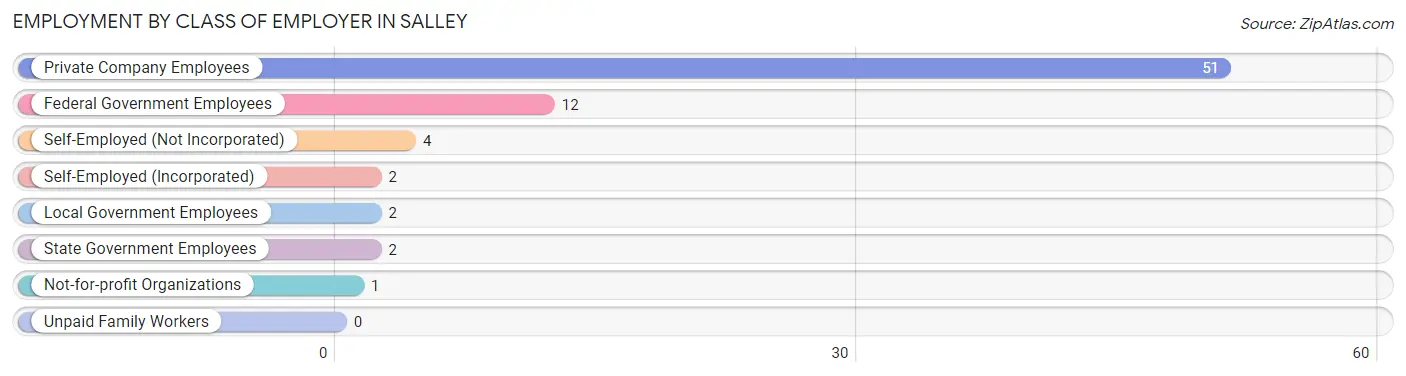
| Employer Class | # Employees | % Employees |
| Private Company Employees | 51 | 68.9% |
| Self-Employed (Incorporated) | 2 | 2.7% |
| Self-Employed (Not Incorporated) | 4 | 5.4% |
| Not-for-profit Organizations | 1 | 1.3% |
| Local Government Employees | 2 | 2.7% |
| State Government Employees | 2 | 2.7% |
| Federal Government Employees | 12 | 16.2% |
| Unpaid Family Workers | 0 | 0.0% |
| Total | 74 | 100.0% |
Employment Status by Age in Salley
According to the labor force statistics for Salley, out of the total population over 16 years of age (208), 39.9% or 83 individuals are in the labor force, with 10.8% or 9 of them unemployed. The age group with the highest labor force participation rate is 30 to 34 years, with 100.0% or 17 individuals in the labor force. Within the labor force, the 55 to 59 years age range has the highest percentage of unemployed individuals, with 56.3% or 9 of them being unemployed.
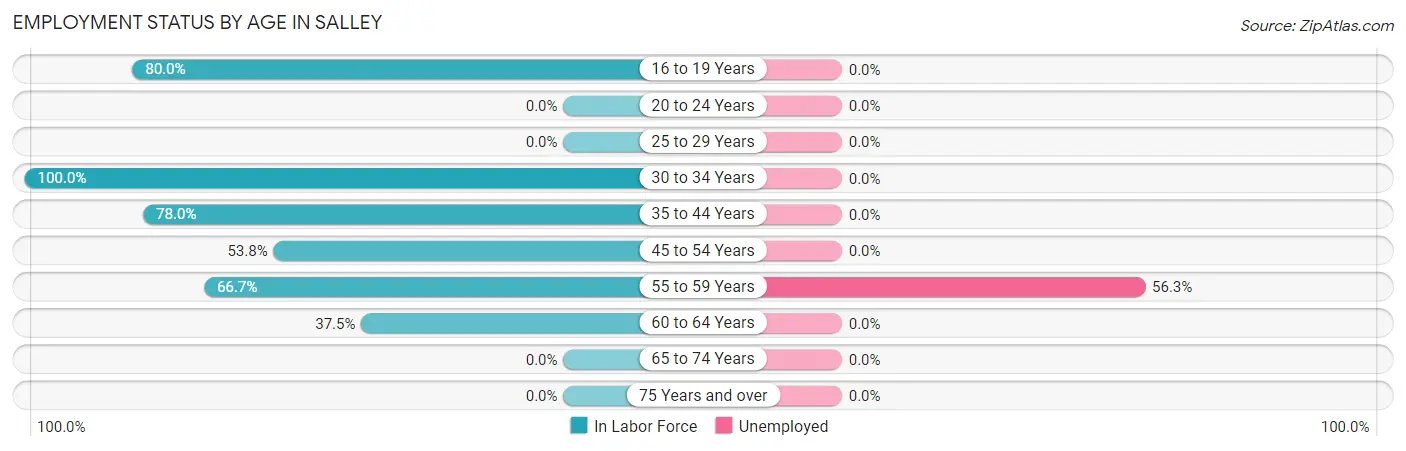
| Age Bracket | In Labor Force | Unemployed |
| 16 to 19 Years | 8 (80.0%) | 0 (0.0%) |
| 20 to 24 Years | 0 (0.0%) | 0 (0.0%) |
| 25 to 29 Years | 0 (0.0%) | 0 (0.0%) |
| 30 to 34 Years | 17 (100.0%) | 0 (0.0%) |
| 35 to 44 Years | 32 (78.0%) | 0 (0.0%) |
| 45 to 54 Years | 7 (53.8%) | 0 (0.0%) |
| 55 to 59 Years | 16 (66.7%) | 9 (56.3%) |
| 60 to 64 Years | 3 (37.5%) | 0 (0.0%) |
| 65 to 74 Years | 0 (0.0%) | 0 (0.0%) |
| 75 Years and over | 0 (0.0%) | 0 (0.0%) |
| Total | 83 (39.9%) | 9 (10.8%) |
Employment Status by Educational Attainment in Salley
According to labor force statistics for Salley, 68.8% of individuals (75) out of the total population between 25 and 64 years of age (109) are in the labor force, with 12.0% or 9 of them being unemployed. The group with the highest labor force participation rate are those with the educational attainment of college / associate degree, with 80.6% or 25 individuals in the labor force. Within the labor force, individuals with less than high school education have the highest percentage of unemployment, with 52.9% or 9 of them being unemployed.
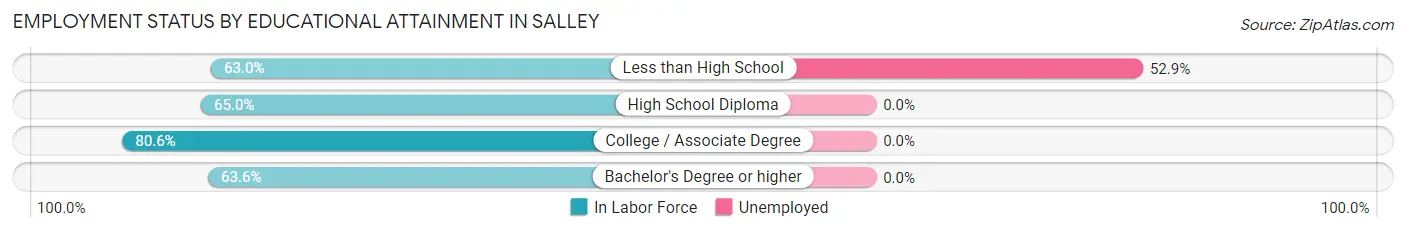
| Educational Attainment | In Labor Force | Unemployed |
| Less than High School | 17 (63.0%) | 14 (52.9%) |
| High School Diploma | 26 (65.0%) | 0 (0.0%) |
| College / Associate Degree | 25 (80.6%) | 0 (0.0%) |
| Bachelor's Degree or higher | 7 (63.6%) | 0 (0.0%) |
| Total | 75 (68.8%) | 13 (12.0%) |
Employment Occupations by Sex in Salley
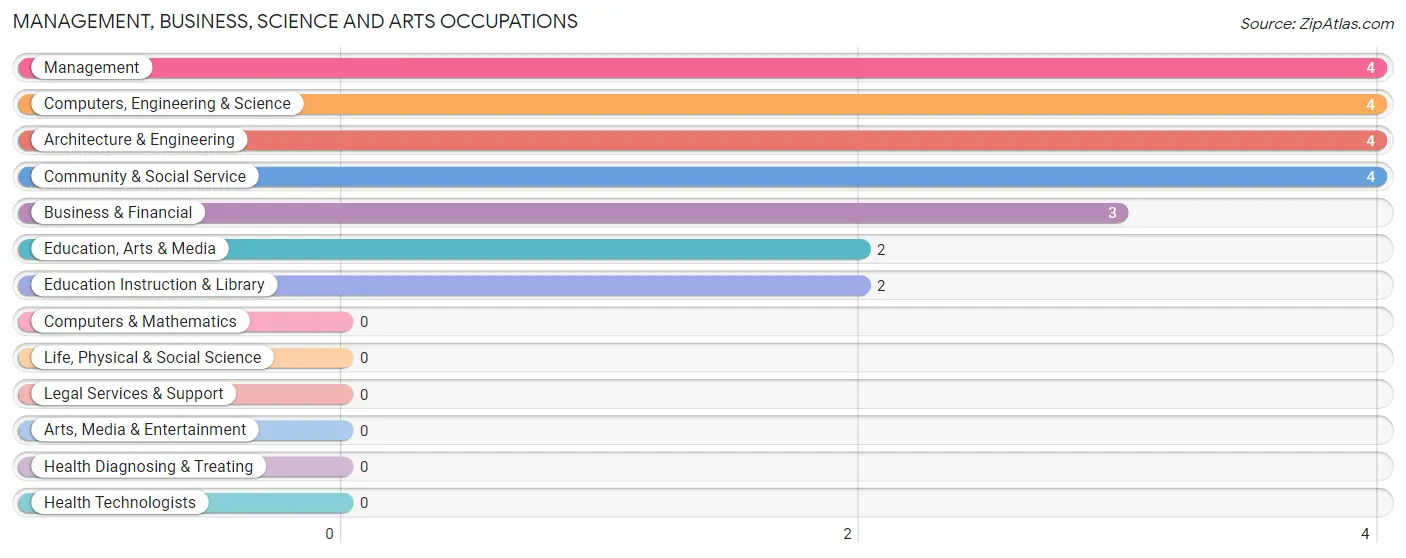
Management, Business, Science and Arts Occupations
The most common Management, Business, Science and Arts occupations in Salley are Management (4 | 5.4%), Computers, Engineering & Science (4 | 5.4%), Architecture & Engineering (4 | 5.4%), Community & Social Service (4 | 5.4%), and Business & Financial (3 | 4.1%).
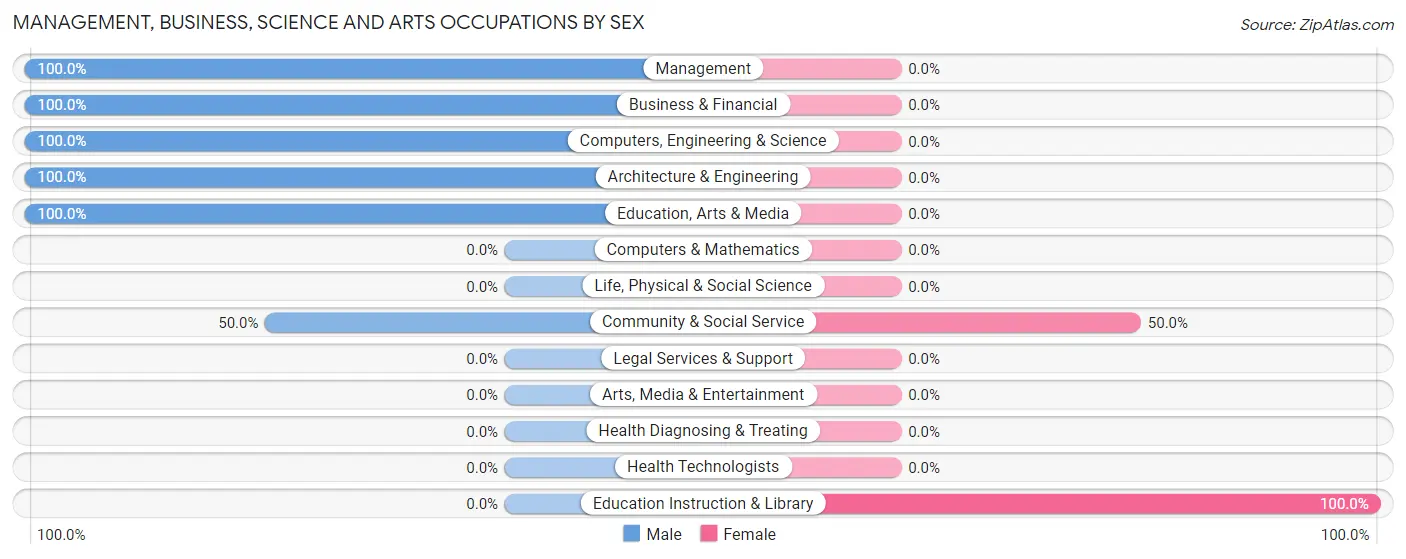
Management, Business, Science and Arts Occupations by Sex
Within the Management, Business, Science and Arts occupations in Salley, the most male-oriented occupations are Management (100.0%), Business & Financial (100.0%), and Computers, Engineering & Science (100.0%), while the most female-oriented occupations are Education Instruction & Library (100.0%), and Community & Social Service (50.0%).
| Occupation | Male | Female |
| Management | 4 (100.0%) | 0 (0.0%) |
| Business & Financial | 3 (100.0%) | 0 (0.0%) |
| Computers, Engineering & Science | 4 (100.0%) | 0 (0.0%) |
| Computers & Mathematics | 0 (0.0%) | 0 (0.0%) |
| Architecture & Engineering | 4 (100.0%) | 0 (0.0%) |
| Life, Physical & Social Science | 0 (0.0%) | 0 (0.0%) |
| Community & Social Service | 2 (50.0%) | 2 (50.0%) |
| Education, Arts & Media | 2 (100.0%) | 0 (0.0%) |
| Legal Services & Support | 0 (0.0%) | 0 (0.0%) |
| Education Instruction & Library | 0 (0.0%) | 2 (100.0%) |
| Arts, Media & Entertainment | 0 (0.0%) | 0 (0.0%) |
| Health Diagnosing & Treating | 0 (0.0%) | 0 (0.0%) |
| Health Technologists | 0 (0.0%) | 0 (0.0%) |
| Total (Category) | 13 (86.7%) | 2 (13.3%) |
| Total (Overall) | 28 (37.8%) | 46 (62.2%) |
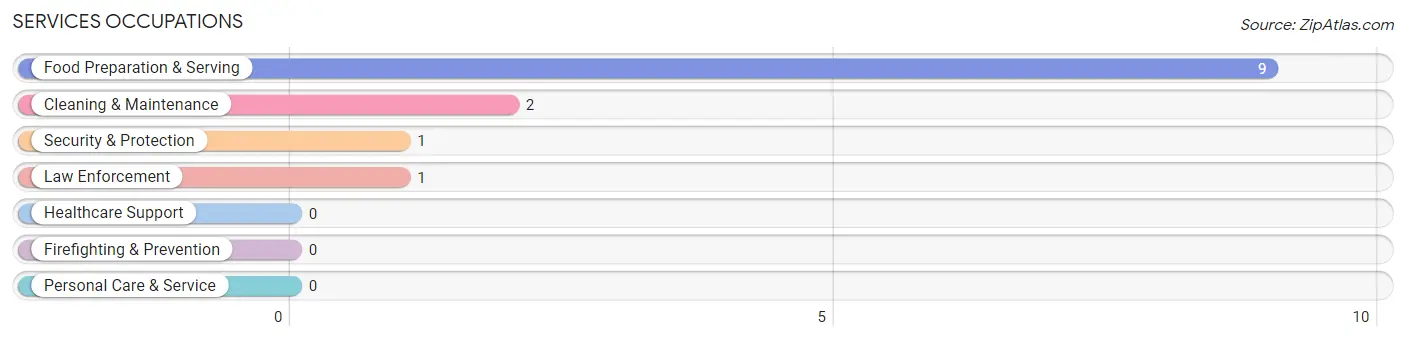
Services Occupations
The most common Services occupations in Salley are Food Preparation & Serving (9 | 12.2%), Cleaning & Maintenance (2 | 2.7%), Security & Protection (1 | 1.3%), and Law Enforcement (1 | 1.3%).
Services Occupations by Sex
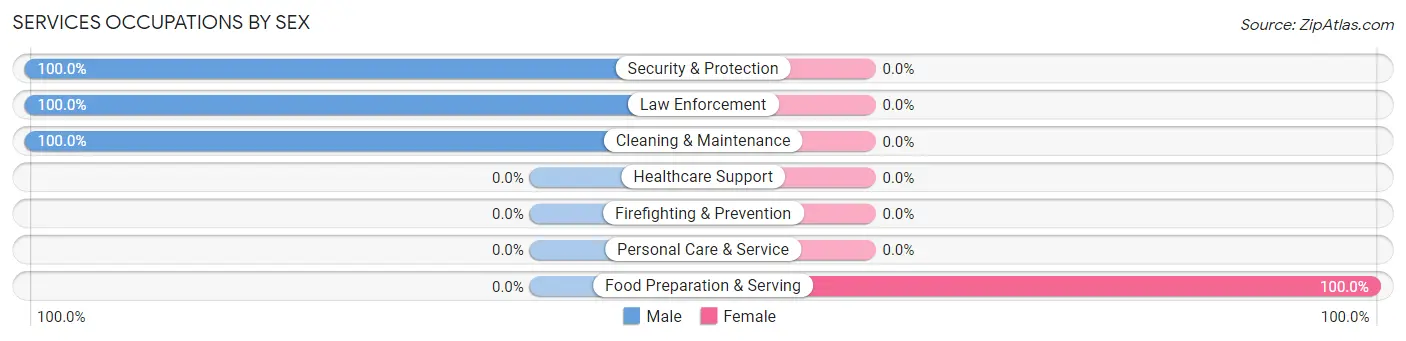
| Occupation | Male | Female |
| Healthcare Support | 0 (0.0%) | 0 (0.0%) |
| Security & Protection | 1 (100.0%) | 0 (0.0%) |
| Firefighting & Prevention | 0 (0.0%) | 0 (0.0%) |
| Law Enforcement | 1 (100.0%) | 0 (0.0%) |
| Food Preparation & Serving | 0 (0.0%) | 9 (100.0%) |
| Cleaning & Maintenance | 2 (100.0%) | 0 (0.0%) |
| Personal Care & Service | 0 (0.0%) | 0 (0.0%) |
| Total (Category) | 3 (25.0%) | 9 (75.0%) |
| Total (Overall) | 28 (37.8%) | 46 (62.2%) |
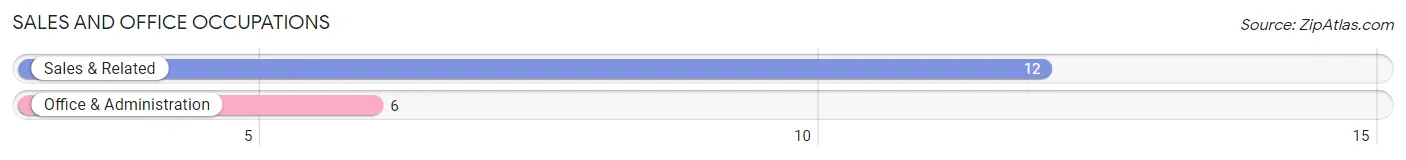
Sales and Office Occupations
The most common Sales and Office occupations in Salley are Sales & Related (12 | 16.2%), and Office & Administration (6 | 8.1%).
Sales and Office Occupations by Sex
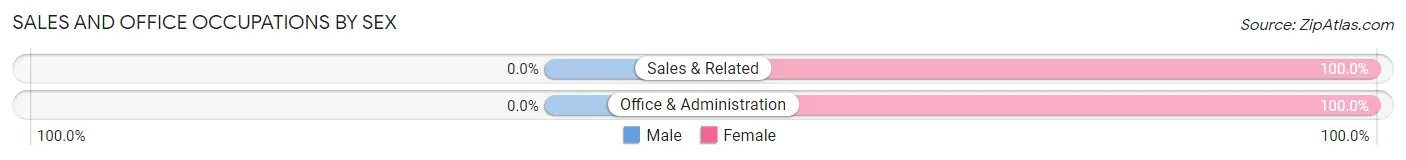
| Occupation | Male | Female |
| Sales & Related | 0 (0.0%) | 12 (100.0%) |
| Office & Administration | 0 (0.0%) | 6 (100.0%) |
| Total (Category) | 0 (0.0%) | 18 (100.0%) |
| Total (Overall) | 28 (37.8%) | 46 (62.2%) |
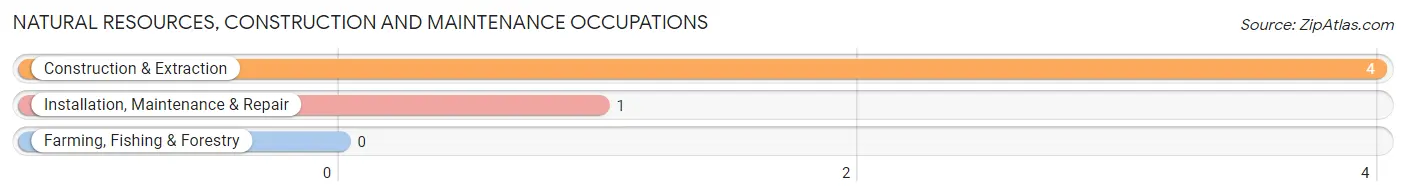
Natural Resources, Construction and Maintenance Occupations
The most common Natural Resources, Construction and Maintenance occupations in Salley are Construction & Extraction (4 | 5.4%), and Installation, Maintenance & Repair (1 | 1.3%).
Natural Resources, Construction and Maintenance Occupations by Sex
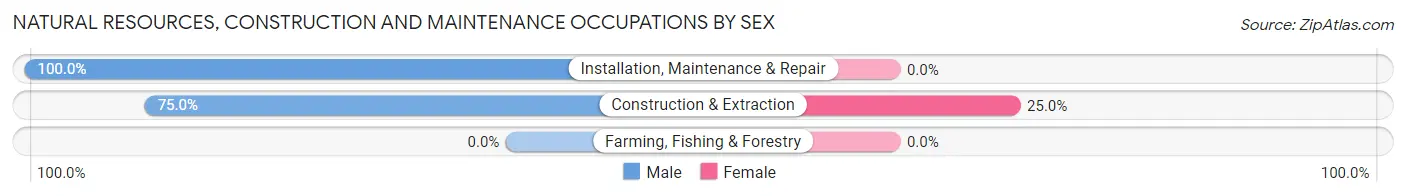
| Occupation | Male | Female |
| Farming, Fishing & Forestry | 0 (0.0%) | 0 (0.0%) |
| Construction & Extraction | 3 (75.0%) | 1 (25.0%) |
| Installation, Maintenance & Repair | 1 (100.0%) | 0 (0.0%) |
| Total (Category) | 4 (80.0%) | 1 (20.0%) |
| Total (Overall) | 28 (37.8%) | 46 (62.2%) |
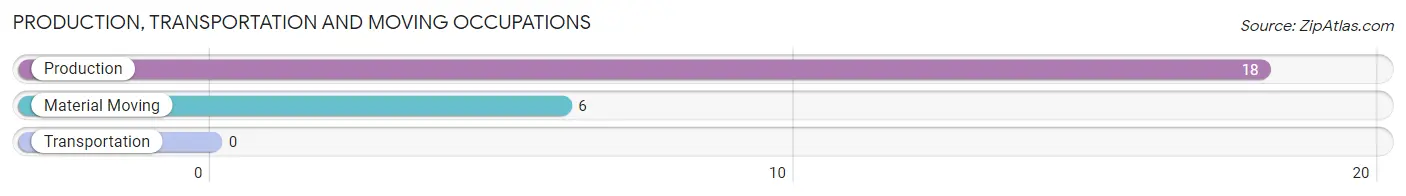
Production, Transportation and Moving Occupations
The most common Production, Transportation and Moving occupations in Salley are Production (18 | 24.3%), and Material Moving (6 | 8.1%).
Production, Transportation and Moving Occupations by Sex
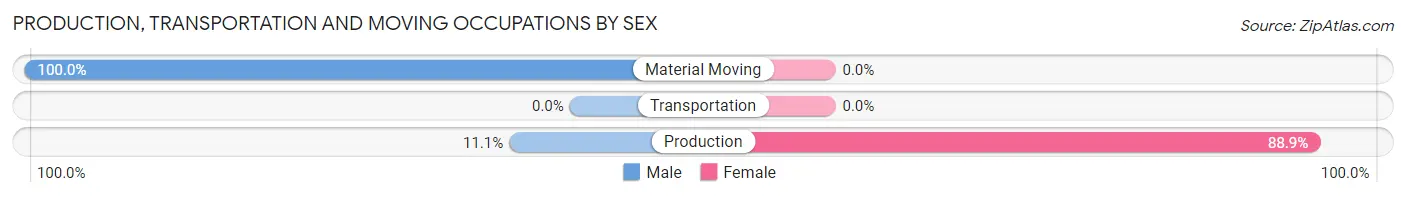
| Occupation | Male | Female |
| Production | 2 (11.1%) | 16 (88.9%) |
| Transportation | 0 (0.0%) | 0 (0.0%) |
| Material Moving | 6 (100.0%) | 0 (0.0%) |
| Total (Category) | 8 (33.3%) | 16 (66.7%) |
| Total (Overall) | 28 (37.8%) | 46 (62.2%) |
Employment Industries by Sex in Salley
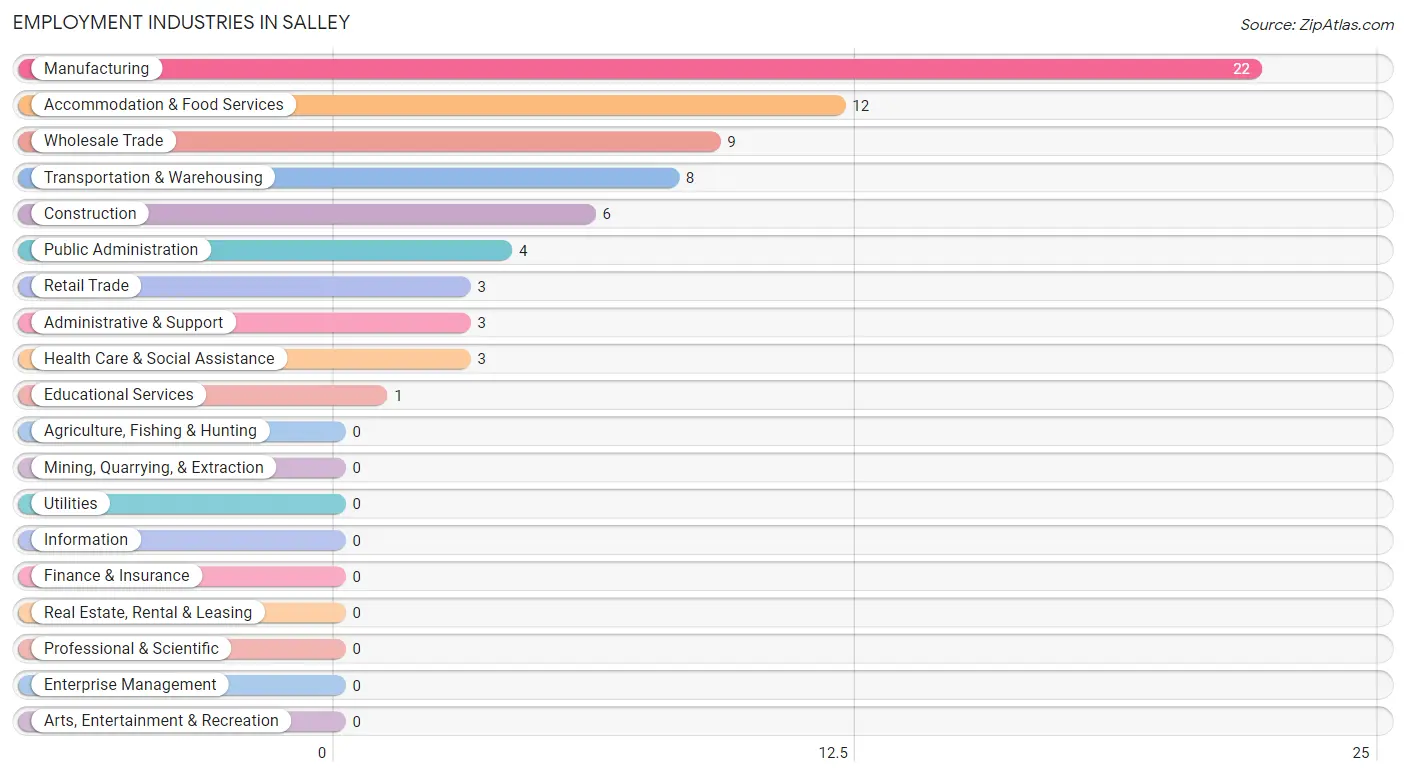
Employment Industries in Salley
The major employment industries in Salley include Manufacturing (22 | 29.7%), Accommodation & Food Services (12 | 16.2%), Wholesale Trade (9 | 12.2%), Transportation & Warehousing (8 | 10.8%), and Construction (6 | 8.1%).
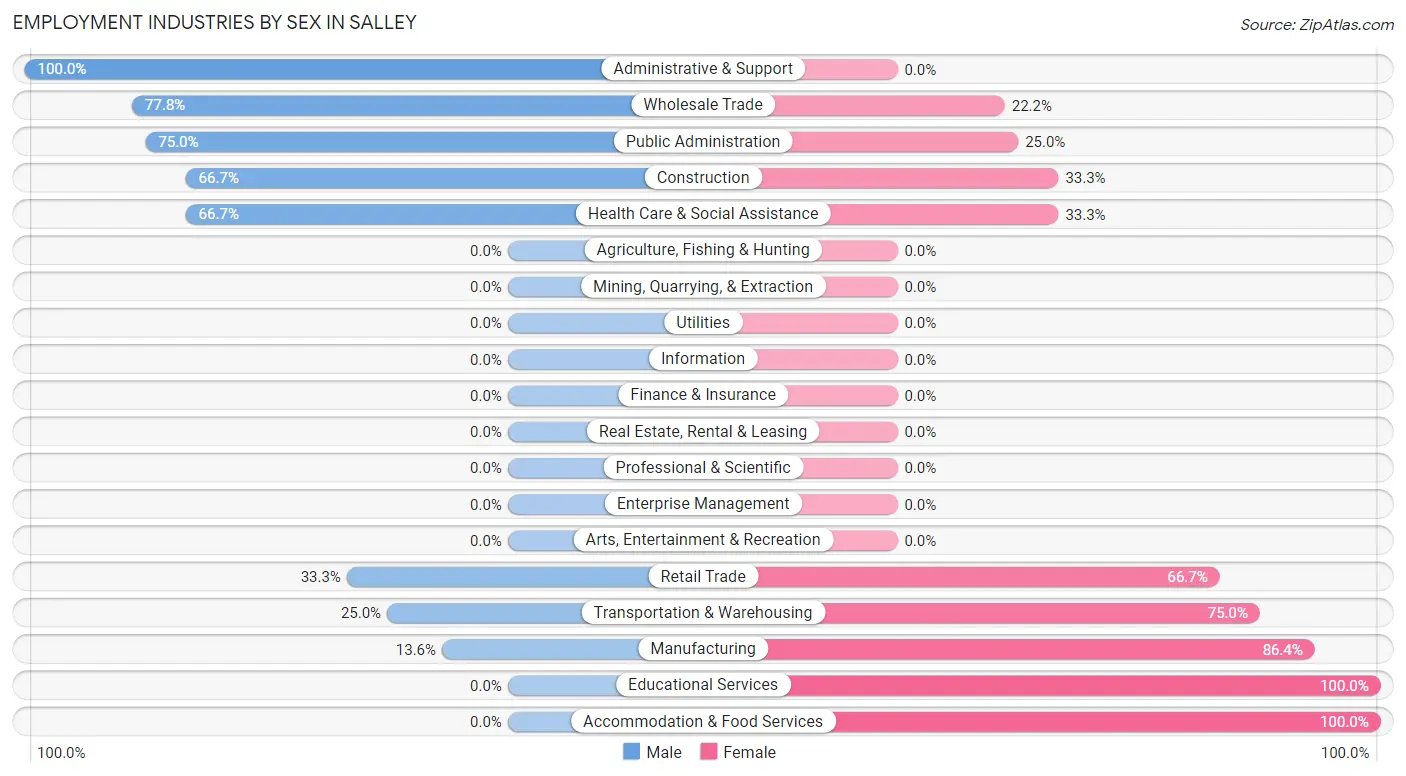
Employment Industries by Sex in Salley
The Salley industries that see more men than women are Administrative & Support (100.0%), Wholesale Trade (77.8%), and Public Administration (75.0%), whereas the industries that tend to have a higher number of women are Educational Services (100.0%), Accommodation & Food Services (100.0%), and Manufacturing (86.4%).
| Industry | Male | Female |
| Agriculture, Fishing & Hunting | 0 (0.0%) | 0 (0.0%) |
| Mining, Quarrying, & Extraction | 0 (0.0%) | 0 (0.0%) |
| Construction | 4 (66.7%) | 2 (33.3%) |
| Manufacturing | 3 (13.6%) | 19 (86.4%) |
| Wholesale Trade | 7 (77.8%) | 2 (22.2%) |
| Retail Trade | 1 (33.3%) | 2 (66.7%) |
| Transportation & Warehousing | 2 (25.0%) | 6 (75.0%) |
| Utilities | 0 (0.0%) | 0 (0.0%) |
| Information | 0 (0.0%) | 0 (0.0%) |
| Finance & Insurance | 0 (0.0%) | 0 (0.0%) |
| Real Estate, Rental & Leasing | 0 (0.0%) | 0 (0.0%) |
| Professional & Scientific | 0 (0.0%) | 0 (0.0%) |
| Enterprise Management | 0 (0.0%) | 0 (0.0%) |
| Administrative & Support | 3 (100.0%) | 0 (0.0%) |
| Educational Services | 0 (0.0%) | 1 (100.0%) |
| Health Care & Social Assistance | 2 (66.7%) | 1 (33.3%) |
| Arts, Entertainment & Recreation | 0 (0.0%) | 0 (0.0%) |
| Accommodation & Food Services | 0 (0.0%) | 12 (100.0%) |
| Public Administration | 3 (75.0%) | 1 (25.0%) |
| Total | 28 (37.8%) | 46 (62.2%) |
Education in Salley
School Enrollment in Salley
The most common levels of schooling among the 88 students in Salley are elementary school (32 | 36.4%), high school (19 | 21.6%), and kindergarten (12 | 13.6%).
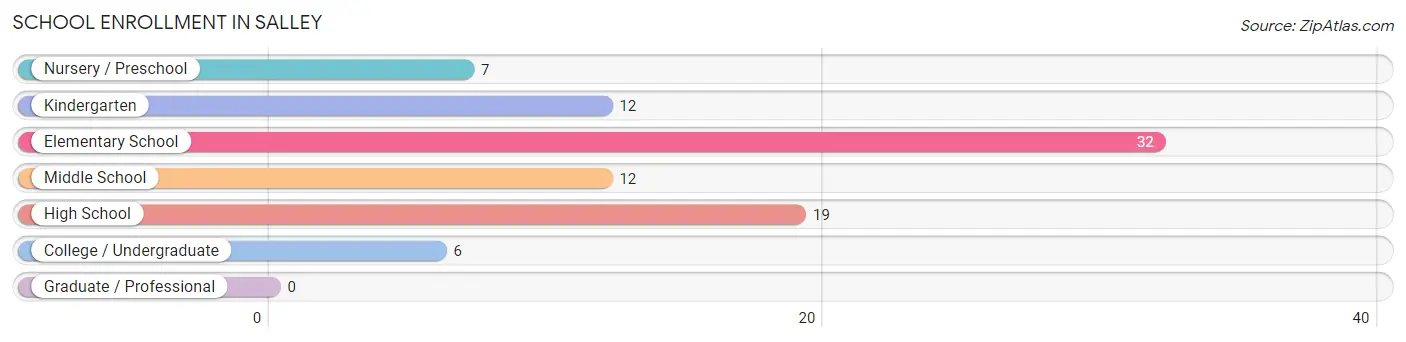
| School Level | # Students | % Students |
| Nursery / Preschool | 7 | 8.0% |
| Kindergarten | 12 | 13.6% |
| Elementary School | 32 | 36.4% |
| Middle School | 12 | 13.6% |
| High School | 19 | 21.6% |
| College / Undergraduate | 6 | 6.8% |
| Graduate / Professional | 0 | 0.0% |
| Total | 88 | 100.0% |
School Enrollment by Age by Funding Source in Salley
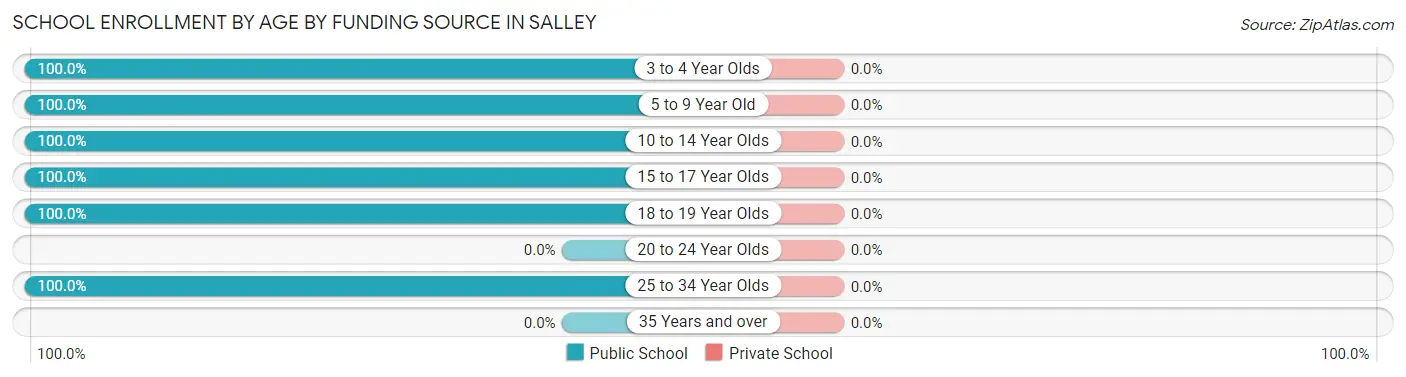
| Age Bracket | Public School | Private School |
| 3 to 4 Year Olds | 7 (100.0%) | 0 (0.0%) |
| 5 to 9 Year Old | 44 (100.0%) | 0 (0.0%) |
| 10 to 14 Year Olds | 24 (100.0%) | 0 (0.0%) |
| 15 to 17 Year Olds | 7 (100.0%) | 0 (0.0%) |
| 18 to 19 Year Olds | 3 (100.0%) | 0 (0.0%) |
| 20 to 24 Year Olds | 0 (0.0%) | 0 (0.0%) |
| 25 to 34 Year Olds | 3 (100.0%) | 0 (0.0%) |
| 35 Years and over | 0 (0.0%) | 0 (0.0%) |
| Total | 88 (100.0%) | 0 (0.0%) |
Educational Attainment by Field of Study in Salley
Education (5 | 35.7%), psychology (4 | 28.6%), business (3 | 21.4%), computers & mathematics (1 | 7.1%), and multidisciplinary studies (1 | 7.1%) are the most common fields of study among 14 individuals in Salley who have obtained a bachelor's degree or higher.
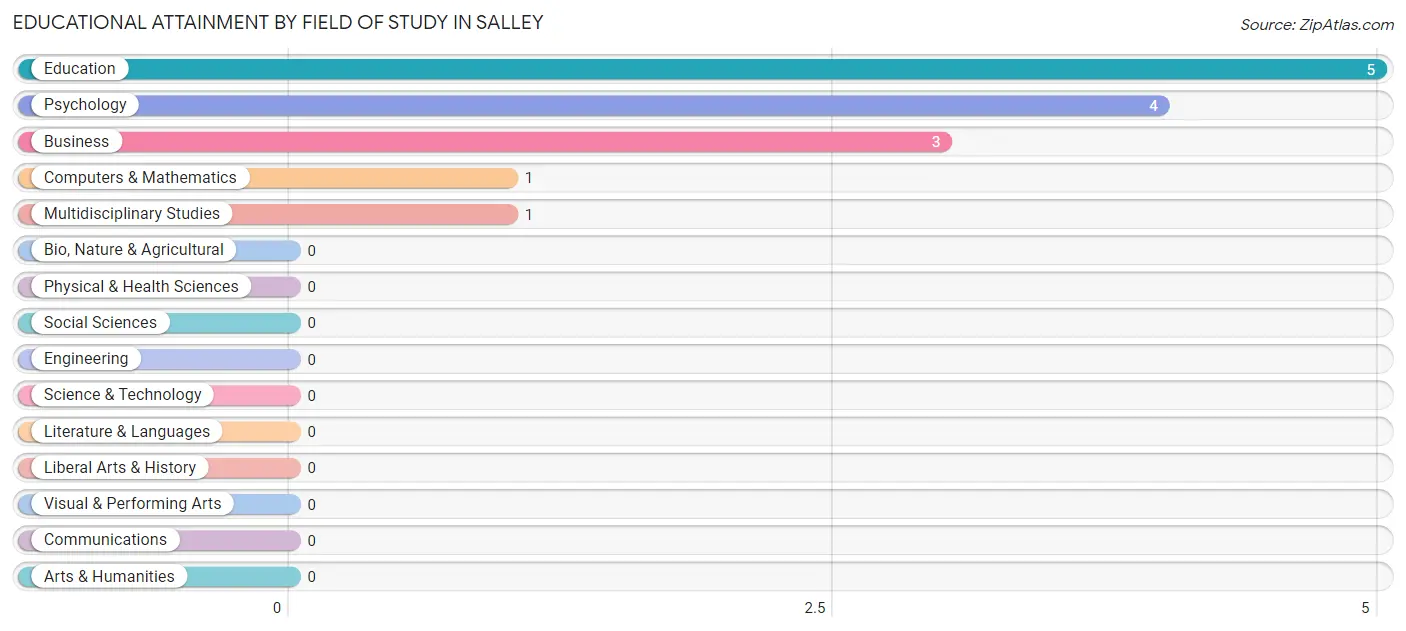
| Field of Study | # Graduates | % Graduates |
| Computers & Mathematics | 1 | 7.1% |
| Bio, Nature & Agricultural | 0 | 0.0% |
| Physical & Health Sciences | 0 | 0.0% |
| Psychology | 4 | 28.6% |
| Social Sciences | 0 | 0.0% |
| Engineering | 0 | 0.0% |
| Multidisciplinary Studies | 1 | 7.1% |
| Science & Technology | 0 | 0.0% |
| Business | 3 | 21.4% |
| Education | 5 | 35.7% |
| Literature & Languages | 0 | 0.0% |
| Liberal Arts & History | 0 | 0.0% |
| Visual & Performing Arts | 0 | 0.0% |
| Communications | 0 | 0.0% |
| Arts & Humanities | 0 | 0.0% |
| Total | 14 | 100.0% |
Transportation & Commute in Salley
Vehicle Availability by Sex in Salley
The most prevalent vehicle ownership categories in Salley are males with 2 vehicles (14, accounting for 50.0%) and females with 2 vehicles (7, making up 30.4%).
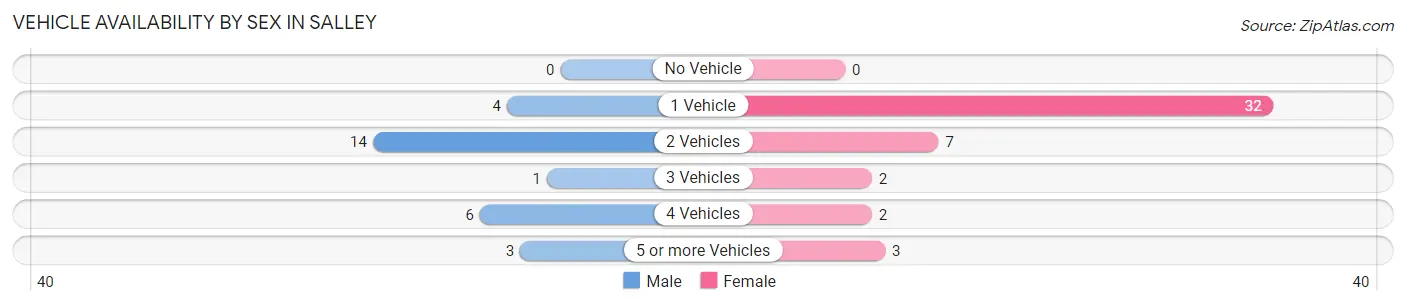
| Vehicles Available | Male | Female |
| No Vehicle | 0 (0.0%) | 0 (0.0%) |
| 1 Vehicle | 4 (14.3%) | 32 (69.6%) |
| 2 Vehicles | 14 (50.0%) | 7 (15.2%) |
| 3 Vehicles | 1 (3.6%) | 2 (4.3%) |
| 4 Vehicles | 6 (21.4%) | 2 (4.3%) |
| 5 or more Vehicles | 3 (10.7%) | 3 (6.5%) |
| Total | 28 (100.0%) | 46 (100.0%) |
Commute Time in Salley
The most frequently occuring commute durations in Salley are 60 to 89 minutes (20 commuters, 28.2%), 45 to 59 minutes (15 commuters, 21.1%), and 5 to 9 minutes (9 commuters, 12.7%).
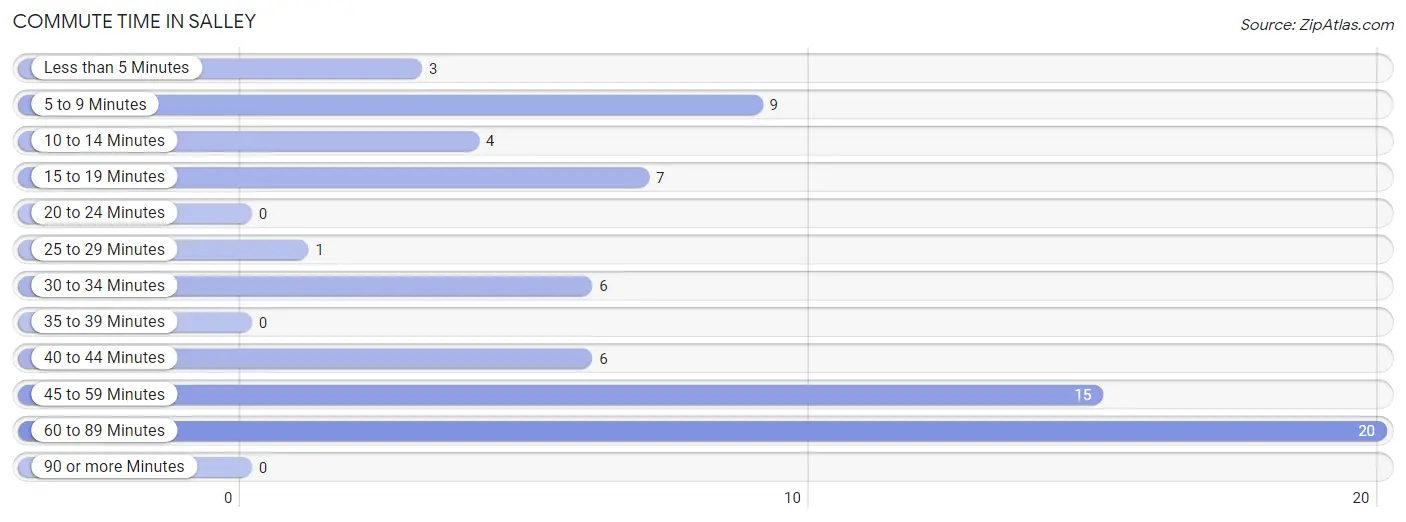
| Commute Time | # Commuters | % Commuters |
| Less than 5 Minutes | 3 | 4.2% |
| 5 to 9 Minutes | 9 | 12.7% |
| 10 to 14 Minutes | 4 | 5.6% |
| 15 to 19 Minutes | 7 | 9.9% |
| 20 to 24 Minutes | 0 | 0.0% |
| 25 to 29 Minutes | 1 | 1.4% |
| 30 to 34 Minutes | 6 | 8.5% |
| 35 to 39 Minutes | 0 | 0.0% |
| 40 to 44 Minutes | 6 | 8.5% |
| 45 to 59 Minutes | 15 | 21.1% |
| 60 to 89 Minutes | 20 | 28.2% |
| 90 or more Minutes | 0 | 0.0% |
Commute Time by Sex in Salley
The most common commute times in Salley are 30 to 34 minutes (6 commuters, 24.0%) for males and 60 to 89 minutes (18 commuters, 39.1%) for females.
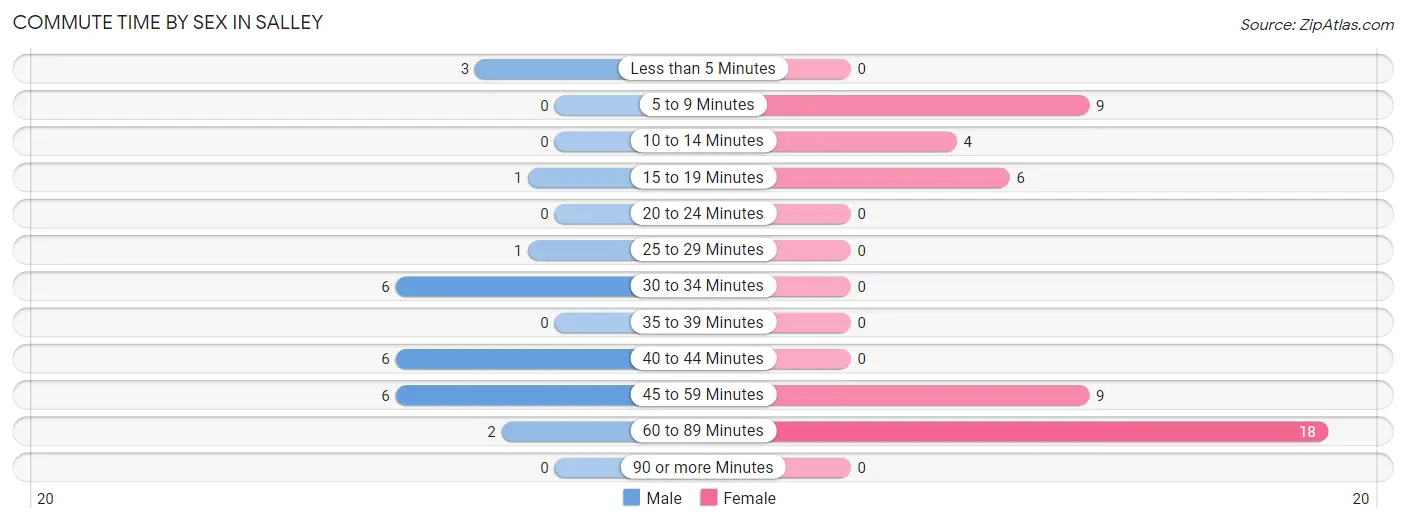
| Commute Time | Male | Female |
| Less than 5 Minutes | 3 (12.0%) | 0 (0.0%) |
| 5 to 9 Minutes | 0 (0.0%) | 9 (19.6%) |
| 10 to 14 Minutes | 0 (0.0%) | 4 (8.7%) |
| 15 to 19 Minutes | 1 (4.0%) | 6 (13.0%) |
| 20 to 24 Minutes | 0 (0.0%) | 0 (0.0%) |
| 25 to 29 Minutes | 1 (4.0%) | 0 (0.0%) |
| 30 to 34 Minutes | 6 (24.0%) | 0 (0.0%) |
| 35 to 39 Minutes | 0 (0.0%) | 0 (0.0%) |
| 40 to 44 Minutes | 6 (24.0%) | 0 (0.0%) |
| 45 to 59 Minutes | 6 (24.0%) | 9 (19.6%) |
| 60 to 89 Minutes | 2 (8.0%) | 18 (39.1%) |
| 90 or more Minutes | 0 (0.0%) | 0 (0.0%) |
Time of Departure to Work by Sex in Salley
The most frequent times of departure to work in Salley are 5:00 AM to 5:29 AM (6, 24.0%) for males and 7:00 AM to 7:29 AM (18, 39.1%) for females.
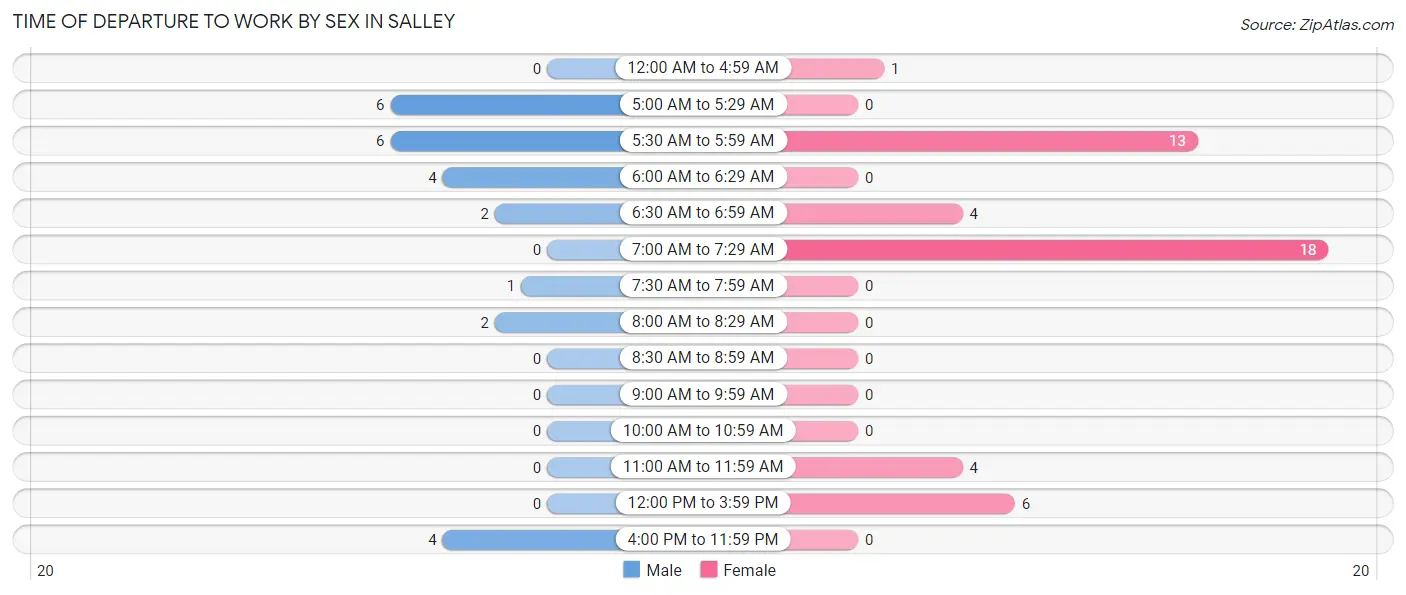
| Time of Departure | Male | Female |
| 12:00 AM to 4:59 AM | 0 (0.0%) | 1 (2.2%) |
| 5:00 AM to 5:29 AM | 6 (24.0%) | 0 (0.0%) |
| 5:30 AM to 5:59 AM | 6 (24.0%) | 13 (28.3%) |
| 6:00 AM to 6:29 AM | 4 (16.0%) | 0 (0.0%) |
| 6:30 AM to 6:59 AM | 2 (8.0%) | 4 (8.7%) |
| 7:00 AM to 7:29 AM | 0 (0.0%) | 18 (39.1%) |
| 7:30 AM to 7:59 AM | 1 (4.0%) | 0 (0.0%) |
| 8:00 AM to 8:29 AM | 2 (8.0%) | 0 (0.0%) |
| 8:30 AM to 8:59 AM | 0 (0.0%) | 0 (0.0%) |
| 9:00 AM to 9:59 AM | 0 (0.0%) | 0 (0.0%) |
| 10:00 AM to 10:59 AM | 0 (0.0%) | 0 (0.0%) |
| 11:00 AM to 11:59 AM | 0 (0.0%) | 4 (8.7%) |
| 12:00 PM to 3:59 PM | 0 (0.0%) | 6 (13.0%) |
| 4:00 PM to 11:59 PM | 4 (16.0%) | 0 (0.0%) |
| Total | 25 (100.0%) | 46 (100.0%) |
Housing Occupancy in Salley
Occupancy by Ownership in Salley
Of the total 140 dwellings in Salley, owner-occupied units account for 83 (59.3%), while renter-occupied units make up 57 (40.7%).
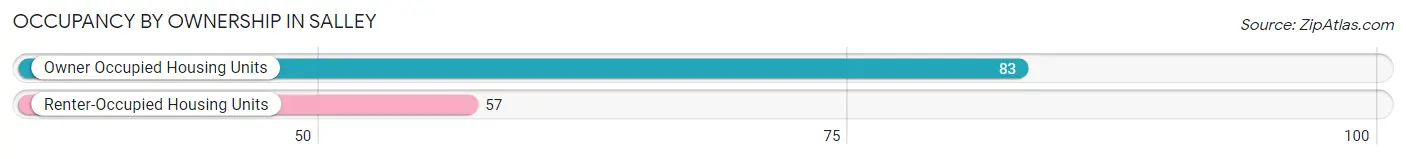
| Occupancy | # Housing Units | % Housing Units |
| Owner Occupied Housing Units | 83 | 59.3% |
| Renter-Occupied Housing Units | 57 | 40.7% |
| Total Occupied Housing Units | 140 | 100.0% |
Occupancy by Household Size in Salley
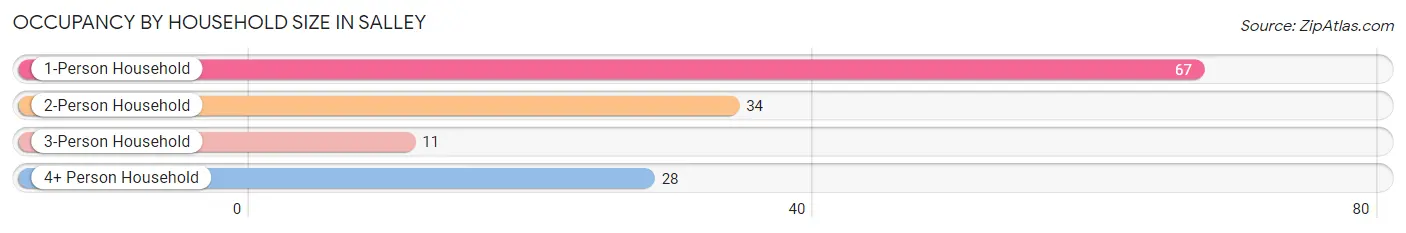
| Household Size | # Housing Units | % Housing Units |
| 1-Person Household | 67 | 47.9% |
| 2-Person Household | 34 | 24.3% |
| 3-Person Household | 11 | 7.9% |
| 4+ Person Household | 28 | 20.0% |
| Total Housing Units | 140 | 100.0% |
Occupancy by Ownership by Household Size in Salley
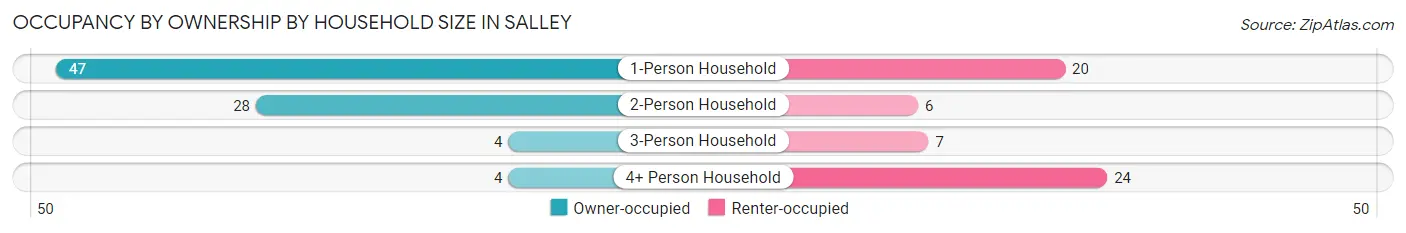
| Household Size | Owner-occupied | Renter-occupied |
| 1-Person Household | 47 (70.2%) | 20 (29.8%) |
| 2-Person Household | 28 (82.4%) | 6 (17.6%) |
| 3-Person Household | 4 (36.4%) | 7 (63.6%) |
| 4+ Person Household | 4 (14.3%) | 24 (85.7%) |
| Total Housing Units | 83 (59.3%) | 57 (40.7%) |
Occupancy by Educational Attainment in Salley
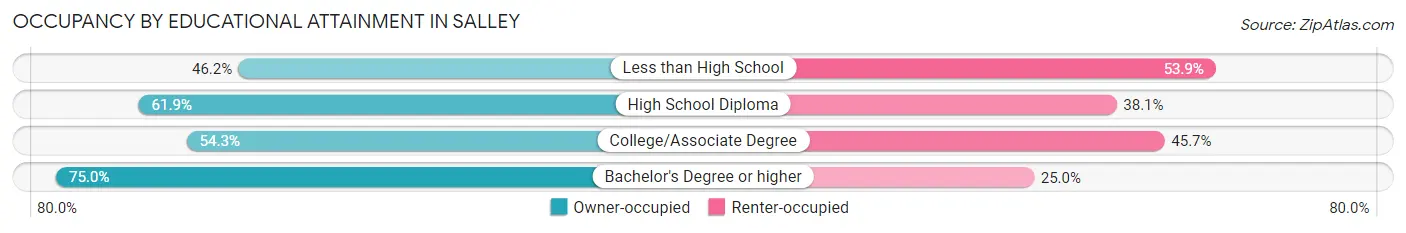
| Household Size | Owner-occupied | Renter-occupied |
| Less than High School | 6 (46.2%) | 7 (53.8%) |
| High School Diploma | 52 (61.9%) | 32 (38.1%) |
| College/Associate Degree | 19 (54.3%) | 16 (45.7%) |
| Bachelor's Degree or higher | 6 (75.0%) | 2 (25.0%) |
Occupancy by Age of Householder in Salley
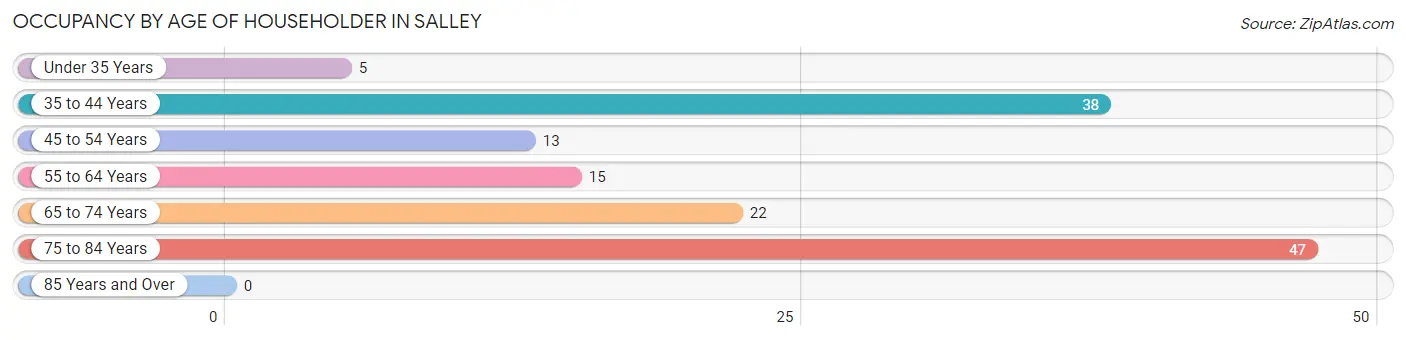
| Age Bracket | # Households | % Households |
| Under 35 Years | 5 | 3.6% |
| 35 to 44 Years | 38 | 27.1% |
| 45 to 54 Years | 13 | 9.3% |
| 55 to 64 Years | 15 | 10.7% |
| 65 to 74 Years | 22 | 15.7% |
| 75 to 84 Years | 47 | 33.6% |
| 85 Years and Over | 0 | 0.0% |
| Total | 140 | 100.0% |
Housing Finances in Salley
Median Income by Occupancy in Salley
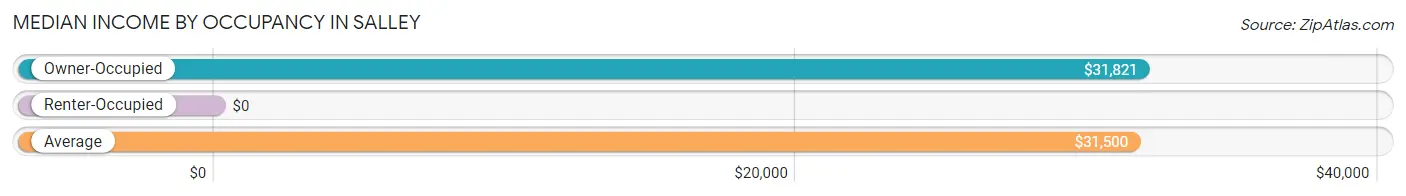
| Occupancy Type | # Households | Median Income |
| Owner-Occupied | 83 (59.3%) | $31,821 |
| Renter-Occupied | 57 (40.7%) | $0 |
| Average | 140 (100.0%) | $31,500 |
Occupancy by Householder Income Bracket in Salley
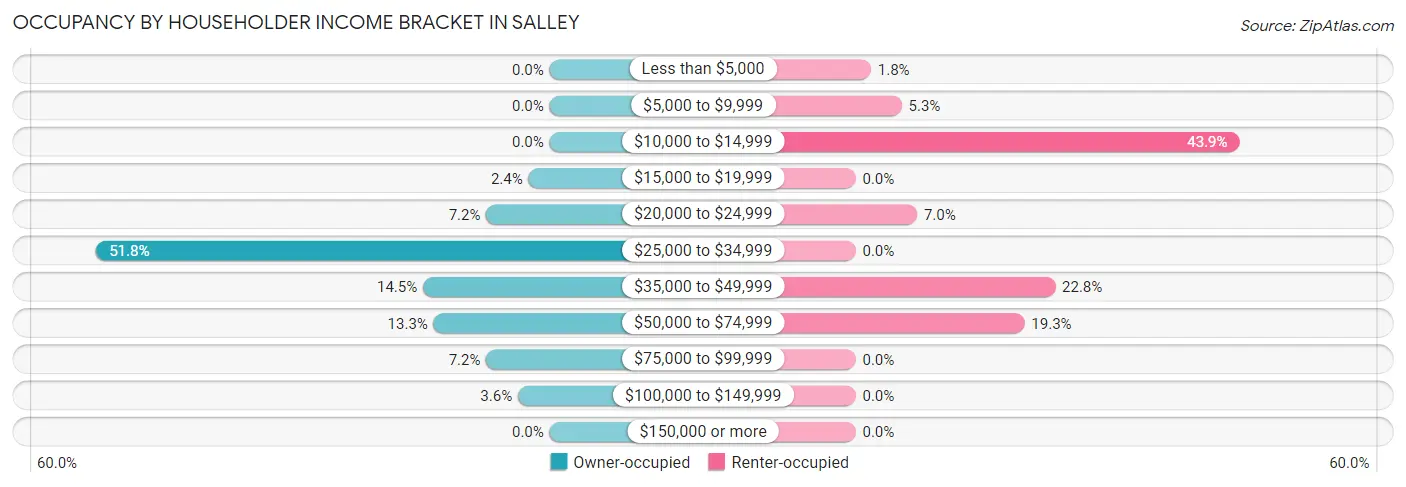
| Income Bracket | Owner-occupied | Renter-occupied |
| Less than $5,000 | 0 (0.0%) | 1 (1.8%) |
| $5,000 to $9,999 | 0 (0.0%) | 3 (5.3%) |
| $10,000 to $14,999 | 0 (0.0%) | 25 (43.9%) |
| $15,000 to $19,999 | 2 (2.4%) | 0 (0.0%) |
| $20,000 to $24,999 | 6 (7.2%) | 4 (7.0%) |
| $25,000 to $34,999 | 43 (51.8%) | 0 (0.0%) |
| $35,000 to $49,999 | 12 (14.5%) | 13 (22.8%) |
| $50,000 to $74,999 | 11 (13.3%) | 11 (19.3%) |
| $75,000 to $99,999 | 6 (7.2%) | 0 (0.0%) |
| $100,000 to $149,999 | 3 (3.6%) | 0 (0.0%) |
| $150,000 or more | 0 (0.0%) | 0 (0.0%) |
| Total | 83 (100.0%) | 57 (100.0%) |
Monthly Housing Cost Tiers in Salley
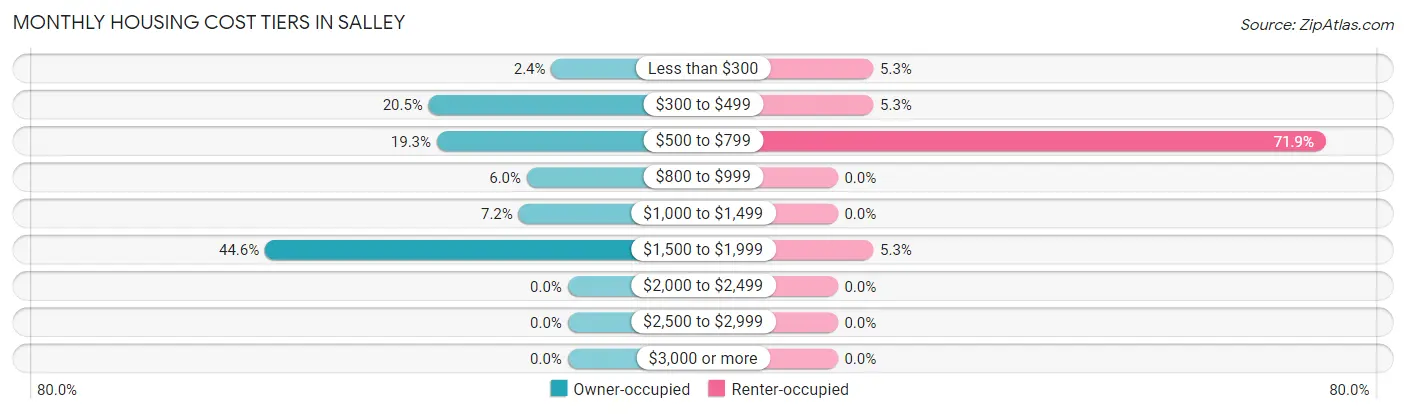
| Monthly Cost | Owner-occupied | Renter-occupied |
| Less than $300 | 2 (2.4%) | 3 (5.3%) |
| $300 to $499 | 17 (20.5%) | 3 (5.3%) |
| $500 to $799 | 16 (19.3%) | 41 (71.9%) |
| $800 to $999 | 5 (6.0%) | 0 (0.0%) |
| $1,000 to $1,499 | 6 (7.2%) | 0 (0.0%) |
| $1,500 to $1,999 | 37 (44.6%) | 3 (5.3%) |
| $2,000 to $2,499 | 0 (0.0%) | 0 (0.0%) |
| $2,500 to $2,999 | 0 (0.0%) | 0 (0.0%) |
| $3,000 or more | 0 (0.0%) | 0 (0.0%) |
| Total | 83 (100.0%) | 57 (100.0%) |
Physical Housing Characteristics in Salley
Housing Structures in Salley
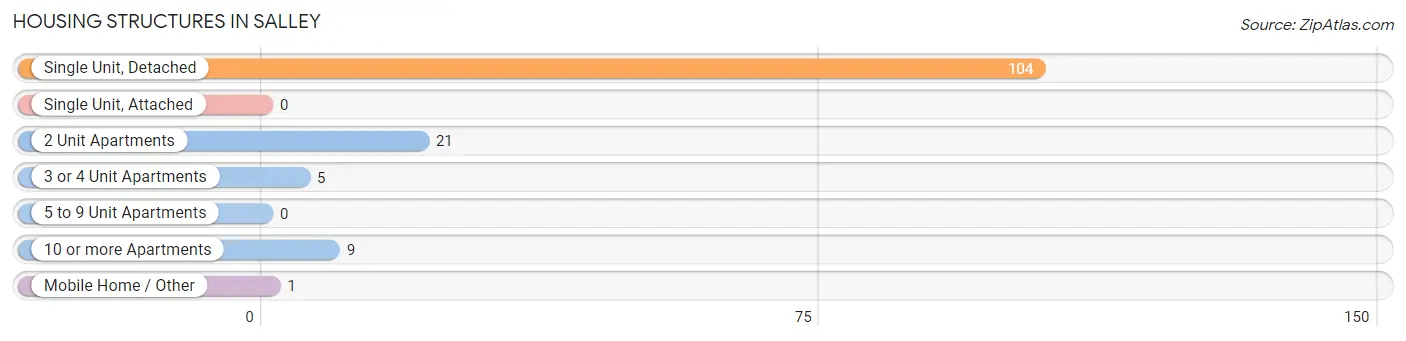
| Structure Type | # Housing Units | % Housing Units |
| Single Unit, Detached | 104 | 74.3% |
| Single Unit, Attached | 0 | 0.0% |
| 2 Unit Apartments | 21 | 15.0% |
| 3 or 4 Unit Apartments | 5 | 3.6% |
| 5 to 9 Unit Apartments | 0 | 0.0% |
| 10 or more Apartments | 9 | 6.4% |
| Mobile Home / Other | 1 | 0.7% |
| Total | 140 | 100.0% |
Housing Structures by Occupancy in Salley
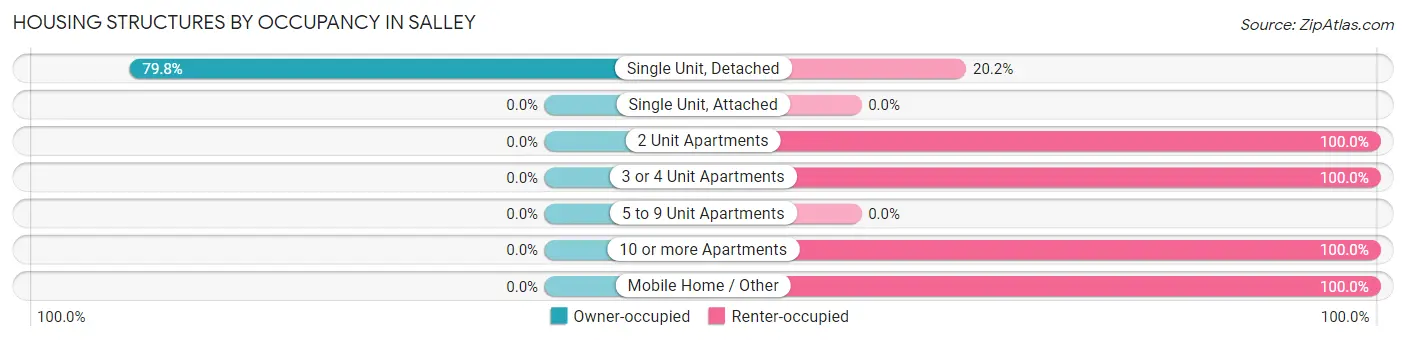
| Structure Type | Owner-occupied | Renter-occupied |
| Single Unit, Detached | 83 (79.8%) | 21 (20.2%) |
| Single Unit, Attached | 0 (0.0%) | 0 (0.0%) |
| 2 Unit Apartments | 0 (0.0%) | 21 (100.0%) |
| 3 or 4 Unit Apartments | 0 (0.0%) | 5 (100.0%) |
| 5 to 9 Unit Apartments | 0 (0.0%) | 0 (0.0%) |
| 10 or more Apartments | 0 (0.0%) | 9 (100.0%) |
| Mobile Home / Other | 0 (0.0%) | 1 (100.0%) |
| Total | 83 (59.3%) | 57 (40.7%) |
Housing Structures by Number of Rooms in Salley
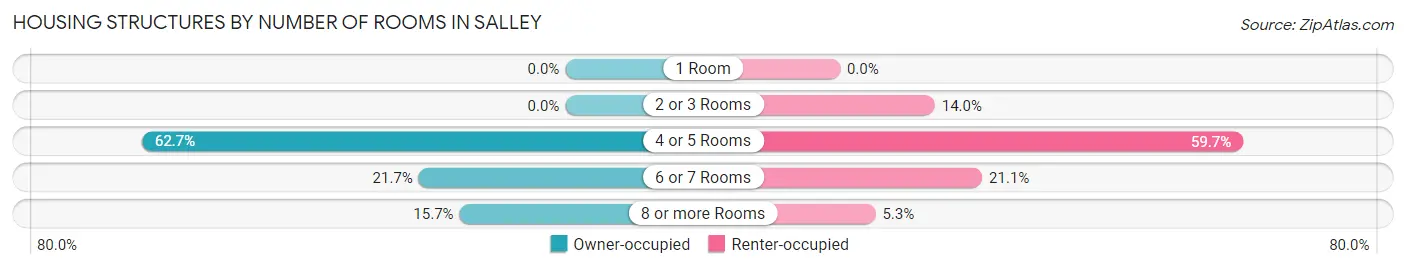
| Number of Rooms | Owner-occupied | Renter-occupied |
| 1 Room | 0 (0.0%) | 0 (0.0%) |
| 2 or 3 Rooms | 0 (0.0%) | 8 (14.0%) |
| 4 or 5 Rooms | 52 (62.6%) | 34 (59.7%) |
| 6 or 7 Rooms | 18 (21.7%) | 12 (21.0%) |
| 8 or more Rooms | 13 (15.7%) | 3 (5.3%) |
| Total | 83 (100.0%) | 57 (100.0%) |
Housing Structure by Heating Type in Salley
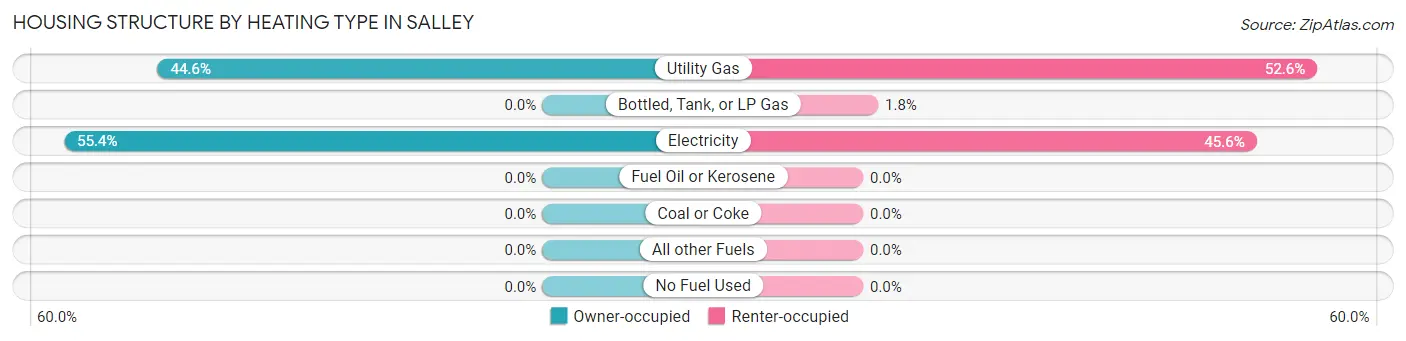
| Heating Type | Owner-occupied | Renter-occupied |
| Utility Gas | 37 (44.6%) | 30 (52.6%) |
| Bottled, Tank, or LP Gas | 0 (0.0%) | 1 (1.8%) |
| Electricity | 46 (55.4%) | 26 (45.6%) |
| Fuel Oil or Kerosene | 0 (0.0%) | 0 (0.0%) |
| Coal or Coke | 0 (0.0%) | 0 (0.0%) |
| All other Fuels | 0 (0.0%) | 0 (0.0%) |
| No Fuel Used | 0 (0.0%) | 0 (0.0%) |
| Total | 83 (100.0%) | 57 (100.0%) |
Household Vehicle Usage in Salley
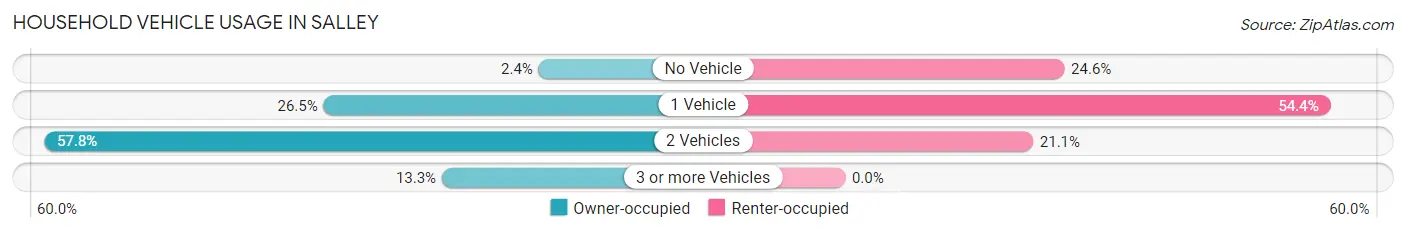
| Vehicles per Household | Owner-occupied | Renter-occupied |
| No Vehicle | 2 (2.4%) | 14 (24.6%) |
| 1 Vehicle | 22 (26.5%) | 31 (54.4%) |
| 2 Vehicles | 48 (57.8%) | 12 (21.0%) |
| 3 or more Vehicles | 11 (13.3%) | 0 (0.0%) |
| Total | 83 (100.0%) | 57 (100.0%) |
Real Estate & Mortgages in Salley
Real Estate and Mortgage Overview in Salley
| Characteristic | Without Mortgage | With Mortgage |
| Housing Units | 19 | 64 |
| Median Property Value | $110,900 | $308,600 |
| Median Household Income | $47,188 | $0 |
| Monthly Housing Costs | $441 | $0 |
| Real Estate Taxes | $500 | $0 |
Property Value by Mortgage Status in Salley
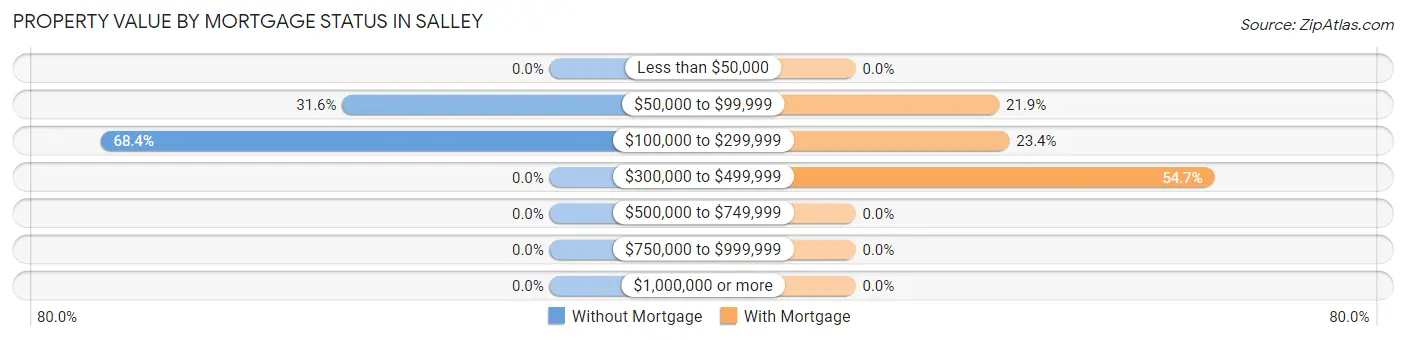
| Property Value | Without Mortgage | With Mortgage |
| Less than $50,000 | 0 (0.0%) | 0 (0.0%) |
| $50,000 to $99,999 | 6 (31.6%) | 14 (21.9%) |
| $100,000 to $299,999 | 13 (68.4%) | 15 (23.4%) |
| $300,000 to $499,999 | 0 (0.0%) | 35 (54.7%) |
| $500,000 to $749,999 | 0 (0.0%) | 0 (0.0%) |
| $750,000 to $999,999 | 0 (0.0%) | 0 (0.0%) |
| $1,000,000 or more | 0 (0.0%) | 0 (0.0%) |
| Total | 19 (100.0%) | 64 (100.0%) |
Household Income by Mortgage Status in Salley
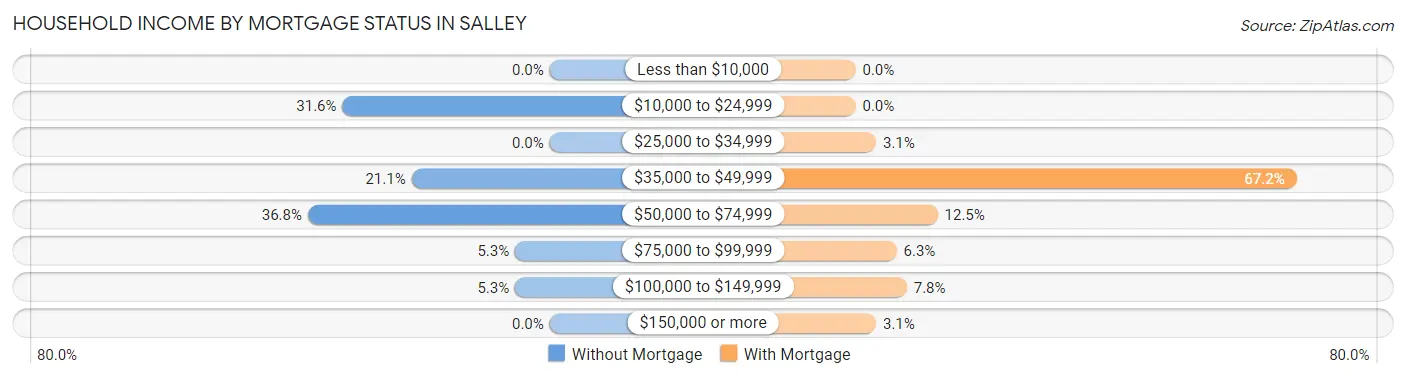
| Household Income | Without Mortgage | With Mortgage |
| Less than $10,000 | 0 (0.0%) | 0 (0.0%) |
| $10,000 to $24,999 | 6 (31.6%) | 0 (0.0%) |
| $25,000 to $34,999 | 0 (0.0%) | 2 (3.1%) |
| $35,000 to $49,999 | 4 (21.0%) | 43 (67.2%) |
| $50,000 to $74,999 | 7 (36.8%) | 8 (12.5%) |
| $75,000 to $99,999 | 1 (5.3%) | 4 (6.2%) |
| $100,000 to $149,999 | 1 (5.3%) | 5 (7.8%) |
| $150,000 or more | 0 (0.0%) | 2 (3.1%) |
| Total | 19 (100.0%) | 64 (100.0%) |
Property Value to Household Income Ratio in Salley
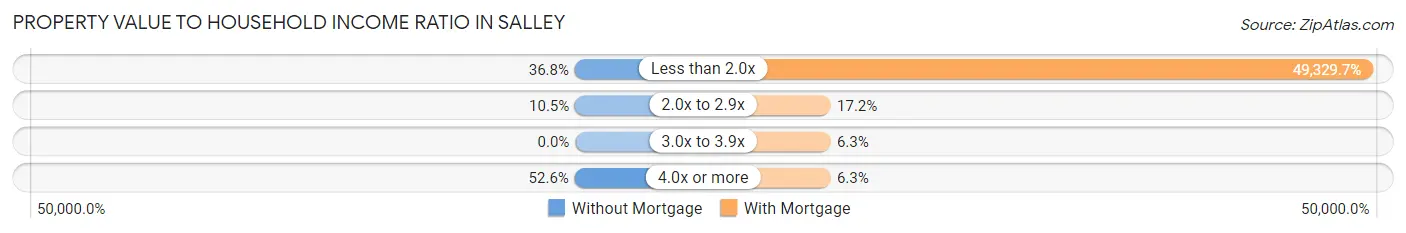
| Value-to-Income Ratio | Without Mortgage | With Mortgage |
| Less than 2.0x | 7 (36.8%) | 31,571 (49,329.7%) |
| 2.0x to 2.9x | 2 (10.5%) | 11 (17.2%) |
| 3.0x to 3.9x | 0 (0.0%) | 4 (6.2%) |
| 4.0x or more | 10 (52.6%) | 4 (6.2%) |
| Total | 19 (100.0%) | 64 (100.0%) |
Real Estate Taxes by Mortgage Status in Salley
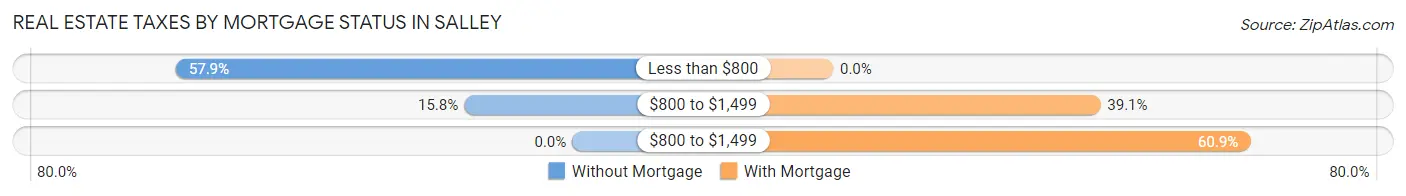
| Property Taxes | Without Mortgage | With Mortgage |
| Less than $800 | 11 (57.9%) | 0 (0.0%) |
| $800 to $1,499 | 3 (15.8%) | 25 (39.1%) |
| $800 to $1,499 | 0 (0.0%) | 39 (60.9%) |
| Total | 19 (100.0%) | 64 (100.0%) |
Health & Disability in Salley
Health Insurance Coverage by Age in Salley
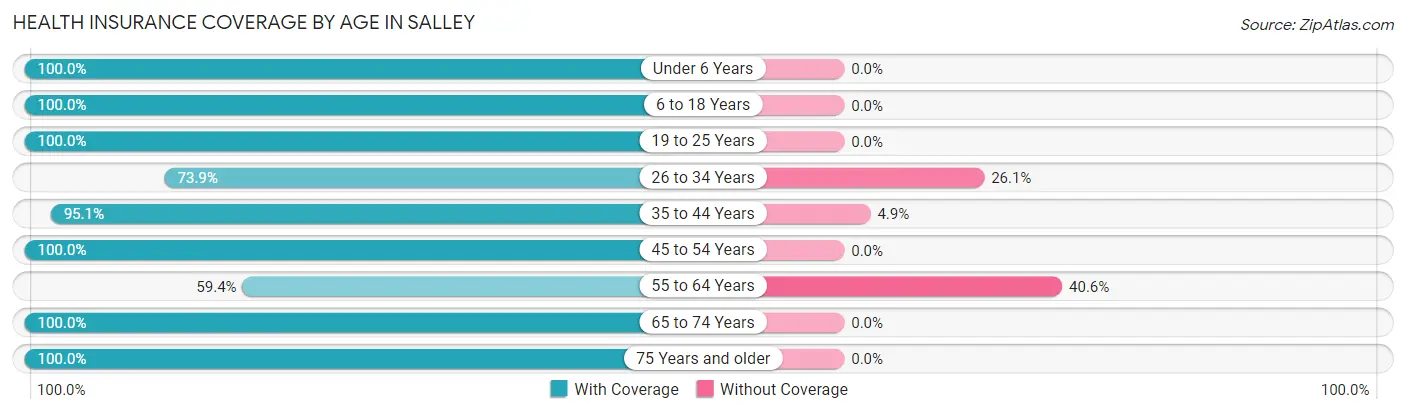
| Age Bracket | With Coverage | Without Coverage |
| Under 6 Years | 32 (100.0%) | 0 (0.0%) |
| 6 to 18 Years | 64 (100.0%) | 0 (0.0%) |
| 19 to 25 Years | 3 (100.0%) | 0 (0.0%) |
| 26 to 34 Years | 17 (73.9%) | 6 (26.1%) |
| 35 to 44 Years | 39 (95.1%) | 2 (4.9%) |
| 45 to 54 Years | 13 (100.0%) | 0 (0.0%) |
| 55 to 64 Years | 19 (59.4%) | 13 (40.6%) |
| 65 to 74 Years | 37 (100.0%) | 0 (0.0%) |
| 75 Years and older | 52 (100.0%) | 0 (0.0%) |
| Total | 276 (92.9%) | 21 (7.1%) |
Health Insurance Coverage by Citizenship Status in Salley
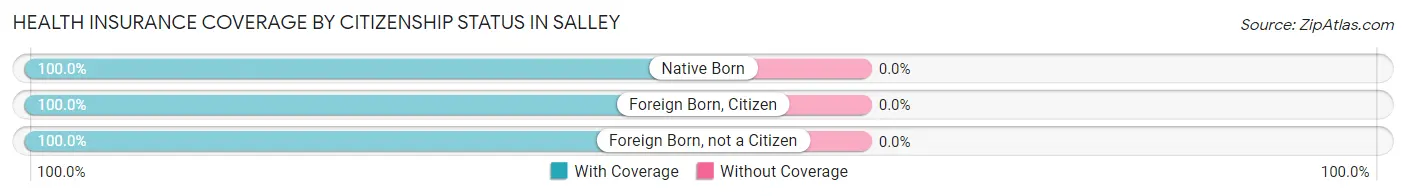
| Citizenship Status | With Coverage | Without Coverage |
| Native Born | 32 (100.0%) | 0 (0.0%) |
| Foreign Born, Citizen | 64 (100.0%) | 0 (0.0%) |
| Foreign Born, not a Citizen | 3 (100.0%) | 0 (0.0%) |
Health Insurance Coverage by Household Income in Salley
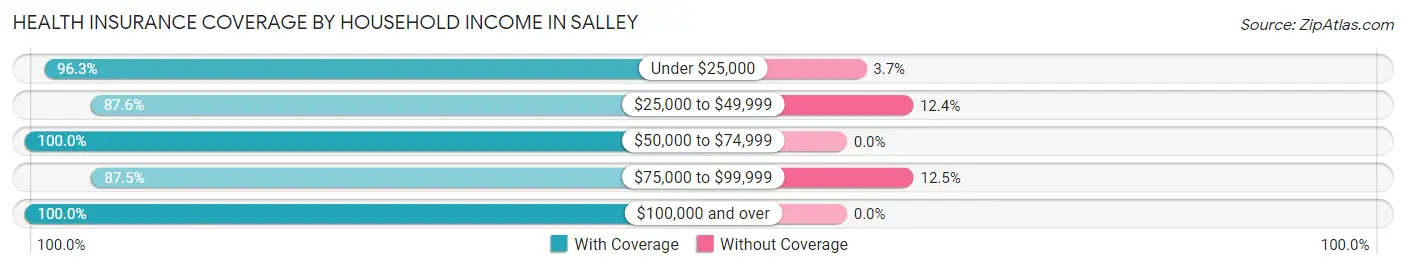
| Household Income | With Coverage | Without Coverage |
| Under $25,000 | 105 (96.3%) | 4 (3.7%) |
| $25,000 to $49,999 | 106 (87.6%) | 15 (12.4%) |
| $50,000 to $74,999 | 36 (100.0%) | 0 (0.0%) |
| $75,000 to $99,999 | 14 (87.5%) | 2 (12.5%) |
| $100,000 and over | 15 (100.0%) | 0 (0.0%) |
Public vs Private Health Insurance Coverage by Age in Salley
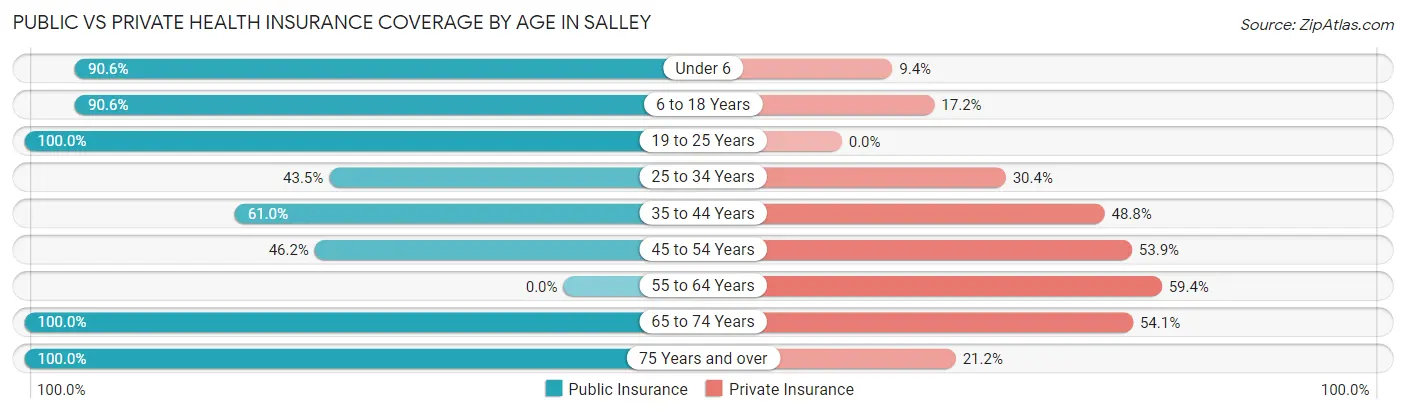
| Age Bracket | Public Insurance | Private Insurance |
| Under 6 | 29 (90.6%) | 3 (9.4%) |
| 6 to 18 Years | 58 (90.6%) | 11 (17.2%) |
| 19 to 25 Years | 3 (100.0%) | 0 (0.0%) |
| 25 to 34 Years | 10 (43.5%) | 7 (30.4%) |
| 35 to 44 Years | 25 (61.0%) | 20 (48.8%) |
| 45 to 54 Years | 6 (46.2%) | 7 (53.8%) |
| 55 to 64 Years | 0 (0.0%) | 19 (59.4%) |
| 65 to 74 Years | 37 (100.0%) | 20 (54.0%) |
| 75 Years and over | 52 (100.0%) | 11 (21.1%) |
| Total | 220 (74.1%) | 98 (33.0%) |
Disability Status by Sex by Age in Salley
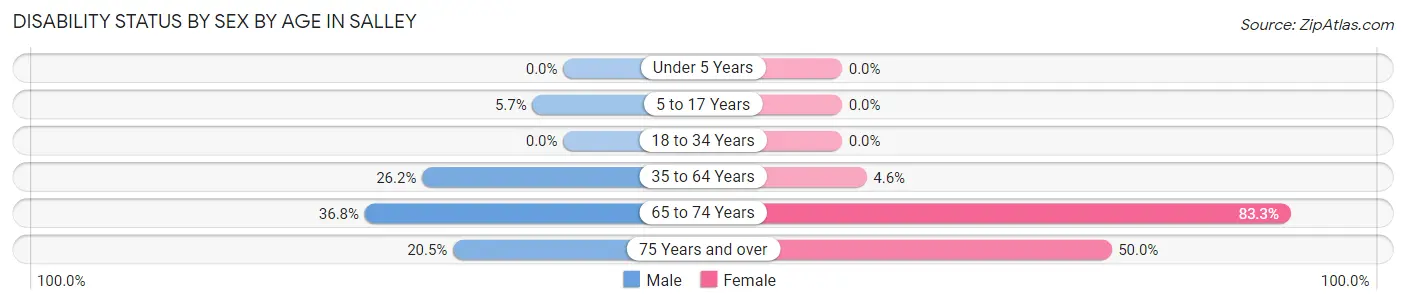
| Age Bracket | Male | Female |
| Under 5 Years | 0 (0.0%) | 0 (0.0%) |
| 5 to 17 Years | 2 (5.7%) | 0 (0.0%) |
| 18 to 34 Years | 0 (0.0%) | 0 (0.0%) |
| 35 to 64 Years | 11 (26.2%) | 2 (4.5%) |
| 65 to 74 Years | 7 (36.8%) | 15 (83.3%) |
| 75 Years and over | 9 (20.4%) | 4 (50.0%) |
Disability Class by Sex by Age in Salley
Disability Class: Hearing Difficulty
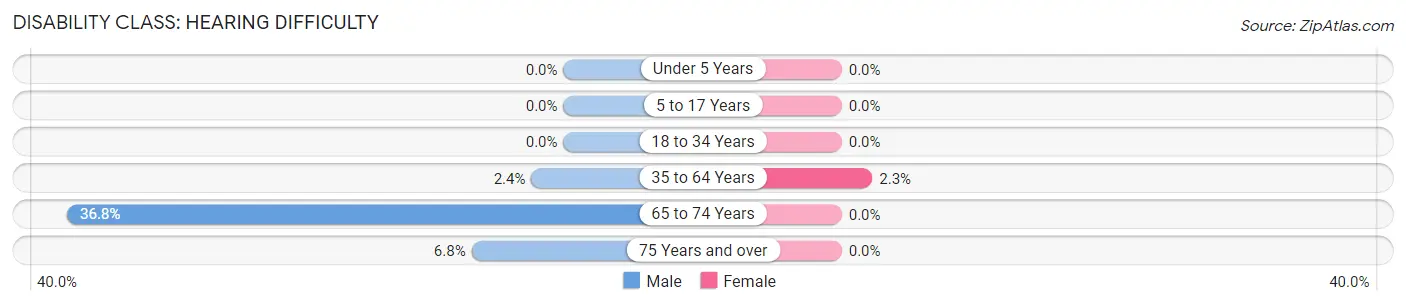
| Age Bracket | Male | Female |
| Under 5 Years | 0 (0.0%) | 0 (0.0%) |
| 5 to 17 Years | 0 (0.0%) | 0 (0.0%) |
| 18 to 34 Years | 0 (0.0%) | 0 (0.0%) |
| 35 to 64 Years | 1 (2.4%) | 1 (2.3%) |
| 65 to 74 Years | 7 (36.8%) | 0 (0.0%) |
| 75 Years and over | 3 (6.8%) | 0 (0.0%) |
Disability Class: Vision Difficulty
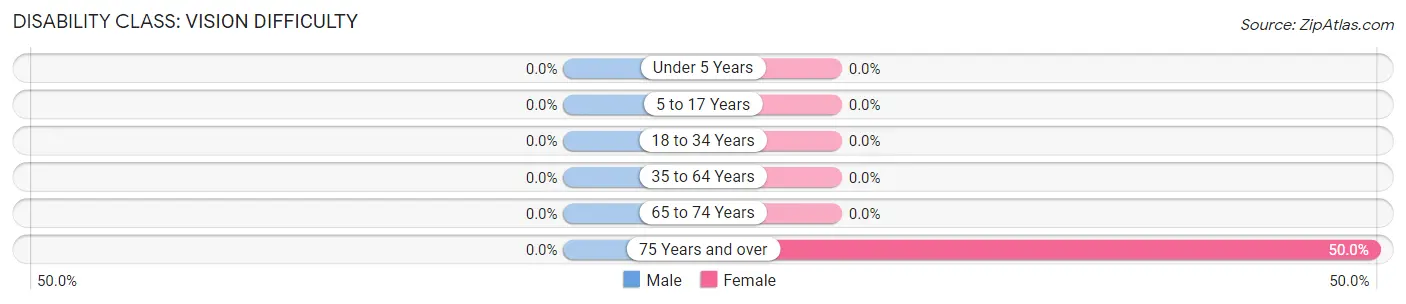
| Age Bracket | Male | Female |
| Under 5 Years | 0 (0.0%) | 0 (0.0%) |
| 5 to 17 Years | 0 (0.0%) | 0 (0.0%) |
| 18 to 34 Years | 0 (0.0%) | 0 (0.0%) |
| 35 to 64 Years | 0 (0.0%) | 0 (0.0%) |
| 65 to 74 Years | 0 (0.0%) | 0 (0.0%) |
| 75 Years and over | 0 (0.0%) | 4 (50.0%) |
Disability Class: Cognitive Difficulty
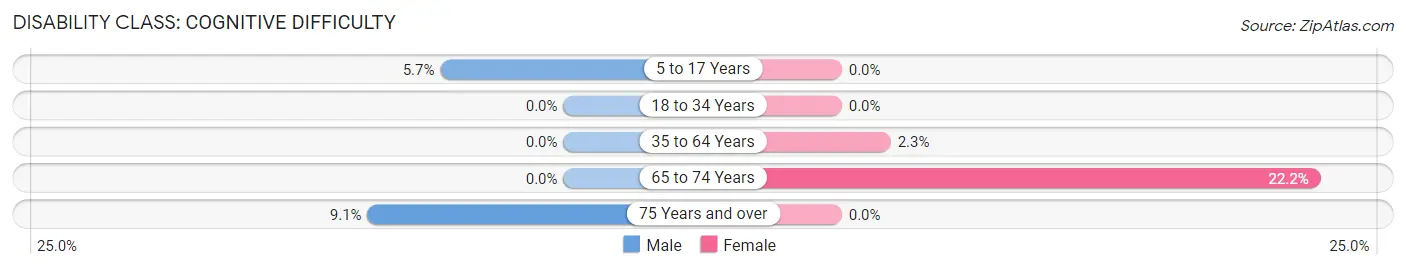
| Age Bracket | Male | Female |
| 5 to 17 Years | 2 (5.7%) | 0 (0.0%) |
| 18 to 34 Years | 0 (0.0%) | 0 (0.0%) |
| 35 to 64 Years | 0 (0.0%) | 1 (2.3%) |
| 65 to 74 Years | 0 (0.0%) | 4 (22.2%) |
| 75 Years and over | 4 (9.1%) | 0 (0.0%) |
Disability Class: Ambulatory Difficulty
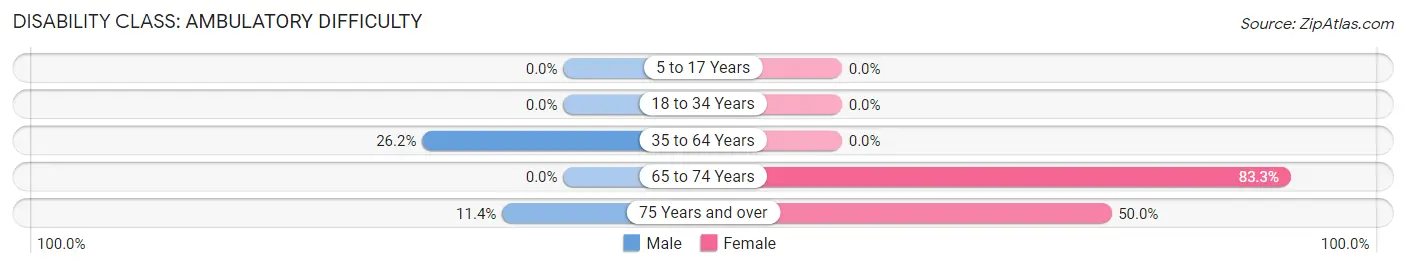
| Age Bracket | Male | Female |
| 5 to 17 Years | 0 (0.0%) | 0 (0.0%) |
| 18 to 34 Years | 0 (0.0%) | 0 (0.0%) |
| 35 to 64 Years | 11 (26.2%) | 0 (0.0%) |
| 65 to 74 Years | 0 (0.0%) | 15 (83.3%) |
| 75 Years and over | 5 (11.4%) | 4 (50.0%) |
Disability Class: Self-Care Difficulty
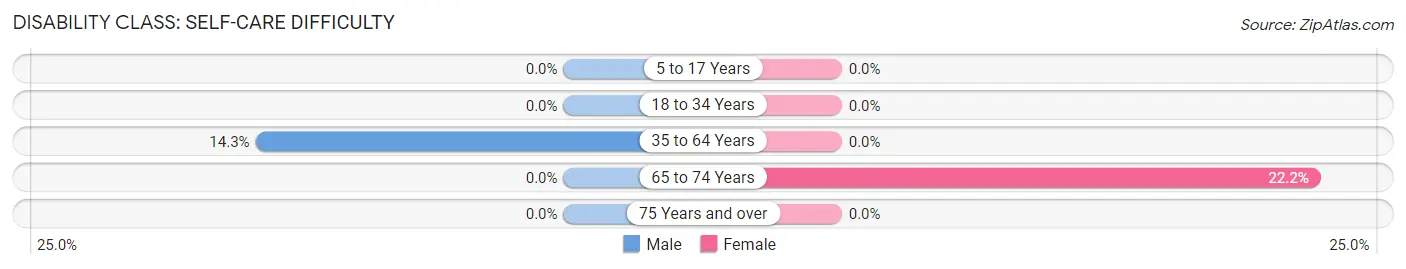
| Age Bracket | Male | Female |
| 5 to 17 Years | 0 (0.0%) | 0 (0.0%) |
| 18 to 34 Years | 0 (0.0%) | 0 (0.0%) |
| 35 to 64 Years | 6 (14.3%) | 0 (0.0%) |
| 65 to 74 Years | 0 (0.0%) | 4 (22.2%) |
| 75 Years and over | 0 (0.0%) | 0 (0.0%) |
Technology Access in Salley
Computing Device Access in Salley
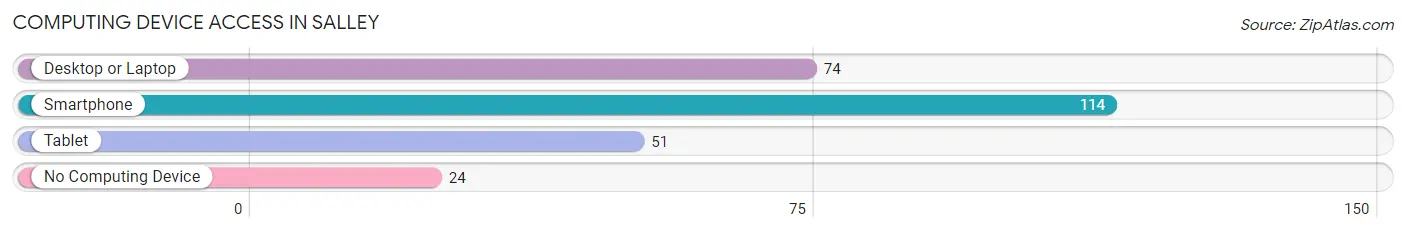
| Device Type | # Households | % Households |
| Desktop or Laptop | 74 | 52.9% |
| Smartphone | 114 | 81.4% |
| Tablet | 51 | 36.4% |
| No Computing Device | 24 | 17.1% |
| Total | 140 | 100.0% |
Internet Access in Salley
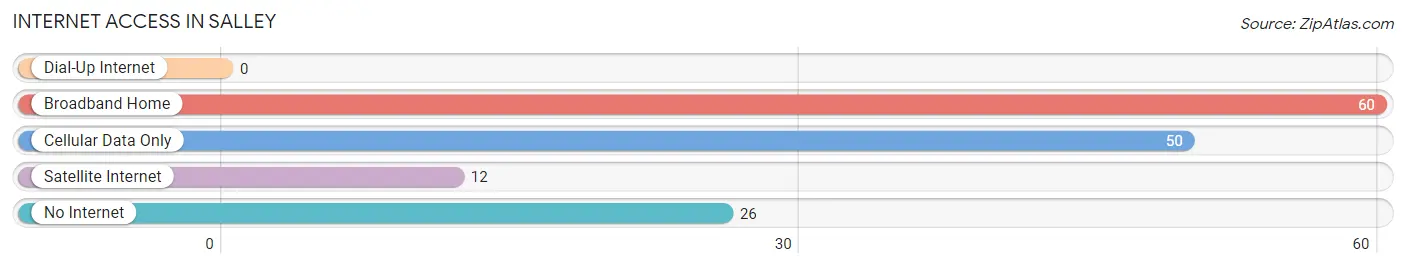
| Internet Type | # Households | % Households |
| Dial-Up Internet | 0 | 0.0% |
| Broadband Home | 60 | 42.9% |
| Cellular Data Only | 50 | 35.7% |
| Satellite Internet | 12 | 8.6% |
| No Internet | 26 | 18.6% |
| Total | 140 | 100.0% |
Salley Summary
Salley, South Carolina is a small town located in Aiken County, South Carolina. It is situated along the banks of the Saluda River, approximately 20 miles northwest of Aiken. The town has a population of approximately 500 people and is part of the Augusta-Aiken metropolitan area.
Geography
Salley is located in the Piedmont region of South Carolina, which is characterized by rolling hills and flat plains. The town is situated on the banks of the Saluda River, which is a tributary of the Savannah River. The town is located at an elevation of approximately 200 feet above sea level. The climate in Salley is humid subtropical, with hot, humid summers and mild winters.
Economy
The economy of Salley is largely based on agriculture. The town is home to several farms, which produce a variety of crops, including corn, soybeans, cotton, and peanuts. The town also has a small manufacturing sector, which produces a variety of products, including furniture, textiles, and paper products.
Demographics
As of the 2010 census, the population of Salley was 498. The racial makeup of the town was 79.2% White, 17.2% African American, 0.2% Native American, 0.4% Asian, and 3.0% from other races. The median household income in Salley was $31,250, and the median family income was $37,500. The per capita income in Salley was $14,945.
History
Salley was founded in 1820 by a group of settlers from North Carolina. The town was named after the Saluda River, which runs through the town. The town was incorporated in 1887 and has remained relatively unchanged since then.
Salley has a rich history of agriculture and industry. The town was home to several cotton mills in the late 19th and early 20th centuries. The town also had a thriving lumber industry, which provided jobs for many of the town’s residents.
In recent years, Salley has become a popular tourist destination. The town is home to several historic sites, including the Salley Historic District, which is listed on the National Register of Historic Places. The town also has several parks and recreational areas, including the Salley Recreation Area, which offers camping, fishing, and hiking.
Conclusion
Salley, South Carolina is a small town located in Aiken County, South Carolina. It is situated along the banks of the Saluda River, approximately 20 miles northwest of Aiken. The town has a population of approximately 500 people and is part of the Augusta-Aiken metropolitan area. The economy of Salley is largely based on agriculture, with a small manufacturing sector. The town has a rich history of agriculture and industry, and is now a popular tourist destination.
Common Questions
What is Per Capita Income in Salley?
Per Capita income in Salley is $17,300.
What is the Median Family Income in Salley?
Median Family Income in Salley is $28,438.
What is the Median Household income in Salley?
Median Household Income in Salley is $31,500.
What is Inequality or Gini Index in Salley?
Inequality or Gini Index in Salley is 0.34.
What is the Total Population of Salley?
Total Population of Salley is 297.
What is the Total Male Population of Salley?
Total Male Population of Salley is 164.
What is the Total Female Population of Salley?
Total Female Population of Salley is 133.
What is the Ratio of Males per 100 Females in Salley?
There are 123.31 Males per 100 Females in Salley.
What is the Ratio of Females per 100 Males in Salley?
There are 81.10 Females per 100 Males in Salley.
What is the Median Population Age in Salley?
Median Population Age in Salley is 37.7 Years.
What is the Average Family Size in Salley
Average Family Size in Salley is 3.1 People.
What is the Average Household Size in Salley
Average Household Size in Salley is 2.1 People.
How Large is the Labor Force in Salley?
There are 83 People in the Labor Forcein in Salley.
What is the Percentage of People in the Labor Force in Salley?
39.9% of People are in the Labor Force in Salley.
What is the Unemployment Rate in Salley?
Unemployment Rate in Salley is 10.8%.