Waterloo, SC
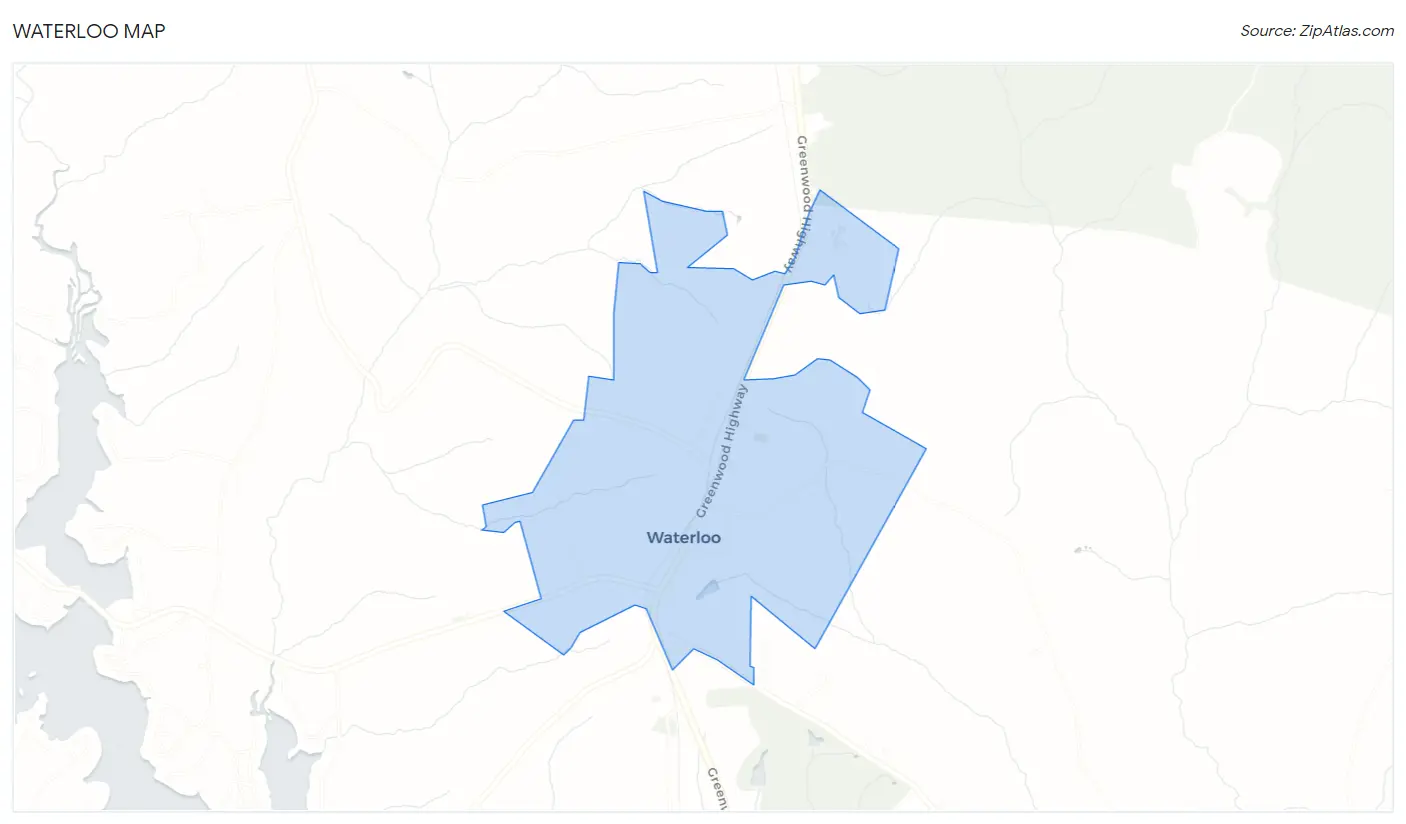
Waterloo Map
Waterloo Overview
244
TOTAL POPULATION
132
MALE POPULATION
112
FEMALE POPULATION
117.86
MALES / 100 FEMALES
84.85
FEMALES / 100 MALES
30.9
MEDIAN AGE
3.3
AVG FAMILY SIZE
2.7
AVG HOUSEHOLD SIZE
$15,730
PER CAPITA INCOME
$60,238
AVG FAMILY INCOME
$40,500
AVG HOUSEHOLD INCOME
63.1%
WAGE / INCOME GAP [ % ]
36.9¢/ $1
WAGE / INCOME GAP [ $ ]
$2,974
FAMILY INCOME DEFICIT
0.32
INEQUALITY / GINI INDEX
82
LABOR FORCE [ PEOPLE ]
49.7%
PERCENT IN LABOR FORCE
2.4%
UNEMPLOYMENT RATE
Waterloo Zip Codes
Waterloo Area Codes
Race in Waterloo
The most populous races in Waterloo are Black / African American (187 | 76.6%), White / Caucasian (40 | 16.4%), and Two or more Races (13 | 5.3%).
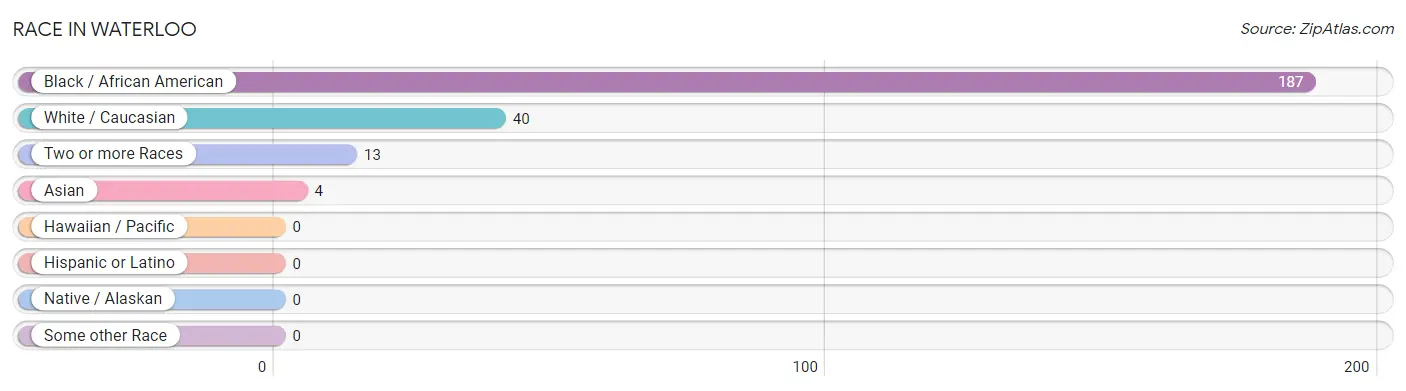
| Race | # Population | % Population |
| Asian | 4 | 1.6% |
| Black / African American | 187 | 76.6% |
| Hawaiian / Pacific | 0 | 0.0% |
| Hispanic or Latino | 0 | 0.0% |
| Native / Alaskan | 0 | 0.0% |
| White / Caucasian | 40 | 16.4% |
| Two or more Races | 13 | 5.3% |
| Some other Race | 0 | 0.0% |
| Total | 244 | 100.0% |
Ancestry in Waterloo
The most populous ancestries reported in Waterloo are English (19 | 7.8%), American (17 | 7.0%), German (7 | 2.9%), Scotch-Irish (6 | 2.5%), and Italian (5 | 2.1%), together accounting for 22.1% of all Waterloo residents.
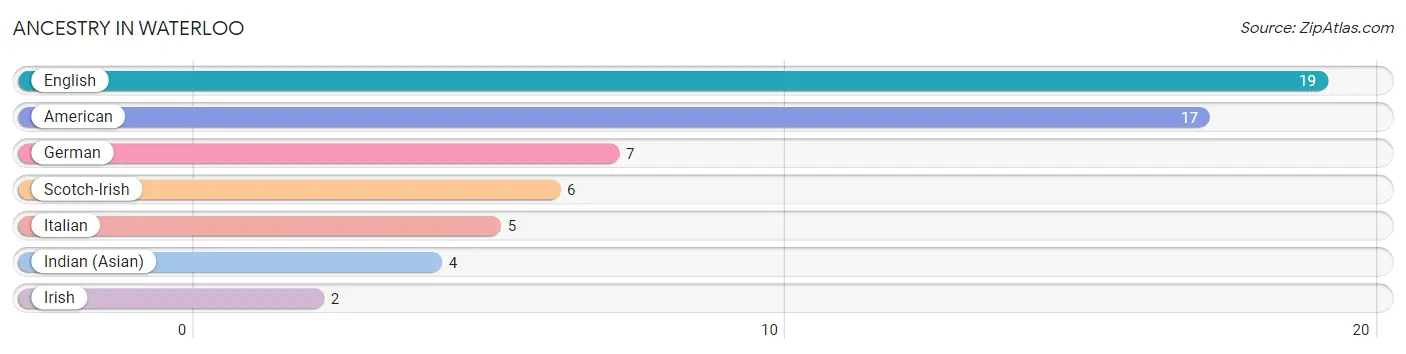
| Ancestry | # Population | % Population |
| American | 17 | 7.0% |
| English | 19 | 7.8% |
| German | 7 | 2.9% |
| Indian (Asian) | 4 | 1.6% |
| Irish | 2 | 0.8% |
| Italian | 5 | 2.1% |
| Scotch-Irish | 6 | 2.5% | View All 7 Rows |
Immigrants in Waterloo
The most numerous immigrant groups reported in Waterloo came from Asia (4 | 1.6%), China (4 | 1.6%), Eastern Asia (4 | 1.6%), Taiwan (4 | 1.6%), and Africa (3 | 1.2%), together accounting for 7.8% of all Waterloo residents.
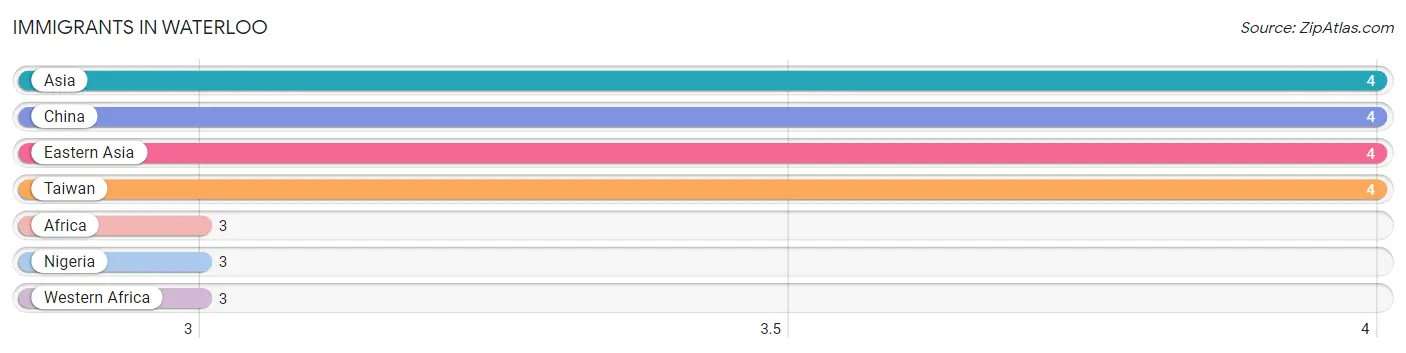
| Immigration Origin | # Population | % Population |
| Africa | 3 | 1.2% |
| Asia | 4 | 1.6% |
| China | 4 | 1.6% |
| Eastern Asia | 4 | 1.6% |
| Nigeria | 3 | 1.2% |
| Taiwan | 4 | 1.6% |
| Western Africa | 3 | 1.2% | View All 7 Rows |
Sex and Age in Waterloo
Sex and Age in Waterloo
The most populous age groups in Waterloo are Under 5 Years (49 | 37.1%) for men and 45 to 49 Years (21 | 18.8%) for women.
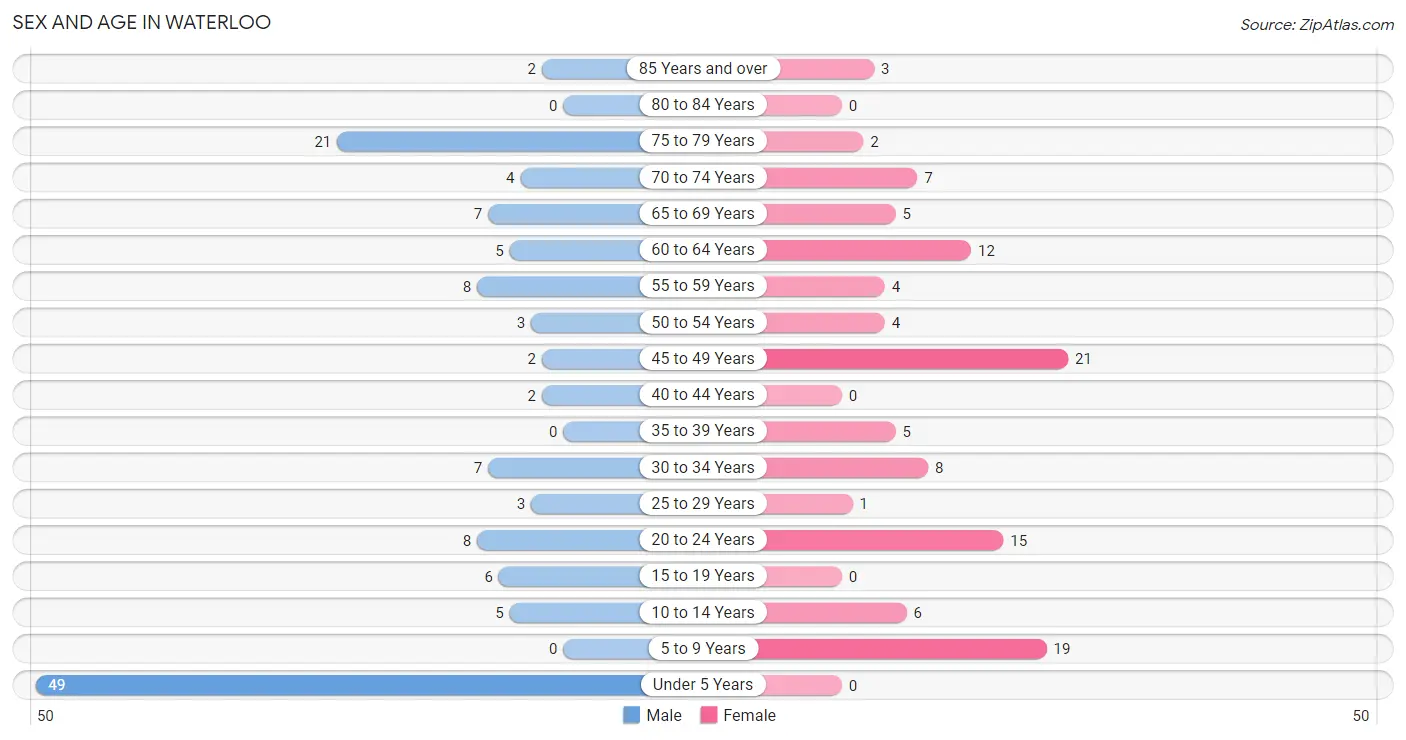
| Age Bracket | Male | Female |
| Under 5 Years | 49 (37.1%) | 0 (0.0%) |
| 5 to 9 Years | 0 (0.0%) | 19 (17.0%) |
| 10 to 14 Years | 5 (3.8%) | 6 (5.4%) |
| 15 to 19 Years | 6 (4.5%) | 0 (0.0%) |
| 20 to 24 Years | 8 (6.1%) | 15 (13.4%) |
| 25 to 29 Years | 3 (2.3%) | 1 (0.9%) |
| 30 to 34 Years | 7 (5.3%) | 8 (7.1%) |
| 35 to 39 Years | 0 (0.0%) | 5 (4.5%) |
| 40 to 44 Years | 2 (1.5%) | 0 (0.0%) |
| 45 to 49 Years | 2 (1.5%) | 21 (18.8%) |
| 50 to 54 Years | 3 (2.3%) | 4 (3.6%) |
| 55 to 59 Years | 8 (6.1%) | 4 (3.6%) |
| 60 to 64 Years | 5 (3.8%) | 12 (10.7%) |
| 65 to 69 Years | 7 (5.3%) | 5 (4.5%) |
| 70 to 74 Years | 4 (3.0%) | 7 (6.2%) |
| 75 to 79 Years | 21 (15.9%) | 2 (1.8%) |
| 80 to 84 Years | 0 (0.0%) | 0 (0.0%) |
| 85 Years and over | 2 (1.5%) | 3 (2.7%) |
| Total | 132 (100.0%) | 112 (100.0%) |
Families and Households in Waterloo
Median Family Size in Waterloo
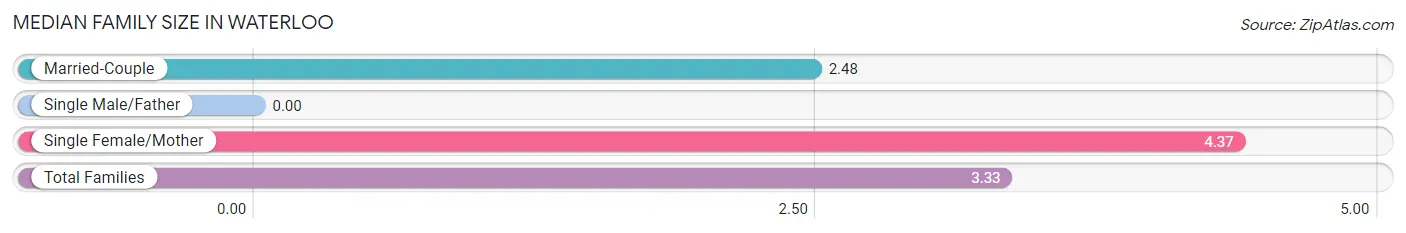
| Family Type | # Families | Family Size |
| Married-Couple | 33 (55.0%) | 2.48 |
| Single Male/Father | 0 (0.0%) | - |
| Single Female/Mother | 27 (45.0%) | 4.37 |
| Total Families | 60 (100.0%) | 3.33 |
Median Household Size in Waterloo
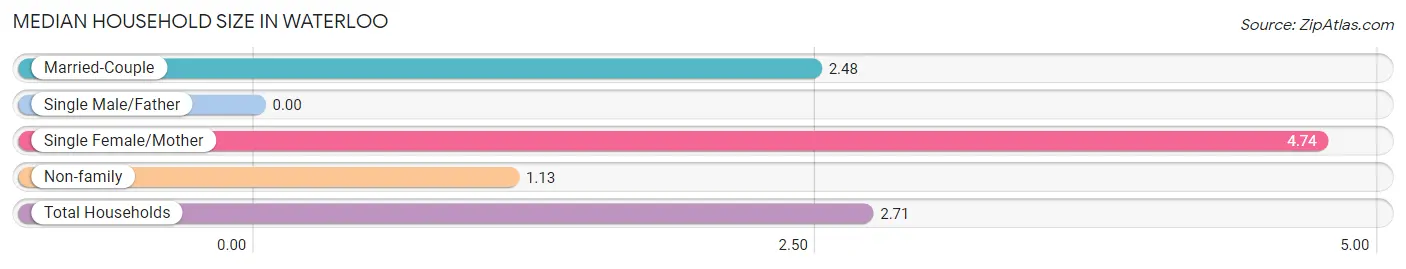
| Household Type | # Households | Household Size |
| Married-Couple | 33 (36.7%) | 2.48 |
| Single Male/Father | 0 (0.0%) | - |
| Single Female/Mother | 27 (30.0%) | 4.74 |
| Non-family | 30 (33.3%) | 1.13 |
| Total Households | 90 (100.0%) | 2.71 |
Household Size by Marriage Status in Waterloo
Out of a total of 90 households in Waterloo, 60 (66.7%) are family households, while 30 (33.3%) are nonfamily households. The most numerous type of family households are 4-person households, comprising 24, and the most common type of nonfamily households are 1-person households, comprising 26.
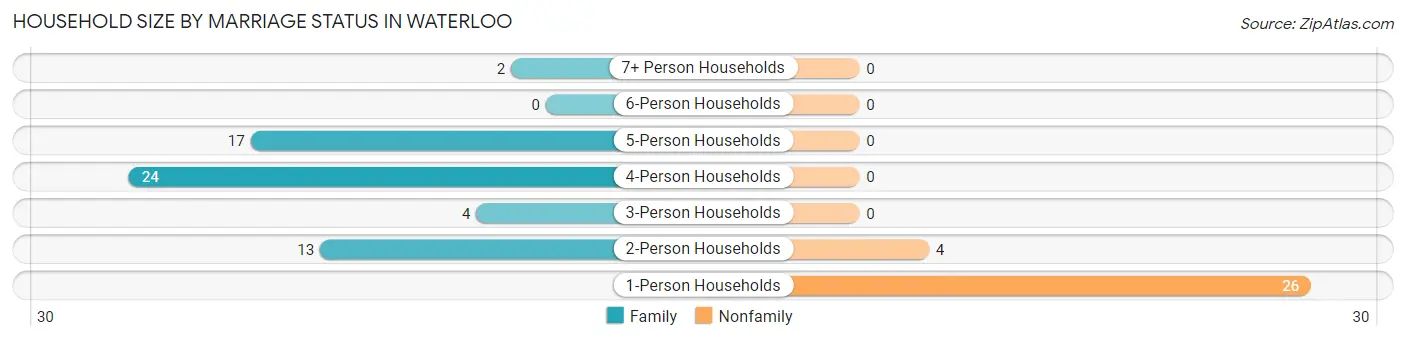
| Household Size | Family Households | Nonfamily Households |
| 1-Person Households | - | 26 (28.9%) |
| 2-Person Households | 13 (14.4%) | 4 (4.4%) |
| 3-Person Households | 4 (4.4%) | 0 (0.0%) |
| 4-Person Households | 24 (26.7%) | 0 (0.0%) |
| 5-Person Households | 17 (18.9%) | 0 (0.0%) |
| 6-Person Households | 0 (0.0%) | 0 (0.0%) |
| 7+ Person Households | 2 (2.2%) | 0 (0.0%) |
| Total | 60 (66.7%) | 30 (33.3%) |
Female Fertility in Waterloo
Fertility by Age in Waterloo
Average fertility rate in Waterloo is 260.0 births per 1,000 women. Women in the age bracket of 20 to 34 years have the highest fertility rate with 542.0 births per 1,000 women. Women in the age bracket of 20 to 34 years acount for 100.0% of all women with births.
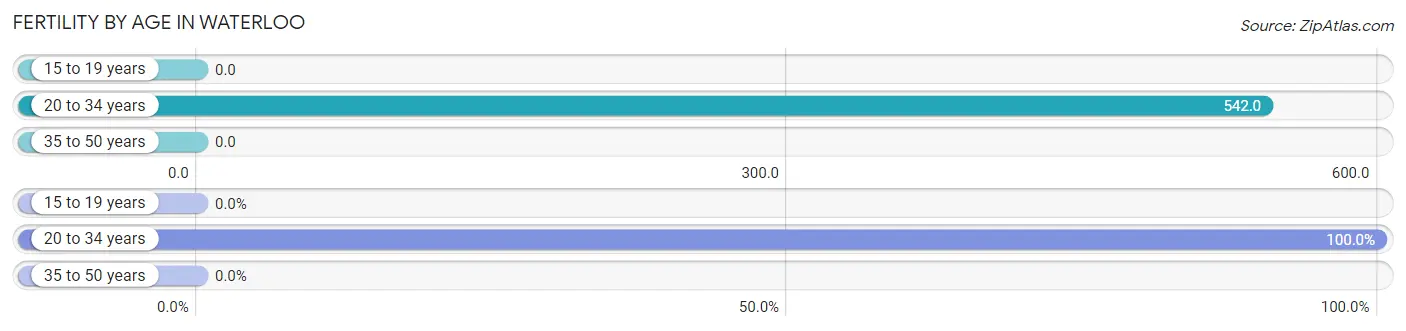
| Age Bracket | Women with Births | Births / 1,000 Women |
| 15 to 19 years | 0 (0.0%) | 0.0 |
| 20 to 34 years | 13 (100.0%) | 542.0 |
| 35 to 50 years | 0 (0.0%) | 0.0 |
| Total | 13 (100.0%) | 260.0 |
Fertility by Age by Marriage Status in Waterloo
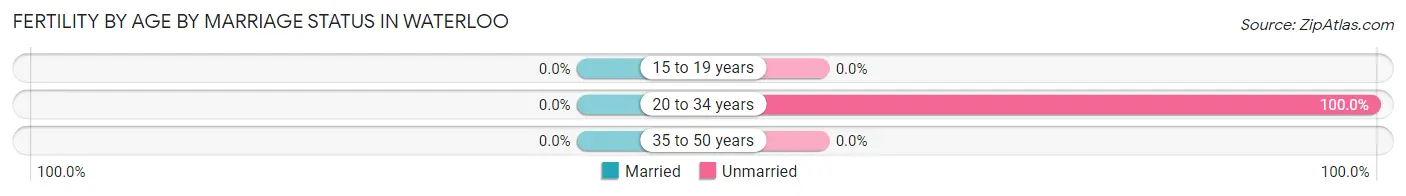
| Age Bracket | Married | Unmarried |
| 15 to 19 years | 0 (0.0%) | 0 (0.0%) |
| 20 to 34 years | 0 (0.0%) | 13 (100.0%) |
| 35 to 50 years | 0 (0.0%) | 0 (0.0%) |
| Total | 0 (0.0%) | 13 (100.0%) |
Fertility by Education in Waterloo
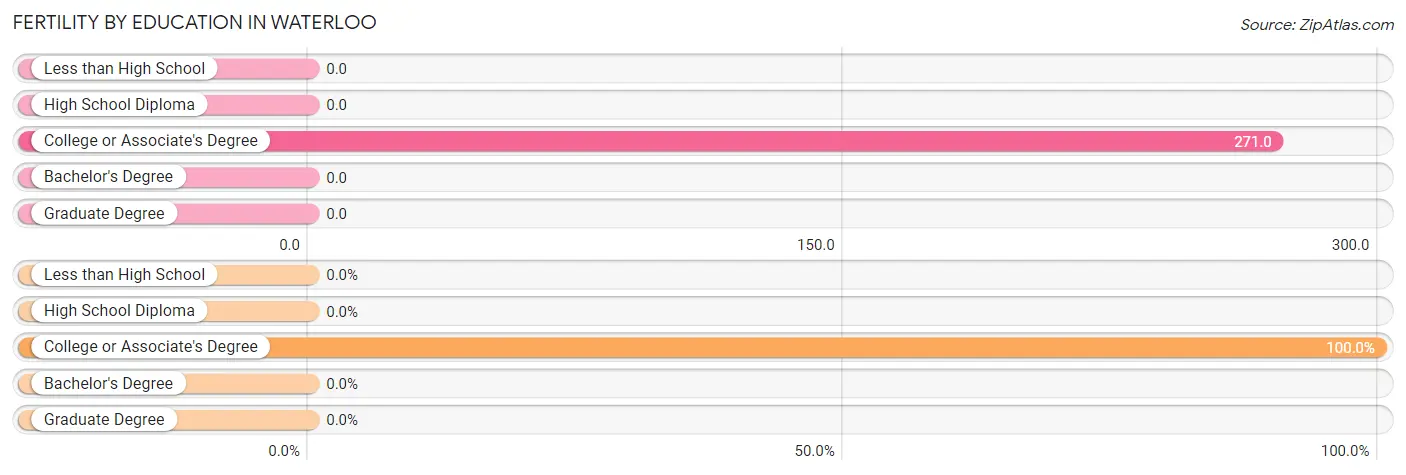
| Educational Attainment | Women with Births | Births / 1,000 Women |
| Less than High School | 0 (0.0%) | 0.0 |
| High School Diploma | 0 (0.0%) | 0.0 |
| College or Associate's Degree | 13 (100.0%) | 271.0 |
| Bachelor's Degree | 0 (0.0%) | 0.0 |
| Graduate Degree | 0 (0.0%) | 0.0 |
| Total | 13 (100.0%) | 260.0 |
Fertility by Education by Marriage Status in Waterloo
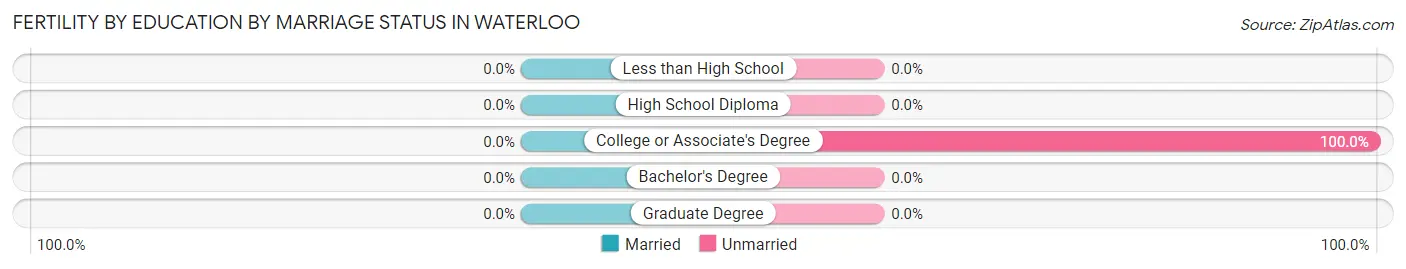
| Educational Attainment | Married | Unmarried |
| Less than High School | 0 (0.0%) | 0 (0.0%) |
| High School Diploma | 0 (0.0%) | 0 (0.0%) |
| College or Associate's Degree | 0 (0.0%) | 13 (100.0%) |
| Bachelor's Degree | 0 (0.0%) | 0 (0.0%) |
| Graduate Degree | 0 (0.0%) | 0 (0.0%) |
| Total | 0 (0.0%) | 13 (100.0%) |
Income in Waterloo
Income Overview in Waterloo
Per Capita Income in Waterloo is $15,730, while median incomes of families and households are $60,238 and $40,500 respectively.
| Characteristic | Number | Measure |
| Per Capita Income | 244 | $15,730 |
| Median Family Income | 60 | $60,238 |
| Mean Family Income | 60 | $55,835 |
| Median Household Income | 90 | $40,500 |
| Mean Household Income | 90 | $48,774 |
| Income Deficit | 60 | $2,974 |
| Wage / Income Gap (%) | 244 | 63.12% |
| Wage / Income Gap ($) | 244 | 36.88¢ per $1 |
| Gini / Inequality Index | 244 | 0.32 |
Earnings by Sex in Waterloo
Average Earnings in Waterloo are $18,750, $45,417 for men and $16,750 for women, a difference of 63.1%.
| Sex | Number | Average Earnings |
| Male | 33 (38.4%) | $45,417 |
| Female | 53 (61.6%) | $16,750 |
| Total | 86 (100.0%) | $18,750 |
Earnings by Sex by Income Bracket in Waterloo
The most common earnings brackets in Waterloo are $50,000 to $54,999 for men (13 | 39.4%) and $12,500 to $14,999 for women (15 | 28.3%).
| Income | Male | Female |
| $2,499 or less | 0 (0.0%) | 0 (0.0%) |
| $2,500 to $4,999 | 0 (0.0%) | 0 (0.0%) |
| $5,000 to $7,499 | 3 (9.1%) | 6 (11.3%) |
| $7,500 to $9,999 | 4 (12.1%) | 2 (3.8%) |
| $10,000 to $12,499 | 0 (0.0%) | 0 (0.0%) |
| $12,500 to $14,999 | 0 (0.0%) | 15 (28.3%) |
| $15,000 to $17,499 | 4 (12.1%) | 5 (9.4%) |
| $17,500 to $19,999 | 0 (0.0%) | 8 (15.1%) |
| $20,000 to $22,499 | 0 (0.0%) | 2 (3.8%) |
| $22,500 to $24,999 | 5 (15.1%) | 2 (3.8%) |
| $25,000 to $29,999 | 0 (0.0%) | 8 (15.1%) |
| $30,000 to $34,999 | 0 (0.0%) | 0 (0.0%) |
| $35,000 to $39,999 | 0 (0.0%) | 0 (0.0%) |
| $40,000 to $44,999 | 0 (0.0%) | 0 (0.0%) |
| $45,000 to $49,999 | 3 (9.1%) | 0 (0.0%) |
| $50,000 to $54,999 | 13 (39.4%) | 1 (1.9%) |
| $55,000 to $64,999 | 0 (0.0%) | 4 (7.5%) |
| $65,000 to $74,999 | 0 (0.0%) | 0 (0.0%) |
| $75,000 to $99,999 | 1 (3.0%) | 0 (0.0%) |
| $100,000+ | 0 (0.0%) | 0 (0.0%) |
| Total | 33 (100.0%) | 53 (100.0%) |
Earnings by Sex by Educational Attainment in Waterloo
| Educational Attainment | Male Income | Female Income |
| Less than High School | - | - |
| High School Diploma | - | - |
| College or Associate's Degree | - | - |
| Bachelor's Degree | - | - |
| Graduate Degree | - | - |
| Total | $53,077 | $18,750 |
Family Income in Waterloo
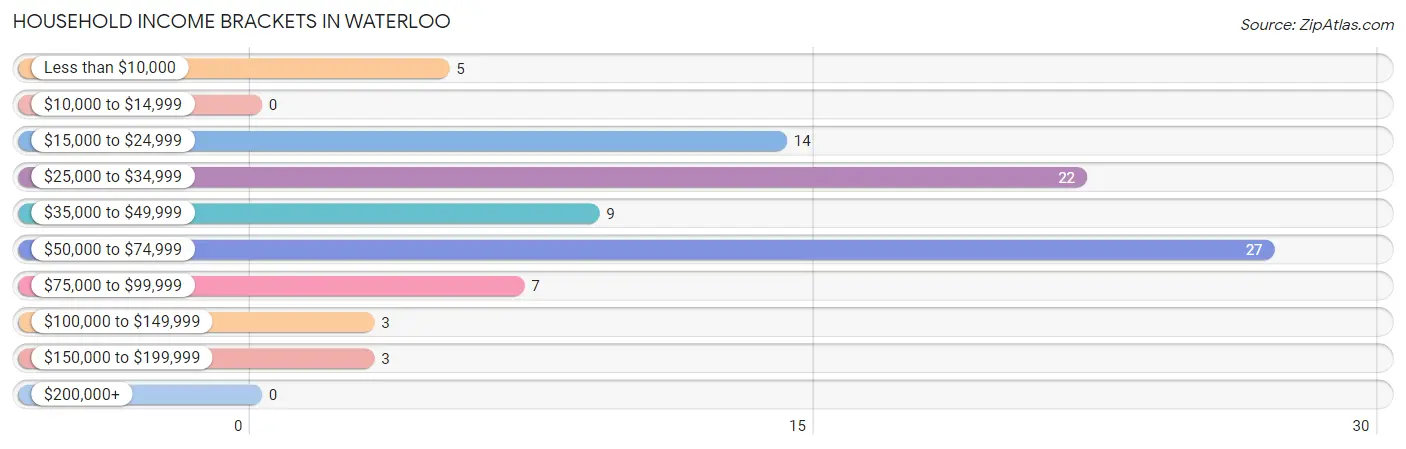
Family Income Brackets in Waterloo
According to the Waterloo family income data, there are 25 families falling into the $50,000 to $74,999 income range, which is the most common income bracket and makes up 41.7% of all families.
| Income Bracket | # Families | % Families |
| Less than $10,000 | 2 | 3.3% |
| $10,000 to $14,999 | 0 | 0.0% |
| $15,000 to $24,999 | 0 | 0.0% |
| $25,000 to $34,999 | 16 | 26.7% |
| $35,000 to $49,999 | 6 | 10.0% |
| $50,000 to $74,999 | 25 | 41.7% |
| $75,000 to $99,999 | 7 | 11.7% |
| $100,000 to $149,999 | 3 | 5.0% |
| $150,000 to $199,999 | 1 | 1.7% |
| $200,000+ | 0 | 0.0% |
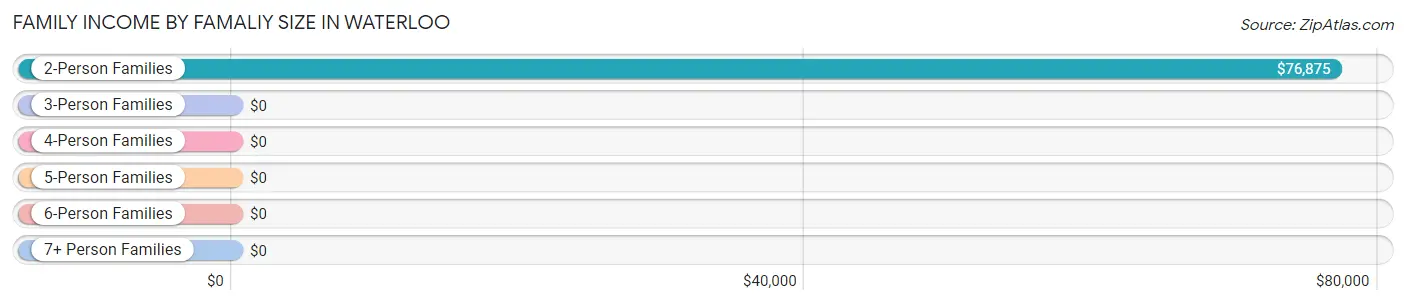
Family Income by Famaliy Size in Waterloo
2-person families (13 | 21.7%) account for the highest median family income in Waterloo with $76,875 per family, while 2-person families (13 | 21.7%) have the highest median income of $38,438 per family member.
| Income Bracket | # Families | Median Income |
| 2-Person Families | 13 (21.7%) | $76,875 |
| 3-Person Families | 8 (13.3%) | $0 |
| 4-Person Families | 22 (36.7%) | $0 |
| 5-Person Families | 15 (25.0%) | $0 |
| 6-Person Families | 0 (0.0%) | $0 |
| 7+ Person Families | 2 (3.3%) | $0 |
| Total | 60 (100.0%) | $60,238 |
Family Income by Number of Earners in Waterloo
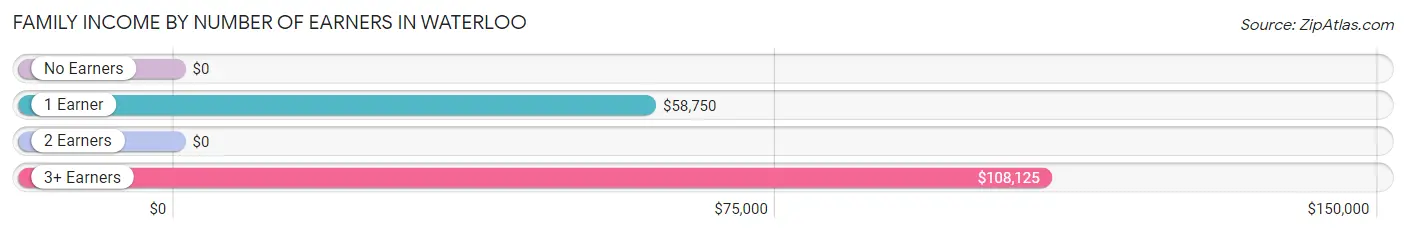
| Number of Earners | # Families | Median Income |
| No Earners | 4 (6.7%) | $0 |
| 1 Earner | 46 (76.7%) | $58,750 |
| 2 Earners | 5 (8.3%) | $0 |
| 3+ Earners | 5 (8.3%) | $108,125 |
| Total | 60 (100.0%) | $60,238 |
Household Income in Waterloo
Household Income Brackets in Waterloo
With 27 households falling in the category, the $50,000 to $74,999 income range is the most frequent in Waterloo, accounting for 30.0% of all households.
| Income Bracket | # Households | % Households |
| Less than $10,000 | 5 | 5.6% |
| $10,000 to $14,999 | 0 | 0.0% |
| $15,000 to $24,999 | 14 | 15.6% |
| $25,000 to $34,999 | 22 | 24.4% |
| $35,000 to $49,999 | 9 | 10.0% |
| $50,000 to $74,999 | 27 | 30.0% |
| $75,000 to $99,999 | 7 | 7.8% |
| $100,000 to $149,999 | 3 | 3.3% |
| $150,000 to $199,999 | 3 | 3.3% |
| $200,000+ | 0 | 0.0% |
Household Income by Householder Age in Waterloo
The median household income in Waterloo is $40,500, with the highest median household income of $60,298 found in the 65+ years age bracket for the primary householder. A total of 43 households (47.8%) fall into this category. Meanwhile, the 15 to 24 years age bracket for the primary householder has the lowest median household income of $0, with 2 households (2.2%) in this group.
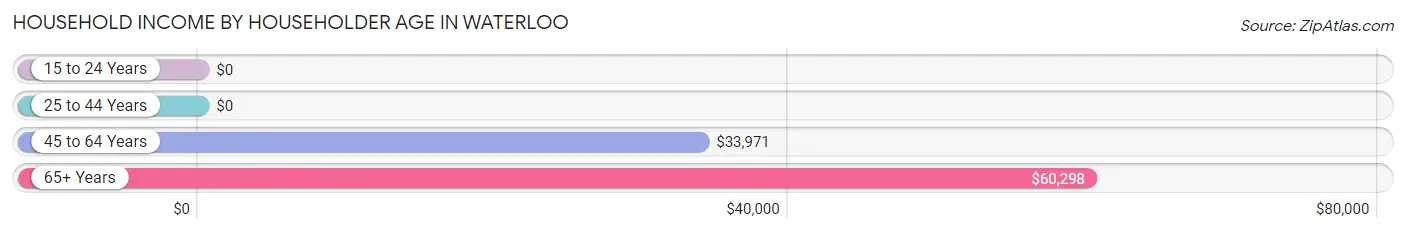
| Income Bracket | # Households | Median Income |
| 15 to 24 Years | 2 (2.2%) | $0 |
| 25 to 44 Years | 3 (3.3%) | $0 |
| 45 to 64 Years | 42 (46.7%) | $33,971 |
| 65+ Years | 43 (47.8%) | $60,298 |
| Total | 90 (100.0%) | $40,500 |
Poverty in Waterloo
Income Below Poverty by Sex and Age in Waterloo
With 41.7% poverty level for males and 48.2% for females among the residents of Waterloo, 6 to 11 year old males and 5 year old females are the most vulnerable to poverty, with 5 males (100.0%) and 3 females (100.0%) in their respective age groups living below the poverty level.
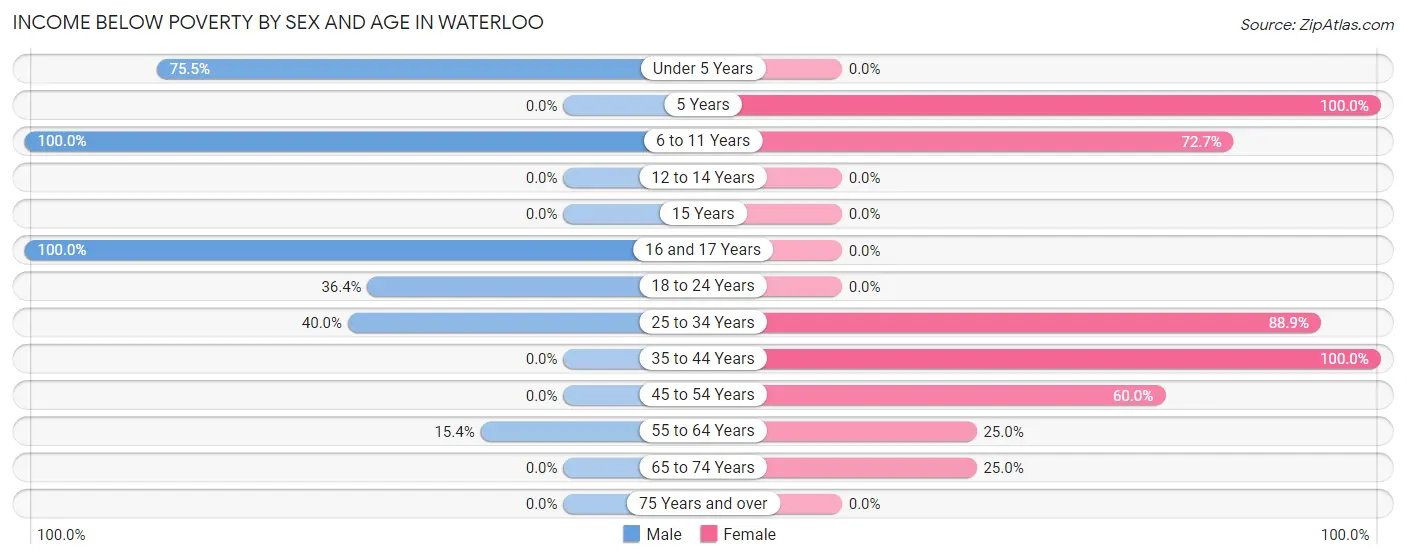
| Age Bracket | Male | Female |
| Under 5 Years | 37 (75.5%) | 0 (0.0%) |
| 5 Years | 0 (0.0%) | 3 (100.0%) |
| 6 to 11 Years | 5 (100.0%) | 16 (72.7%) |
| 12 to 14 Years | 0 (0.0%) | 0 (0.0%) |
| 15 Years | 0 (0.0%) | 0 (0.0%) |
| 16 and 17 Years | 3 (100.0%) | 0 (0.0%) |
| 18 to 24 Years | 4 (36.4%) | 0 (0.0%) |
| 25 to 34 Years | 4 (40.0%) | 8 (88.9%) |
| 35 to 44 Years | 0 (0.0%) | 5 (100.0%) |
| 45 to 54 Years | 0 (0.0%) | 15 (60.0%) |
| 55 to 64 Years | 2 (15.4%) | 4 (25.0%) |
| 65 to 74 Years | 0 (0.0%) | 3 (25.0%) |
| 75 Years and over | 0 (0.0%) | 0 (0.0%) |
| Total | 55 (41.7%) | 54 (48.2%) |
Income Above Poverty by Sex and Age in Waterloo
According to the poverty statistics in Waterloo, males aged 35 to 44 years and females aged 18 to 24 years are the age groups that are most secure financially, with 100.0% of males and 100.0% of females in these age groups living above the poverty line.
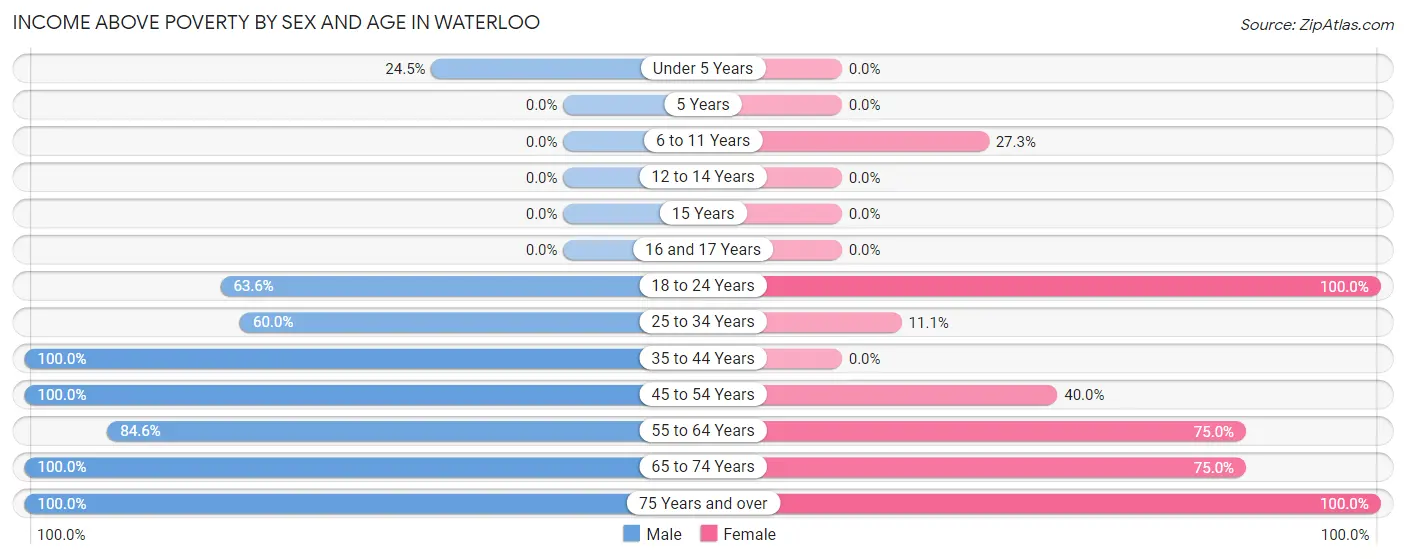
| Age Bracket | Male | Female |
| Under 5 Years | 12 (24.5%) | 0 (0.0%) |
| 5 Years | 0 (0.0%) | 0 (0.0%) |
| 6 to 11 Years | 0 (0.0%) | 6 (27.3%) |
| 12 to 14 Years | 0 (0.0%) | 0 (0.0%) |
| 15 Years | 0 (0.0%) | 0 (0.0%) |
| 16 and 17 Years | 0 (0.0%) | 0 (0.0%) |
| 18 to 24 Years | 7 (63.6%) | 15 (100.0%) |
| 25 to 34 Years | 6 (60.0%) | 1 (11.1%) |
| 35 to 44 Years | 2 (100.0%) | 0 (0.0%) |
| 45 to 54 Years | 5 (100.0%) | 10 (40.0%) |
| 55 to 64 Years | 11 (84.6%) | 12 (75.0%) |
| 65 to 74 Years | 11 (100.0%) | 9 (75.0%) |
| 75 Years and over | 23 (100.0%) | 5 (100.0%) |
| Total | 77 (58.3%) | 58 (51.8%) |
Income Below Poverty Among Married-Couple Families in Waterloo
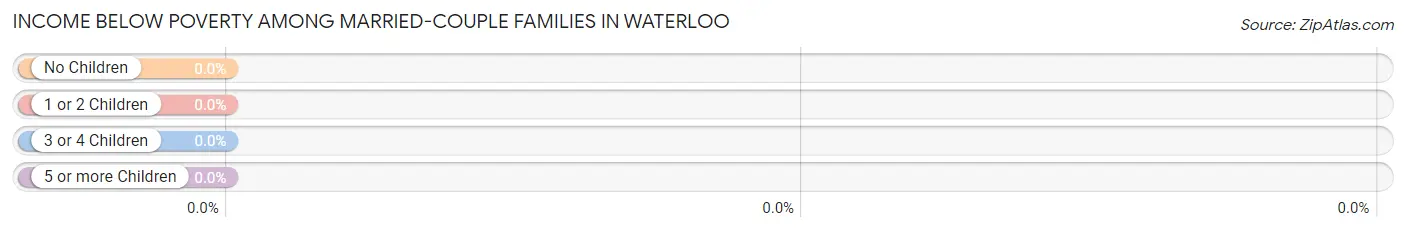
| Children | Above Poverty | Below Poverty |
| No Children | 9 (100.0%) | 0 (0.0%) |
| 1 or 2 Children | 24 (100.0%) | 0 (0.0%) |
| 3 or 4 Children | 0 (0.0%) | 0 (0.0%) |
| 5 or more Children | 0 (0.0%) | 0 (0.0%) |
| Total | 33 (100.0%) | 0 (0.0%) |
Income Below Poverty Among Single-Parent Households in Waterloo
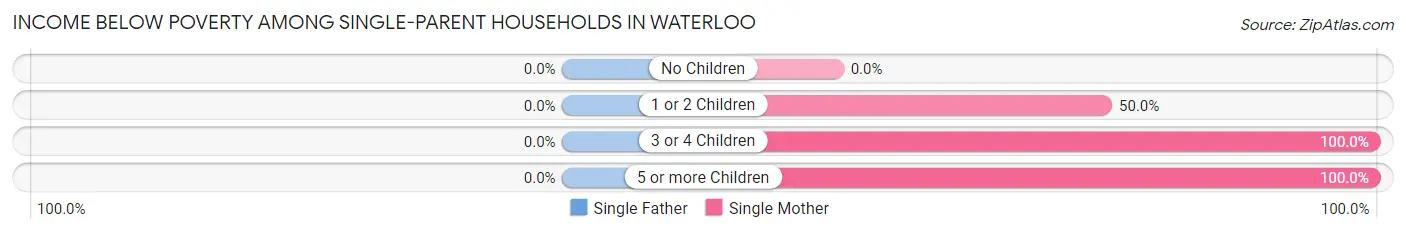
| Children | Single Father | Single Mother |
| No Children | 0 (0.0%) | 0 (0.0%) |
| 1 or 2 Children | 0 (0.0%) | 2 (50.0%) |
| 3 or 4 Children | 0 (0.0%) | 15 (100.0%) |
| 5 or more Children | 0 (0.0%) | 2 (100.0%) |
| Total | 0 (0.0%) | 19 (70.4%) |
Income Below Poverty Among Married-Couple vs Single-Parent Households in Waterloo
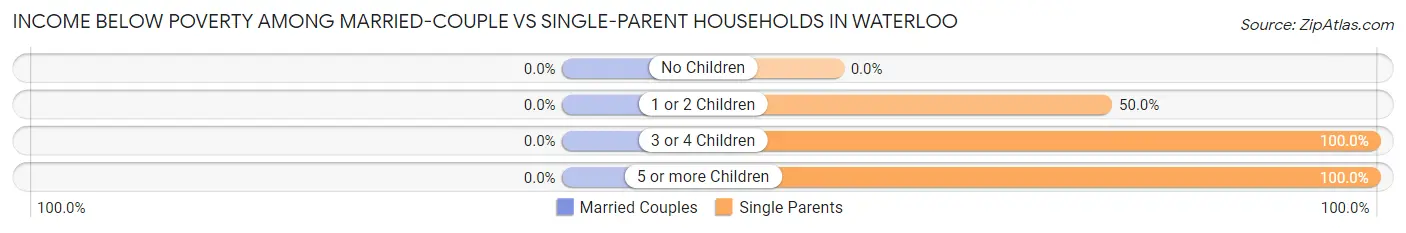
| Children | Married-Couple Families | Single-Parent Households |
| No Children | 0 (0.0%) | 0 (0.0%) |
| 1 or 2 Children | 0 (0.0%) | 2 (50.0%) |
| 3 or 4 Children | 0 (0.0%) | 15 (100.0%) |
| 5 or more Children | 0 (0.0%) | 2 (100.0%) |
| Total | 0 (0.0%) | 19 (70.4%) |
Employment Characteristics in Waterloo
Employment by Class of Employer in Waterloo
Among the 80 employed individuals in Waterloo, private company employees (54 | 67.5%), not-for-profit organizations (11 | 13.8%), and state government employees (11 | 13.8%) make up the most common classes of employment.
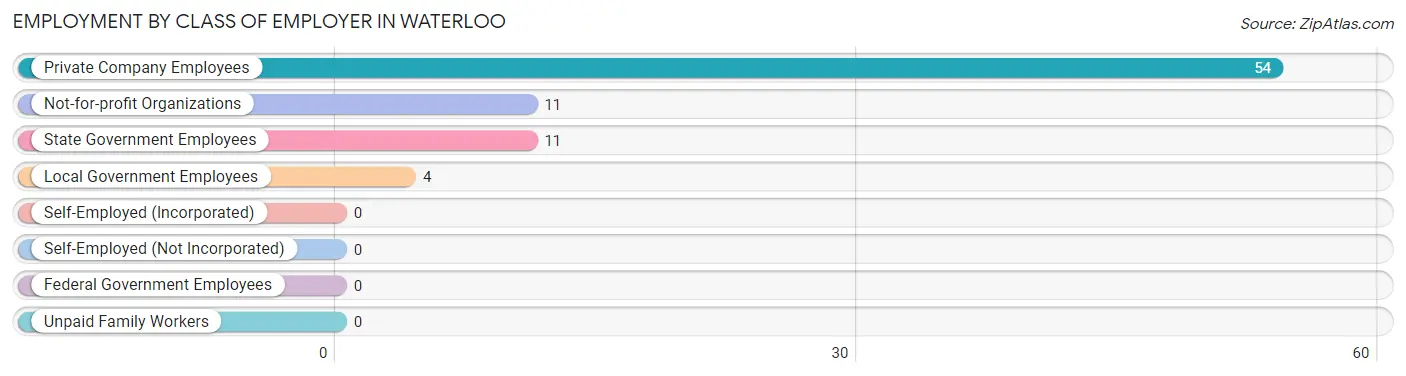
| Employer Class | # Employees | % Employees |
| Private Company Employees | 54 | 67.5% |
| Self-Employed (Incorporated) | 0 | 0.0% |
| Self-Employed (Not Incorporated) | 0 | 0.0% |
| Not-for-profit Organizations | 11 | 13.8% |
| Local Government Employees | 4 | 5.0% |
| State Government Employees | 11 | 13.8% |
| Federal Government Employees | 0 | 0.0% |
| Unpaid Family Workers | 0 | 0.0% |
| Total | 80 | 100.0% |
Employment Status by Age in Waterloo
According to the labor force statistics for Waterloo, out of the total population over 16 years of age (165), 49.7% or 82 individuals are in the labor force, with 2.4% or 2 of them unemployed. The age group with the highest labor force participation rate is 25 to 29 years, with 100.0% or 4 individuals in the labor force. Within the labor force, the 55 to 59 years age range has the highest percentage of unemployed individuals, with 28.6% or 2 of them being unemployed.
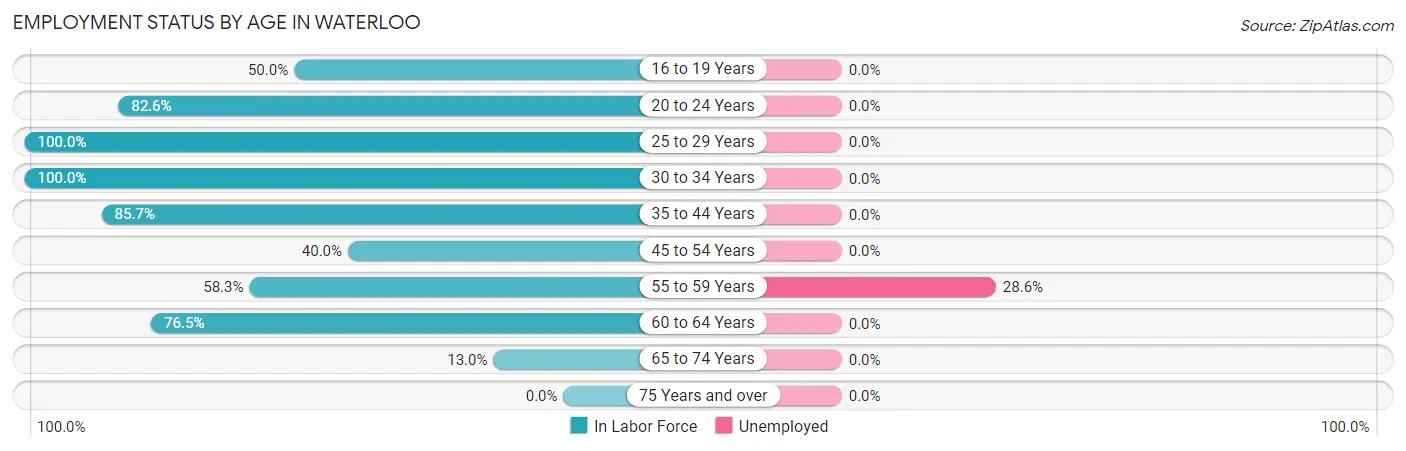
| Age Bracket | In Labor Force | Unemployed |
| 16 to 19 Years | 3 (50.0%) | 0 (0.0%) |
| 20 to 24 Years | 19 (82.6%) | 0 (0.0%) |
| 25 to 29 Years | 4 (100.0%) | 0 (0.0%) |
| 30 to 34 Years | 15 (100.0%) | 0 (0.0%) |
| 35 to 44 Years | 6 (85.7%) | 0 (0.0%) |
| 45 to 54 Years | 12 (40.0%) | 0 (0.0%) |
| 55 to 59 Years | 7 (58.3%) | 2 (28.6%) |
| 60 to 64 Years | 13 (76.5%) | 0 (0.0%) |
| 65 to 74 Years | 3 (13.0%) | 0 (0.0%) |
| 75 Years and over | 0 (0.0%) | 0 (0.0%) |
| Total | 82 (49.7%) | 2 (2.4%) |
Employment Status by Educational Attainment in Waterloo
According to labor force statistics for Waterloo, 67.1% of individuals (57) out of the total population between 25 and 64 years of age (85) are in the labor force, with 3.5% or 2 of them being unemployed. The group with the highest labor force participation rate are those with the educational attainment of bachelor's degree or higher, with 100.0% or 12 individuals in the labor force. Within the labor force, individuals with high school diploma education have the highest percentage of unemployment, with 13.3% or 2 of them being unemployed.
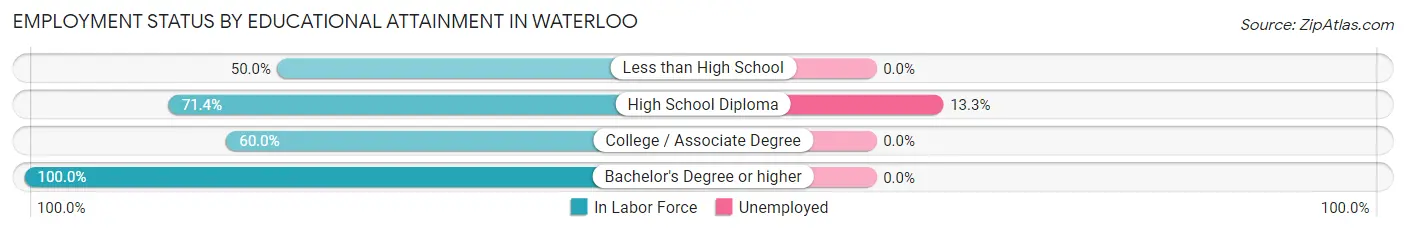
| Educational Attainment | In Labor Force | Unemployed |
| Less than High School | 6 (50.0%) | 0 (0.0%) |
| High School Diploma | 15 (71.4%) | 3 (13.3%) |
| College / Associate Degree | 24 (60.0%) | 0 (0.0%) |
| Bachelor's Degree or higher | 12 (100.0%) | 0 (0.0%) |
| Total | 57 (67.1%) | 3 (3.5%) |
Employment Occupations by Sex in Waterloo
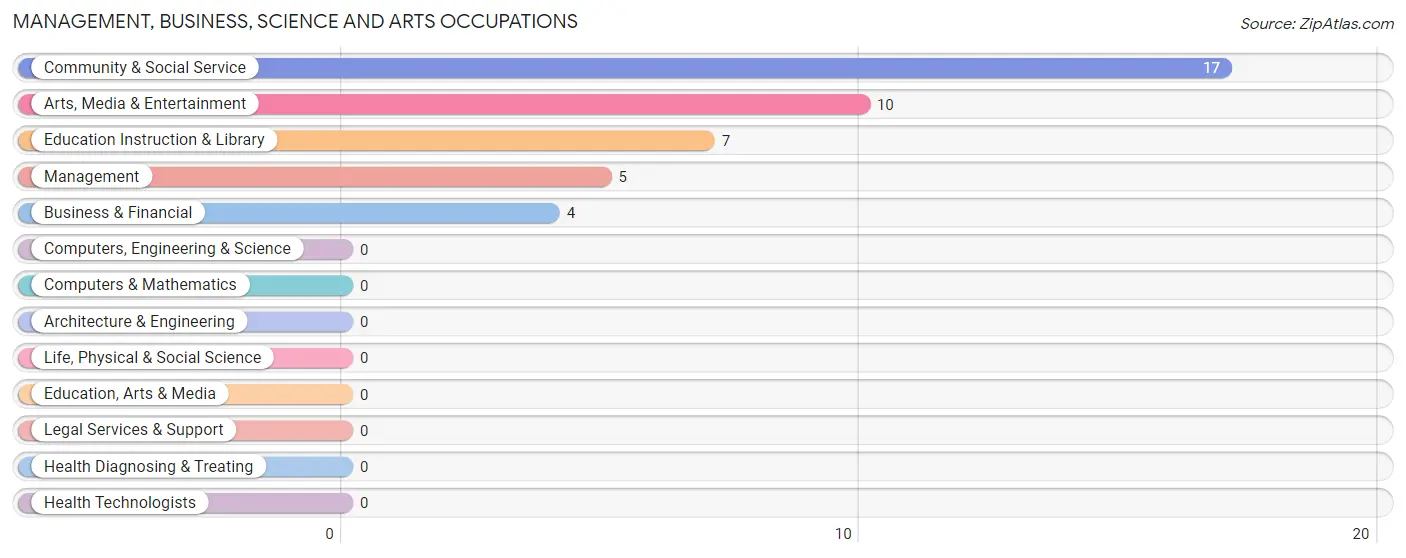
Management, Business, Science and Arts Occupations
The most common Management, Business, Science and Arts occupations in Waterloo are Community & Social Service (17 | 21.2%), Arts, Media & Entertainment (10 | 12.5%), Education Instruction & Library (7 | 8.7%), Management (5 | 6.2%), and Business & Financial (4 | 5.0%).
Management, Business, Science and Arts Occupations by Sex
Within the Management, Business, Science and Arts occupations in Waterloo, the most male-oriented occupations are Education Instruction & Library (71.4%), Management (60.0%), and Community & Social Service (29.4%), while the most female-oriented occupations are Business & Financial (100.0%), Arts, Media & Entertainment (100.0%), and Community & Social Service (70.6%).
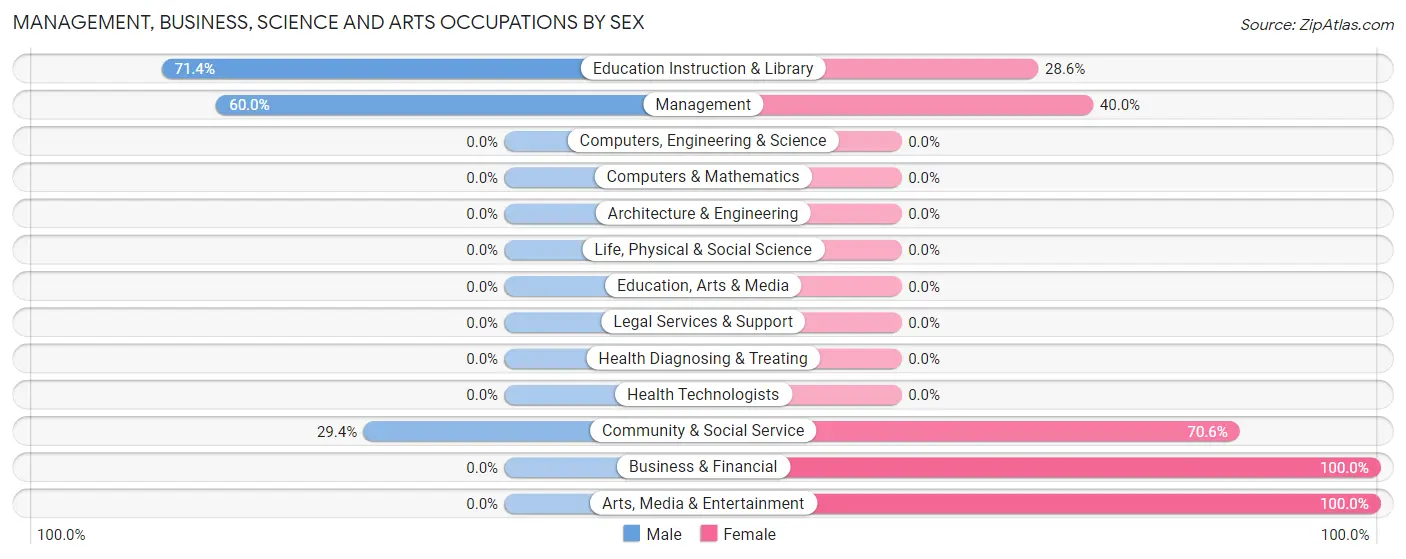
| Occupation | Male | Female |
| Management | 3 (60.0%) | 2 (40.0%) |
| Business & Financial | 0 (0.0%) | 4 (100.0%) |
| Computers, Engineering & Science | 0 (0.0%) | 0 (0.0%) |
| Computers & Mathematics | 0 (0.0%) | 0 (0.0%) |
| Architecture & Engineering | 0 (0.0%) | 0 (0.0%) |
| Life, Physical & Social Science | 0 (0.0%) | 0 (0.0%) |
| Community & Social Service | 5 (29.4%) | 12 (70.6%) |
| Education, Arts & Media | 0 (0.0%) | 0 (0.0%) |
| Legal Services & Support | 0 (0.0%) | 0 (0.0%) |
| Education Instruction & Library | 5 (71.4%) | 2 (28.6%) |
| Arts, Media & Entertainment | 0 (0.0%) | 10 (100.0%) |
| Health Diagnosing & Treating | 0 (0.0%) | 0 (0.0%) |
| Health Technologists | 0 (0.0%) | 0 (0.0%) |
| Total (Category) | 8 (30.8%) | 18 (69.2%) |
| Total (Overall) | 29 (36.2%) | 51 (63.7%) |
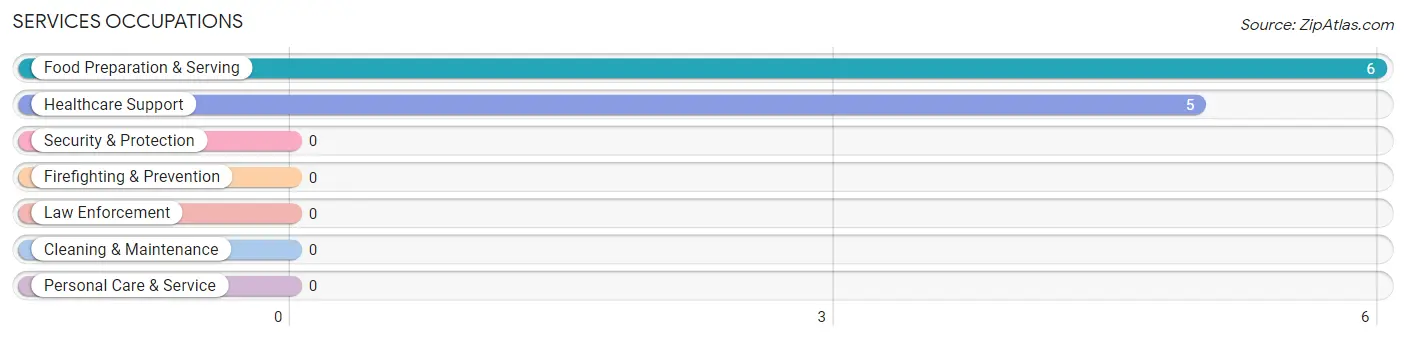
Services Occupations
The most common Services occupations in Waterloo are Food Preparation & Serving (6 | 7.5%), and Healthcare Support (5 | 6.2%).
Services Occupations by Sex
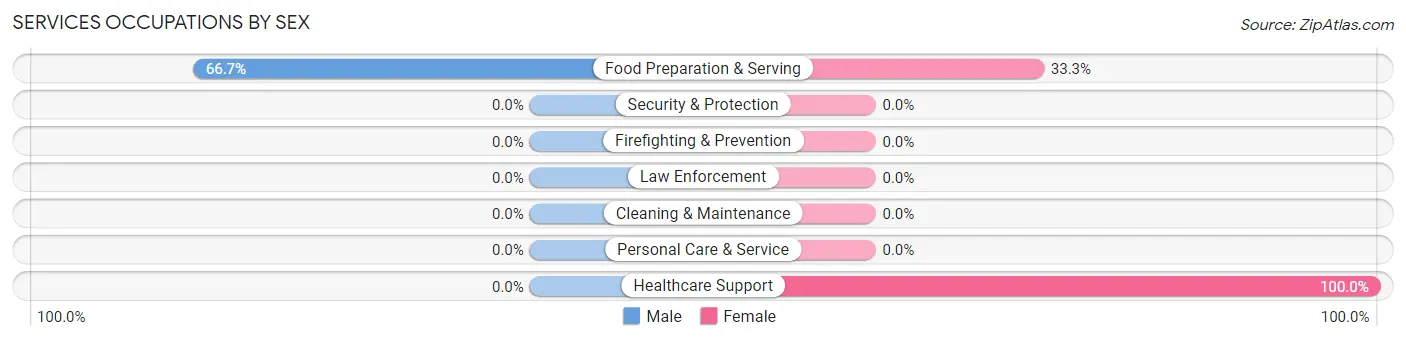
| Occupation | Male | Female |
| Healthcare Support | 0 (0.0%) | 5 (100.0%) |
| Security & Protection | 0 (0.0%) | 0 (0.0%) |
| Firefighting & Prevention | 0 (0.0%) | 0 (0.0%) |
| Law Enforcement | 0 (0.0%) | 0 (0.0%) |
| Food Preparation & Serving | 4 (66.7%) | 2 (33.3%) |
| Cleaning & Maintenance | 0 (0.0%) | 0 (0.0%) |
| Personal Care & Service | 0 (0.0%) | 0 (0.0%) |
| Total (Category) | 4 (36.4%) | 7 (63.6%) |
| Total (Overall) | 29 (36.2%) | 51 (63.7%) |
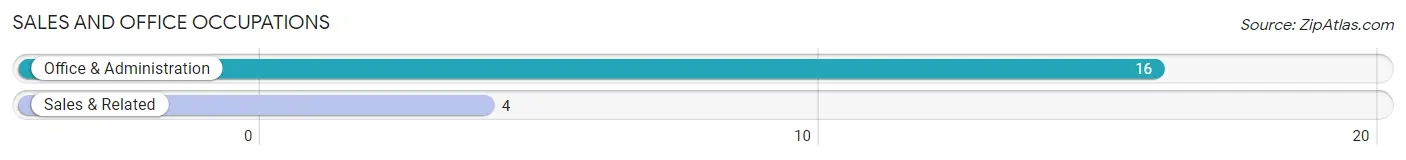
Sales and Office Occupations
The most common Sales and Office occupations in Waterloo are Office & Administration (16 | 20.0%), and Sales & Related (4 | 5.0%).
Sales and Office Occupations by Sex
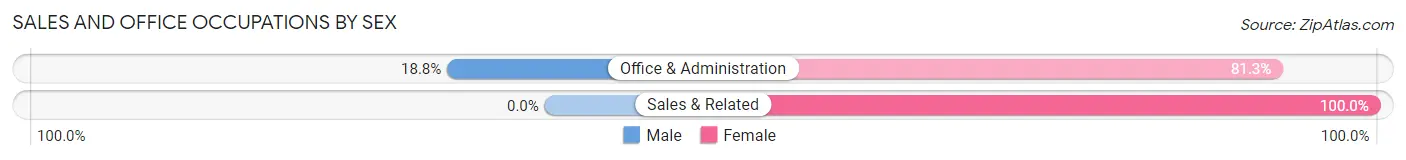
| Occupation | Male | Female |
| Sales & Related | 0 (0.0%) | 4 (100.0%) |
| Office & Administration | 3 (18.8%) | 13 (81.2%) |
| Total (Category) | 3 (15.0%) | 17 (85.0%) |
| Total (Overall) | 29 (36.2%) | 51 (63.7%) |
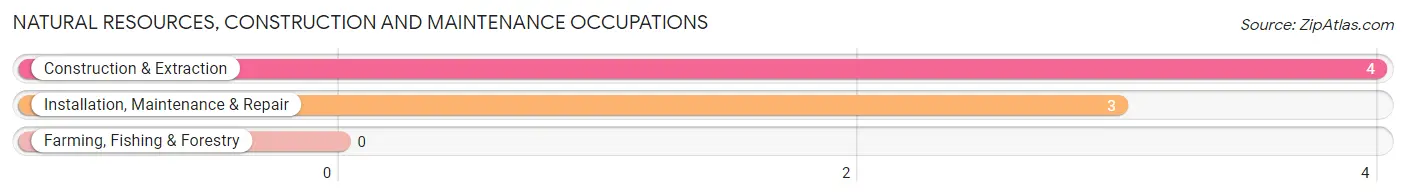
Natural Resources, Construction and Maintenance Occupations
The most common Natural Resources, Construction and Maintenance occupations in Waterloo are Construction & Extraction (4 | 5.0%), and Installation, Maintenance & Repair (3 | 3.7%).
Natural Resources, Construction and Maintenance Occupations by Sex
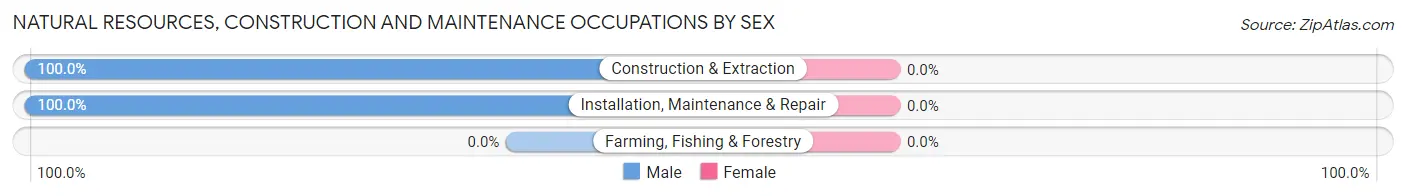
| Occupation | Male | Female |
| Farming, Fishing & Forestry | 0 (0.0%) | 0 (0.0%) |
| Construction & Extraction | 4 (100.0%) | 0 (0.0%) |
| Installation, Maintenance & Repair | 3 (100.0%) | 0 (0.0%) |
| Total (Category) | 7 (100.0%) | 0 (0.0%) |
| Total (Overall) | 29 (36.2%) | 51 (63.7%) |
Production, Transportation and Moving Occupations
The most common Production, Transportation and Moving occupations in Waterloo are Production (13 | 16.3%), and Transportation (3 | 3.7%).
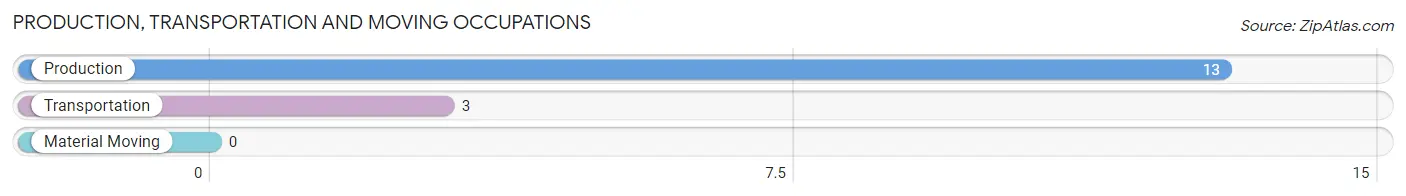
Production, Transportation and Moving Occupations by Sex
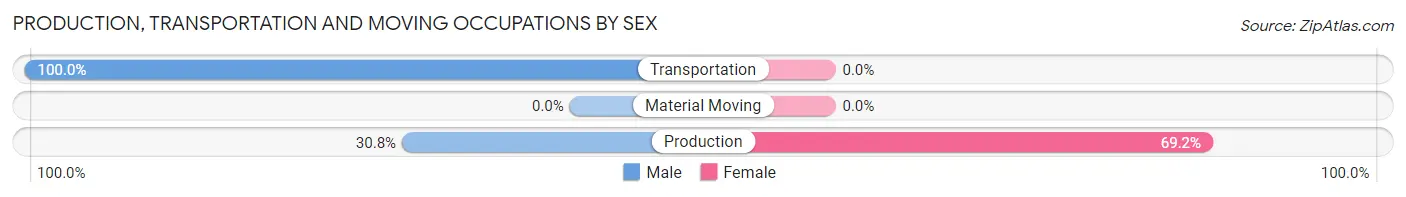
| Occupation | Male | Female |
| Production | 4 (30.8%) | 9 (69.2%) |
| Transportation | 3 (100.0%) | 0 (0.0%) |
| Material Moving | 0 (0.0%) | 0 (0.0%) |
| Total (Category) | 7 (43.8%) | 9 (56.2%) |
| Total (Overall) | 29 (36.2%) | 51 (63.7%) |
Employment Industries by Sex in Waterloo
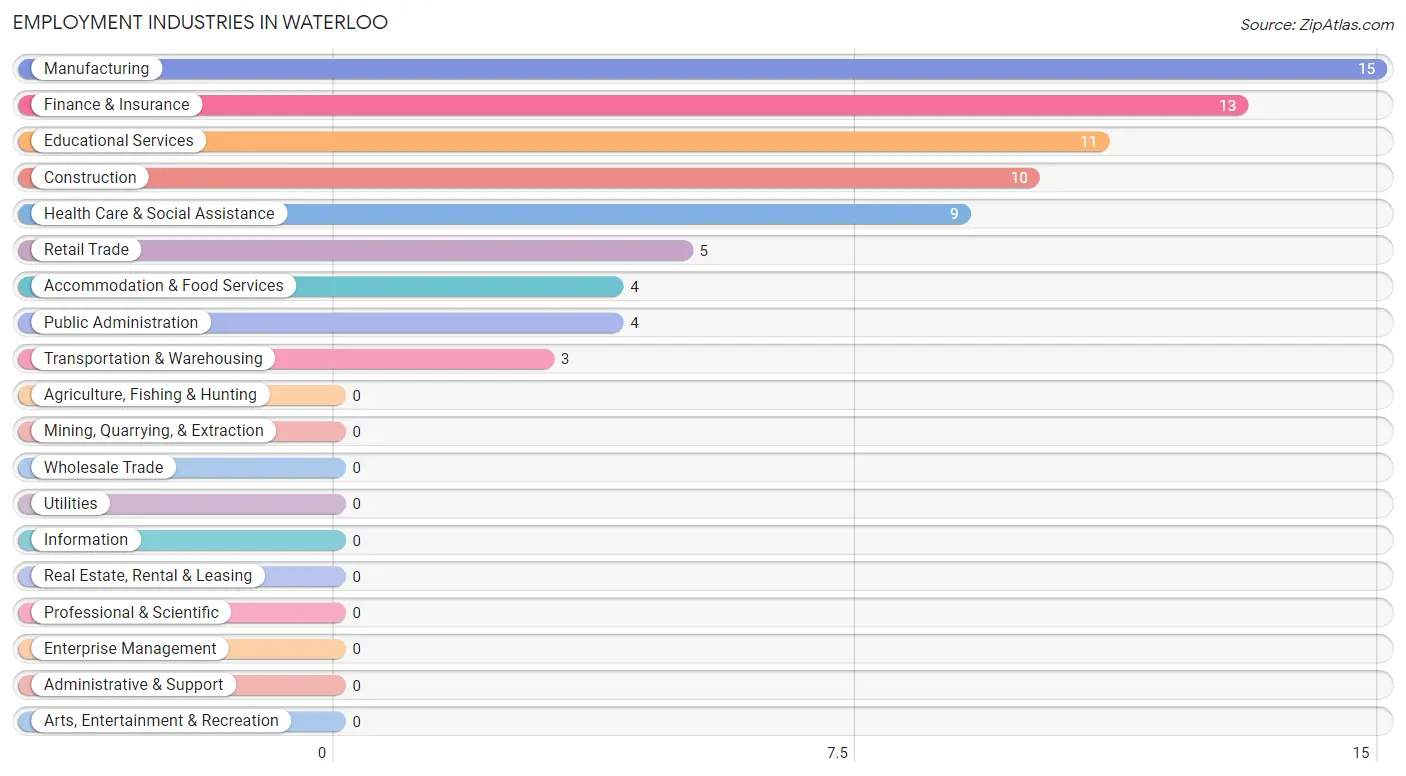
Employment Industries in Waterloo
The major employment industries in Waterloo include Manufacturing (15 | 18.8%), Finance & Insurance (13 | 16.3%), Educational Services (11 | 13.8%), Construction (10 | 12.5%), and Health Care & Social Assistance (9 | 11.3%).
Employment Industries by Sex in Waterloo
The Waterloo industries that see more men than women are Construction (100.0%), Transportation & Warehousing (100.0%), and Accommodation & Food Services (100.0%), whereas the industries that tend to have a higher number of women are Finance & Insurance (100.0%), Health Care & Social Assistance (100.0%), and Public Administration (100.0%).
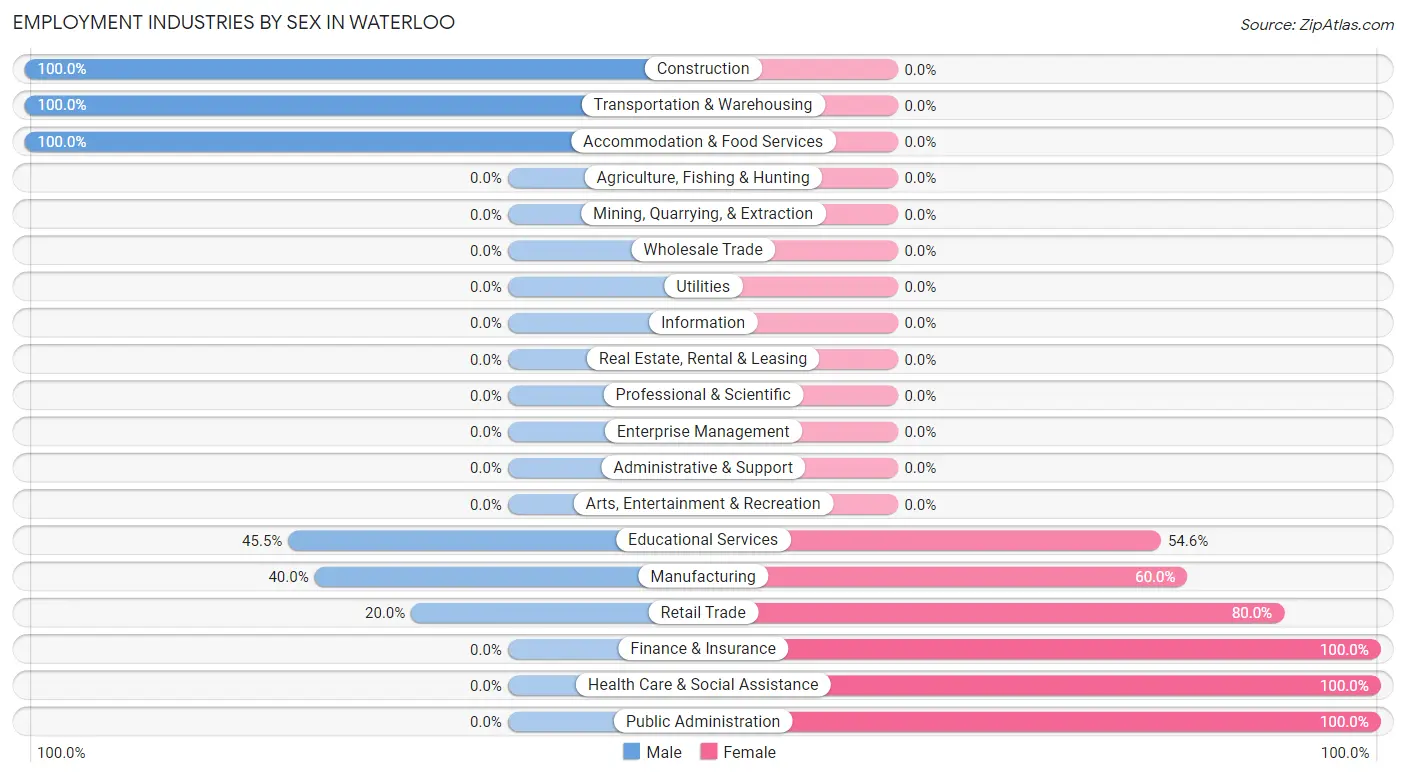
| Industry | Male | Female |
| Agriculture, Fishing & Hunting | 0 (0.0%) | 0 (0.0%) |
| Mining, Quarrying, & Extraction | 0 (0.0%) | 0 (0.0%) |
| Construction | 10 (100.0%) | 0 (0.0%) |
| Manufacturing | 6 (40.0%) | 9 (60.0%) |
| Wholesale Trade | 0 (0.0%) | 0 (0.0%) |
| Retail Trade | 1 (20.0%) | 4 (80.0%) |
| Transportation & Warehousing | 3 (100.0%) | 0 (0.0%) |
| Utilities | 0 (0.0%) | 0 (0.0%) |
| Information | 0 (0.0%) | 0 (0.0%) |
| Finance & Insurance | 0 (0.0%) | 13 (100.0%) |
| Real Estate, Rental & Leasing | 0 (0.0%) | 0 (0.0%) |
| Professional & Scientific | 0 (0.0%) | 0 (0.0%) |
| Enterprise Management | 0 (0.0%) | 0 (0.0%) |
| Administrative & Support | 0 (0.0%) | 0 (0.0%) |
| Educational Services | 5 (45.5%) | 6 (54.5%) |
| Health Care & Social Assistance | 0 (0.0%) | 9 (100.0%) |
| Arts, Entertainment & Recreation | 0 (0.0%) | 0 (0.0%) |
| Accommodation & Food Services | 4 (100.0%) | 0 (0.0%) |
| Public Administration | 0 (0.0%) | 4 (100.0%) |
| Total | 29 (36.2%) | 51 (63.7%) |
Education in Waterloo
School Enrollment in Waterloo
The most common levels of schooling among the 59 students in Waterloo are elementary school (19 | 32.2%), college / undergraduate (14 | 23.7%), and kindergarten (13 | 22.0%).
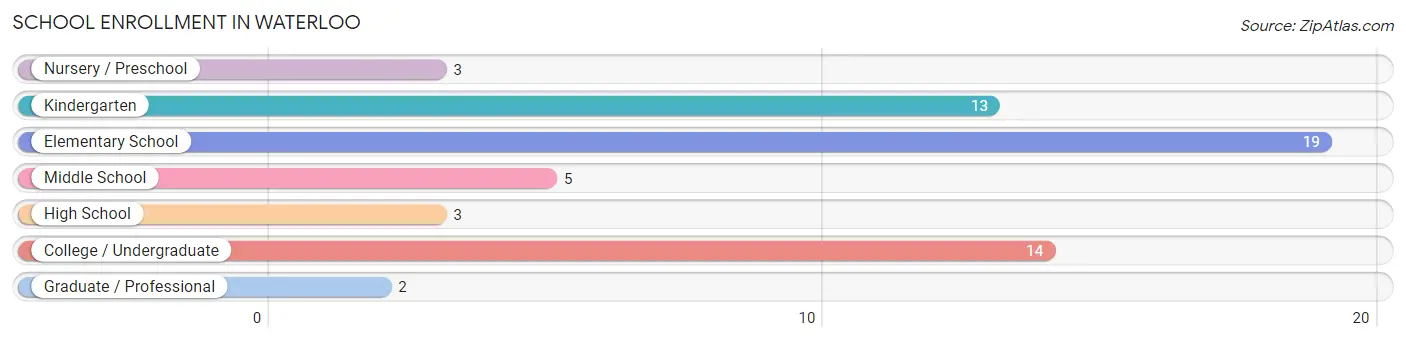
| School Level | # Students | % Students |
| Nursery / Preschool | 3 | 5.1% |
| Kindergarten | 13 | 22.0% |
| Elementary School | 19 | 32.2% |
| Middle School | 5 | 8.5% |
| High School | 3 | 5.1% |
| College / Undergraduate | 14 | 23.7% |
| Graduate / Professional | 2 | 3.4% |
| Total | 59 | 100.0% |
School Enrollment by Age by Funding Source in Waterloo
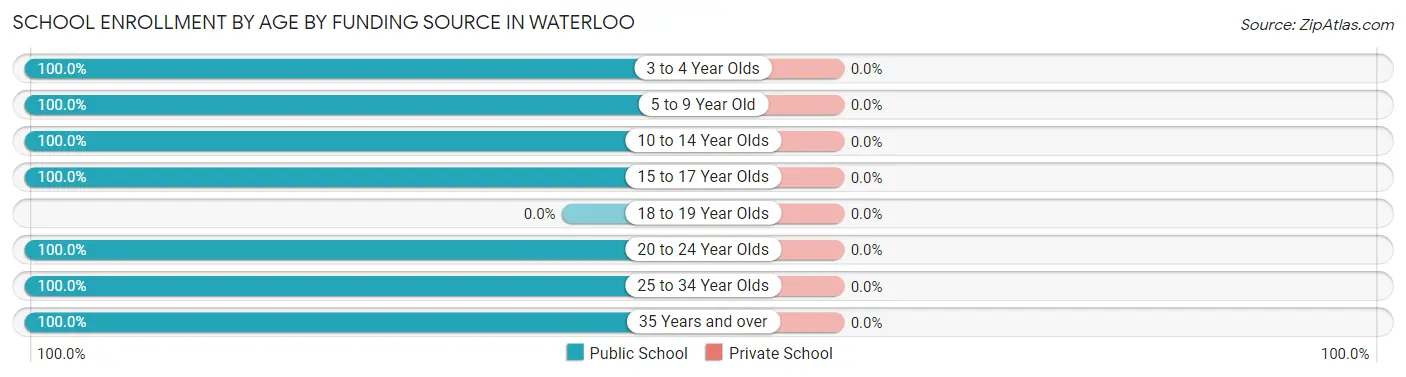
| Age Bracket | Public School | Private School |
| 3 to 4 Year Olds | 13 (100.0%) | 0 (0.0%) |
| 5 to 9 Year Old | 16 (100.0%) | 0 (0.0%) |
| 10 to 14 Year Olds | 11 (100.0%) | 0 (0.0%) |
| 15 to 17 Year Olds | 3 (100.0%) | 0 (0.0%) |
| 18 to 19 Year Olds | 0 (0.0%) | 0 (0.0%) |
| 20 to 24 Year Olds | 2 (100.0%) | 0 (0.0%) |
| 25 to 34 Year Olds | 8 (100.0%) | 0 (0.0%) |
| 35 Years and over | 6 (100.0%) | 0 (0.0%) |
| Total | 59 (100.0%) | 0 (0.0%) |
Educational Attainment by Field of Study in Waterloo
Science & technology (25 | 41.7%), arts & humanities (21 | 35.0%), education (6 | 10.0%), literature & languages (5 | 8.3%), and computers & mathematics (1 | 1.7%) are the most common fields of study among 60 individuals in Waterloo who have obtained a bachelor's degree or higher.
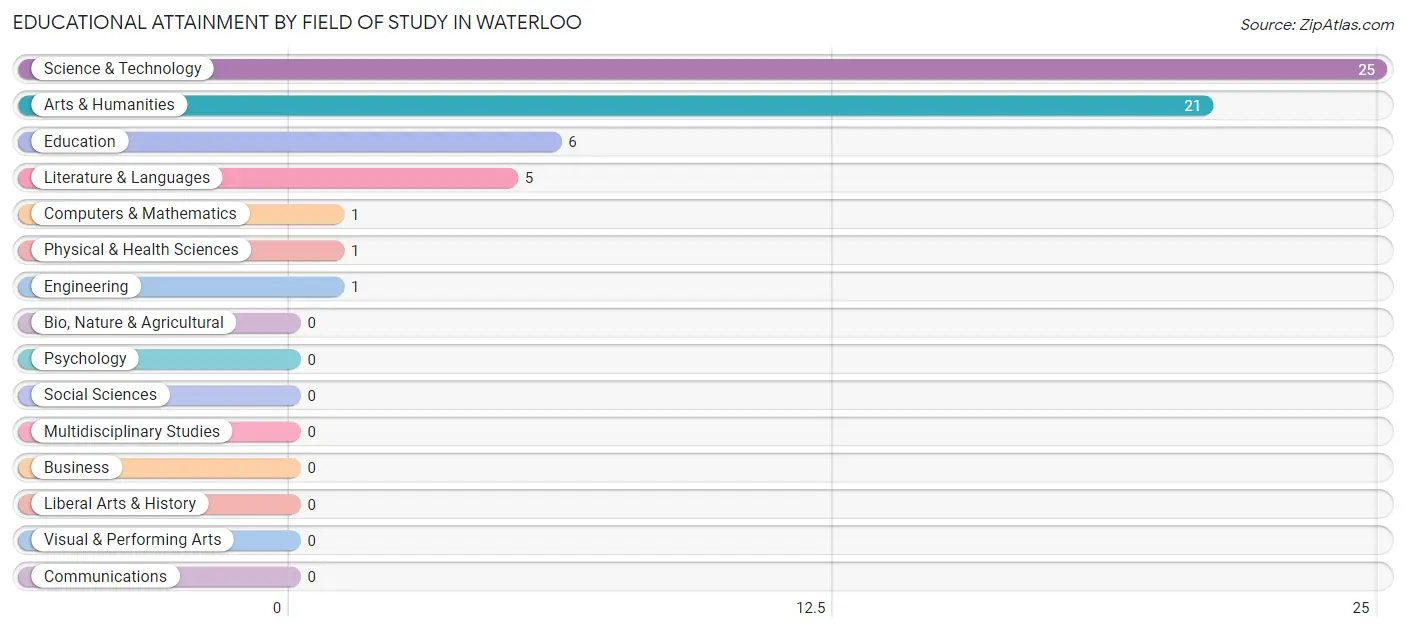
| Field of Study | # Graduates | % Graduates |
| Computers & Mathematics | 1 | 1.7% |
| Bio, Nature & Agricultural | 0 | 0.0% |
| Physical & Health Sciences | 1 | 1.7% |
| Psychology | 0 | 0.0% |
| Social Sciences | 0 | 0.0% |
| Engineering | 1 | 1.7% |
| Multidisciplinary Studies | 0 | 0.0% |
| Science & Technology | 25 | 41.7% |
| Business | 0 | 0.0% |
| Education | 6 | 10.0% |
| Literature & Languages | 5 | 8.3% |
| Liberal Arts & History | 0 | 0.0% |
| Visual & Performing Arts | 0 | 0.0% |
| Communications | 0 | 0.0% |
| Arts & Humanities | 21 | 35.0% |
| Total | 60 | 100.0% |
Transportation & Commute in Waterloo
Vehicle Availability by Sex in Waterloo
The most prevalent vehicle ownership categories in Waterloo are males with 2 vehicles (12, accounting for 41.4%) and females with 2 vehicles (22, making up 23.5%).
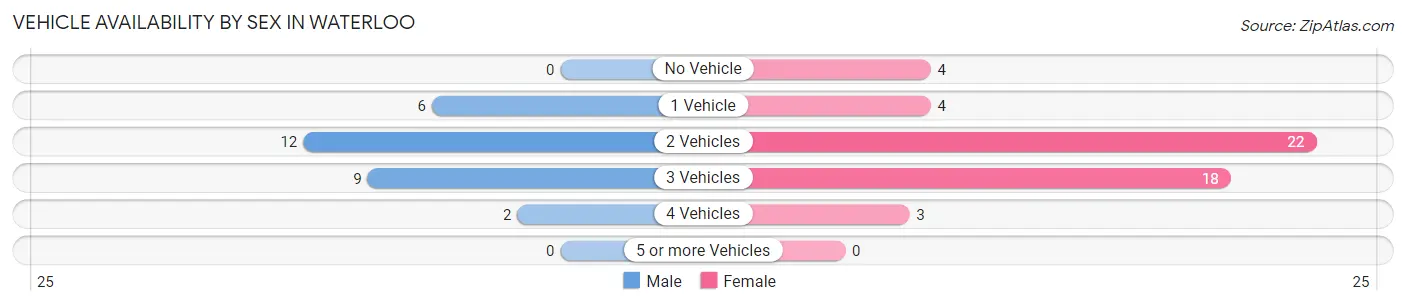
| Vehicles Available | Male | Female |
| No Vehicle | 0 (0.0%) | 4 (7.8%) |
| 1 Vehicle | 6 (20.7%) | 4 (7.8%) |
| 2 Vehicles | 12 (41.4%) | 22 (43.1%) |
| 3 Vehicles | 9 (31.0%) | 18 (35.3%) |
| 4 Vehicles | 2 (6.9%) | 3 (5.9%) |
| 5 or more Vehicles | 0 (0.0%) | 0 (0.0%) |
| Total | 29 (100.0%) | 51 (100.0%) |
Commute Time in Waterloo
The most frequently occuring commute durations in Waterloo are 45 to 59 minutes (20 commuters, 25.0%), 60 to 89 minutes (13 commuters, 16.3%), and 15 to 19 minutes (11 commuters, 13.8%).
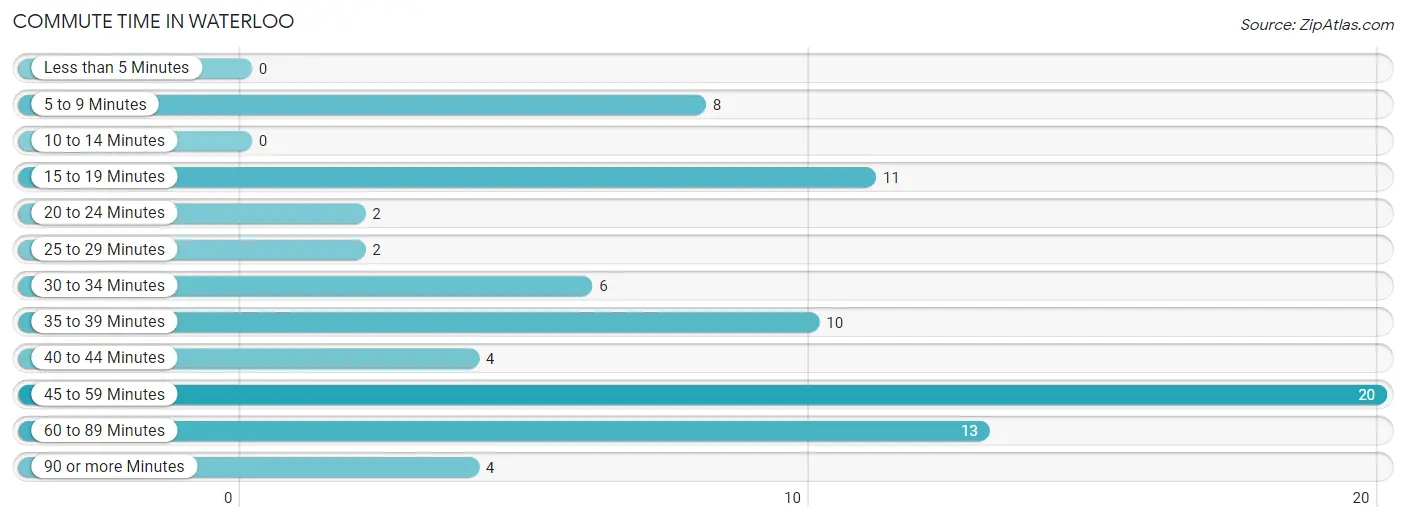
| Commute Time | # Commuters | % Commuters |
| Less than 5 Minutes | 0 | 0.0% |
| 5 to 9 Minutes | 8 | 10.0% |
| 10 to 14 Minutes | 0 | 0.0% |
| 15 to 19 Minutes | 11 | 13.8% |
| 20 to 24 Minutes | 2 | 2.5% |
| 25 to 29 Minutes | 2 | 2.5% |
| 30 to 34 Minutes | 6 | 7.5% |
| 35 to 39 Minutes | 10 | 12.5% |
| 40 to 44 Minutes | 4 | 5.0% |
| 45 to 59 Minutes | 20 | 25.0% |
| 60 to 89 Minutes | 13 | 16.3% |
| 90 or more Minutes | 4 | 5.0% |
Commute Time by Sex in Waterloo
The most common commute times in Waterloo are 15 to 19 minutes (9 commuters, 31.0%) for males and 45 to 59 minutes (16 commuters, 31.4%) for females.
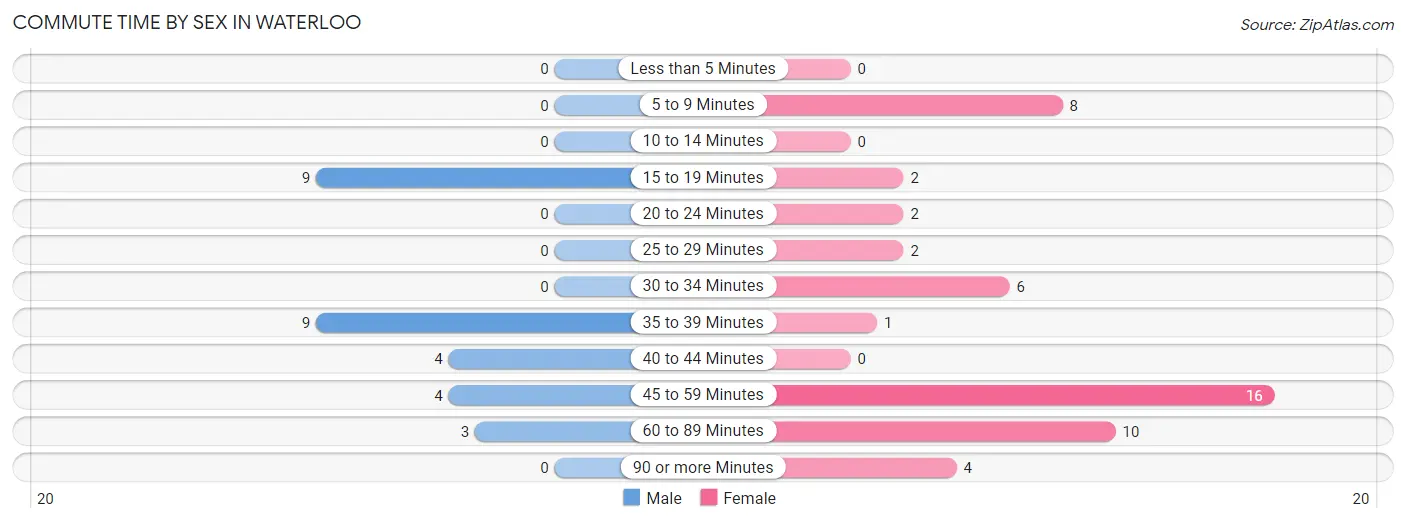
| Commute Time | Male | Female |
| Less than 5 Minutes | 0 (0.0%) | 0 (0.0%) |
| 5 to 9 Minutes | 0 (0.0%) | 8 (15.7%) |
| 10 to 14 Minutes | 0 (0.0%) | 0 (0.0%) |
| 15 to 19 Minutes | 9 (31.0%) | 2 (3.9%) |
| 20 to 24 Minutes | 0 (0.0%) | 2 (3.9%) |
| 25 to 29 Minutes | 0 (0.0%) | 2 (3.9%) |
| 30 to 34 Minutes | 0 (0.0%) | 6 (11.8%) |
| 35 to 39 Minutes | 9 (31.0%) | 1 (2.0%) |
| 40 to 44 Minutes | 4 (13.8%) | 0 (0.0%) |
| 45 to 59 Minutes | 4 (13.8%) | 16 (31.4%) |
| 60 to 89 Minutes | 3 (10.3%) | 10 (19.6%) |
| 90 or more Minutes | 0 (0.0%) | 4 (7.8%) |
Time of Departure to Work by Sex in Waterloo
The most frequent times of departure to work in Waterloo are 8:00 AM to 8:29 AM (7, 24.1%) for males and 6:00 AM to 6:29 AM (17, 33.3%) for females.
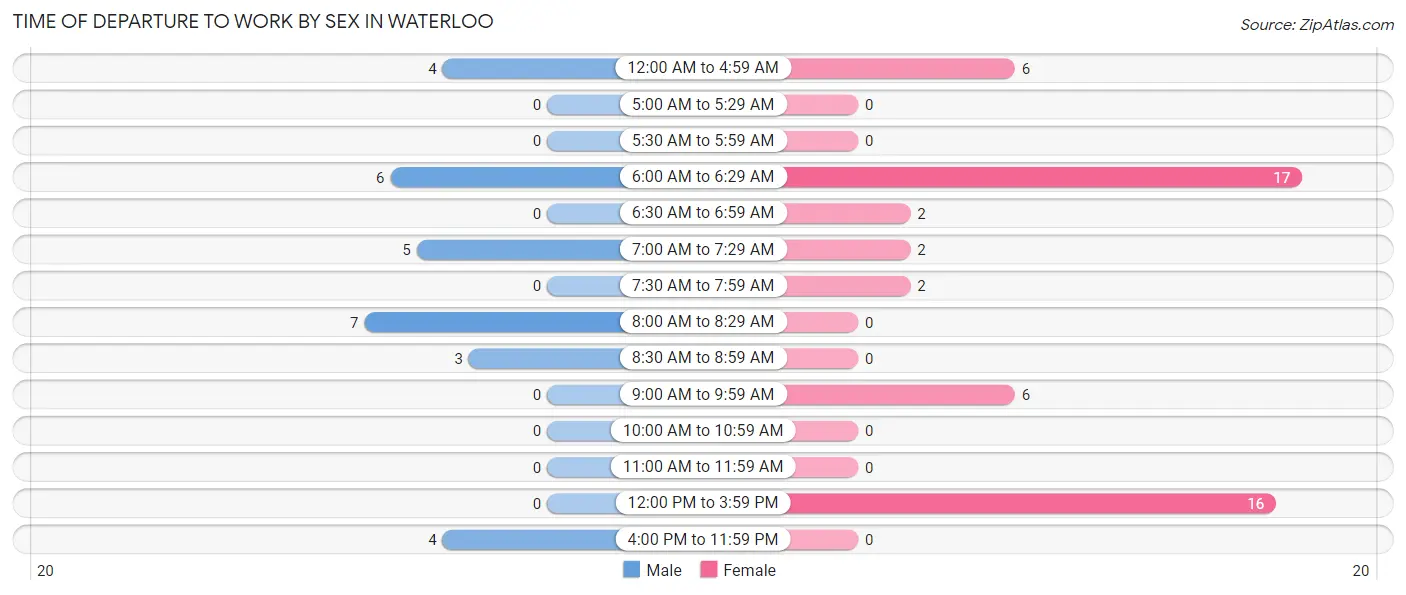
| Time of Departure | Male | Female |
| 12:00 AM to 4:59 AM | 4 (13.8%) | 6 (11.8%) |
| 5:00 AM to 5:29 AM | 0 (0.0%) | 0 (0.0%) |
| 5:30 AM to 5:59 AM | 0 (0.0%) | 0 (0.0%) |
| 6:00 AM to 6:29 AM | 6 (20.7%) | 17 (33.3%) |
| 6:30 AM to 6:59 AM | 0 (0.0%) | 2 (3.9%) |
| 7:00 AM to 7:29 AM | 5 (17.2%) | 2 (3.9%) |
| 7:30 AM to 7:59 AM | 0 (0.0%) | 2 (3.9%) |
| 8:00 AM to 8:29 AM | 7 (24.1%) | 0 (0.0%) |
| 8:30 AM to 8:59 AM | 3 (10.3%) | 0 (0.0%) |
| 9:00 AM to 9:59 AM | 0 (0.0%) | 6 (11.8%) |
| 10:00 AM to 10:59 AM | 0 (0.0%) | 0 (0.0%) |
| 11:00 AM to 11:59 AM | 0 (0.0%) | 0 (0.0%) |
| 12:00 PM to 3:59 PM | 0 (0.0%) | 16 (31.4%) |
| 4:00 PM to 11:59 PM | 4 (13.8%) | 0 (0.0%) |
| Total | 29 (100.0%) | 51 (100.0%) |
Housing Occupancy in Waterloo
Occupancy by Ownership in Waterloo
Of the total 90 dwellings in Waterloo, owner-occupied units account for 81 (90.0%), while renter-occupied units make up 9 (10.0%).
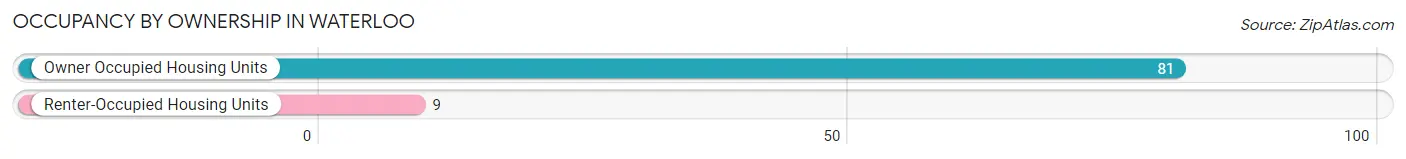
| Occupancy | # Housing Units | % Housing Units |
| Owner Occupied Housing Units | 81 | 90.0% |
| Renter-Occupied Housing Units | 9 | 10.0% |
| Total Occupied Housing Units | 90 | 100.0% |
Occupancy by Household Size in Waterloo
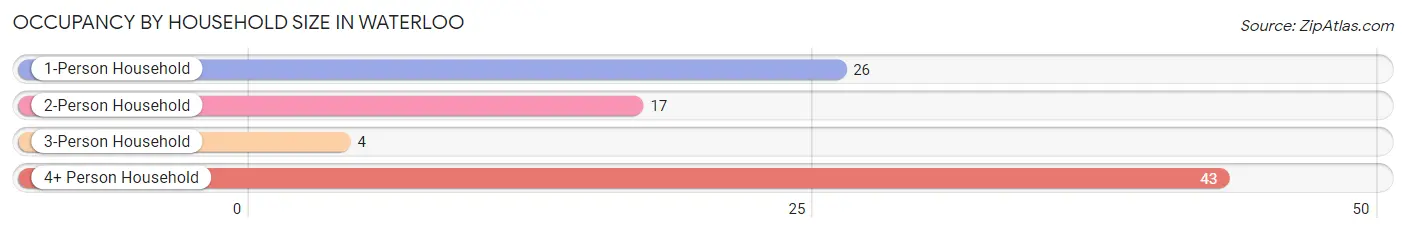
| Household Size | # Housing Units | % Housing Units |
| 1-Person Household | 26 | 28.9% |
| 2-Person Household | 17 | 18.9% |
| 3-Person Household | 4 | 4.4% |
| 4+ Person Household | 43 | 47.8% |
| Total Housing Units | 90 | 100.0% |
Occupancy by Ownership by Household Size in Waterloo
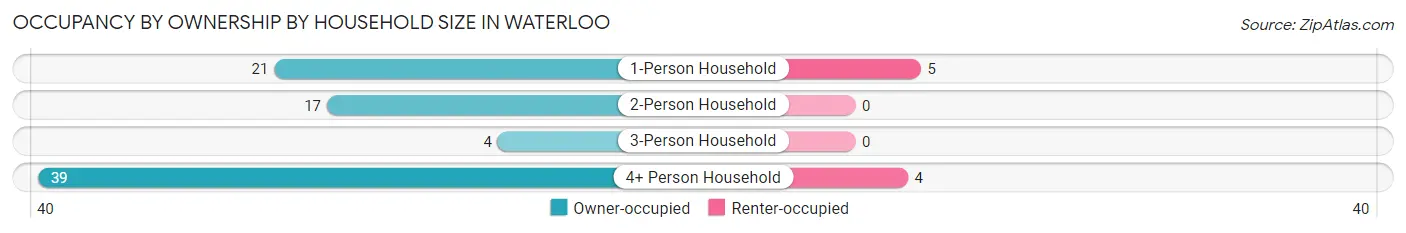
| Household Size | Owner-occupied | Renter-occupied |
| 1-Person Household | 21 (80.8%) | 5 (19.2%) |
| 2-Person Household | 17 (100.0%) | 0 (0.0%) |
| 3-Person Household | 4 (100.0%) | 0 (0.0%) |
| 4+ Person Household | 39 (90.7%) | 4 (9.3%) |
| Total Housing Units | 81 (90.0%) | 9 (10.0%) |
Occupancy by Educational Attainment in Waterloo
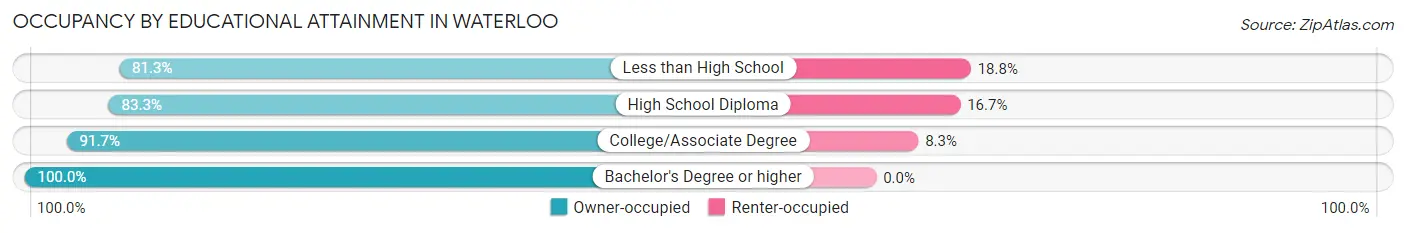
| Household Size | Owner-occupied | Renter-occupied |
| Less than High School | 13 (81.2%) | 3 (18.8%) |
| High School Diploma | 20 (83.3%) | 4 (16.7%) |
| College/Associate Degree | 22 (91.7%) | 2 (8.3%) |
| Bachelor's Degree or higher | 26 (100.0%) | 0 (0.0%) |
Occupancy by Age of Householder in Waterloo
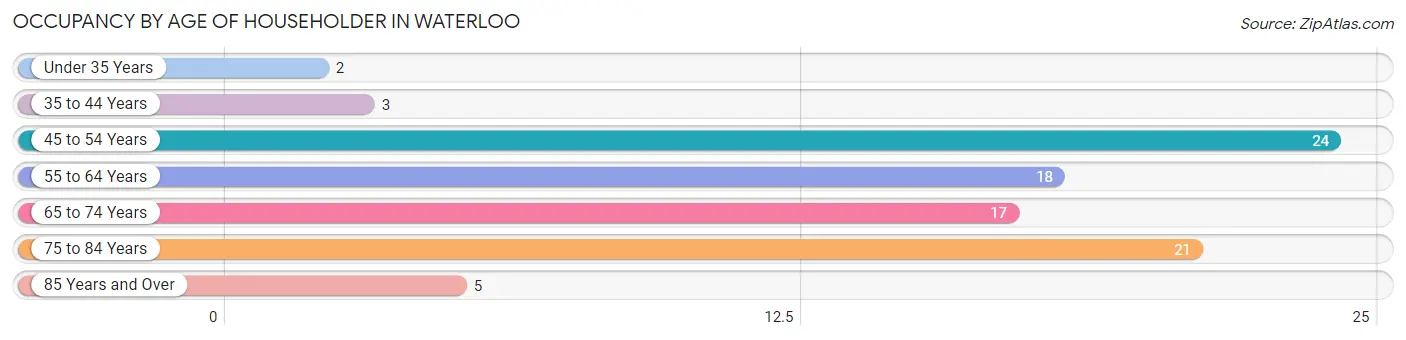
| Age Bracket | # Households | % Households |
| Under 35 Years | 2 | 2.2% |
| 35 to 44 Years | 3 | 3.3% |
| 45 to 54 Years | 24 | 26.7% |
| 55 to 64 Years | 18 | 20.0% |
| 65 to 74 Years | 17 | 18.9% |
| 75 to 84 Years | 21 | 23.3% |
| 85 Years and Over | 5 | 5.6% |
| Total | 90 | 100.0% |
Housing Finances in Waterloo
Median Income by Occupancy in Waterloo
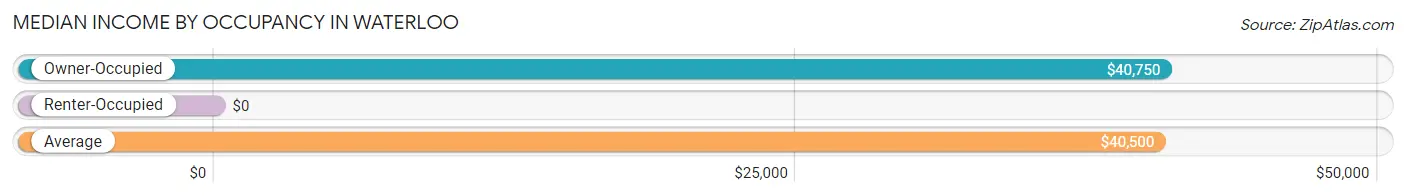
| Occupancy Type | # Households | Median Income |
| Owner-Occupied | 81 (90.0%) | $40,750 |
| Renter-Occupied | 9 (10.0%) | $0 |
| Average | 90 (100.0%) | $40,500 |
Occupancy by Householder Income Bracket in Waterloo
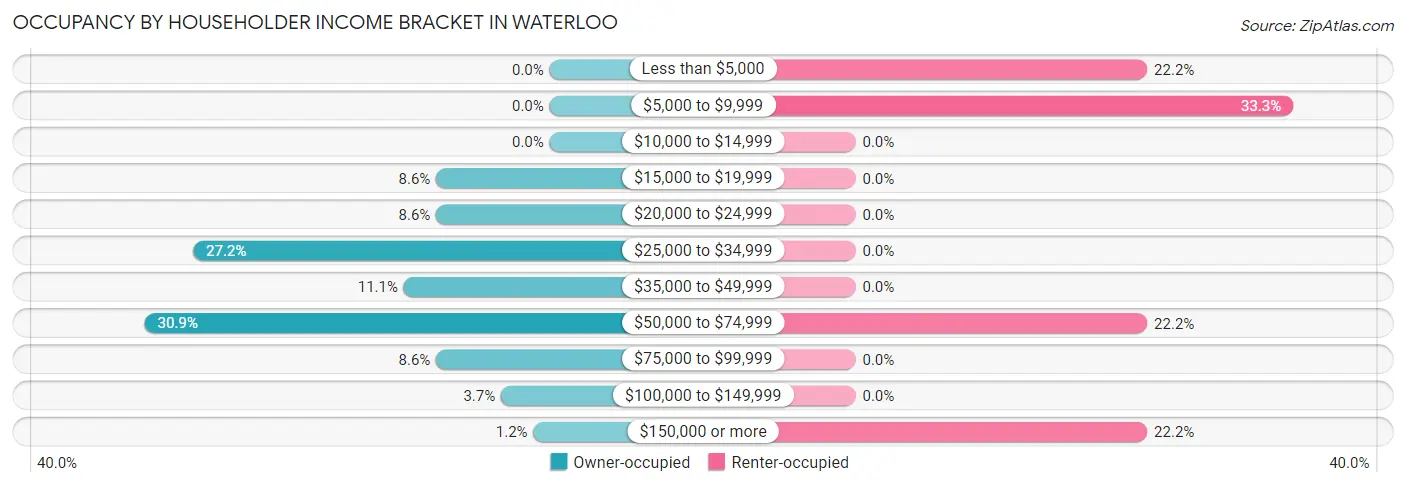
| Income Bracket | Owner-occupied | Renter-occupied |
| Less than $5,000 | 0 (0.0%) | 2 (22.2%) |
| $5,000 to $9,999 | 0 (0.0%) | 3 (33.3%) |
| $10,000 to $14,999 | 0 (0.0%) | 0 (0.0%) |
| $15,000 to $19,999 | 7 (8.6%) | 0 (0.0%) |
| $20,000 to $24,999 | 7 (8.6%) | 0 (0.0%) |
| $25,000 to $34,999 | 22 (27.2%) | 0 (0.0%) |
| $35,000 to $49,999 | 9 (11.1%) | 0 (0.0%) |
| $50,000 to $74,999 | 25 (30.9%) | 2 (22.2%) |
| $75,000 to $99,999 | 7 (8.6%) | 0 (0.0%) |
| $100,000 to $149,999 | 3 (3.7%) | 0 (0.0%) |
| $150,000 or more | 1 (1.2%) | 2 (22.2%) |
| Total | 81 (100.0%) | 9 (100.0%) |
Monthly Housing Cost Tiers in Waterloo
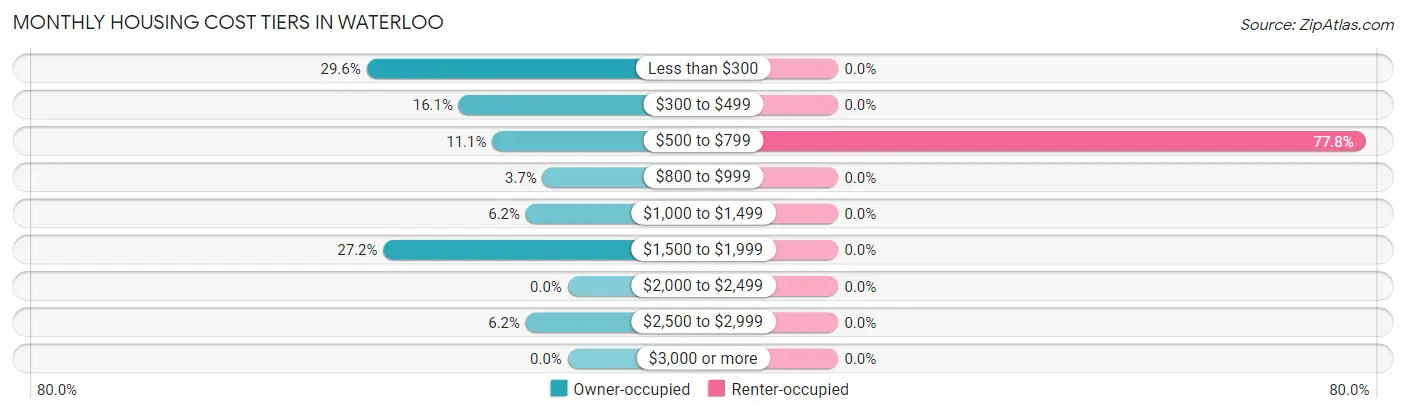
| Monthly Cost | Owner-occupied | Renter-occupied |
| Less than $300 | 24 (29.6%) | 0 (0.0%) |
| $300 to $499 | 13 (16.1%) | 0 (0.0%) |
| $500 to $799 | 9 (11.1%) | 7 (77.8%) |
| $800 to $999 | 3 (3.7%) | 0 (0.0%) |
| $1,000 to $1,499 | 5 (6.2%) | 0 (0.0%) |
| $1,500 to $1,999 | 22 (27.2%) | 0 (0.0%) |
| $2,000 to $2,499 | 0 (0.0%) | 0 (0.0%) |
| $2,500 to $2,999 | 5 (6.2%) | 0 (0.0%) |
| $3,000 or more | 0 (0.0%) | 0 (0.0%) |
| Total | 81 (100.0%) | 9 (100.0%) |
Physical Housing Characteristics in Waterloo
Housing Structures in Waterloo
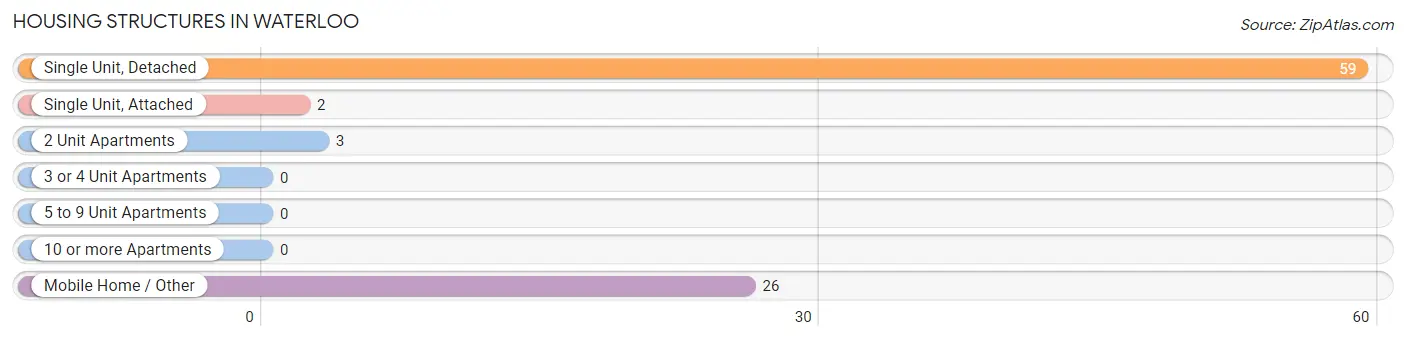
| Structure Type | # Housing Units | % Housing Units |
| Single Unit, Detached | 59 | 65.6% |
| Single Unit, Attached | 2 | 2.2% |
| 2 Unit Apartments | 3 | 3.3% |
| 3 or 4 Unit Apartments | 0 | 0.0% |
| 5 to 9 Unit Apartments | 0 | 0.0% |
| 10 or more Apartments | 0 | 0.0% |
| Mobile Home / Other | 26 | 28.9% |
| Total | 90 | 100.0% |
Housing Structures by Occupancy in Waterloo
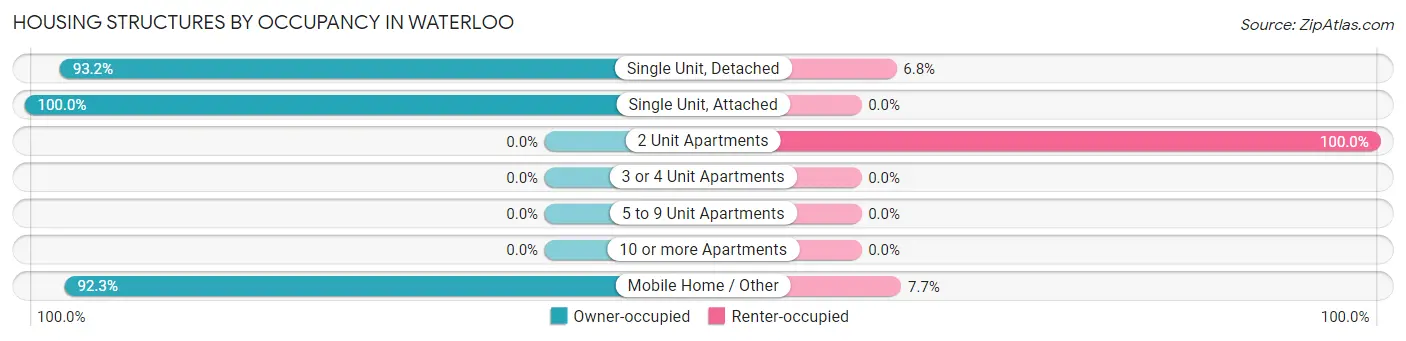
| Structure Type | Owner-occupied | Renter-occupied |
| Single Unit, Detached | 55 (93.2%) | 4 (6.8%) |
| Single Unit, Attached | 2 (100.0%) | 0 (0.0%) |
| 2 Unit Apartments | 0 (0.0%) | 3 (100.0%) |
| 3 or 4 Unit Apartments | 0 (0.0%) | 0 (0.0%) |
| 5 to 9 Unit Apartments | 0 (0.0%) | 0 (0.0%) |
| 10 or more Apartments | 0 (0.0%) | 0 (0.0%) |
| Mobile Home / Other | 24 (92.3%) | 2 (7.7%) |
| Total | 81 (90.0%) | 9 (10.0%) |
Housing Structures by Number of Rooms in Waterloo
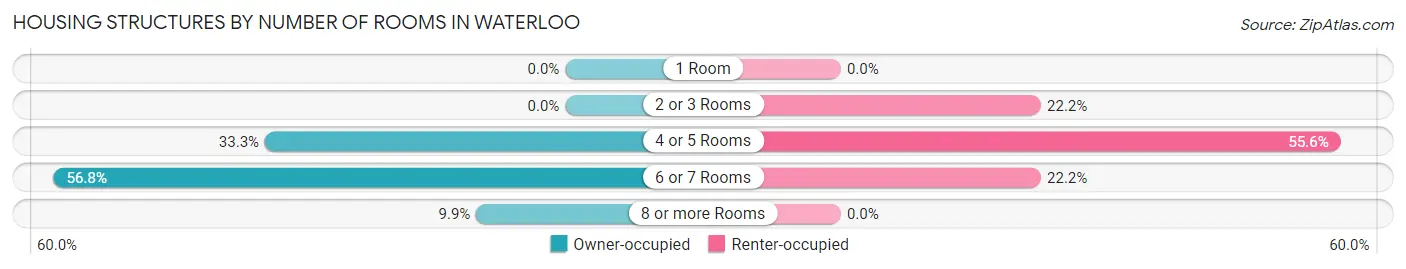
| Number of Rooms | Owner-occupied | Renter-occupied |
| 1 Room | 0 (0.0%) | 0 (0.0%) |
| 2 or 3 Rooms | 0 (0.0%) | 2 (22.2%) |
| 4 or 5 Rooms | 27 (33.3%) | 5 (55.6%) |
| 6 or 7 Rooms | 46 (56.8%) | 2 (22.2%) |
| 8 or more Rooms | 8 (9.9%) | 0 (0.0%) |
| Total | 81 (100.0%) | 9 (100.0%) |
Housing Structure by Heating Type in Waterloo
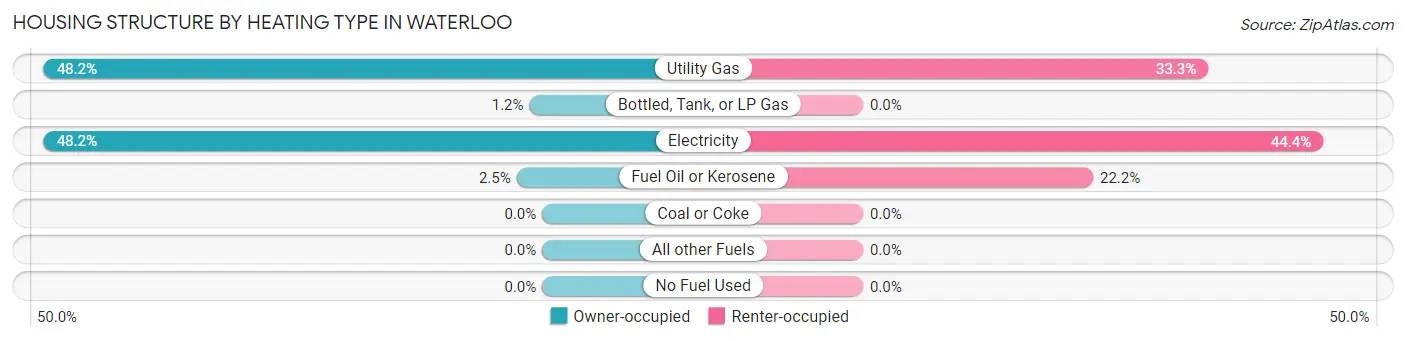
| Heating Type | Owner-occupied | Renter-occupied |
| Utility Gas | 39 (48.1%) | 3 (33.3%) |
| Bottled, Tank, or LP Gas | 1 (1.2%) | 0 (0.0%) |
| Electricity | 39 (48.1%) | 4 (44.4%) |
| Fuel Oil or Kerosene | 2 (2.5%) | 2 (22.2%) |
| Coal or Coke | 0 (0.0%) | 0 (0.0%) |
| All other Fuels | 0 (0.0%) | 0 (0.0%) |
| No Fuel Used | 0 (0.0%) | 0 (0.0%) |
| Total | 81 (100.0%) | 9 (100.0%) |
Household Vehicle Usage in Waterloo
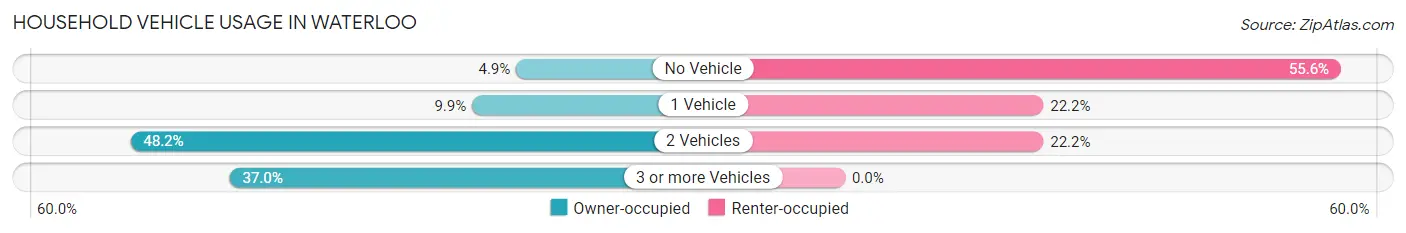
| Vehicles per Household | Owner-occupied | Renter-occupied |
| No Vehicle | 4 (4.9%) | 5 (55.6%) |
| 1 Vehicle | 8 (9.9%) | 2 (22.2%) |
| 2 Vehicles | 39 (48.1%) | 2 (22.2%) |
| 3 or more Vehicles | 30 (37.0%) | 0 (0.0%) |
| Total | 81 (100.0%) | 9 (100.0%) |
Real Estate & Mortgages in Waterloo
Real Estate and Mortgage Overview in Waterloo
| Characteristic | Without Mortgage | With Mortgage |
| Housing Units | 41 | 40 |
| Median Property Value | - | - |
| Median Household Income | $33,456 | $1 |
| Monthly Housing Costs | - | - |
| Real Estate Taxes | $199 | $0 |
Property Value by Mortgage Status in Waterloo
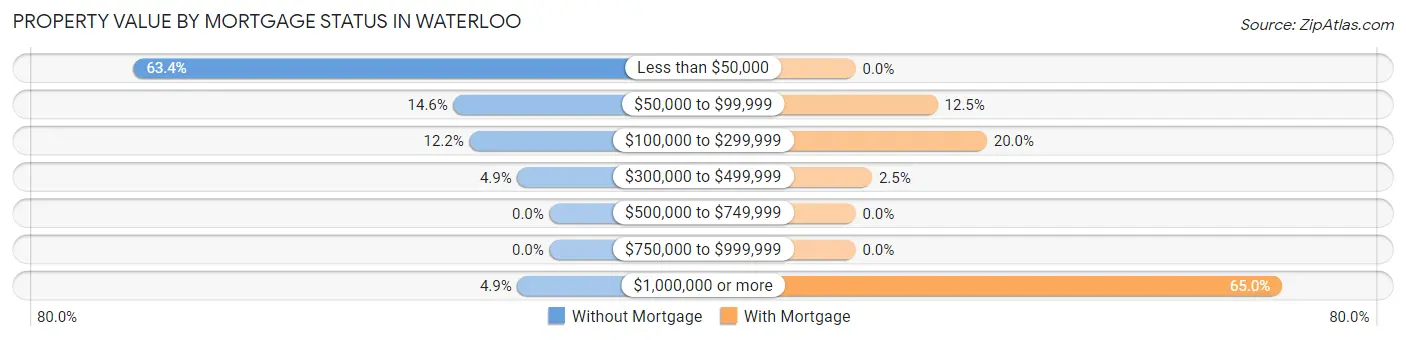
| Property Value | Without Mortgage | With Mortgage |
| Less than $50,000 | 26 (63.4%) | 0 (0.0%) |
| $50,000 to $99,999 | 6 (14.6%) | 5 (12.5%) |
| $100,000 to $299,999 | 5 (12.2%) | 8 (20.0%) |
| $300,000 to $499,999 | 2 (4.9%) | 1 (2.5%) |
| $500,000 to $749,999 | 0 (0.0%) | 0 (0.0%) |
| $750,000 to $999,999 | 0 (0.0%) | 0 (0.0%) |
| $1,000,000 or more | 2 (4.9%) | 26 (65.0%) |
| Total | 41 (100.0%) | 40 (100.0%) |
Household Income by Mortgage Status in Waterloo
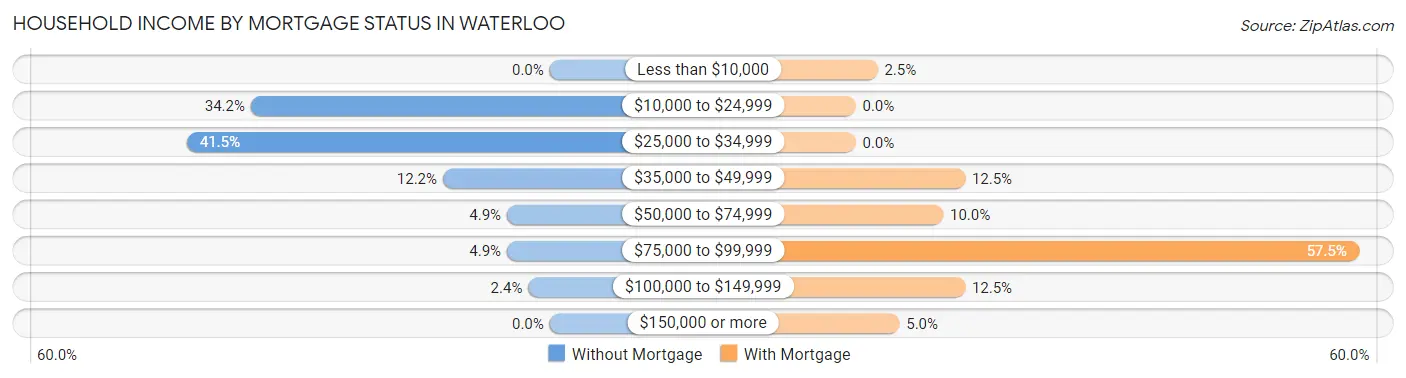
| Household Income | Without Mortgage | With Mortgage |
| Less than $10,000 | 0 (0.0%) | 1 (2.5%) |
| $10,000 to $24,999 | 14 (34.2%) | 0 (0.0%) |
| $25,000 to $34,999 | 17 (41.5%) | 0 (0.0%) |
| $35,000 to $49,999 | 5 (12.2%) | 5 (12.5%) |
| $50,000 to $74,999 | 2 (4.9%) | 4 (10.0%) |
| $75,000 to $99,999 | 2 (4.9%) | 23 (57.5%) |
| $100,000 to $149,999 | 1 (2.4%) | 5 (12.5%) |
| $150,000 or more | 0 (0.0%) | 2 (5.0%) |
| Total | 41 (100.0%) | 40 (100.0%) |
Property Value to Household Income Ratio in Waterloo
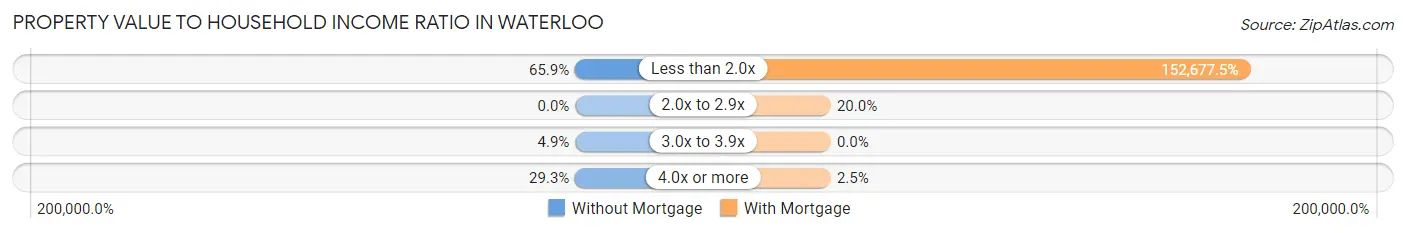
| Value-to-Income Ratio | Without Mortgage | With Mortgage |
| Less than 2.0x | 27 (65.8%) | 61,071 (152,677.5%) |
| 2.0x to 2.9x | 0 (0.0%) | 8 (20.0%) |
| 3.0x to 3.9x | 2 (4.9%) | 0 (0.0%) |
| 4.0x or more | 12 (29.3%) | 1 (2.5%) |
| Total | 41 (100.0%) | 40 (100.0%) |
Real Estate Taxes by Mortgage Status in Waterloo
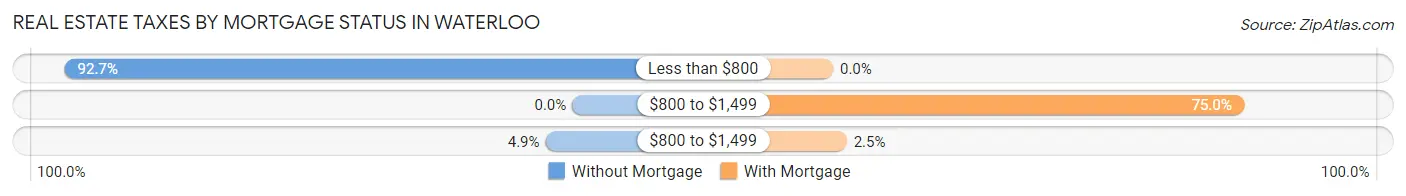
| Property Taxes | Without Mortgage | With Mortgage |
| Less than $800 | 38 (92.7%) | 0 (0.0%) |
| $800 to $1,499 | 0 (0.0%) | 30 (75.0%) |
| $800 to $1,499 | 2 (4.9%) | 1 (2.5%) |
| Total | 41 (100.0%) | 40 (100.0%) |
Health & Disability in Waterloo
Health Insurance Coverage by Age in Waterloo
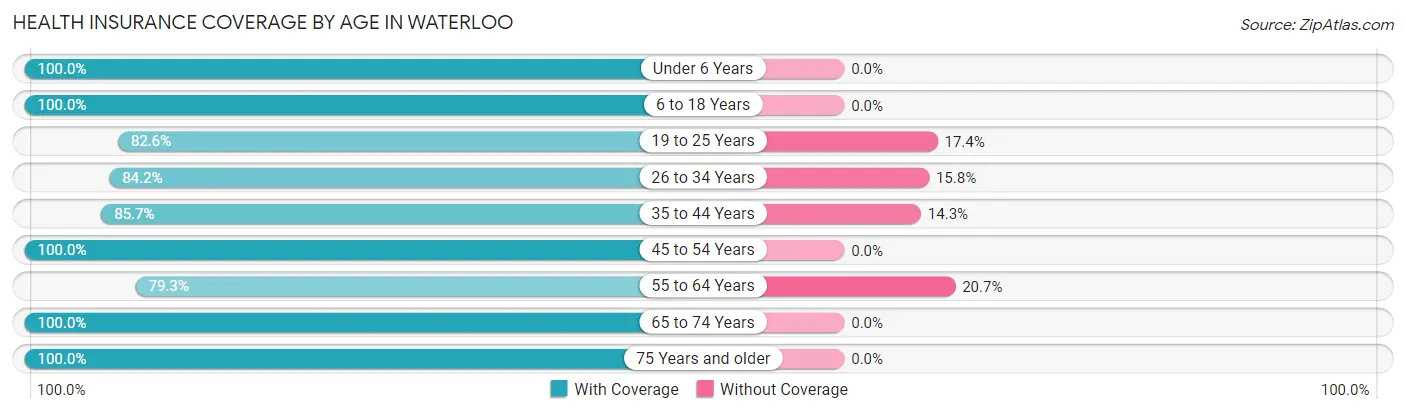
| Age Bracket | With Coverage | Without Coverage |
| Under 6 Years | 52 (100.0%) | 0 (0.0%) |
| 6 to 18 Years | 33 (100.0%) | 0 (0.0%) |
| 19 to 25 Years | 19 (82.6%) | 4 (17.4%) |
| 26 to 34 Years | 16 (84.2%) | 3 (15.8%) |
| 35 to 44 Years | 6 (85.7%) | 1 (14.3%) |
| 45 to 54 Years | 30 (100.0%) | 0 (0.0%) |
| 55 to 64 Years | 23 (79.3%) | 6 (20.7%) |
| 65 to 74 Years | 23 (100.0%) | 0 (0.0%) |
| 75 Years and older | 28 (100.0%) | 0 (0.0%) |
| Total | 230 (94.3%) | 14 (5.7%) |
Health Insurance Coverage by Citizenship Status in Waterloo
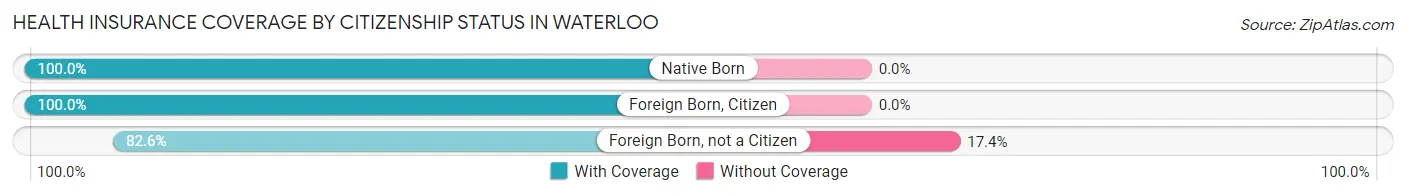
| Citizenship Status | With Coverage | Without Coverage |
| Native Born | 52 (100.0%) | 0 (0.0%) |
| Foreign Born, Citizen | 33 (100.0%) | 0 (0.0%) |
| Foreign Born, not a Citizen | 19 (82.6%) | 4 (17.4%) |
Health Insurance Coverage by Household Income in Waterloo
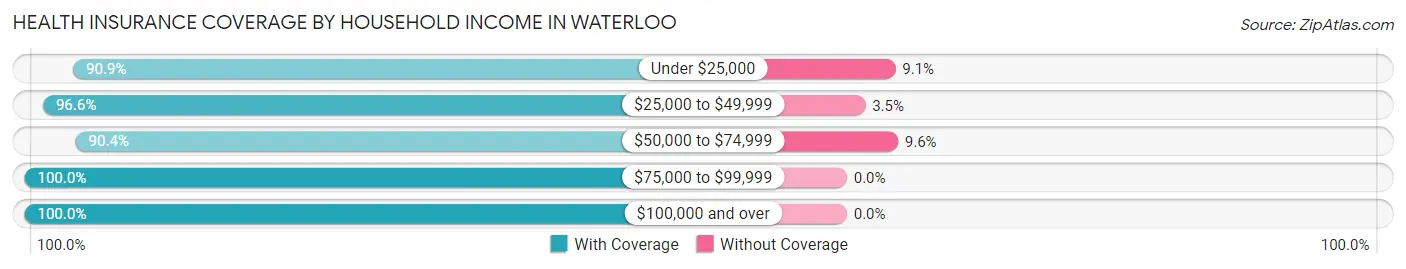
| Household Income | With Coverage | Without Coverage |
| Under $25,000 | 20 (90.9%) | 2 (9.1%) |
| $25,000 to $49,999 | 84 (96.6%) | 3 (3.5%) |
| $50,000 to $74,999 | 85 (90.4%) | 9 (9.6%) |
| $75,000 to $99,999 | 16 (100.0%) | 0 (0.0%) |
| $100,000 and over | 25 (100.0%) | 0 (0.0%) |
Public vs Private Health Insurance Coverage by Age in Waterloo
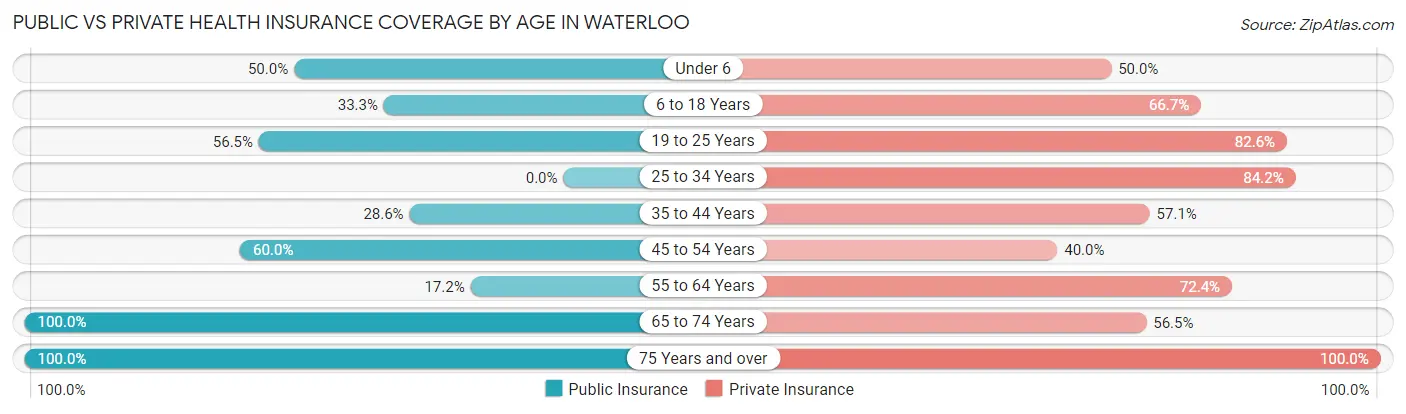
| Age Bracket | Public Insurance | Private Insurance |
| Under 6 | 26 (50.0%) | 26 (50.0%) |
| 6 to 18 Years | 11 (33.3%) | 22 (66.7%) |
| 19 to 25 Years | 13 (56.5%) | 19 (82.6%) |
| 25 to 34 Years | 0 (0.0%) | 16 (84.2%) |
| 35 to 44 Years | 2 (28.6%) | 4 (57.1%) |
| 45 to 54 Years | 18 (60.0%) | 12 (40.0%) |
| 55 to 64 Years | 5 (17.2%) | 21 (72.4%) |
| 65 to 74 Years | 23 (100.0%) | 13 (56.5%) |
| 75 Years and over | 28 (100.0%) | 28 (100.0%) |
| Total | 126 (51.6%) | 161 (66.0%) |
Disability Status by Sex by Age in Waterloo
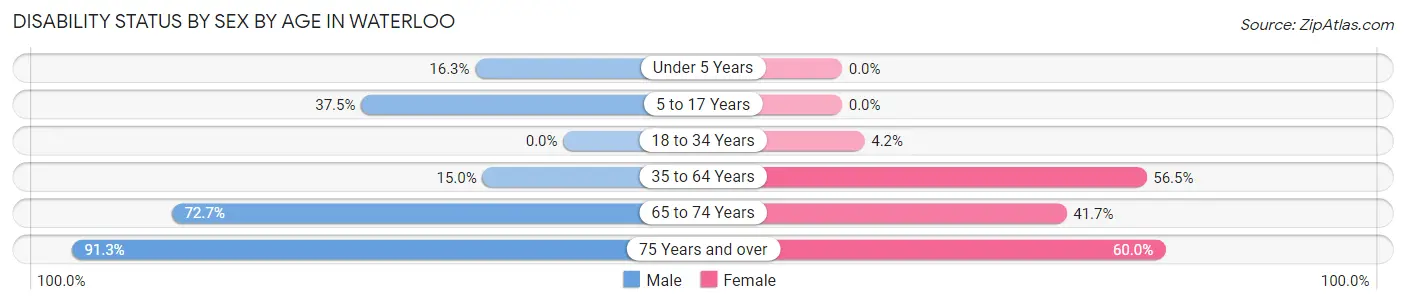
| Age Bracket | Male | Female |
| Under 5 Years | 8 (16.3%) | 0 (0.0%) |
| 5 to 17 Years | 3 (37.5%) | 0 (0.0%) |
| 18 to 34 Years | 0 (0.0%) | 1 (4.2%) |
| 35 to 64 Years | 3 (15.0%) | 26 (56.5%) |
| 65 to 74 Years | 8 (72.7%) | 5 (41.7%) |
| 75 Years and over | 21 (91.3%) | 3 (60.0%) |
Disability Class by Sex by Age in Waterloo
Disability Class: Hearing Difficulty
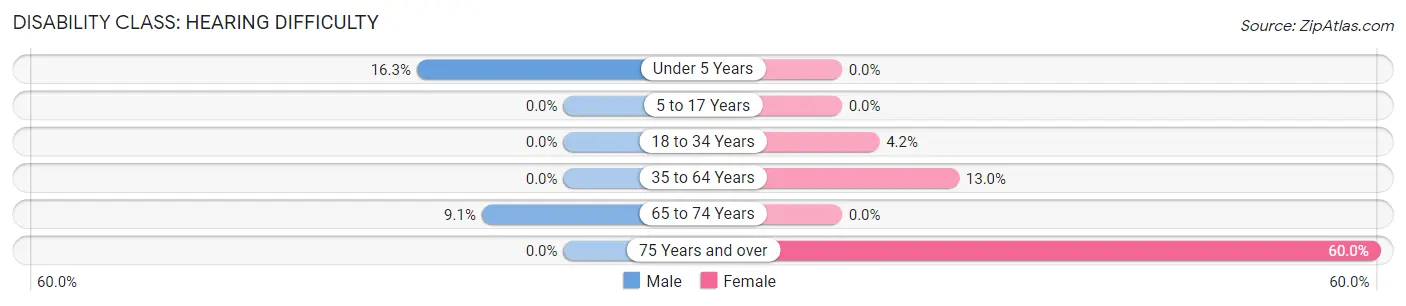
| Age Bracket | Male | Female |
| Under 5 Years | 8 (16.3%) | 0 (0.0%) |
| 5 to 17 Years | 0 (0.0%) | 0 (0.0%) |
| 18 to 34 Years | 0 (0.0%) | 1 (4.2%) |
| 35 to 64 Years | 0 (0.0%) | 6 (13.0%) |
| 65 to 74 Years | 1 (9.1%) | 0 (0.0%) |
| 75 Years and over | 0 (0.0%) | 3 (60.0%) |
Disability Class: Vision Difficulty
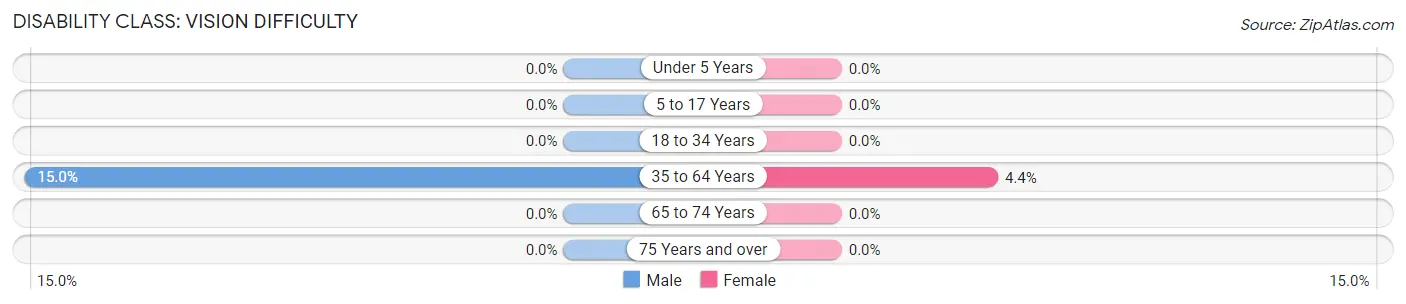
| Age Bracket | Male | Female |
| Under 5 Years | 0 (0.0%) | 0 (0.0%) |
| 5 to 17 Years | 0 (0.0%) | 0 (0.0%) |
| 18 to 34 Years | 0 (0.0%) | 0 (0.0%) |
| 35 to 64 Years | 3 (15.0%) | 2 (4.3%) |
| 65 to 74 Years | 0 (0.0%) | 0 (0.0%) |
| 75 Years and over | 0 (0.0%) | 0 (0.0%) |
Disability Class: Cognitive Difficulty
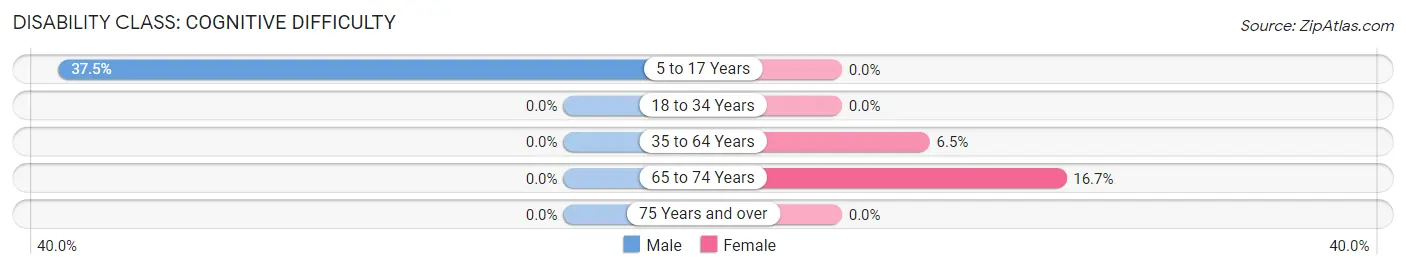
| Age Bracket | Male | Female |
| 5 to 17 Years | 3 (37.5%) | 0 (0.0%) |
| 18 to 34 Years | 0 (0.0%) | 0 (0.0%) |
| 35 to 64 Years | 0 (0.0%) | 3 (6.5%) |
| 65 to 74 Years | 0 (0.0%) | 2 (16.7%) |
| 75 Years and over | 0 (0.0%) | 0 (0.0%) |
Disability Class: Ambulatory Difficulty
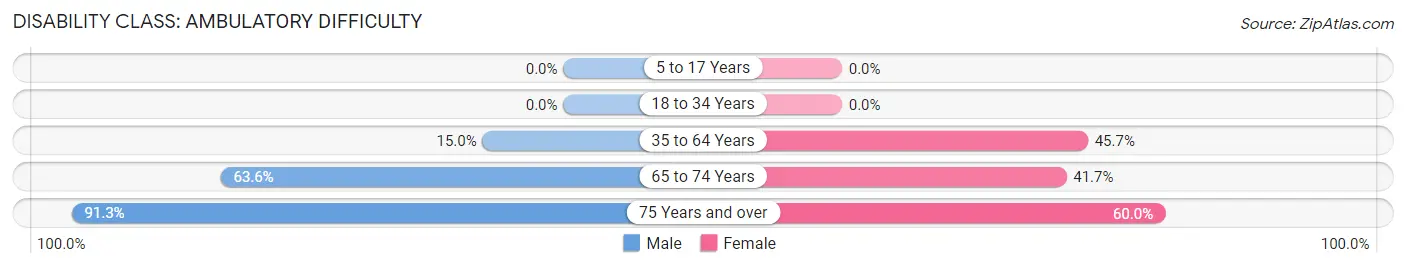
| Age Bracket | Male | Female |
| 5 to 17 Years | 0 (0.0%) | 0 (0.0%) |
| 18 to 34 Years | 0 (0.0%) | 0 (0.0%) |
| 35 to 64 Years | 3 (15.0%) | 21 (45.7%) |
| 65 to 74 Years | 7 (63.6%) | 5 (41.7%) |
| 75 Years and over | 21 (91.3%) | 3 (60.0%) |
Disability Class: Self-Care Difficulty
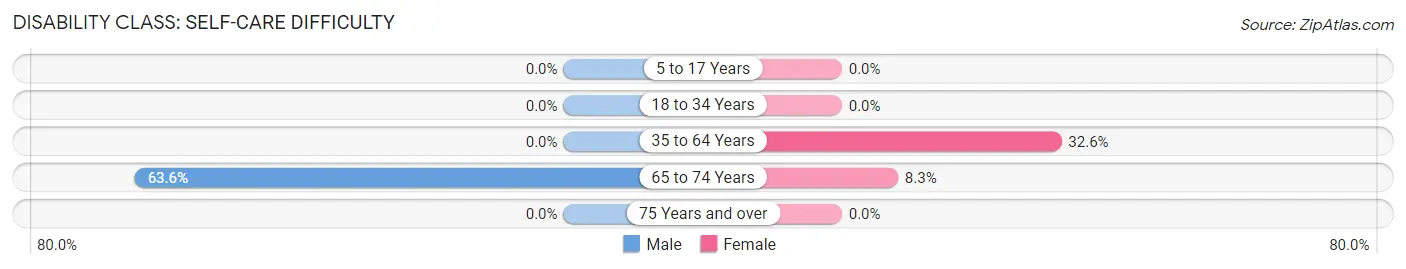
| Age Bracket | Male | Female |
| 5 to 17 Years | 0 (0.0%) | 0 (0.0%) |
| 18 to 34 Years | 0 (0.0%) | 0 (0.0%) |
| 35 to 64 Years | 0 (0.0%) | 15 (32.6%) |
| 65 to 74 Years | 7 (63.6%) | 1 (8.3%) |
| 75 Years and over | 0 (0.0%) | 0 (0.0%) |
Technology Access in Waterloo
Computing Device Access in Waterloo
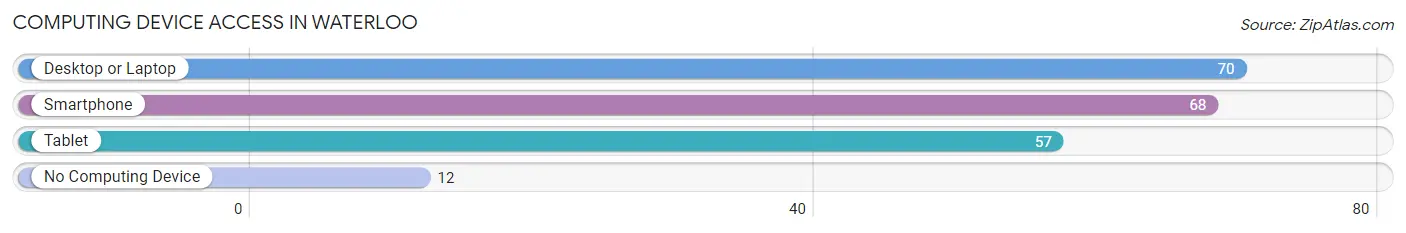
| Device Type | # Households | % Households |
| Desktop or Laptop | 70 | 77.8% |
| Smartphone | 68 | 75.6% |
| Tablet | 57 | 63.3% |
| No Computing Device | 12 | 13.3% |
| Total | 90 | 100.0% |
Internet Access in Waterloo
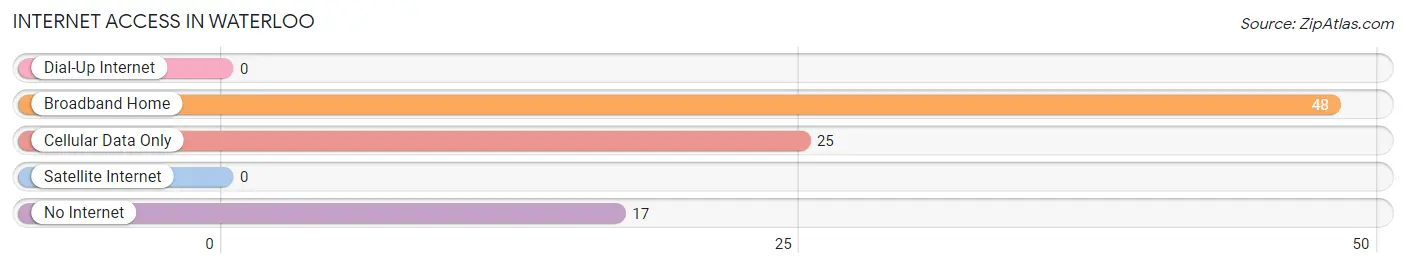
| Internet Type | # Households | % Households |
| Dial-Up Internet | 0 | 0.0% |
| Broadband Home | 48 | 53.3% |
| Cellular Data Only | 25 | 27.8% |
| Satellite Internet | 0 | 0.0% |
| No Internet | 17 | 18.9% |
| Total | 90 | 100.0% |
Waterloo Summary
Waterloo is a small town located in Laurens County, South Carolina. It is situated in the foothills of the Blue Ridge Mountains, approximately 30 miles south of Greenville. The town was founded in 1820 and is named after the Battle of Waterloo in 1815. The population of Waterloo was estimated to be 1,845 in 2019.
Geography
Waterloo is located in the foothills of the Blue Ridge Mountains, approximately 30 miles south of Greenville. The town is situated on the banks of the Reedy River, which flows through the town and is a popular spot for fishing and canoeing. The town is surrounded by rolling hills and forests, making it a popular destination for outdoor activities such as hiking, camping, and hunting.
Economy
Waterloo’s economy is largely based on agriculture and manufacturing. The town is home to several large farms, which produce a variety of crops such as corn, soybeans, and cotton. The town is also home to several manufacturing companies, which produce a variety of products such as furniture, textiles, and automotive parts.
Demographics
As of 2019, the population of Waterloo was estimated to be 1,845. The town is predominantly white, with a population that is approximately 85% white and 15% African American. The median household income in Waterloo is $37,000, and the median home value is $125,000.
Education
Waterloo is served by the Laurens County School District, which operates two elementary schools, one middle school, and one high school. The town is also home to several private schools, including Waterloo Christian Academy and Waterloo Academy.
Conclusion
Waterloo is a small town located in Laurens County, South Carolina. It is situated in the foothills of the Blue Ridge Mountains, approximately 30 miles south of Greenville. The town was founded in 1820 and is named after the Battle of Waterloo in 1815. The population of Waterloo was estimated to be 1,845 in 2019. The town’s economy is largely based on agriculture and manufacturing, and the town is predominantly white. Waterloo is served by the Laurens County School District, which operates two elementary schools, one middle school, and one high school. The town is also home to several private schools.
Common Questions
What is the Total Population of Waterloo?
Total Population of Waterloo is 244.
What is the Total Male Population of Waterloo?
Total Male Population of Waterloo is 132.
What is the Total Female Population of Waterloo?
Total Female Population of Waterloo is 112.
What is the Ratio of Males per 100 Females in Waterloo?
There are 117.86 Males per 100 Females in Waterloo.
What is the Ratio of Females per 100 Males in Waterloo?
There are 84.85 Females per 100 Males in Waterloo.
What is the Median Population Age in Waterloo?
Median Population Age in Waterloo is 30.9 Years.
What is the Average Family Size in Waterloo
Average Family Size in Waterloo is 3.3 People.
What is the Average Household Size in Waterloo
Average Household Size in Waterloo is 2.7 People.
What is Per Capita Income in Waterloo?
Per Capita income in Waterloo is $15,730.
What is the Median Family Income in Waterloo?
Median Family Income in Waterloo is $60,238.
What is the Median Household income in Waterloo?
Median Household Income in Waterloo is $40,500.
What is Income or Wage Gap in Waterloo?
Income or Wage Gap in Waterloo is 63.1%.
Women in Waterloo earn 36.9 cents for every dollar earned by a man.
What is Family Income Deficit in Waterloo?
Family Income Deficit in Waterloo is $2,974.
Families that are below poverty line in Waterloo earn $2,974 less on average than the poverty threshold level.
What is Inequality or Gini Index in Waterloo?
Inequality or Gini Index in Waterloo is 0.32.
How Large is the Labor Force in Waterloo?
There are 82 People in the Labor Forcein in Waterloo.
What is the Percentage of People in the Labor Force in Waterloo?
49.7% of People are in the Labor Force in Waterloo.
What is the Unemployment Rate in Waterloo?
Unemployment Rate in Waterloo is 2.4%.