Zip Codes with the Highest Percentage of Households with Income Above $100,000 in North Dakota
RELATED REPORTS & OPTIONS
Household Income | $100k+
North Dakota
Compare Zip Codes
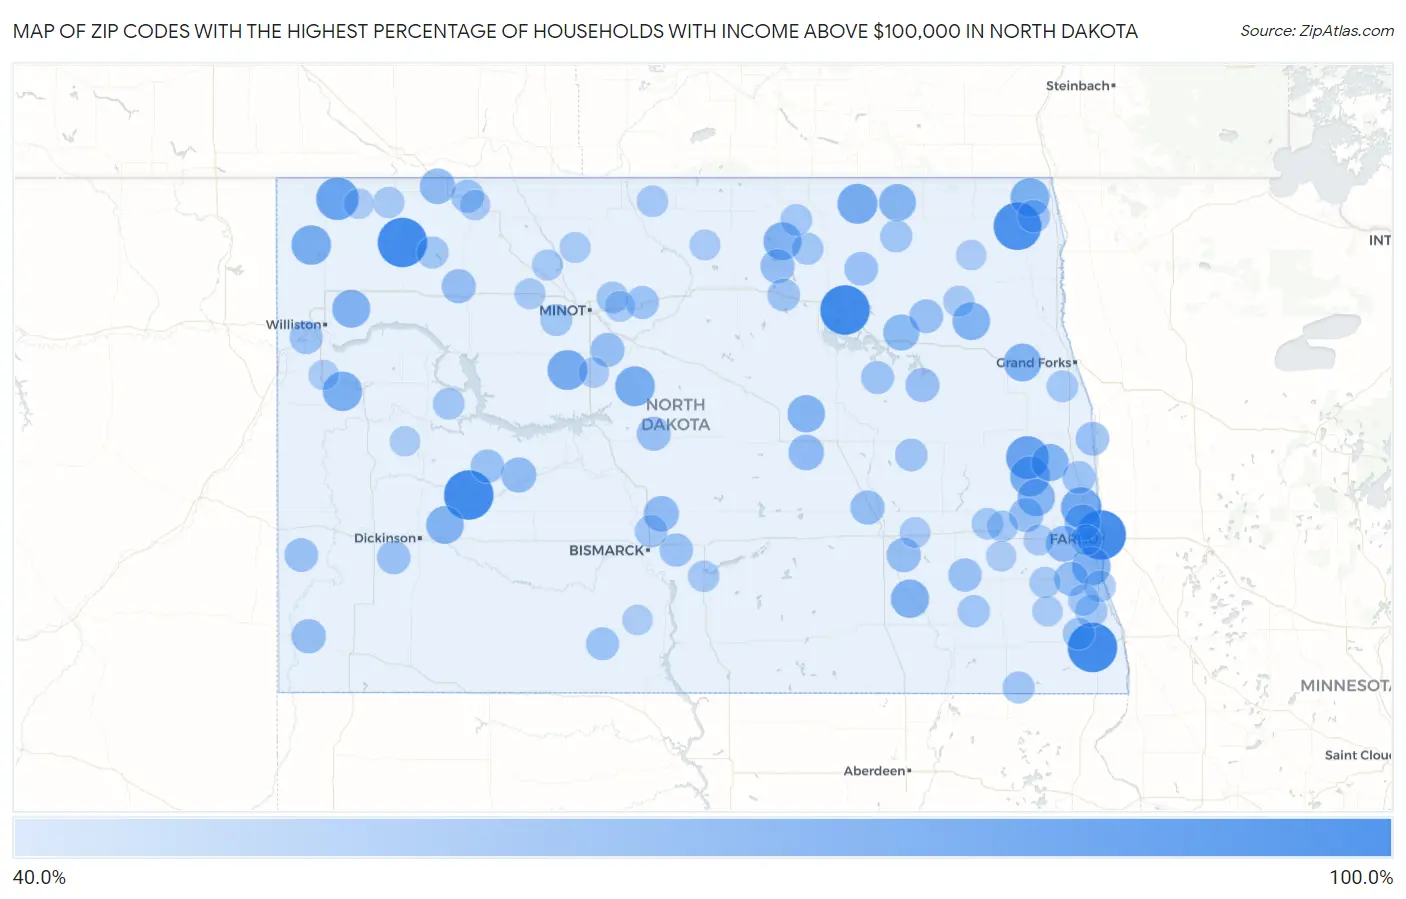
Map of Zip Codes with the Highest Percentage of Households with Income Above $100,000 in North Dakota
40.0%
100.0%
Zip Codes with the Highest Percentage of Households with Income Above $100,000 in North Dakota
| Zip Code | Households with Income > $100k | vs State | vs National | |
| 1. | 58105 | 100.0% | 35.6%(+64.4)#1 | 37.3%(+62.7)#1 |
| 2. | 58074 | 100.0% | 35.6%(+64.4)#2 | 37.3%(+62.7)#98 |
| 3. | 58644 | 100.0% | 35.6%(+64.4)#3 | 37.3%(+62.7)#120 |
| 4. | 58362 | 100.0% | 35.6%(+64.4)#4 | 37.3%(+62.7)#123 |
| 5. | 58755 | 99.9% | 35.6%(+64.3)#5 | 37.3%(+62.6)#147 |
| 6. | 58236 | 94.4% | 35.6%(+58.8)#6 | 37.3%(+57.1)#153 |
| 7. | 58016 | 80.4% | 35.6%(+44.8)#7 | 37.3%(+43.1)#331 |
| 8. | 58833 | 79.6% | 35.6%(+44.0)#8 | 37.3%(+42.3)#360 |
| 9. | 58005 | 73.9% | 35.6%(+38.3)#9 | 37.3%(+36.6)#646 |
| 10. | 58323 | 72.3% | 35.6%(+36.7)#10 | 37.3%(+35.0)#759 |
| 11. | 58735 | 72.1% | 35.6%(+36.5)#11 | 37.3%(+34.8)#769 |
| 12. | 58035 | 71.8% | 35.6%(+36.2)#12 | 37.3%(+34.5)#798 |
| 13. | 58778 | 71.7% | 35.6%(+36.1)#13 | 37.3%(+34.4)#811 |
| 14. | 58856 | 71.1% | 35.6%(+35.5)#14 | 37.3%(+33.8)#866 |
| 15. | 58835 | 70.4% | 35.6%(+34.8)#15 | 37.3%(+33.1)#926 |
| 16. | 58216 | 69.1% | 35.6%(+33.5)#16 | 37.3%(+31.8)#1,051 |
| 17. | 58047 | 68.5% | 35.6%(+32.9)#17 | 37.3%(+31.2)#1,115 |
| 18. | 58431 | 67.2% | 35.6%(+31.6)#18 | 37.3%(+29.9)#1,248 |
| 19. | 58353 | 66.7% | 35.6%(+31.1)#19 | 37.3%(+29.4)#1,321 |
| 20. | 58843 | 66.5% | 35.6%(+30.9)#20 | 37.3%(+29.2)#1,344 |
| 21. | 58214 | 65.6% | 35.6%(+30.0)#21 | 37.3%(+28.3)#1,454 |
| 22. | 58630 | 65.5% | 35.6%(+29.9)#22 | 37.3%(+28.2)#1,472 |
| 23. | 58224 | 65.4% | 35.6%(+29.8)#23 | 37.3%(+28.1)#1,490 |
| 24. | 58422 | 64.7% | 35.6%(+29.1)#24 | 37.3%(+27.4)#1,583 |
| 25. | 58029 | 64.5% | 35.6%(+28.9)#25 | 37.3%(+27.2)#1,622 |
| 26. | 58009 | 64.3% | 35.6%(+28.7)#26 | 37.3%(+27.0)#1,647 |
| 27. | 58281 | 64.0% | 35.6%(+28.4)#27 | 37.3%(+26.7)#1,692 |
| 28. | 58327 | 61.1% | 35.6%(+25.5)#28 | 37.3%(+23.8)#2,169 |
| 29. | 58042 | 61.0% | 35.6%(+25.4)#29 | 37.3%(+23.7)#2,186 |
| 30. | 58059 | 60.6% | 35.6%(+25.0)#30 | 37.3%(+23.3)#2,256 |
| 31. | 58486 | 59.5% | 35.6%(+23.9)#31 | 37.3%(+22.2)#2,478 |
| 32. | 58772 | 59.4% | 35.6%(+23.8)#32 | 37.3%(+22.1)#2,496 |
| 33. | 58521 | 59.2% | 35.6%(+23.6)#33 | 37.3%(+21.9)#2,537 |
| 34. | 58580 | 58.4% | 35.6%(+22.8)#34 | 37.3%(+21.1)#2,697 |
| 35. | 58497 | 56.1% | 35.6%(+20.5)#35 | 37.3%(+18.8)#3,184 |
| 36. | 58651 | 56.0% | 35.6%(+20.4)#36 | 37.3%(+18.7)#3,198 |
| 37. | 58385 | 55.7% | 35.6%(+20.1)#37 | 37.3%(+18.4)#3,288 |
| 38. | 58784 | 55.6% | 35.6%(+20.0)#38 | 37.3%(+18.3)#3,303 |
| 39. | 58051 | 55.6% | 35.6%(+20.0)#39 | 37.3%(+18.3)#3,305 |
| 40. | 58420 | 55.6% | 35.6%(+20.0)#40 | 37.3%(+18.3)#3,306 |
| 41. | 58781 | 55.4% | 35.6%(+19.8)#41 | 37.3%(+18.1)#3,367 |
| 42. | 58007 | 55.4% | 35.6%(+19.8)#42 | 37.3%(+18.1)#3,372 |
| 43. | 58559 | 55.3% | 35.6%(+19.7)#43 | 37.3%(+18.0)#3,388 |
| 44. | 58361 | 55.0% | 35.6%(+19.4)#44 | 37.3%(+17.7)#3,465 |
| 45. | 58321 | 54.6% | 35.6%(+19.0)#45 | 37.3%(+17.3)#3,568 |
| 46. | 58654 | 54.2% | 35.6%(+18.6)#46 | 37.3%(+16.9)#3,679 |
| 47. | 58377 | 54.2% | 35.6%(+18.6)#47 | 37.3%(+16.9)#3,680 |
| 48. | 58625 | 53.8% | 35.6%(+18.2)#48 | 37.3%(+16.5)#3,775 |
| 49. | 58219 | 53.8% | 35.6%(+18.2)#49 | 37.3%(+16.5)#3,777 |
| 50. | 58655 | 53.7% | 35.6%(+18.1)#50 | 37.3%(+16.4)#3,794 |
| 51. | 58558 | 53.4% | 35.6%(+17.8)#51 | 37.3%(+16.1)#3,872 |
| 52. | 58049 | 53.4% | 35.6%(+17.8)#52 | 37.3%(+16.1)#3,875 |
| 53. | 58853 | 52.7% | 35.6%(+17.1)#53 | 37.3%(+15.4)#4,076 |
| 54. | 58737 | 52.6% | 35.6%(+17.0)#54 | 37.3%(+15.3)#4,101 |
| 55. | 58381 | 52.5% | 35.6%(+16.9)#55 | 37.3%(+15.2)#4,128 |
| 56. | 58741 | 52.2% | 35.6%(+16.6)#56 | 37.3%(+14.9)#4,204 |
| 57. | 58569 | 52.2% | 35.6%(+16.6)#57 | 37.3%(+14.9)#4,205 |
| 58. | 58038 | 52.1% | 35.6%(+16.5)#58 | 37.3%(+14.8)#4,230 |
| 59. | 58386 | 51.5% | 35.6%(+15.9)#59 | 37.3%(+14.2)#4,422 |
| 60. | 58238 | 51.4% | 35.6%(+15.8)#60 | 37.3%(+14.1)#4,450 |
| 61. | 58484 | 51.2% | 35.6%(+15.6)#61 | 37.3%(+13.9)#4,497 |
| 62. | 58503 | 50.9% | 35.6%(+15.3)#62 | 37.3%(+13.6)#4,564 |
| 63. | 58033 | 50.3% | 35.6%(+14.7)#63 | 37.3%(+13.0)#4,763 |
| 64. | 58018 | 50.0% | 35.6%(+14.4)#64 | 37.3%(+12.7)#4,836 |
| 65. | 58043 | 50.0% | 35.6%(+14.4)#65 | 37.3%(+12.7)#4,853 |
| 66. | 58311 | 50.0% | 35.6%(+14.4)#66 | 37.3%(+12.7)#4,858 |
| 67. | 58773 | 49.6% | 35.6%(+14.0)#67 | 37.3%(+12.3)#5,000 |
| 68. | 58733 | 49.6% | 35.6%(+14.0)#68 | 37.3%(+12.3)#5,004 |
| 69. | 58008 | 49.5% | 35.6%(+13.9)#69 | 37.3%(+12.2)#5,046 |
| 70. | 58317 | 49.3% | 35.6%(+13.7)#70 | 37.3%(+12.0)#5,098 |
| 71. | 58785 | 49.2% | 35.6%(+13.6)#71 | 37.3%(+11.9)#5,119 |
| 72. | 58757 | 48.9% | 35.6%(+13.3)#72 | 37.3%(+11.6)#5,215 |
| 73. | 58278 | 48.7% | 35.6%(+13.1)#73 | 37.3%(+11.4)#5,275 |
| 74. | 58783 | 48.7% | 35.6%(+13.1)#74 | 37.3%(+11.4)#5,282 |
| 75. | 58363 | 48.7% | 35.6%(+13.1)#75 | 37.3%(+11.4)#5,283 |
| 76. | 58063 | 48.6% | 35.6%(+13.0)#76 | 37.3%(+11.3)#5,304 |
| 77. | 58015 | 48.5% | 35.6%(+12.9)#77 | 37.3%(+11.2)#5,340 |
| 78. | 58077 | 48.3% | 35.6%(+12.7)#78 | 37.3%(+11.0)#5,405 |
| 79. | 58560 | 47.8% | 35.6%(+12.2)#79 | 37.3%(+10.5)#5,587 |
| 80. | 58765 | 47.6% | 35.6%(+12.0)#80 | 37.3%(+10.3)#5,659 |
| 81. | 58052 | 47.5% | 35.6%(+11.9)#81 | 37.3%(+10.2)#5,685 |
| 82. | 58078 | 47.3% | 35.6%(+11.7)#82 | 37.3%(+10.00)#5,728 |
| 83. | 58071 | 47.3% | 35.6%(+11.7)#83 | 37.3%(+10.00)#5,760 |
| 84. | 58250 | 46.9% | 35.6%(+11.3)#84 | 37.3%(+9.60)#5,888 |
| 85. | 58725 | 46.7% | 35.6%(+11.1)#85 | 37.3%(+9.40)#5,963 |
| 86. | 58718 | 46.6% | 35.6%(+11.0)#86 | 37.3%(+9.30)#5,992 |
| 87. | 58750 | 46.5% | 35.6%(+10.9)#87 | 37.3%(+9.20)#6,035 |
| 88. | 58079 | 46.4% | 35.6%(+10.8)#88 | 37.3%(+9.10)#6,070 |
| 89. | 58384 | 46.3% | 35.6%(+10.7)#89 | 37.3%(+9.00)#6,113 |
| 90. | 58768 | 46.2% | 35.6%(+10.6)#90 | 37.3%(+8.90)#6,146 |
| 91. | 58759 | 45.6% | 35.6%(+10.00)#91 | 37.3%(+8.30)#6,383 |
| 92. | 58481 | 45.6% | 35.6%(+10.00)#92 | 37.3%(+8.30)#6,385 |
| 93. | 58721 | 45.5% | 35.6%(+9.90)#93 | 37.3%(+8.20)#6,429 |
| 94. | 58057 | 45.5% | 35.6%(+9.90)#94 | 37.3%(+8.20)#6,432 |
| 95. | 58730 | 45.2% | 35.6%(+9.60)#95 | 37.3%(+7.90)#6,558 |
| 96. | 58227 | 45.2% | 35.6%(+9.60)#96 | 37.3%(+7.90)#6,564 |
| 97. | 58640 | 45.1% | 35.6%(+9.50)#97 | 37.3%(+7.80)#6,596 |
| 98. | 58831 | 45.0% | 35.6%(+9.40)#98 | 37.3%(+7.70)#6,643 |
| 99. | 58570 | 45.0% | 35.6%(+9.40)#99 | 37.3%(+7.70)#6,647 |
| 100. | 58031 | 44.9% | 35.6%(+9.30)#100 | 37.3%(+7.60)#6,684 |
Common Questions
What are the Top 10 Zip Codes with the Highest Percentage of Households with Income Above $100,000 in North Dakota?
Top 10 Zip Codes with the Highest Percentage of Households with Income Above $100,000 in North Dakota are:
What zip code has the Highest Percentage of Households with Income Above $100,000 in North Dakota?
58105 has the Highest Percentage of Households with Income Above $100,000 in North Dakota with 100.0%.
What is the Percentage of Households with Income Above $100,000 in the State of North Dakota?
Percentage of Households with Income Above $100,000 in North Dakota is 35.6%.
What is the Percentage of Households with Income Above $100,000 in the United States?
Percentage of Households with Income Above $100,000 in the United States is 37.3%.