Zip Codes with the Highest Percentage of Households with Income Above $100,000 in New Mexico
RELATED REPORTS & OPTIONS
Household Income | $100k+
New Mexico
Compare Zip Codes
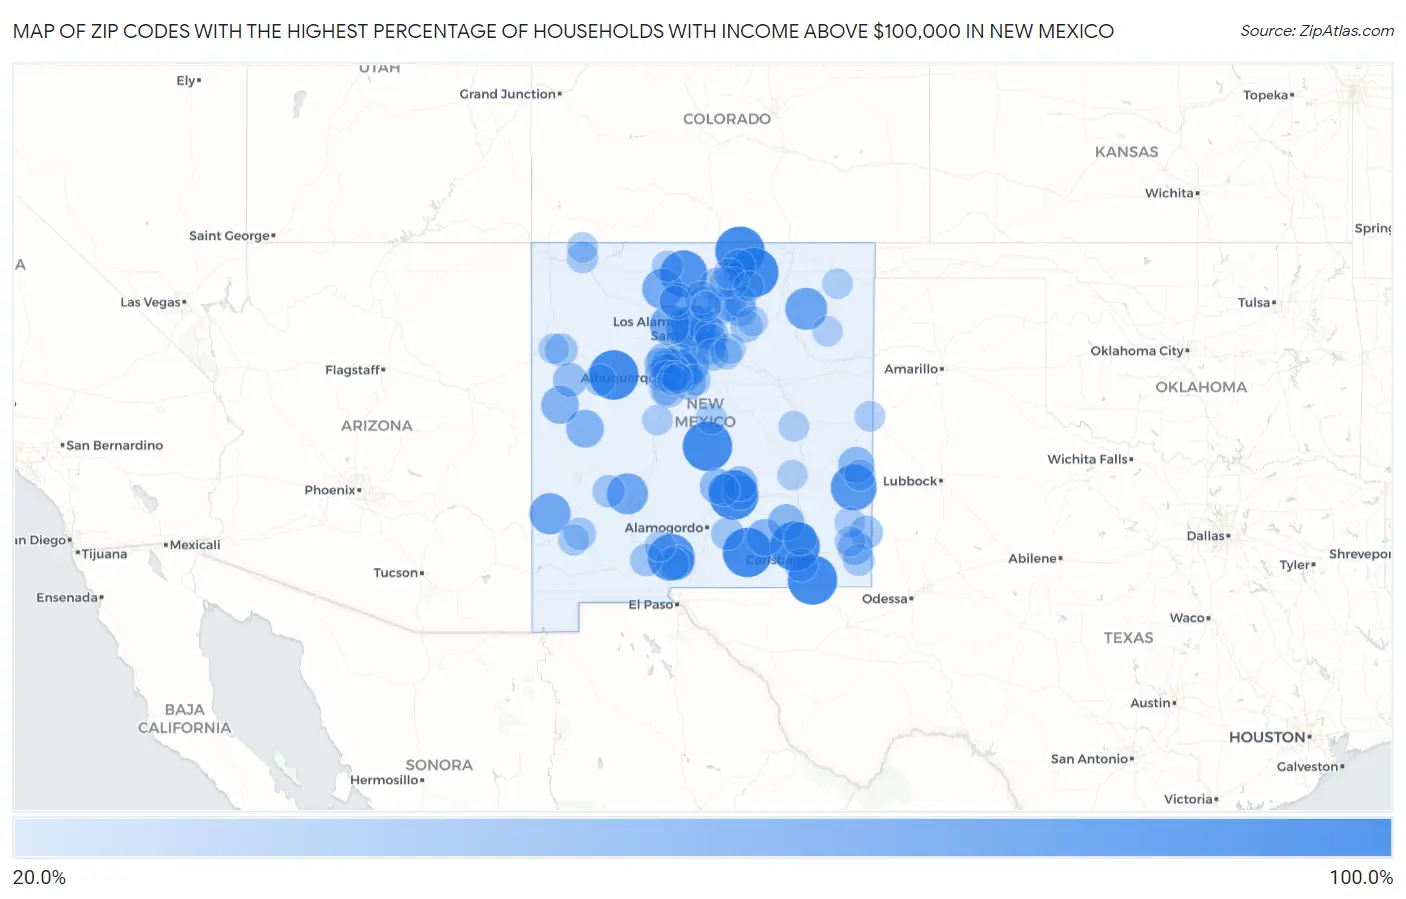
Map of Zip Codes with the Highest Percentage of Households with Income Above $100,000 in New Mexico
20.0%
100.0%
Zip Codes with the Highest Percentage of Households with Income Above $100,000 in New Mexico
| Zip Code | Households with Income > $100k | vs State | vs National | |
| 1. | 87049 | 100.0% | 27.3%(+72.7)#1 | 37.3%(+62.7)#15 |
| 2. | 88263 | 100.0% | 27.3%(+72.7)#2 | 37.3%(+62.7)#27 |
| 3. | 87512 | 100.0% | 27.3%(+72.7)#3 | 37.3%(+62.7)#42 |
| 4. | 88324 | 100.0% | 27.3%(+72.7)#4 | 37.3%(+62.7)#51 |
| 5. | 87749 | 100.0% | 27.3%(+72.7)#5 | 37.3%(+62.7)#52 |
| 6. | 88344 | 100.0% | 27.3%(+72.7)#6 | 37.3%(+62.7)#102 |
| 7. | 88254 | 100.0% | 27.3%(+72.7)#7 | 37.3%(+62.7)#107 |
| 8. | 87011 | 100.0% | 27.3%(+72.7)#8 | 37.3%(+62.7)#142 |
| 9. | 88052 | 90.3% | 27.3%(+63.0)#9 | 37.3%(+53.0)#174 |
| 10. | 87515 | 89.7% | 27.3%(+62.4)#10 | 37.3%(+52.4)#179 |
| 11. | 88114 | 86.2% | 27.3%(+58.9)#11 | 37.3%(+48.9)#214 |
| 12. | 87547 | 79.2% | 27.3%(+51.9)#12 | 37.3%(+41.9)#374 |
| 13. | 87730 | 71.4% | 27.3%(+44.1)#13 | 37.3%(+34.1)#838 |
| 14. | 88025 | 68.4% | 27.3%(+41.1)#14 | 37.3%(+31.1)#1,123 |
| 15. | 87939 | 68.0% | 27.3%(+40.7)#15 | 37.3%(+30.7)#1,170 |
| 16. | 87122 | 66.8% | 27.3%(+39.5)#16 | 37.3%(+29.5)#1,293 |
| 17. | 87017 | 65.7% | 27.3%(+38.4)#17 | 37.3%(+28.4)#1,440 |
| 18. | 87544 | 65.4% | 27.3%(+38.1)#18 | 37.3%(+28.1)#1,480 |
| 19. | 87025 | 64.4% | 27.3%(+37.1)#19 | 37.3%(+27.1)#1,636 |
| 20. | 87008 | 57.0% | 27.3%(+29.7)#20 | 37.3%(+19.7)#2,992 |
| 21. | 87827 | 55.4% | 27.3%(+28.1)#21 | 37.3%(+18.1)#3,369 |
| 22. | 87315 | 55.4% | 27.3%(+28.1)#22 | 37.3%(+18.1)#3,370 |
| 23. | 87047 | 55.3% | 27.3%(+28.0)#23 | 37.3%(+18.0)#3,384 |
| 24. | 87043 | 52.5% | 27.3%(+25.2)#24 | 37.3%(+15.2)#4,121 |
| 25. | 88250 | 52.3% | 27.3%(+25.0)#25 | 37.3%(+15.0)#4,182 |
| 26. | 87516 | 51.1% | 27.3%(+23.8)#26 | 37.3%(+13.8)#4,527 |
| 27. | 88253 | 50.9% | 27.3%(+23.6)#27 | 37.3%(+13.6)#4,588 |
| 28. | 88126 | 50.0% | 27.3%(+22.7)#28 | 37.3%(+12.7)#4,877 |
| 29. | 87048 | 48.6% | 27.3%(+21.3)#29 | 37.3%(+11.3)#5,296 |
| 30. | 88341 | 46.4% | 27.3%(+19.1)#30 | 37.3%(+9.10)#6,068 |
| 31. | 88348 | 45.6% | 27.3%(+18.3)#31 | 37.3%(+8.30)#6,384 |
| 32. | 88338 | 45.4% | 27.3%(+18.1)#32 | 37.3%(+8.10)#6,486 |
| 33. | 88265 | 44.3% | 27.3%(+17.0)#33 | 37.3%(+7.00)#6,913 |
| 34. | 87113 | 44.1% | 27.3%(+16.8)#34 | 37.3%(+6.80)#6,964 |
| 35. | 87059 | 43.2% | 27.3%(+15.9)#35 | 37.3%(+5.90)#7,339 |
| 36. | 88002 | 42.8% | 27.3%(+15.5)#36 | 37.3%(+5.50)#7,544 |
| 37. | 87508 | 42.5% | 27.3%(+15.2)#37 | 37.3%(+5.20)#7,676 |
| 38. | 87543 | 42.2% | 27.3%(+14.9)#38 | 37.3%(+4.90)#7,836 |
| 39. | 87321 | 41.6% | 27.3%(+14.3)#39 | 37.3%(+4.30)#8,092 |
| 40. | 87517 | 41.4% | 27.3%(+14.1)#40 | 37.3%(+4.10)#8,205 |
| 41. | 87506 | 41.0% | 27.3%(+13.7)#41 | 37.3%(+3.70)#8,403 |
| 42. | 87111 | 40.9% | 27.3%(+13.6)#42 | 37.3%(+3.60)#8,437 |
| 43. | 87144 | 40.4% | 27.3%(+13.1)#43 | 37.3%(+3.10)#8,692 |
| 44. | 87501 | 40.3% | 27.3%(+13.0)#44 | 37.3%(+3.00)#8,755 |
| 45. | 87558 | 39.5% | 27.3%(+12.2)#45 | 37.3%(+2.20)#9,208 |
| 46. | 87582 | 39.4% | 27.3%(+12.1)#46 | 37.3%(+2.10)#9,254 |
| 47. | 88242 | 39.2% | 27.3%(+11.9)#47 | 37.3%(+1.90)#9,333 |
| 48. | 87723 | 38.6% | 27.3%(+11.3)#48 | 37.3%(+1.30)#9,672 |
| 49. | 87120 | 38.3% | 27.3%(+11.0)#49 | 37.3%(+1.000)#9,803 |
| 50. | 88011 | 38.3% | 27.3%(+11.0)#50 | 37.3%(+1.000)#9,811 |
| 51. | 88220 | 38.2% | 27.3%(+10.9)#51 | 37.3%(+0.900)#9,859 |
| 52. | 88210 | 38.1% | 27.3%(+10.8)#52 | 37.3%(+0.800)#9,929 |
| 53. | 87549 | 37.3% | 27.3%(+10.00)#53 | 37.3%(=0.000)#10,396 |
| 54. | 87579 | 37.0% | 27.3%(+9.70)#54 | 37.3%(-0.300)#10,577 |
| 55. | 87316 | 37.0% | 27.3%(+9.70)#55 | 37.3%(-0.300)#10,584 |
| 56. | 87114 | 36.9% | 27.3%(+9.60)#56 | 37.3%(-0.400)#10,606 |
| 57. | 88317 | 36.5% | 27.3%(+9.20)#57 | 37.3%(-0.800)#10,885 |
| 58. | 87943 | 36.5% | 27.3%(+9.20)#58 | 37.3%(-0.800)#10,899 |
| 59. | 88007 | 36.4% | 27.3%(+9.10)#59 | 37.3%(-0.900)#10,917 |
| 60. | 87068 | 36.1% | 27.3%(+8.80)#60 | 37.3%(-1.20)#11,090 |
| 61. | 87505 | 35.5% | 27.3%(+8.20)#61 | 37.3%(-1.80)#11,439 |
| 62. | 88312 | 35.5% | 27.3%(+8.20)#62 | 37.3%(-1.80)#11,474 |
| 63. | 87745 | 35.1% | 27.3%(+7.80)#63 | 37.3%(-2.20)#11,745 |
| 64. | 88022 | 34.5% | 27.3%(+7.20)#64 | 37.3%(-2.80)#12,117 |
| 65. | 87713 | 33.6% | 27.3%(+6.30)#65 | 37.3%(-3.70)#12,764 |
| 66. | 87124 | 33.5% | 27.3%(+6.20)#66 | 37.3%(-3.80)#12,767 |
| 67. | 88231 | 33.3% | 27.3%(+6.00)#67 | 37.3%(-4.00)#12,893 |
| 68. | 87051 | 33.1% | 27.3%(+5.80)#68 | 37.3%(-4.20)#13,055 |
| 69. | 87540 | 32.9% | 27.3%(+5.60)#69 | 37.3%(-4.40)#13,235 |
| 70. | 87562 | 32.8% | 27.3%(+5.50)#70 | 37.3%(-4.50)#13,311 |
| 71. | 87402 | 32.5% | 27.3%(+5.20)#71 | 37.3%(-4.80)#13,466 |
| 72. | 87015 | 32.0% | 27.3%(+4.70)#72 | 37.3%(-5.30)#13,863 |
| 73. | 88125 | 31.6% | 27.3%(+4.30)#73 | 37.3%(-5.70)#14,233 |
| 74. | 87104 | 31.3% | 27.3%(+4.00)#74 | 37.3%(-6.00)#14,388 |
| 75. | 87551 | 31.2% | 27.3%(+3.90)#75 | 37.3%(-6.10)#14,540 |
| 76. | 88065 | 31.0% | 27.3%(+3.70)#76 | 37.3%(-6.30)#14,689 |
| 77. | 87063 | 31.0% | 27.3%(+3.70)#77 | 37.3%(-6.30)#14,699 |
| 78. | 87022 | 30.9% | 27.3%(+3.60)#78 | 37.3%(-6.40)#14,783 |
| 79. | 87571 | 30.7% | 27.3%(+3.40)#79 | 37.3%(-6.60)#14,892 |
| 80. | 87538 | 30.6% | 27.3%(+3.30)#80 | 37.3%(-6.70)#15,031 |
| 81. | 87529 | 30.1% | 27.3%(+2.80)#81 | 37.3%(-7.20)#15,392 |
| 82. | 88260 | 29.9% | 27.3%(+2.60)#82 | 37.3%(-7.40)#15,521 |
| 83. | 87064 | 29.9% | 27.3%(+2.60)#83 | 37.3%(-7.40)#15,563 |
| 84. | 87580 | 29.8% | 27.3%(+2.50)#84 | 37.3%(-7.50)#15,653 |
| 85. | 87112 | 29.4% | 27.3%(+2.10)#85 | 37.3%(-7.90)#15,904 |
| 86. | 88012 | 29.4% | 27.3%(+2.10)#86 | 37.3%(-7.90)#15,909 |
| 87. | 88240 | 29.3% | 27.3%(+2.00)#87 | 37.3%(-8.00)#16,002 |
| 88. | 87418 | 29.1% | 27.3%(+1.80)#88 | 37.3%(-8.20)#16,201 |
| 89. | 87006 | 28.8% | 27.3%(+1.50)#89 | 37.3%(-8.50)#16,455 |
| 90. | 87116 | 28.7% | 27.3%(+1.40)#90 | 37.3%(-8.60)#16,525 |
| 91. | 88135 | 28.7% | 27.3%(+1.40)#91 | 37.3%(-8.60)#16,548 |
| 92. | 87322 | 28.6% | 27.3%(+1.30)#92 | 37.3%(-8.70)#16,638 |
| 93. | 88424 | 28.6% | 27.3%(+1.30)#93 | 37.3%(-8.70)#16,664 |
| 94. | 87123 | 28.4% | 27.3%(+1.10)#94 | 37.3%(-8.90)#16,768 |
| 95. | 88119 | 28.4% | 27.3%(+1.10)#95 | 37.3%(-8.90)#16,819 |
| 96. | 88201 | 28.3% | 27.3%(+1.00)#96 | 37.3%(-9.00)#16,858 |
| 97. | 87712 | 28.3% | 27.3%(+1.00)#97 | 37.3%(-9.00)#16,921 |
| 98. | 87733 | 28.2% | 27.3%(+0.900)#98 | 37.3%(-9.10)#17,016 |
| 99. | 87511 | 28.0% | 27.3%(+0.700)#99 | 37.3%(-9.30)#17,138 |
| 100. | 87710 | 27.8% | 27.3%(+0.500)#100 | 37.3%(-9.50)#17,334 |
Common Questions
What are the Top 10 Zip Codes with the Highest Percentage of Households with Income Above $100,000 in New Mexico?
Top 10 Zip Codes with the Highest Percentage of Households with Income Above $100,000 in New Mexico are:
What zip code has the Highest Percentage of Households with Income Above $100,000 in New Mexico?
87049 has the Highest Percentage of Households with Income Above $100,000 in New Mexico with 100.0%.
What is the Percentage of Households with Income Above $100,000 in the State of New Mexico?
Percentage of Households with Income Above $100,000 in New Mexico is 27.3%.
What is the Percentage of Households with Income Above $100,000 in the United States?
Percentage of Households with Income Above $100,000 in the United States is 37.3%.