Zip Codes with the Highest Percentage of Households with Income Above $100,000 in Papillion, NE
RELATED REPORTS & OPTIONS
Household Income | $100k+
Papillion
Compare Zip Codes
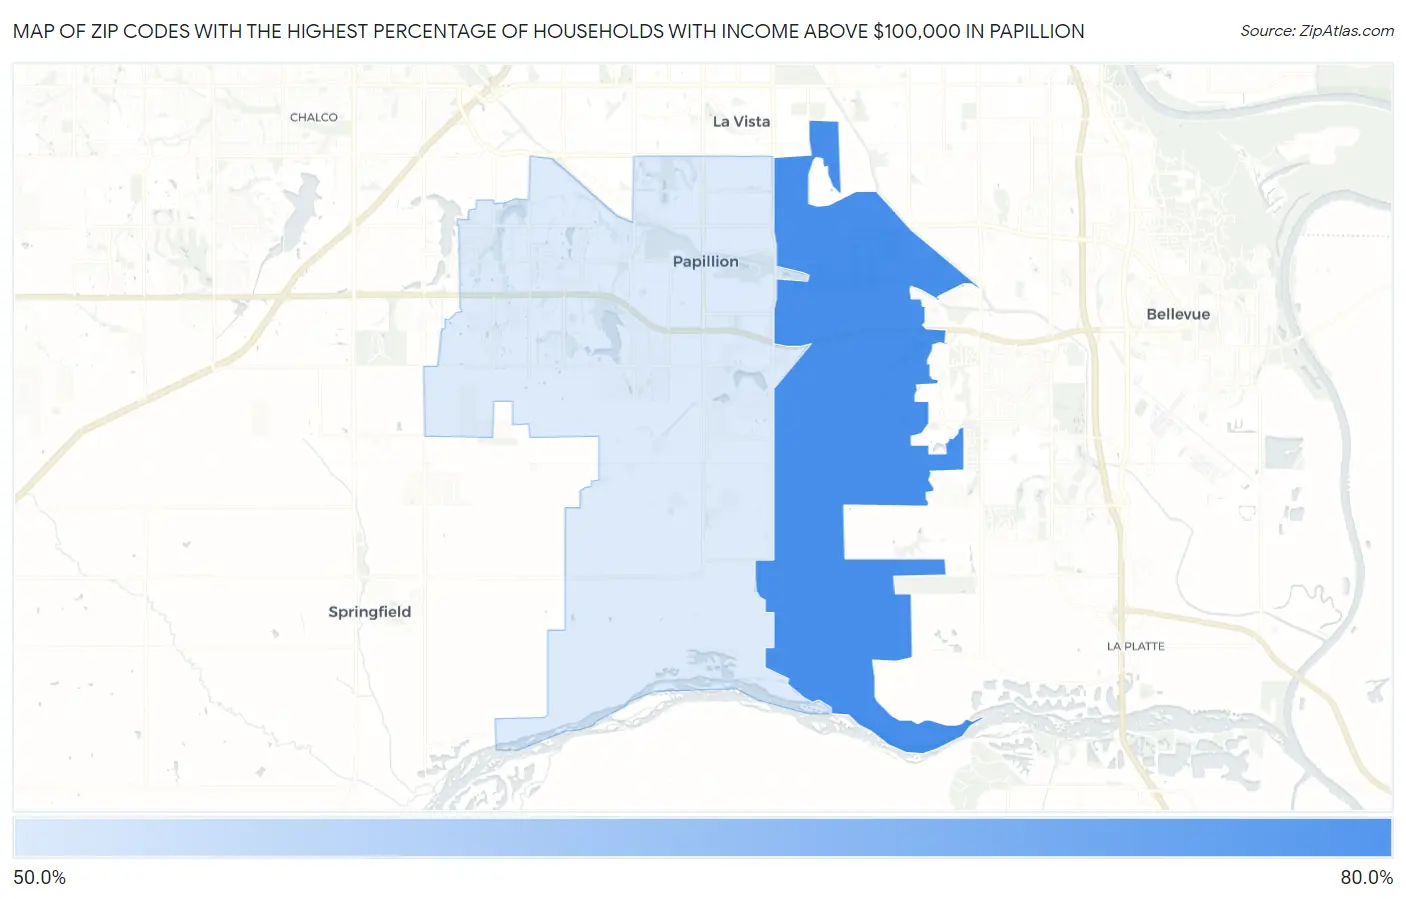
Map of Zip Codes with the Highest Percentage of Households with Income Above $100,000 in Papillion
55.5%
60.5%
Zip Codes with the Highest Percentage of Households with Income Above $100,000 in Papillion, NE
| Zip Code | Households with Income > $100k | vs State | vs National | |
| 1. | 68133 | 60.5% | 34.0%(+26.5)#18 | 37.3%(+23.2)#2,271 |
| 2. | 68046 | 55.5% | 34.0%(+21.5)#28 | 37.3%(+18.2)#3,318 |
1
Common Questions
What are the Top Zip Codes with the Highest Percentage of Households with Income Above $100,000 in Papillion, NE?
Top Zip Codes with the Highest Percentage of Households with Income Above $100,000 in Papillion, NE are:
What zip code has the Highest Percentage of Households with Income Above $100,000 in Papillion, NE?
68133 has the Highest Percentage of Households with Income Above $100,000 in Papillion, NE with 60.5%.
What is the Percentage of Households with Income Above $100,000 in Papillion, NE?
Percentage of Households with Income Above $100,000 in Papillion is 52.2%.
What is the Percentage of Households with Income Above $100,000 in Nebraska?
Percentage of Households with Income Above $100,000 in Nebraska is 34.0%.
What is the Percentage of Households with Income Above $100,000 in the United States?
Percentage of Households with Income Above $100,000 in the United States is 37.3%.