Zip Codes with the Highest Percentage of Households with Income Above $100,000 in Arizona
RELATED REPORTS & OPTIONS
Household Income | $100k+
Arizona
Compare Zip Codes
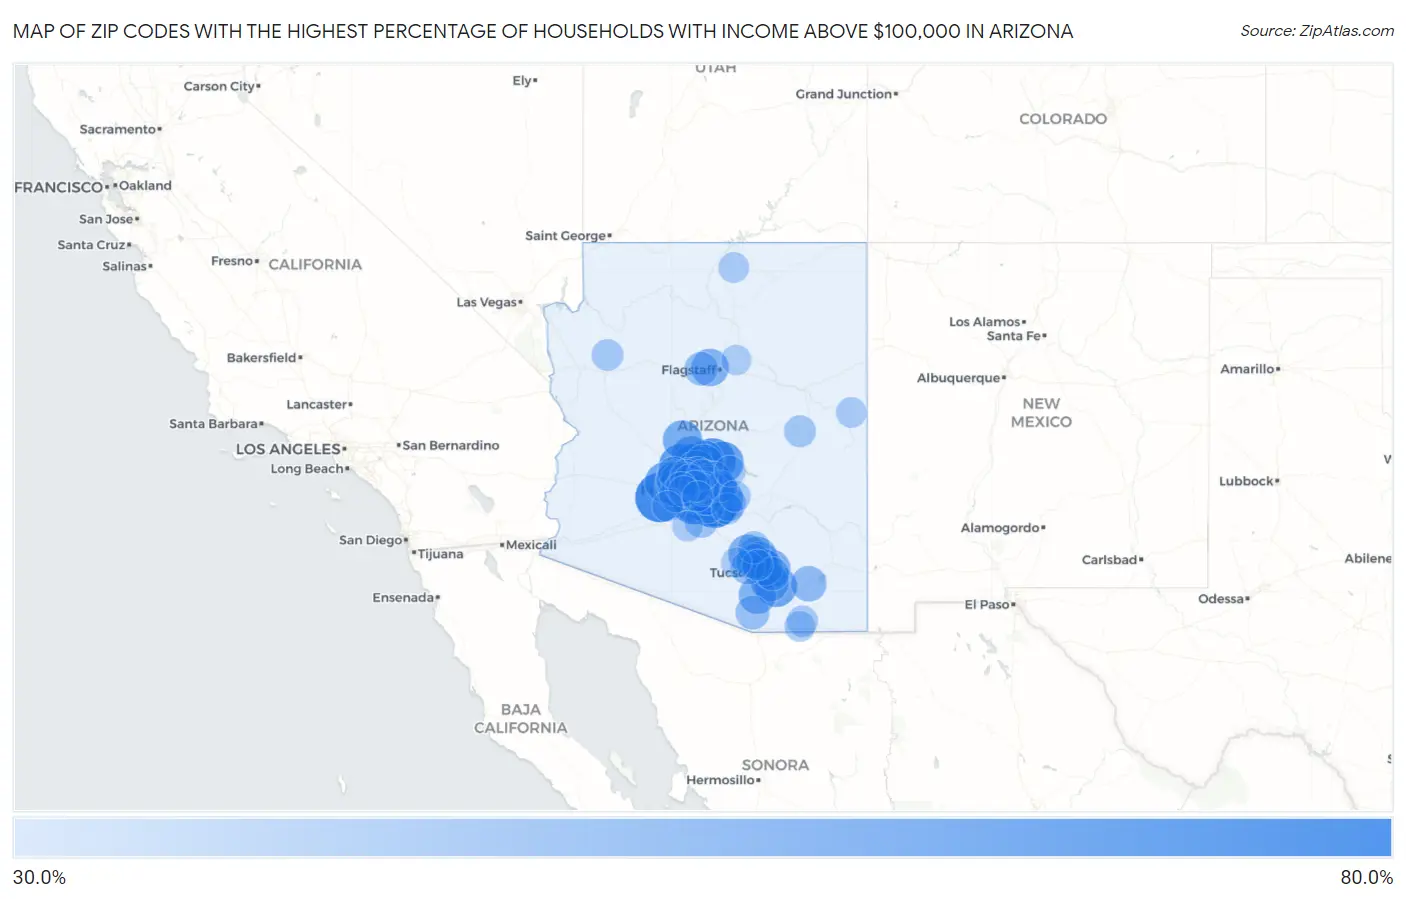
Map of Zip Codes with the Highest Percentage of Households with Income Above $100,000 in Arizona
30.0%
80.0%
Zip Codes with the Highest Percentage of Households with Income Above $100,000 in Arizona
| Zip Code | Households with Income > $100k | vs State | vs National | |
| 1. | 85343 | 76.2% | 34.8%(+41.4)#1 | 37.3%(+38.9)#514 |
| 2. | 85284 | 75.4% | 34.8%(+40.6)#2 | 37.3%(+38.1)#552 |
| 3. | 85045 | 73.9% | 34.8%(+39.1)#3 | 37.3%(+36.6)#643 |
| 4. | 85083 | 72.4% | 34.8%(+37.6)#4 | 37.3%(+35.1)#747 |
| 5. | 85262 | 69.3% | 34.8%(+34.5)#5 | 37.3%(+32.0)#1,028 |
| 6. | 85298 | 68.9% | 34.8%(+34.1)#6 | 37.3%(+31.6)#1,068 |
| 7. | 85253 | 67.8% | 34.8%(+33.0)#7 | 37.3%(+30.5)#1,190 |
| 8. | 85266 | 67.1% | 34.8%(+32.3)#8 | 37.3%(+29.8)#1,253 |
| 9. | 85383 | 66.4% | 34.8%(+31.6)#9 | 37.3%(+29.1)#1,346 |
| 10. | 85249 | 65.3% | 34.8%(+30.5)#10 | 37.3%(+28.0)#1,495 |
| 11. | 85255 | 65.3% | 34.8%(+30.5)#11 | 37.3%(+28.0)#1,496 |
| 12. | 85297 | 65.0% | 34.8%(+30.2)#12 | 37.3%(+27.7)#1,534 |
| 13. | 85212 | 63.9% | 34.8%(+29.1)#13 | 37.3%(+26.6)#1,696 |
| 14. | 85259 | 63.5% | 34.8%(+28.7)#14 | 37.3%(+26.2)#1,754 |
| 15. | 85050 | 62.5% | 34.8%(+27.7)#15 | 37.3%(+25.2)#1,928 |
| 16. | 85263 | 61.1% | 34.8%(+26.3)#16 | 37.3%(+23.8)#2,168 |
| 17. | 85331 | 60.0% | 34.8%(+25.2)#17 | 37.3%(+22.7)#2,360 |
| 18. | 85142 | 59.9% | 34.8%(+25.1)#18 | 37.3%(+22.6)#2,378 |
| 19. | 85641 | 59.5% | 34.8%(+24.7)#19 | 37.3%(+22.2)#2,463 |
| 20. | 85286 | 58.5% | 34.8%(+23.7)#20 | 37.3%(+21.2)#2,652 |
| 21. | 85296 | 58.1% | 34.8%(+23.3)#21 | 37.3%(+20.8)#2,737 |
| 22. | 85295 | 58.0% | 34.8%(+23.2)#22 | 37.3%(+20.7)#2,756 |
| 23. | 85310 | 57.6% | 34.8%(+22.8)#23 | 37.3%(+20.3)#2,850 |
| 24. | 85396 | 57.5% | 34.8%(+22.7)#24 | 37.3%(+20.2)#2,869 |
| 25. | 85340 | 57.4% | 34.8%(+22.6)#25 | 37.3%(+20.1)#2,888 |
| 26. | 85028 | 56.6% | 34.8%(+21.8)#26 | 37.3%(+19.3)#3,072 |
| 27. | 85087 | 56.6% | 34.8%(+21.8)#27 | 37.3%(+19.3)#3,078 |
| 28. | 85048 | 56.5% | 34.8%(+21.7)#28 | 37.3%(+19.2)#3,087 |
| 29. | 85234 | 56.0% | 34.8%(+21.2)#29 | 37.3%(+18.7)#3,186 |
| 30. | 85254 | 56.0% | 34.8%(+21.2)#30 | 37.3%(+18.7)#3,187 |
| 31. | 85086 | 55.8% | 34.8%(+21.0)#31 | 37.3%(+18.5)#3,231 |
| 32. | 86343 | 55.2% | 34.8%(+20.4)#32 | 37.3%(+17.9)#3,413 |
| 33. | 85085 | 55.0% | 34.8%(+20.2)#33 | 37.3%(+17.7)#3,451 |
| 34. | 85755 | 54.8% | 34.8%(+20.0)#34 | 37.3%(+17.5)#3,504 |
| 35. | 85355 | 54.4% | 34.8%(+19.6)#35 | 37.3%(+17.1)#3,615 |
| 36. | 85377 | 54.1% | 34.8%(+19.3)#36 | 37.3%(+16.8)#3,698 |
| 37. | 85658 | 53.7% | 34.8%(+18.9)#37 | 37.3%(+16.4)#3,787 |
| 38. | 85749 | 53.5% | 34.8%(+18.7)#38 | 37.3%(+16.2)#3,836 |
| 39. | 85718 | 53.0% | 34.8%(+18.2)#39 | 37.3%(+15.7)#3,961 |
| 40. | 85747 | 52.7% | 34.8%(+17.9)#40 | 37.3%(+15.4)#4,059 |
| 41. | 85629 | 51.8% | 34.8%(+17.0)#41 | 37.3%(+14.5)#4,292 |
| 42. | 86015 | 51.8% | 34.8%(+17.0)#42 | 37.3%(+14.5)#4,310 |
| 43. | 85395 | 51.7% | 34.8%(+16.9)#43 | 37.3%(+14.4)#4,329 |
| 44. | 85737 | 51.1% | 34.8%(+16.3)#44 | 37.3%(+13.8)#4,509 |
| 45. | 85260 | 51.0% | 34.8%(+16.2)#45 | 37.3%(+13.7)#4,532 |
| 46. | 85226 | 50.8% | 34.8%(+16.0)#46 | 37.3%(+13.5)#4,597 |
| 47. | 85388 | 50.5% | 34.8%(+15.7)#47 | 37.3%(+13.2)#4,682 |
| 48. | 85268 | 50.5% | 34.8%(+15.7)#48 | 37.3%(+13.2)#4,684 |
| 49. | 85258 | 49.9% | 34.8%(+15.1)#49 | 37.3%(+12.6)#4,885 |
| 50. | 85379 | 49.8% | 34.8%(+15.0)#50 | 37.3%(+12.5)#4,910 |
| 51. | 85233 | 49.6% | 34.8%(+14.8)#51 | 37.3%(+12.3)#4,970 |
| 52. | 85750 | 49.0% | 34.8%(+14.2)#52 | 37.3%(+11.7)#5,168 |
| 53. | 85339 | 48.3% | 34.8%(+13.5)#53 | 37.3%(+11.0)#5,375 |
| 54. | 85207 | 47.8% | 34.8%(+13.0)#54 | 37.3%(+10.5)#5,556 |
| 55. | 85609 | 47.8% | 34.8%(+13.0)#55 | 37.3%(+10.5)#5,586 |
| 56. | 85213 | 47.2% | 34.8%(+12.4)#56 | 37.3%(+9.90)#5,767 |
| 57. | 85742 | 46.3% | 34.8%(+11.5)#57 | 37.3%(+9.00)#6,083 |
| 58. | 85140 | 45.7% | 34.8%(+10.9)#58 | 37.3%(+8.40)#6,320 |
| 59. | 85308 | 45.6% | 34.8%(+10.8)#59 | 37.3%(+8.30)#6,359 |
| 60. | 85338 | 45.5% | 34.8%(+10.7)#60 | 37.3%(+8.20)#6,387 |
| 61. | 85044 | 45.5% | 34.8%(+10.7)#61 | 37.3%(+8.20)#6,392 |
| 62. | 85305 | 45.5% | 34.8%(+10.7)#62 | 37.3%(+8.20)#6,400 |
| 63. | 85248 | 45.0% | 34.8%(+10.2)#63 | 37.3%(+7.70)#6,617 |
| 64. | 85018 | 44.7% | 34.8%(+9.90)#64 | 37.3%(+7.40)#6,742 |
| 65. | 85250 | 44.7% | 34.8%(+9.90)#65 | 37.3%(+7.40)#6,747 |
| 66. | 85646 | 44.6% | 34.8%(+9.80)#66 | 37.3%(+7.30)#6,799 |
| 67. | 85024 | 44.2% | 34.8%(+9.40)#67 | 37.3%(+6.90)#6,923 |
| 68. | 85743 | 44.1% | 34.8%(+9.30)#68 | 37.3%(+6.80)#6,960 |
| 69. | 86018 | 44.0% | 34.8%(+9.20)#69 | 37.3%(+6.70)#7,032 |
| 70. | 85748 | 43.7% | 34.8%(+8.90)#70 | 37.3%(+6.40)#7,123 |
| 71. | 85138 | 43.1% | 34.8%(+8.30)#71 | 37.3%(+5.80)#7,370 |
| 72. | 85382 | 42.9% | 34.8%(+8.10)#72 | 37.3%(+5.60)#7,472 |
| 73. | 85381 | 42.8% | 34.8%(+8.00)#73 | 37.3%(+5.50)#7,517 |
| 74. | 85224 | 41.9% | 34.8%(+7.10)#74 | 37.3%(+4.60)#7,919 |
| 75. | 85251 | 41.6% | 34.8%(+6.80)#75 | 37.3%(+4.30)#8,070 |
| 76. | 85739 | 41.5% | 34.8%(+6.70)#76 | 37.3%(+4.20)#8,115 |
| 77. | 85257 | 41.3% | 34.8%(+6.50)#77 | 37.3%(+4.00)#8,223 |
| 78. | 85934 | 40.4% | 34.8%(+5.60)#78 | 37.3%(+3.10)#8,730 |
| 79. | 85387 | 40.1% | 34.8%(+5.30)#79 | 37.3%(+2.80)#8,845 |
| 80. | 86437 | 40.0% | 34.8%(+5.20)#80 | 37.3%(+2.70)#8,933 |
| 81. | 85215 | 39.9% | 34.8%(+5.10)#81 | 37.3%(+2.60)#8,962 |
| 82. | 85016 | 39.7% | 34.8%(+4.90)#82 | 37.3%(+2.40)#9,061 |
| 83. | 85304 | 39.6% | 34.8%(+4.80)#83 | 37.3%(+2.30)#9,125 |
| 84. | 85143 | 39.5% | 34.8%(+4.70)#84 | 37.3%(+2.20)#9,166 |
| 85. | 85054 | 39.2% | 34.8%(+4.40)#85 | 37.3%(+1.90)#9,331 |
| 86. | 85012 | 39.2% | 34.8%(+4.40)#86 | 37.3%(+1.90)#9,332 |
| 87. | 85264 | 39.2% | 34.8%(+4.40)#87 | 37.3%(+1.90)#9,346 |
| 88. | 85392 | 39.1% | 34.8%(+4.30)#88 | 37.3%(+1.80)#9,363 |
| 89. | 85118 | 39.1% | 34.8%(+4.30)#89 | 37.3%(+1.80)#9,376 |
| 90. | 85650 | 39.0% | 34.8%(+4.20)#90 | 37.3%(+1.70)#9,427 |
| 91. | 85615 | 38.6% | 34.8%(+3.80)#91 | 37.3%(+1.30)#9,638 |
| 92. | 85704 | 38.4% | 34.8%(+3.60)#92 | 37.3%(+1.10)#9,748 |
| 93. | 85353 | 38.1% | 34.8%(+3.30)#93 | 37.3%(+0.800)#9,913 |
| 94. | 85326 | 38.0% | 34.8%(+3.20)#94 | 37.3%(+0.700)#9,972 |
| 95. | 86040 | 37.9% | 34.8%(+3.10)#95 | 37.3%(+0.600)#10,049 |
| 96. | 85936 | 37.9% | 34.8%(+3.10)#96 | 37.3%(+0.600)#10,060 |
| 97. | 85042 | 37.8% | 34.8%(+3.00)#97 | 37.3%(+0.500)#10,090 |
| 98. | 85139 | 37.6% | 34.8%(+2.80)#98 | 37.3%(+0.300)#10,204 |
| 99. | 86004 | 37.3% | 34.8%(+2.50)#99 | 37.3%(=0.000)#10,367 |
| 100. | 85653 | 37.3% | 34.8%(+2.50)#100 | 37.3%(=0.000)#10,374 |
Common Questions
What are the Top 10 Zip Codes with the Highest Percentage of Households with Income Above $100,000 in Arizona?
Top 10 Zip Codes with the Highest Percentage of Households with Income Above $100,000 in Arizona are:
What zip code has the Highest Percentage of Households with Income Above $100,000 in Arizona?
85343 has the Highest Percentage of Households with Income Above $100,000 in Arizona with 76.2%.
What is the Percentage of Households with Income Above $100,000 in the State of Arizona?
Percentage of Households with Income Above $100,000 in Arizona is 34.8%.
What is the Percentage of Households with Income Above $100,000 in the United States?
Percentage of Households with Income Above $100,000 in the United States is 37.3%.