Zip Codes with the Highest Percentage of Households with Income Above $100,000 in Idaho
RELATED REPORTS & OPTIONS
Household Income | $100k+
Idaho
Compare Zip Codes
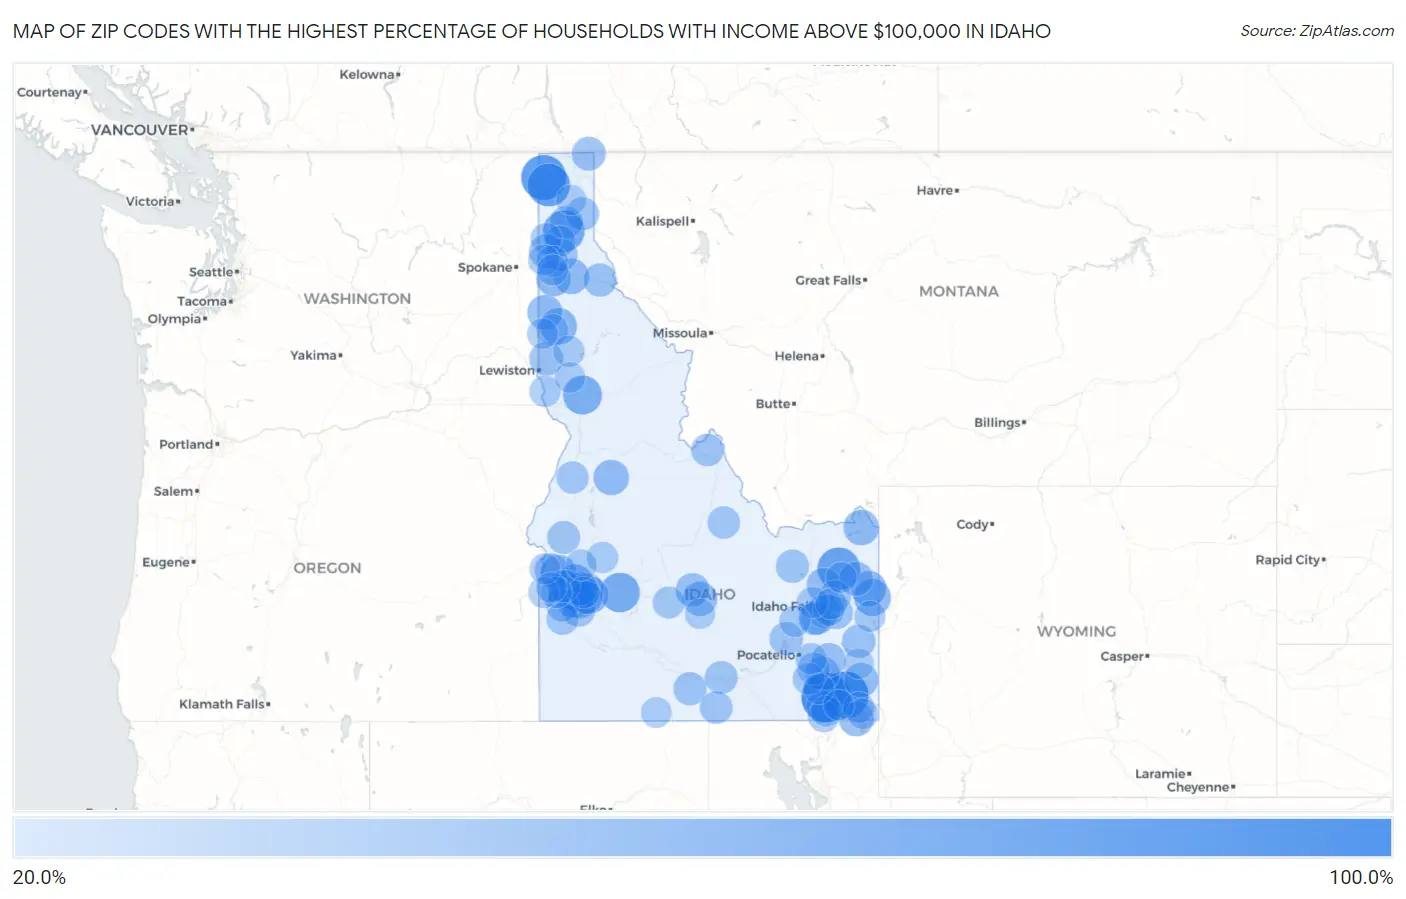
Map of Zip Codes with the Highest Percentage of Households with Income Above $100,000 in Idaho
20.0%
100.0%
Zip Codes with the Highest Percentage of Households with Income Above $100,000 in Idaho
| Zip Code | Households with Income > $100k | vs State | vs National | |
| 1. | 83281 | 93.9% | 31.8%(+62.1)#1 | 37.3%(+56.6)#156 |
| 2. | 83283 | 86.0% | 31.8%(+54.2)#2 | 37.3%(+48.7)#217 |
| 3. | 83848 | 78.2% | 31.8%(+46.4)#3 | 37.3%(+40.9)#417 |
| 4. | 83821 | 70.5% | 31.8%(+38.7)#4 | 37.3%(+33.2)#920 |
| 5. | 83438 | 70.2% | 31.8%(+38.4)#5 | 37.3%(+32.9)#949 |
| 6. | 83809 | 66.2% | 31.8%(+34.4)#6 | 37.3%(+28.9)#1,390 |
| 7. | 83716 | 59.5% | 31.8%(+27.7)#7 | 37.3%(+22.2)#2,465 |
| 8. | 83533 | 57.6% | 31.8%(+25.8)#8 | 37.3%(+20.3)#2,863 |
| 9. | 83616 | 55.1% | 31.8%(+23.3)#9 | 37.3%(+17.8)#3,420 |
| 10. | 83455 | 50.8% | 31.8%(+19.0)#10 | 37.3%(+13.5)#4,609 |
| 11. | 83712 | 50.3% | 31.8%(+18.5)#11 | 37.3%(+13.0)#4,745 |
| 12. | 83834 | 49.4% | 31.8%(+17.6)#12 | 37.3%(+12.1)#5,078 |
| 13. | 83810 | 46.4% | 31.8%(+14.6)#13 | 37.3%(+9.10)#6,062 |
| 14. | 83422 | 46.3% | 31.8%(+14.5)#14 | 37.3%(+9.00)#6,103 |
| 15. | 83646 | 46.1% | 31.8%(+14.3)#15 | 37.3%(+8.80)#6,154 |
| 16. | 83429 | 46.0% | 31.8%(+14.2)#16 | 37.3%(+8.70)#6,231 |
| 17. | 83642 | 45.6% | 31.8%(+13.8)#17 | 37.3%(+8.30)#6,360 |
| 18. | 83636 | 45.4% | 31.8%(+13.6)#18 | 37.3%(+8.10)#6,478 |
| 19. | 83638 | 45.2% | 31.8%(+13.4)#19 | 37.3%(+7.90)#6,551 |
| 20. | 83824 | 44.8% | 31.8%(+13.0)#20 | 37.3%(+7.50)#6,732 |
| 21. | 83287 | 44.2% | 31.8%(+12.4)#21 | 37.3%(+6.90)#6,950 |
| 22. | 83833 | 44.1% | 31.8%(+12.3)#22 | 37.3%(+6.80)#6,980 |
| 23. | 83669 | 43.0% | 31.8%(+11.2)#23 | 37.3%(+5.70)#7,439 |
| 24. | 83333 | 42.6% | 31.8%(+10.8)#24 | 37.3%(+5.30)#7,622 |
| 25. | 83239 | 41.9% | 31.8%(+10.1)#25 | 37.3%(+4.60)#7,971 |
| 26. | 83434 | 41.8% | 31.8%(+10.00)#26 | 37.3%(+4.50)#8,011 |
| 27. | 83246 | 41.7% | 31.8%(+9.90)#27 | 37.3%(+4.40)#8,047 |
| 28. | 83858 | 41.6% | 31.8%(+9.80)#28 | 37.3%(+4.30)#8,078 |
| 29. | 83274 | 41.6% | 31.8%(+9.80)#29 | 37.3%(+4.30)#8,081 |
| 30. | 83709 | 41.0% | 31.8%(+9.20)#30 | 37.3%(+3.70)#8,389 |
| 31. | 83217 | 40.9% | 31.8%(+9.10)#31 | 37.3%(+3.60)#8,485 |
| 32. | 83436 | 40.8% | 31.8%(+9.00)#32 | 37.3%(+3.50)#8,535 |
| 33. | 83832 | 40.5% | 31.8%(+8.70)#33 | 37.3%(+3.20)#8,678 |
| 34. | 83826 | 40.2% | 31.8%(+8.40)#34 | 37.3%(+2.90)#8,830 |
| 35. | 83353 | 40.0% | 31.8%(+8.20)#35 | 37.3%(+2.70)#8,920 |
| 36. | 83713 | 39.2% | 31.8%(+7.40)#36 | 37.3%(+1.90)#9,316 |
| 37. | 83702 | 38.6% | 31.8%(+6.80)#37 | 37.3%(+1.30)#9,630 |
| 38. | 83867 | 38.5% | 31.8%(+6.70)#38 | 37.3%(+1.20)#9,730 |
| 39. | 83285 | 38.5% | 31.8%(+6.70)#39 | 37.3%(+1.20)#9,740 |
| 40. | 83427 | 38.3% | 31.8%(+6.50)#40 | 37.3%(+1.000)#9,834 |
| 41. | 83277 | 38.3% | 31.8%(+6.50)#41 | 37.3%(+1.000)#9,854 |
| 42. | 83341 | 38.2% | 31.8%(+6.40)#42 | 37.3%(+0.900)#9,876 |
| 43. | 83836 | 38.2% | 31.8%(+6.40)#43 | 37.3%(+0.900)#9,898 |
| 44. | 83435 | 38.2% | 31.8%(+6.40)#44 | 37.3%(+0.900)#9,904 |
| 45. | 83634 | 38.1% | 31.8%(+6.30)#45 | 37.3%(+0.800)#9,917 |
| 46. | 83714 | 38.0% | 31.8%(+6.20)#46 | 37.3%(+0.700)#9,985 |
| 47. | 83860 | 38.0% | 31.8%(+6.20)#47 | 37.3%(+0.700)#9,995 |
| 48. | 83655 | 37.9% | 31.8%(+6.10)#48 | 37.3%(+0.600)#10,054 |
| 49. | 83404 | 37.7% | 31.8%(+5.90)#49 | 37.3%(+0.400)#10,140 |
| 50. | 83706 | 37.5% | 31.8%(+5.70)#50 | 37.3%(+0.200)#10,253 |
| 51. | 83218 | 37.1% | 31.8%(+5.30)#51 | 37.3%(-0.200)#10,522 |
| 52. | 83336 | 37.0% | 31.8%(+5.20)#52 | 37.3%(-0.300)#10,557 |
| 53. | 83645 | 36.9% | 31.8%(+5.10)#53 | 37.3%(-0.400)#10,661 |
| 54. | 83686 | 36.5% | 31.8%(+4.70)#54 | 37.3%(-0.800)#10,858 |
| 55. | 83346 | 36.4% | 31.8%(+4.60)#55 | 37.3%(-0.900)#10,945 |
| 56. | 83835 | 36.1% | 31.8%(+4.30)#56 | 37.3%(-1.20)#11,077 |
| 57. | 83466 | 36.1% | 31.8%(+4.30)#57 | 37.3%(-1.20)#11,119 |
| 58. | 83644 | 36.0% | 31.8%(+4.20)#58 | 37.3%(-1.30)#11,135 |
| 59. | 83228 | 35.8% | 31.8%(+4.00)#59 | 37.3%(-1.50)#11,299 |
| 60. | 83253 | 35.7% | 31.8%(+3.90)#60 | 37.3%(-1.60)#11,371 |
| 61. | 83250 | 35.3% | 31.8%(+3.50)#61 | 37.3%(-2.00)#11,619 |
| 62. | 83442 | 34.8% | 31.8%(+3.00)#62 | 37.3%(-2.50)#11,887 |
| 63. | 83641 | 34.8% | 31.8%(+3.00)#63 | 37.3%(-2.50)#11,909 |
| 64. | 83654 | 34.7% | 31.8%(+2.90)#64 | 37.3%(-2.60)#11,977 |
| 65. | 83327 | 34.1% | 31.8%(+2.30)#65 | 37.3%(-3.20)#12,377 |
| 66. | 83406 | 33.6% | 31.8%(+1.80)#66 | 37.3%(-3.70)#12,710 |
| 67. | 83214 | 33.6% | 31.8%(+1.80)#67 | 37.3%(-3.70)#12,750 |
| 68. | 83286 | 33.2% | 31.8%(+1.40)#68 | 37.3%(-4.10)#12,995 |
| 69. | 83857 | 33.1% | 31.8%(+1.30)#69 | 37.3%(-4.20)#13,067 |
| 70. | 83703 | 33.0% | 31.8%(+1.20)#70 | 37.3%(-4.30)#13,109 |
| 71. | 83607 | 32.4% | 31.8%(+0.600)#71 | 37.3%(-4.90)#13,530 |
| 72. | 83245 | 32.2% | 31.8%(+0.400)#72 | 37.3%(-5.10)#13,730 |
| 73. | 83402 | 32.1% | 31.8%(+0.300)#73 | 37.3%(-5.20)#13,768 |
| 74. | 83801 | 32.1% | 31.8%(+0.300)#74 | 37.3%(-5.20)#13,786 |
| 75. | 83501 | 32.0% | 31.8%(+0.200)#75 | 37.3%(-5.30)#13,853 |
| 76. | 83869 | 32.0% | 31.8%(+0.200)#76 | 37.3%(-5.30)#13,884 |
| 77. | 83401 | 31.8% | 31.8%(=0.000)#77 | 37.3%(-5.50)#14,006 |
| 78. | 83622 | 31.8% | 31.8%(=0.000)#78 | 37.3%(-5.50)#14,051 |
| 79. | 83221 | 31.7% | 31.8%(-0.100)#79 | 37.3%(-5.60)#14,092 |
| 80. | 83670 | 31.6% | 31.8%(-0.200)#80 | 37.3%(-5.70)#14,219 |
| 81. | 83223 | 31.6% | 31.8%(-0.200)#81 | 37.3%(-5.70)#14,229 |
| 82. | 83815 | 31.4% | 31.8%(-0.400)#82 | 37.3%(-5.90)#14,306 |
| 83. | 83537 | 31.4% | 31.8%(-0.400)#83 | 37.3%(-5.90)#14,348 |
| 84. | 83854 | 31.1% | 31.8%(-0.700)#84 | 37.3%(-6.20)#14,548 |
| 85. | 83814 | 31.0% | 31.8%(-0.800)#85 | 37.3%(-6.30)#14,641 |
| 86. | 83428 | 31.0% | 31.8%(-0.800)#86 | 37.3%(-6.30)#14,697 |
| 87. | 83232 | 30.6% | 31.8%(-1.20)#87 | 37.3%(-6.70)#15,029 |
| 88. | 83676 | 30.4% | 31.8%(-1.40)#88 | 37.3%(-6.90)#15,133 |
| 89. | 83619 | 30.3% | 31.8%(-1.50)#89 | 37.3%(-7.00)#15,207 |
| 90. | 83448 | 30.3% | 31.8%(-1.50)#90 | 37.3%(-7.00)#15,220 |
| 91. | 83234 | 30.3% | 31.8%(-1.50)#91 | 37.3%(-7.00)#15,233 |
| 92. | 83272 | 30.2% | 31.8%(-1.60)#92 | 37.3%(-7.10)#15,342 |
| 93. | 83263 | 29.8% | 31.8%(-2.00)#93 | 37.3%(-7.50)#15,598 |
| 94. | 83872 | 29.8% | 31.8%(-2.00)#94 | 37.3%(-7.50)#15,638 |
| 95. | 83302 | 29.7% | 31.8%(-2.10)#95 | 37.3%(-7.60)#15,733 |
| 96. | 83548 | 29.6% | 31.8%(-2.20)#96 | 37.3%(-7.70)#15,816 |
| 97. | 83656 | 29.2% | 31.8%(-2.60)#97 | 37.3%(-8.10)#16,132 |
| 98. | 83864 | 28.9% | 31.8%(-2.90)#98 | 37.3%(-8.40)#16,325 |
| 99. | 83313 | 28.7% | 31.8%(-3.10)#99 | 37.3%(-8.60)#16,526 |
| 100. | 83276 | 28.6% | 31.8%(-3.20)#100 | 37.3%(-8.70)#16,605 |
Common Questions
What are the Top 10 Zip Codes with the Highest Percentage of Households with Income Above $100,000 in Idaho?
Top 10 Zip Codes with the Highest Percentage of Households with Income Above $100,000 in Idaho are:
What zip code has the Highest Percentage of Households with Income Above $100,000 in Idaho?
83281 has the Highest Percentage of Households with Income Above $100,000 in Idaho with 93.9%.
What is the Percentage of Households with Income Above $100,000 in the State of Idaho?
Percentage of Households with Income Above $100,000 in Idaho is 31.8%.
What is the Percentage of Households with Income Above $100,000 in the United States?
Percentage of Households with Income Above $100,000 in the United States is 37.3%.