Lake Lure, NC Map & Demographics
Lake Lure Map
Lake Lure Overview
$64,692
PER CAPITA INCOME
$117,750
AVG FAMILY INCOME
$75,259
AVG HOUSEHOLD INCOME
43.8%
WAGE / INCOME GAP [ % ]
56.2¢/ $1
WAGE / INCOME GAP [ $ ]
0.53
INEQUALITY / GINI INDEX
1,575
TOTAL POPULATION
750
MALE POPULATION
825
FEMALE POPULATION
90.91
MALES / 100 FEMALES
110.00
FEMALES / 100 MALES
61.6
MEDIAN AGE
2.4
AVG FAMILY SIZE
1.9
AVG HOUSEHOLD SIZE
627
LABOR FORCE [ PEOPLE ]
43.6%
PERCENT IN LABOR FORCE
4.1%
UNEMPLOYMENT RATE
Lake Lure Zip Codes
Lake Lure Area Codes
Income in Lake Lure
Income Overview in Lake Lure
Per Capita Income in Lake Lure is $64,692, while median incomes of families and households are $117,750 and $75,259 respectively.
| Characteristic | Number | Measure |
| Per Capita Income | 1,575 | $64,692 |
| Median Family Income | 495 | $117,750 |
| Mean Family Income | 495 | $175,660 |
| Median Household Income | 836 | $75,259 |
| Mean Household Income | 836 | $125,289 |
| Income Deficit | 495 | $0 |
| Wage / Income Gap (%) | 1,575 | 43.77% |
| Wage / Income Gap ($) | 1,575 | 56.23¢ per $1 |
| Gini / Inequality Index | 1,575 | 0.53 |
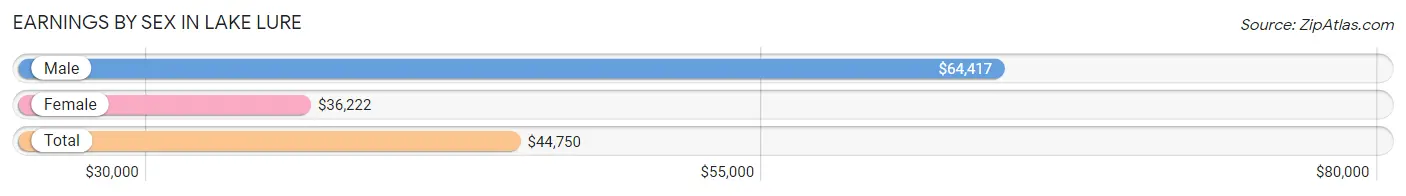
Earnings by Sex in Lake Lure
Average Earnings in Lake Lure are $44,750, $64,417 for men and $36,222 for women, a difference of 43.8%.
| Sex | Number | Average Earnings |
| Male | 399 (58.8%) | $64,417 |
| Female | 280 (41.2%) | $36,222 |
| Total | 679 (100.0%) | $44,750 |
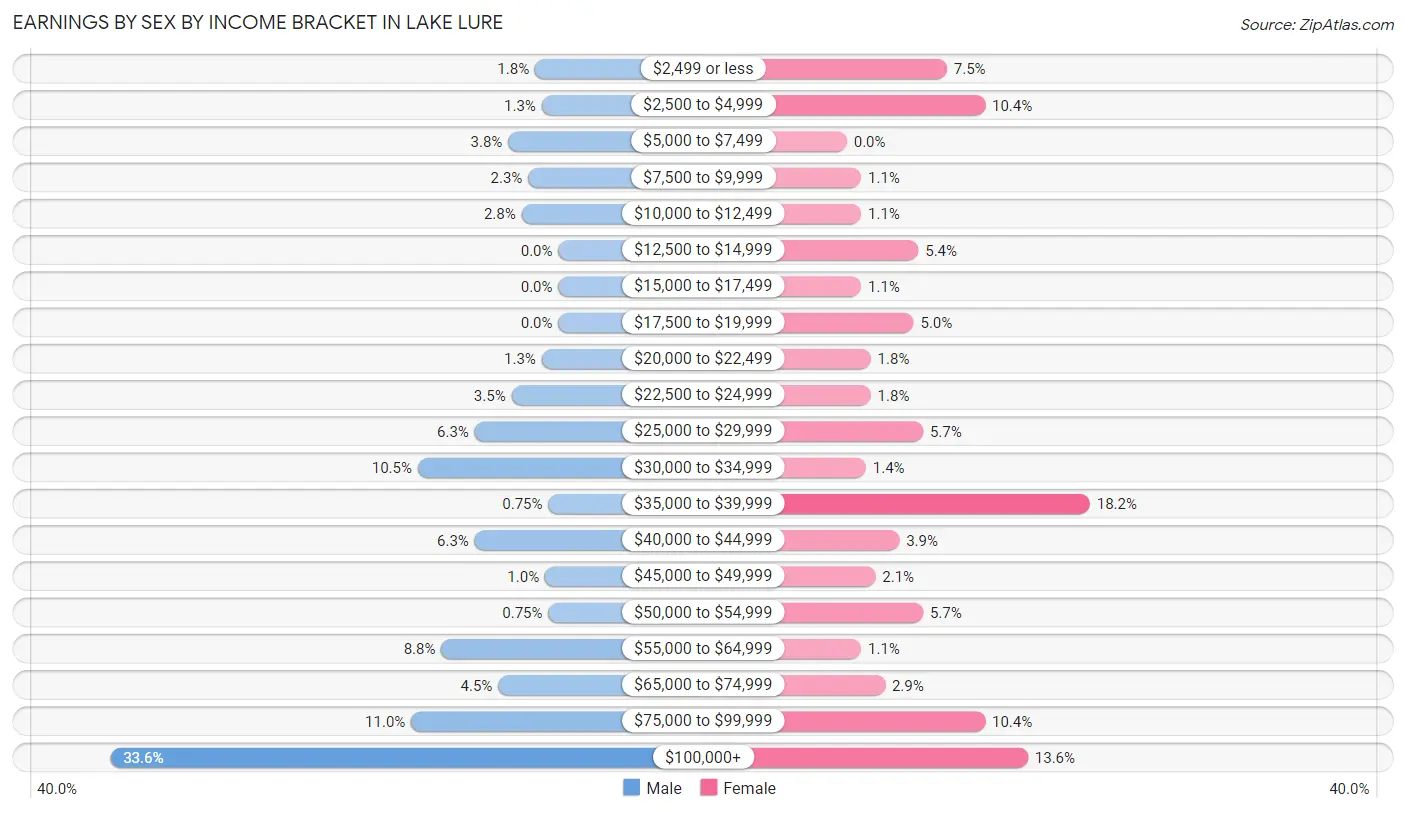
Earnings by Sex by Income Bracket in Lake Lure
The most common earnings brackets in Lake Lure are $100,000+ for men (134 | 33.6%) and $35,000 to $39,999 for women (51 | 18.2%).
| Income | Male | Female |
| $2,499 or less | 7 (1.8%) | 21 (7.5%) |
| $2,500 to $4,999 | 5 (1.3%) | 29 (10.4%) |
| $5,000 to $7,499 | 15 (3.8%) | 0 (0.0%) |
| $7,500 to $9,999 | 9 (2.3%) | 3 (1.1%) |
| $10,000 to $12,499 | 11 (2.8%) | 3 (1.1%) |
| $12,500 to $14,999 | 0 (0.0%) | 15 (5.4%) |
| $15,000 to $17,499 | 0 (0.0%) | 3 (1.1%) |
| $17,500 to $19,999 | 0 (0.0%) | 14 (5.0%) |
| $20,000 to $22,499 | 5 (1.3%) | 5 (1.8%) |
| $22,500 to $24,999 | 14 (3.5%) | 5 (1.8%) |
| $25,000 to $29,999 | 25 (6.3%) | 16 (5.7%) |
| $30,000 to $34,999 | 42 (10.5%) | 4 (1.4%) |
| $35,000 to $39,999 | 3 (0.7%) | 51 (18.2%) |
| $40,000 to $44,999 | 25 (6.3%) | 11 (3.9%) |
| $45,000 to $49,999 | 4 (1.0%) | 6 (2.1%) |
| $50,000 to $54,999 | 3 (0.7%) | 16 (5.7%) |
| $55,000 to $64,999 | 35 (8.8%) | 3 (1.1%) |
| $65,000 to $74,999 | 18 (4.5%) | 8 (2.9%) |
| $75,000 to $99,999 | 44 (11.0%) | 29 (10.4%) |
| $100,000+ | 134 (33.6%) | 38 (13.6%) |
| Total | 399 (100.0%) | 280 (100.0%) |
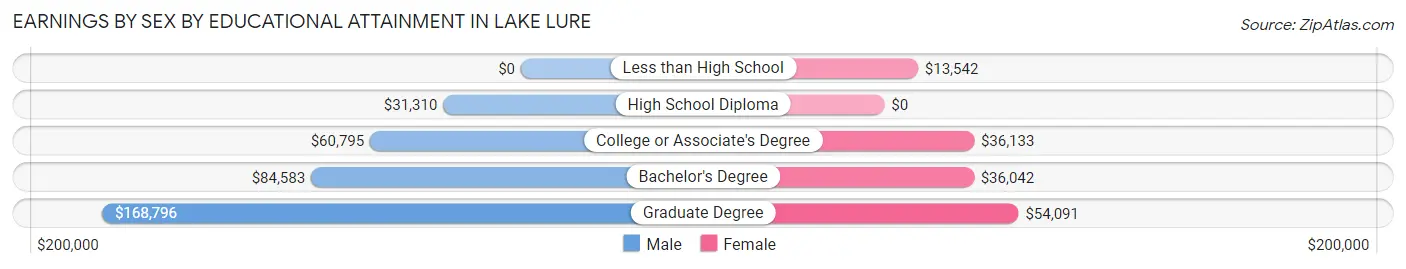
Earnings by Sex by Educational Attainment in Lake Lure
Average earnings in Lake Lure are $72,000 for men and $36,316 for women, a difference of 49.6%. Men with an educational attainment of graduate degree enjoy the highest average annual earnings of $168,796, while those with high school diploma education earn the least with $31,310. Women with an educational attainment of graduate degree earn the most with the average annual earnings of $54,091, while those with less than high school education have the smallest earnings of $13,542.
| Educational Attainment | Male Income | Female Income |
| Less than High School | - | - |
| High School Diploma | $31,310 | $0 |
| College or Associate's Degree | $60,795 | $36,133 |
| Bachelor's Degree | $84,583 | $36,042 |
| Graduate Degree | $168,796 | $54,091 |
| Total | $72,000 | $36,316 |
Family Income in Lake Lure
Family Income Brackets in Lake Lure
According to the Lake Lure family income data, there are 152 families falling into the $200,000+ income range, which is the most common income bracket and makes up 30.7% of all families.
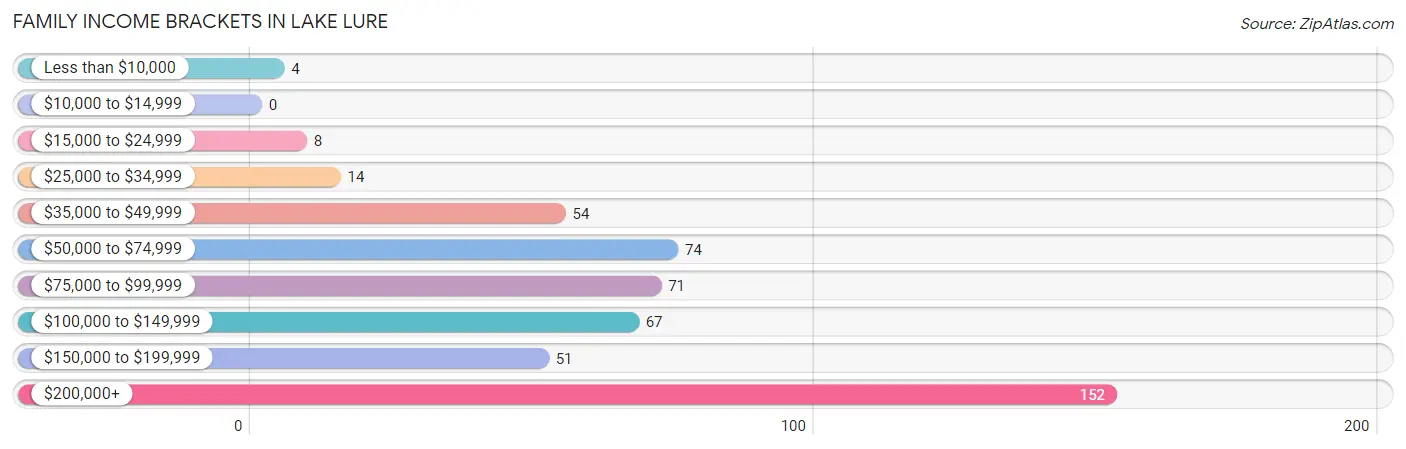
| Income Bracket | # Families | % Families |
| Less than $10,000 | 4 | 0.8% |
| $10,000 to $14,999 | 0 | 0.0% |
| $15,000 to $24,999 | 8 | 1.6% |
| $25,000 to $34,999 | 14 | 2.8% |
| $35,000 to $49,999 | 54 | 10.9% |
| $50,000 to $74,999 | 74 | 14.9% |
| $75,000 to $99,999 | 71 | 14.3% |
| $100,000 to $149,999 | 67 | 13.5% |
| $150,000 to $199,999 | 51 | 10.3% |
| $200,000+ | 152 | 30.7% |
Family Income by Famaliy Size in Lake Lure
4-person families (25 | 5.1%) account for the highest median family income in Lake Lure with $160,417 per family, while 2-person families (403 | 81.4%) have the highest median income of $55,364 per family member.
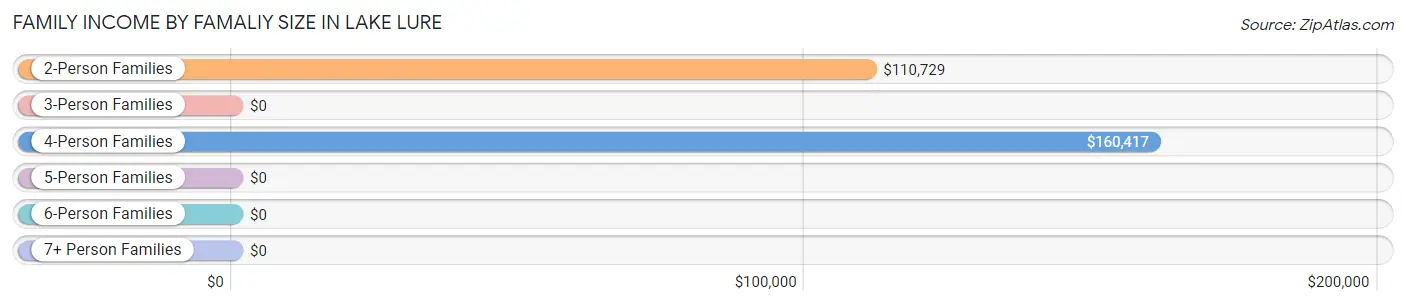
| Income Bracket | # Families | Median Income |
| 2-Person Families | 403 (81.4%) | $110,729 |
| 3-Person Families | 48 (9.7%) | $0 |
| 4-Person Families | 25 (5.1%) | $160,417 |
| 5-Person Families | 19 (3.8%) | $0 |
| 6-Person Families | 0 (0.0%) | $0 |
| 7+ Person Families | 0 (0.0%) | $0 |
| Total | 495 (100.0%) | $117,750 |
Family Income by Number of Earners in Lake Lure
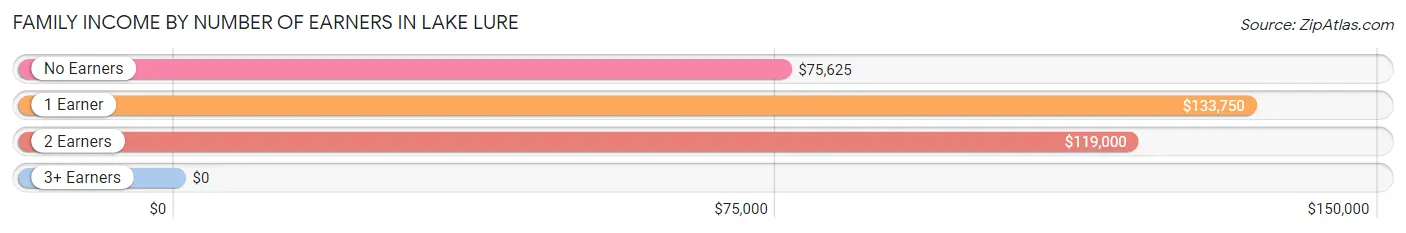
| Number of Earners | # Families | Median Income |
| No Earners | 122 (24.6%) | $75,625 |
| 1 Earner | 209 (42.2%) | $133,750 |
| 2 Earners | 152 (30.7%) | $119,000 |
| 3+ Earners | 12 (2.4%) | $0 |
| Total | 495 (100.0%) | $117,750 |
Household Income in Lake Lure
Household Income Brackets in Lake Lure
With 157 households falling in the category, the $200,000+ income range is the most frequent in Lake Lure, accounting for 18.8% of all households. In contrast, only 8 households (1.0%) fall into the $10,000 to $14,999 income bracket, making it the least populous group.
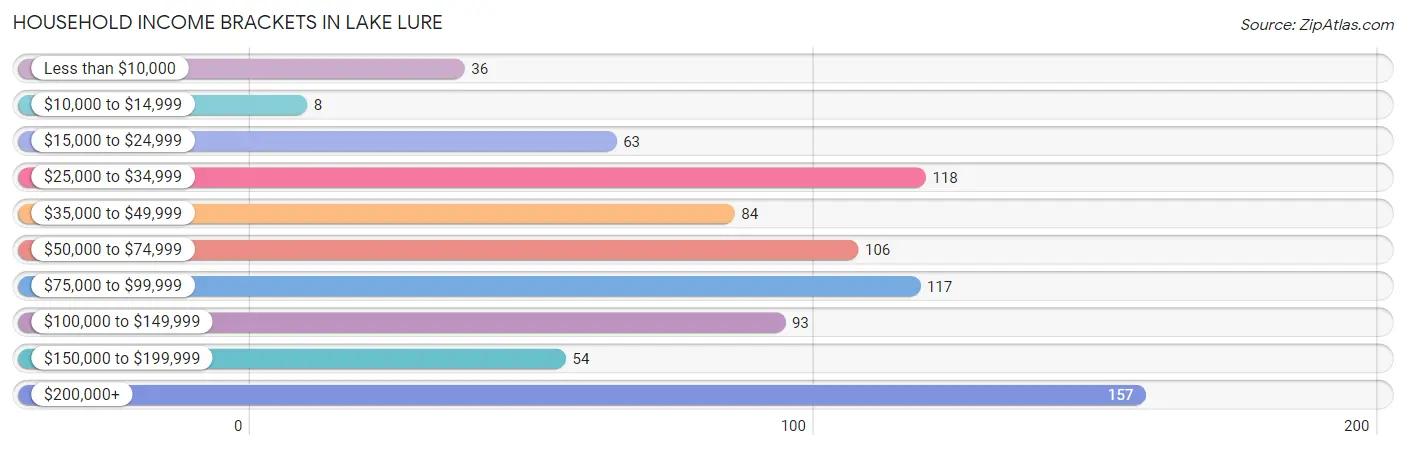
| Income Bracket | # Households | % Households |
| Less than $10,000 | 36 | 4.3% |
| $10,000 to $14,999 | 8 | 1.0% |
| $15,000 to $24,999 | 63 | 7.5% |
| $25,000 to $34,999 | 118 | 14.1% |
| $35,000 to $49,999 | 84 | 10.0% |
| $50,000 to $74,999 | 106 | 12.7% |
| $75,000 to $99,999 | 117 | 14.0% |
| $100,000 to $149,999 | 93 | 11.1% |
| $150,000 to $199,999 | 54 | 6.5% |
| $200,000+ | 157 | 18.8% |
Household Income by Householder Age in Lake Lure
The median household income in Lake Lure is $75,259, with the highest median household income of $89,444 found in the 45 to 64 years age bracket for the primary householder. A total of 308 households (36.8%) fall into this category. Meanwhile, the 15 to 24 years age bracket for the primary householder has the lowest median household income of $0, with 17 households (2.0%) in this group.
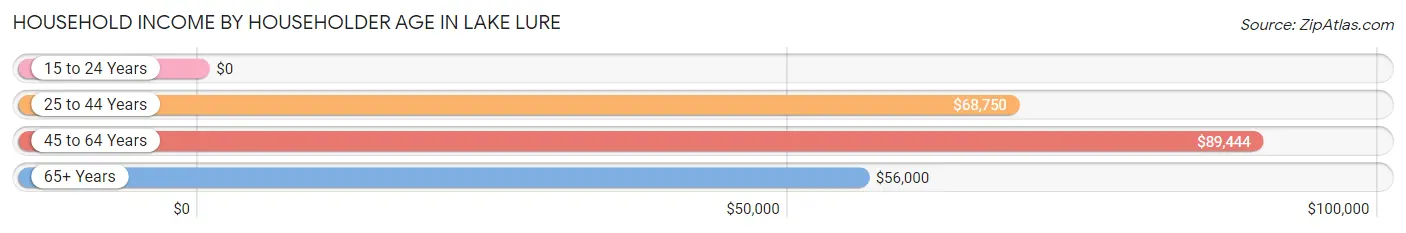
| Income Bracket | # Households | Median Income |
| 15 to 24 Years | 17 (2.0%) | $0 |
| 25 to 44 Years | 91 (10.9%) | $68,750 |
| 45 to 64 Years | 308 (36.8%) | $89,444 |
| 65+ Years | 420 (50.2%) | $56,000 |
| Total | 836 (100.0%) | $75,259 |
Poverty in Lake Lure
Income Below Poverty by Sex and Age in Lake Lure
With 10.1% poverty level for males and 5.9% for females among the residents of Lake Lure, 45 to 54 year old males and 15 year old females are the most vulnerable to poverty, with 24 males (38.1%) and 1 females (100.0%) in their respective age groups living below the poverty level.
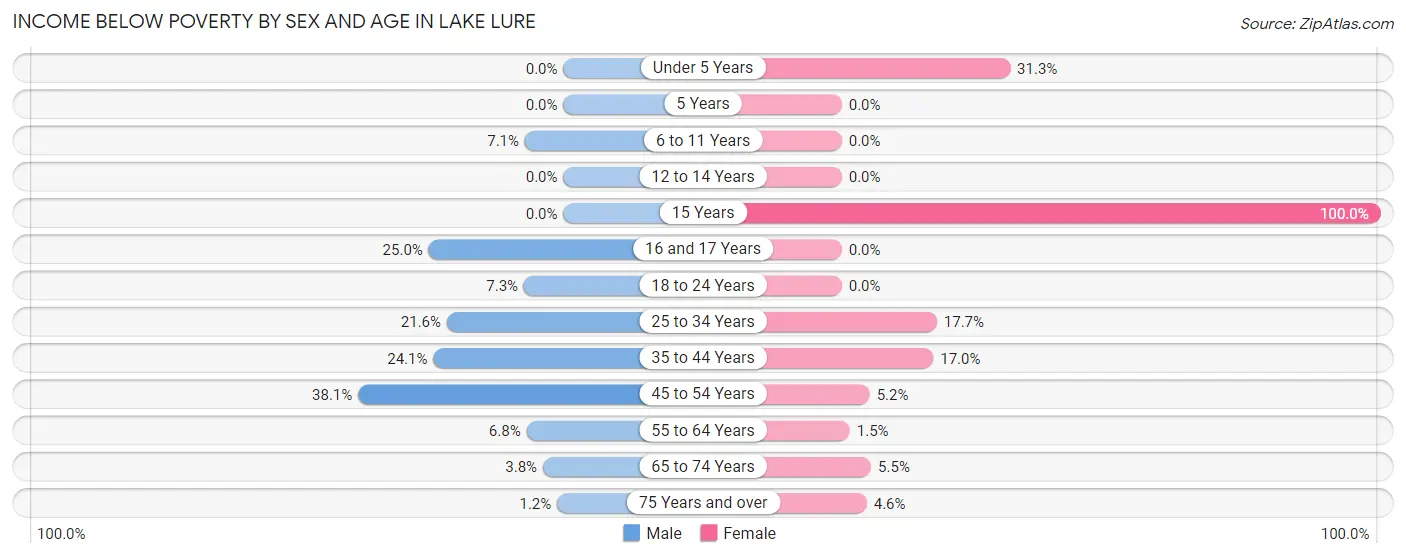
| Age Bracket | Male | Female |
| Under 5 Years | 0 (0.0%) | 5 (31.2%) |
| 5 Years | 0 (0.0%) | 0 (0.0%) |
| 6 to 11 Years | 3 (7.1%) | 0 (0.0%) |
| 12 to 14 Years | 0 (0.0%) | 0 (0.0%) |
| 15 Years | 0 (0.0%) | 1 (100.0%) |
| 16 and 17 Years | 1 (25.0%) | 0 (0.0%) |
| 18 to 24 Years | 3 (7.3%) | 0 (0.0%) |
| 25 to 34 Years | 8 (21.6%) | 6 (17.6%) |
| 35 to 44 Years | 14 (24.1%) | 9 (17.0%) |
| 45 to 54 Years | 24 (38.1%) | 4 (5.2%) |
| 55 to 64 Years | 16 (6.8%) | 3 (1.5%) |
| 65 to 74 Years | 5 (3.8%) | 14 (5.4%) |
| 75 Years and over | 1 (1.2%) | 7 (4.6%) |
| Total | 75 (10.1%) | 49 (5.9%) |
Income Above Poverty by Sex and Age in Lake Lure
According to the poverty statistics in Lake Lure, males aged under 5 years and females aged 6 to 11 years are the age groups that are most secure financially, with 100.0% of males and 100.0% of females in these age groups living above the poverty line.
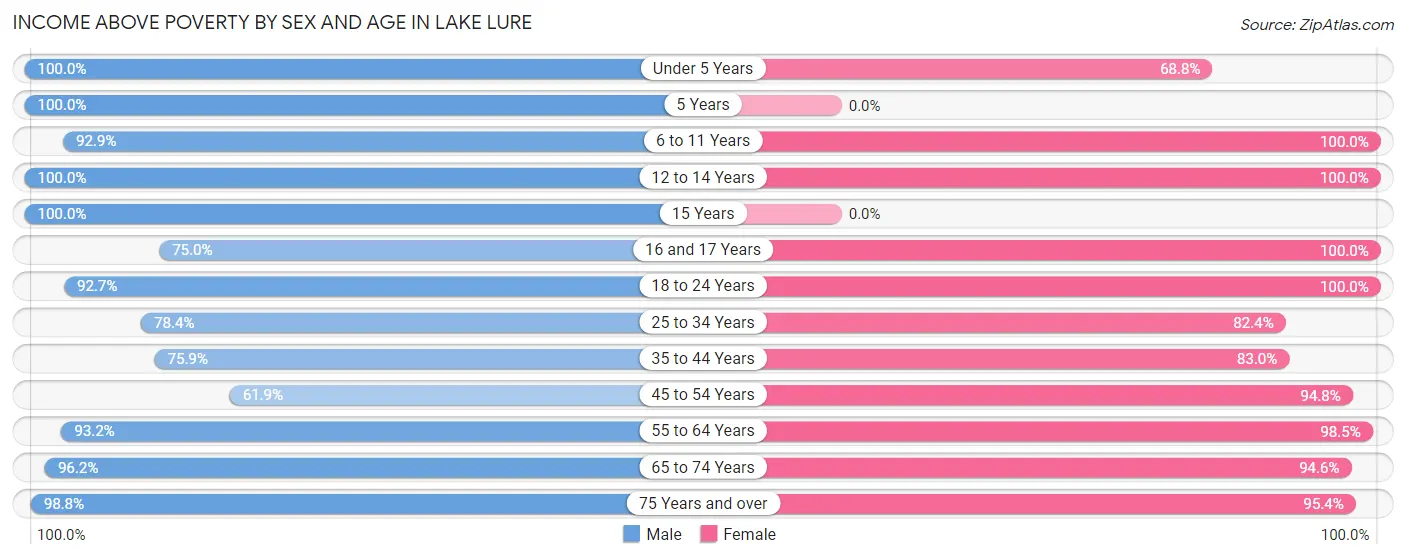
| Age Bracket | Male | Female |
| Under 5 Years | 12 (100.0%) | 11 (68.8%) |
| 5 Years | 14 (100.0%) | 0 (0.0%) |
| 6 to 11 Years | 39 (92.9%) | 24 (100.0%) |
| 12 to 14 Years | 10 (100.0%) | 2 (100.0%) |
| 15 Years | 8 (100.0%) | 0 (0.0%) |
| 16 and 17 Years | 3 (75.0%) | 3 (100.0%) |
| 18 to 24 Years | 38 (92.7%) | 7 (100.0%) |
| 25 to 34 Years | 29 (78.4%) | 28 (82.4%) |
| 35 to 44 Years | 44 (75.9%) | 44 (83.0%) |
| 45 to 54 Years | 39 (61.9%) | 73 (94.8%) |
| 55 to 64 Years | 218 (93.2%) | 197 (98.5%) |
| 65 to 74 Years | 127 (96.2%) | 243 (94.6%) |
| 75 Years and over | 85 (98.8%) | 144 (95.4%) |
| Total | 666 (89.9%) | 776 (94.1%) |
Income Below Poverty Among Married-Couple Families in Lake Lure
The poverty statistics for married-couple families in Lake Lure show that 2.9% or 13 of the total 450 families live below the poverty line. Families with 1 or 2 children have the highest poverty rate of 13.9%, comprising of 5 families. On the other hand, families with 3 or 4 children have the lowest poverty rate of 0.0%, which includes 0 families.
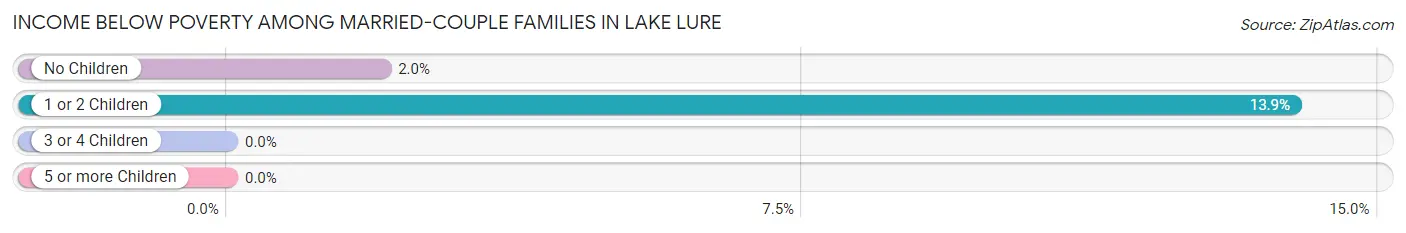
| Children | Above Poverty | Below Poverty |
| No Children | 392 (98.0%) | 8 (2.0%) |
| 1 or 2 Children | 31 (86.1%) | 5 (13.9%) |
| 3 or 4 Children | 14 (100.0%) | 0 (0.0%) |
| 5 or more Children | 0 (0.0%) | 0 (0.0%) |
| Total | 437 (97.1%) | 13 (2.9%) |
Income Below Poverty Among Single-Parent Households in Lake Lure
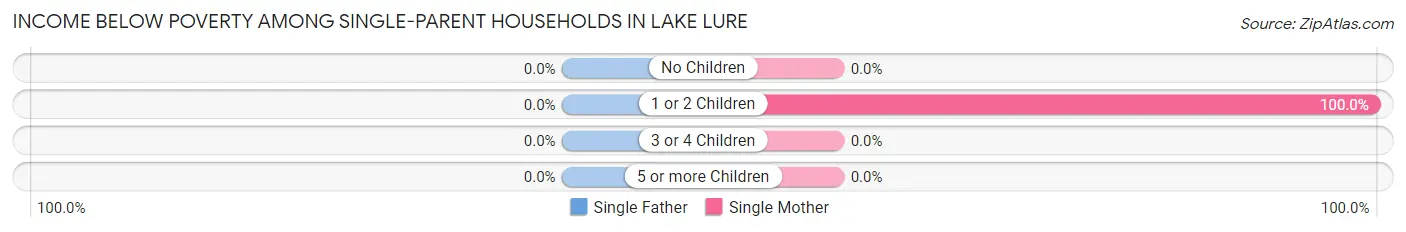
| Children | Single Father | Single Mother |
| No Children | 0 (0.0%) | 0 (0.0%) |
| 1 or 2 Children | 0 (0.0%) | 4 (100.0%) |
| 3 or 4 Children | 0 (0.0%) | 0 (0.0%) |
| 5 or more Children | 0 (0.0%) | 0 (0.0%) |
| Total | 0 (0.0%) | 4 (16.7%) |
Income Below Poverty Among Married-Couple vs Single-Parent Households in Lake Lure
The poverty data for Lake Lure shows that 13 of the married-couple family households (2.9%) and 4 of the single-parent households (8.9%) are living below the poverty level. Within the married-couple family households, those with 1 or 2 children have the highest poverty rate, with 5 households (13.9%) falling below the poverty line. Among the single-parent households, those with 1 or 2 children have the highest poverty rate, with 4 household (16.0%) living below poverty.
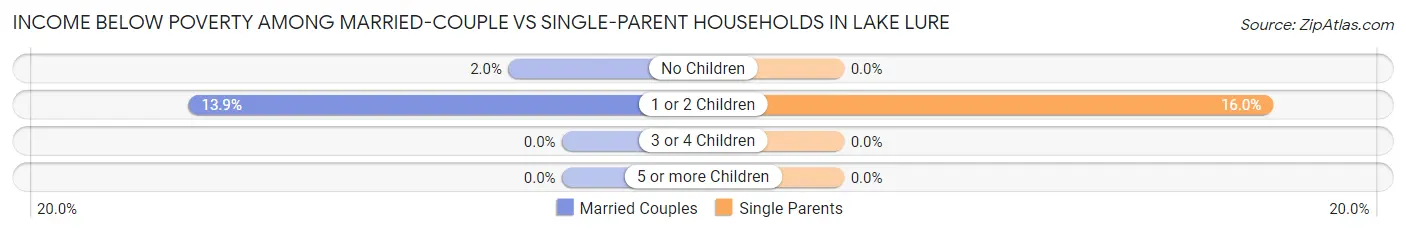
| Children | Married-Couple Families | Single-Parent Households |
| No Children | 8 (2.0%) | 0 (0.0%) |
| 1 or 2 Children | 5 (13.9%) | 4 (16.0%) |
| 3 or 4 Children | 0 (0.0%) | 0 (0.0%) |
| 5 or more Children | 0 (0.0%) | 0 (0.0%) |
| Total | 13 (2.9%) | 4 (8.9%) |
Race in Lake Lure
The most populous races in Lake Lure are White / Caucasian (1,476 | 93.7%), Two or more Races (86 | 5.5%), and Hispanic or Latino (69 | 4.4%).
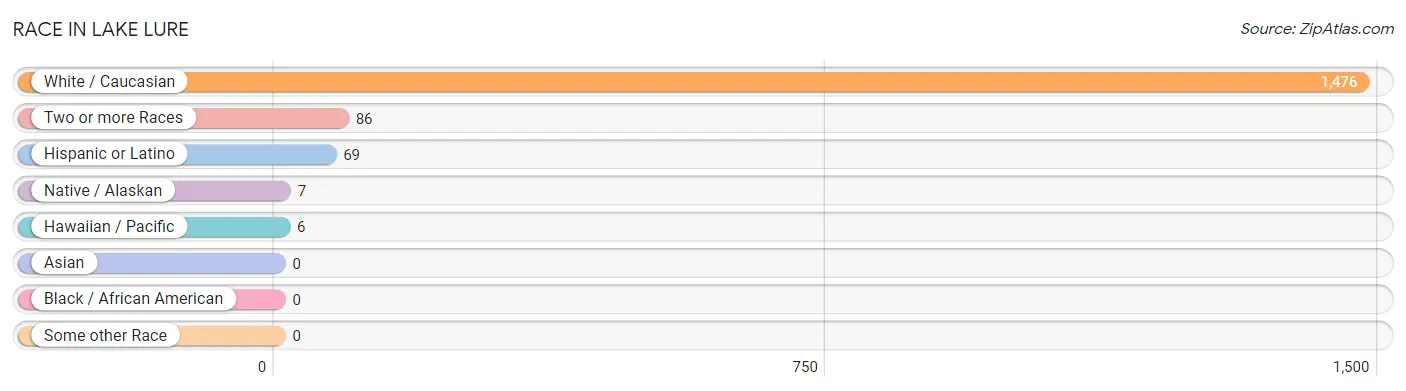
| Race | # Population | % Population |
| Asian | 0 | 0.0% |
| Black / African American | 0 | 0.0% |
| Hawaiian / Pacific | 6 | 0.4% |
| Hispanic or Latino | 69 | 4.4% |
| Native / Alaskan | 7 | 0.4% |
| White / Caucasian | 1,476 | 93.7% |
| Two or more Races | 86 | 5.5% |
| Some other Race | 0 | 0.0% |
| Total | 1,575 | 100.0% |
Ancestry in Lake Lure
The most populous ancestries reported in Lake Lure are English (306 | 19.4%), Irish (261 | 16.6%), German (220 | 14.0%), American (149 | 9.5%), and Welsh (74 | 4.7%), together accounting for 64.1% of all Lake Lure residents.
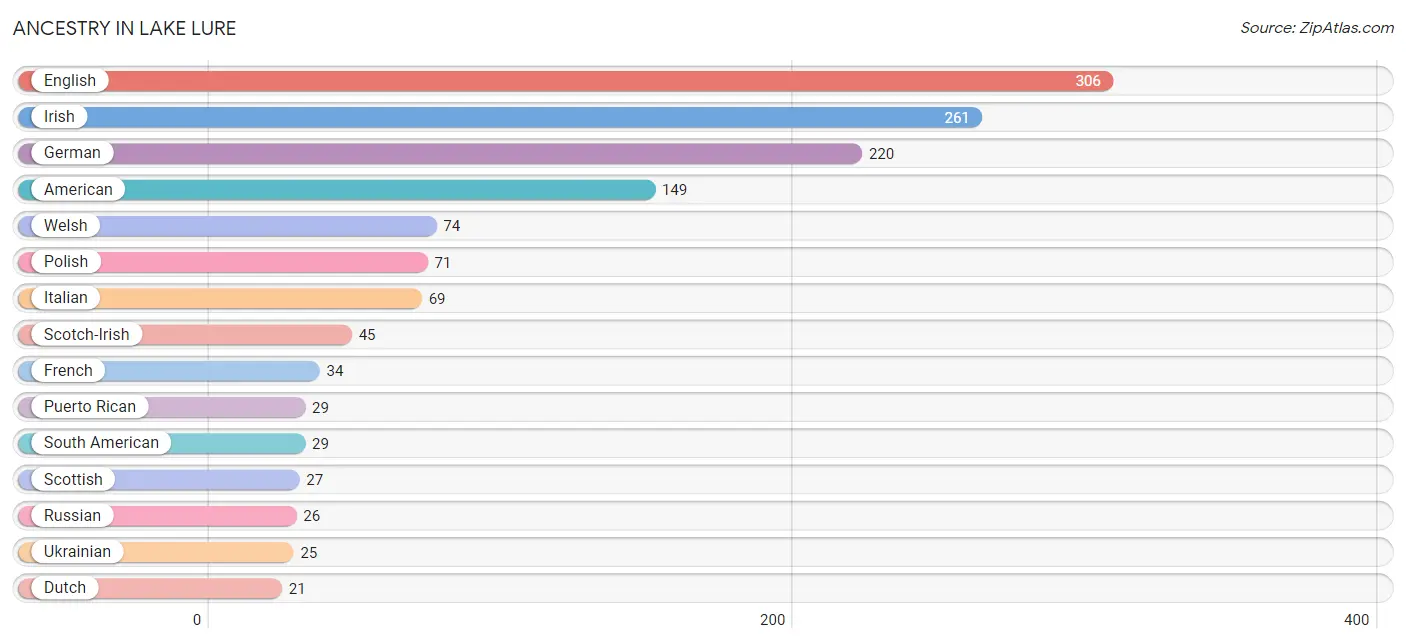
| Ancestry | # Population | % Population |
| American | 149 | 9.5% |
| Arab | 5 | 0.3% |
| Austrian | 3 | 0.2% |
| British | 3 | 0.2% |
| Cambodian | 6 | 0.4% |
| Canadian | 6 | 0.4% |
| Cherokee | 7 | 0.4% |
| Colombian | 8 | 0.5% |
| Cuban | 5 | 0.3% |
| Czech | 5 | 0.3% |
| Danish | 15 | 0.9% |
| Dutch | 21 | 1.3% |
| Eastern European | 10 | 0.6% |
| English | 306 | 19.4% |
| European | 16 | 1.0% |
| Finnish | 4 | 0.3% |
| French | 34 | 2.2% |
| German | 220 | 14.0% |
| Hungarian | 8 | 0.5% |
| Icelander | 4 | 0.3% |
| Irish | 261 | 16.6% |
| Iroquois | 6 | 0.4% |
| Italian | 69 | 4.4% |
| Lebanese | 2 | 0.1% |
| Lithuanian | 12 | 0.8% |
| Native Hawaiian | 6 | 0.4% |
| Norwegian | 6 | 0.4% |
| Polish | 71 | 4.5% |
| Puerto Rican | 29 | 1.8% |
| Russian | 26 | 1.7% |
| Scandinavian | 3 | 0.2% |
| Scotch-Irish | 45 | 2.9% |
| Scottish | 27 | 1.7% |
| Slovak | 3 | 0.2% |
| Slovene | 3 | 0.2% |
| South American | 29 | 1.8% |
| Spanish | 6 | 0.4% |
| Sri Lankan | 8 | 0.5% |
| Swedish | 7 | 0.4% |
| Ukrainian | 25 | 1.6% |
| Venezuelan | 21 | 1.3% |
| Welsh | 74 | 4.7% | View All 42 Rows |
Immigrants in Lake Lure
The most numerous immigrant groups reported in Lake Lure came from Europe (41 | 2.6%), Northern Europe (25 | 1.6%), Latin America (22 | 1.4%), South America (22 | 1.4%), and Venezuela (14 | 0.9%), together accounting for 7.9% of all Lake Lure residents.
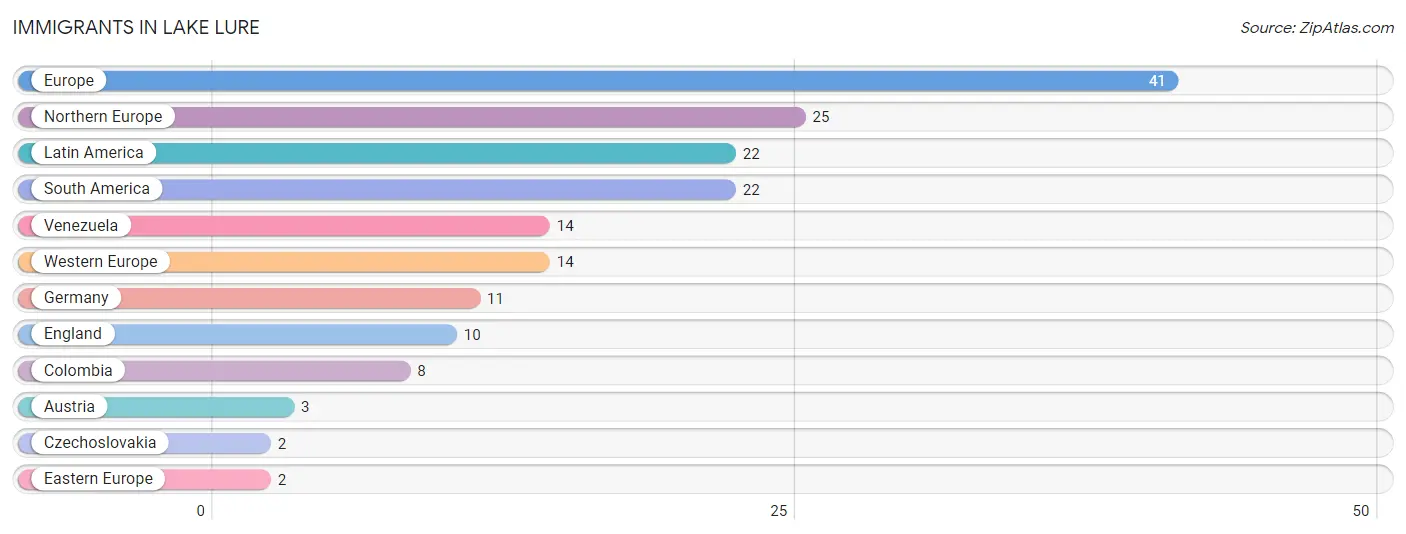
| Immigration Origin | # Population | % Population |
| Austria | 3 | 0.2% |
| Colombia | 8 | 0.5% |
| Czechoslovakia | 2 | 0.1% |
| Eastern Europe | 2 | 0.1% |
| England | 10 | 0.6% |
| Europe | 41 | 2.6% |
| Germany | 11 | 0.7% |
| Latin America | 22 | 1.4% |
| Northern Europe | 25 | 1.6% |
| South America | 22 | 1.4% |
| Venezuela | 14 | 0.9% |
| Western Europe | 14 | 0.9% | View All 12 Rows |
Sex and Age in Lake Lure
Sex and Age in Lake Lure
The most populous age groups in Lake Lure are 60 to 64 Years (122 | 16.3%) for men and 65 to 69 Years (165 | 20.0%) for women.
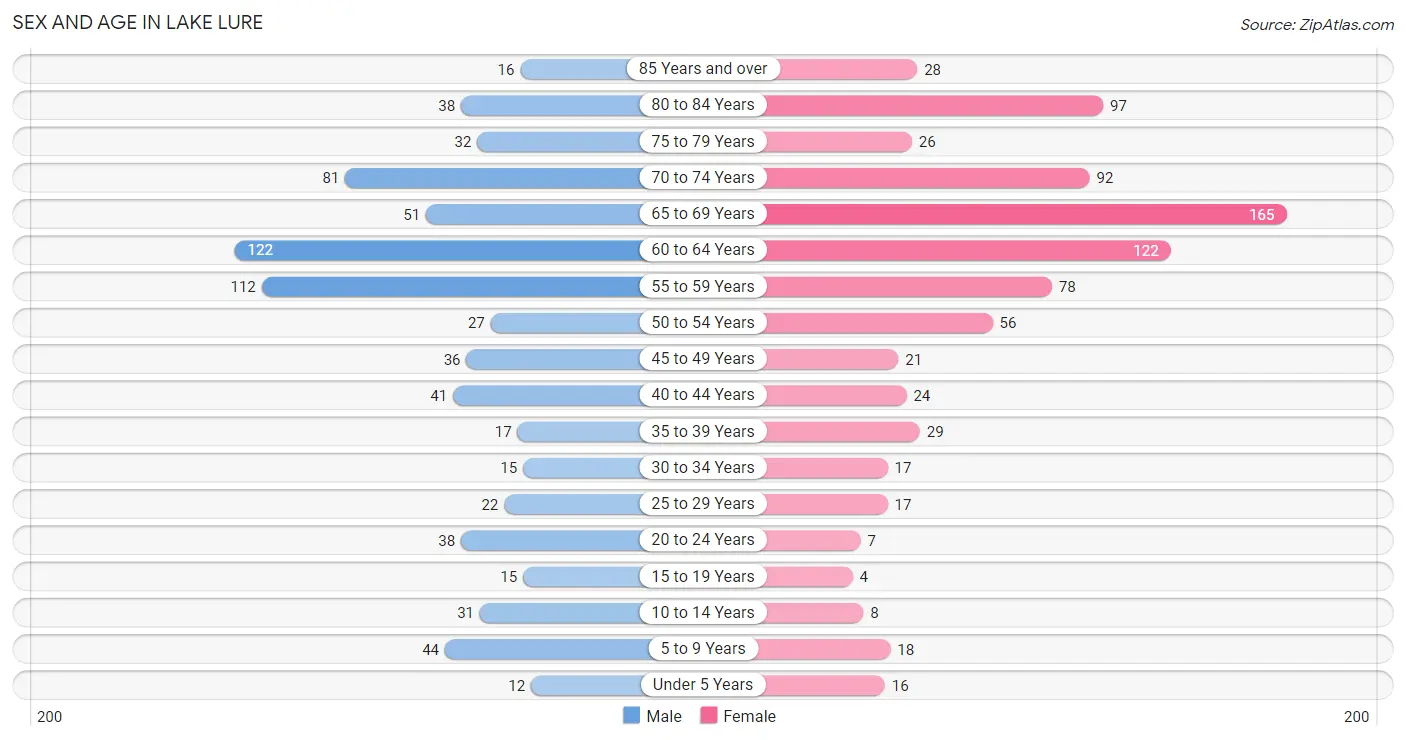
| Age Bracket | Male | Female |
| Under 5 Years | 12 (1.6%) | 16 (1.9%) |
| 5 to 9 Years | 44 (5.9%) | 18 (2.2%) |
| 10 to 14 Years | 31 (4.1%) | 8 (1.0%) |
| 15 to 19 Years | 15 (2.0%) | 4 (0.5%) |
| 20 to 24 Years | 38 (5.1%) | 7 (0.9%) |
| 25 to 29 Years | 22 (2.9%) | 17 (2.1%) |
| 30 to 34 Years | 15 (2.0%) | 17 (2.1%) |
| 35 to 39 Years | 17 (2.3%) | 29 (3.5%) |
| 40 to 44 Years | 41 (5.5%) | 24 (2.9%) |
| 45 to 49 Years | 36 (4.8%) | 21 (2.5%) |
| 50 to 54 Years | 27 (3.6%) | 56 (6.8%) |
| 55 to 59 Years | 112 (14.9%) | 78 (9.5%) |
| 60 to 64 Years | 122 (16.3%) | 122 (14.8%) |
| 65 to 69 Years | 51 (6.8%) | 165 (20.0%) |
| 70 to 74 Years | 81 (10.8%) | 92 (11.2%) |
| 75 to 79 Years | 32 (4.3%) | 26 (3.2%) |
| 80 to 84 Years | 38 (5.1%) | 97 (11.8%) |
| 85 Years and over | 16 (2.1%) | 28 (3.4%) |
| Total | 750 (100.0%) | 825 (100.0%) |
Families and Households in Lake Lure
Median Family Size in Lake Lure
The median family size in Lake Lure is 2.37 persons per family, with single male/father families (21 | 4.2%) accounting for the largest median family size of 2.86 persons per family. On the other hand, married-couple families (450 | 90.9%) represent the smallest median family size with 2.32 persons per family.
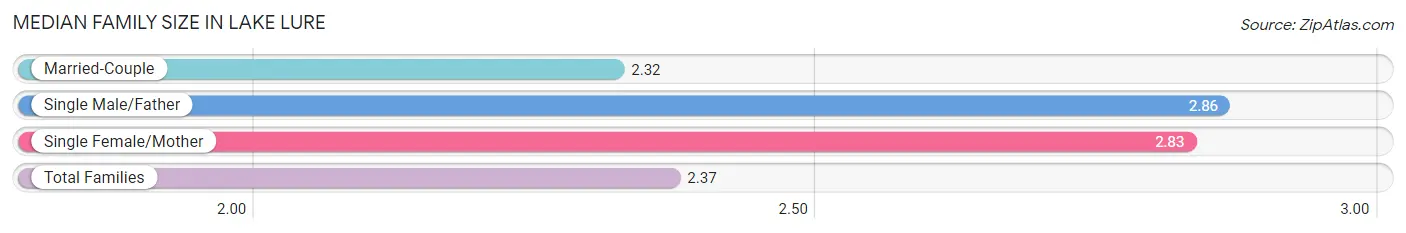
| Family Type | # Families | Family Size |
| Married-Couple | 450 (90.9%) | 2.32 |
| Single Male/Father | 21 (4.2%) | 2.86 |
| Single Female/Mother | 24 (4.9%) | 2.83 |
| Total Families | 495 (100.0%) | 2.37 |
Median Household Size in Lake Lure
The median household size in Lake Lure is 1.88 persons per household, with single female/mother households (24 | 2.9%) accounting for the largest median household size of 3.71 persons per household. non-family households (341 | 40.8%) represent the smallest median household size with 1.07 persons per household.
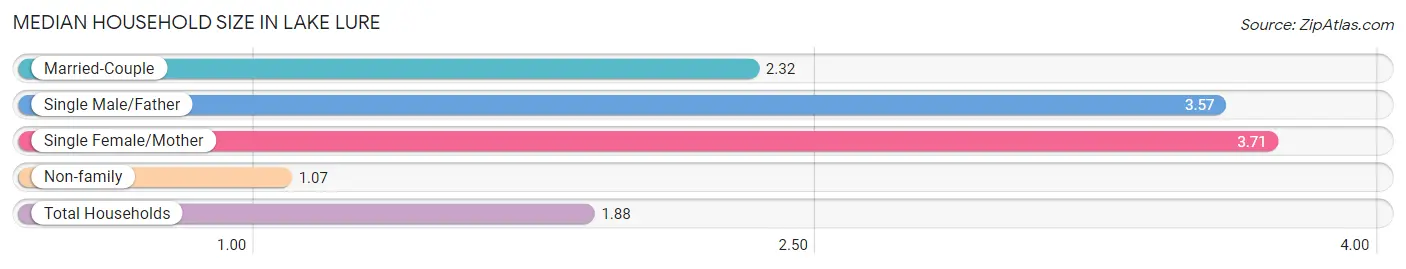
| Household Type | # Households | Household Size |
| Married-Couple | 450 (53.8%) | 2.32 |
| Single Male/Father | 21 (2.5%) | 3.57 |
| Single Female/Mother | 24 (2.9%) | 3.71 |
| Non-family | 341 (40.8%) | 1.07 |
| Total Households | 836 (100.0%) | 1.88 |
Household Size by Marriage Status in Lake Lure
Out of a total of 836 households in Lake Lure, 495 (59.2%) are family households, while 341 (40.8%) are nonfamily households. The most numerous type of family households are 2-person households, comprising 394, and the most common type of nonfamily households are 1-person households, comprising 321.
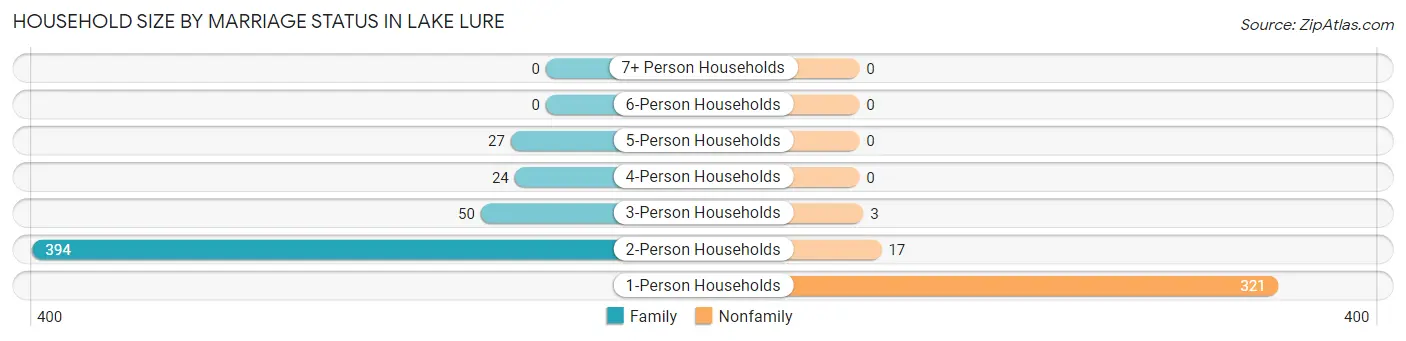
| Household Size | Family Households | Nonfamily Households |
| 1-Person Households | - | 321 (38.4%) |
| 2-Person Households | 394 (47.1%) | 17 (2.0%) |
| 3-Person Households | 50 (6.0%) | 3 (0.4%) |
| 4-Person Households | 24 (2.9%) | 0 (0.0%) |
| 5-Person Households | 27 (3.2%) | 0 (0.0%) |
| 6-Person Households | 0 (0.0%) | 0 (0.0%) |
| 7+ Person Households | 0 (0.0%) | 0 (0.0%) |
| Total | 495 (59.2%) | 341 (40.8%) |
Female Fertility in Lake Lure
Fertility by Age in Lake Lure
Average fertility rate in Lake Lure is 98.0 births per 1,000 women. Women in the age bracket of 35 to 50 years have the highest fertility rate with 156.0 births per 1,000 women. Women in the age bracket of 35 to 50 years acount for 100.0% of all women with births.
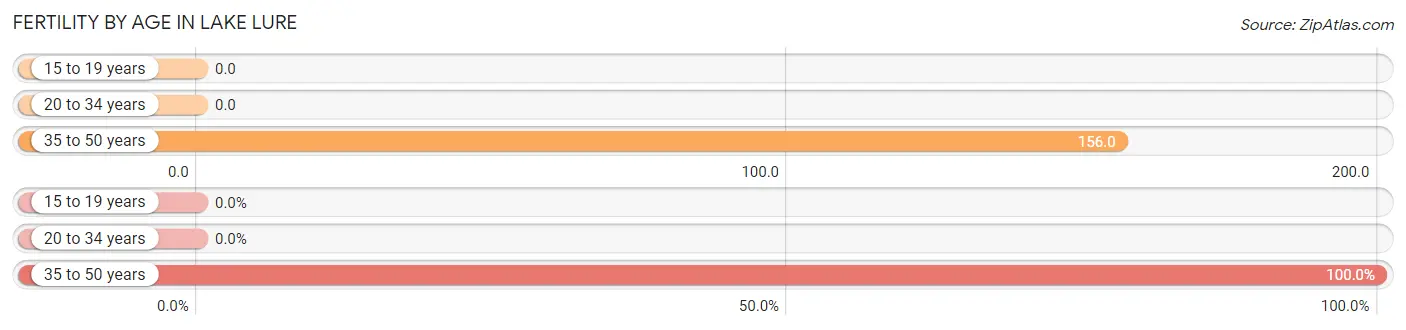
| Age Bracket | Women with Births | Births / 1,000 Women |
| 15 to 19 years | 0 (0.0%) | 0.0 |
| 20 to 34 years | 0 (0.0%) | 0.0 |
| 35 to 50 years | 12 (100.0%) | 156.0 |
| Total | 12 (100.0%) | 98.0 |
Fertility by Age by Marriage Status in Lake Lure
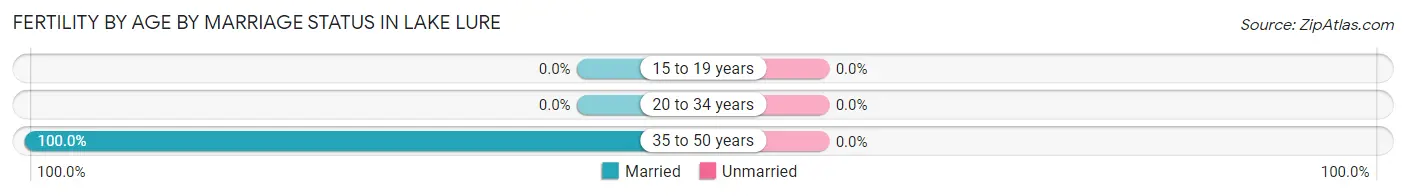
| Age Bracket | Married | Unmarried |
| 15 to 19 years | 0 (0.0%) | 0 (0.0%) |
| 20 to 34 years | 0 (0.0%) | 0 (0.0%) |
| 35 to 50 years | 12 (100.0%) | 0 (0.0%) |
| Total | 12 (100.0%) | 0 (0.0%) |
Fertility by Education in Lake Lure
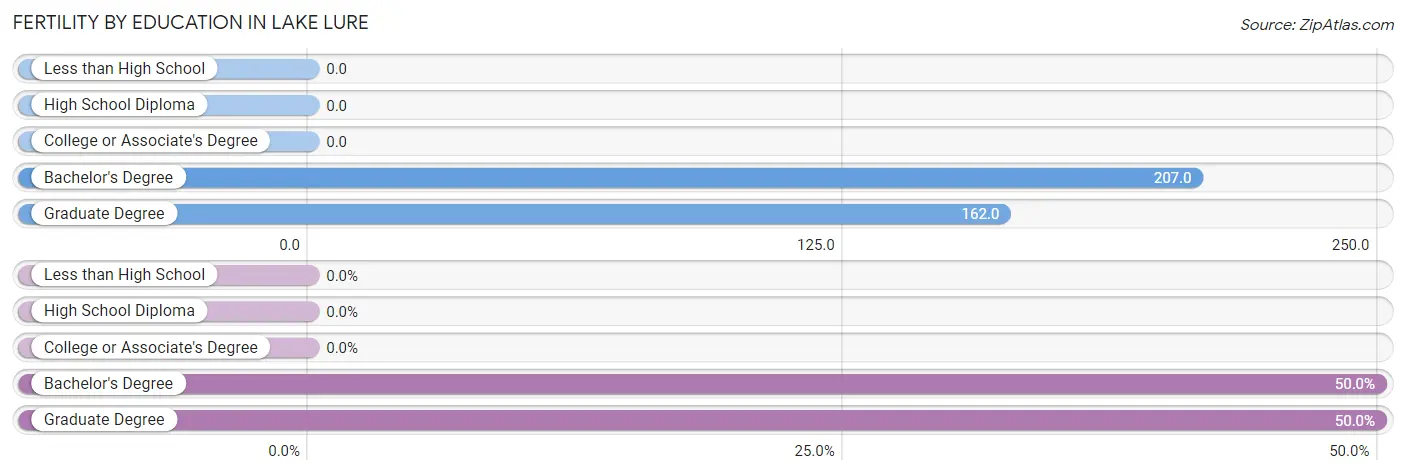
| Educational Attainment | Women with Births | Births / 1,000 Women |
| Less than High School | 0 (0.0%) | 0.0 |
| High School Diploma | 0 (0.0%) | 0.0 |
| College or Associate's Degree | 0 (0.0%) | 0.0 |
| Bachelor's Degree | 6 (50.0%) | 207.0 |
| Graduate Degree | 6 (50.0%) | 162.0 |
| Total | 12 (100.0%) | 98.0 |
Fertility by Education by Marriage Status in Lake Lure
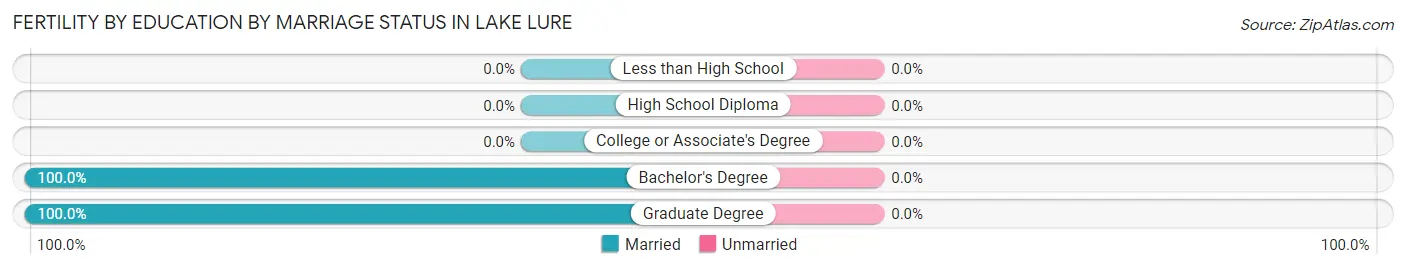
| Educational Attainment | Married | Unmarried |
| Less than High School | 0 (0.0%) | 0 (0.0%) |
| High School Diploma | 0 (0.0%) | 0 (0.0%) |
| College or Associate's Degree | 0 (0.0%) | 0 (0.0%) |
| Bachelor's Degree | 6 (100.0%) | 0 (0.0%) |
| Graduate Degree | 6 (100.0%) | 0 (0.0%) |
| Total | 12 (100.0%) | 0 (0.0%) |
Employment Characteristics in Lake Lure
Employment by Class of Employer in Lake Lure
Among the 593 employed individuals in Lake Lure, private company employees (377 | 63.6%), self-employed (incorporated) (91 | 15.3%), and self-employed (not incorporated) (45 | 7.6%) make up the most common classes of employment.
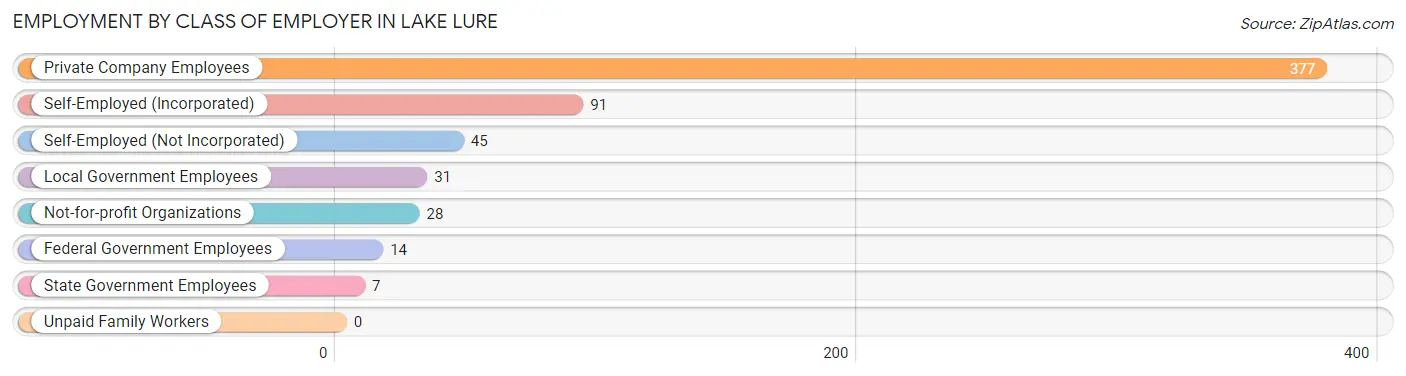
| Employer Class | # Employees | % Employees |
| Private Company Employees | 377 | 63.6% |
| Self-Employed (Incorporated) | 91 | 15.3% |
| Self-Employed (Not Incorporated) | 45 | 7.6% |
| Not-for-profit Organizations | 28 | 4.7% |
| Local Government Employees | 31 | 5.2% |
| State Government Employees | 7 | 1.2% |
| Federal Government Employees | 14 | 2.4% |
| Unpaid Family Workers | 0 | 0.0% |
| Total | 593 | 100.0% |
Employment Status by Age in Lake Lure
According to the labor force statistics for Lake Lure, out of the total population over 16 years of age (1,437), 43.6% or 627 individuals are in the labor force, with 4.1% or 26 of them unemployed. The age group with the highest labor force participation rate is 55 to 59 years, with 84.7% or 161 individuals in the labor force. Within the labor force, the 35 to 44 years age range has the highest percentage of unemployed individuals, with 13.3% or 11 of them being unemployed.
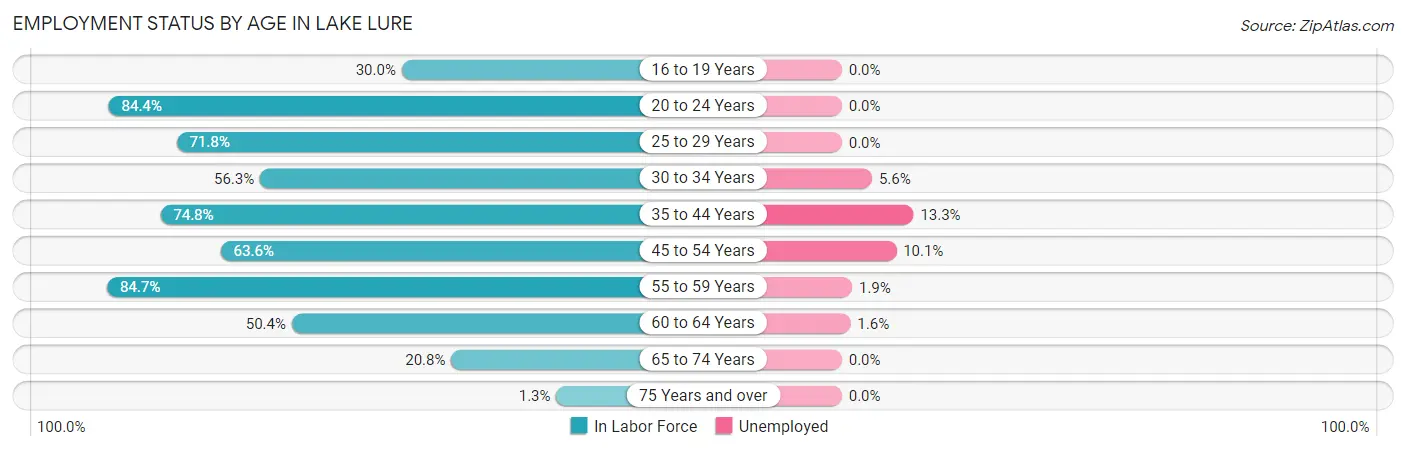
| Age Bracket | In Labor Force | Unemployed |
| 16 to 19 Years | 3 (30.0%) | 0 (0.0%) |
| 20 to 24 Years | 38 (84.4%) | 0 (0.0%) |
| 25 to 29 Years | 28 (71.8%) | 0 (0.0%) |
| 30 to 34 Years | 18 (56.3%) | 1 (5.6%) |
| 35 to 44 Years | 83 (74.8%) | 11 (13.3%) |
| 45 to 54 Years | 89 (63.6%) | 9 (10.1%) |
| 55 to 59 Years | 161 (84.7%) | 3 (1.9%) |
| 60 to 64 Years | 123 (50.4%) | 2 (1.6%) |
| 65 to 74 Years | 81 (20.8%) | 0 (0.0%) |
| 75 Years and over | 3 (1.3%) | 0 (0.0%) |
| Total | 627 (43.6%) | 26 (4.1%) |
Employment Status by Educational Attainment in Lake Lure
According to labor force statistics for Lake Lure, 66.4% of individuals (502) out of the total population between 25 and 64 years of age (756) are in the labor force, with 5.2% or 26 of them being unemployed. The group with the highest labor force participation rate are those with the educational attainment of college / associate degree, with 85.7% or 138 individuals in the labor force. Within the labor force, individuals with high school diploma education have the highest percentage of unemployment, with 15.8% or 12 of them being unemployed.
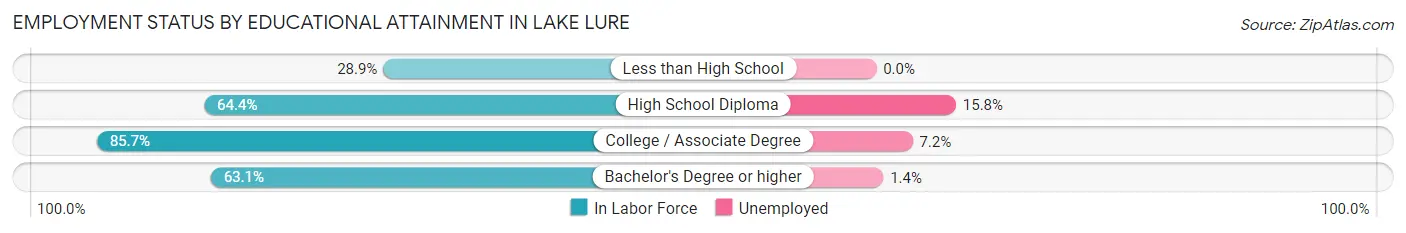
| Educational Attainment | In Labor Force | Unemployed |
| Less than High School | 11 (28.9%) | 0 (0.0%) |
| High School Diploma | 76 (64.4%) | 19 (15.8%) |
| College / Associate Degree | 138 (85.7%) | 12 (7.2%) |
| Bachelor's Degree or higher | 277 (63.1%) | 6 (1.4%) |
| Total | 502 (66.4%) | 39 (5.2%) |
Employment Occupations by Sex in Lake Lure
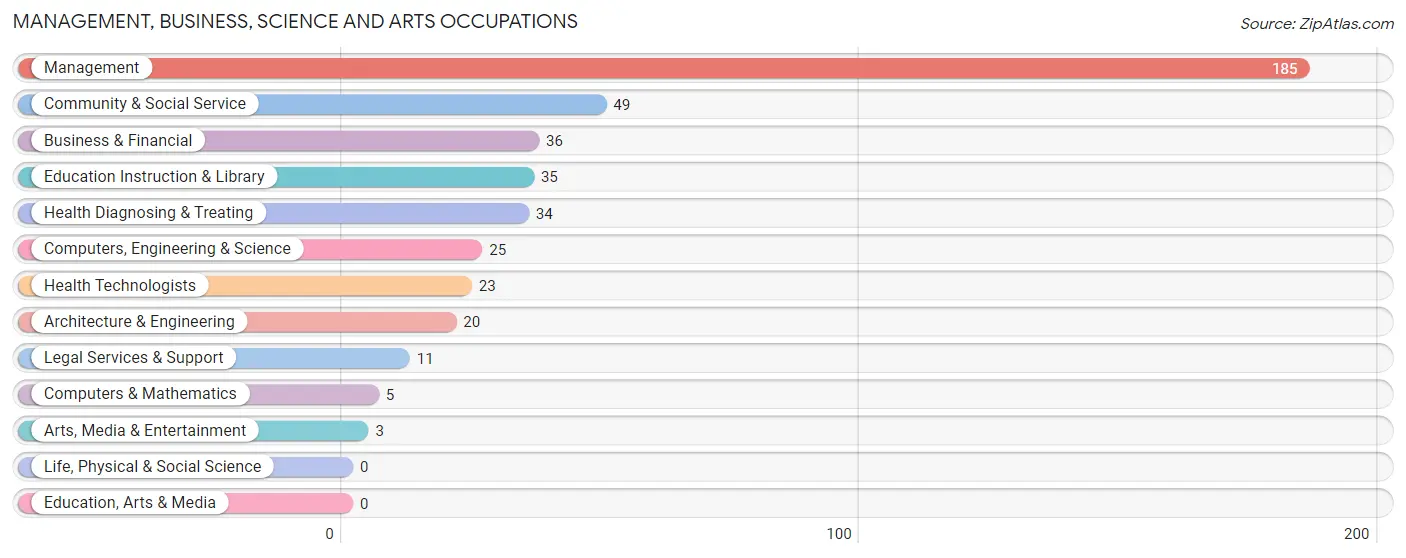
Management, Business, Science and Arts Occupations
The most common Management, Business, Science and Arts occupations in Lake Lure are Management (185 | 30.8%), Community & Social Service (49 | 8.2%), Business & Financial (36 | 6.0%), Education Instruction & Library (35 | 5.8%), and Health Diagnosing & Treating (34 | 5.7%).
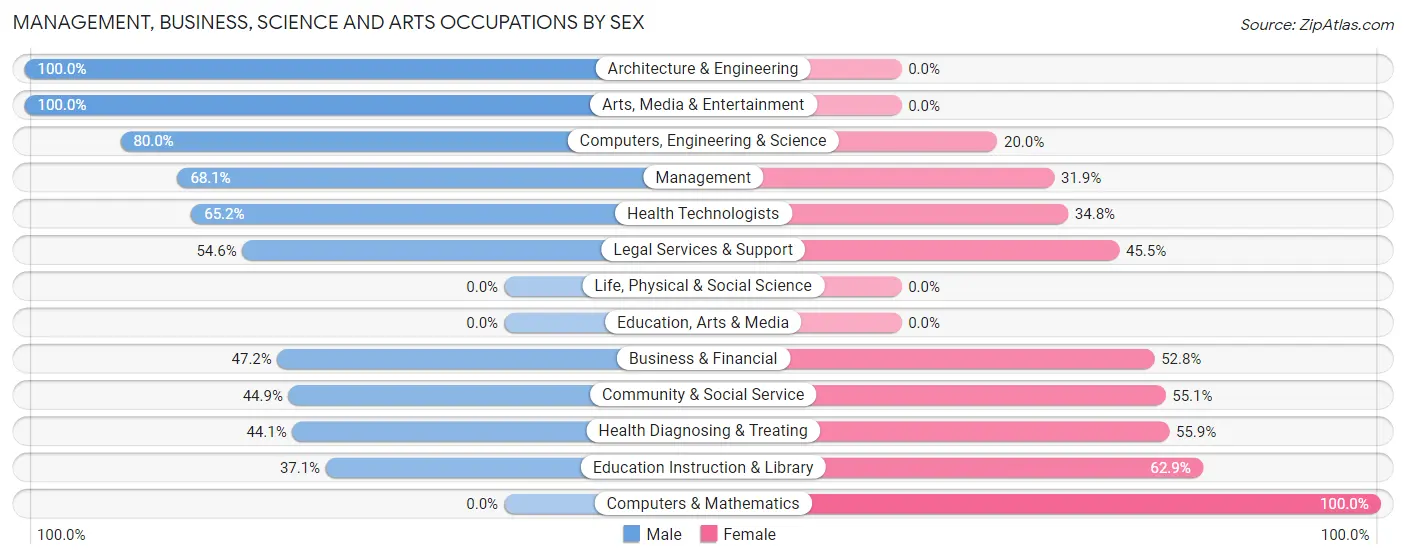
Management, Business, Science and Arts Occupations by Sex
Within the Management, Business, Science and Arts occupations in Lake Lure, the most male-oriented occupations are Architecture & Engineering (100.0%), Arts, Media & Entertainment (100.0%), and Computers, Engineering & Science (80.0%), while the most female-oriented occupations are Computers & Mathematics (100.0%), Education Instruction & Library (62.9%), and Health Diagnosing & Treating (55.9%).
| Occupation | Male | Female |
| Management | 126 (68.1%) | 59 (31.9%) |
| Business & Financial | 17 (47.2%) | 19 (52.8%) |
| Computers, Engineering & Science | 20 (80.0%) | 5 (20.0%) |
| Computers & Mathematics | 0 (0.0%) | 5 (100.0%) |
| Architecture & Engineering | 20 (100.0%) | 0 (0.0%) |
| Life, Physical & Social Science | 0 (0.0%) | 0 (0.0%) |
| Community & Social Service | 22 (44.9%) | 27 (55.1%) |
| Education, Arts & Media | 0 (0.0%) | 0 (0.0%) |
| Legal Services & Support | 6 (54.5%) | 5 (45.5%) |
| Education Instruction & Library | 13 (37.1%) | 22 (62.9%) |
| Arts, Media & Entertainment | 3 (100.0%) | 0 (0.0%) |
| Health Diagnosing & Treating | 15 (44.1%) | 19 (55.9%) |
| Health Technologists | 15 (65.2%) | 8 (34.8%) |
| Total (Category) | 200 (60.8%) | 129 (39.2%) |
| Total (Overall) | 374 (62.2%) | 227 (37.8%) |
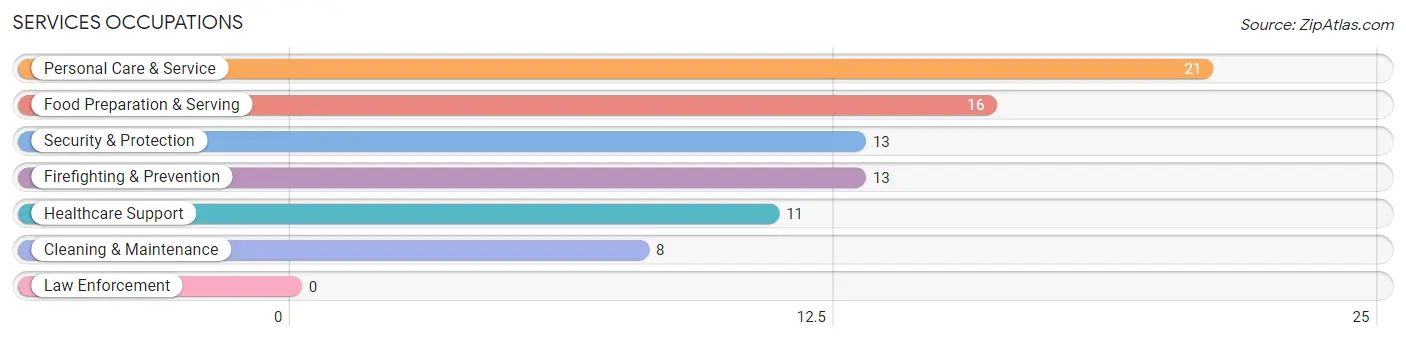
Services Occupations
The most common Services occupations in Lake Lure are Personal Care & Service (21 | 3.5%), Food Preparation & Serving (16 | 2.7%), Security & Protection (13 | 2.2%), Firefighting & Prevention (13 | 2.2%), and Healthcare Support (11 | 1.8%).
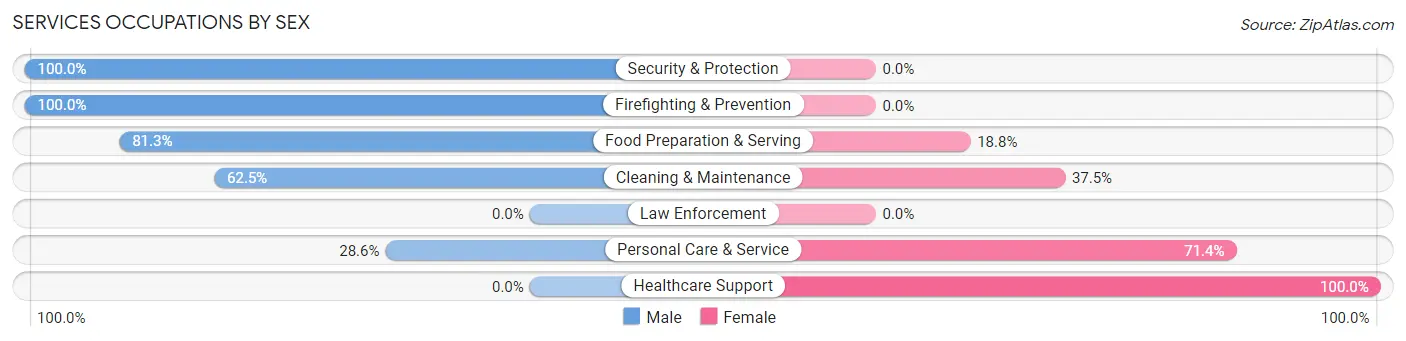
Services Occupations by Sex
Within the Services occupations in Lake Lure, the most male-oriented occupations are Security & Protection (100.0%), Firefighting & Prevention (100.0%), and Food Preparation & Serving (81.2%), while the most female-oriented occupations are Healthcare Support (100.0%), Personal Care & Service (71.4%), and Cleaning & Maintenance (37.5%).
| Occupation | Male | Female |
| Healthcare Support | 0 (0.0%) | 11 (100.0%) |
| Security & Protection | 13 (100.0%) | 0 (0.0%) |
| Firefighting & Prevention | 13 (100.0%) | 0 (0.0%) |
| Law Enforcement | 0 (0.0%) | 0 (0.0%) |
| Food Preparation & Serving | 13 (81.2%) | 3 (18.8%) |
| Cleaning & Maintenance | 5 (62.5%) | 3 (37.5%) |
| Personal Care & Service | 6 (28.6%) | 15 (71.4%) |
| Total (Category) | 37 (53.6%) | 32 (46.4%) |
| Total (Overall) | 374 (62.2%) | 227 (37.8%) |
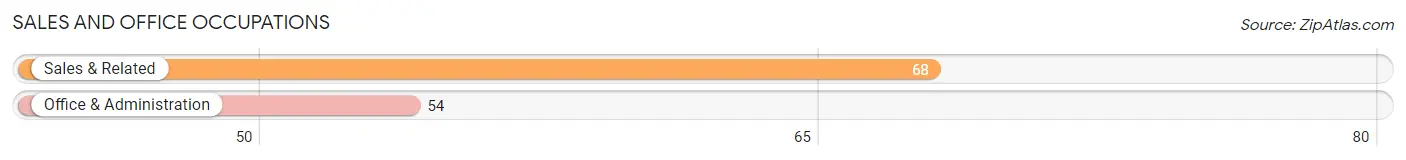
Sales and Office Occupations
The most common Sales and Office occupations in Lake Lure are Sales & Related (68 | 11.3%), and Office & Administration (54 | 9.0%).
Sales and Office Occupations by Sex
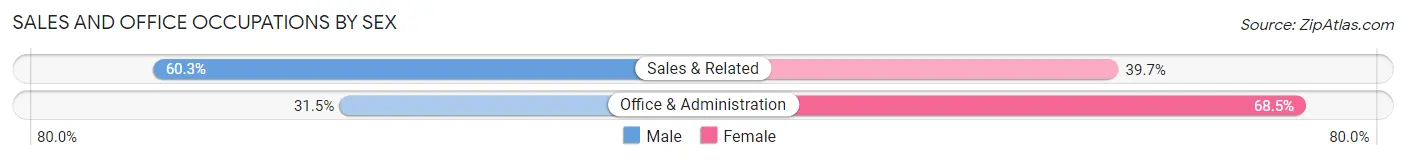
| Occupation | Male | Female |
| Sales & Related | 41 (60.3%) | 27 (39.7%) |
| Office & Administration | 17 (31.5%) | 37 (68.5%) |
| Total (Category) | 58 (47.5%) | 64 (52.5%) |
| Total (Overall) | 374 (62.2%) | 227 (37.8%) |
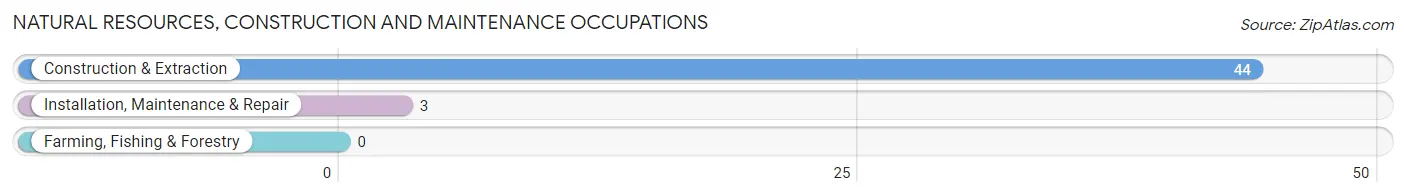
Natural Resources, Construction and Maintenance Occupations
The most common Natural Resources, Construction and Maintenance occupations in Lake Lure are Construction & Extraction (44 | 7.3%), and Installation, Maintenance & Repair (3 | 0.5%).
Natural Resources, Construction and Maintenance Occupations by Sex
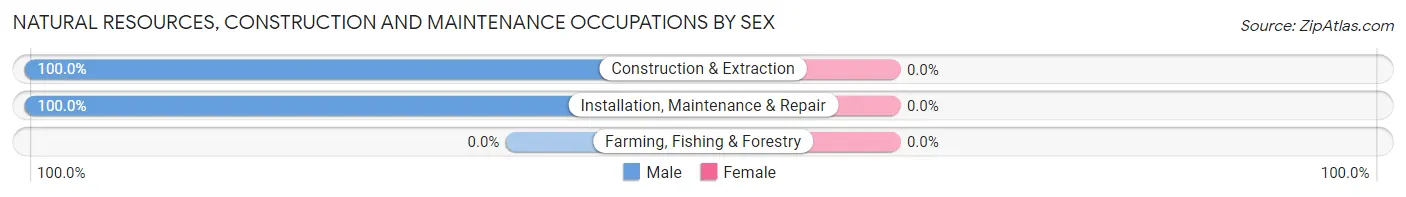
| Occupation | Male | Female |
| Farming, Fishing & Forestry | 0 (0.0%) | 0 (0.0%) |
| Construction & Extraction | 44 (100.0%) | 0 (0.0%) |
| Installation, Maintenance & Repair | 3 (100.0%) | 0 (0.0%) |
| Total (Category) | 47 (100.0%) | 0 (0.0%) |
| Total (Overall) | 374 (62.2%) | 227 (37.8%) |
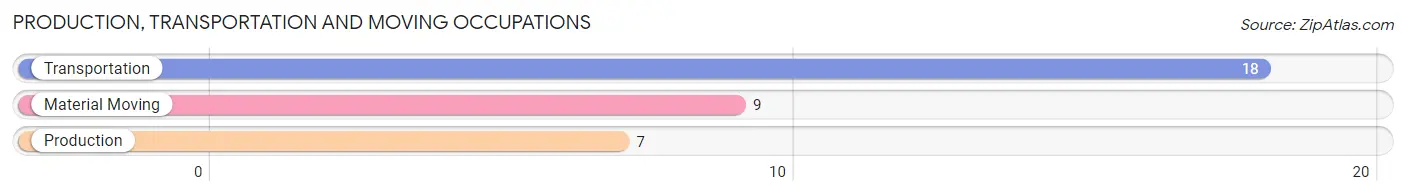
Production, Transportation and Moving Occupations
The most common Production, Transportation and Moving occupations in Lake Lure are Transportation (18 | 3.0%), Material Moving (9 | 1.5%), and Production (7 | 1.2%).
Production, Transportation and Moving Occupations by Sex
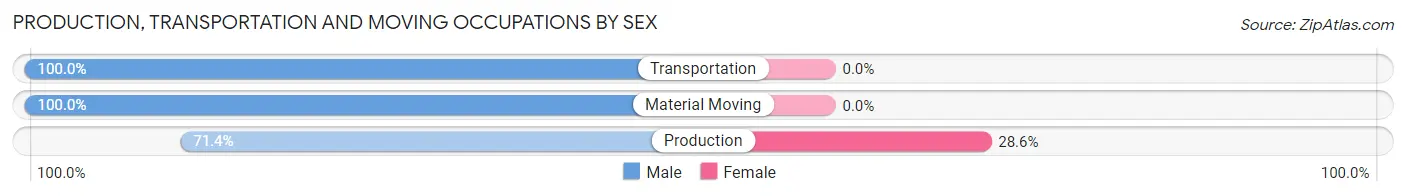
| Occupation | Male | Female |
| Production | 5 (71.4%) | 2 (28.6%) |
| Transportation | 18 (100.0%) | 0 (0.0%) |
| Material Moving | 9 (100.0%) | 0 (0.0%) |
| Total (Category) | 32 (94.1%) | 2 (5.9%) |
| Total (Overall) | 374 (62.2%) | 227 (37.8%) |
Employment Industries by Sex in Lake Lure
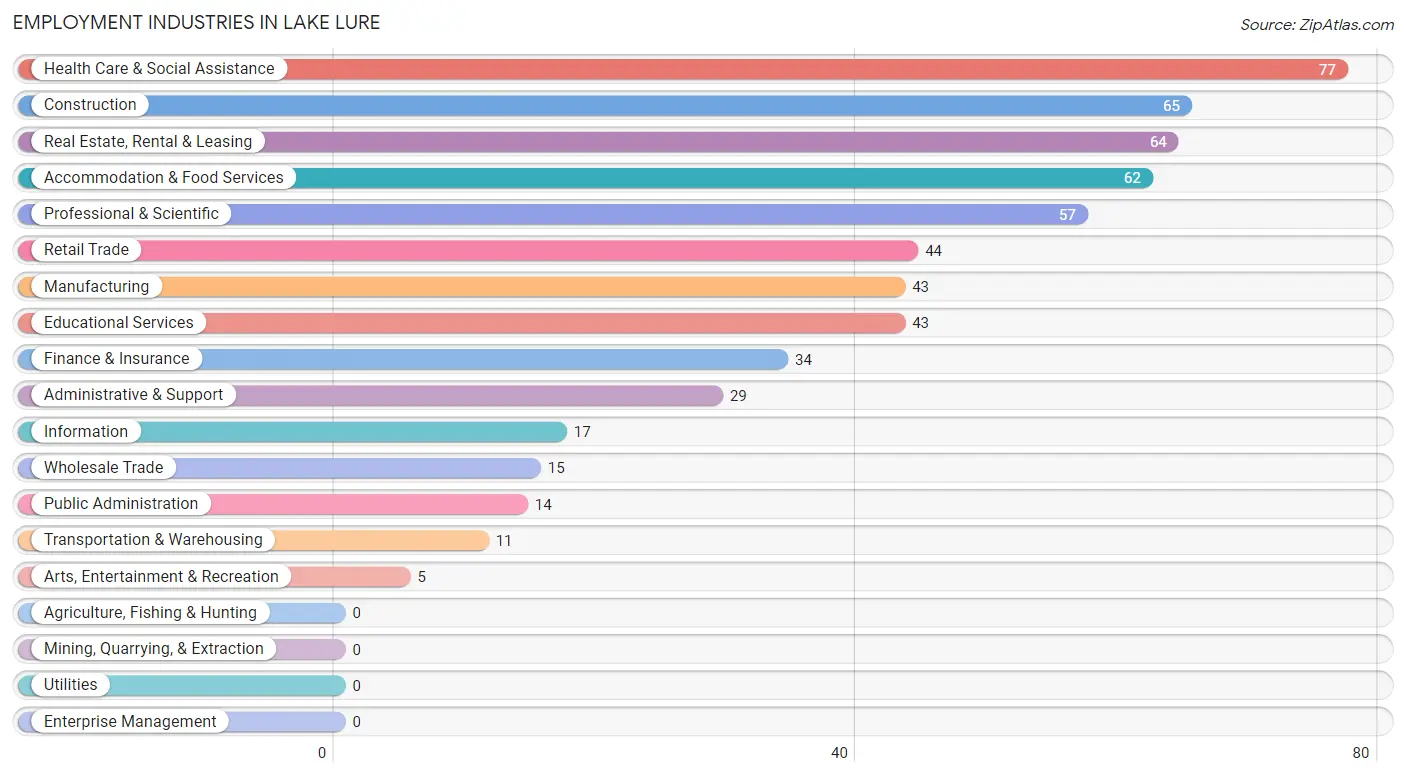
Employment Industries in Lake Lure
The major employment industries in Lake Lure include Health Care & Social Assistance (77 | 12.8%), Construction (65 | 10.8%), Real Estate, Rental & Leasing (64 | 10.6%), Accommodation & Food Services (62 | 10.3%), and Professional & Scientific (57 | 9.5%).
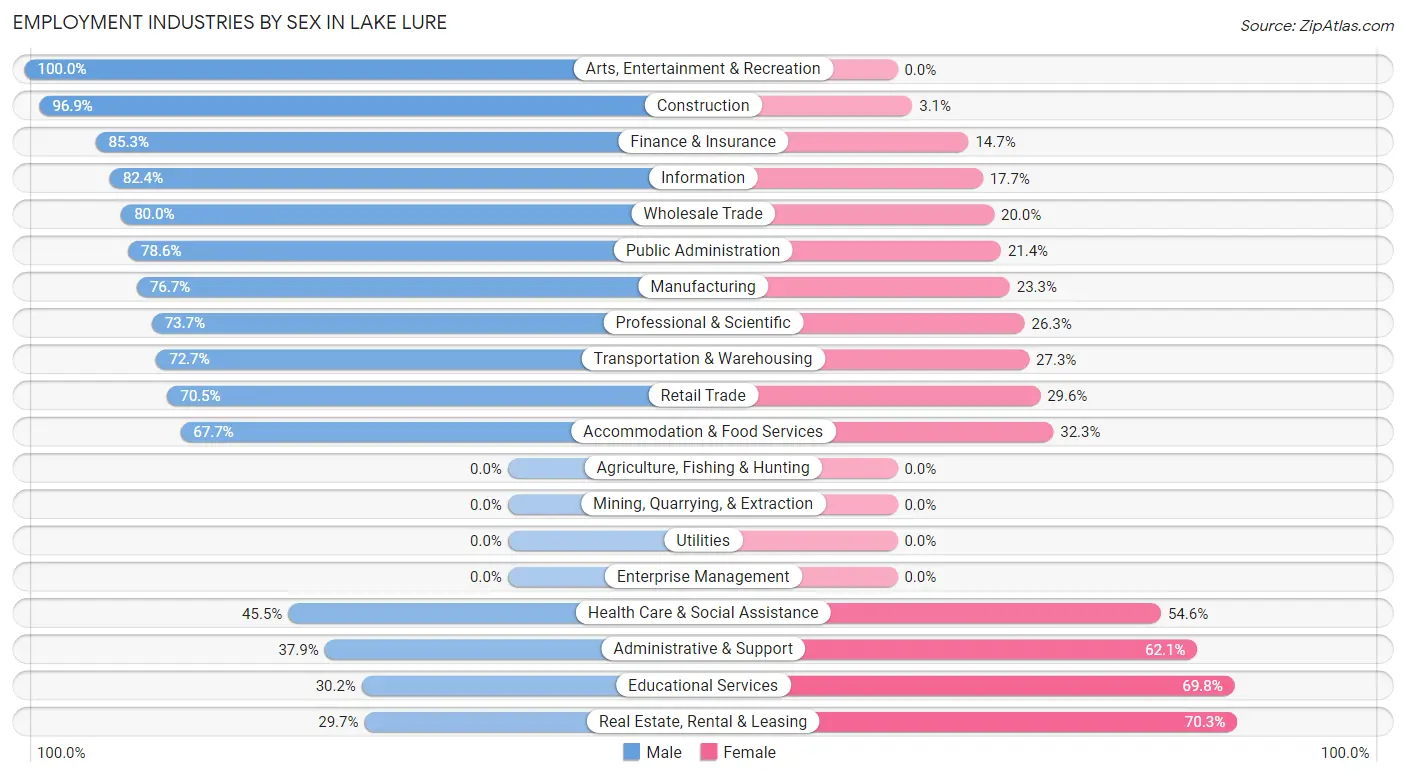
Employment Industries by Sex in Lake Lure
The Lake Lure industries that see more men than women are Arts, Entertainment & Recreation (100.0%), Construction (96.9%), and Finance & Insurance (85.3%), whereas the industries that tend to have a higher number of women are Real Estate, Rental & Leasing (70.3%), Educational Services (69.8%), and Administrative & Support (62.1%).
| Industry | Male | Female |
| Agriculture, Fishing & Hunting | 0 (0.0%) | 0 (0.0%) |
| Mining, Quarrying, & Extraction | 0 (0.0%) | 0 (0.0%) |
| Construction | 63 (96.9%) | 2 (3.1%) |
| Manufacturing | 33 (76.7%) | 10 (23.3%) |
| Wholesale Trade | 12 (80.0%) | 3 (20.0%) |
| Retail Trade | 31 (70.5%) | 13 (29.5%) |
| Transportation & Warehousing | 8 (72.7%) | 3 (27.3%) |
| Utilities | 0 (0.0%) | 0 (0.0%) |
| Information | 14 (82.4%) | 3 (17.6%) |
| Finance & Insurance | 29 (85.3%) | 5 (14.7%) |
| Real Estate, Rental & Leasing | 19 (29.7%) | 45 (70.3%) |
| Professional & Scientific | 42 (73.7%) | 15 (26.3%) |
| Enterprise Management | 0 (0.0%) | 0 (0.0%) |
| Administrative & Support | 11 (37.9%) | 18 (62.1%) |
| Educational Services | 13 (30.2%) | 30 (69.8%) |
| Health Care & Social Assistance | 35 (45.5%) | 42 (54.5%) |
| Arts, Entertainment & Recreation | 5 (100.0%) | 0 (0.0%) |
| Accommodation & Food Services | 42 (67.7%) | 20 (32.3%) |
| Public Administration | 11 (78.6%) | 3 (21.4%) |
| Total | 374 (62.2%) | 227 (37.8%) |
Education in Lake Lure
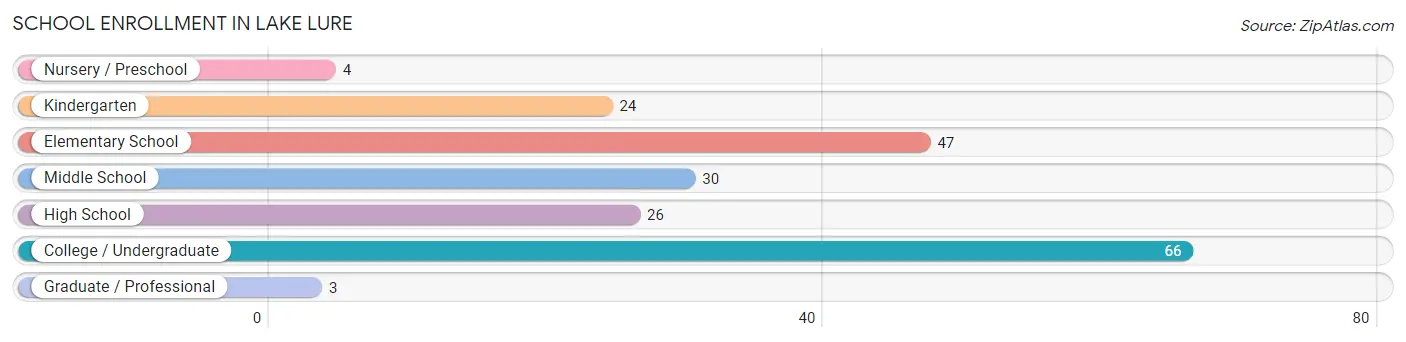
School Enrollment in Lake Lure
The most common levels of schooling among the 200 students in Lake Lure are college / undergraduate (66 | 33.0%), elementary school (47 | 23.5%), and middle school (30 | 15.0%).
| School Level | # Students | % Students |
| Nursery / Preschool | 4 | 2.0% |
| Kindergarten | 24 | 12.0% |
| Elementary School | 47 | 23.5% |
| Middle School | 30 | 15.0% |
| High School | 26 | 13.0% |
| College / Undergraduate | 66 | 33.0% |
| Graduate / Professional | 3 | 1.5% |
| Total | 200 | 100.0% |
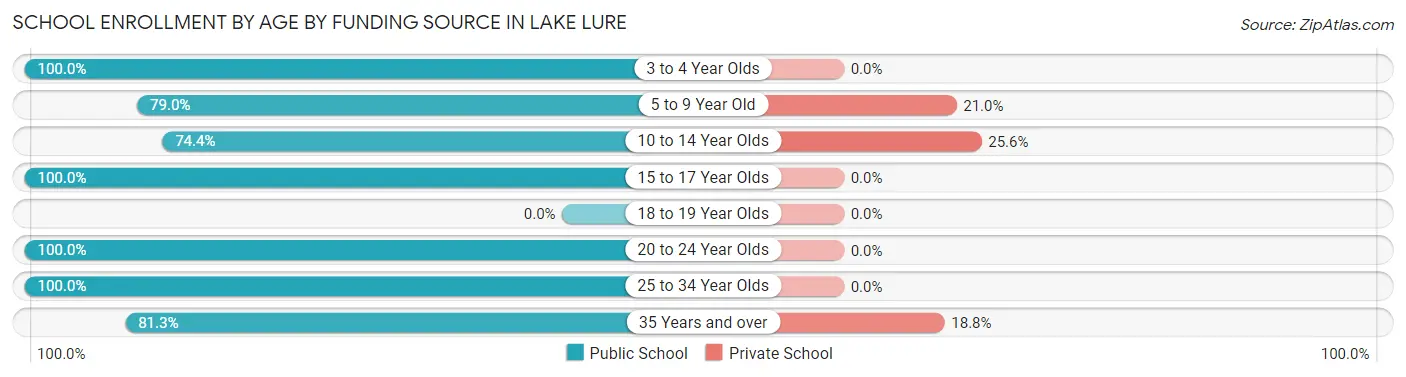
School Enrollment by Age by Funding Source in Lake Lure
Out of a total of 200 students who are enrolled in schools in Lake Lure, 29 (14.5%) attend a private institution, while the remaining 171 (85.5%) are enrolled in public schools. The age group of 10 to 14 year olds has the highest likelihood of being enrolled in private schools, with 10 (25.6% in the age bracket) enrolled. Conversely, the age group of 3 to 4 year olds has the lowest likelihood of being enrolled in a private school, with 4 (100.0% in the age bracket) attending a public institution.
| Age Bracket | Public School | Private School |
| 3 to 4 Year Olds | 4 (100.0%) | 0 (0.0%) |
| 5 to 9 Year Old | 49 (79.0%) | 13 (21.0%) |
| 10 to 14 Year Olds | 29 (74.4%) | 10 (25.6%) |
| 15 to 17 Year Olds | 16 (100.0%) | 0 (0.0%) |
| 18 to 19 Year Olds | 0 (0.0%) | 0 (0.0%) |
| 20 to 24 Year Olds | 45 (100.0%) | 0 (0.0%) |
| 25 to 34 Year Olds | 2 (100.0%) | 0 (0.0%) |
| 35 Years and over | 26 (81.2%) | 6 (18.8%) |
| Total | 171 (85.5%) | 29 (14.5%) |
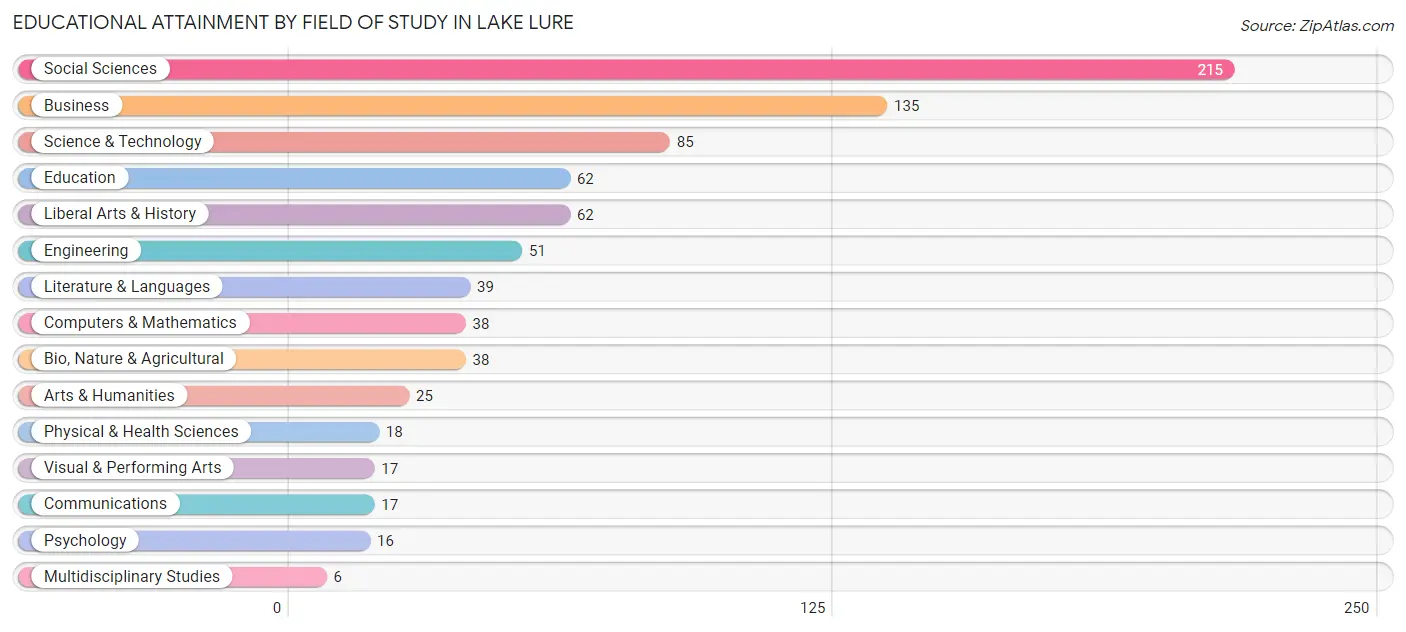
Educational Attainment by Field of Study in Lake Lure
Social sciences (215 | 26.1%), business (135 | 16.4%), science & technology (85 | 10.3%), education (62 | 7.5%), and liberal arts & history (62 | 7.5%) are the most common fields of study among 824 individuals in Lake Lure who have obtained a bachelor's degree or higher.
| Field of Study | # Graduates | % Graduates |
| Computers & Mathematics | 38 | 4.6% |
| Bio, Nature & Agricultural | 38 | 4.6% |
| Physical & Health Sciences | 18 | 2.2% |
| Psychology | 16 | 1.9% |
| Social Sciences | 215 | 26.1% |
| Engineering | 51 | 6.2% |
| Multidisciplinary Studies | 6 | 0.7% |
| Science & Technology | 85 | 10.3% |
| Business | 135 | 16.4% |
| Education | 62 | 7.5% |
| Literature & Languages | 39 | 4.7% |
| Liberal Arts & History | 62 | 7.5% |
| Visual & Performing Arts | 17 | 2.1% |
| Communications | 17 | 2.1% |
| Arts & Humanities | 25 | 3.0% |
| Total | 824 | 100.0% |
Transportation & Commute in Lake Lure
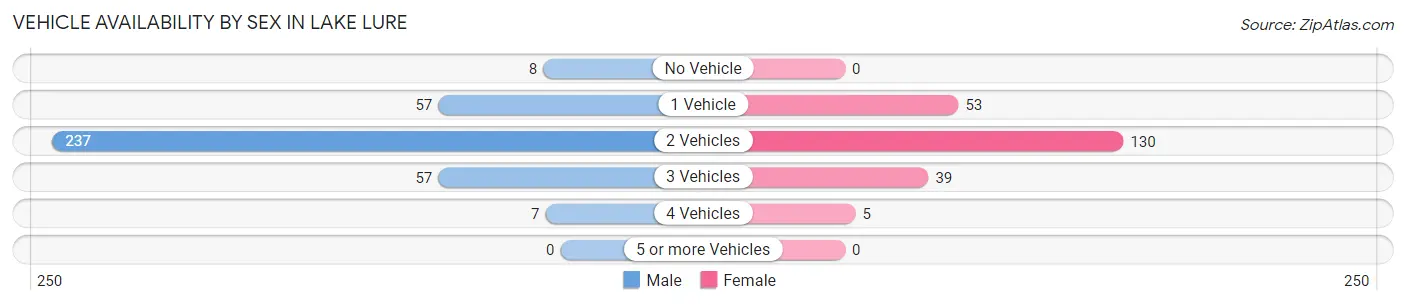
Vehicle Availability by Sex in Lake Lure
The most prevalent vehicle ownership categories in Lake Lure are males with 2 vehicles (237, accounting for 64.7%) and females with 2 vehicles (130, making up 104.4%).
| Vehicles Available | Male | Female |
| No Vehicle | 8 (2.2%) | 0 (0.0%) |
| 1 Vehicle | 57 (15.6%) | 53 (23.4%) |
| 2 Vehicles | 237 (64.7%) | 130 (57.3%) |
| 3 Vehicles | 57 (15.6%) | 39 (17.2%) |
| 4 Vehicles | 7 (1.9%) | 5 (2.2%) |
| 5 or more Vehicles | 0 (0.0%) | 0 (0.0%) |
| Total | 366 (100.0%) | 227 (100.0%) |
Commute Time in Lake Lure
The most frequently occuring commute durations in Lake Lure are 45 to 59 minutes (56 commuters, 13.4%), 30 to 34 minutes (52 commuters, 12.5%), and 35 to 39 minutes (51 commuters, 12.2%).
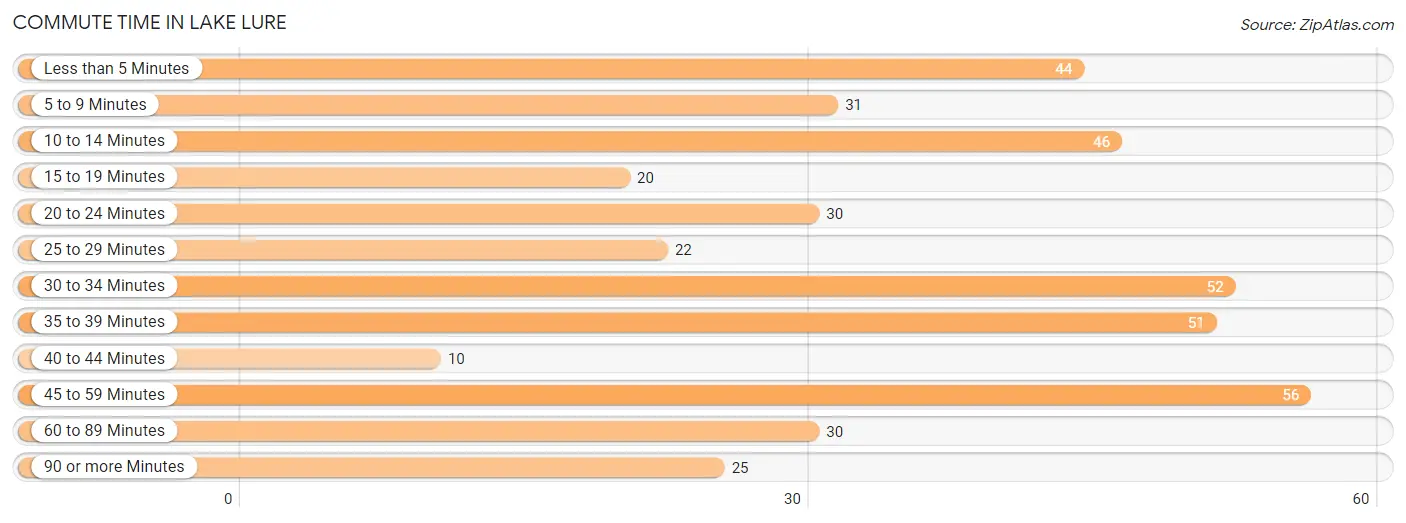
| Commute Time | # Commuters | % Commuters |
| Less than 5 Minutes | 44 | 10.5% |
| 5 to 9 Minutes | 31 | 7.4% |
| 10 to 14 Minutes | 46 | 11.0% |
| 15 to 19 Minutes | 20 | 4.8% |
| 20 to 24 Minutes | 30 | 7.2% |
| 25 to 29 Minutes | 22 | 5.3% |
| 30 to 34 Minutes | 52 | 12.5% |
| 35 to 39 Minutes | 51 | 12.2% |
| 40 to 44 Minutes | 10 | 2.4% |
| 45 to 59 Minutes | 56 | 13.4% |
| 60 to 89 Minutes | 30 | 7.2% |
| 90 or more Minutes | 25 | 6.0% |
Commute Time by Sex in Lake Lure
The most common commute times in Lake Lure are 35 to 39 minutes (45 commuters, 17.4%) for males and 45 to 59 minutes (24 commuters, 15.2%) for females.
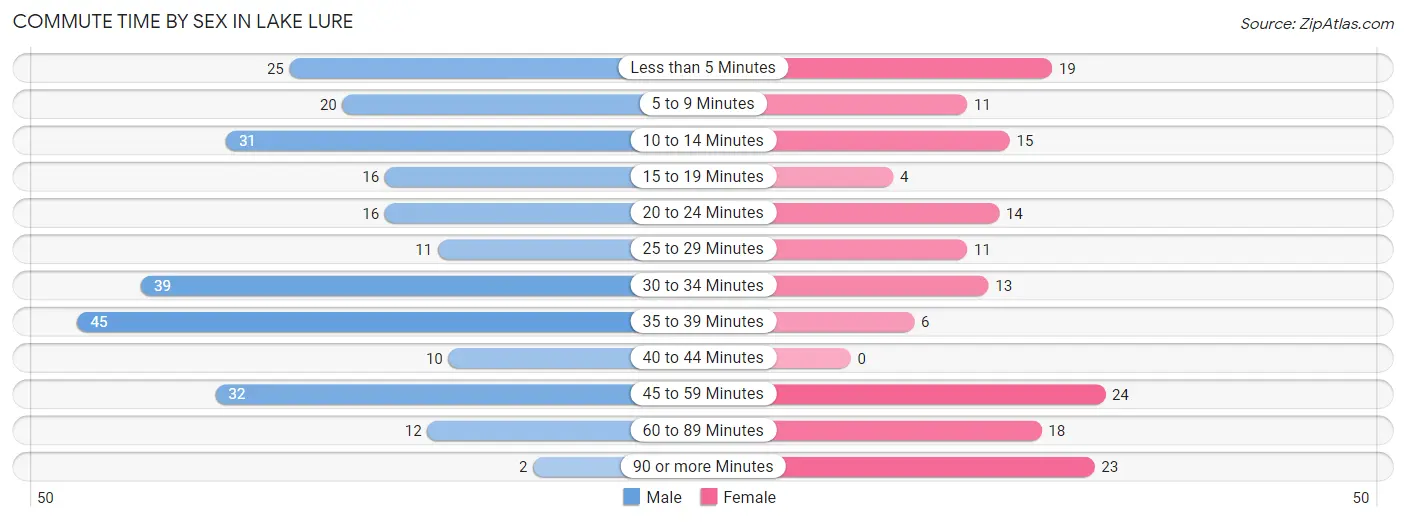
| Commute Time | Male | Female |
| Less than 5 Minutes | 25 (9.7%) | 19 (12.0%) |
| 5 to 9 Minutes | 20 (7.7%) | 11 (7.0%) |
| 10 to 14 Minutes | 31 (12.0%) | 15 (9.5%) |
| 15 to 19 Minutes | 16 (6.2%) | 4 (2.5%) |
| 20 to 24 Minutes | 16 (6.2%) | 14 (8.9%) |
| 25 to 29 Minutes | 11 (4.3%) | 11 (7.0%) |
| 30 to 34 Minutes | 39 (15.1%) | 13 (8.2%) |
| 35 to 39 Minutes | 45 (17.4%) | 6 (3.8%) |
| 40 to 44 Minutes | 10 (3.9%) | 0 (0.0%) |
| 45 to 59 Minutes | 32 (12.4%) | 24 (15.2%) |
| 60 to 89 Minutes | 12 (4.6%) | 18 (11.4%) |
| 90 or more Minutes | 2 (0.8%) | 23 (14.6%) |
Time of Departure to Work by Sex in Lake Lure
The most frequent times of departure to work in Lake Lure are 8:00 AM to 8:29 AM (79, 30.5%) for males and 8:00 AM to 8:29 AM (33, 20.9%) for females.
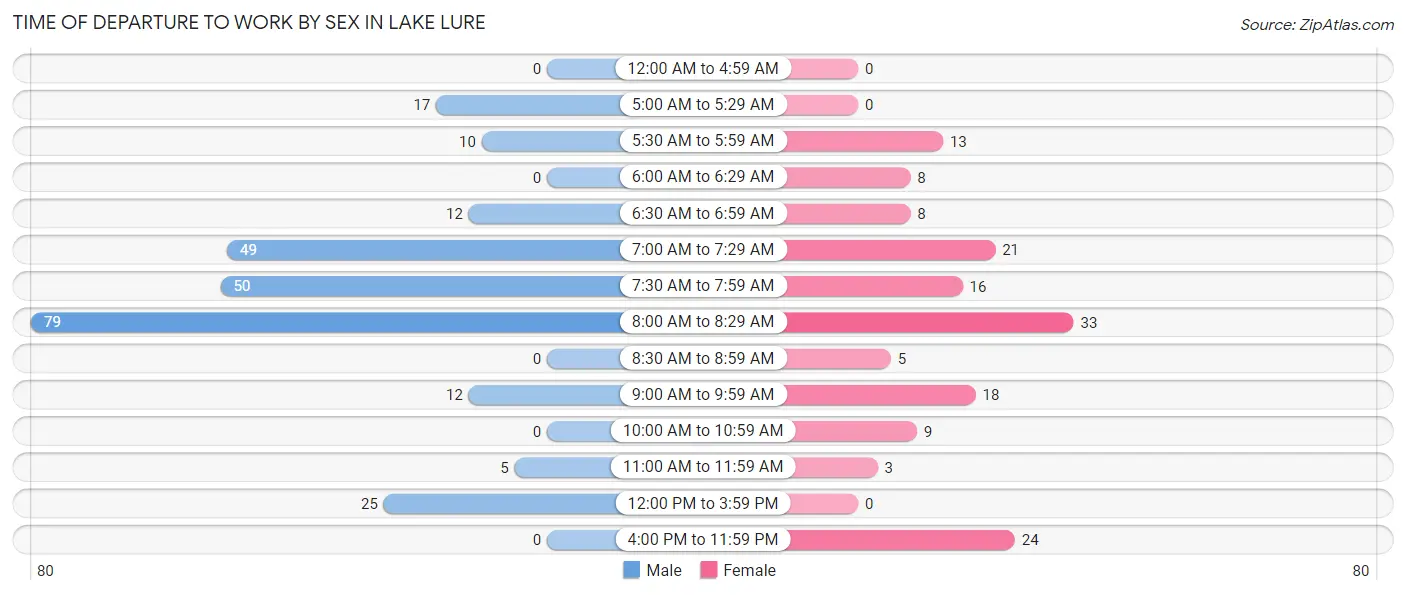
| Time of Departure | Male | Female |
| 12:00 AM to 4:59 AM | 0 (0.0%) | 0 (0.0%) |
| 5:00 AM to 5:29 AM | 17 (6.6%) | 0 (0.0%) |
| 5:30 AM to 5:59 AM | 10 (3.9%) | 13 (8.2%) |
| 6:00 AM to 6:29 AM | 0 (0.0%) | 8 (5.1%) |
| 6:30 AM to 6:59 AM | 12 (4.6%) | 8 (5.1%) |
| 7:00 AM to 7:29 AM | 49 (18.9%) | 21 (13.3%) |
| 7:30 AM to 7:59 AM | 50 (19.3%) | 16 (10.1%) |
| 8:00 AM to 8:29 AM | 79 (30.5%) | 33 (20.9%) |
| 8:30 AM to 8:59 AM | 0 (0.0%) | 5 (3.2%) |
| 9:00 AM to 9:59 AM | 12 (4.6%) | 18 (11.4%) |
| 10:00 AM to 10:59 AM | 0 (0.0%) | 9 (5.7%) |
| 11:00 AM to 11:59 AM | 5 (1.9%) | 3 (1.9%) |
| 12:00 PM to 3:59 PM | 25 (9.7%) | 0 (0.0%) |
| 4:00 PM to 11:59 PM | 0 (0.0%) | 24 (15.2%) |
| Total | 259 (100.0%) | 158 (100.0%) |
Housing Occupancy in Lake Lure
Occupancy by Ownership in Lake Lure
Of the total 836 dwellings in Lake Lure, owner-occupied units account for 707 (84.6%), while renter-occupied units make up 129 (15.4%).
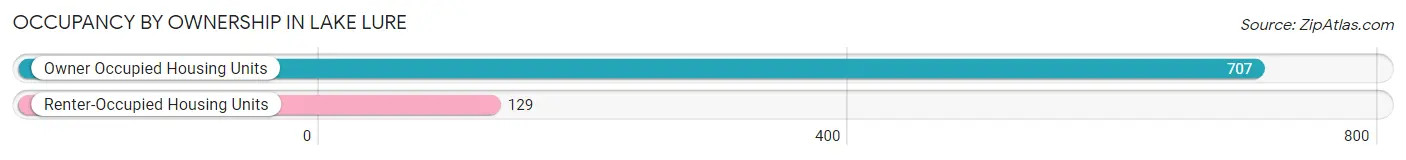
| Occupancy | # Housing Units | % Housing Units |
| Owner Occupied Housing Units | 707 | 84.6% |
| Renter-Occupied Housing Units | 129 | 15.4% |
| Total Occupied Housing Units | 836 | 100.0% |
Occupancy by Household Size in Lake Lure
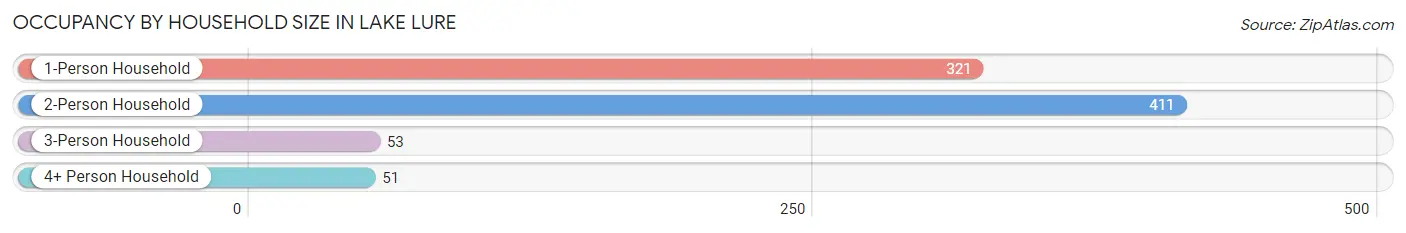
| Household Size | # Housing Units | % Housing Units |
| 1-Person Household | 321 | 38.4% |
| 2-Person Household | 411 | 49.2% |
| 3-Person Household | 53 | 6.3% |
| 4+ Person Household | 51 | 6.1% |
| Total Housing Units | 836 | 100.0% |
Occupancy by Ownership by Household Size in Lake Lure
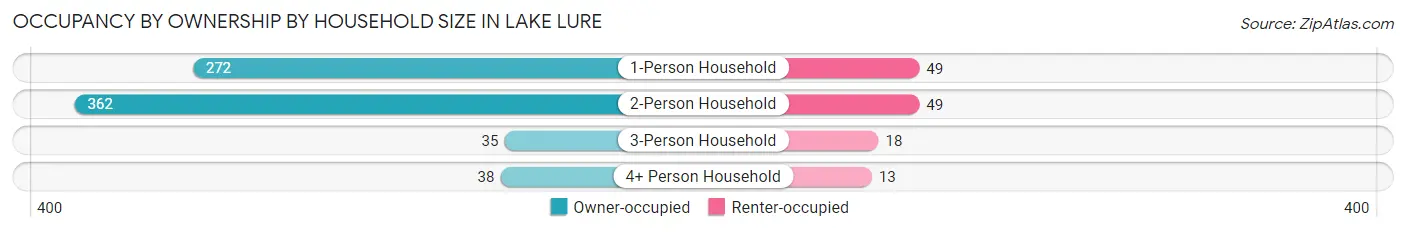
| Household Size | Owner-occupied | Renter-occupied |
| 1-Person Household | 272 (84.7%) | 49 (15.3%) |
| 2-Person Household | 362 (88.1%) | 49 (11.9%) |
| 3-Person Household | 35 (66.0%) | 18 (34.0%) |
| 4+ Person Household | 38 (74.5%) | 13 (25.5%) |
| Total Housing Units | 707 (84.6%) | 129 (15.4%) |
Occupancy by Educational Attainment in Lake Lure
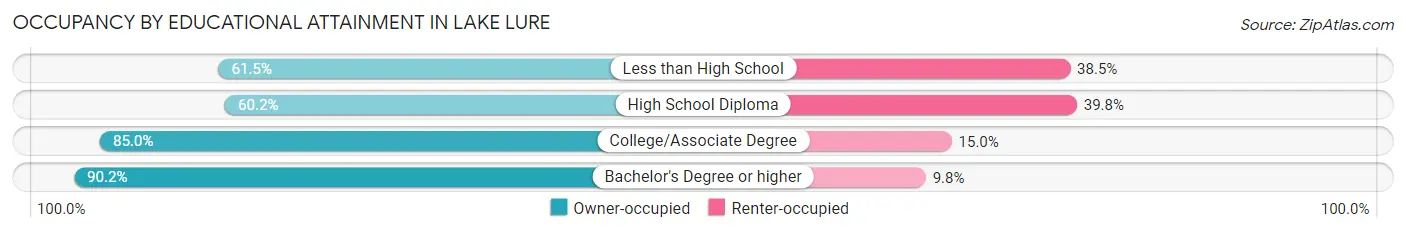
| Household Size | Owner-occupied | Renter-occupied |
| Less than High School | 16 (61.5%) | 10 (38.5%) |
| High School Diploma | 53 (60.2%) | 35 (39.8%) |
| College/Associate Degree | 216 (85.0%) | 38 (15.0%) |
| Bachelor's Degree or higher | 422 (90.2%) | 46 (9.8%) |
Occupancy by Age of Householder in Lake Lure
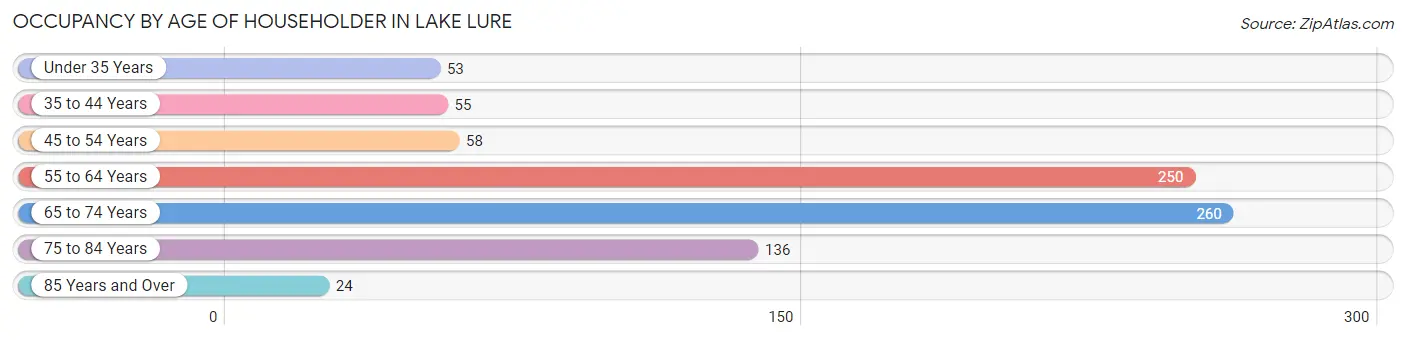
| Age Bracket | # Households | % Households |
| Under 35 Years | 53 | 6.3% |
| 35 to 44 Years | 55 | 6.6% |
| 45 to 54 Years | 58 | 6.9% |
| 55 to 64 Years | 250 | 29.9% |
| 65 to 74 Years | 260 | 31.1% |
| 75 to 84 Years | 136 | 16.3% |
| 85 Years and Over | 24 | 2.9% |
| Total | 836 | 100.0% |
Housing Finances in Lake Lure
Median Income by Occupancy in Lake Lure
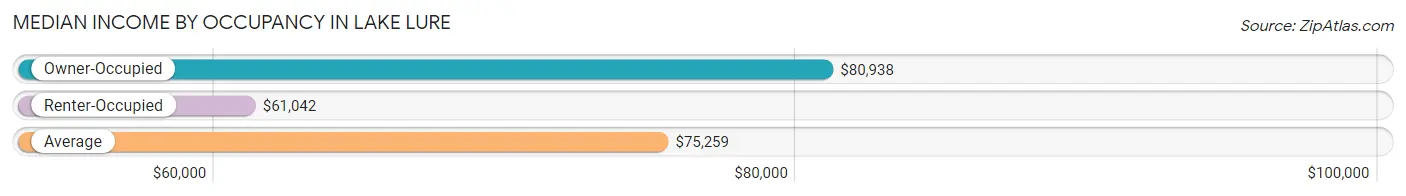
| Occupancy Type | # Households | Median Income |
| Owner-Occupied | 707 (84.6%) | $80,938 |
| Renter-Occupied | 129 (15.4%) | $61,042 |
| Average | 836 (100.0%) | $75,259 |
Occupancy by Householder Income Bracket in Lake Lure
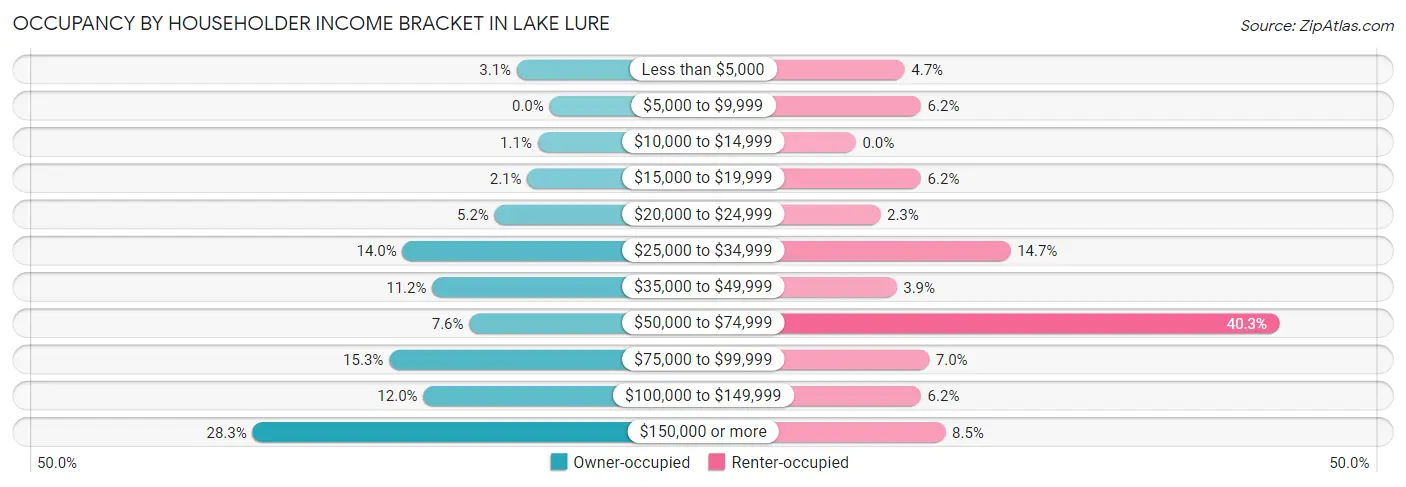
| Income Bracket | Owner-occupied | Renter-occupied |
| Less than $5,000 | 22 (3.1%) | 6 (4.6%) |
| $5,000 to $9,999 | 0 (0.0%) | 8 (6.2%) |
| $10,000 to $14,999 | 8 (1.1%) | 0 (0.0%) |
| $15,000 to $19,999 | 15 (2.1%) | 8 (6.2%) |
| $20,000 to $24,999 | 37 (5.2%) | 3 (2.3%) |
| $25,000 to $34,999 | 99 (14.0%) | 19 (14.7%) |
| $35,000 to $49,999 | 79 (11.2%) | 5 (3.9%) |
| $50,000 to $74,999 | 54 (7.6%) | 52 (40.3%) |
| $75,000 to $99,999 | 108 (15.3%) | 9 (7.0%) |
| $100,000 to $149,999 | 85 (12.0%) | 8 (6.2%) |
| $150,000 or more | 200 (28.3%) | 11 (8.5%) |
| Total | 707 (100.0%) | 129 (100.0%) |
Monthly Housing Cost Tiers in Lake Lure
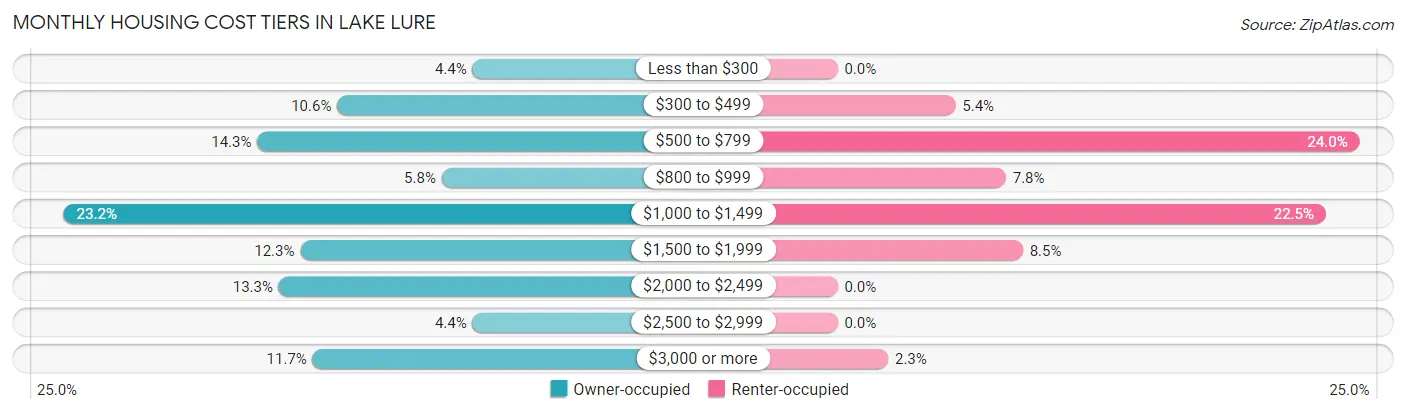
| Monthly Cost | Owner-occupied | Renter-occupied |
| Less than $300 | 31 (4.4%) | 0 (0.0%) |
| $300 to $499 | 75 (10.6%) | 7 (5.4%) |
| $500 to $799 | 101 (14.3%) | 31 (24.0%) |
| $800 to $999 | 41 (5.8%) | 10 (7.7%) |
| $1,000 to $1,499 | 164 (23.2%) | 29 (22.5%) |
| $1,500 to $1,999 | 87 (12.3%) | 11 (8.5%) |
| $2,000 to $2,499 | 94 (13.3%) | 0 (0.0%) |
| $2,500 to $2,999 | 31 (4.4%) | 0 (0.0%) |
| $3,000 or more | 83 (11.7%) | 3 (2.3%) |
| Total | 707 (100.0%) | 129 (100.0%) |
Physical Housing Characteristics in Lake Lure
Housing Structures in Lake Lure
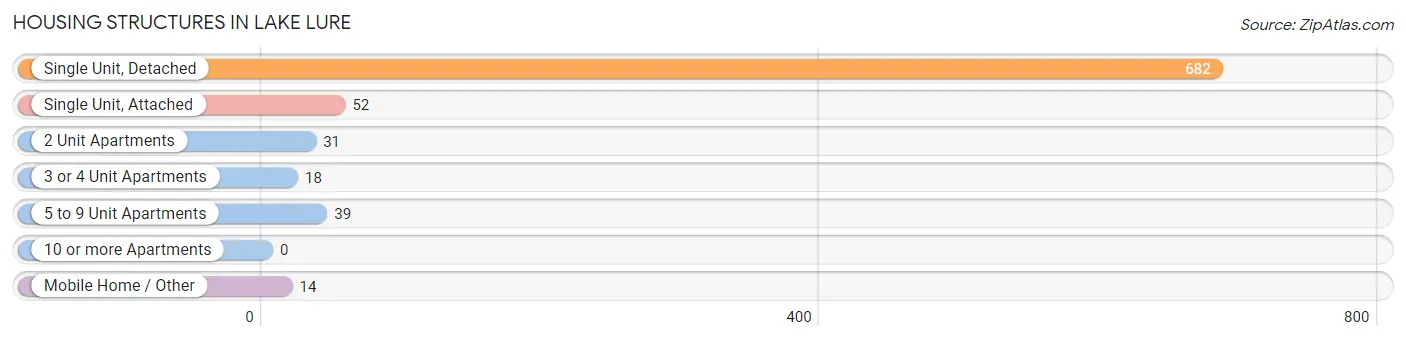
| Structure Type | # Housing Units | % Housing Units |
| Single Unit, Detached | 682 | 81.6% |
| Single Unit, Attached | 52 | 6.2% |
| 2 Unit Apartments | 31 | 3.7% |
| 3 or 4 Unit Apartments | 18 | 2.1% |
| 5 to 9 Unit Apartments | 39 | 4.7% |
| 10 or more Apartments | 0 | 0.0% |
| Mobile Home / Other | 14 | 1.7% |
| Total | 836 | 100.0% |
Housing Structures by Occupancy in Lake Lure
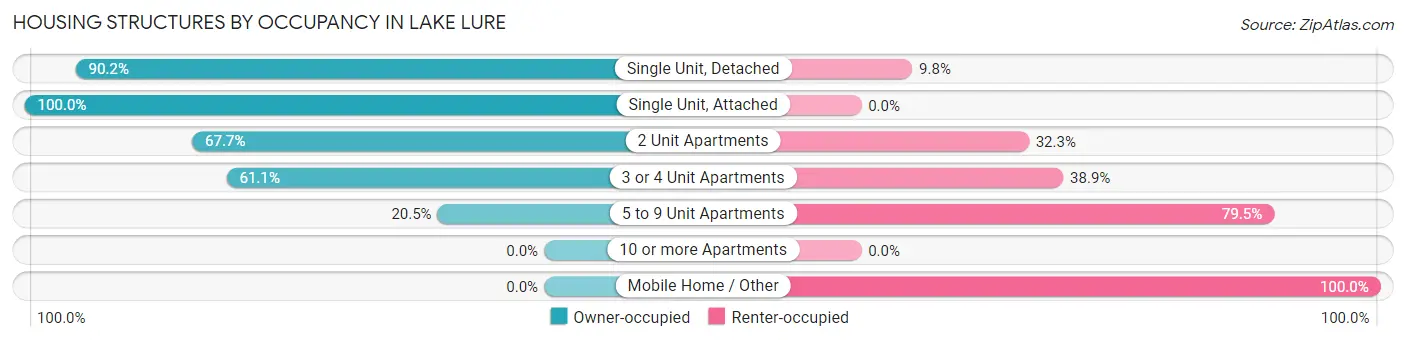
| Structure Type | Owner-occupied | Renter-occupied |
| Single Unit, Detached | 615 (90.2%) | 67 (9.8%) |
| Single Unit, Attached | 52 (100.0%) | 0 (0.0%) |
| 2 Unit Apartments | 21 (67.7%) | 10 (32.3%) |
| 3 or 4 Unit Apartments | 11 (61.1%) | 7 (38.9%) |
| 5 to 9 Unit Apartments | 8 (20.5%) | 31 (79.5%) |
| 10 or more Apartments | 0 (0.0%) | 0 (0.0%) |
| Mobile Home / Other | 0 (0.0%) | 14 (100.0%) |
| Total | 707 (84.6%) | 129 (15.4%) |
Housing Structures by Number of Rooms in Lake Lure
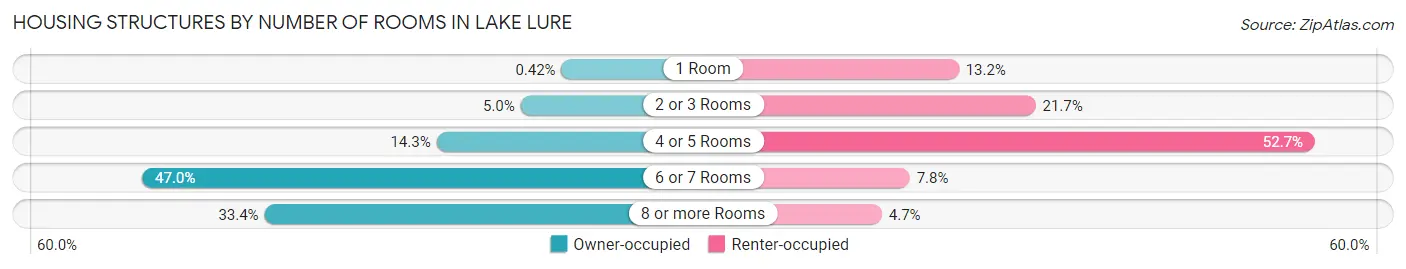
| Number of Rooms | Owner-occupied | Renter-occupied |
| 1 Room | 3 (0.4%) | 17 (13.2%) |
| 2 or 3 Rooms | 35 (5.0%) | 28 (21.7%) |
| 4 or 5 Rooms | 101 (14.3%) | 68 (52.7%) |
| 6 or 7 Rooms | 332 (47.0%) | 10 (7.7%) |
| 8 or more Rooms | 236 (33.4%) | 6 (4.6%) |
| Total | 707 (100.0%) | 129 (100.0%) |
Housing Structure by Heating Type in Lake Lure
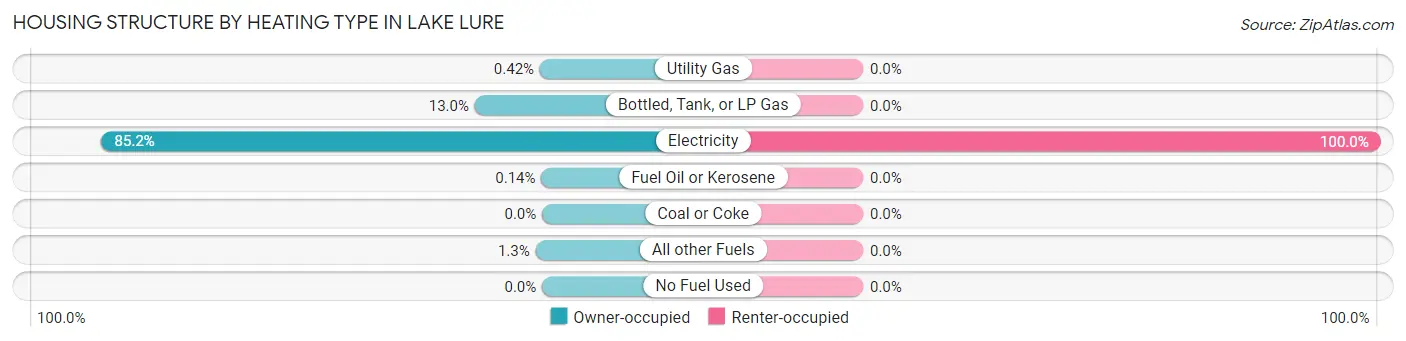
| Heating Type | Owner-occupied | Renter-occupied |
| Utility Gas | 3 (0.4%) | 0 (0.0%) |
| Bottled, Tank, or LP Gas | 92 (13.0%) | 0 (0.0%) |
| Electricity | 602 (85.2%) | 129 (100.0%) |
| Fuel Oil or Kerosene | 1 (0.1%) | 0 (0.0%) |
| Coal or Coke | 0 (0.0%) | 0 (0.0%) |
| All other Fuels | 9 (1.3%) | 0 (0.0%) |
| No Fuel Used | 0 (0.0%) | 0 (0.0%) |
| Total | 707 (100.0%) | 129 (100.0%) |
Household Vehicle Usage in Lake Lure
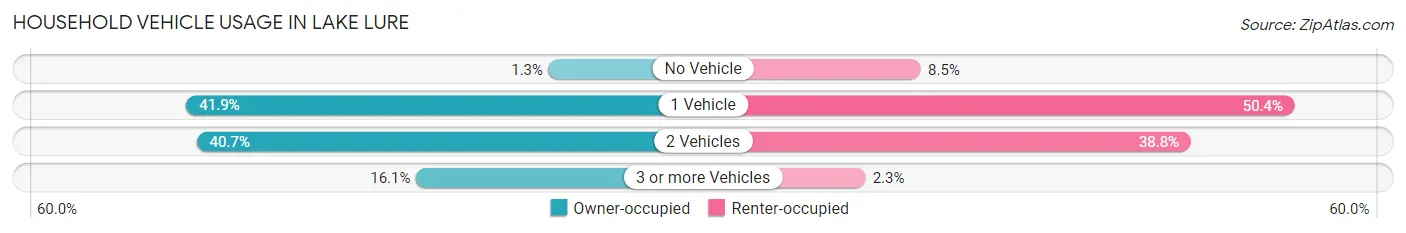
| Vehicles per Household | Owner-occupied | Renter-occupied |
| No Vehicle | 9 (1.3%) | 11 (8.5%) |
| 1 Vehicle | 296 (41.9%) | 65 (50.4%) |
| 2 Vehicles | 288 (40.7%) | 50 (38.8%) |
| 3 or more Vehicles | 114 (16.1%) | 3 (2.3%) |
| Total | 707 (100.0%) | 129 (100.0%) |
Real Estate & Mortgages in Lake Lure
Real Estate and Mortgage Overview in Lake Lure
| Characteristic | Without Mortgage | With Mortgage |
| Housing Units | 338 | 369 |
| Median Property Value | $586,100 | $444,700 |
| Median Household Income | - | - |
| Monthly Housing Costs | $696 | $83 |
| Real Estate Taxes | $4,219 | $0 |
Property Value by Mortgage Status in Lake Lure
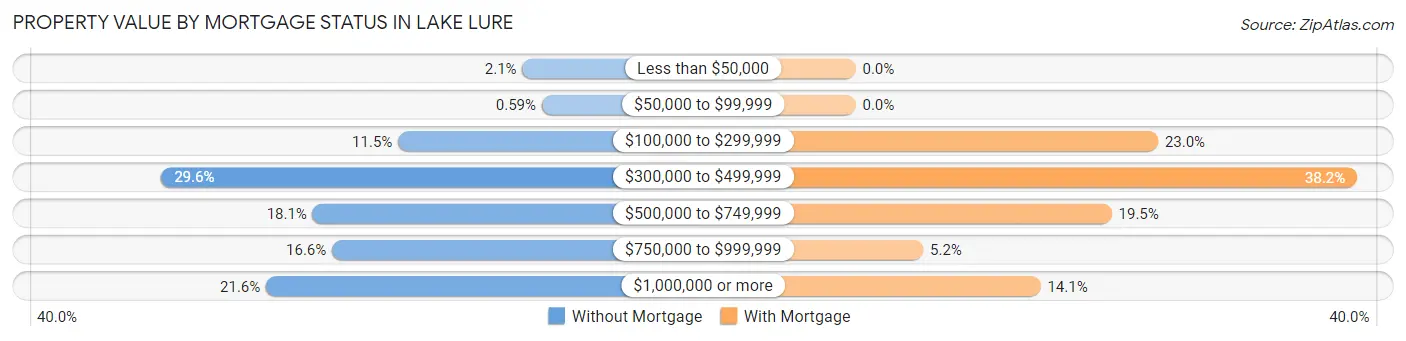
| Property Value | Without Mortgage | With Mortgage |
| Less than $50,000 | 7 (2.1%) | 0 (0.0%) |
| $50,000 to $99,999 | 2 (0.6%) | 0 (0.0%) |
| $100,000 to $299,999 | 39 (11.5%) | 85 (23.0%) |
| $300,000 to $499,999 | 100 (29.6%) | 141 (38.2%) |
| $500,000 to $749,999 | 61 (18.0%) | 72 (19.5%) |
| $750,000 to $999,999 | 56 (16.6%) | 19 (5.1%) |
| $1,000,000 or more | 73 (21.6%) | 52 (14.1%) |
| Total | 338 (100.0%) | 369 (100.0%) |
Household Income by Mortgage Status in Lake Lure
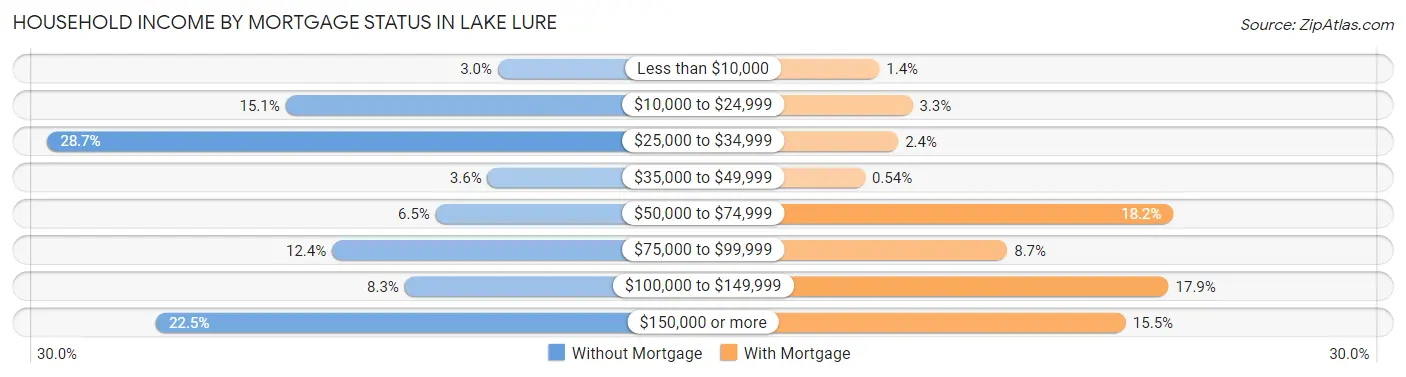
| Household Income | Without Mortgage | With Mortgage |
| Less than $10,000 | 10 (3.0%) | 5 (1.4%) |
| $10,000 to $24,999 | 51 (15.1%) | 12 (3.3%) |
| $25,000 to $34,999 | 97 (28.7%) | 9 (2.4%) |
| $35,000 to $49,999 | 12 (3.5%) | 2 (0.5%) |
| $50,000 to $74,999 | 22 (6.5%) | 67 (18.2%) |
| $75,000 to $99,999 | 42 (12.4%) | 32 (8.7%) |
| $100,000 to $149,999 | 28 (8.3%) | 66 (17.9%) |
| $150,000 or more | 76 (22.5%) | 57 (15.4%) |
| Total | 338 (100.0%) | 369 (100.0%) |
Property Value to Household Income Ratio in Lake Lure
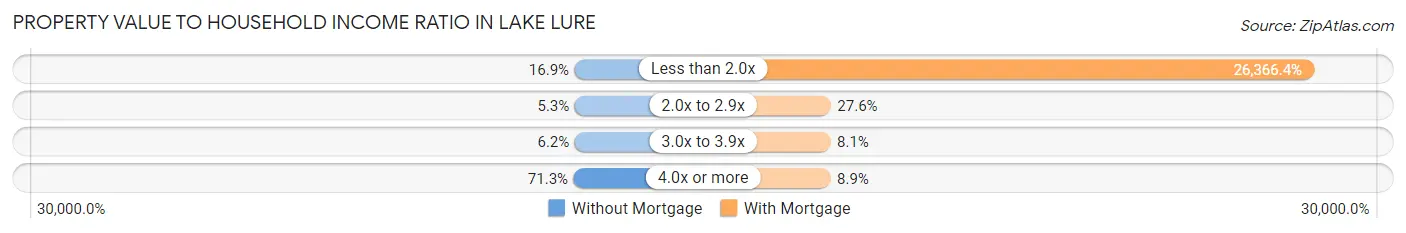
| Value-to-Income Ratio | Without Mortgage | With Mortgage |
| Less than 2.0x | 57 (16.9%) | 97,292 (26,366.4%) |
| 2.0x to 2.9x | 18 (5.3%) | 102 (27.6%) |
| 3.0x to 3.9x | 21 (6.2%) | 30 (8.1%) |
| 4.0x or more | 241 (71.3%) | 33 (8.9%) |
| Total | 338 (100.0%) | 369 (100.0%) |
Real Estate Taxes by Mortgage Status in Lake Lure
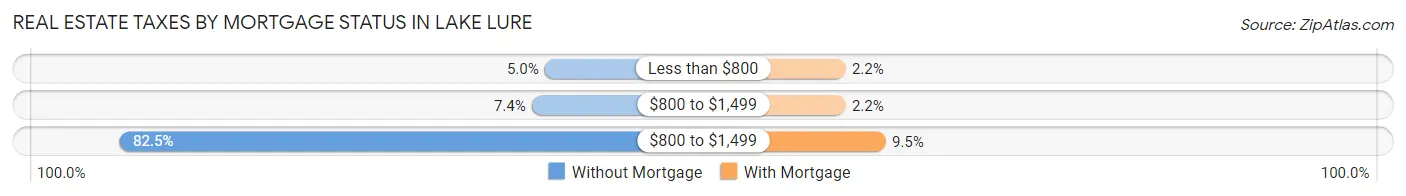
| Property Taxes | Without Mortgage | With Mortgage |
| Less than $800 | 17 (5.0%) | 8 (2.2%) |
| $800 to $1,499 | 25 (7.4%) | 8 (2.2%) |
| $800 to $1,499 | 279 (82.5%) | 35 (9.5%) |
| Total | 338 (100.0%) | 369 (100.0%) |
Health & Disability in Lake Lure
Health Insurance Coverage by Age in Lake Lure
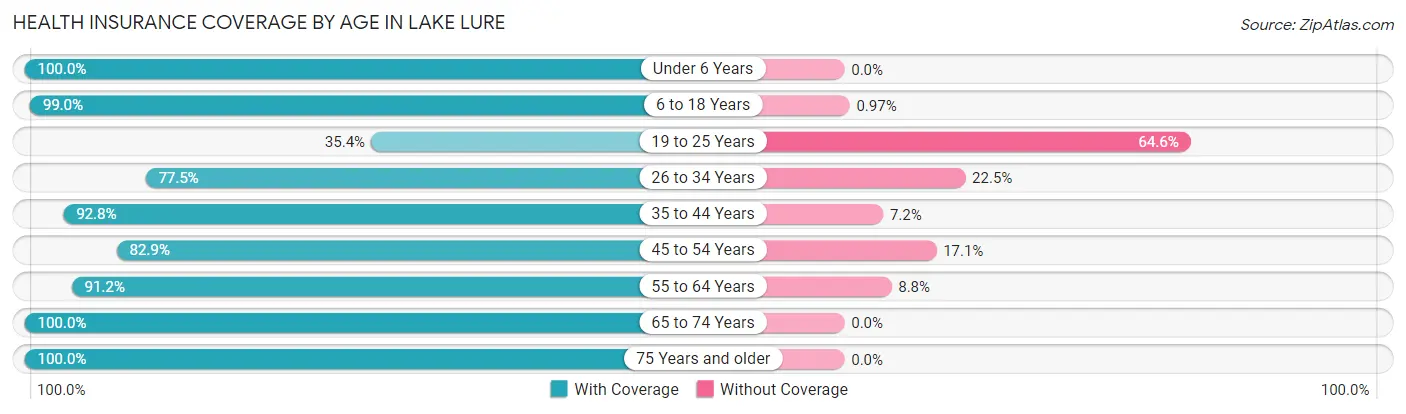
| Age Bracket | With Coverage | Without Coverage |
| Under 6 Years | 42 (100.0%) | 0 (0.0%) |
| 6 to 18 Years | 102 (99.0%) | 1 (1.0%) |
| 19 to 25 Years | 17 (35.4%) | 31 (64.6%) |
| 26 to 34 Years | 55 (77.5%) | 16 (22.5%) |
| 35 to 44 Years | 103 (92.8%) | 8 (7.2%) |
| 45 to 54 Years | 116 (82.9%) | 24 (17.1%) |
| 55 to 64 Years | 396 (91.2%) | 38 (8.8%) |
| 65 to 74 Years | 389 (100.0%) | 0 (0.0%) |
| 75 Years and older | 237 (100.0%) | 0 (0.0%) |
| Total | 1,457 (92.5%) | 118 (7.5%) |
Health Insurance Coverage by Citizenship Status in Lake Lure
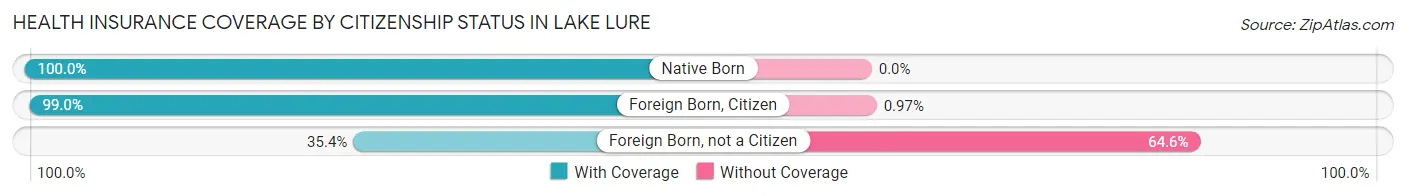
| Citizenship Status | With Coverage | Without Coverage |
| Native Born | 42 (100.0%) | 0 (0.0%) |
| Foreign Born, Citizen | 102 (99.0%) | 1 (1.0%) |
| Foreign Born, not a Citizen | 17 (35.4%) | 31 (64.6%) |
Health Insurance Coverage by Household Income in Lake Lure
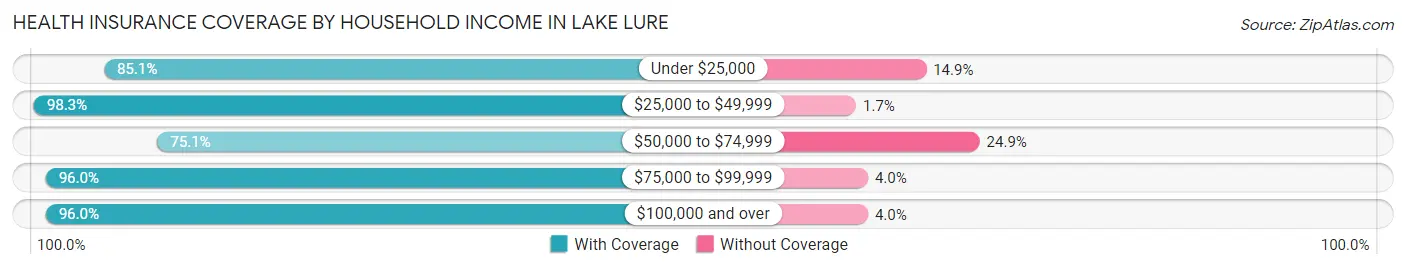
| Household Income | With Coverage | Without Coverage |
| Under $25,000 | 103 (85.1%) | 18 (14.9%) |
| $25,000 to $49,999 | 283 (98.3%) | 5 (1.7%) |
| $50,000 to $74,999 | 175 (75.1%) | 58 (24.9%) |
| $75,000 to $99,999 | 218 (96.0%) | 9 (4.0%) |
| $100,000 and over | 678 (96.0%) | 28 (4.0%) |
Public vs Private Health Insurance Coverage by Age in Lake Lure
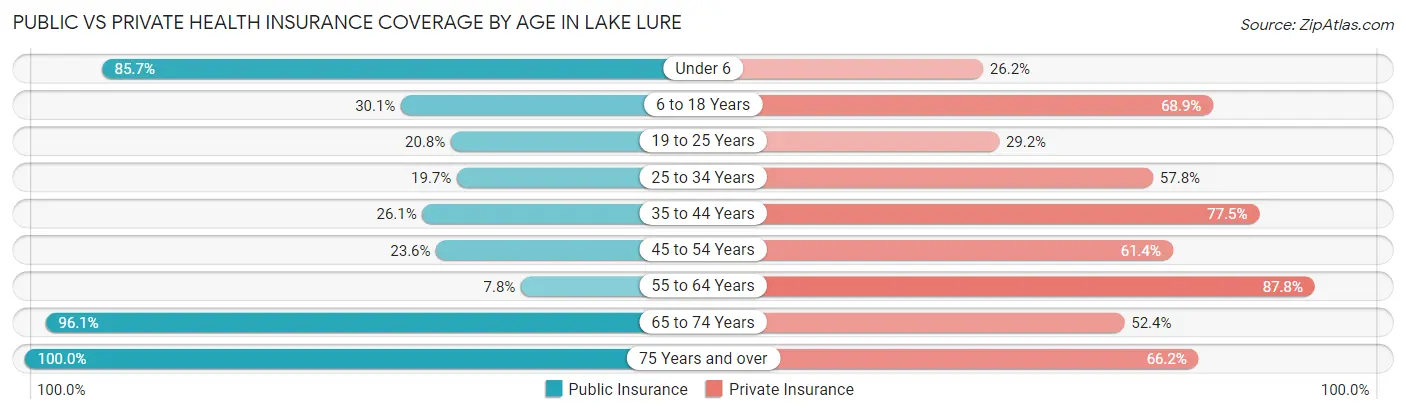
| Age Bracket | Public Insurance | Private Insurance |
| Under 6 | 36 (85.7%) | 11 (26.2%) |
| 6 to 18 Years | 31 (30.1%) | 71 (68.9%) |
| 19 to 25 Years | 10 (20.8%) | 14 (29.2%) |
| 25 to 34 Years | 14 (19.7%) | 41 (57.8%) |
| 35 to 44 Years | 29 (26.1%) | 86 (77.5%) |
| 45 to 54 Years | 33 (23.6%) | 86 (61.4%) |
| 55 to 64 Years | 34 (7.8%) | 381 (87.8%) |
| 65 to 74 Years | 374 (96.1%) | 204 (52.4%) |
| 75 Years and over | 237 (100.0%) | 157 (66.2%) |
| Total | 798 (50.7%) | 1,051 (66.7%) |
Disability Status by Sex by Age in Lake Lure
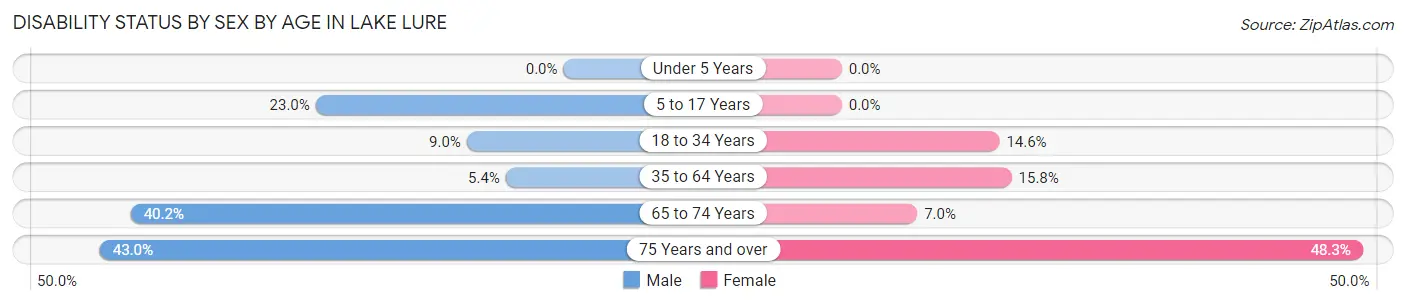
| Age Bracket | Male | Female |
| Under 5 Years | 0 (0.0%) | 0 (0.0%) |
| 5 to 17 Years | 20 (23.0%) | 0 (0.0%) |
| 18 to 34 Years | 7 (9.0%) | 6 (14.6%) |
| 35 to 64 Years | 19 (5.3%) | 52 (15.8%) |
| 65 to 74 Years | 53 (40.2%) | 18 (7.0%) |
| 75 Years and over | 37 (43.0%) | 73 (48.3%) |
Disability Class by Sex by Age in Lake Lure
Disability Class: Hearing Difficulty
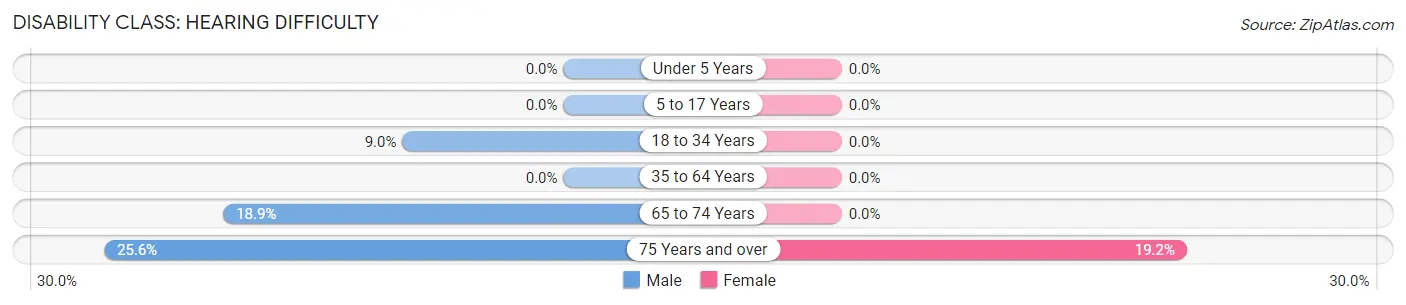
| Age Bracket | Male | Female |
| Under 5 Years | 0 (0.0%) | 0 (0.0%) |
| 5 to 17 Years | 0 (0.0%) | 0 (0.0%) |
| 18 to 34 Years | 7 (9.0%) | 0 (0.0%) |
| 35 to 64 Years | 0 (0.0%) | 0 (0.0%) |
| 65 to 74 Years | 25 (18.9%) | 0 (0.0%) |
| 75 Years and over | 22 (25.6%) | 29 (19.2%) |
Disability Class: Vision Difficulty
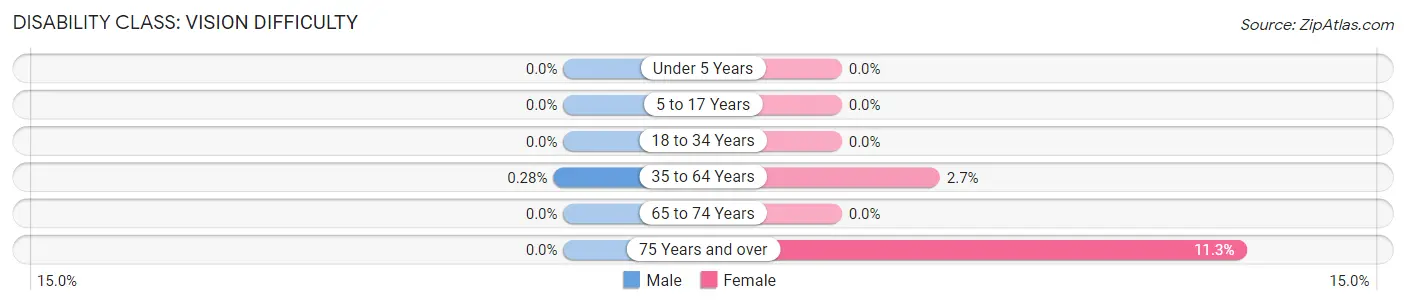
| Age Bracket | Male | Female |
| Under 5 Years | 0 (0.0%) | 0 (0.0%) |
| 5 to 17 Years | 0 (0.0%) | 0 (0.0%) |
| 18 to 34 Years | 0 (0.0%) | 0 (0.0%) |
| 35 to 64 Years | 1 (0.3%) | 9 (2.7%) |
| 65 to 74 Years | 0 (0.0%) | 0 (0.0%) |
| 75 Years and over | 0 (0.0%) | 17 (11.3%) |
Disability Class: Cognitive Difficulty
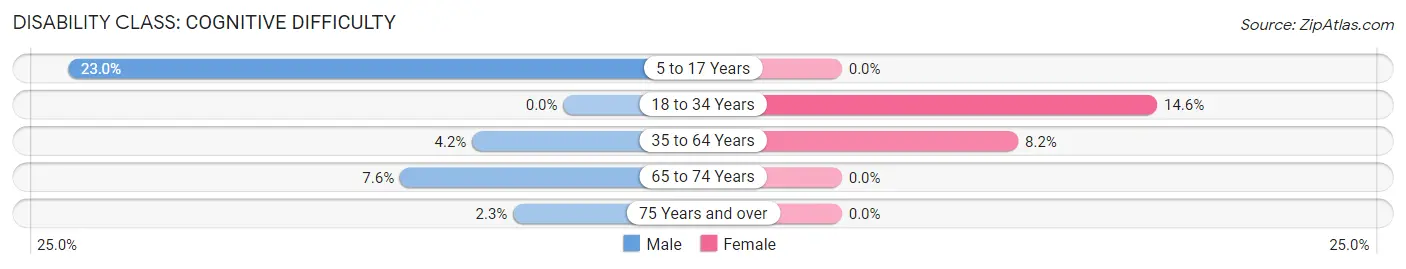
| Age Bracket | Male | Female |
| 5 to 17 Years | 20 (23.0%) | 0 (0.0%) |
| 18 to 34 Years | 0 (0.0%) | 6 (14.6%) |
| 35 to 64 Years | 15 (4.2%) | 27 (8.2%) |
| 65 to 74 Years | 10 (7.6%) | 0 (0.0%) |
| 75 Years and over | 2 (2.3%) | 0 (0.0%) |
Disability Class: Ambulatory Difficulty
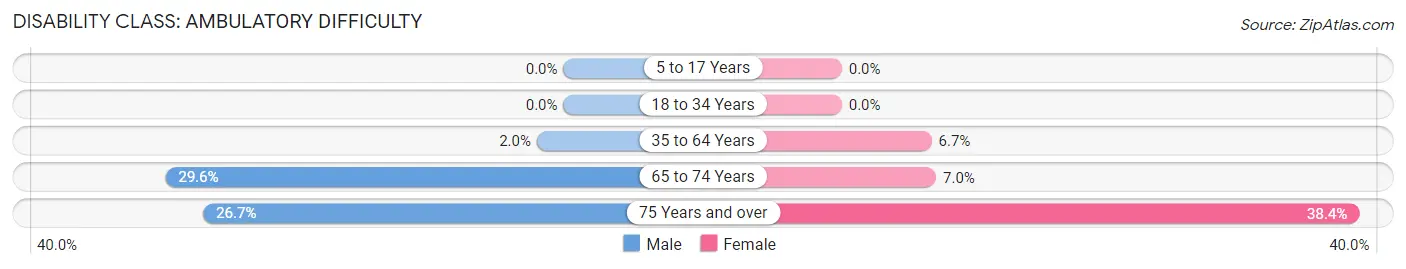
| Age Bracket | Male | Female |
| 5 to 17 Years | 0 (0.0%) | 0 (0.0%) |
| 18 to 34 Years | 0 (0.0%) | 0 (0.0%) |
| 35 to 64 Years | 7 (2.0%) | 22 (6.7%) |
| 65 to 74 Years | 39 (29.5%) | 18 (7.0%) |
| 75 Years and over | 23 (26.7%) | 58 (38.4%) |
Disability Class: Self-Care Difficulty
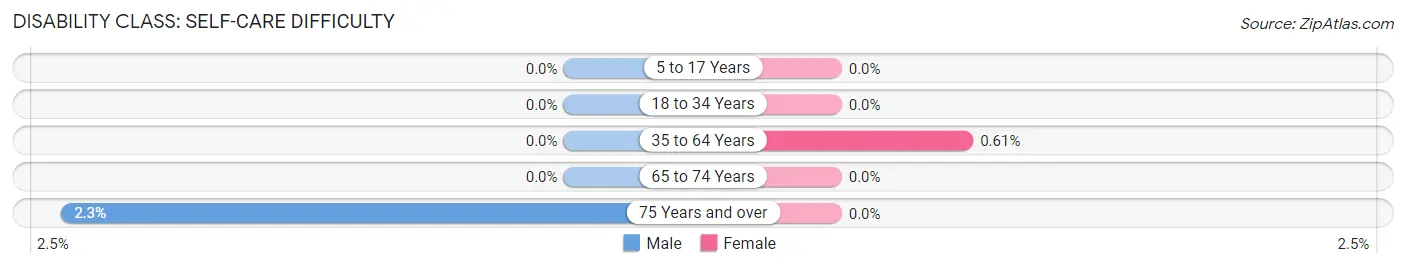
| Age Bracket | Male | Female |
| 5 to 17 Years | 0 (0.0%) | 0 (0.0%) |
| 18 to 34 Years | 0 (0.0%) | 0 (0.0%) |
| 35 to 64 Years | 0 (0.0%) | 2 (0.6%) |
| 65 to 74 Years | 0 (0.0%) | 0 (0.0%) |
| 75 Years and over | 2 (2.3%) | 0 (0.0%) |
Technology Access in Lake Lure
Computing Device Access in Lake Lure
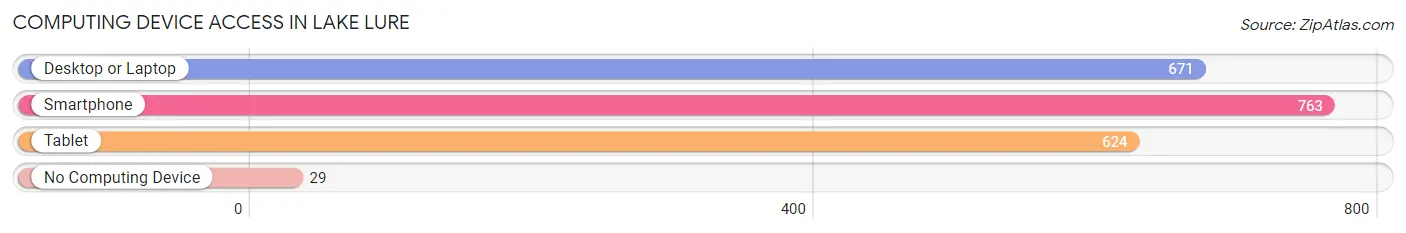
| Device Type | # Households | % Households |
| Desktop or Laptop | 671 | 80.3% |
| Smartphone | 763 | 91.3% |
| Tablet | 624 | 74.6% |
| No Computing Device | 29 | 3.5% |
| Total | 836 | 100.0% |
Internet Access in Lake Lure
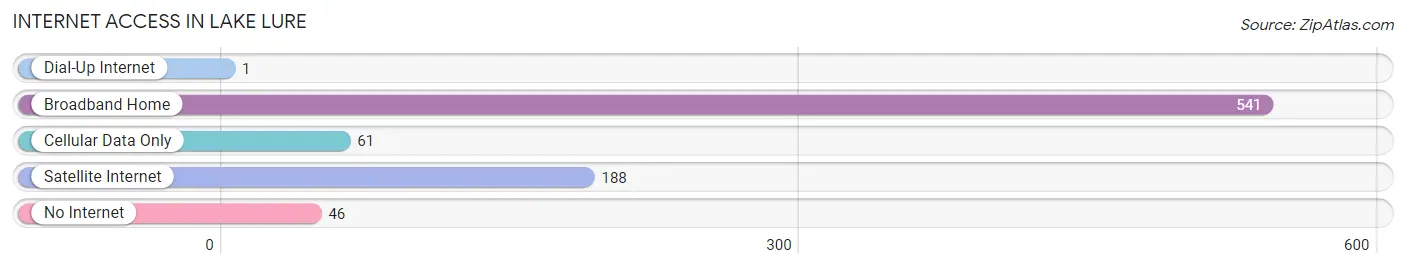
| Internet Type | # Households | % Households |
| Dial-Up Internet | 1 | 0.1% |
| Broadband Home | 541 | 64.7% |
| Cellular Data Only | 61 | 7.3% |
| Satellite Internet | 188 | 22.5% |
| No Internet | 46 | 5.5% |
| Total | 836 | 100.0% |
Lake Lure Summary
Lake Lure is a small town located in the foothills of the Blue Ridge Mountains in western North Carolina. It is situated in the Hickory Nut Gorge, a deep, narrow valley that is home to the scenic Hickory Nut Falls. The town is located in Rutherford County, about 25 miles southeast of Asheville.
History
The area around Lake Lure has been inhabited for thousands of years. The Cherokee and Catawba tribes were the first to settle in the area, and the Cherokee called the lake “Tahkeeosteh”, meaning “place of many fish”. The first European settlers arrived in the area in the late 1700s, and the town of Lake Lure was officially established in 1927.
The town was originally developed as a resort destination, and the lake was created in 1926 by damming the Rocky Broad River. The lake was named after the nearby town of Lure, which was named after the lure of the lake’s beauty. The town was also home to the first hydroelectric plant in the state of North Carolina.
Geography
Lake Lure is located in the foothills of the Blue Ridge Mountains in western North Carolina. The town is situated in the Hickory Nut Gorge, a deep, narrow valley that is home to the scenic Hickory Nut Falls. The lake itself is approximately 720 acres in size and is surrounded by the towns of Chimney Rock, Bat Cave, and Lake Lure.
The town is located in Rutherford County, about 25 miles southeast of Asheville. The town is situated at an elevation of 1,400 feet above sea level, and the surrounding area is characterized by rolling hills and lush forests.
Economy
The economy of Lake Lure is largely based on tourism. The town is home to a variety of attractions, including the Lake Lure Beach and Water Park, the Chimney Rock State Park, and the Hickory Nut Gorge. The town is also home to a variety of restaurants, shops, and lodging options.
In addition to tourism, the town is also home to a variety of small businesses, including a winery, a brewery, and a distillery. The town is also home to a number of manufacturing companies, including a furniture manufacturer and a plastics manufacturer.
Demographics
As of the 2010 census, the population of Lake Lure was 1,192. The town is predominantly white, with 91.3% of the population identifying as white. The town is also home to a small Hispanic population, with 4.2% of the population identifying as Hispanic or Latino.
The median household income in Lake Lure is $41,250, and the median home value is $179,400. The town has a poverty rate of 11.3%, and the unemployment rate is 4.2%.
Conclusion
Lake Lure is a small town located in the foothills of the Blue Ridge Mountains in western North Carolina. The town is situated in the Hickory Nut Gorge, a deep, narrow valley that is home to the scenic Hickory Nut Falls. The town was originally developed as a resort destination, and the lake was created in 1926 by damming the Rocky Broad River. The economy of Lake Lure is largely based on tourism, and the town is home to a variety of attractions, restaurants, shops, and lodging options. As of the 2010 census, the population of Lake Lure was 1,192, and the median household income is $41,250.
Common Questions
What is Per Capita Income in Lake Lure?
Per Capita income in Lake Lure is $64,692.
What is the Median Family Income in Lake Lure?
Median Family Income in Lake Lure is $117,750.
What is the Median Household income in Lake Lure?
Median Household Income in Lake Lure is $75,259.
What is Income or Wage Gap in Lake Lure?
Income or Wage Gap in Lake Lure is 43.8%.
Women in Lake Lure earn 56.2 cents for every dollar earned by a man.
What is Inequality or Gini Index in Lake Lure?
Inequality or Gini Index in Lake Lure is 0.53.
What is the Total Population of Lake Lure?
Total Population of Lake Lure is 1,575.
What is the Total Male Population of Lake Lure?
Total Male Population of Lake Lure is 750.
What is the Total Female Population of Lake Lure?
Total Female Population of Lake Lure is 825.
What is the Ratio of Males per 100 Females in Lake Lure?
There are 90.91 Males per 100 Females in Lake Lure.
What is the Ratio of Females per 100 Males in Lake Lure?
There are 110.00 Females per 100 Males in Lake Lure.
What is the Median Population Age in Lake Lure?
Median Population Age in Lake Lure is 61.6 Years.
What is the Average Family Size in Lake Lure
Average Family Size in Lake Lure is 2.4 People.
What is the Average Household Size in Lake Lure
Average Household Size in Lake Lure is 1.9 People.
How Large is the Labor Force in Lake Lure?
There are 627 People in the Labor Forcein in Lake Lure.
What is the Percentage of People in the Labor Force in Lake Lure?
43.6% of People are in the Labor Force in Lake Lure.
What is the Unemployment Rate in Lake Lure?
Unemployment Rate in Lake Lure is 4.1%.