Broadway, NC Map & Demographics
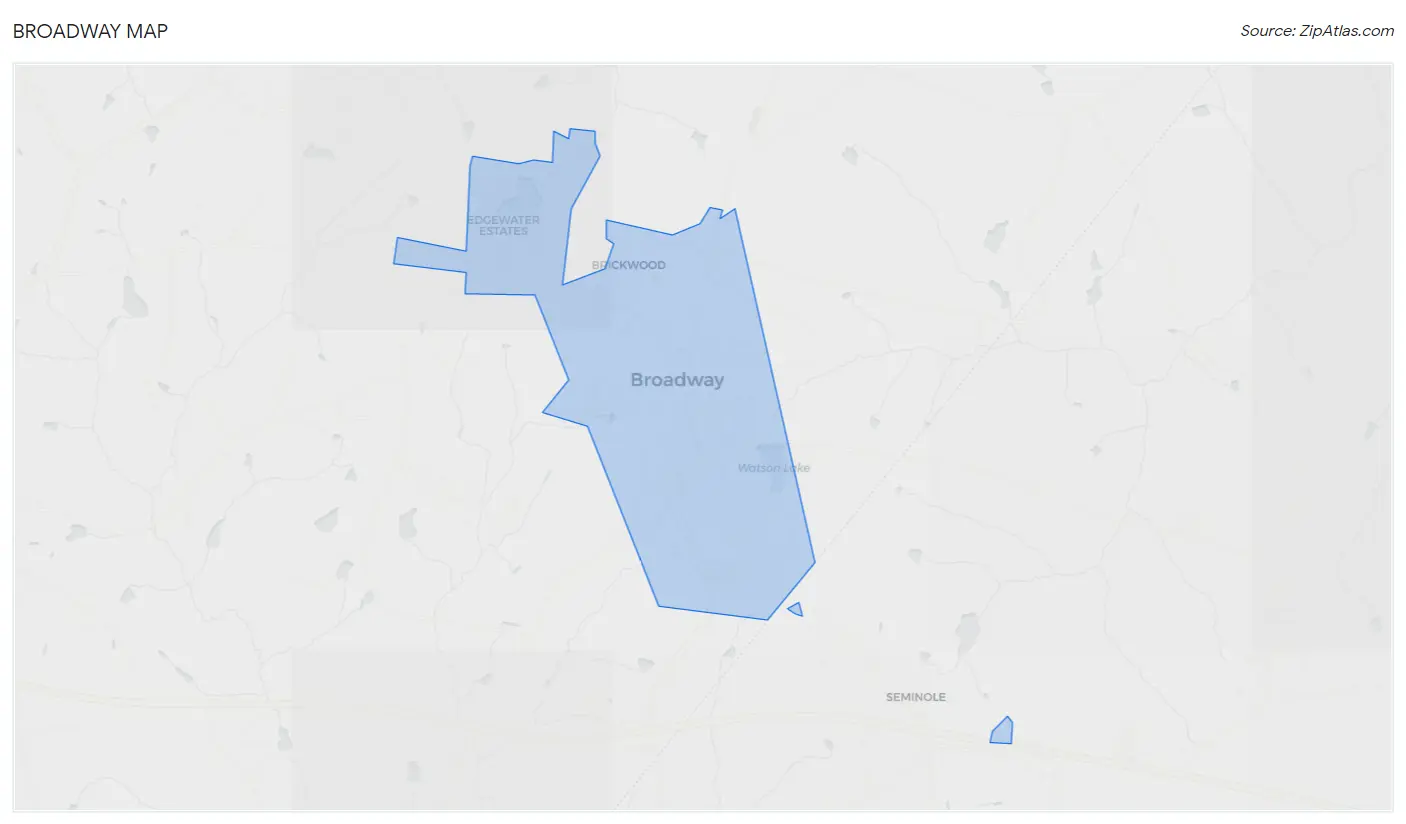
Broadway Map
Broadway Overview
$46,473
PER CAPITA INCOME
$103,333
AVG FAMILY INCOME
$63,333
AVG HOUSEHOLD INCOME
23.8%
WAGE / INCOME GAP [ % ]
76.2¢/ $1
WAGE / INCOME GAP [ $ ]
0.50
INEQUALITY / GINI INDEX
1,415
TOTAL POPULATION
690
MALE POPULATION
725
FEMALE POPULATION
95.17
MALES / 100 FEMALES
105.07
FEMALES / 100 MALES
48.3
MEDIAN AGE
2.6
AVG FAMILY SIZE
2.2
AVG HOUSEHOLD SIZE
716
LABOR FORCE [ PEOPLE ]
61.6%
PERCENT IN LABOR FORCE
2.9%
UNEMPLOYMENT RATE
Broadway Zip Codes
Broadway Area Codes
Income in Broadway
Income Overview in Broadway
Per Capita Income in Broadway is $46,473, while median incomes of families and households are $103,333 and $63,333 respectively.
| Characteristic | Number | Measure |
| Per Capita Income | 1,415 | $46,473 |
| Median Family Income | 420 | $103,333 |
| Mean Family Income | 420 | $130,706 |
| Median Household Income | 644 | $63,333 |
| Mean Household Income | 644 | $102,961 |
| Income Deficit | 420 | $0 |
| Wage / Income Gap (%) | 1,415 | 23.82% |
| Wage / Income Gap ($) | 1,415 | 76.18¢ per $1 |
| Gini / Inequality Index | 1,415 | 0.50 |
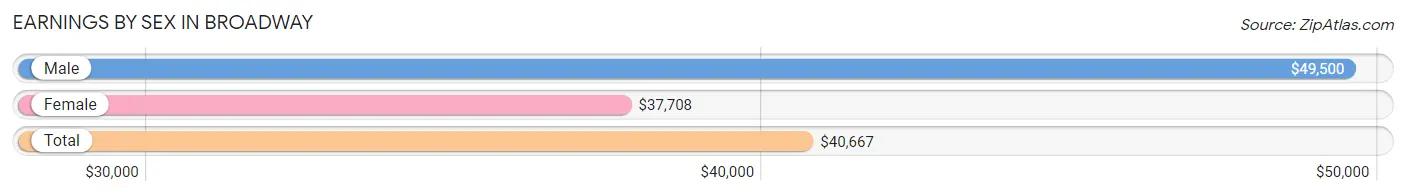
Earnings by Sex in Broadway
Average Earnings in Broadway are $40,667, $49,500 for men and $37,708 for women, a difference of 23.8%.
| Sex | Number | Average Earnings |
| Male | 406 (54.4%) | $49,500 |
| Female | 340 (45.6%) | $37,708 |
| Total | 746 (100.0%) | $40,667 |
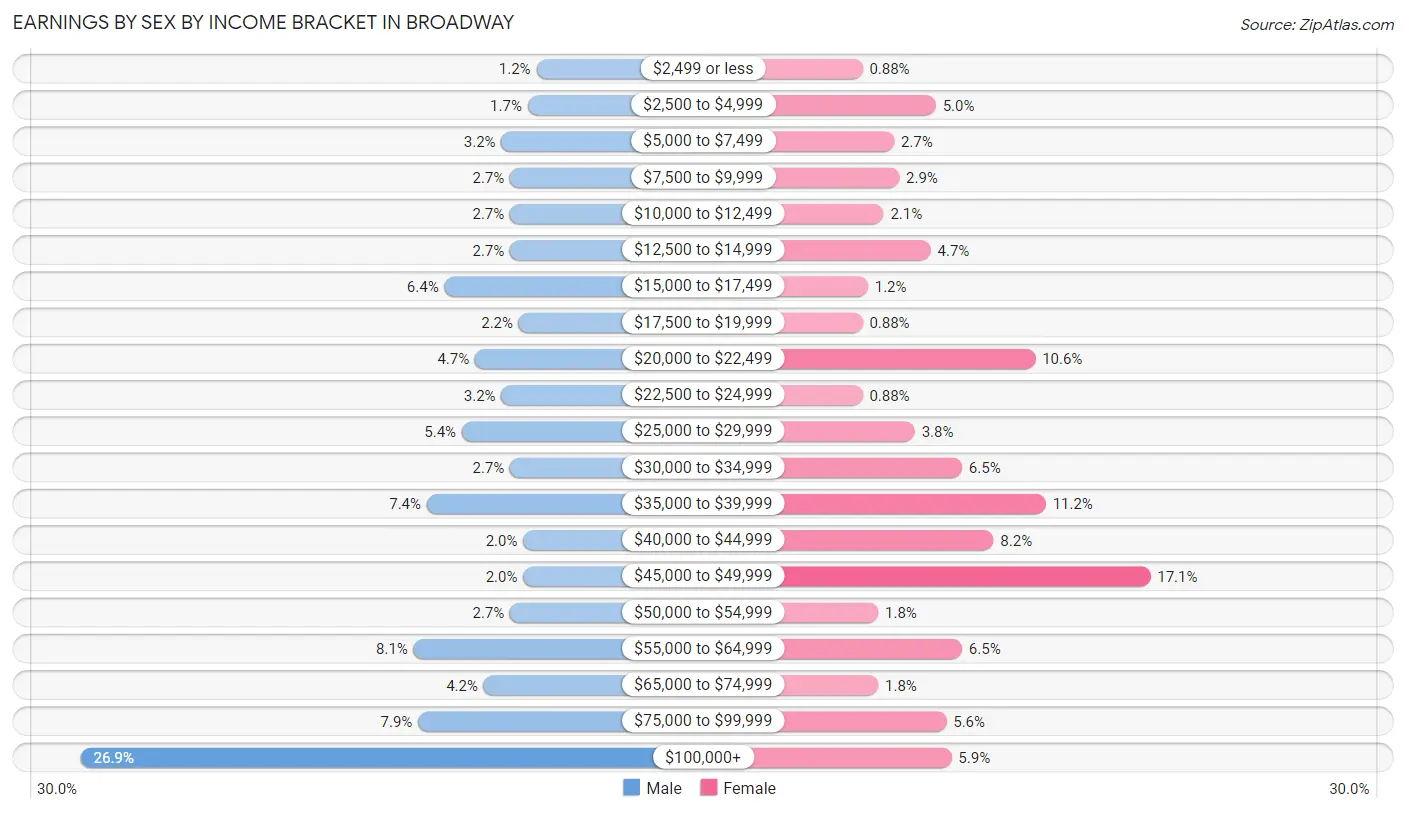
Earnings by Sex by Income Bracket in Broadway
The most common earnings brackets in Broadway are $100,000+ for men (109 | 26.9%) and $45,000 to $49,999 for women (58 | 17.1%).
| Income | Male | Female |
| $2,499 or less | 5 (1.2%) | 3 (0.9%) |
| $2,500 to $4,999 | 7 (1.7%) | 17 (5.0%) |
| $5,000 to $7,499 | 13 (3.2%) | 9 (2.6%) |
| $7,500 to $9,999 | 11 (2.7%) | 10 (2.9%) |
| $10,000 to $12,499 | 11 (2.7%) | 7 (2.1%) |
| $12,500 to $14,999 | 11 (2.7%) | 16 (4.7%) |
| $15,000 to $17,499 | 26 (6.4%) | 4 (1.2%) |
| $17,500 to $19,999 | 9 (2.2%) | 3 (0.9%) |
| $20,000 to $22,499 | 19 (4.7%) | 36 (10.6%) |
| $22,500 to $24,999 | 13 (3.2%) | 3 (0.9%) |
| $25,000 to $29,999 | 22 (5.4%) | 13 (3.8%) |
| $30,000 to $34,999 | 11 (2.7%) | 22 (6.5%) |
| $35,000 to $39,999 | 30 (7.4%) | 38 (11.2%) |
| $40,000 to $44,999 | 8 (2.0%) | 28 (8.2%) |
| $45,000 to $49,999 | 8 (2.0%) | 58 (17.1%) |
| $50,000 to $54,999 | 11 (2.7%) | 6 (1.8%) |
| $55,000 to $64,999 | 33 (8.1%) | 22 (6.5%) |
| $65,000 to $74,999 | 17 (4.2%) | 6 (1.8%) |
| $75,000 to $99,999 | 32 (7.9%) | 19 (5.6%) |
| $100,000+ | 109 (26.9%) | 20 (5.9%) |
| Total | 406 (100.0%) | 340 (100.0%) |
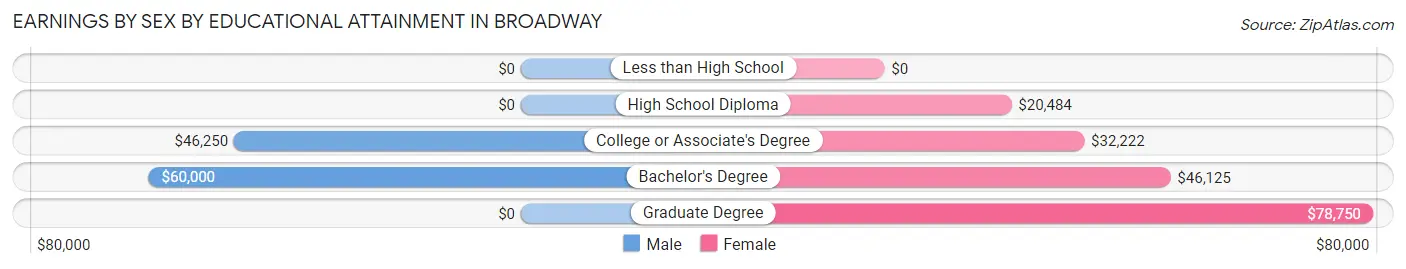
Earnings by Sex by Educational Attainment in Broadway
Average earnings in Broadway are $59,861 for men and $37,500 for women, a difference of 37.3%. Men with an educational attainment of bachelor's degree enjoy the highest average annual earnings of $60,000, while those with college or associate's degree education earn the least with $46,250. Women with an educational attainment of graduate degree earn the most with the average annual earnings of $78,750, while those with high school diploma education have the smallest earnings of $20,484.
| Educational Attainment | Male Income | Female Income |
| Less than High School | - | - |
| High School Diploma | - | - |
| College or Associate's Degree | $46,250 | $32,222 |
| Bachelor's Degree | $60,000 | $46,125 |
| Graduate Degree | - | - |
| Total | $59,861 | $37,500 |
Family Income in Broadway
Family Income Brackets in Broadway
According to the Broadway family income data, there are 100 families falling into the $100,000 to $149,999 income range, which is the most common income bracket and makes up 23.8% of all families. Conversely, the less than $10,000 income bracket is the least frequent group with only 3 families (0.7%) belonging to this category.
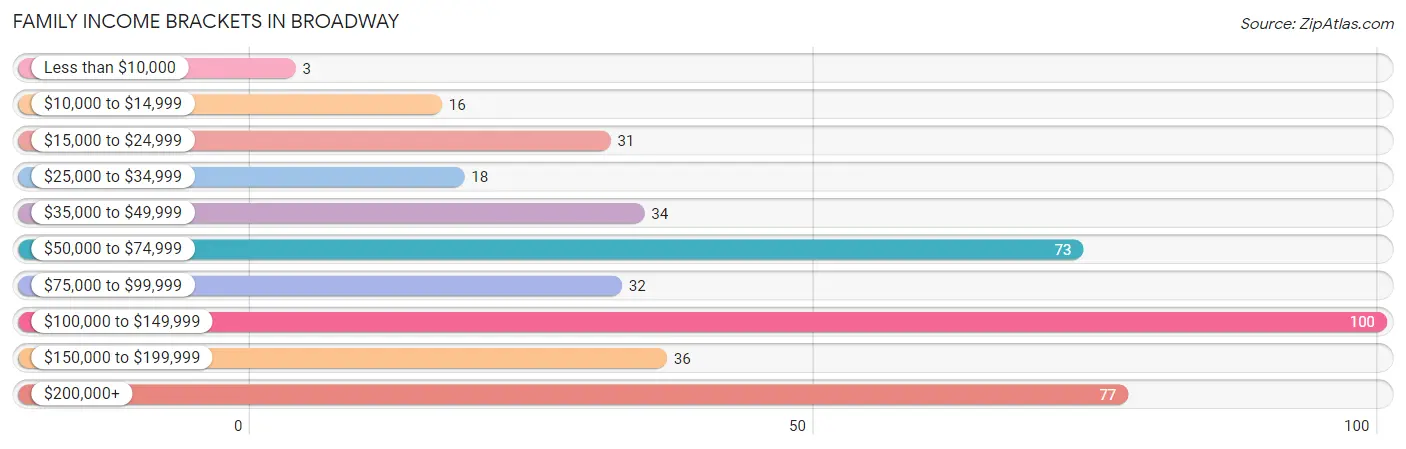
| Income Bracket | # Families | % Families |
| Less than $10,000 | 3 | 0.7% |
| $10,000 to $14,999 | 16 | 3.8% |
| $15,000 to $24,999 | 31 | 7.4% |
| $25,000 to $34,999 | 18 | 4.3% |
| $35,000 to $49,999 | 34 | 8.1% |
| $50,000 to $74,999 | 73 | 17.4% |
| $75,000 to $99,999 | 32 | 7.6% |
| $100,000 to $149,999 | 100 | 23.8% |
| $150,000 to $199,999 | 36 | 8.6% |
| $200,000+ | 77 | 18.3% |
Family Income by Famaliy Size in Broadway
2-person families (256 | 61.0%) account for the highest median family income in Broadway with $105,000 per family, while 2-person families (256 | 61.0%) have the highest median income of $52,500 per family member.
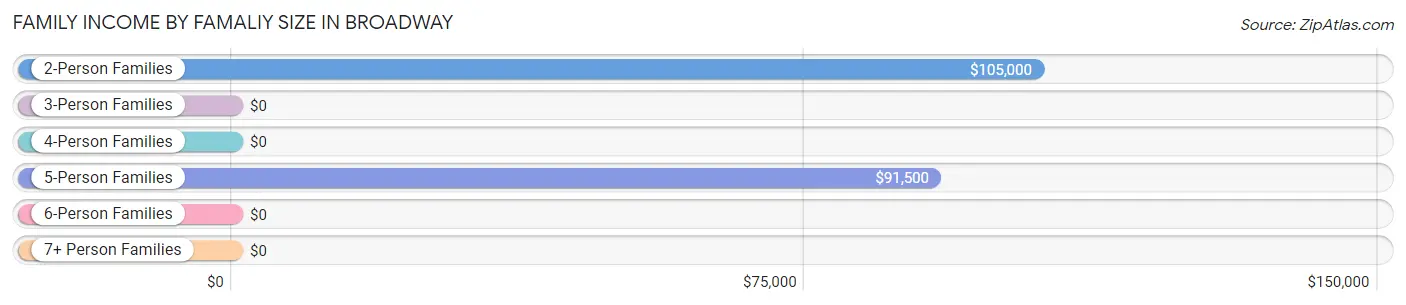
| Income Bracket | # Families | Median Income |
| 2-Person Families | 256 (61.0%) | $105,000 |
| 3-Person Families | 100 (23.8%) | $0 |
| 4-Person Families | 47 (11.2%) | $0 |
| 5-Person Families | 12 (2.9%) | $91,500 |
| 6-Person Families | 5 (1.2%) | $0 |
| 7+ Person Families | 0 (0.0%) | $0 |
| Total | 420 (100.0%) | $103,333 |
Family Income by Number of Earners in Broadway
The median family income in Broadway is $103,333, with families comprising 2 earners (189) having the highest median family income of $147,266, while families with 1 earner (161) have the lowest median family income of $52,083, accounting for 45.0% and 38.3% of families, respectively.
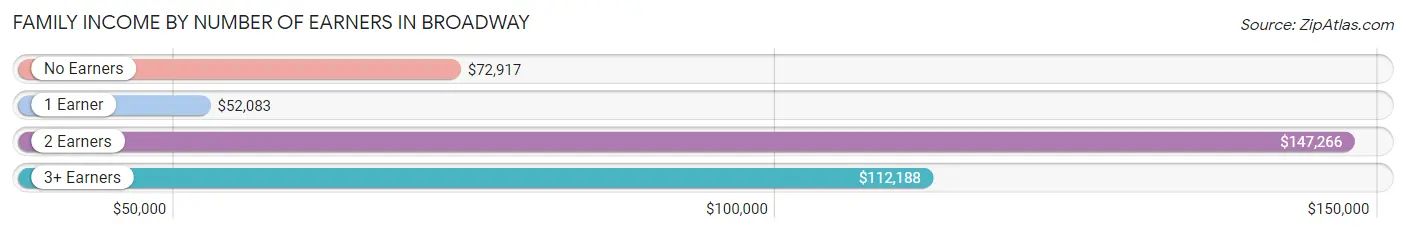
| Number of Earners | # Families | Median Income |
| No Earners | 57 (13.6%) | $72,917 |
| 1 Earner | 161 (38.3%) | $52,083 |
| 2 Earners | 189 (45.0%) | $147,266 |
| 3+ Earners | 13 (3.1%) | $112,188 |
| Total | 420 (100.0%) | $103,333 |
Household Income in Broadway
Household Income Brackets in Broadway
With 123 households falling in the category, the $100,000 to $149,999 income range is the most frequent in Broadway, accounting for 19.1% of all households. In contrast, only 6 households (0.9%) fall into the less than $10,000 income bracket, making it the least populous group.
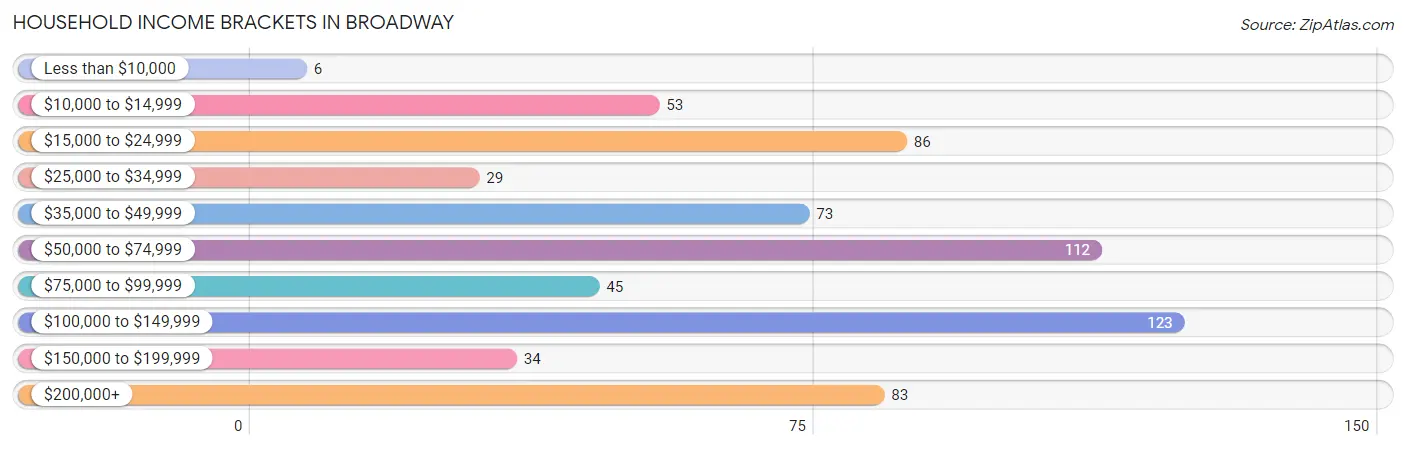
| Income Bracket | # Households | % Households |
| Less than $10,000 | 6 | 0.9% |
| $10,000 to $14,999 | 53 | 8.2% |
| $15,000 to $24,999 | 86 | 13.4% |
| $25,000 to $34,999 | 29 | 4.5% |
| $35,000 to $49,999 | 73 | 11.3% |
| $50,000 to $74,999 | 112 | 17.4% |
| $75,000 to $99,999 | 45 | 7.0% |
| $100,000 to $149,999 | 123 | 19.1% |
| $150,000 to $199,999 | 34 | 5.3% |
| $200,000+ | 83 | 12.9% |
Household Income by Householder Age in Broadway
The median household income in Broadway is $63,333, with the highest median household income of $82,188 found in the 45 to 64 years age bracket for the primary householder. A total of 221 households (34.3%) fall into this category. Meanwhile, the 15 to 24 years age bracket for the primary householder has the lowest median household income of $0, with 24 households (3.7%) in this group.
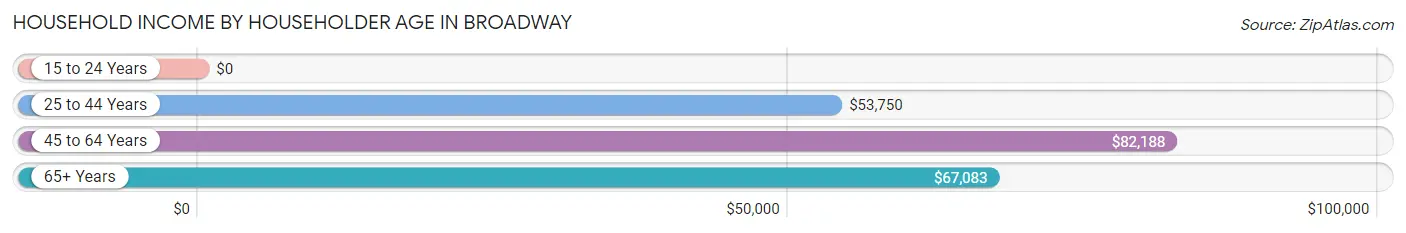
| Income Bracket | # Households | Median Income |
| 15 to 24 Years | 24 (3.7%) | $0 |
| 25 to 44 Years | 150 (23.3%) | $53,750 |
| 45 to 64 Years | 221 (34.3%) | $82,188 |
| 65+ Years | 249 (38.7%) | $67,083 |
| Total | 644 (100.0%) | $63,333 |
Poverty in Broadway
Income Below Poverty by Sex and Age in Broadway
With 9.7% poverty level for males and 24.0% for females among the residents of Broadway, 12 to 14 year old males and 12 to 14 year old females are the most vulnerable to poverty, with 7 males (30.4%) and 32 females (84.2%) in their respective age groups living below the poverty level.
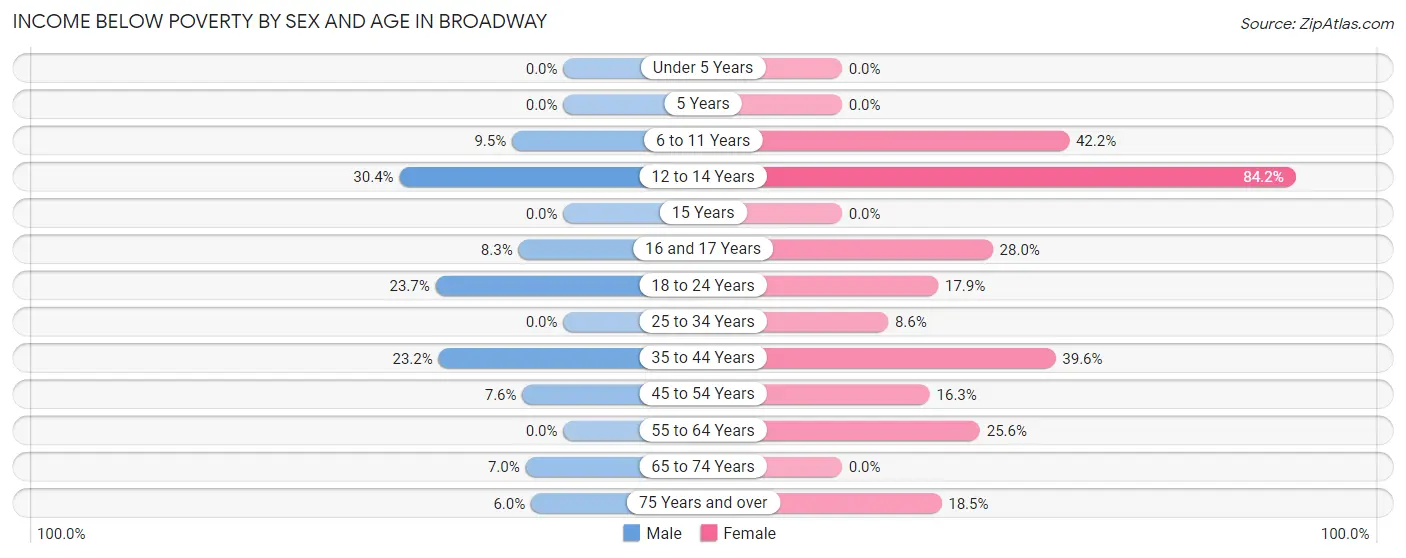
| Age Bracket | Male | Female |
| Under 5 Years | 0 (0.0%) | 0 (0.0%) |
| 5 Years | 0 (0.0%) | 0 (0.0%) |
| 6 to 11 Years | 4 (9.5%) | 35 (42.2%) |
| 12 to 14 Years | 7 (30.4%) | 32 (84.2%) |
| 15 Years | 0 (0.0%) | 0 (0.0%) |
| 16 and 17 Years | 1 (8.3%) | 7 (28.0%) |
| 18 to 24 Years | 14 (23.7%) | 5 (17.9%) |
| 25 to 34 Years | 0 (0.0%) | 3 (8.6%) |
| 35 to 44 Years | 19 (23.2%) | 44 (39.6%) |
| 45 to 54 Years | 7 (7.6%) | 15 (16.3%) |
| 55 to 64 Years | 0 (0.0%) | 21 (25.6%) |
| 65 to 74 Years | 11 (7.0%) | 0 (0.0%) |
| 75 Years and over | 3 (6.0%) | 12 (18.5%) |
| Total | 66 (9.7%) | 174 (24.0%) |
Income Above Poverty by Sex and Age in Broadway
According to the poverty statistics in Broadway, males aged under 5 years and females aged under 5 years are the age groups that are most secure financially, with 100.0% of males and 100.0% of females in these age groups living above the poverty line.
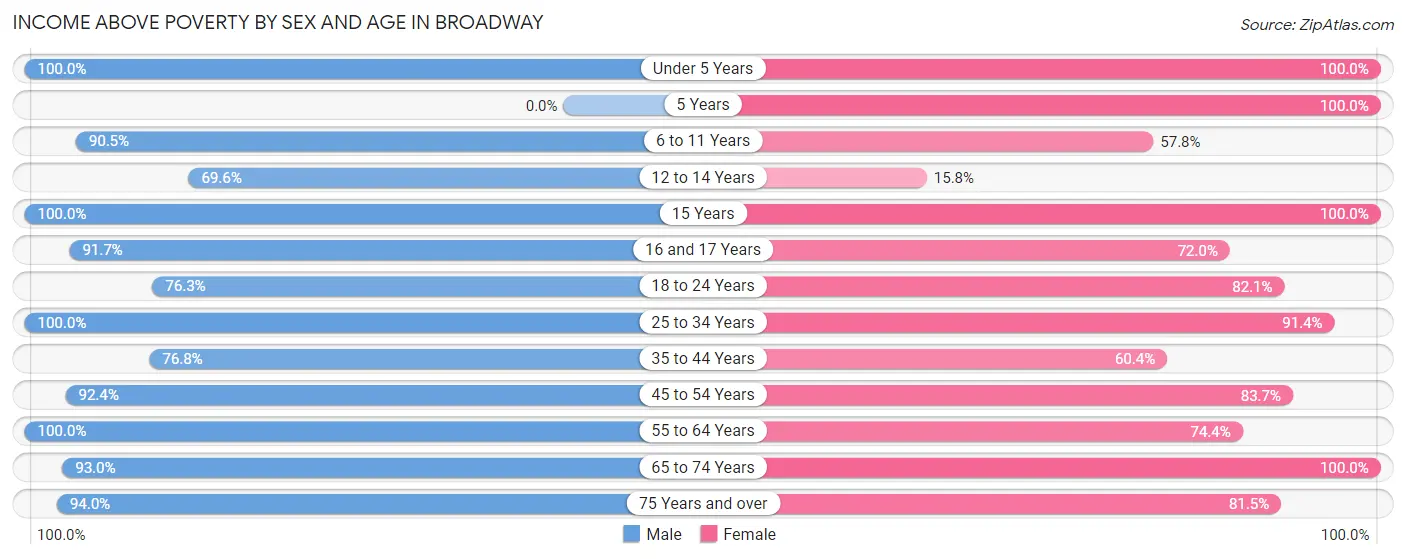
| Age Bracket | Male | Female |
| Under 5 Years | 17 (100.0%) | 26 (100.0%) |
| 5 Years | 0 (0.0%) | 5 (100.0%) |
| 6 to 11 Years | 38 (90.5%) | 48 (57.8%) |
| 12 to 14 Years | 16 (69.6%) | 6 (15.8%) |
| 15 Years | 8 (100.0%) | 3 (100.0%) |
| 16 and 17 Years | 11 (91.7%) | 18 (72.0%) |
| 18 to 24 Years | 45 (76.3%) | 23 (82.1%) |
| 25 to 34 Years | 51 (100.0%) | 32 (91.4%) |
| 35 to 44 Years | 63 (76.8%) | 67 (60.4%) |
| 45 to 54 Years | 85 (92.4%) | 77 (83.7%) |
| 55 to 64 Years | 89 (100.0%) | 61 (74.4%) |
| 65 to 74 Years | 146 (93.0%) | 132 (100.0%) |
| 75 Years and over | 47 (94.0%) | 53 (81.5%) |
| Total | 616 (90.3%) | 551 (76.0%) |
Income Below Poverty Among Married-Couple Families in Broadway
The poverty statistics for married-couple families in Broadway show that 1.3% or 4 of the total 301 families live below the poverty line. Families with 1 or 2 children have the highest poverty rate of 5.1%, comprising of 4 families. On the other hand, families with no children have the lowest poverty rate of 0.0%, which includes 0 families.
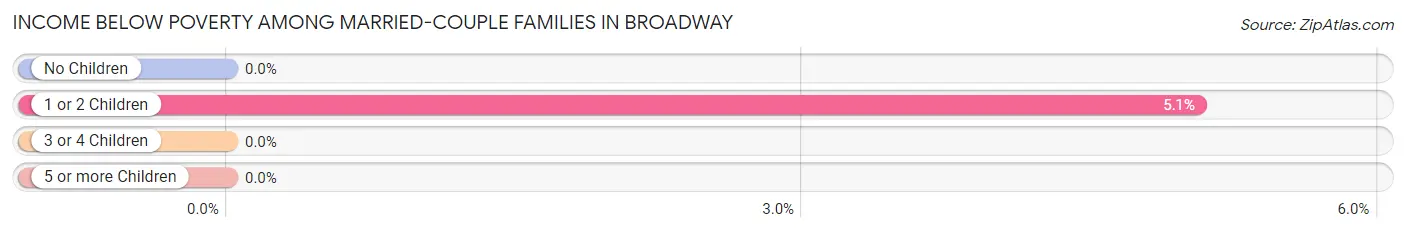
| Children | Above Poverty | Below Poverty |
| No Children | 214 (100.0%) | 0 (0.0%) |
| 1 or 2 Children | 75 (94.9%) | 4 (5.1%) |
| 3 or 4 Children | 8 (100.0%) | 0 (0.0%) |
| 5 or more Children | 0 (0.0%) | 0 (0.0%) |
| Total | 297 (98.7%) | 4 (1.3%) |
Income Below Poverty Among Single-Parent Households in Broadway
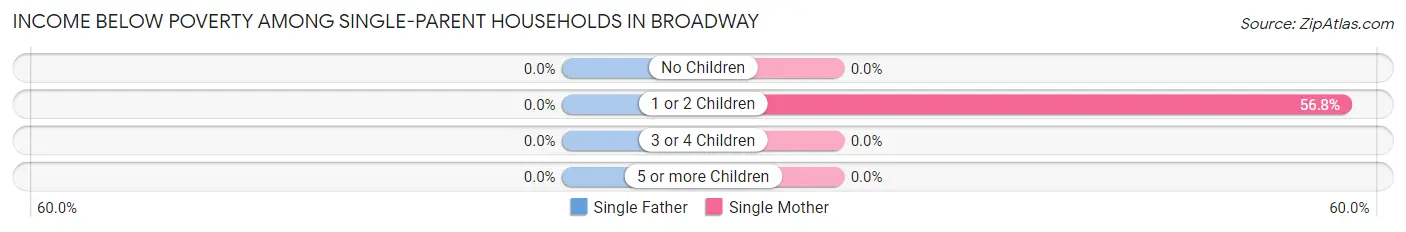
| Children | Single Father | Single Mother |
| No Children | 0 (0.0%) | 0 (0.0%) |
| 1 or 2 Children | 0 (0.0%) | 46 (56.8%) |
| 3 or 4 Children | 0 (0.0%) | 0 (0.0%) |
| 5 or more Children | 0 (0.0%) | 0 (0.0%) |
| Total | 0 (0.0%) | 46 (51.1%) |
Income Below Poverty Among Married-Couple vs Single-Parent Households in Broadway
The poverty data for Broadway shows that 4 of the married-couple family households (1.3%) and 46 of the single-parent households (38.7%) are living below the poverty level. Within the married-couple family households, those with 1 or 2 children have the highest poverty rate, with 4 households (5.1%) falling below the poverty line. Among the single-parent households, those with 1 or 2 children have the highest poverty rate, with 46 household (51.7%) living below poverty.
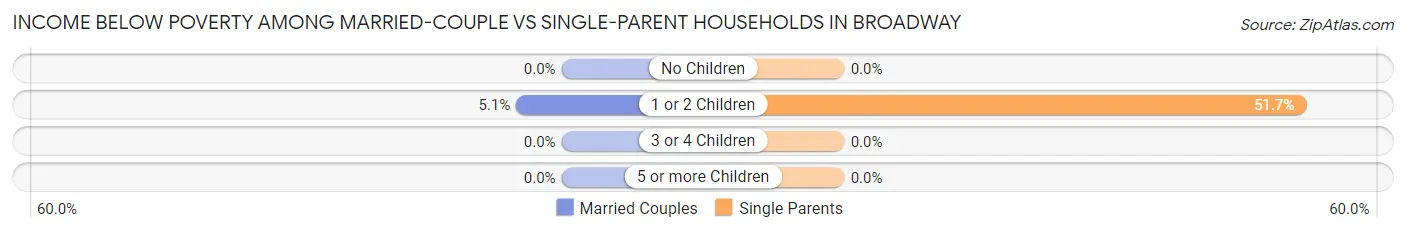
| Children | Married-Couple Families | Single-Parent Households |
| No Children | 0 (0.0%) | 0 (0.0%) |
| 1 or 2 Children | 4 (5.1%) | 46 (51.7%) |
| 3 or 4 Children | 0 (0.0%) | 0 (0.0%) |
| 5 or more Children | 0 (0.0%) | 0 (0.0%) |
| Total | 4 (1.3%) | 46 (38.7%) |
Race in Broadway
The most populous races in Broadway are White / Caucasian (1,224 | 86.5%), Hispanic or Latino (111 | 7.8%), and Black / African American (92 | 6.5%).
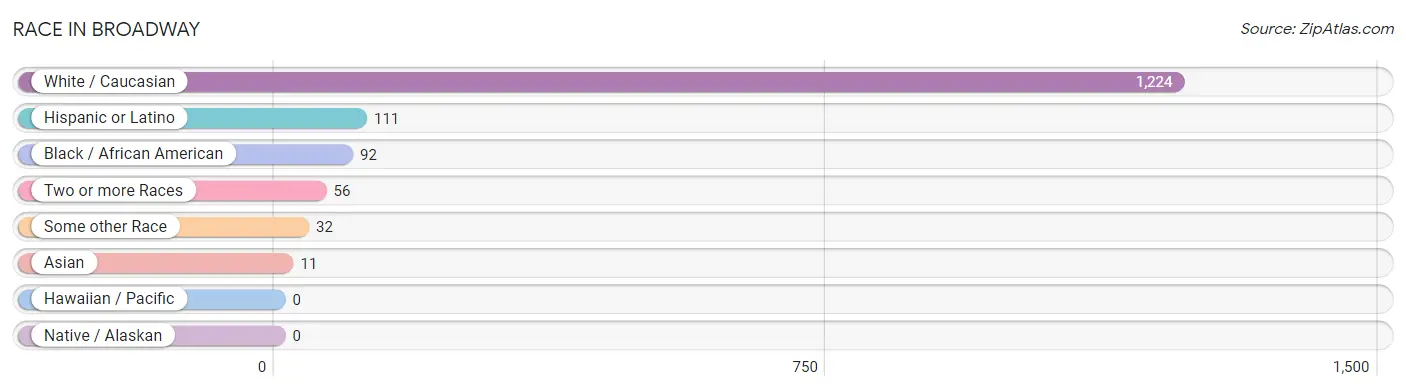
| Race | # Population | % Population |
| Asian | 11 | 0.8% |
| Black / African American | 92 | 6.5% |
| Hawaiian / Pacific | 0 | 0.0% |
| Hispanic or Latino | 111 | 7.8% |
| Native / Alaskan | 0 | 0.0% |
| White / Caucasian | 1,224 | 86.5% |
| Two or more Races | 56 | 4.0% |
| Some other Race | 32 | 2.3% |
| Total | 1,415 | 100.0% |
Ancestry in Broadway
The most populous ancestries reported in Broadway are German (205 | 14.5%), English (200 | 14.1%), Irish (182 | 12.9%), American (123 | 8.7%), and Scottish (70 | 5.0%), together accounting for 55.1% of all Broadway residents.
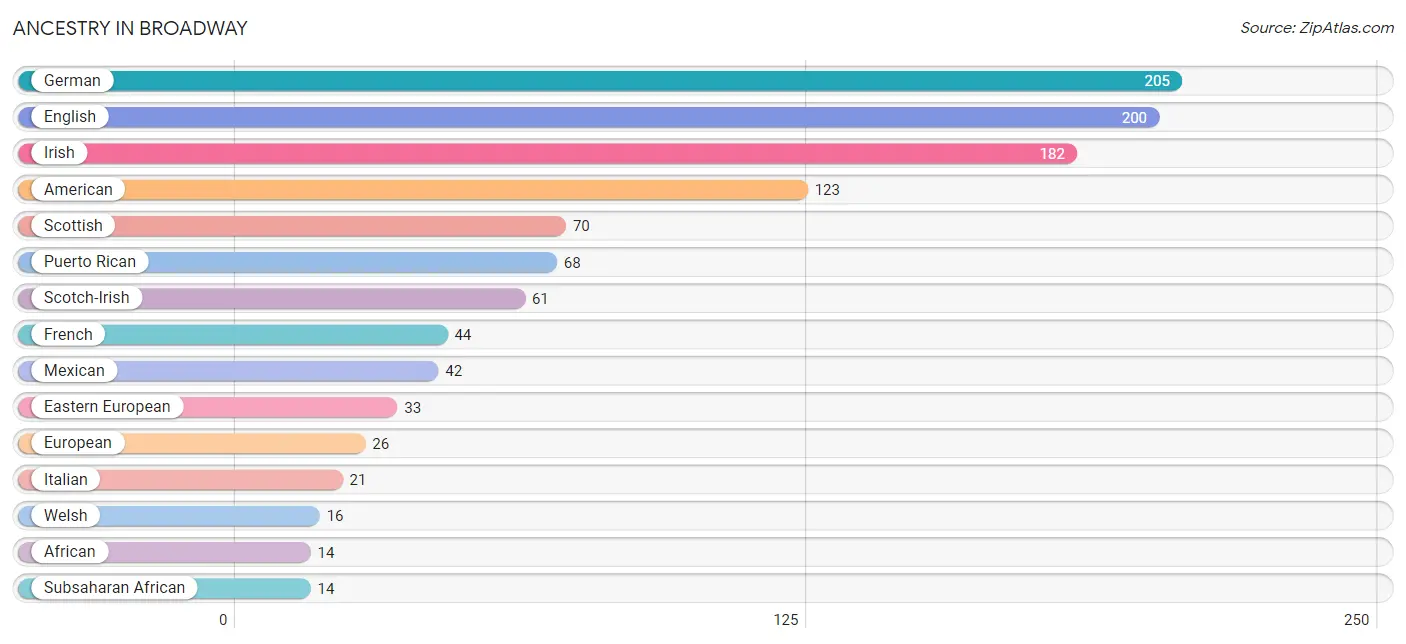
| Ancestry | # Population | % Population |
| African | 14 | 1.0% |
| American | 123 | 8.7% |
| British | 5 | 0.4% |
| Celtic | 4 | 0.3% |
| Central American | 1 | 0.1% |
| Eastern European | 33 | 2.3% |
| English | 200 | 14.1% |
| European | 26 | 1.8% |
| French | 44 | 3.1% |
| French Canadian | 3 | 0.2% |
| German | 205 | 14.5% |
| Honduran | 1 | 0.1% |
| Hungarian | 3 | 0.2% |
| Indian (Asian) | 6 | 0.4% |
| Irish | 182 | 12.9% |
| Israeli | 4 | 0.3% |
| Italian | 21 | 1.5% |
| Lithuanian | 3 | 0.2% |
| Mexican | 42 | 3.0% |
| Norwegian | 12 | 0.9% |
| Pennsylvania German | 7 | 0.5% |
| Polish | 5 | 0.4% |
| Portuguese | 3 | 0.2% |
| Puerto Rican | 68 | 4.8% |
| Scotch-Irish | 61 | 4.3% |
| Scottish | 70 | 5.0% |
| Subsaharan African | 14 | 1.0% |
| Welsh | 16 | 1.1% | View All 28 Rows |
Immigrants in Broadway
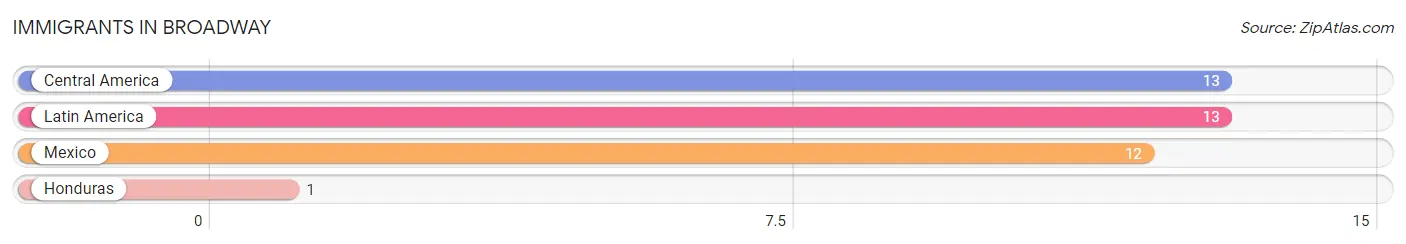
The most numerous immigrant groups reported in Broadway came from Central America (13 | 0.9%), Latin America (13 | 0.9%), Mexico (12 | 0.9%), and Honduras (1 | 0.1%), together accounting for 2.8% of all Broadway residents.
| Immigration Origin | # Population | % Population |
| Central America | 13 | 0.9% |
| Honduras | 1 | 0.1% |
| Latin America | 13 | 0.9% |
| Mexico | 12 | 0.9% | View All 4 Rows |
Sex and Age in Broadway
Sex and Age in Broadway
The most populous age groups in Broadway are 70 to 74 Years (97 | 14.1%) for men and 65 to 69 Years (81 | 11.2%) for women.

| Age Bracket | Male | Female |
| Under 5 Years | 25 (3.6%) | 26 (3.6%) |
| 5 to 9 Years | 39 (5.7%) | 67 (9.2%) |
| 10 to 14 Years | 26 (3.8%) | 59 (8.1%) |
| 15 to 19 Years | 41 (5.9%) | 36 (5.0%) |
| 20 to 24 Years | 38 (5.5%) | 20 (2.8%) |
| 25 to 29 Years | 32 (4.6%) | 15 (2.1%) |
| 30 to 34 Years | 19 (2.8%) | 20 (2.8%) |
| 35 to 39 Years | 43 (6.2%) | 76 (10.5%) |
| 40 to 44 Years | 39 (5.7%) | 35 (4.8%) |
| 45 to 49 Years | 38 (5.5%) | 60 (8.3%) |
| 50 to 54 Years | 54 (7.8%) | 32 (4.4%) |
| 55 to 59 Years | 24 (3.5%) | 24 (3.3%) |
| 60 to 64 Years | 65 (9.4%) | 58 (8.0%) |
| 65 to 69 Years | 60 (8.7%) | 81 (11.2%) |
| 70 to 74 Years | 97 (14.1%) | 51 (7.0%) |
| 75 to 79 Years | 22 (3.2%) | 26 (3.6%) |
| 80 to 84 Years | 17 (2.5%) | 13 (1.8%) |
| 85 Years and over | 11 (1.6%) | 26 (3.6%) |
| Total | 690 (100.0%) | 725 (100.0%) |
Families and Households in Broadway
Median Family Size in Broadway
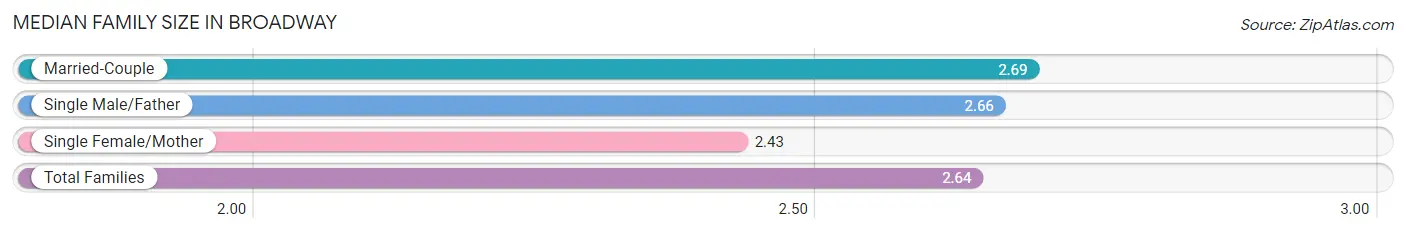
The median family size in Broadway is 2.64 persons per family, with married-couple families (301 | 71.7%) accounting for the largest median family size of 2.69 persons per family. On the other hand, single female/mother families (90 | 21.4%) represent the smallest median family size with 2.43 persons per family.
| Family Type | # Families | Family Size |
| Married-Couple | 301 (71.7%) | 2.69 |
| Single Male/Father | 29 (6.9%) | 2.66 |
| Single Female/Mother | 90 (21.4%) | 2.43 |
| Total Families | 420 (100.0%) | 2.64 |
Median Household Size in Broadway
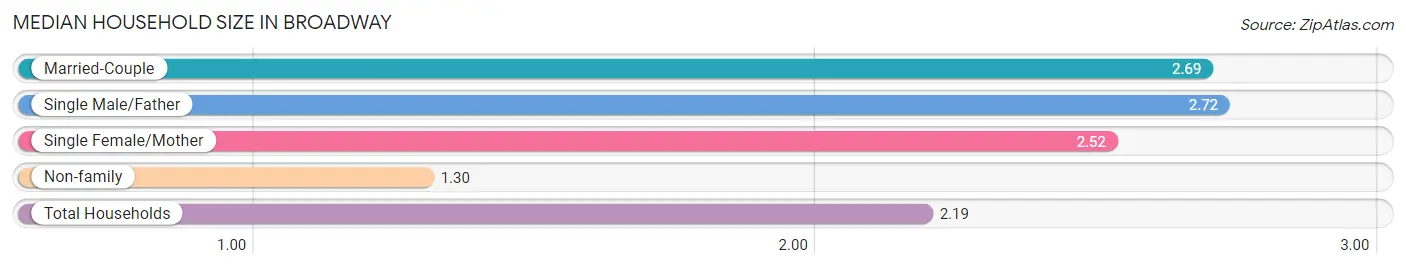
The median household size in Broadway is 2.19 persons per household, with single male/father households (29 | 4.5%) accounting for the largest median household size of 2.72 persons per household. non-family households (224 | 34.8%) represent the smallest median household size with 1.30 persons per household.
| Household Type | # Households | Household Size |
| Married-Couple | 301 (46.7%) | 2.69 |
| Single Male/Father | 29 (4.5%) | 2.72 |
| Single Female/Mother | 90 (14.0%) | 2.52 |
| Non-family | 224 (34.8%) | 1.30 |
| Total Households | 644 (100.0%) | 2.19 |
Household Size by Marriage Status in Broadway
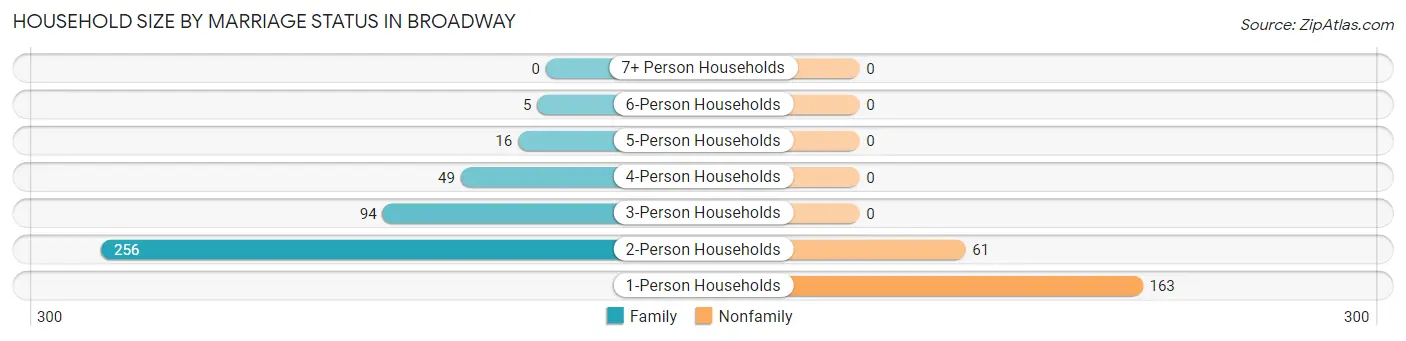
Out of a total of 644 households in Broadway, 420 (65.2%) are family households, while 224 (34.8%) are nonfamily households. The most numerous type of family households are 2-person households, comprising 256, and the most common type of nonfamily households are 1-person households, comprising 163.
| Household Size | Family Households | Nonfamily Households |
| 1-Person Households | - | 163 (25.3%) |
| 2-Person Households | 256 (39.8%) | 61 (9.5%) |
| 3-Person Households | 94 (14.6%) | 0 (0.0%) |
| 4-Person Households | 49 (7.6%) | 0 (0.0%) |
| 5-Person Households | 16 (2.5%) | 0 (0.0%) |
| 6-Person Households | 5 (0.8%) | 0 (0.0%) |
| 7+ Person Households | 0 (0.0%) | 0 (0.0%) |
| Total | 420 (65.2%) | 224 (34.8%) |
Female Fertility in Broadway
Fertility by Age in Broadway
Average fertility rate in Broadway is 87.0 births per 1,000 women. Women in the age bracket of 20 to 34 years have the highest fertility rate with 436.0 births per 1,000 women. Women in the age bracket of 20 to 34 years acount for 100.0% of all women with births.
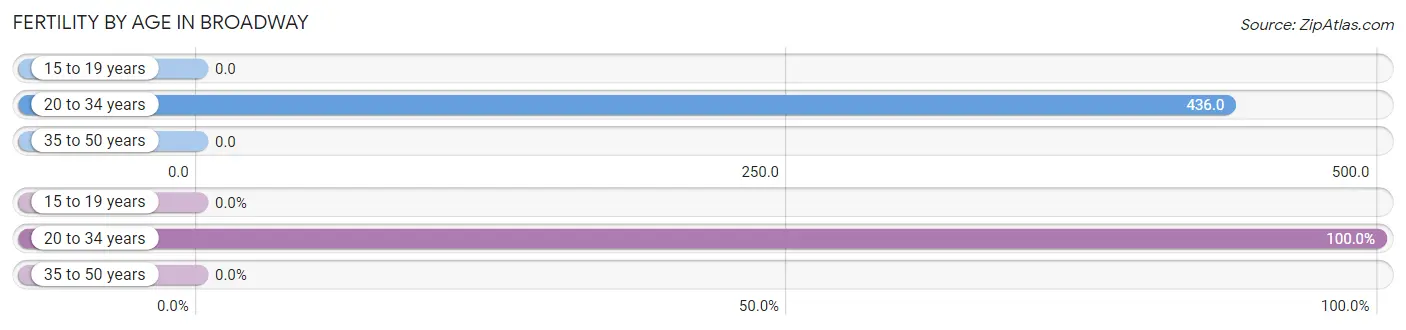
| Age Bracket | Women with Births | Births / 1,000 Women |
| 15 to 19 years | 0 (0.0%) | 0.0 |
| 20 to 34 years | 24 (100.0%) | 436.0 |
| 35 to 50 years | 0 (0.0%) | 0.0 |
| Total | 24 (100.0%) | 87.0 |
Fertility by Age by Marriage Status in Broadway
45.8% of women with births (24) in Broadway are married. The highest percentage of unmarried women with births falls into 20 to 34 years age bracket with 54.2% of them unmarried at the time of birth, while the lowest percentage of unmarried women with births belong to 20 to 34 years age bracket with 54.2% of them unmarried.
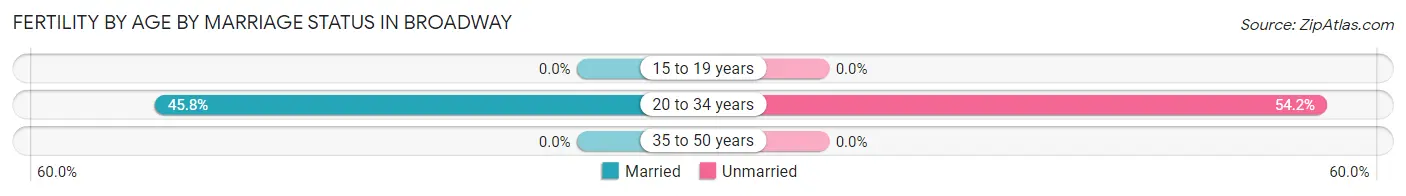
| Age Bracket | Married | Unmarried |
| 15 to 19 years | 0 (0.0%) | 0 (0.0%) |
| 20 to 34 years | 11 (45.8%) | 13 (54.2%) |
| 35 to 50 years | 0 (0.0%) | 0 (0.0%) |
| Total | 11 (45.8%) | 13 (54.2%) |
Fertility by Education in Broadway
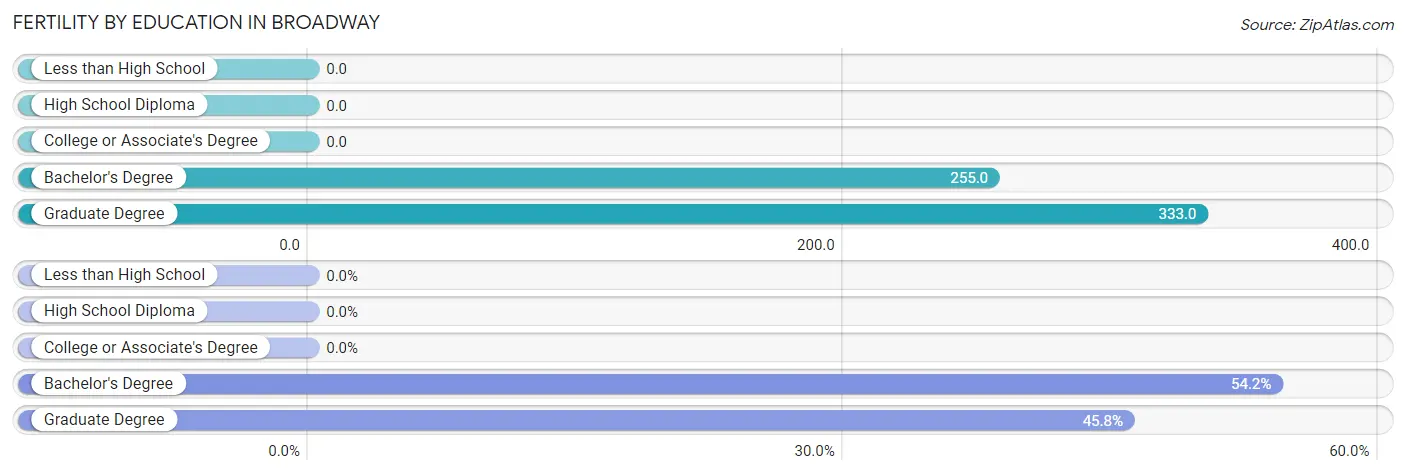
| Educational Attainment | Women with Births | Births / 1,000 Women |
| Less than High School | 0 (0.0%) | 0.0 |
| High School Diploma | 0 (0.0%) | 0.0 |
| College or Associate's Degree | 0 (0.0%) | 0.0 |
| Bachelor's Degree | 13 (54.2%) | 255.0 |
| Graduate Degree | 11 (45.8%) | 333.0 |
| Total | 24 (100.0%) | 87.0 |
Fertility by Education by Marriage Status in Broadway
54.2% of women with births in Broadway are unmarried. Women with the educational attainment of graduate degree are most likely to be married with 100.0% of them married at childbirth, while women with the educational attainment of bachelor's degree are least likely to be married with 100.0% of them unmarried at childbirth.
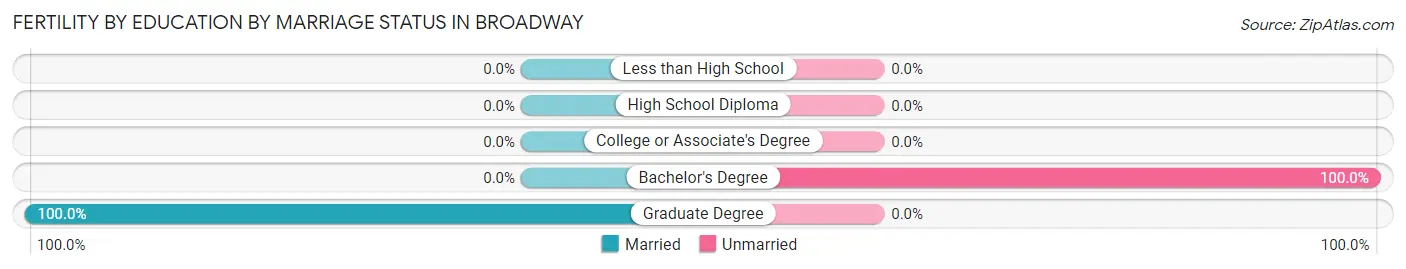
| Educational Attainment | Married | Unmarried |
| Less than High School | 0 (0.0%) | 0 (0.0%) |
| High School Diploma | 0 (0.0%) | 0 (0.0%) |
| College or Associate's Degree | 0 (0.0%) | 0 (0.0%) |
| Bachelor's Degree | 0 (0.0%) | 13 (100.0%) |
| Graduate Degree | 11 (100.0%) | 0 (0.0%) |
| Total | 11 (45.8%) | 13 (54.2%) |
Employment Characteristics in Broadway
Employment by Class of Employer in Broadway
Among the 692 employed individuals in Broadway, private company employees (413 | 59.7%), local government employees (87 | 12.6%), and state government employees (80 | 11.6%) make up the most common classes of employment.
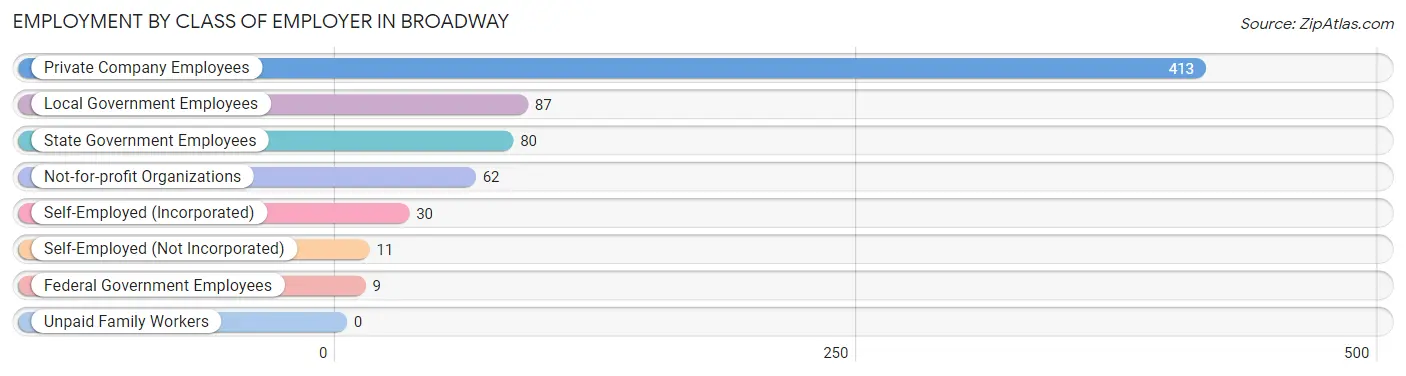
| Employer Class | # Employees | % Employees |
| Private Company Employees | 413 | 59.7% |
| Self-Employed (Incorporated) | 30 | 4.3% |
| Self-Employed (Not Incorporated) | 11 | 1.6% |
| Not-for-profit Organizations | 62 | 9.0% |
| Local Government Employees | 87 | 12.6% |
| State Government Employees | 80 | 11.6% |
| Federal Government Employees | 9 | 1.3% |
| Unpaid Family Workers | 0 | 0.0% |
| Total | 692 | 100.0% |
Employment Status by Age in Broadway
According to the labor force statistics for Broadway, out of the total population over 16 years of age (1,162), 61.6% or 716 individuals are in the labor force, with 2.9% or 21 of them unemployed. The age group with the highest labor force participation rate is 30 to 34 years, with 100.0% or 39 individuals in the labor force. Within the labor force, the 16 to 19 years age range has the highest percentage of unemployed individuals, with 12.5% or 3 of them being unemployed.
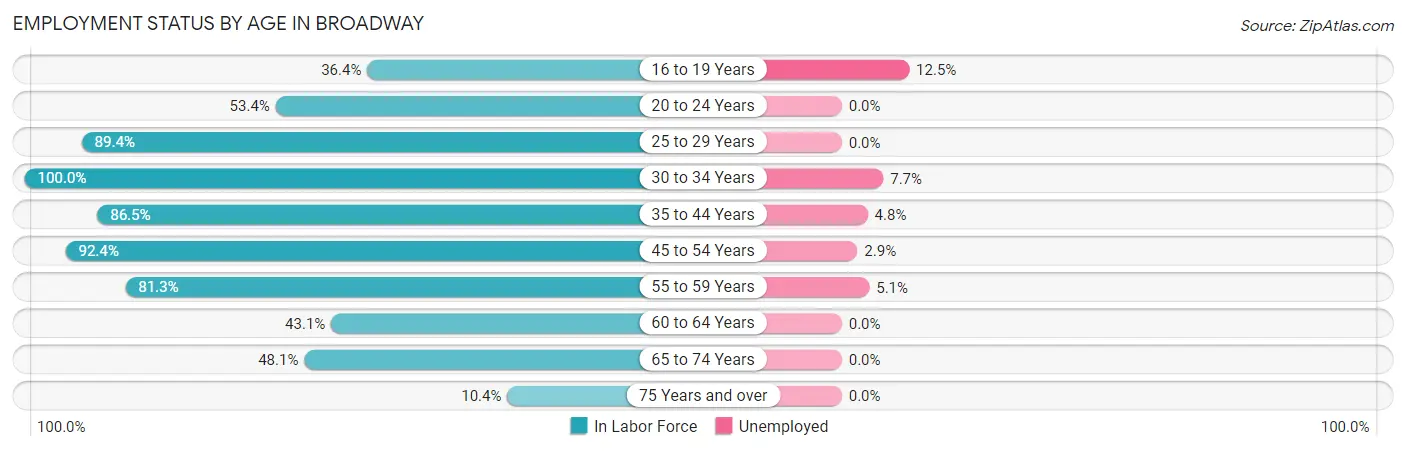
| Age Bracket | In Labor Force | Unemployed |
| 16 to 19 Years | 24 (36.4%) | 3 (12.5%) |
| 20 to 24 Years | 31 (53.4%) | 0 (0.0%) |
| 25 to 29 Years | 42 (89.4%) | 0 (0.0%) |
| 30 to 34 Years | 39 (100.0%) | 3 (7.7%) |
| 35 to 44 Years | 167 (86.5%) | 8 (4.8%) |
| 45 to 54 Years | 170 (92.4%) | 5 (2.9%) |
| 55 to 59 Years | 39 (81.3%) | 2 (5.1%) |
| 60 to 64 Years | 53 (43.1%) | 0 (0.0%) |
| 65 to 74 Years | 139 (48.1%) | 0 (0.0%) |
| 75 Years and over | 12 (10.4%) | 0 (0.0%) |
| Total | 716 (61.6%) | 21 (2.9%) |
Employment Status by Educational Attainment in Broadway
According to labor force statistics for Broadway, 80.4% of individuals (510) out of the total population between 25 and 64 years of age (634) are in the labor force, with 3.5% or 18 of them being unemployed. The group with the highest labor force participation rate are those with the educational attainment of bachelor's degree or higher, with 89.8% or 177 individuals in the labor force. Within the labor force, individuals with less than high school education have the highest percentage of unemployment, with 32.0% or 8 of them being unemployed.
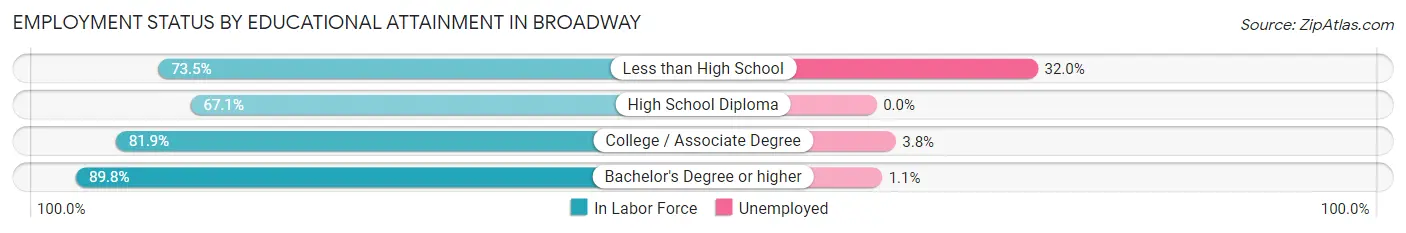
| Educational Attainment | In Labor Force | Unemployed |
| Less than High School | 25 (73.5%) | 11 (32.0%) |
| High School Diploma | 100 (67.1%) | 0 (0.0%) |
| College / Associate Degree | 208 (81.9%) | 10 (3.8%) |
| Bachelor's Degree or higher | 177 (89.8%) | 2 (1.1%) |
| Total | 510 (80.4%) | 22 (3.5%) |
Employment Occupations by Sex in Broadway
Management, Business, Science and Arts Occupations
The most common Management, Business, Science and Arts occupations in Broadway are Management (104 | 15.0%), Community & Social Service (85 | 12.2%), Education Instruction & Library (66 | 9.5%), Computers, Engineering & Science (40 | 5.8%), and Health Diagnosing & Treating (38 | 5.5%).
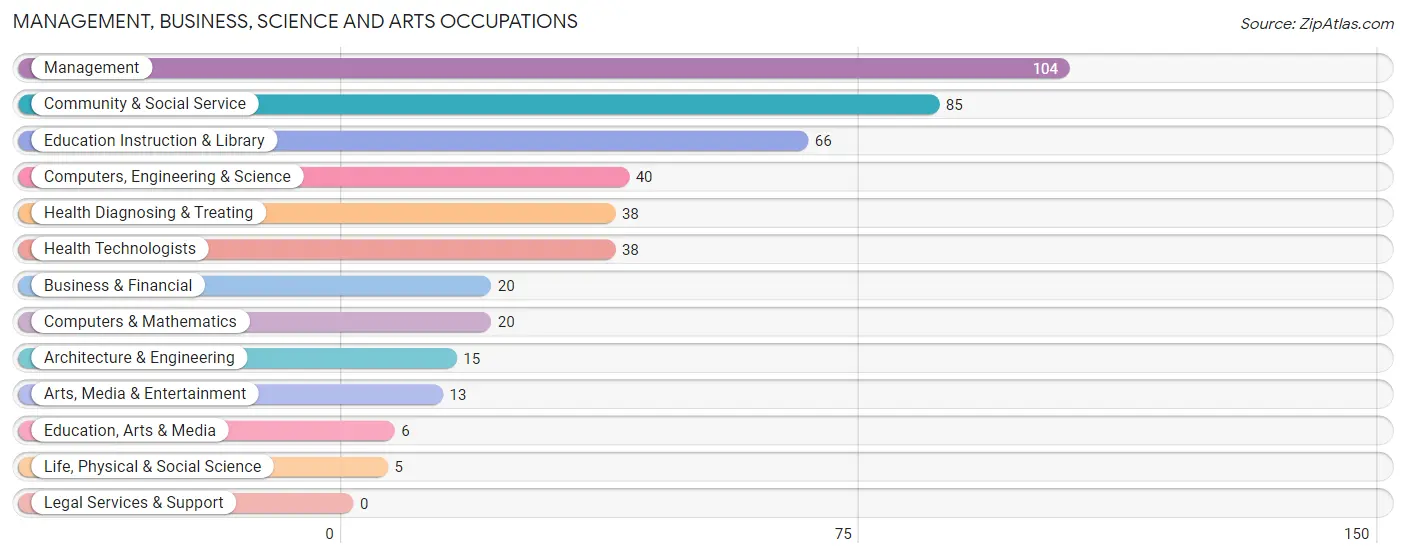
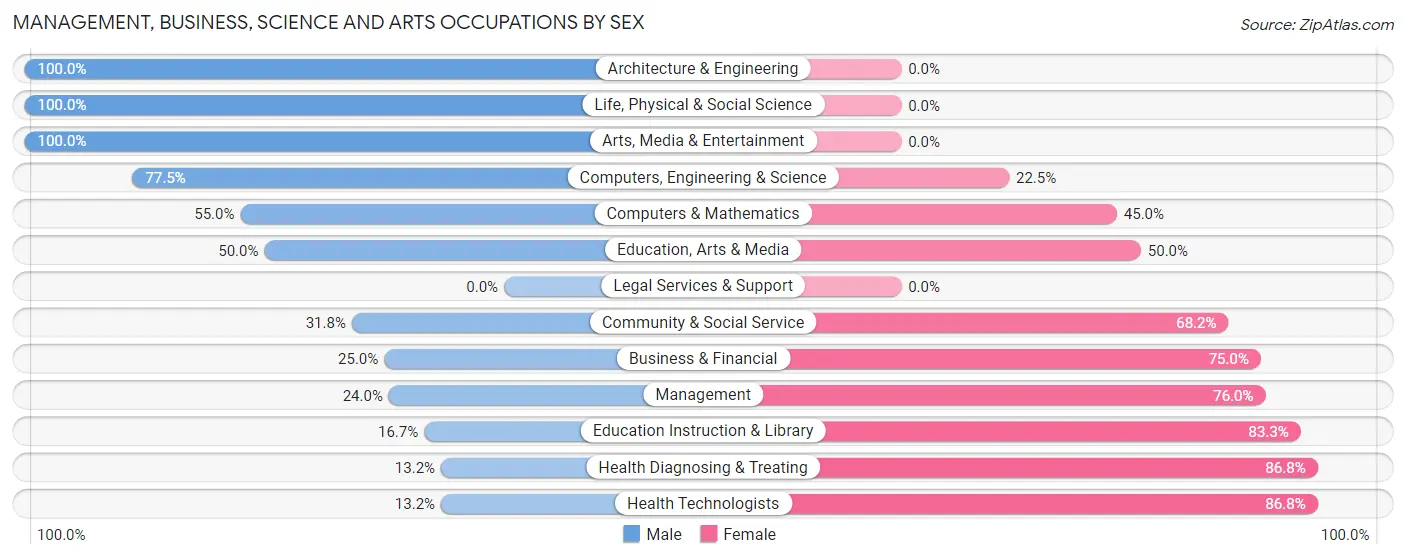
Management, Business, Science and Arts Occupations by Sex
Within the Management, Business, Science and Arts occupations in Broadway, the most male-oriented occupations are Architecture & Engineering (100.0%), Life, Physical & Social Science (100.0%), and Arts, Media & Entertainment (100.0%), while the most female-oriented occupations are Health Diagnosing & Treating (86.8%), Health Technologists (86.8%), and Education Instruction & Library (83.3%).
| Occupation | Male | Female |
| Management | 25 (24.0%) | 79 (76.0%) |
| Business & Financial | 5 (25.0%) | 15 (75.0%) |
| Computers, Engineering & Science | 31 (77.5%) | 9 (22.5%) |
| Computers & Mathematics | 11 (55.0%) | 9 (45.0%) |
| Architecture & Engineering | 15 (100.0%) | 0 (0.0%) |
| Life, Physical & Social Science | 5 (100.0%) | 0 (0.0%) |
| Community & Social Service | 27 (31.8%) | 58 (68.2%) |
| Education, Arts & Media | 3 (50.0%) | 3 (50.0%) |
| Legal Services & Support | 0 (0.0%) | 0 (0.0%) |
| Education Instruction & Library | 11 (16.7%) | 55 (83.3%) |
| Arts, Media & Entertainment | 13 (100.0%) | 0 (0.0%) |
| Health Diagnosing & Treating | 5 (13.2%) | 33 (86.8%) |
| Health Technologists | 5 (13.2%) | 33 (86.8%) |
| Total (Category) | 93 (32.4%) | 194 (67.6%) |
| Total (Overall) | 361 (51.9%) | 334 (48.1%) |
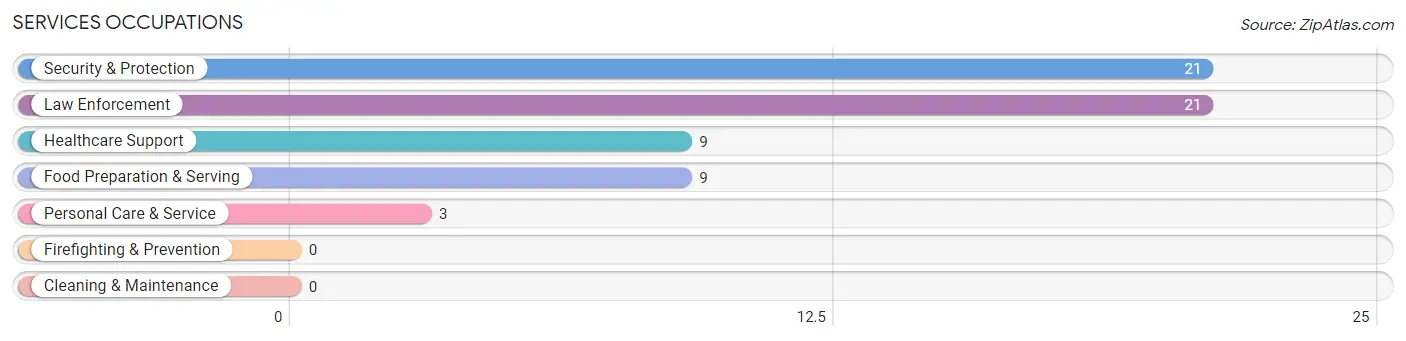
Services Occupations
The most common Services occupations in Broadway are Security & Protection (21 | 3.0%), Law Enforcement (21 | 3.0%), Healthcare Support (9 | 1.3%), Food Preparation & Serving (9 | 1.3%), and Personal Care & Service (3 | 0.4%).
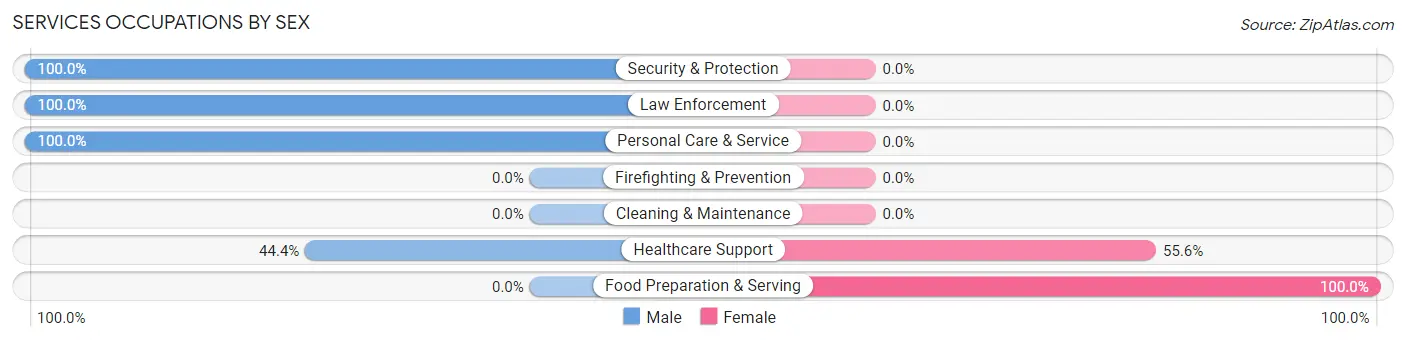
Services Occupations by Sex
Within the Services occupations in Broadway, the most male-oriented occupations are Security & Protection (100.0%), Law Enforcement (100.0%), and Personal Care & Service (100.0%), while the most female-oriented occupations are Food Preparation & Serving (100.0%), and Healthcare Support (55.6%).
| Occupation | Male | Female |
| Healthcare Support | 4 (44.4%) | 5 (55.6%) |
| Security & Protection | 21 (100.0%) | 0 (0.0%) |
| Firefighting & Prevention | 0 (0.0%) | 0 (0.0%) |
| Law Enforcement | 21 (100.0%) | 0 (0.0%) |
| Food Preparation & Serving | 0 (0.0%) | 9 (100.0%) |
| Cleaning & Maintenance | 0 (0.0%) | 0 (0.0%) |
| Personal Care & Service | 3 (100.0%) | 0 (0.0%) |
| Total (Category) | 28 (66.7%) | 14 (33.3%) |
| Total (Overall) | 361 (51.9%) | 334 (48.1%) |
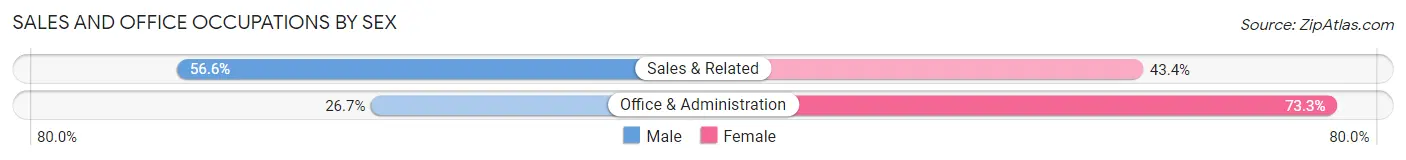
Sales and Office Occupations
The most common Sales and Office occupations in Broadway are Sales & Related (122 | 17.5%), and Office & Administration (75 | 10.8%).

Sales and Office Occupations by Sex
| Occupation | Male | Female |
| Sales & Related | 69 (56.6%) | 53 (43.4%) |
| Office & Administration | 20 (26.7%) | 55 (73.3%) |
| Total (Category) | 89 (45.2%) | 108 (54.8%) |
| Total (Overall) | 361 (51.9%) | 334 (48.1%) |
Natural Resources, Construction and Maintenance Occupations
The most common Natural Resources, Construction and Maintenance occupations in Broadway are Construction & Extraction (28 | 4.0%), Installation, Maintenance & Repair (8 | 1.1%), and Farming, Fishing & Forestry (6 | 0.9%).

Natural Resources, Construction and Maintenance Occupations by Sex

| Occupation | Male | Female |
| Farming, Fishing & Forestry | 6 (100.0%) | 0 (0.0%) |
| Construction & Extraction | 28 (100.0%) | 0 (0.0%) |
| Installation, Maintenance & Repair | 7 (87.5%) | 1 (12.5%) |
| Total (Category) | 41 (97.6%) | 1 (2.4%) |
| Total (Overall) | 361 (51.9%) | 334 (48.1%) |
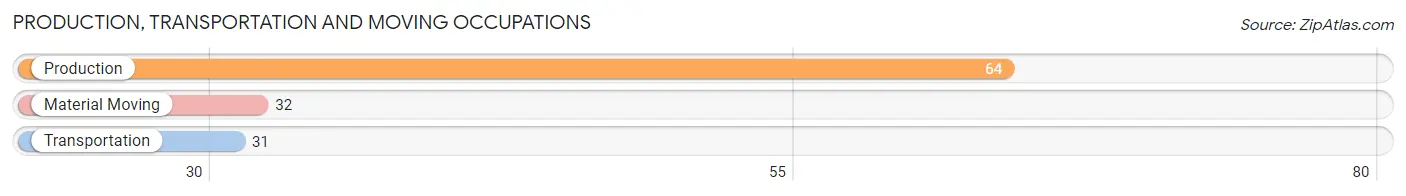
Production, Transportation and Moving Occupations
The most common Production, Transportation and Moving occupations in Broadway are Production (64 | 9.2%), Material Moving (32 | 4.6%), and Transportation (31 | 4.5%).
Production, Transportation and Moving Occupations by Sex
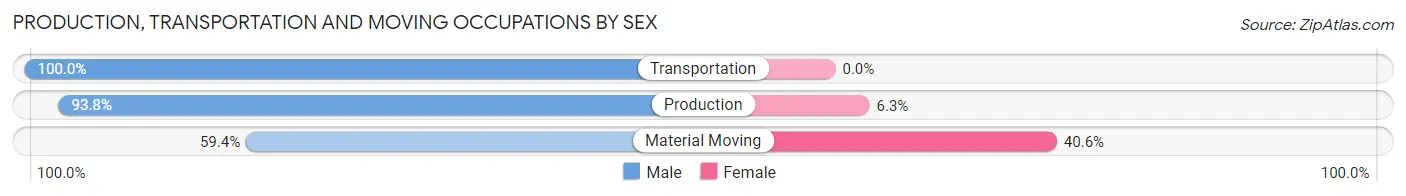
| Occupation | Male | Female |
| Production | 60 (93.8%) | 4 (6.2%) |
| Transportation | 31 (100.0%) | 0 (0.0%) |
| Material Moving | 19 (59.4%) | 13 (40.6%) |
| Total (Category) | 110 (86.6%) | 17 (13.4%) |
| Total (Overall) | 361 (51.9%) | 334 (48.1%) |
Employment Industries by Sex in Broadway
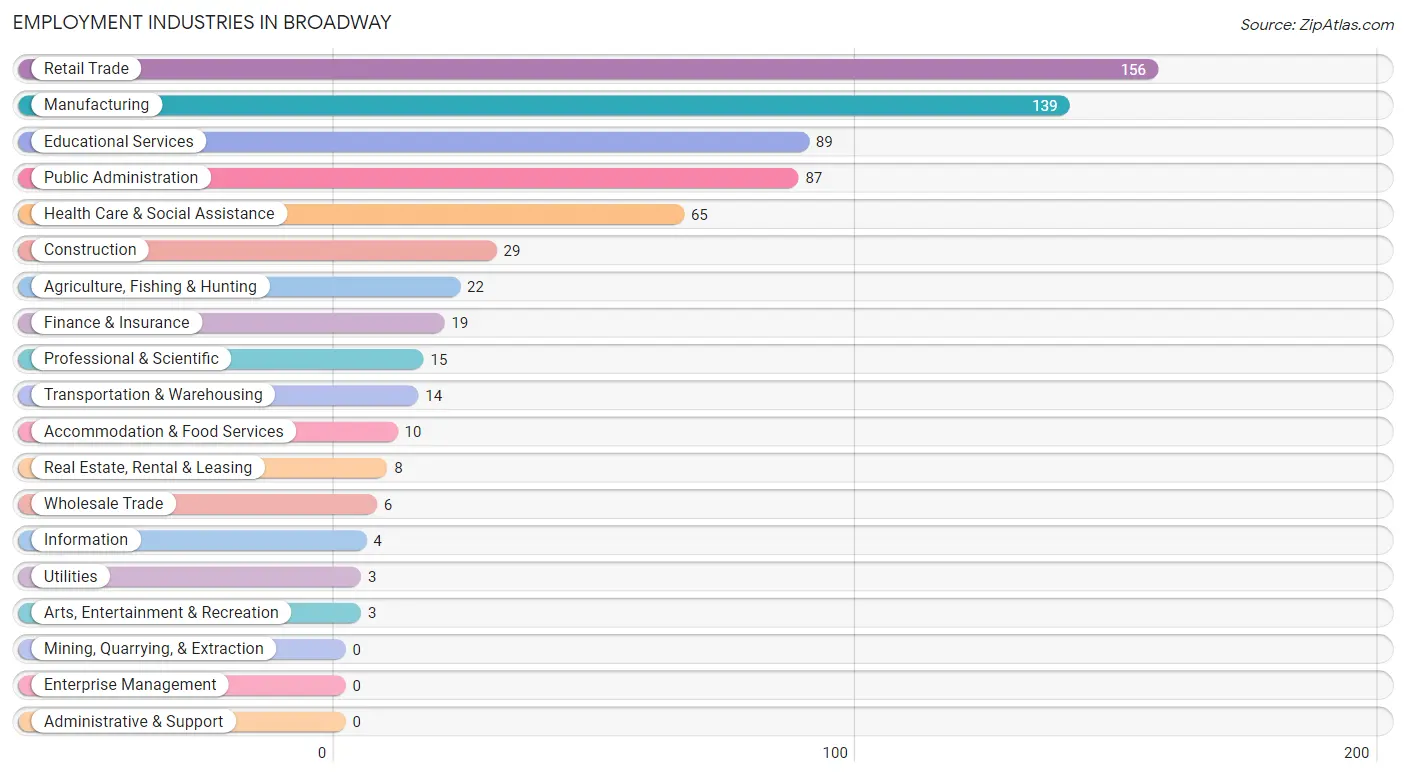
Employment Industries in Broadway
The major employment industries in Broadway include Retail Trade (156 | 22.5%), Manufacturing (139 | 20.0%), Educational Services (89 | 12.8%), Public Administration (87 | 12.5%), and Health Care & Social Assistance (65 | 9.3%).
Employment Industries by Sex in Broadway
The Broadway industries that see more men than women are Agriculture, Fishing & Hunting (100.0%), Construction (100.0%), and Utilities (100.0%), whereas the industries that tend to have a higher number of women are Wholesale Trade (100.0%), Information (100.0%), and Health Care & Social Assistance (86.2%).
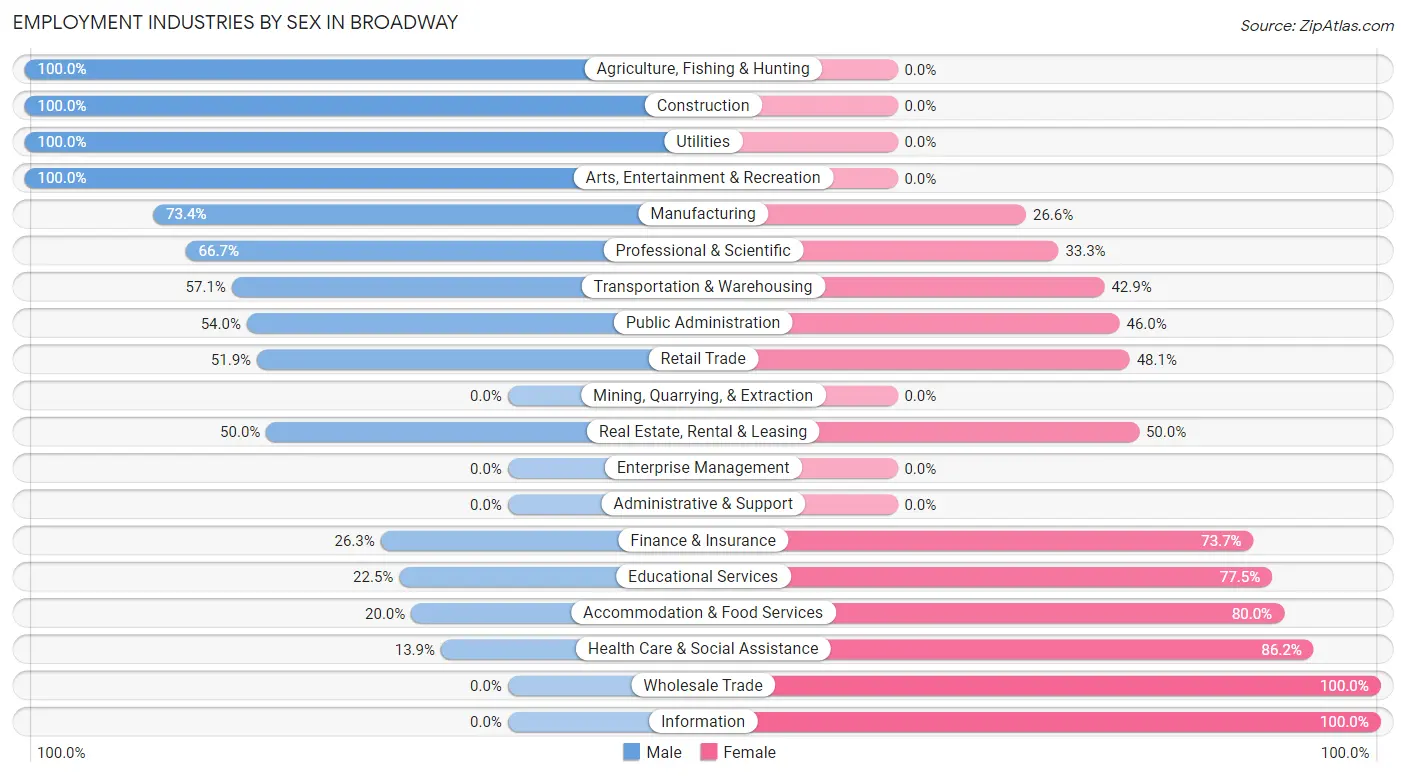
| Industry | Male | Female |
| Agriculture, Fishing & Hunting | 22 (100.0%) | 0 (0.0%) |
| Mining, Quarrying, & Extraction | 0 (0.0%) | 0 (0.0%) |
| Construction | 29 (100.0%) | 0 (0.0%) |
| Manufacturing | 102 (73.4%) | 37 (26.6%) |
| Wholesale Trade | 0 (0.0%) | 6 (100.0%) |
| Retail Trade | 81 (51.9%) | 75 (48.1%) |
| Transportation & Warehousing | 8 (57.1%) | 6 (42.9%) |
| Utilities | 3 (100.0%) | 0 (0.0%) |
| Information | 0 (0.0%) | 4 (100.0%) |
| Finance & Insurance | 5 (26.3%) | 14 (73.7%) |
| Real Estate, Rental & Leasing | 4 (50.0%) | 4 (50.0%) |
| Professional & Scientific | 10 (66.7%) | 5 (33.3%) |
| Enterprise Management | 0 (0.0%) | 0 (0.0%) |
| Administrative & Support | 0 (0.0%) | 0 (0.0%) |
| Educational Services | 20 (22.5%) | 69 (77.5%) |
| Health Care & Social Assistance | 9 (13.9%) | 56 (86.2%) |
| Arts, Entertainment & Recreation | 3 (100.0%) | 0 (0.0%) |
| Accommodation & Food Services | 2 (20.0%) | 8 (80.0%) |
| Public Administration | 47 (54.0%) | 40 (46.0%) |
| Total | 361 (51.9%) | 334 (48.1%) |
Education in Broadway
School Enrollment in Broadway
The most common levels of schooling among the 254 students in Broadway are elementary school (94 | 37.0%), middle school (70 | 27.6%), and high school (55 | 21.6%).
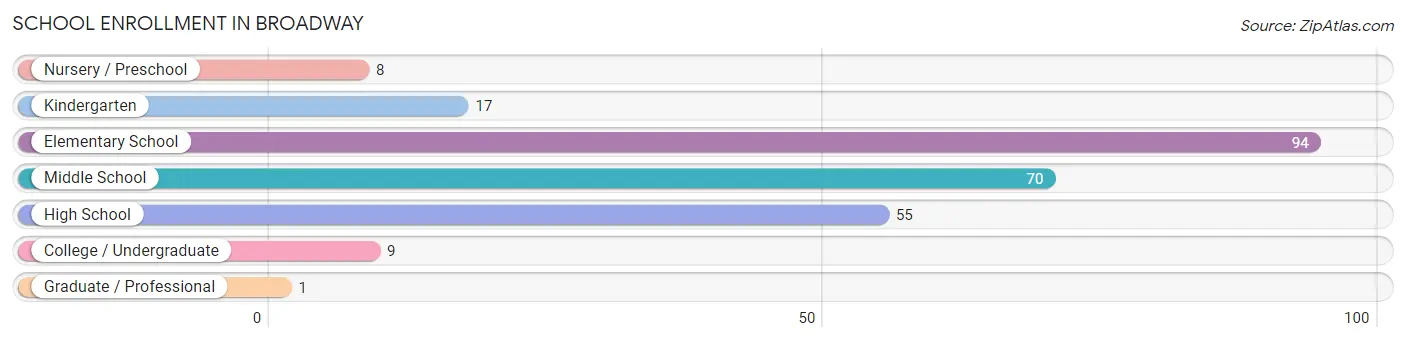
| School Level | # Students | % Students |
| Nursery / Preschool | 8 | 3.2% |
| Kindergarten | 17 | 6.7% |
| Elementary School | 94 | 37.0% |
| Middle School | 70 | 27.6% |
| High School | 55 | 21.6% |
| College / Undergraduate | 9 | 3.5% |
| Graduate / Professional | 1 | 0.4% |
| Total | 254 | 100.0% |
School Enrollment by Age by Funding Source in Broadway
Out of a total of 254 students who are enrolled in schools in Broadway, 30 (11.8%) attend a private institution, while the remaining 224 (88.2%) are enrolled in public schools. The age group of 20 to 24 year olds has the highest likelihood of being enrolled in private schools, with 5 (100.0% in the age bracket) enrolled. Conversely, the age group of 3 to 4 year olds has the lowest likelihood of being enrolled in a private school, with 8 (100.0% in the age bracket) attending a public institution.
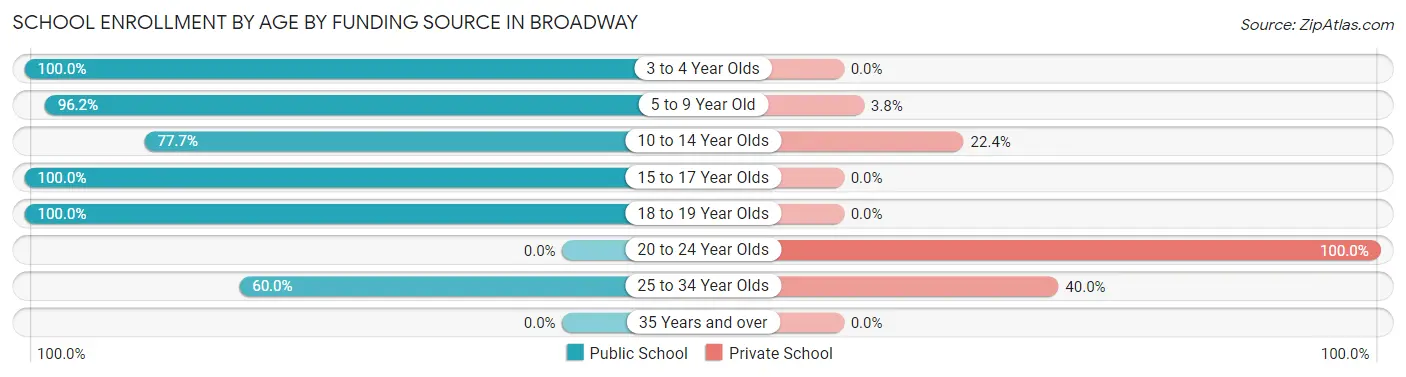
| Age Bracket | Public School | Private School |
| 3 to 4 Year Olds | 8 (100.0%) | 0 (0.0%) |
| 5 to 9 Year Old | 102 (96.2%) | 4 (3.8%) |
| 10 to 14 Year Olds | 66 (77.6%) | 19 (22.4%) |
| 15 to 17 Year Olds | 41 (100.0%) | 0 (0.0%) |
| 18 to 19 Year Olds | 4 (100.0%) | 0 (0.0%) |
| 20 to 24 Year Olds | 0 (0.0%) | 5 (100.0%) |
| 25 to 34 Year Olds | 3 (60.0%) | 2 (40.0%) |
| 35 Years and over | 0 (0.0%) | 0 (0.0%) |
| Total | 224 (88.2%) | 30 (11.8%) |
Educational Attainment by Field of Study in Broadway
Education (77 | 25.5%), engineering (55 | 18.2%), business (40 | 13.3%), arts & humanities (29 | 9.6%), and science & technology (23 | 7.6%) are the most common fields of study among 302 individuals in Broadway who have obtained a bachelor's degree or higher.
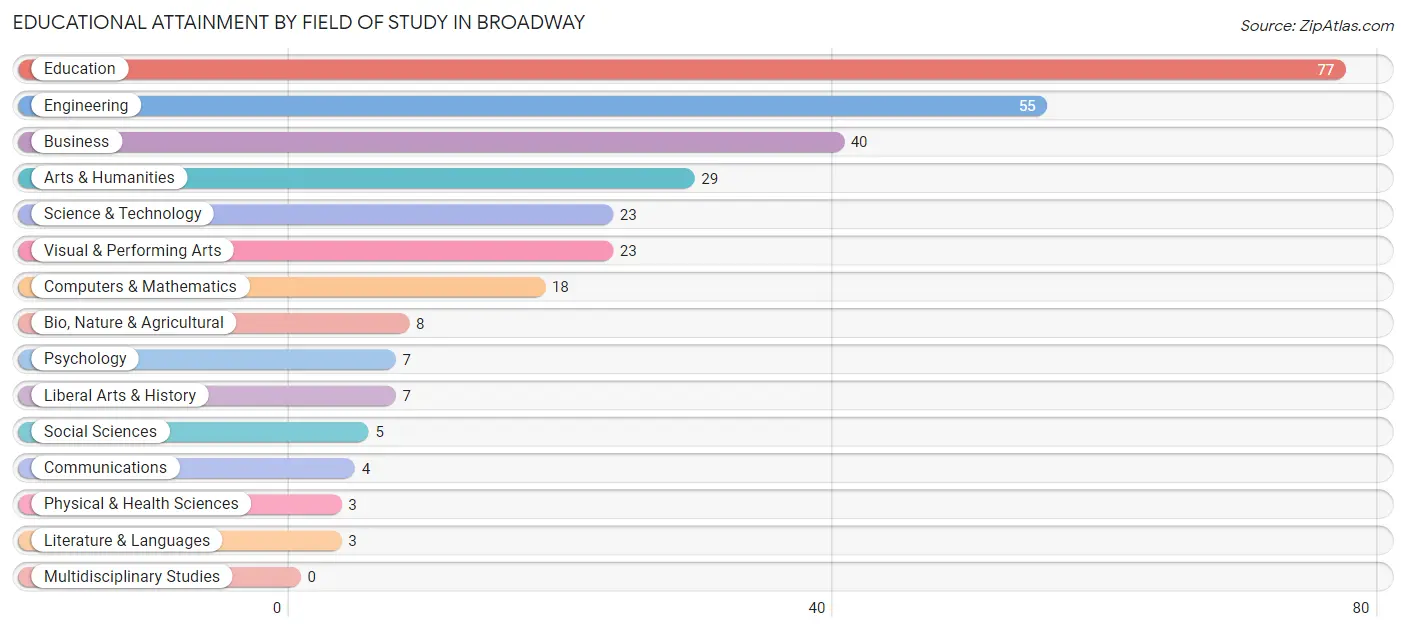
| Field of Study | # Graduates | % Graduates |
| Computers & Mathematics | 18 | 6.0% |
| Bio, Nature & Agricultural | 8 | 2.6% |
| Physical & Health Sciences | 3 | 1.0% |
| Psychology | 7 | 2.3% |
| Social Sciences | 5 | 1.7% |
| Engineering | 55 | 18.2% |
| Multidisciplinary Studies | 0 | 0.0% |
| Science & Technology | 23 | 7.6% |
| Business | 40 | 13.3% |
| Education | 77 | 25.5% |
| Literature & Languages | 3 | 1.0% |
| Liberal Arts & History | 7 | 2.3% |
| Visual & Performing Arts | 23 | 7.6% |
| Communications | 4 | 1.3% |
| Arts & Humanities | 29 | 9.6% |
| Total | 302 | 100.0% |
Transportation & Commute in Broadway
Vehicle Availability by Sex in Broadway
The most prevalent vehicle ownership categories in Broadway are males with 2 vehicles (117, accounting for 33.2%) and females with 2 vehicles (109, making up 35.0%).
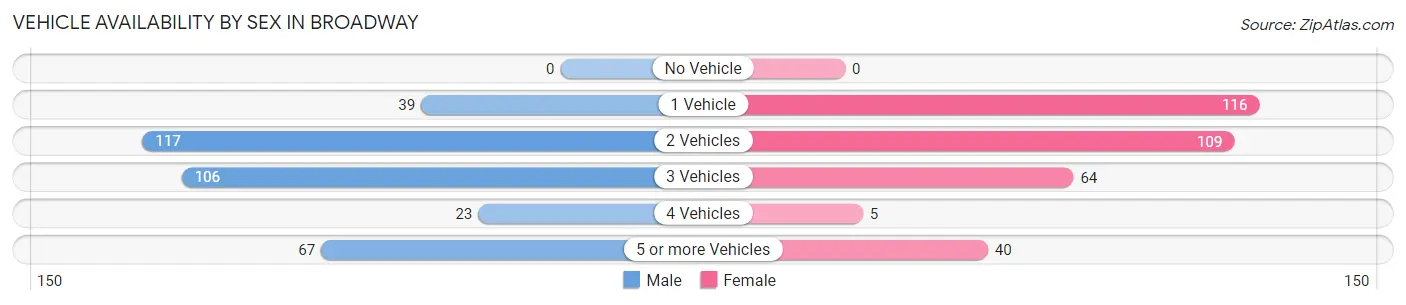
| Vehicles Available | Male | Female |
| No Vehicle | 0 (0.0%) | 0 (0.0%) |
| 1 Vehicle | 39 (11.1%) | 116 (34.7%) |
| 2 Vehicles | 117 (33.2%) | 109 (32.6%) |
| 3 Vehicles | 106 (30.1%) | 64 (19.2%) |
| 4 Vehicles | 23 (6.5%) | 5 (1.5%) |
| 5 or more Vehicles | 67 (19.0%) | 40 (12.0%) |
| Total | 352 (100.0%) | 334 (100.0%) |
Commute Time in Broadway
The most frequently occuring commute durations in Broadway are 20 to 24 minutes (175 commuters, 25.9%), 30 to 34 minutes (102 commuters, 15.1%), and 15 to 19 minutes (84 commuters, 12.4%).
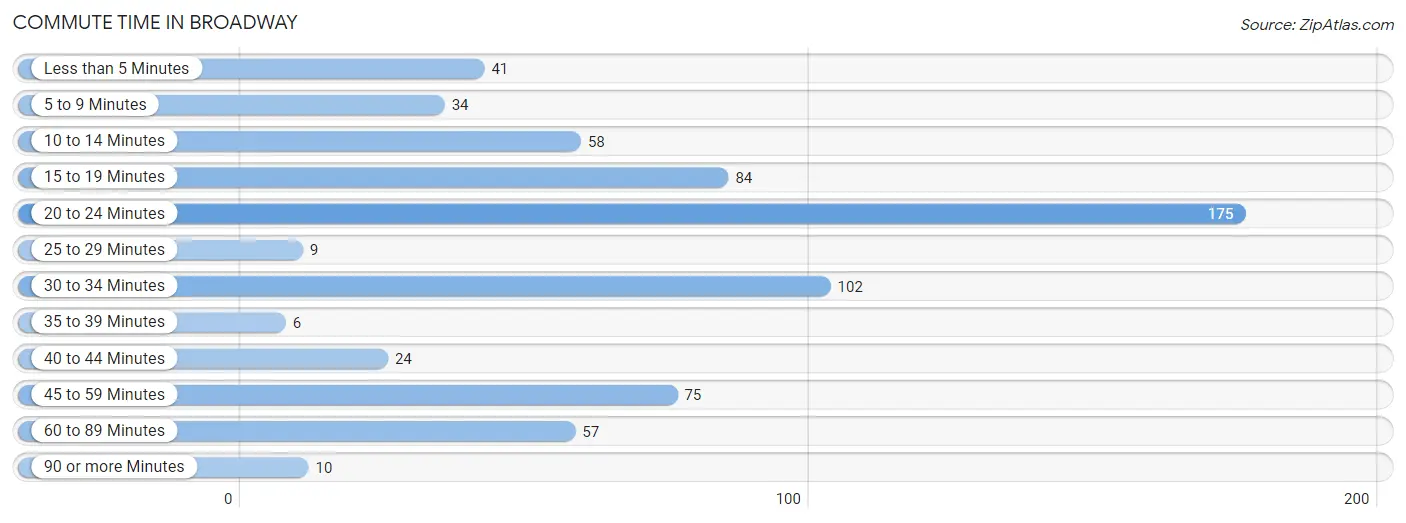
| Commute Time | # Commuters | % Commuters |
| Less than 5 Minutes | 41 | 6.1% |
| 5 to 9 Minutes | 34 | 5.0% |
| 10 to 14 Minutes | 58 | 8.6% |
| 15 to 19 Minutes | 84 | 12.4% |
| 20 to 24 Minutes | 175 | 25.9% |
| 25 to 29 Minutes | 9 | 1.3% |
| 30 to 34 Minutes | 102 | 15.1% |
| 35 to 39 Minutes | 6 | 0.9% |
| 40 to 44 Minutes | 24 | 3.6% |
| 45 to 59 Minutes | 75 | 11.1% |
| 60 to 89 Minutes | 57 | 8.4% |
| 90 or more Minutes | 10 | 1.5% |
Commute Time by Sex in Broadway
The most common commute times in Broadway are 20 to 24 minutes (74 commuters, 21.1%) for males and 20 to 24 minutes (101 commuters, 31.2%) for females.
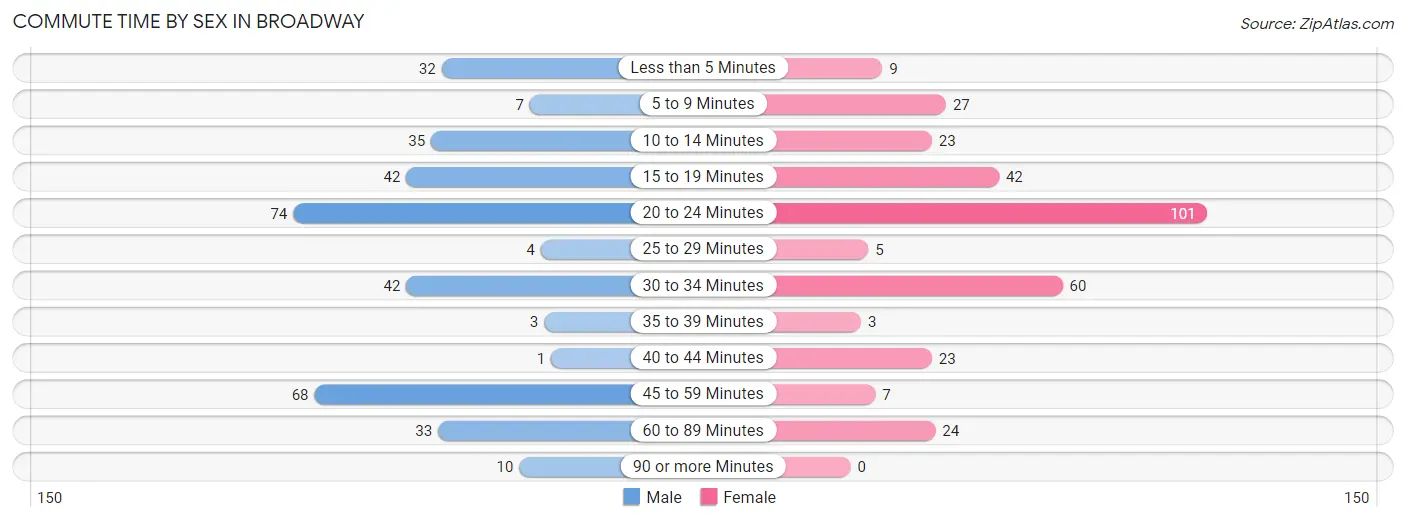
| Commute Time | Male | Female |
| Less than 5 Minutes | 32 (9.1%) | 9 (2.8%) |
| 5 to 9 Minutes | 7 (2.0%) | 27 (8.3%) |
| 10 to 14 Minutes | 35 (10.0%) | 23 (7.1%) |
| 15 to 19 Minutes | 42 (12.0%) | 42 (13.0%) |
| 20 to 24 Minutes | 74 (21.1%) | 101 (31.2%) |
| 25 to 29 Minutes | 4 (1.1%) | 5 (1.5%) |
| 30 to 34 Minutes | 42 (12.0%) | 60 (18.5%) |
| 35 to 39 Minutes | 3 (0.9%) | 3 (0.9%) |
| 40 to 44 Minutes | 1 (0.3%) | 23 (7.1%) |
| 45 to 59 Minutes | 68 (19.4%) | 7 (2.2%) |
| 60 to 89 Minutes | 33 (9.4%) | 24 (7.4%) |
| 90 or more Minutes | 10 (2.9%) | 0 (0.0%) |
Time of Departure to Work by Sex in Broadway
The most frequent times of departure to work in Broadway are 6:30 AM to 6:59 AM (120, 34.2%) for males and 7:30 AM to 7:59 AM (124, 38.3%) for females.
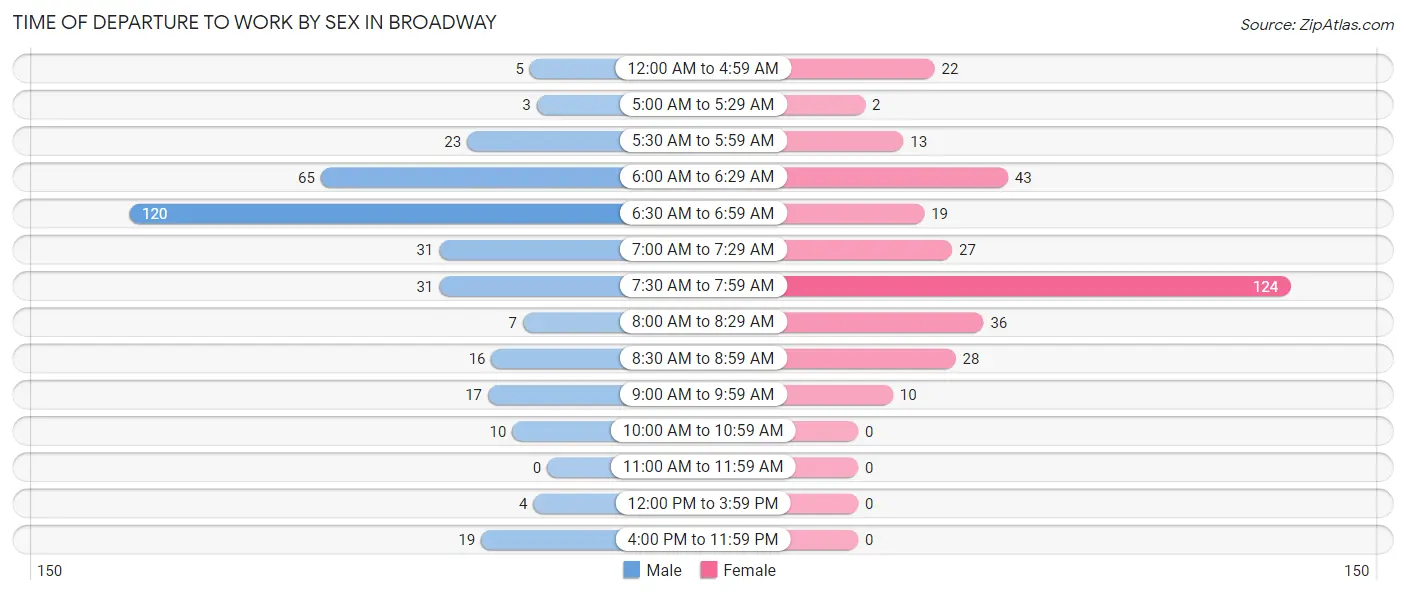
| Time of Departure | Male | Female |
| 12:00 AM to 4:59 AM | 5 (1.4%) | 22 (6.8%) |
| 5:00 AM to 5:29 AM | 3 (0.9%) | 2 (0.6%) |
| 5:30 AM to 5:59 AM | 23 (6.6%) | 13 (4.0%) |
| 6:00 AM to 6:29 AM | 65 (18.5%) | 43 (13.3%) |
| 6:30 AM to 6:59 AM | 120 (34.2%) | 19 (5.9%) |
| 7:00 AM to 7:29 AM | 31 (8.8%) | 27 (8.3%) |
| 7:30 AM to 7:59 AM | 31 (8.8%) | 124 (38.3%) |
| 8:00 AM to 8:29 AM | 7 (2.0%) | 36 (11.1%) |
| 8:30 AM to 8:59 AM | 16 (4.6%) | 28 (8.6%) |
| 9:00 AM to 9:59 AM | 17 (4.8%) | 10 (3.1%) |
| 10:00 AM to 10:59 AM | 10 (2.9%) | 0 (0.0%) |
| 11:00 AM to 11:59 AM | 0 (0.0%) | 0 (0.0%) |
| 12:00 PM to 3:59 PM | 4 (1.1%) | 0 (0.0%) |
| 4:00 PM to 11:59 PM | 19 (5.4%) | 0 (0.0%) |
| Total | 351 (100.0%) | 324 (100.0%) |
Housing Occupancy in Broadway
Occupancy by Ownership in Broadway
Of the total 644 dwellings in Broadway, owner-occupied units account for 532 (82.6%), while renter-occupied units make up 112 (17.4%).
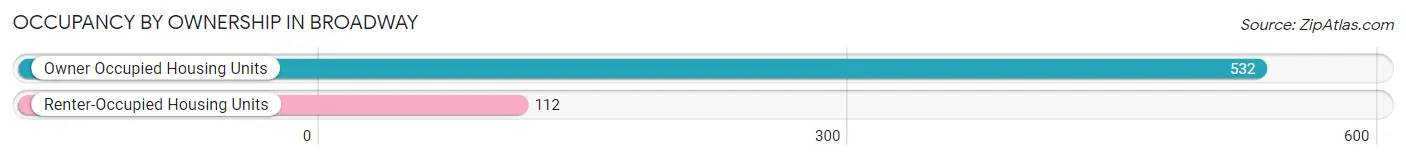
| Occupancy | # Housing Units | % Housing Units |
| Owner Occupied Housing Units | 532 | 82.6% |
| Renter-Occupied Housing Units | 112 | 17.4% |
| Total Occupied Housing Units | 644 | 100.0% |
Occupancy by Household Size in Broadway
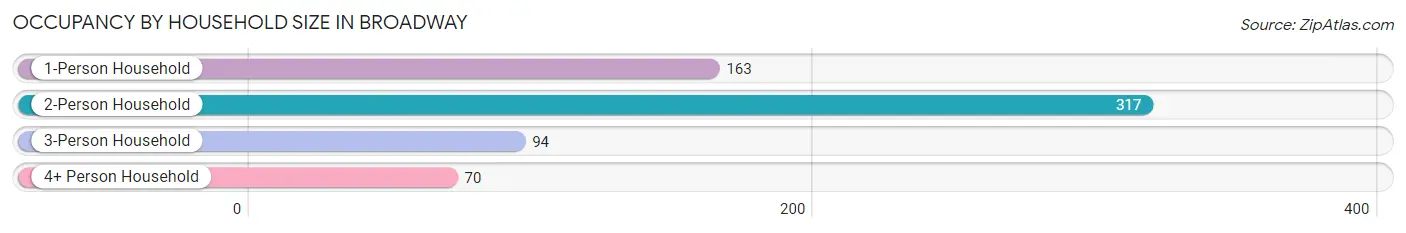
| Household Size | # Housing Units | % Housing Units |
| 1-Person Household | 163 | 25.3% |
| 2-Person Household | 317 | 49.2% |
| 3-Person Household | 94 | 14.6% |
| 4+ Person Household | 70 | 10.9% |
| Total Housing Units | 644 | 100.0% |
Occupancy by Ownership by Household Size in Broadway
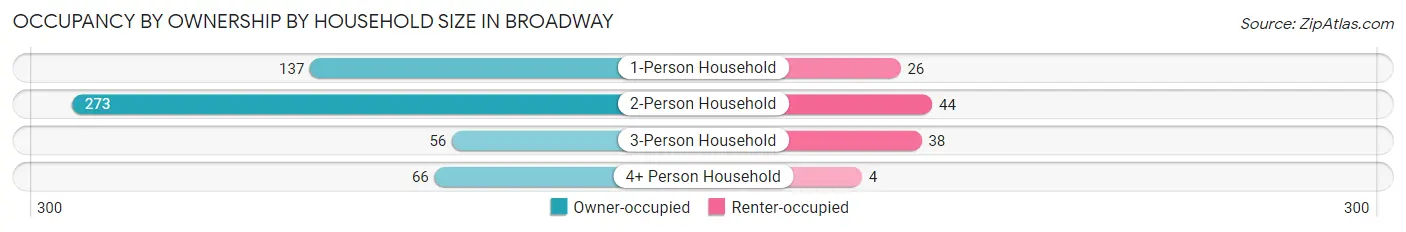
| Household Size | Owner-occupied | Renter-occupied |
| 1-Person Household | 137 (84.1%) | 26 (16.0%) |
| 2-Person Household | 273 (86.1%) | 44 (13.9%) |
| 3-Person Household | 56 (59.6%) | 38 (40.4%) |
| 4+ Person Household | 66 (94.3%) | 4 (5.7%) |
| Total Housing Units | 532 (82.6%) | 112 (17.4%) |
Occupancy by Educational Attainment in Broadway
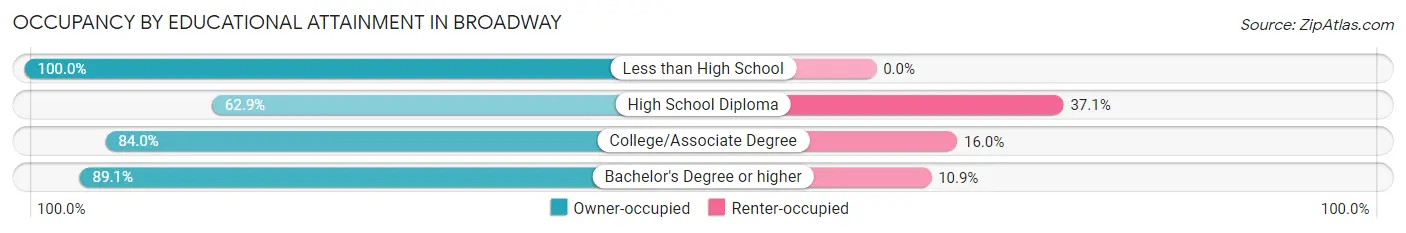
| Household Size | Owner-occupied | Renter-occupied |
| Less than High School | 77 (100.0%) | 0 (0.0%) |
| High School Diploma | 88 (62.9%) | 52 (37.1%) |
| College/Associate Degree | 220 (84.0%) | 42 (16.0%) |
| Bachelor's Degree or higher | 147 (89.1%) | 18 (10.9%) |
Occupancy by Age of Householder in Broadway
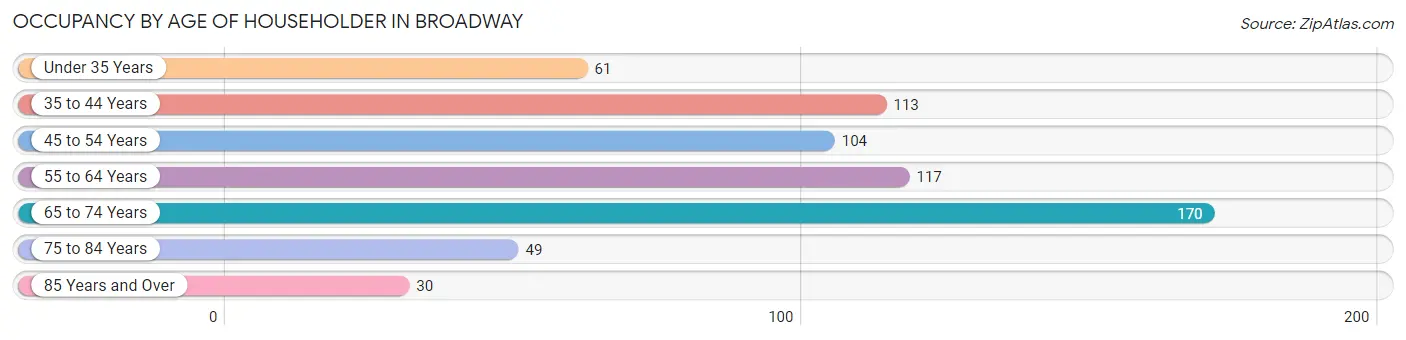
| Age Bracket | # Households | % Households |
| Under 35 Years | 61 | 9.5% |
| 35 to 44 Years | 113 | 17.5% |
| 45 to 54 Years | 104 | 16.2% |
| 55 to 64 Years | 117 | 18.2% |
| 65 to 74 Years | 170 | 26.4% |
| 75 to 84 Years | 49 | 7.6% |
| 85 Years and Over | 30 | 4.7% |
| Total | 644 | 100.0% |
Housing Finances in Broadway
Median Income by Occupancy in Broadway
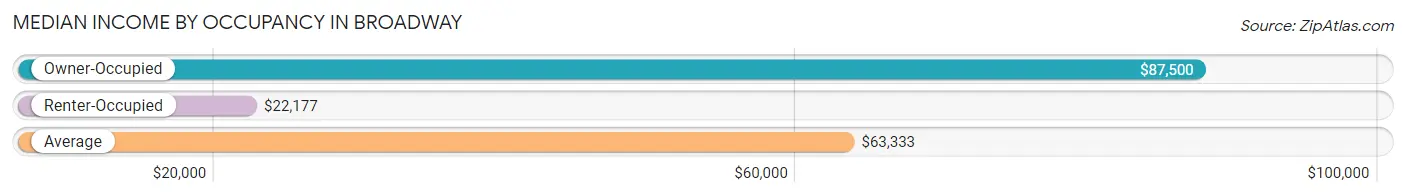
| Occupancy Type | # Households | Median Income |
| Owner-Occupied | 532 (82.6%) | $87,500 |
| Renter-Occupied | 112 (17.4%) | $22,177 |
| Average | 644 (100.0%) | $63,333 |
Occupancy by Householder Income Bracket in Broadway
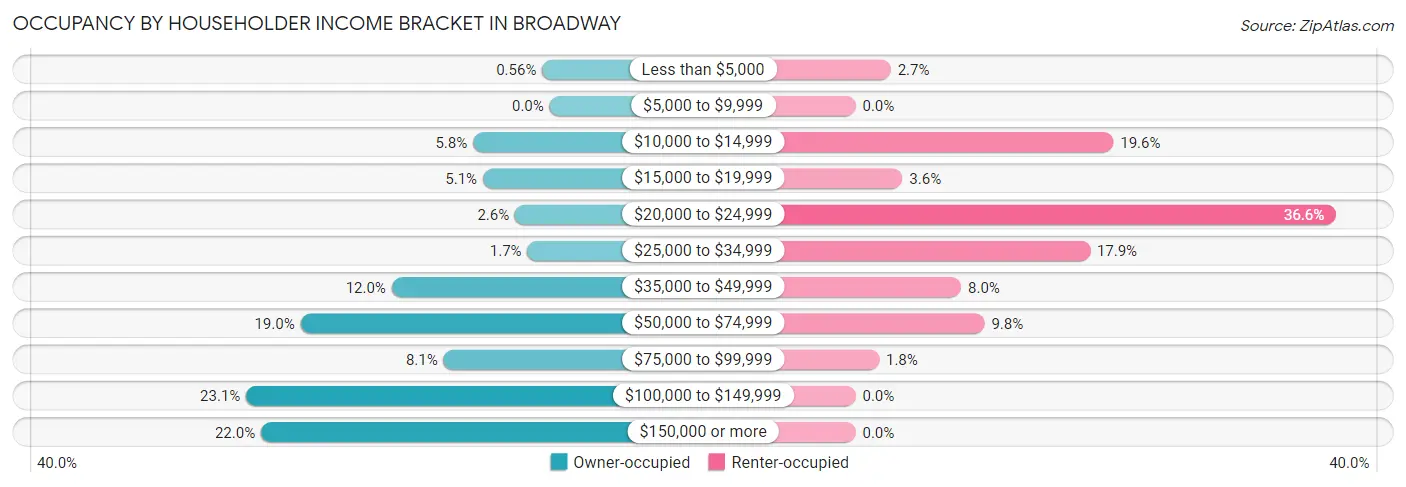
| Income Bracket | Owner-occupied | Renter-occupied |
| Less than $5,000 | 3 (0.6%) | 3 (2.7%) |
| $5,000 to $9,999 | 0 (0.0%) | 0 (0.0%) |
| $10,000 to $14,999 | 31 (5.8%) | 22 (19.6%) |
| $15,000 to $19,999 | 27 (5.1%) | 4 (3.6%) |
| $20,000 to $24,999 | 14 (2.6%) | 41 (36.6%) |
| $25,000 to $34,999 | 9 (1.7%) | 20 (17.9%) |
| $35,000 to $49,999 | 64 (12.0%) | 9 (8.0%) |
| $50,000 to $74,999 | 101 (19.0%) | 11 (9.8%) |
| $75,000 to $99,999 | 43 (8.1%) | 2 (1.8%) |
| $100,000 to $149,999 | 123 (23.1%) | 0 (0.0%) |
| $150,000 or more | 117 (22.0%) | 0 (0.0%) |
| Total | 532 (100.0%) | 112 (100.0%) |
Monthly Housing Cost Tiers in Broadway
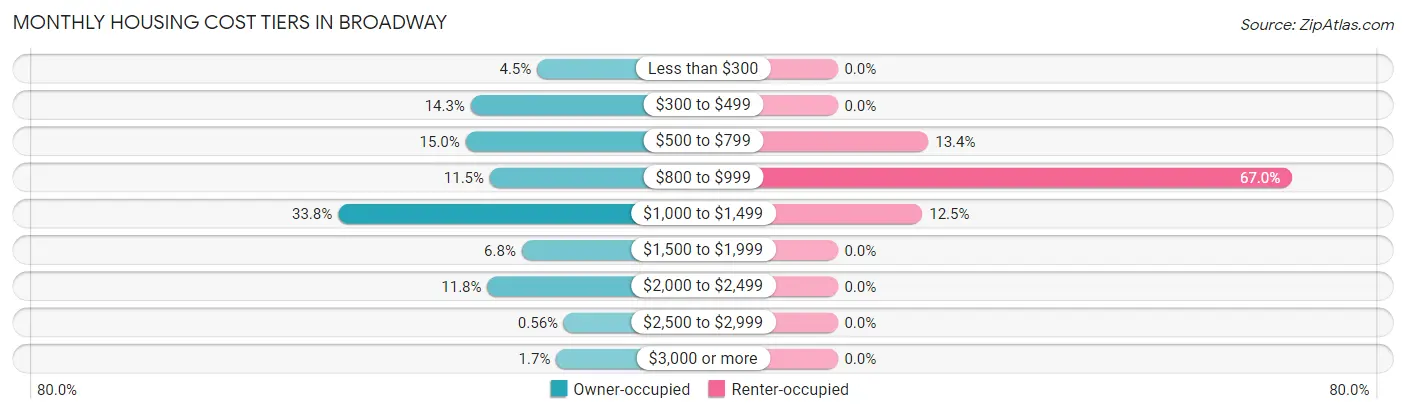
| Monthly Cost | Owner-occupied | Renter-occupied |
| Less than $300 | 24 (4.5%) | 0 (0.0%) |
| $300 to $499 | 76 (14.3%) | 0 (0.0%) |
| $500 to $799 | 80 (15.0%) | 15 (13.4%) |
| $800 to $999 | 61 (11.5%) | 75 (67.0%) |
| $1,000 to $1,499 | 180 (33.8%) | 14 (12.5%) |
| $1,500 to $1,999 | 36 (6.8%) | 0 (0.0%) |
| $2,000 to $2,499 | 63 (11.8%) | 0 (0.0%) |
| $2,500 to $2,999 | 3 (0.6%) | 0 (0.0%) |
| $3,000 or more | 9 (1.7%) | 0 (0.0%) |
| Total | 532 (100.0%) | 112 (100.0%) |
Physical Housing Characteristics in Broadway
Housing Structures in Broadway
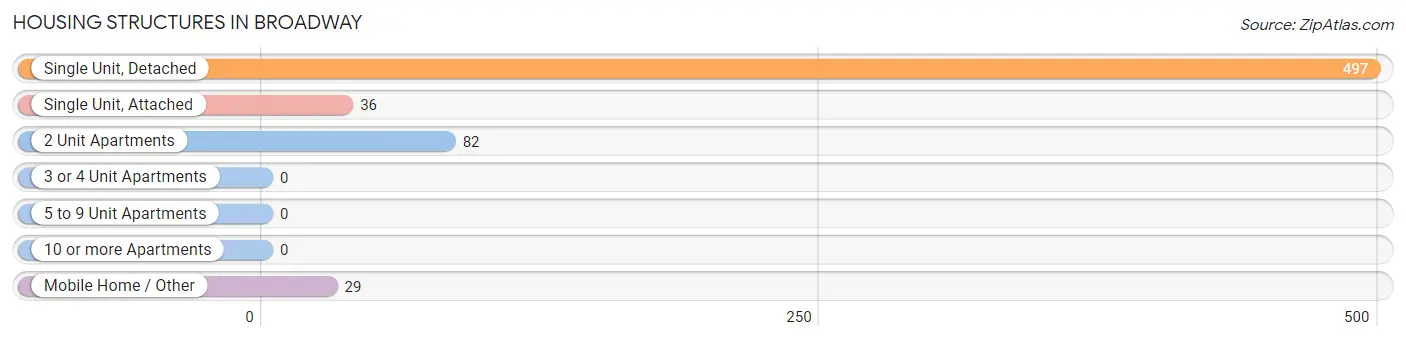
| Structure Type | # Housing Units | % Housing Units |
| Single Unit, Detached | 497 | 77.2% |
| Single Unit, Attached | 36 | 5.6% |
| 2 Unit Apartments | 82 | 12.7% |
| 3 or 4 Unit Apartments | 0 | 0.0% |
| 5 to 9 Unit Apartments | 0 | 0.0% |
| 10 or more Apartments | 0 | 0.0% |
| Mobile Home / Other | 29 | 4.5% |
| Total | 644 | 100.0% |
Housing Structures by Occupancy in Broadway
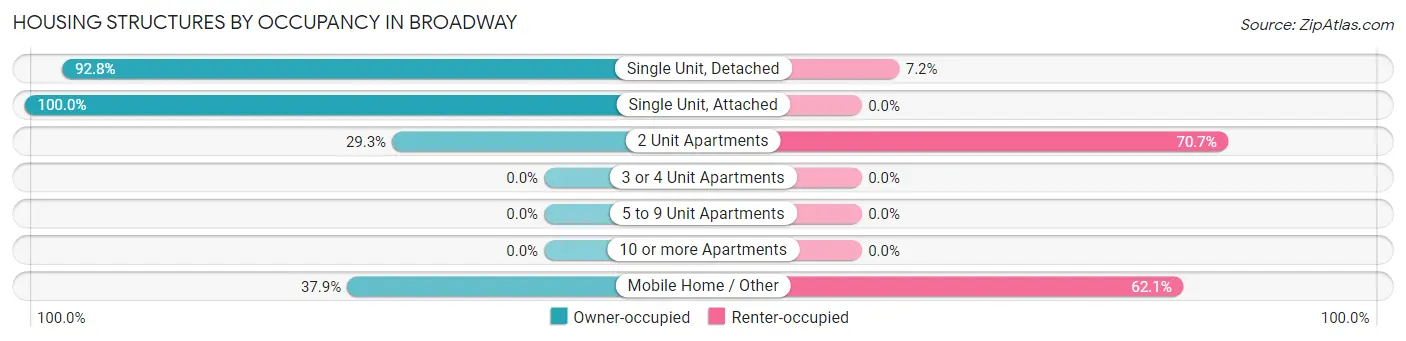
| Structure Type | Owner-occupied | Renter-occupied |
| Single Unit, Detached | 461 (92.8%) | 36 (7.2%) |
| Single Unit, Attached | 36 (100.0%) | 0 (0.0%) |
| 2 Unit Apartments | 24 (29.3%) | 58 (70.7%) |
| 3 or 4 Unit Apartments | 0 (0.0%) | 0 (0.0%) |
| 5 to 9 Unit Apartments | 0 (0.0%) | 0 (0.0%) |
| 10 or more Apartments | 0 (0.0%) | 0 (0.0%) |
| Mobile Home / Other | 11 (37.9%) | 18 (62.1%) |
| Total | 532 (82.6%) | 112 (17.4%) |
Housing Structures by Number of Rooms in Broadway
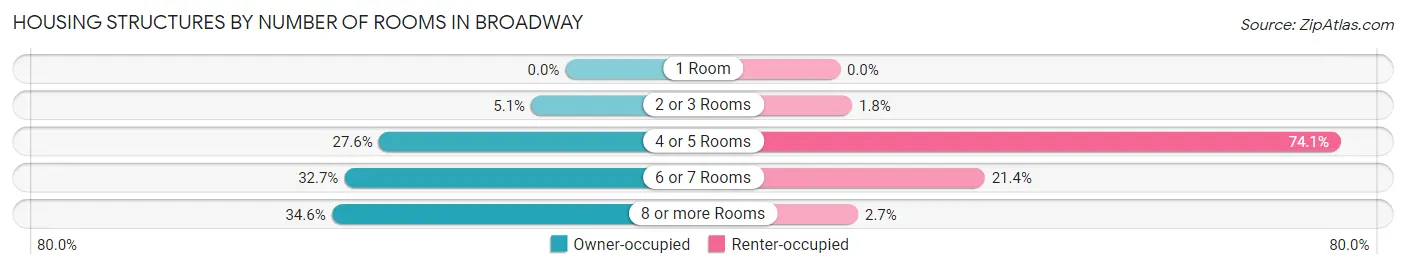
| Number of Rooms | Owner-occupied | Renter-occupied |
| 1 Room | 0 (0.0%) | 0 (0.0%) |
| 2 or 3 Rooms | 27 (5.1%) | 2 (1.8%) |
| 4 or 5 Rooms | 147 (27.6%) | 83 (74.1%) |
| 6 or 7 Rooms | 174 (32.7%) | 24 (21.4%) |
| 8 or more Rooms | 184 (34.6%) | 3 (2.7%) |
| Total | 532 (100.0%) | 112 (100.0%) |
Housing Structure by Heating Type in Broadway
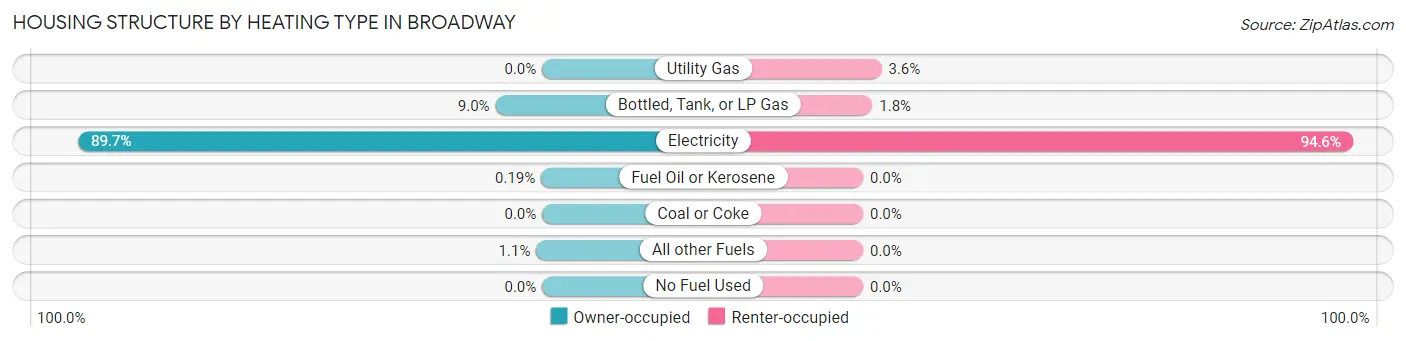
| Heating Type | Owner-occupied | Renter-occupied |
| Utility Gas | 0 (0.0%) | 4 (3.6%) |
| Bottled, Tank, or LP Gas | 48 (9.0%) | 2 (1.8%) |
| Electricity | 477 (89.7%) | 106 (94.6%) |
| Fuel Oil or Kerosene | 1 (0.2%) | 0 (0.0%) |
| Coal or Coke | 0 (0.0%) | 0 (0.0%) |
| All other Fuels | 6 (1.1%) | 0 (0.0%) |
| No Fuel Used | 0 (0.0%) | 0 (0.0%) |
| Total | 532 (100.0%) | 112 (100.0%) |
Household Vehicle Usage in Broadway
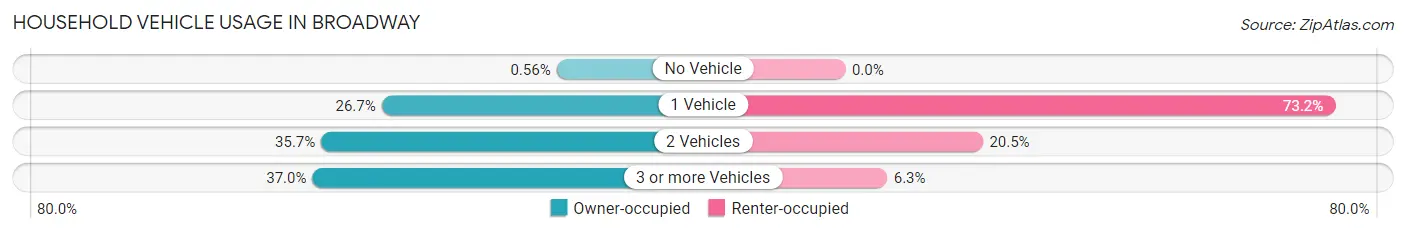
| Vehicles per Household | Owner-occupied | Renter-occupied |
| No Vehicle | 3 (0.6%) | 0 (0.0%) |
| 1 Vehicle | 142 (26.7%) | 82 (73.2%) |
| 2 Vehicles | 190 (35.7%) | 23 (20.5%) |
| 3 or more Vehicles | 197 (37.0%) | 7 (6.2%) |
| Total | 532 (100.0%) | 112 (100.0%) |
Real Estate & Mortgages in Broadway
Real Estate and Mortgage Overview in Broadway
| Characteristic | Without Mortgage | With Mortgage |
| Housing Units | 246 | 286 |
| Median Property Value | $205,800 | $222,500 |
| Median Household Income | $57,955 | $58 |
| Monthly Housing Costs | $582 | $9 |
| Real Estate Taxes | $2,456 | $15 |
Property Value by Mortgage Status in Broadway
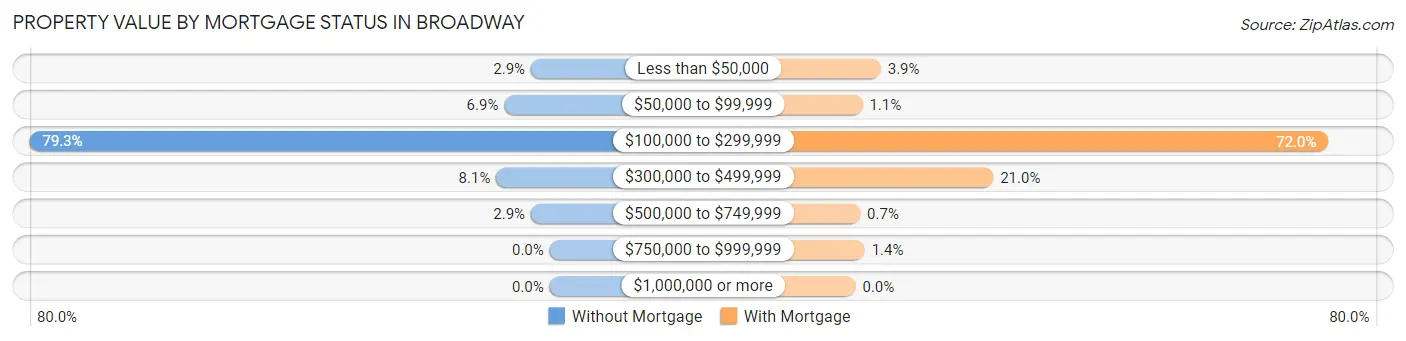
| Property Value | Without Mortgage | With Mortgage |
| Less than $50,000 | 7 (2.9%) | 11 (3.8%) |
| $50,000 to $99,999 | 17 (6.9%) | 3 (1.1%) |
| $100,000 to $299,999 | 195 (79.3%) | 206 (72.0%) |
| $300,000 to $499,999 | 20 (8.1%) | 60 (21.0%) |
| $500,000 to $749,999 | 7 (2.9%) | 2 (0.7%) |
| $750,000 to $999,999 | 0 (0.0%) | 4 (1.4%) |
| $1,000,000 or more | 0 (0.0%) | 0 (0.0%) |
| Total | 246 (100.0%) | 286 (100.0%) |
Household Income by Mortgage Status in Broadway
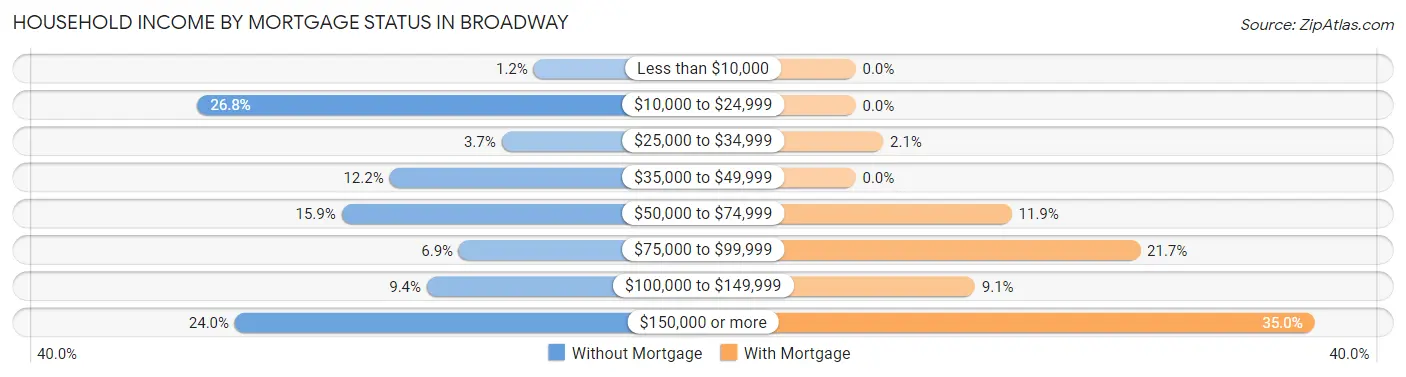
| Household Income | Without Mortgage | With Mortgage |
| Less than $10,000 | 3 (1.2%) | 0 (0.0%) |
| $10,000 to $24,999 | 66 (26.8%) | 0 (0.0%) |
| $25,000 to $34,999 | 9 (3.7%) | 6 (2.1%) |
| $35,000 to $49,999 | 30 (12.2%) | 0 (0.0%) |
| $50,000 to $74,999 | 39 (15.9%) | 34 (11.9%) |
| $75,000 to $99,999 | 17 (6.9%) | 62 (21.7%) |
| $100,000 to $149,999 | 23 (9.3%) | 26 (9.1%) |
| $150,000 or more | 59 (24.0%) | 100 (35.0%) |
| Total | 246 (100.0%) | 286 (100.0%) |
Property Value to Household Income Ratio in Broadway
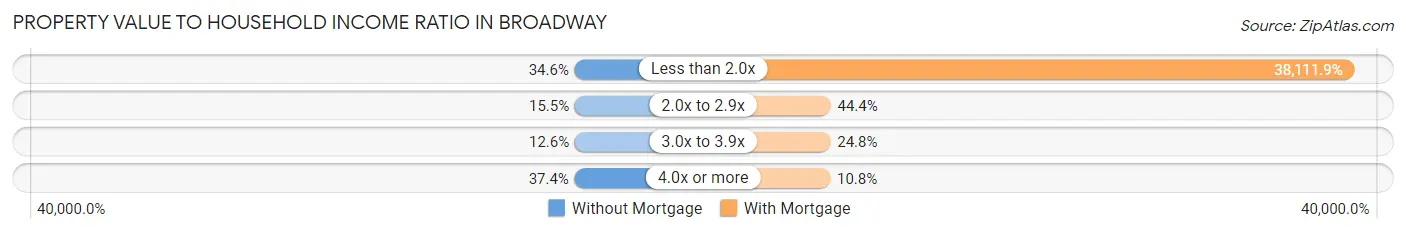
| Value-to-Income Ratio | Without Mortgage | With Mortgage |
| Less than 2.0x | 85 (34.5%) | 109,000 (38,111.9%) |
| 2.0x to 2.9x | 38 (15.4%) | 127 (44.4%) |
| 3.0x to 3.9x | 31 (12.6%) | 71 (24.8%) |
| 4.0x or more | 92 (37.4%) | 31 (10.8%) |
| Total | 246 (100.0%) | 286 (100.0%) |
Real Estate Taxes by Mortgage Status in Broadway
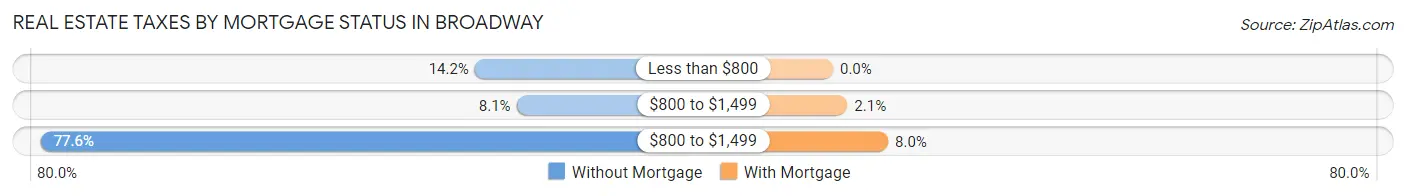
| Property Taxes | Without Mortgage | With Mortgage |
| Less than $800 | 35 (14.2%) | 0 (0.0%) |
| $800 to $1,499 | 20 (8.1%) | 6 (2.1%) |
| $800 to $1,499 | 191 (77.6%) | 23 (8.0%) |
| Total | 246 (100.0%) | 286 (100.0%) |
Health & Disability in Broadway
Health Insurance Coverage by Age in Broadway
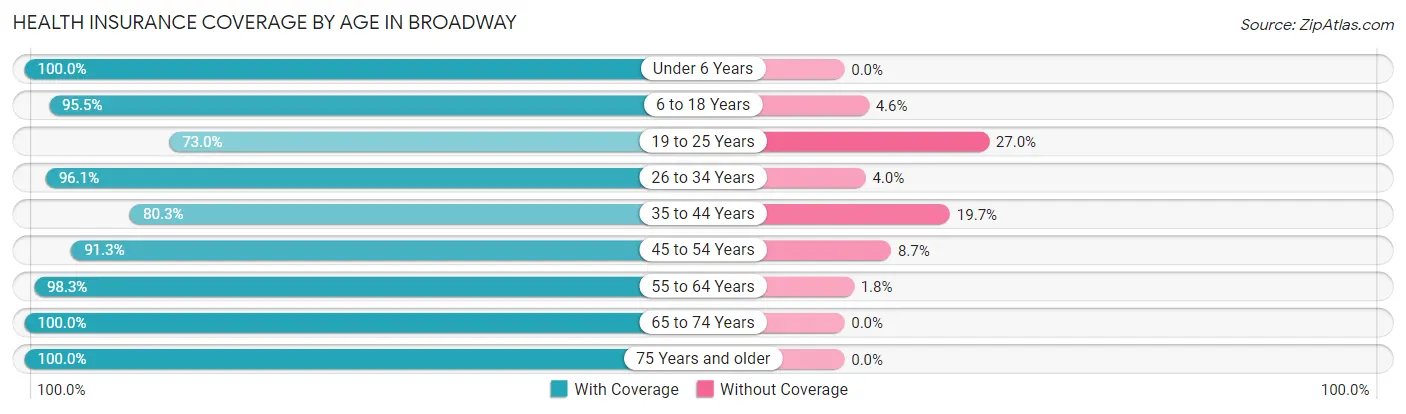
| Age Bracket | With Coverage | Without Coverage |
| Under 6 Years | 56 (100.0%) | 0 (0.0%) |
| 6 to 18 Years | 231 (95.5%) | 11 (4.5%) |
| 19 to 25 Years | 65 (73.0%) | 24 (27.0%) |
| 26 to 34 Years | 73 (96.1%) | 3 (4.0%) |
| 35 to 44 Years | 155 (80.3%) | 38 (19.7%) |
| 45 to 54 Years | 168 (91.3%) | 16 (8.7%) |
| 55 to 64 Years | 168 (98.3%) | 3 (1.8%) |
| 65 to 74 Years | 289 (100.0%) | 0 (0.0%) |
| 75 Years and older | 115 (100.0%) | 0 (0.0%) |
| Total | 1,320 (93.3%) | 95 (6.7%) |
Health Insurance Coverage by Citizenship Status in Broadway
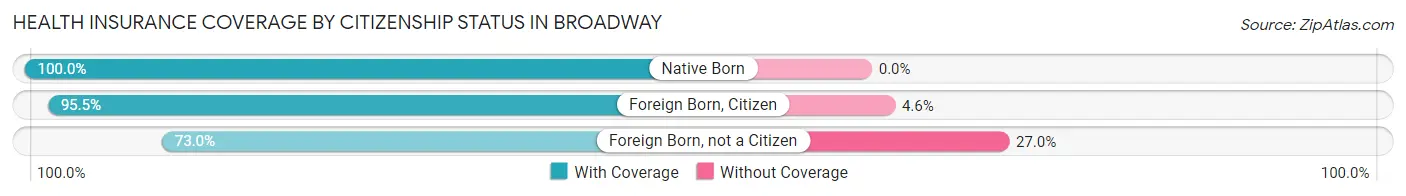
| Citizenship Status | With Coverage | Without Coverage |
| Native Born | 56 (100.0%) | 0 (0.0%) |
| Foreign Born, Citizen | 231 (95.5%) | 11 (4.5%) |
| Foreign Born, not a Citizen | 65 (73.0%) | 24 (27.0%) |
Health Insurance Coverage by Household Income in Broadway
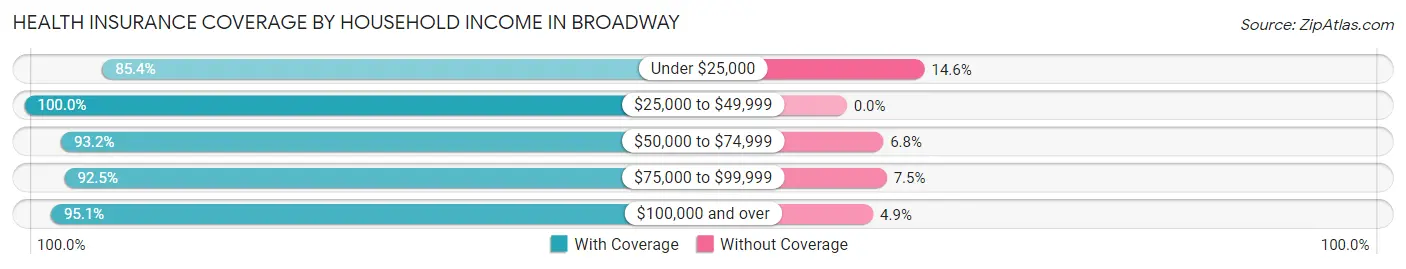
| Household Income | With Coverage | Without Coverage |
| Under $25,000 | 217 (85.4%) | 37 (14.6%) |
| $25,000 to $49,999 | 191 (100.0%) | 0 (0.0%) |
| $50,000 to $74,999 | 232 (93.2%) | 17 (6.8%) |
| $75,000 to $99,999 | 99 (92.5%) | 8 (7.5%) |
| $100,000 and over | 577 (95.1%) | 30 (4.9%) |
Public vs Private Health Insurance Coverage by Age in Broadway
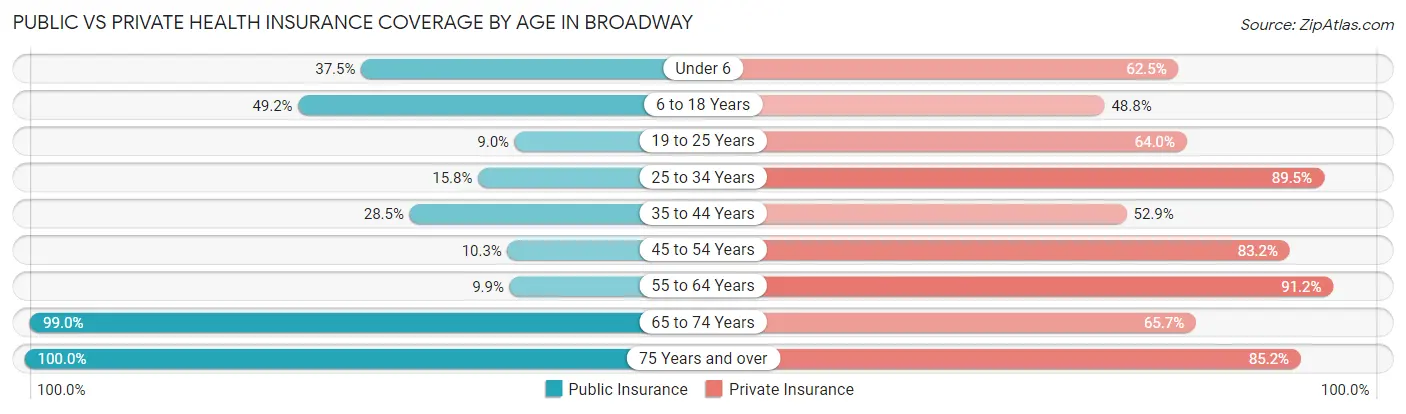
| Age Bracket | Public Insurance | Private Insurance |
| Under 6 | 21 (37.5%) | 35 (62.5%) |
| 6 to 18 Years | 119 (49.2%) | 118 (48.8%) |
| 19 to 25 Years | 8 (9.0%) | 57 (64.0%) |
| 25 to 34 Years | 12 (15.8%) | 68 (89.5%) |
| 35 to 44 Years | 55 (28.5%) | 102 (52.8%) |
| 45 to 54 Years | 19 (10.3%) | 153 (83.2%) |
| 55 to 64 Years | 17 (9.9%) | 156 (91.2%) |
| 65 to 74 Years | 286 (99.0%) | 190 (65.7%) |
| 75 Years and over | 115 (100.0%) | 98 (85.2%) |
| Total | 652 (46.1%) | 977 (69.1%) |
Disability Status by Sex by Age in Broadway
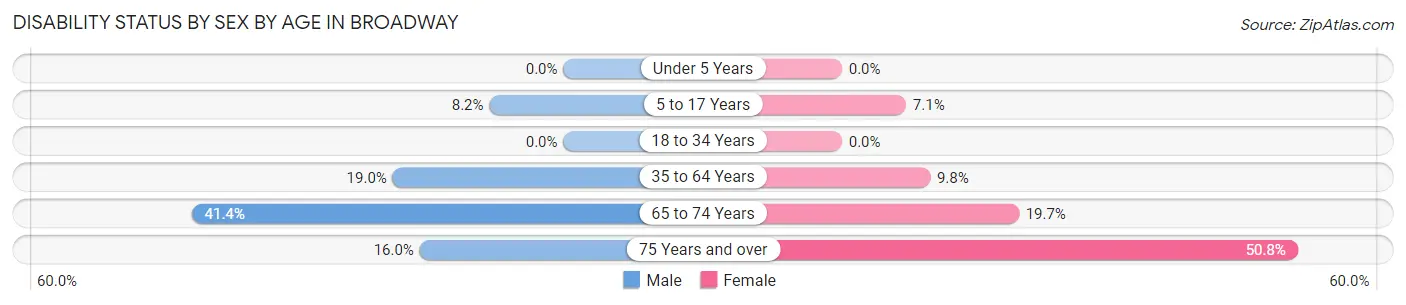
| Age Bracket | Male | Female |
| Under 5 Years | 0 (0.0%) | 0 (0.0%) |
| 5 to 17 Years | 7 (8.2%) | 11 (7.1%) |
| 18 to 34 Years | 0 (0.0%) | 0 (0.0%) |
| 35 to 64 Years | 50 (19.0%) | 28 (9.8%) |
| 65 to 74 Years | 65 (41.4%) | 26 (19.7%) |
| 75 Years and over | 8 (16.0%) | 33 (50.8%) |
Disability Class by Sex by Age in Broadway
Disability Class: Hearing Difficulty
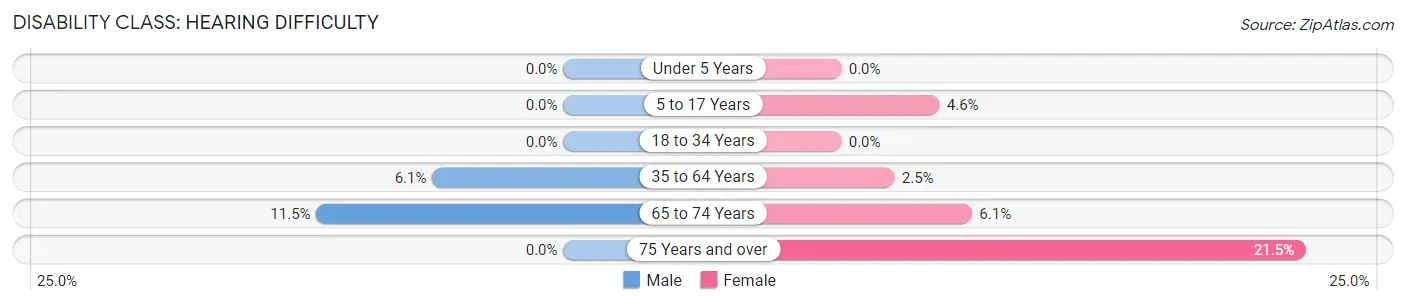
| Age Bracket | Male | Female |
| Under 5 Years | 0 (0.0%) | 0 (0.0%) |
| 5 to 17 Years | 0 (0.0%) | 7 (4.5%) |
| 18 to 34 Years | 0 (0.0%) | 0 (0.0%) |
| 35 to 64 Years | 16 (6.1%) | 7 (2.5%) |
| 65 to 74 Years | 18 (11.5%) | 8 (6.1%) |
| 75 Years and over | 0 (0.0%) | 14 (21.5%) |
Disability Class: Vision Difficulty
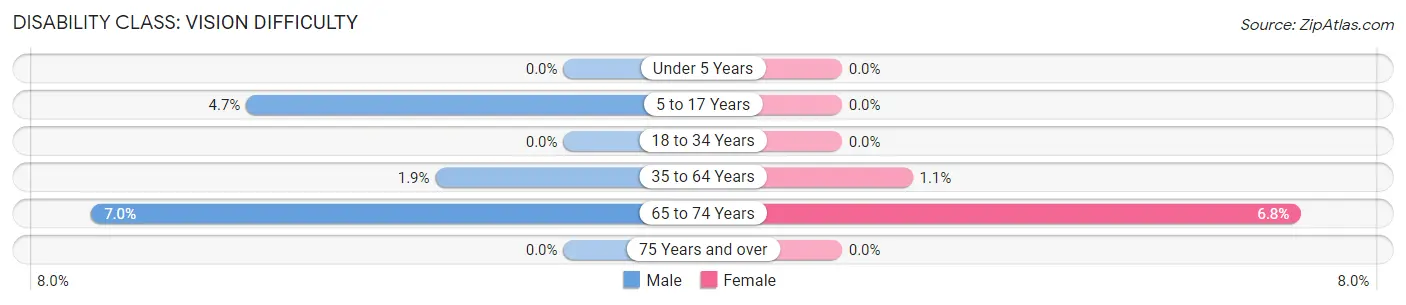
| Age Bracket | Male | Female |
| Under 5 Years | 0 (0.0%) | 0 (0.0%) |
| 5 to 17 Years | 4 (4.7%) | 0 (0.0%) |
| 18 to 34 Years | 0 (0.0%) | 0 (0.0%) |
| 35 to 64 Years | 5 (1.9%) | 3 (1.1%) |
| 65 to 74 Years | 11 (7.0%) | 9 (6.8%) |
| 75 Years and over | 0 (0.0%) | 0 (0.0%) |
Disability Class: Cognitive Difficulty
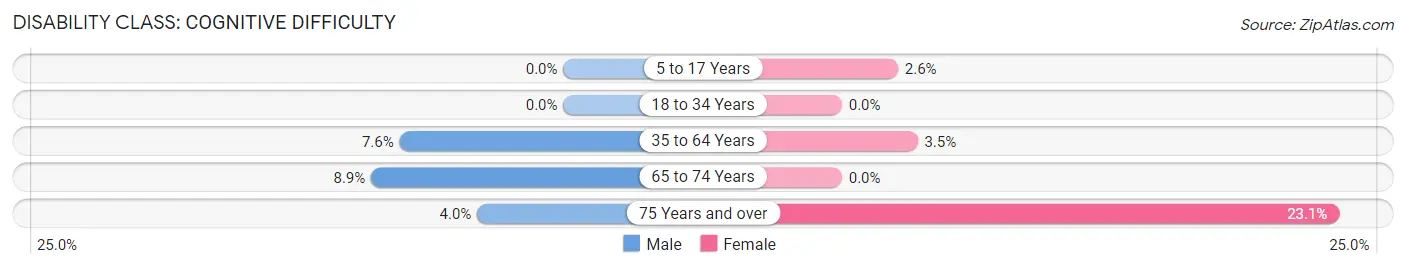
| Age Bracket | Male | Female |
| 5 to 17 Years | 0 (0.0%) | 4 (2.6%) |
| 18 to 34 Years | 0 (0.0%) | 0 (0.0%) |
| 35 to 64 Years | 20 (7.6%) | 10 (3.5%) |
| 65 to 74 Years | 14 (8.9%) | 0 (0.0%) |
| 75 Years and over | 2 (4.0%) | 15 (23.1%) |
Disability Class: Ambulatory Difficulty
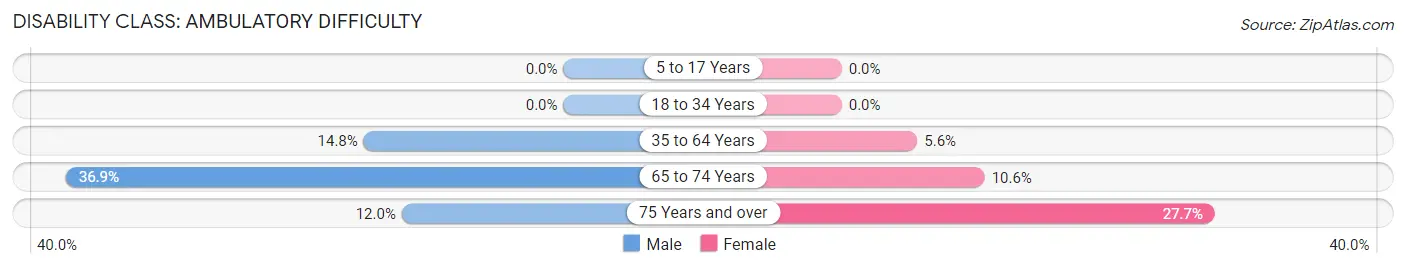
| Age Bracket | Male | Female |
| 5 to 17 Years | 0 (0.0%) | 0 (0.0%) |
| 18 to 34 Years | 0 (0.0%) | 0 (0.0%) |
| 35 to 64 Years | 39 (14.8%) | 16 (5.6%) |
| 65 to 74 Years | 58 (36.9%) | 14 (10.6%) |
| 75 Years and over | 6 (12.0%) | 18 (27.7%) |
Disability Class: Self-Care Difficulty
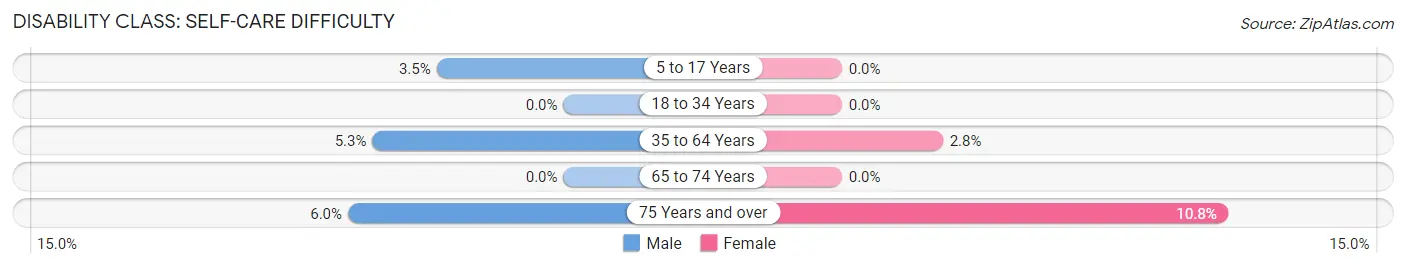
| Age Bracket | Male | Female |
| 5 to 17 Years | 3 (3.5%) | 0 (0.0%) |
| 18 to 34 Years | 0 (0.0%) | 0 (0.0%) |
| 35 to 64 Years | 14 (5.3%) | 8 (2.8%) |
| 65 to 74 Years | 0 (0.0%) | 0 (0.0%) |
| 75 Years and over | 3 (6.0%) | 7 (10.8%) |
Technology Access in Broadway
Computing Device Access in Broadway
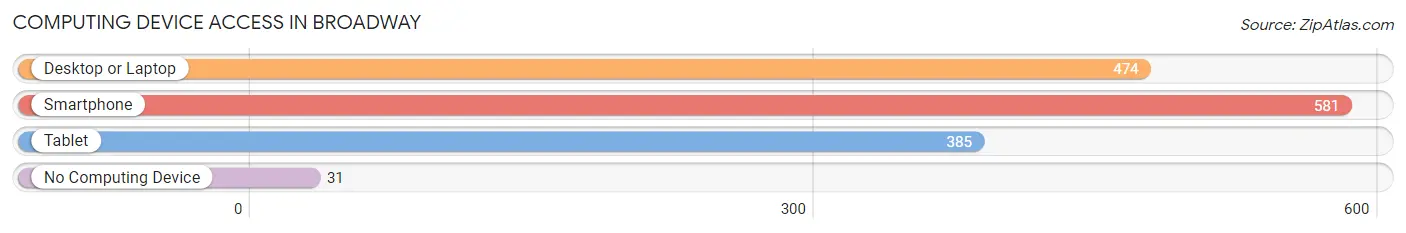
| Device Type | # Households | % Households |
| Desktop or Laptop | 474 | 73.6% |
| Smartphone | 581 | 90.2% |
| Tablet | 385 | 59.8% |
| No Computing Device | 31 | 4.8% |
| Total | 644 | 100.0% |
Internet Access in Broadway
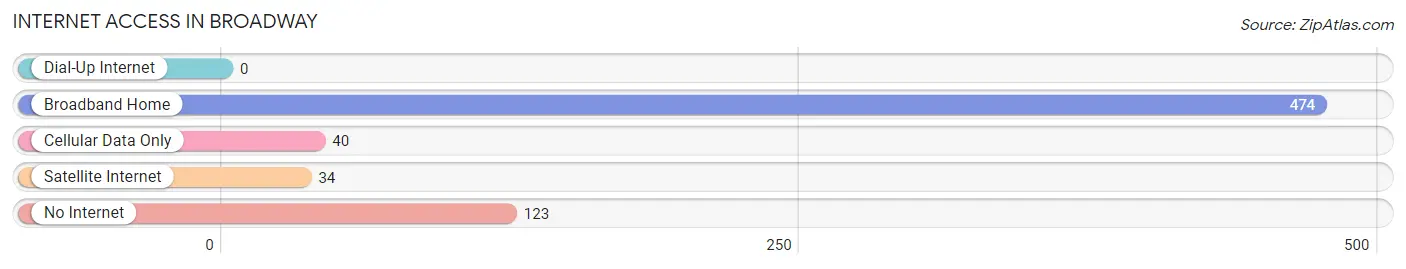
| Internet Type | # Households | % Households |
| Dial-Up Internet | 0 | 0.0% |
| Broadband Home | 474 | 73.6% |
| Cellular Data Only | 40 | 6.2% |
| Satellite Internet | 34 | 5.3% |
| No Internet | 123 | 19.1% |
| Total | 644 | 100.0% |
Broadway Summary
Broadway is a small town located in Lee County, North Carolina. It is situated in the heart of the state, approximately halfway between Raleigh and Charlotte. The town has a population of 1,845 people, according to the 2010 census.
History
The town of Broadway was founded in 1887 by a group of settlers from the nearby town of Sanford. The settlers chose the name Broadway because of its proximity to the railroad line that ran through the area. The railroad line was a major factor in the town's growth and development, as it allowed for the transportation of goods and people to and from the town.
The town was incorporated in 1889 and quickly grew to become a thriving community. The town was home to a variety of businesses, including a cotton mill, a sawmill, a grist mill, and a brickyard. The town also had a post office, a bank, and a hotel.
Geography
Broadway is located in the central part of Lee County, North Carolina. It is situated in the heart of the state, approximately halfway between Raleigh and Charlotte. The town is located on the banks of the Deep River, which flows through the town and provides a source of recreation for the residents.
The town is surrounded by rolling hills and farmland, and is home to a variety of wildlife, including deer, foxes, and wild turkeys. The town is also home to a variety of trees, including oak, hickory, and pine.
Economy
The economy of Broadway is largely based on agriculture. The town is home to a variety of farms, including dairy farms, poultry farms, and vegetable farms. The town is also home to a variety of small businesses, including restaurants, retail stores, and service providers.
The town is also home to a variety of manufacturing businesses, including a furniture factory, a textile mill, and a plastics factory. The town is also home to a variety of transportation businesses, including trucking companies and a railroad line.
Demographics
According to the 2010 census, the population of Broadway was 1,845 people. The town is predominantly white, with a population that is 94.3% white, 2.2% African American, 0.7% Hispanic, and 0.8% Asian. The median household income in the town is $37,941, and the median age is 39.7 years.
Conclusion
Broadway is a small town located in Lee County, North Carolina. It is situated in the heart of the state, approximately halfway between Raleigh and Charlotte. The town has a population of 1,845 people, according to the 2010 census. The town's economy is largely based on agriculture, and it is home to a variety of small businesses, manufacturing businesses, and transportation businesses. The town is predominantly white, with a population that is 94.3% white, 2.2% African American, 0.7% Hispanic, and 0.8% Asian.
Common Questions
What is Per Capita Income in Broadway?
Per Capita income in Broadway is $46,473.
What is the Median Family Income in Broadway?
Median Family Income in Broadway is $103,333.
What is the Median Household income in Broadway?
Median Household Income in Broadway is $63,333.
What is Income or Wage Gap in Broadway?
Income or Wage Gap in Broadway is 23.8%.
Women in Broadway earn 76.2 cents for every dollar earned by a man.
What is Inequality or Gini Index in Broadway?
Inequality or Gini Index in Broadway is 0.50.
What is the Total Population of Broadway?
Total Population of Broadway is 1,415.
What is the Total Male Population of Broadway?
Total Male Population of Broadway is 690.
What is the Total Female Population of Broadway?
Total Female Population of Broadway is 725.
What is the Ratio of Males per 100 Females in Broadway?
There are 95.17 Males per 100 Females in Broadway.
What is the Ratio of Females per 100 Males in Broadway?
There are 105.07 Females per 100 Males in Broadway.
What is the Median Population Age in Broadway?
Median Population Age in Broadway is 48.3 Years.
What is the Average Family Size in Broadway
Average Family Size in Broadway is 2.6 People.
What is the Average Household Size in Broadway
Average Household Size in Broadway is 2.2 People.
How Large is the Labor Force in Broadway?
There are 716 People in the Labor Forcein in Broadway.
What is the Percentage of People in the Labor Force in Broadway?
61.6% of People are in the Labor Force in Broadway.
What is the Unemployment Rate in Broadway?
Unemployment Rate in Broadway is 2.9%.