Nags Head, NC Map & Demographics
Nags Head Map
Nags Head Overview
$55,750
PER CAPITA INCOME
$111,703
AVG FAMILY INCOME
$87,560
AVG HOUSEHOLD INCOME
5.3%
WAGE / INCOME GAP [ % ]
94.7¢/ $1
WAGE / INCOME GAP [ $ ]
0.40
INEQUALITY / GINI INDEX
3,153
TOTAL POPULATION
1,670
MALE POPULATION
1,483
FEMALE POPULATION
112.61
MALES / 100 FEMALES
88.80
FEMALES / 100 MALES
59.8
MEDIAN AGE
2.3
AVG FAMILY SIZE
1.9
AVG HOUSEHOLD SIZE
1,483
LABOR FORCE [ PEOPLE ]
52.6%
PERCENT IN LABOR FORCE
1.8%
UNEMPLOYMENT RATE
Nags Head Zip Codes
Nags Head Area Codes
Income in Nags Head
Income Overview in Nags Head
Per Capita Income in Nags Head is $55,750, while median incomes of families and households are $111,703 and $87,560 respectively.
| Characteristic | Number | Measure |
| Per Capita Income | 3,153 | $55,750 |
| Median Family Income | 980 | $111,703 |
| Mean Family Income | 980 | $139,762 |
| Median Household Income | 1,595 | $87,560 |
| Mean Household Income | 1,595 | $110,861 |
| Income Deficit | 980 | $0 |
| Wage / Income Gap (%) | 3,153 | 5.26% |
| Wage / Income Gap ($) | 3,153 | 94.74¢ per $1 |
| Gini / Inequality Index | 3,153 | 0.40 |
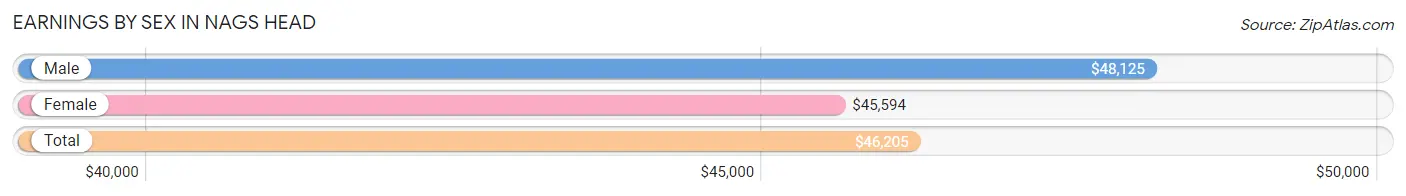
Earnings by Sex in Nags Head
Average Earnings in Nags Head are $46,205, $48,125 for men and $45,594 for women, a difference of 5.3%.
| Sex | Number | Average Earnings |
| Male | 851 (53.5%) | $48,125 |
| Female | 739 (46.5%) | $45,594 |
| Total | 1,590 (100.0%) | $46,205 |
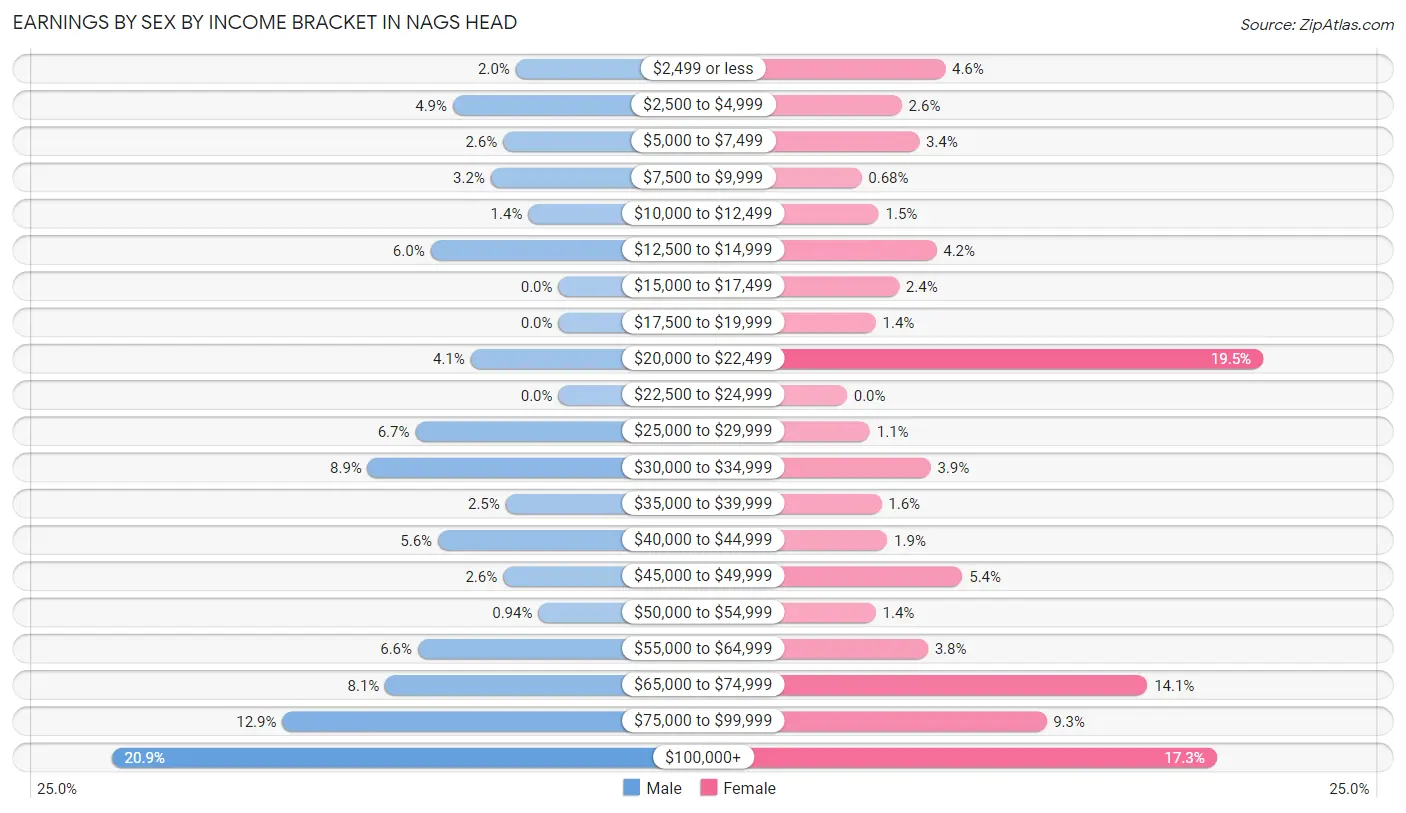
Earnings by Sex by Income Bracket in Nags Head
The most common earnings brackets in Nags Head are $100,000+ for men (178 | 20.9%) and $20,000 to $22,499 for women (144 | 19.5%).
| Income | Male | Female |
| $2,499 or less | 17 (2.0%) | 34 (4.6%) |
| $2,500 to $4,999 | 42 (4.9%) | 19 (2.6%) |
| $5,000 to $7,499 | 22 (2.6%) | 25 (3.4%) |
| $7,500 to $9,999 | 27 (3.2%) | 5 (0.7%) |
| $10,000 to $12,499 | 12 (1.4%) | 11 (1.5%) |
| $12,500 to $14,999 | 51 (6.0%) | 31 (4.2%) |
| $15,000 to $17,499 | 0 (0.0%) | 18 (2.4%) |
| $17,500 to $19,999 | 0 (0.0%) | 10 (1.3%) |
| $20,000 to $22,499 | 35 (4.1%) | 144 (19.5%) |
| $22,500 to $24,999 | 0 (0.0%) | 0 (0.0%) |
| $25,000 to $29,999 | 57 (6.7%) | 8 (1.1%) |
| $30,000 to $34,999 | 76 (8.9%) | 29 (3.9%) |
| $35,000 to $39,999 | 21 (2.5%) | 12 (1.6%) |
| $40,000 to $44,999 | 48 (5.6%) | 14 (1.9%) |
| $45,000 to $49,999 | 22 (2.6%) | 40 (5.4%) |
| $50,000 to $54,999 | 8 (0.9%) | 10 (1.3%) |
| $55,000 to $64,999 | 56 (6.6%) | 28 (3.8%) |
| $65,000 to $74,999 | 69 (8.1%) | 104 (14.1%) |
| $75,000 to $99,999 | 110 (12.9%) | 69 (9.3%) |
| $100,000+ | 178 (20.9%) | 128 (17.3%) |
| Total | 851 (100.0%) | 739 (100.0%) |
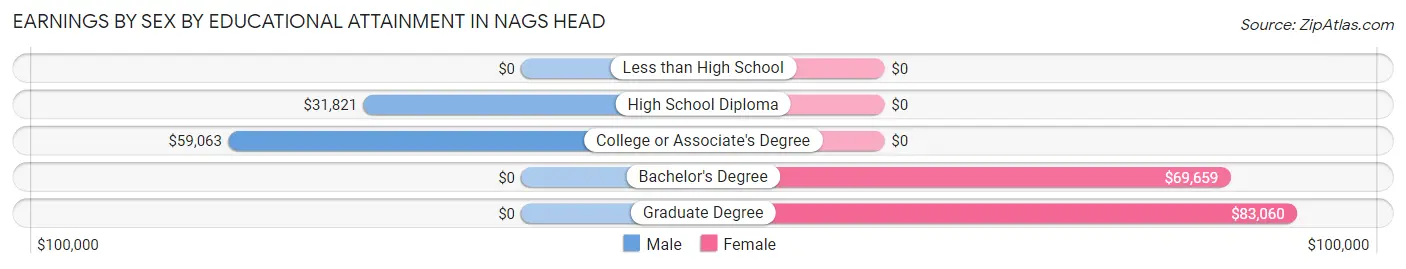
Earnings by Sex by Educational Attainment in Nags Head
Average earnings in Nags Head are $56,442 for men and $64,531 for women, a difference of 12.5%. Men with an educational attainment of college or associate's degree enjoy the highest average annual earnings of $59,063, while those with high school diploma education earn the least with $31,821. Women with an educational attainment of graduate degree earn the most with the average annual earnings of $83,060, while those with bachelor's degree education have the smallest earnings of $69,659.
| Educational Attainment | Male Income | Female Income |
| Less than High School | - | - |
| High School Diploma | $31,821 | $0 |
| College or Associate's Degree | $59,063 | $0 |
| Bachelor's Degree | - | - |
| Graduate Degree | - | - |
| Total | $56,442 | $64,531 |
Family Income in Nags Head
Family Income Brackets in Nags Head
According to the Nags Head family income data, there are 301 families falling into the $100,000 to $149,999 income range, which is the most common income bracket and makes up 30.7% of all families.
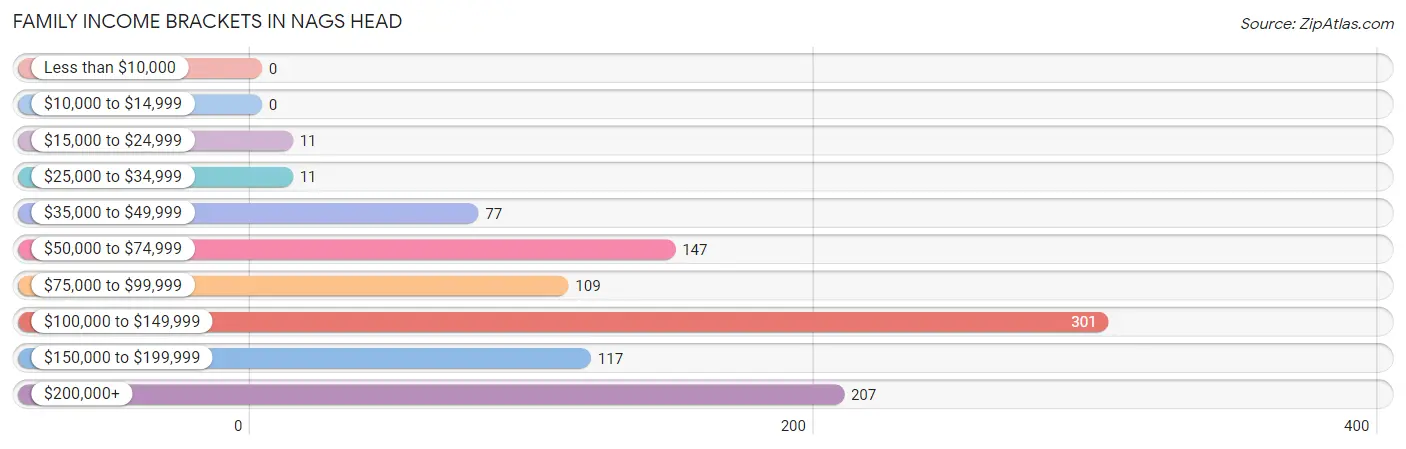
| Income Bracket | # Families | % Families |
| Less than $10,000 | 0 | 0.0% |
| $10,000 to $14,999 | 0 | 0.0% |
| $15,000 to $24,999 | 11 | 1.1% |
| $25,000 to $34,999 | 11 | 1.1% |
| $35,000 to $49,999 | 77 | 7.9% |
| $50,000 to $74,999 | 147 | 15.0% |
| $75,000 to $99,999 | 109 | 11.1% |
| $100,000 to $149,999 | 301 | 30.7% |
| $150,000 to $199,999 | 117 | 11.9% |
| $200,000+ | 207 | 21.1% |
Family Income by Famaliy Size in Nags Head
4-person families (108 | 11.0%) account for the highest median family income in Nags Head with $115,862 per family, while 2-person families (758 | 77.3%) have the highest median income of $55,948 per family member.
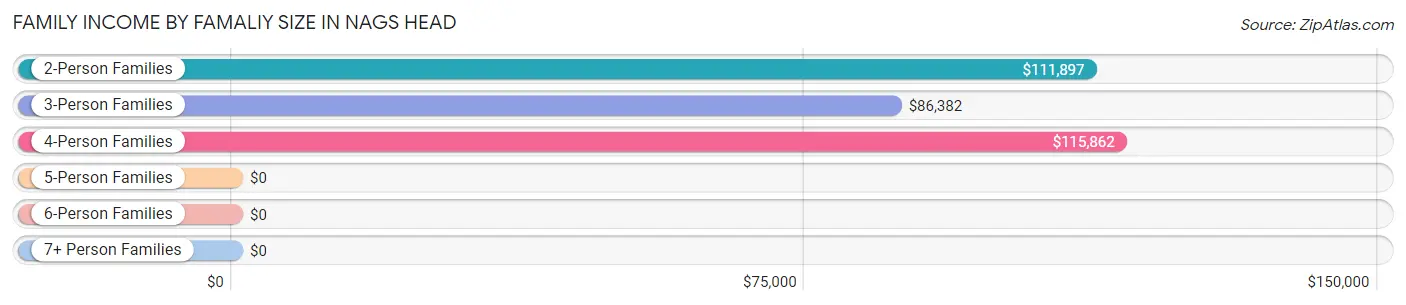
| Income Bracket | # Families | Median Income |
| 2-Person Families | 758 (77.3%) | $111,897 |
| 3-Person Families | 99 (10.1%) | $86,382 |
| 4-Person Families | 108 (11.0%) | $115,862 |
| 5-Person Families | 4 (0.4%) | $0 |
| 6-Person Families | 11 (1.1%) | $0 |
| 7+ Person Families | 0 (0.0%) | $0 |
| Total | 980 (100.0%) | $111,703 |
Family Income by Number of Earners in Nags Head
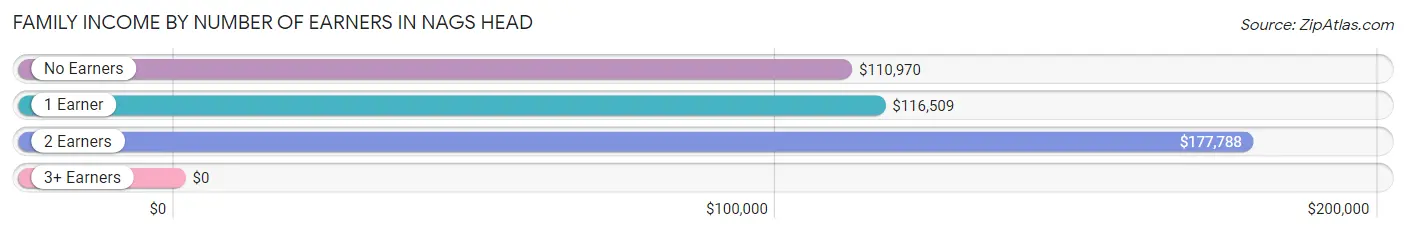
| Number of Earners | # Families | Median Income |
| No Earners | 290 (29.6%) | $110,970 |
| 1 Earner | 313 (31.9%) | $116,509 |
| 2 Earners | 373 (38.1%) | $177,788 |
| 3+ Earners | 4 (0.4%) | $0 |
| Total | 980 (100.0%) | $111,703 |
Household Income in Nags Head
Household Income Brackets in Nags Head
With 297 households falling in the category, the $100,000 to $149,999 income range is the most frequent in Nags Head, accounting for 18.6% of all households. In contrast, only 10 households (0.6%) fall into the less than $10,000 income bracket, making it the least populous group.
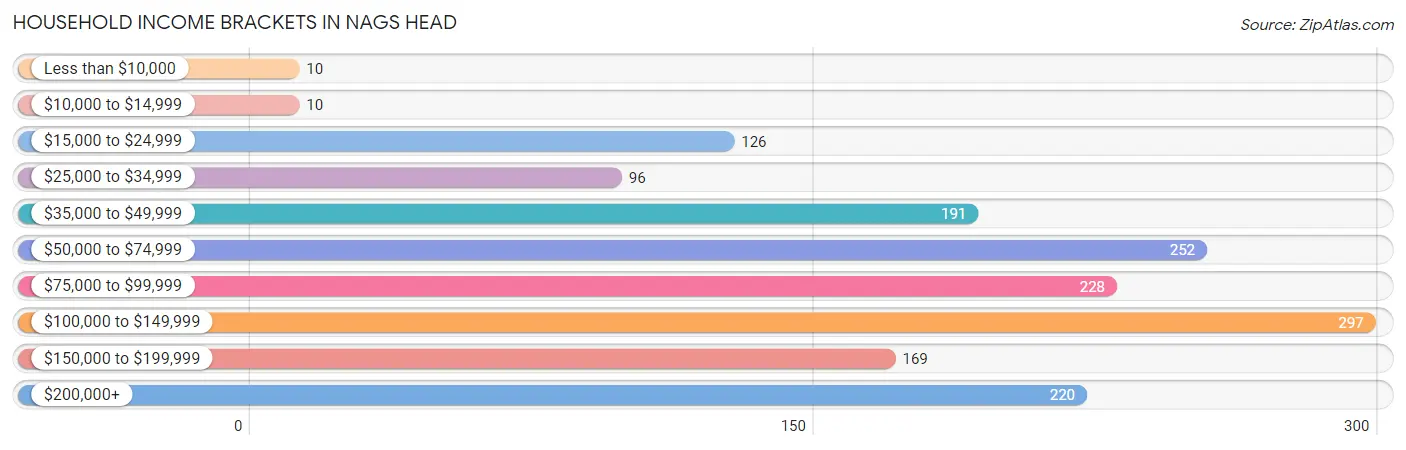
| Income Bracket | # Households | % Households |
| Less than $10,000 | 10 | 0.6% |
| $10,000 to $14,999 | 10 | 0.6% |
| $15,000 to $24,999 | 126 | 7.9% |
| $25,000 to $34,999 | 96 | 6.0% |
| $35,000 to $49,999 | 191 | 12.0% |
| $50,000 to $74,999 | 252 | 15.8% |
| $75,000 to $99,999 | 228 | 14.3% |
| $100,000 to $149,999 | 297 | 18.6% |
| $150,000 to $199,999 | 169 | 10.6% |
| $200,000+ | 220 | 13.8% |
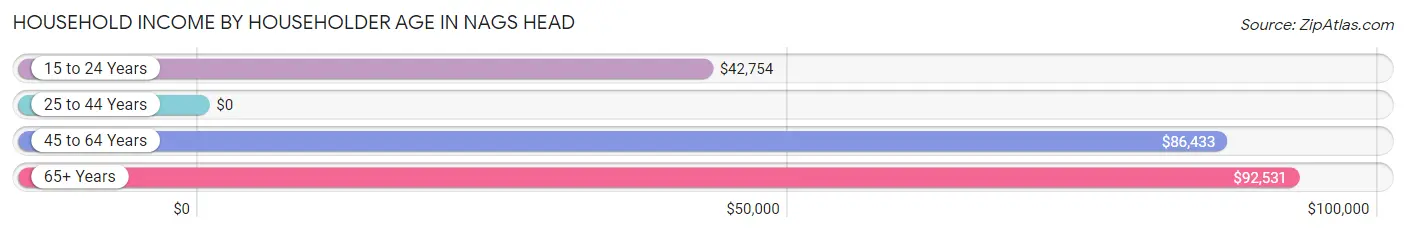
Household Income by Householder Age in Nags Head
The median household income in Nags Head is $87,560, with the highest median household income of $92,531 found in the 65+ years age bracket for the primary householder. A total of 811 households (50.8%) fall into this category. Meanwhile, the 25 to 44 years age bracket for the primary householder has the lowest median household income of $0, with 175 households (11.0%) in this group.
| Income Bracket | # Households | Median Income |
| 15 to 24 Years | 126 (7.9%) | $42,754 |
| 25 to 44 Years | 175 (11.0%) | $0 |
| 45 to 64 Years | 483 (30.3%) | $86,433 |
| 65+ Years | 811 (50.8%) | $92,531 |
| Total | 1,595 (100.0%) | $87,560 |
Poverty in Nags Head
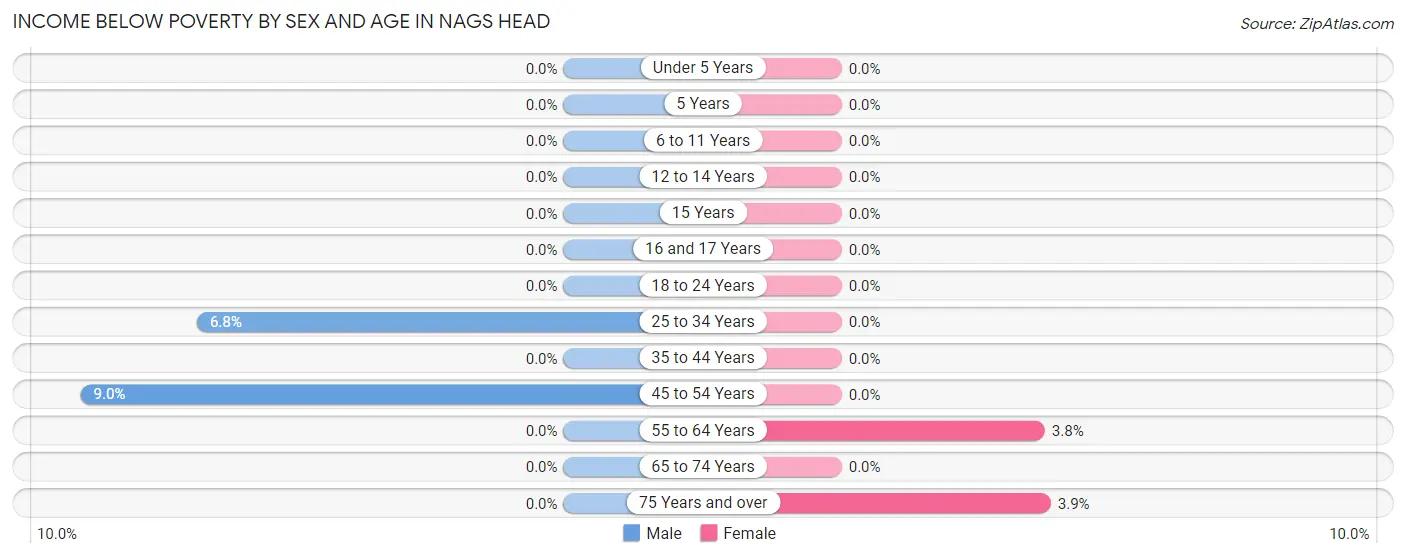
Income Below Poverty by Sex and Age in Nags Head
With 1.3% poverty level for males and 1.2% for females among the residents of Nags Head, 45 to 54 year old males and 75 year old and over females are the most vulnerable to poverty, with 12 males (9.0%) and 9 females (3.9%) in their respective age groups living below the poverty level.
| Age Bracket | Male | Female |
| Under 5 Years | 0 (0.0%) | 0 (0.0%) |
| 5 Years | 0 (0.0%) | 0 (0.0%) |
| 6 to 11 Years | 0 (0.0%) | 0 (0.0%) |
| 12 to 14 Years | 0 (0.0%) | 0 (0.0%) |
| 15 Years | 0 (0.0%) | 0 (0.0%) |
| 16 and 17 Years | 0 (0.0%) | 0 (0.0%) |
| 18 to 24 Years | 0 (0.0%) | 0 (0.0%) |
| 25 to 34 Years | 10 (6.8%) | 0 (0.0%) |
| 35 to 44 Years | 0 (0.0%) | 0 (0.0%) |
| 45 to 54 Years | 12 (9.0%) | 0 (0.0%) |
| 55 to 64 Years | 0 (0.0%) | 9 (3.8%) |
| 65 to 74 Years | 0 (0.0%) | 0 (0.0%) |
| 75 Years and over | 0 (0.0%) | 9 (3.9%) |
| Total | 22 (1.3%) | 18 (1.2%) |
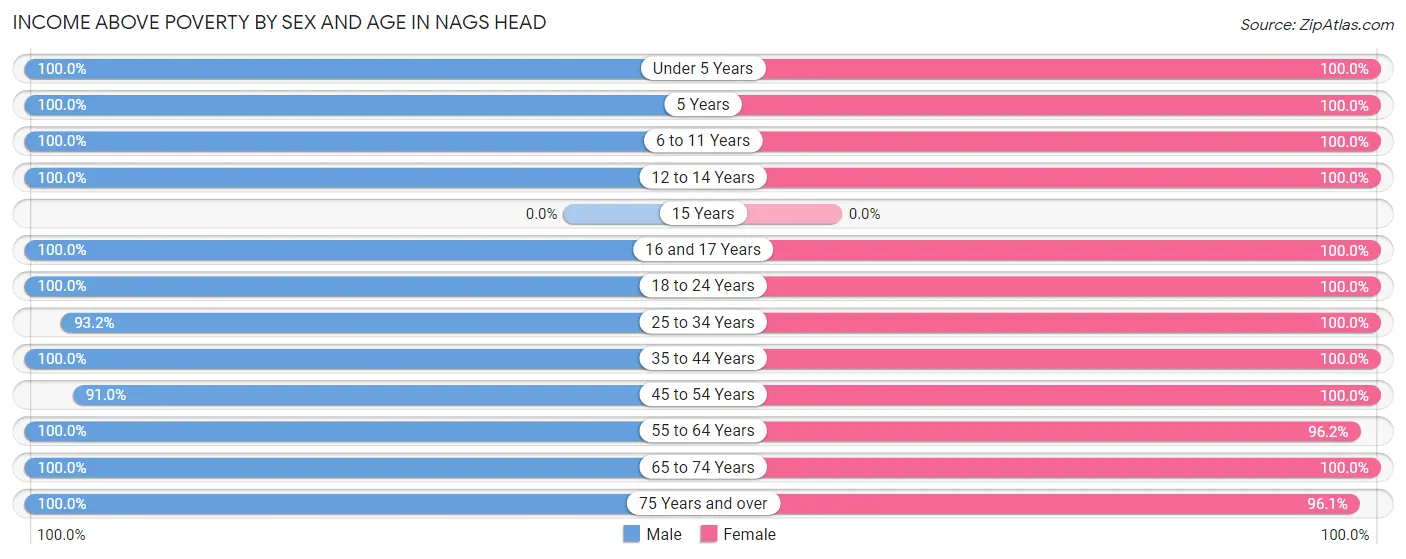
Income Above Poverty by Sex and Age in Nags Head
According to the poverty statistics in Nags Head, males aged under 5 years and females aged under 5 years are the age groups that are most secure financially, with 100.0% of males and 100.0% of females in these age groups living above the poverty line.
| Age Bracket | Male | Female |
| Under 5 Years | 11 (100.0%) | 29 (100.0%) |
| 5 Years | 5 (100.0%) | 48 (100.0%) |
| 6 to 11 Years | 135 (100.0%) | 4 (100.0%) |
| 12 to 14 Years | 38 (100.0%) | 64 (100.0%) |
| 15 Years | 0 (0.0%) | 0 (0.0%) |
| 16 and 17 Years | 25 (100.0%) | 15 (100.0%) |
| 18 to 24 Years | 52 (100.0%) | 116 (100.0%) |
| 25 to 34 Years | 137 (93.2%) | 34 (100.0%) |
| 35 to 44 Years | 129 (100.0%) | 87 (100.0%) |
| 45 to 54 Years | 122 (91.0%) | 222 (100.0%) |
| 55 to 64 Years | 245 (100.0%) | 230 (96.2%) |
| 65 to 74 Years | 550 (100.0%) | 363 (100.0%) |
| 75 Years and over | 155 (100.0%) | 223 (96.1%) |
| Total | 1,604 (98.7%) | 1,435 (98.8%) |
Income Below Poverty Among Married-Couple Families in Nags Head
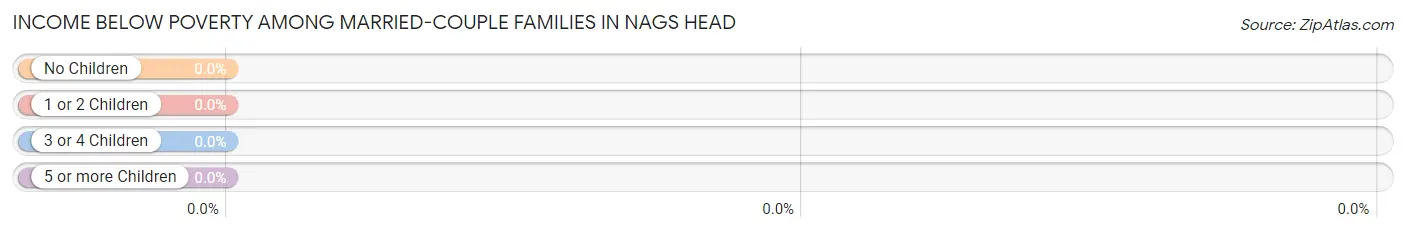
| Children | Above Poverty | Below Poverty |
| No Children | 747 (100.0%) | 0 (0.0%) |
| 1 or 2 Children | 111 (100.0%) | 0 (0.0%) |
| 3 or 4 Children | 0 (0.0%) | 0 (0.0%) |
| 5 or more Children | 0 (0.0%) | 0 (0.0%) |
| Total | 858 (100.0%) | 0 (0.0%) |
Income Below Poverty Among Single-Parent Households in Nags Head
| Children | Single Father | Single Mother |
| No Children | 0 (0.0%) | 0 (0.0%) |
| 1 or 2 Children | 0 (0.0%) | 0 (0.0%) |
| 3 or 4 Children | 0 (0.0%) | 0 (0.0%) |
| 5 or more Children | 0 (0.0%) | 0 (0.0%) |
| Total | 0 (0.0%) | 0 (0.0%) |
Income Below Poverty Among Married-Couple vs Single-Parent Households in Nags Head
| Children | Married-Couple Families | Single-Parent Households |
| No Children | 0 (0.0%) | 0 (0.0%) |
| 1 or 2 Children | 0 (0.0%) | 0 (0.0%) |
| 3 or 4 Children | 0 (0.0%) | 0 (0.0%) |
| 5 or more Children | 0 (0.0%) | 0 (0.0%) |
| Total | 0 (0.0%) | 0 (0.0%) |
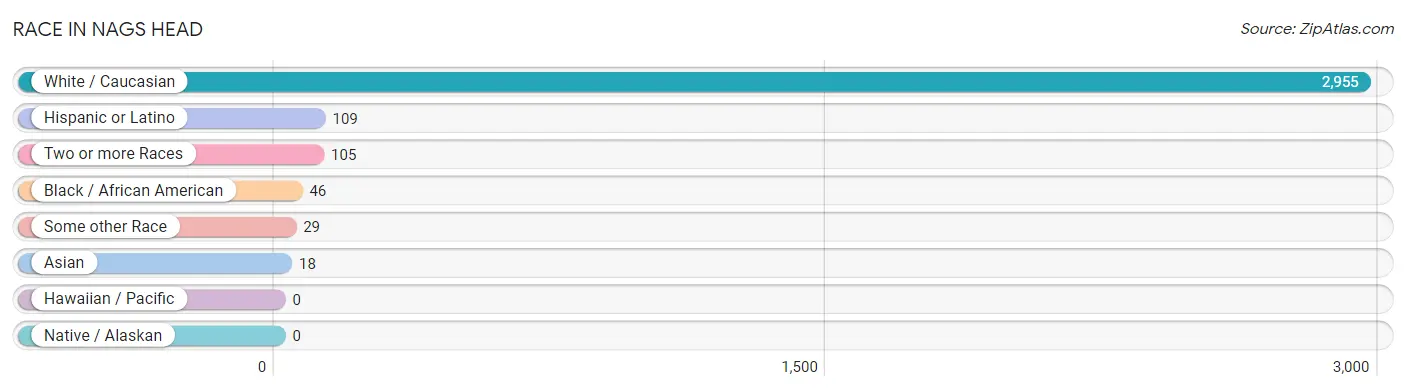
Race in Nags Head
The most populous races in Nags Head are White / Caucasian (2,955 | 93.7%), Hispanic or Latino (109 | 3.5%), and Two or more Races (105 | 3.3%).
| Race | # Population | % Population |
| Asian | 18 | 0.6% |
| Black / African American | 46 | 1.5% |
| Hawaiian / Pacific | 0 | 0.0% |
| Hispanic or Latino | 109 | 3.5% |
| Native / Alaskan | 0 | 0.0% |
| White / Caucasian | 2,955 | 93.7% |
| Two or more Races | 105 | 3.3% |
| Some other Race | 29 | 0.9% |
| Total | 3,153 | 100.0% |
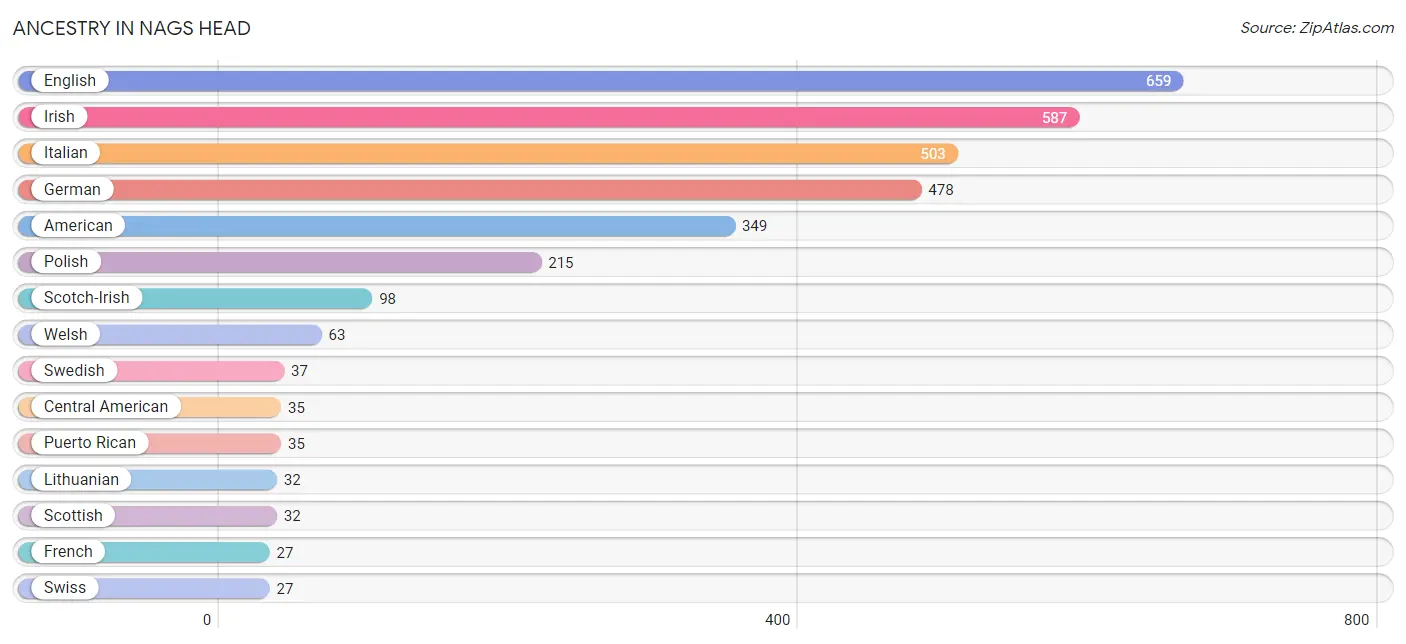
Ancestry in Nags Head
The most populous ancestries reported in Nags Head are English (659 | 20.9%), Irish (587 | 18.6%), Italian (503 | 16.0%), German (478 | 15.2%), and American (349 | 11.1%), together accounting for 81.7% of all Nags Head residents.
| Ancestry | # Population | % Population |
| American | 349 | 11.1% |
| Bhutanese | 15 | 0.5% |
| Central American | 35 | 1.1% |
| Costa Rican | 10 | 0.3% |
| Cuban | 24 | 0.8% |
| Danish | 19 | 0.6% |
| Dutch | 26 | 0.8% |
| Eastern European | 8 | 0.3% |
| English | 659 | 20.9% |
| European | 26 | 0.8% |
| Finnish | 12 | 0.4% |
| French | 27 | 0.9% |
| French Canadian | 10 | 0.3% |
| German | 478 | 15.2% |
| Guatemalan | 7 | 0.2% |
| Honduran | 18 | 0.6% |
| Hungarian | 9 | 0.3% |
| Indian (Asian) | 10 | 0.3% |
| Irish | 587 | 18.6% |
| Italian | 503 | 16.0% |
| Lithuanian | 32 | 1.0% |
| Mexican | 14 | 0.4% |
| Polish | 215 | 6.8% |
| Puerto Rican | 35 | 1.1% |
| Scotch-Irish | 98 | 3.1% |
| Scottish | 32 | 1.0% |
| Sioux | 11 | 0.4% |
| Slovak | 23 | 0.7% |
| Spanish | 1 | 0.0% |
| Swedish | 37 | 1.2% |
| Swiss | 27 | 0.9% |
| Welsh | 63 | 2.0% | View All 32 Rows |
Immigrants in Nags Head
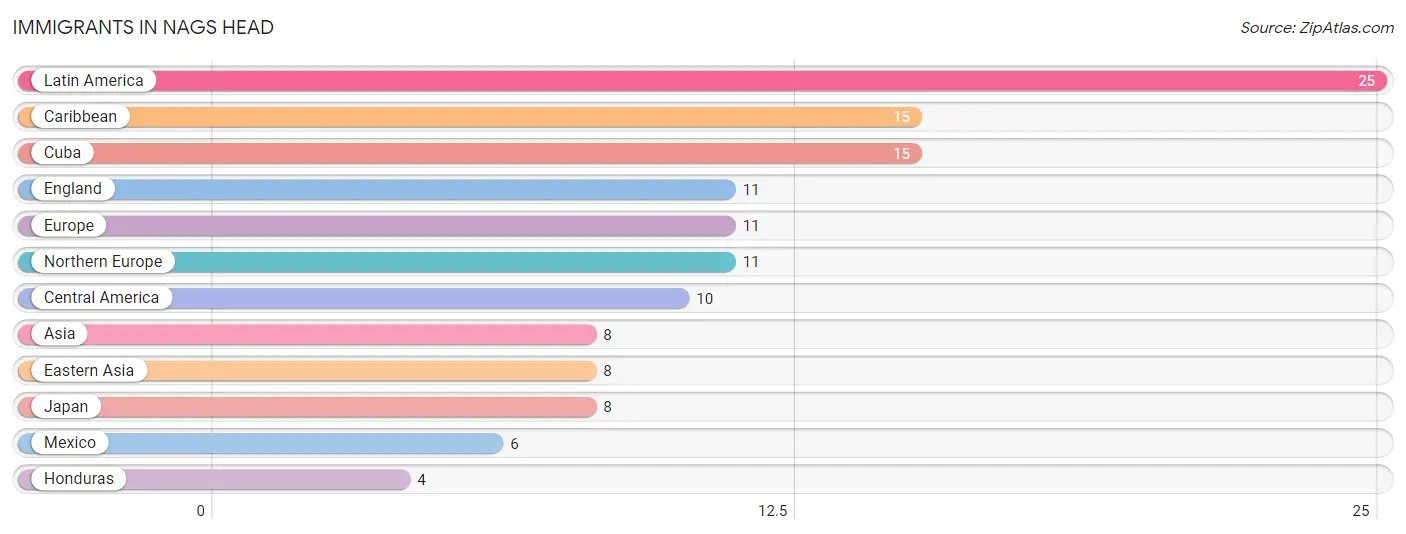
The most numerous immigrant groups reported in Nags Head came from Latin America (25 | 0.8%), Caribbean (15 | 0.5%), Cuba (15 | 0.5%), England (11 | 0.4%), and Europe (11 | 0.4%), together accounting for 2.4% of all Nags Head residents.
| Immigration Origin | # Population | % Population |
| Asia | 8 | 0.3% |
| Caribbean | 15 | 0.5% |
| Central America | 10 | 0.3% |
| Cuba | 15 | 0.5% |
| Eastern Asia | 8 | 0.3% |
| England | 11 | 0.4% |
| Europe | 11 | 0.4% |
| Honduras | 4 | 0.1% |
| Japan | 8 | 0.3% |
| Latin America | 25 | 0.8% |
| Mexico | 6 | 0.2% |
| Northern Europe | 11 | 0.4% | View All 12 Rows |
Sex and Age in Nags Head
Sex and Age in Nags Head
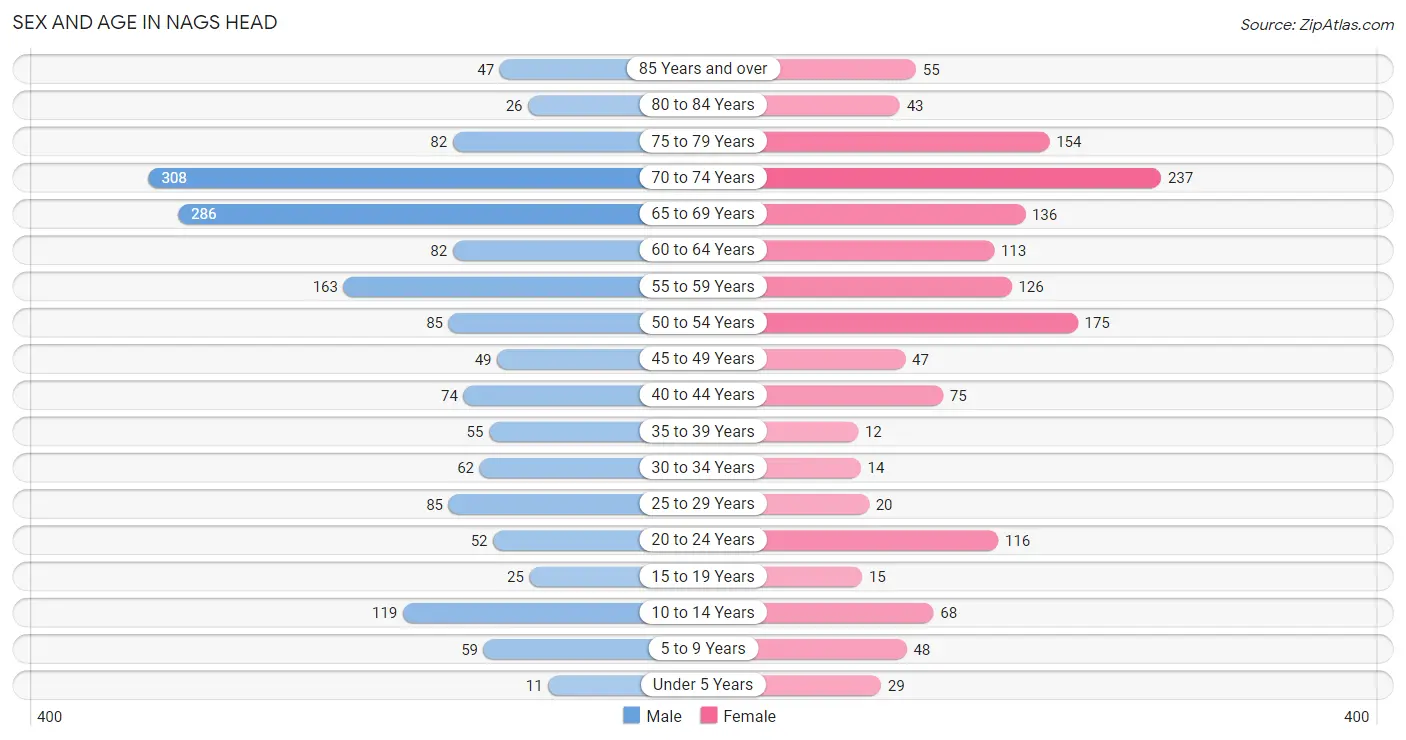
The most populous age groups in Nags Head are 70 to 74 Years (308 | 18.4%) for men and 70 to 74 Years (237 | 16.0%) for women.
| Age Bracket | Male | Female |
| Under 5 Years | 11 (0.7%) | 29 (2.0%) |
| 5 to 9 Years | 59 (3.5%) | 48 (3.2%) |
| 10 to 14 Years | 119 (7.1%) | 68 (4.6%) |
| 15 to 19 Years | 25 (1.5%) | 15 (1.0%) |
| 20 to 24 Years | 52 (3.1%) | 116 (7.8%) |
| 25 to 29 Years | 85 (5.1%) | 20 (1.3%) |
| 30 to 34 Years | 62 (3.7%) | 14 (0.9%) |
| 35 to 39 Years | 55 (3.3%) | 12 (0.8%) |
| 40 to 44 Years | 74 (4.4%) | 75 (5.1%) |
| 45 to 49 Years | 49 (2.9%) | 47 (3.2%) |
| 50 to 54 Years | 85 (5.1%) | 175 (11.8%) |
| 55 to 59 Years | 163 (9.8%) | 126 (8.5%) |
| 60 to 64 Years | 82 (4.9%) | 113 (7.6%) |
| 65 to 69 Years | 286 (17.1%) | 136 (9.2%) |
| 70 to 74 Years | 308 (18.4%) | 237 (16.0%) |
| 75 to 79 Years | 82 (4.9%) | 154 (10.4%) |
| 80 to 84 Years | 26 (1.6%) | 43 (2.9%) |
| 85 Years and over | 47 (2.8%) | 55 (3.7%) |
| Total | 1,670 (100.0%) | 1,483 (100.0%) |
Families and Households in Nags Head
Median Family Size in Nags Head
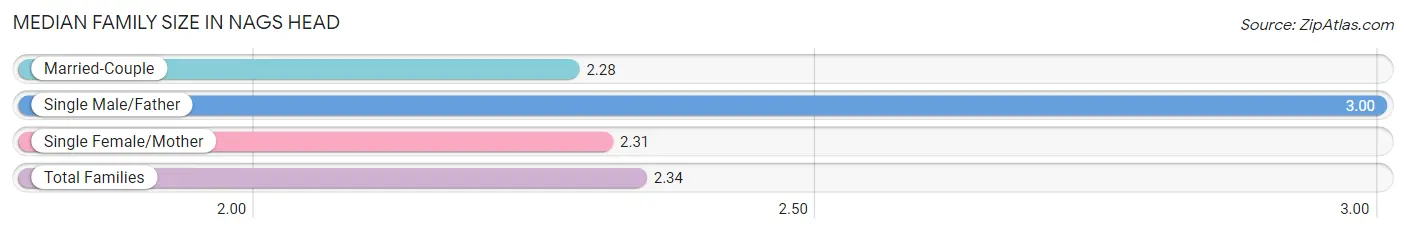
The median family size in Nags Head is 2.34 persons per family, with single male/father families (80 | 8.2%) accounting for the largest median family size of 3 persons per family. On the other hand, married-couple families (858 | 87.5%) represent the smallest median family size with 2.28 persons per family.
| Family Type | # Families | Family Size |
| Married-Couple | 858 (87.5%) | 2.28 |
| Single Male/Father | 80 (8.2%) | 3.00 |
| Single Female/Mother | 42 (4.3%) | 2.31 |
| Total Families | 980 (100.0%) | 2.34 |
Median Household Size in Nags Head
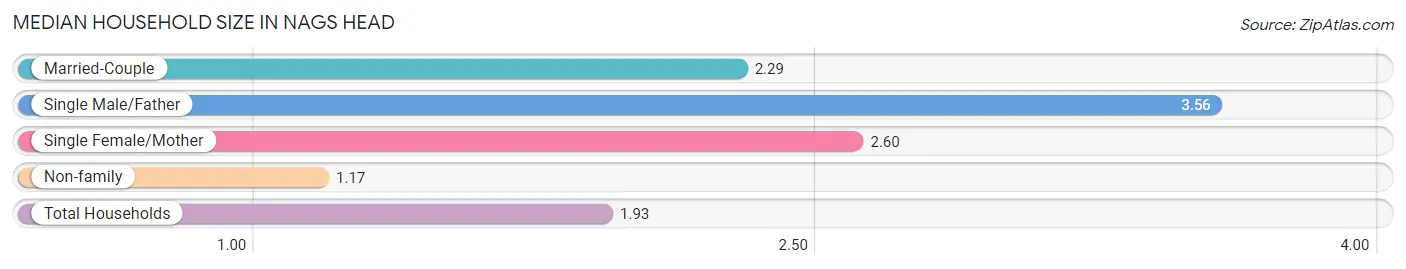
The median household size in Nags Head is 1.93 persons per household, with single male/father households (80 | 5.0%) accounting for the largest median household size of 3.56 persons per household. non-family households (615 | 38.6%) represent the smallest median household size with 1.17 persons per household.
| Household Type | # Households | Household Size |
| Married-Couple | 858 (53.8%) | 2.29 |
| Single Male/Father | 80 (5.0%) | 3.56 |
| Single Female/Mother | 42 (2.6%) | 2.60 |
| Non-family | 615 (38.6%) | 1.17 |
| Total Households | 1,595 (100.0%) | 1.93 |
Household Size by Marriage Status in Nags Head
Out of a total of 1,595 households in Nags Head, 980 (61.4%) are family households, while 615 (38.6%) are nonfamily households. The most numerous type of family households are 2-person households, comprising 741, and the most common type of nonfamily households are 1-person households, comprising 510.
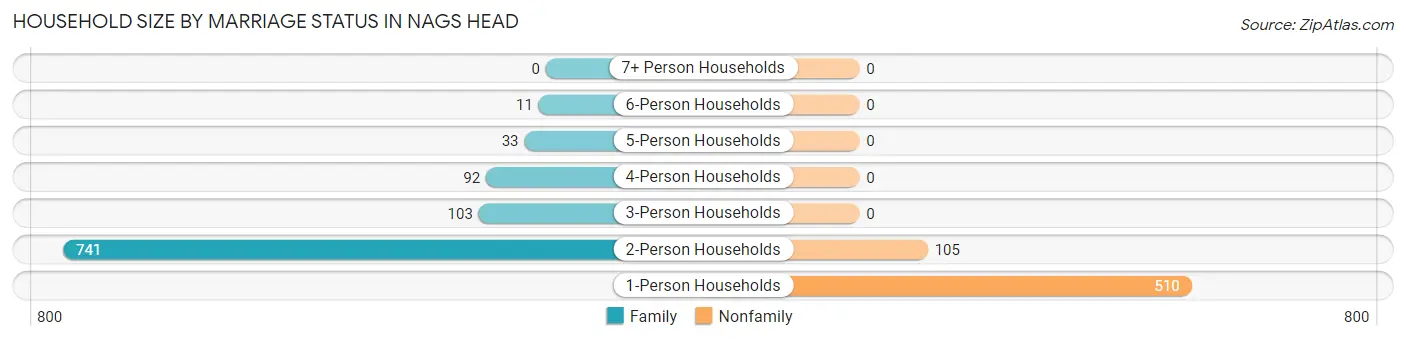
| Household Size | Family Households | Nonfamily Households |
| 1-Person Households | - | 510 (32.0%) |
| 2-Person Households | 741 (46.5%) | 105 (6.6%) |
| 3-Person Households | 103 (6.5%) | 0 (0.0%) |
| 4-Person Households | 92 (5.8%) | 0 (0.0%) |
| 5-Person Households | 33 (2.1%) | 0 (0.0%) |
| 6-Person Households | 11 (0.7%) | 0 (0.0%) |
| 7+ Person Households | 0 (0.0%) | 0 (0.0%) |
| Total | 980 (61.4%) | 615 (38.6%) |
Female Fertility in Nags Head
Fertility by Age in Nags Head
| Age Bracket | Women with Births | Births / 1,000 Women |
| 15 to 19 years | 0 (0.0%) | 0.0 |
| 20 to 34 years | 0 (0.0%) | 0.0 |
| 35 to 50 years | 0 (0.0%) | 0.0 |
| Total | 0 (0.0%) | 0.0 |
Fertility by Age by Marriage Status in Nags Head
| Age Bracket | Married | Unmarried |
| 15 to 19 years | 0 (0.0%) | 0 (0.0%) |
| 20 to 34 years | 0 (0.0%) | 0 (0.0%) |
| 35 to 50 years | 0 (0.0%) | 0 (0.0%) |
| Total | 0 (0.0%) | 0 (0.0%) |
Fertility by Education in Nags Head
| Educational Attainment | Women with Births | Births / 1,000 Women |
| Less than High School | 0 (0.0%) | 0.0 |
| High School Diploma | 0 (0.0%) | 0.0 |
| College or Associate's Degree | 0 (0.0%) | 0.0 |
| Bachelor's Degree | 0 (0.0%) | 0.0 |
| Graduate Degree | 0 (0.0%) | 0.0 |
| Total | 0 (0.0%) | 0.0 |
Fertility by Education by Marriage Status in Nags Head
| Educational Attainment | Married | Unmarried |
| Less than High School | 0 (0.0%) | 0 (0.0%) |
| High School Diploma | 0 (0.0%) | 0 (0.0%) |
| College or Associate's Degree | 0 (0.0%) | 0 (0.0%) |
| Bachelor's Degree | 0 (0.0%) | 0 (0.0%) |
| Graduate Degree | 0 (0.0%) | 0 (0.0%) |
| Total | 0 (0.0%) | 0 (0.0%) |
Employment Characteristics in Nags Head
Employment by Class of Employer in Nags Head
Among the 1,434 employed individuals in Nags Head, private company employees (943 | 65.8%), self-employed (incorporated) (180 | 12.6%), and federal government employees (85 | 5.9%) make up the most common classes of employment.
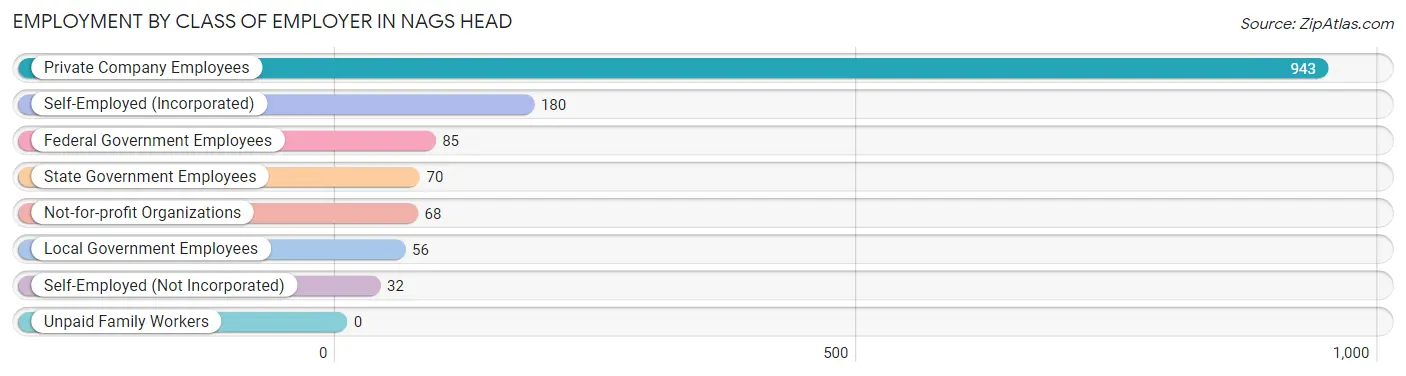
| Employer Class | # Employees | % Employees |
| Private Company Employees | 943 | 65.8% |
| Self-Employed (Incorporated) | 180 | 12.6% |
| Self-Employed (Not Incorporated) | 32 | 2.2% |
| Not-for-profit Organizations | 68 | 4.7% |
| Local Government Employees | 56 | 3.9% |
| State Government Employees | 70 | 4.9% |
| Federal Government Employees | 85 | 5.9% |
| Unpaid Family Workers | 0 | 0.0% |
| Total | 1,434 | 100.0% |
Employment Status by Age in Nags Head
According to the labor force statistics for Nags Head, out of the total population over 16 years of age (2,819), 52.6% or 1,483 individuals are in the labor force, with 1.8% or 27 of them unemployed. The age group with the highest labor force participation rate is 20 to 24 years, with 95.8% or 161 individuals in the labor force. Within the labor force, the 16 to 19 years age range has the highest percentage of unemployed individuals, with 100.0% or 15 of them being unemployed.
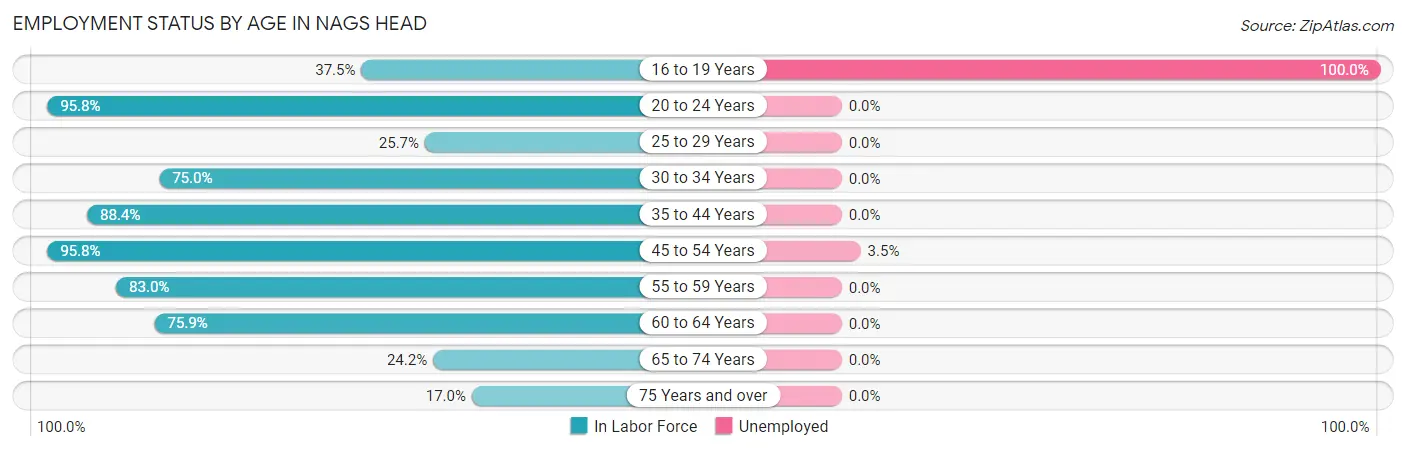
| Age Bracket | In Labor Force | Unemployed |
| 16 to 19 Years | 15 (37.5%) | 15 (100.0%) |
| 20 to 24 Years | 161 (95.8%) | 0 (0.0%) |
| 25 to 29 Years | 27 (25.7%) | 0 (0.0%) |
| 30 to 34 Years | 57 (75.0%) | 0 (0.0%) |
| 35 to 44 Years | 191 (88.4%) | 0 (0.0%) |
| 45 to 54 Years | 341 (95.8%) | 12 (3.5%) |
| 55 to 59 Years | 240 (83.0%) | 0 (0.0%) |
| 60 to 64 Years | 148 (75.9%) | 0 (0.0%) |
| 65 to 74 Years | 234 (24.2%) | 0 (0.0%) |
| 75 Years and over | 69 (17.0%) | 0 (0.0%) |
| Total | 1,483 (52.6%) | 27 (1.8%) |
Employment Status by Educational Attainment in Nags Head
According to labor force statistics for Nags Head, 81.2% of individuals (1,004) out of the total population between 25 and 64 years of age (1,237) are in the labor force, with 1.2% or 12 of them being unemployed. The group with the highest labor force participation rate are those with the educational attainment of college / associate degree, with 91.1% or 276 individuals in the labor force. Within the labor force, individuals with bachelor's degree or higher education have the highest percentage of unemployment, with 2.2% or 12 of them being unemployed.
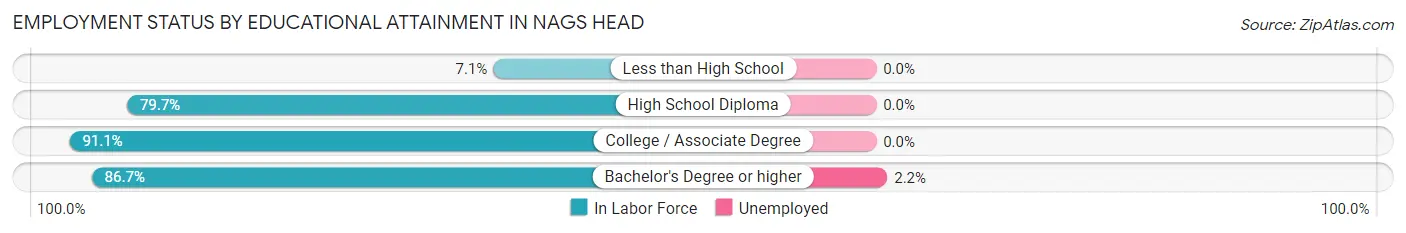
| Educational Attainment | In Labor Force | Unemployed |
| Less than High School | 6 (7.1%) | 0 (0.0%) |
| High School Diploma | 169 (79.7%) | 0 (0.0%) |
| College / Associate Degree | 276 (91.1%) | 0 (0.0%) |
| Bachelor's Degree or higher | 553 (86.7%) | 14 (2.2%) |
| Total | 1,004 (81.2%) | 15 (1.2%) |
Employment Occupations by Sex in Nags Head
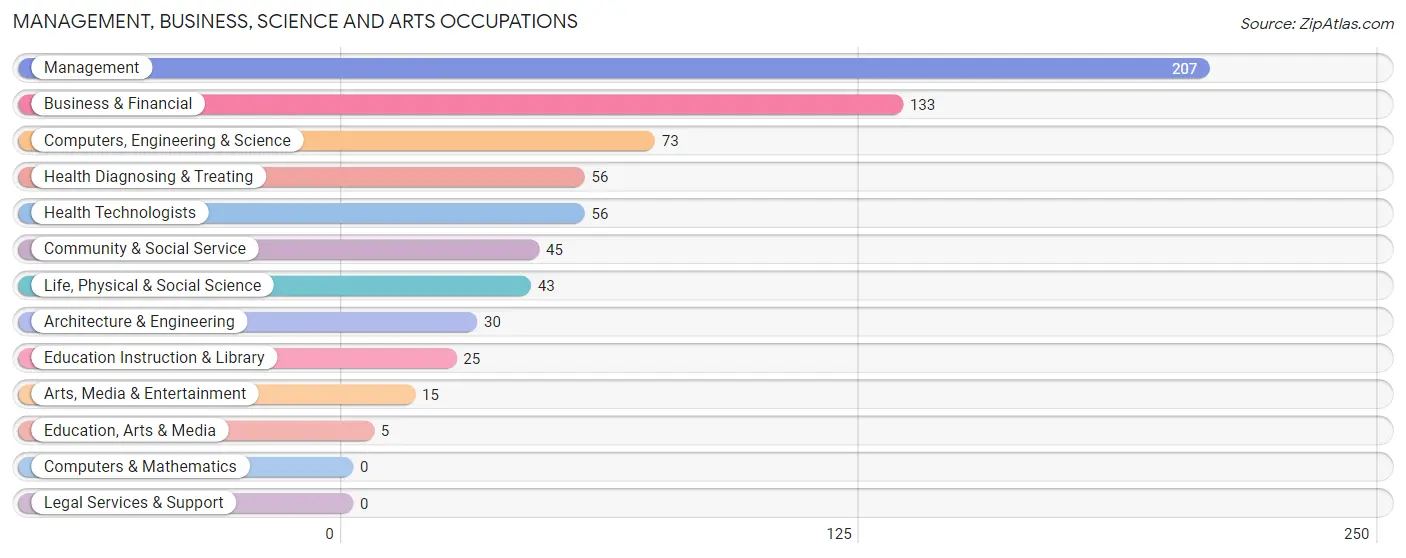
Management, Business, Science and Arts Occupations
The most common Management, Business, Science and Arts occupations in Nags Head are Management (207 | 14.2%), Business & Financial (133 | 9.1%), Computers, Engineering & Science (73 | 5.0%), Health Diagnosing & Treating (56 | 3.8%), and Health Technologists (56 | 3.8%).
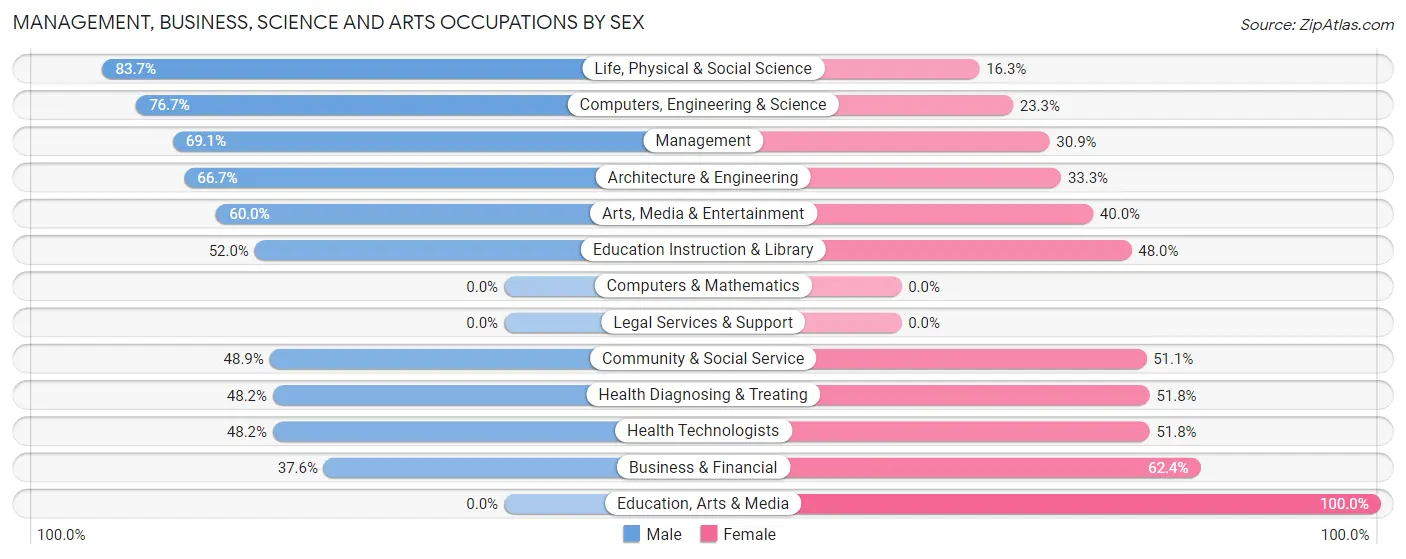
Management, Business, Science and Arts Occupations by Sex
Within the Management, Business, Science and Arts occupations in Nags Head, the most male-oriented occupations are Life, Physical & Social Science (83.7%), Computers, Engineering & Science (76.7%), and Management (69.1%), while the most female-oriented occupations are Education, Arts & Media (100.0%), Business & Financial (62.4%), and Health Diagnosing & Treating (51.8%).
| Occupation | Male | Female |
| Management | 143 (69.1%) | 64 (30.9%) |
| Business & Financial | 50 (37.6%) | 83 (62.4%) |
| Computers, Engineering & Science | 56 (76.7%) | 17 (23.3%) |
| Computers & Mathematics | 0 (0.0%) | 0 (0.0%) |
| Architecture & Engineering | 20 (66.7%) | 10 (33.3%) |
| Life, Physical & Social Science | 36 (83.7%) | 7 (16.3%) |
| Community & Social Service | 22 (48.9%) | 23 (51.1%) |
| Education, Arts & Media | 0 (0.0%) | 5 (100.0%) |
| Legal Services & Support | 0 (0.0%) | 0 (0.0%) |
| Education Instruction & Library | 13 (52.0%) | 12 (48.0%) |
| Arts, Media & Entertainment | 9 (60.0%) | 6 (40.0%) |
| Health Diagnosing & Treating | 27 (48.2%) | 29 (51.8%) |
| Health Technologists | 27 (48.2%) | 29 (51.8%) |
| Total (Category) | 298 (58.0%) | 216 (42.0%) |
| Total (Overall) | 772 (53.0%) | 684 (47.0%) |
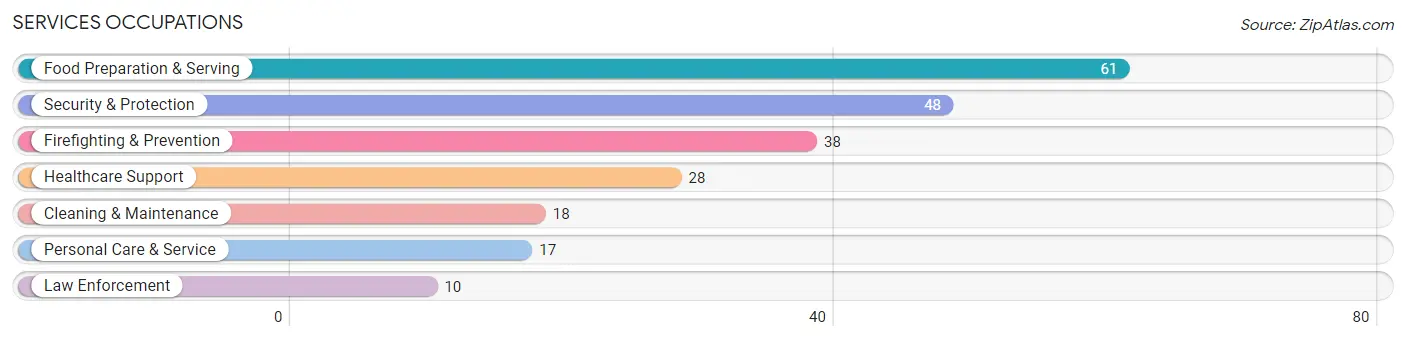
Services Occupations
The most common Services occupations in Nags Head are Food Preparation & Serving (61 | 4.2%), Security & Protection (48 | 3.3%), Firefighting & Prevention (38 | 2.6%), Healthcare Support (28 | 1.9%), and Cleaning & Maintenance (18 | 1.2%).
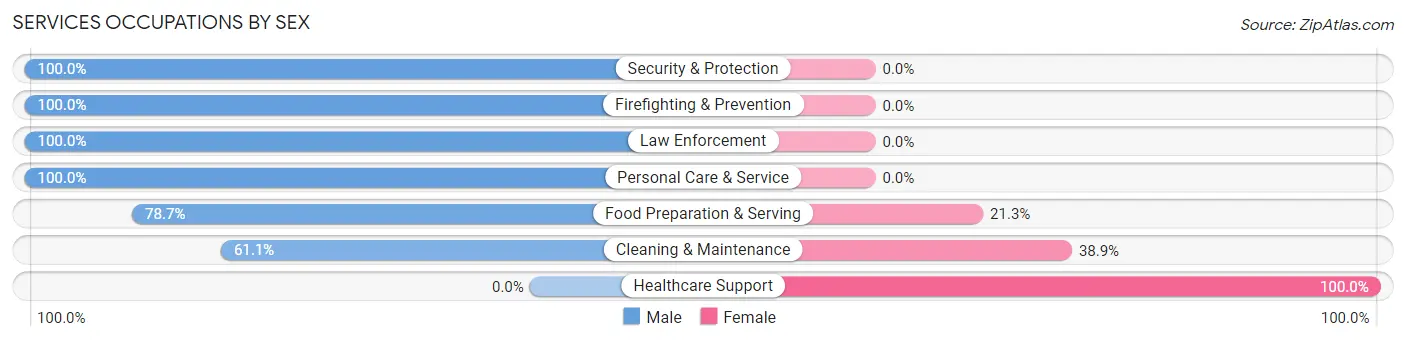
Services Occupations by Sex
Within the Services occupations in Nags Head, the most male-oriented occupations are Security & Protection (100.0%), Firefighting & Prevention (100.0%), and Law Enforcement (100.0%), while the most female-oriented occupations are Healthcare Support (100.0%), Cleaning & Maintenance (38.9%), and Food Preparation & Serving (21.3%).
| Occupation | Male | Female |
| Healthcare Support | 0 (0.0%) | 28 (100.0%) |
| Security & Protection | 48 (100.0%) | 0 (0.0%) |
| Firefighting & Prevention | 38 (100.0%) | 0 (0.0%) |
| Law Enforcement | 10 (100.0%) | 0 (0.0%) |
| Food Preparation & Serving | 48 (78.7%) | 13 (21.3%) |
| Cleaning & Maintenance | 11 (61.1%) | 7 (38.9%) |
| Personal Care & Service | 17 (100.0%) | 0 (0.0%) |
| Total (Category) | 124 (72.1%) | 48 (27.9%) |
| Total (Overall) | 772 (53.0%) | 684 (47.0%) |
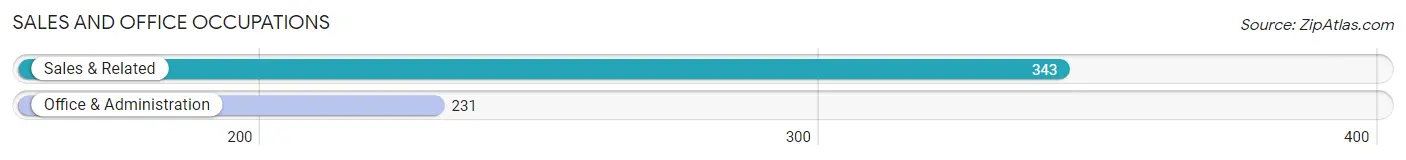
Sales and Office Occupations
The most common Sales and Office occupations in Nags Head are Sales & Related (343 | 23.6%), and Office & Administration (231 | 15.9%).
Sales and Office Occupations by Sex
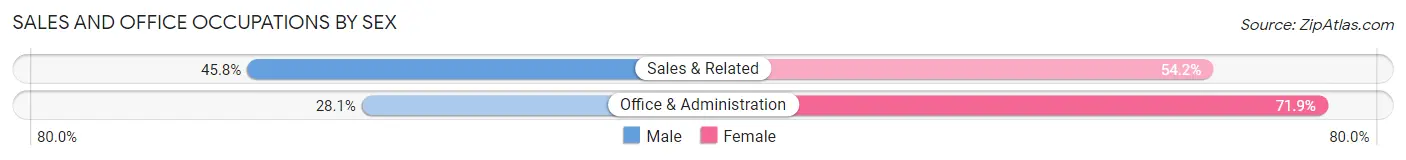
| Occupation | Male | Female |
| Sales & Related | 157 (45.8%) | 186 (54.2%) |
| Office & Administration | 65 (28.1%) | 166 (71.9%) |
| Total (Category) | 222 (38.7%) | 352 (61.3%) |
| Total (Overall) | 772 (53.0%) | 684 (47.0%) |
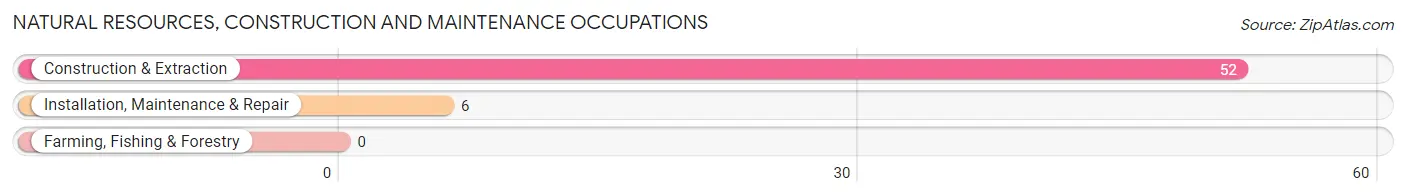
Natural Resources, Construction and Maintenance Occupations
The most common Natural Resources, Construction and Maintenance occupations in Nags Head are Construction & Extraction (52 | 3.6%), and Installation, Maintenance & Repair (6 | 0.4%).
Natural Resources, Construction and Maintenance Occupations by Sex
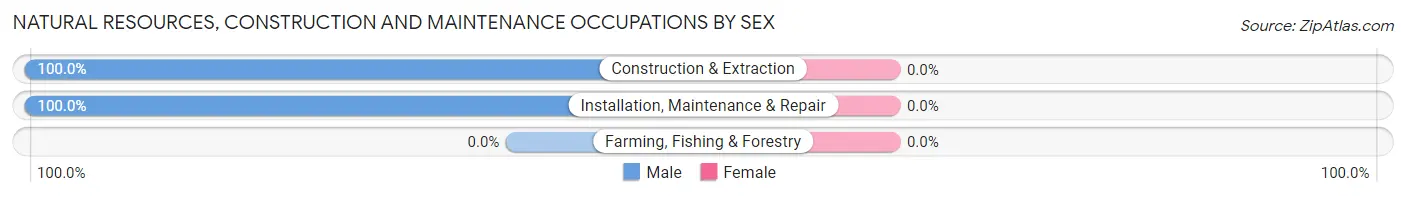
| Occupation | Male | Female |
| Farming, Fishing & Forestry | 0 (0.0%) | 0 (0.0%) |
| Construction & Extraction | 52 (100.0%) | 0 (0.0%) |
| Installation, Maintenance & Repair | 6 (100.0%) | 0 (0.0%) |
| Total (Category) | 58 (100.0%) | 0 (0.0%) |
| Total (Overall) | 772 (53.0%) | 684 (47.0%) |
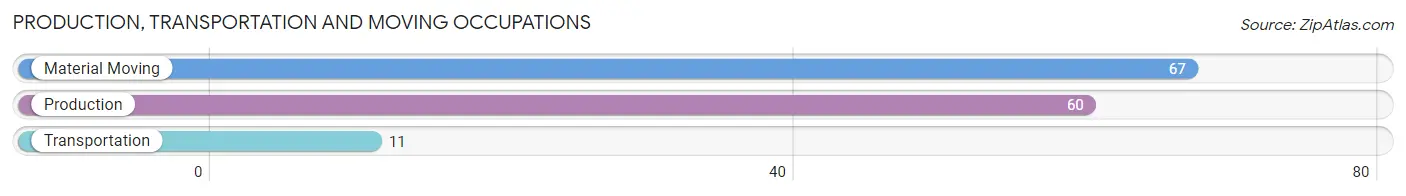
Production, Transportation and Moving Occupations
The most common Production, Transportation and Moving occupations in Nags Head are Material Moving (67 | 4.6%), Production (60 | 4.1%), and Transportation (11 | 0.8%).
Production, Transportation and Moving Occupations by Sex
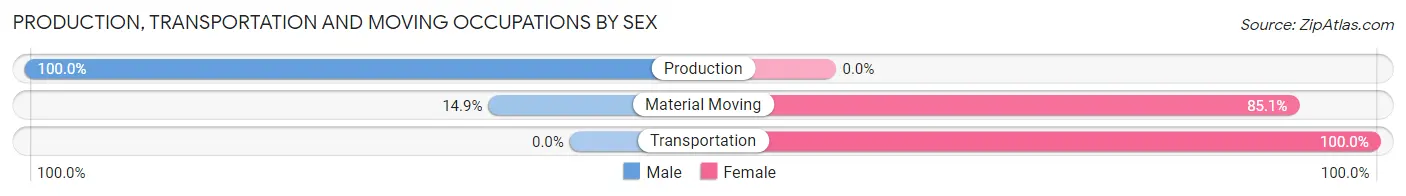
| Occupation | Male | Female |
| Production | 60 (100.0%) | 0 (0.0%) |
| Transportation | 0 (0.0%) | 11 (100.0%) |
| Material Moving | 10 (14.9%) | 57 (85.1%) |
| Total (Category) | 70 (50.7%) | 68 (49.3%) |
| Total (Overall) | 772 (53.0%) | 684 (47.0%) |
Employment Industries by Sex in Nags Head
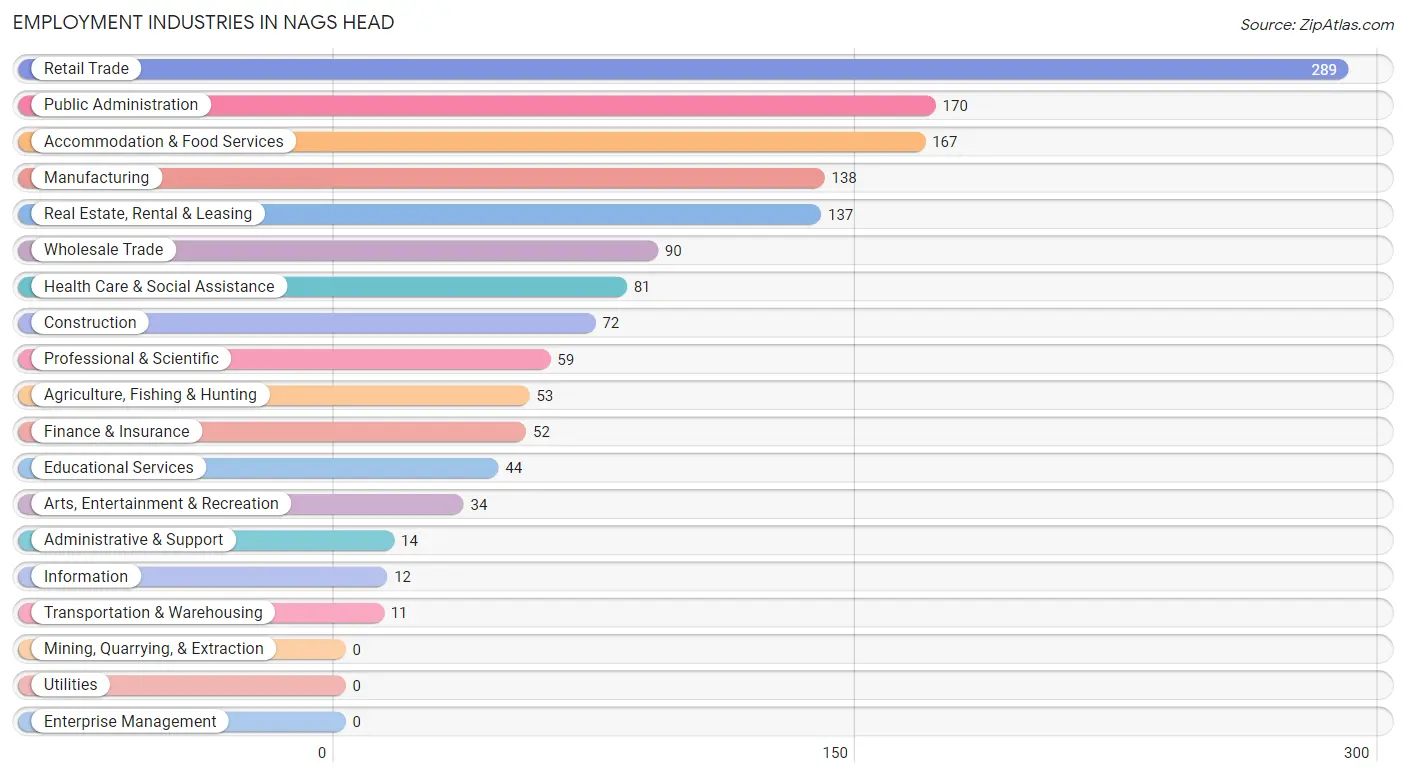
Employment Industries in Nags Head
The major employment industries in Nags Head include Retail Trade (289 | 19.9%), Public Administration (170 | 11.7%), Accommodation & Food Services (167 | 11.5%), Manufacturing (138 | 9.5%), and Real Estate, Rental & Leasing (137 | 9.4%).
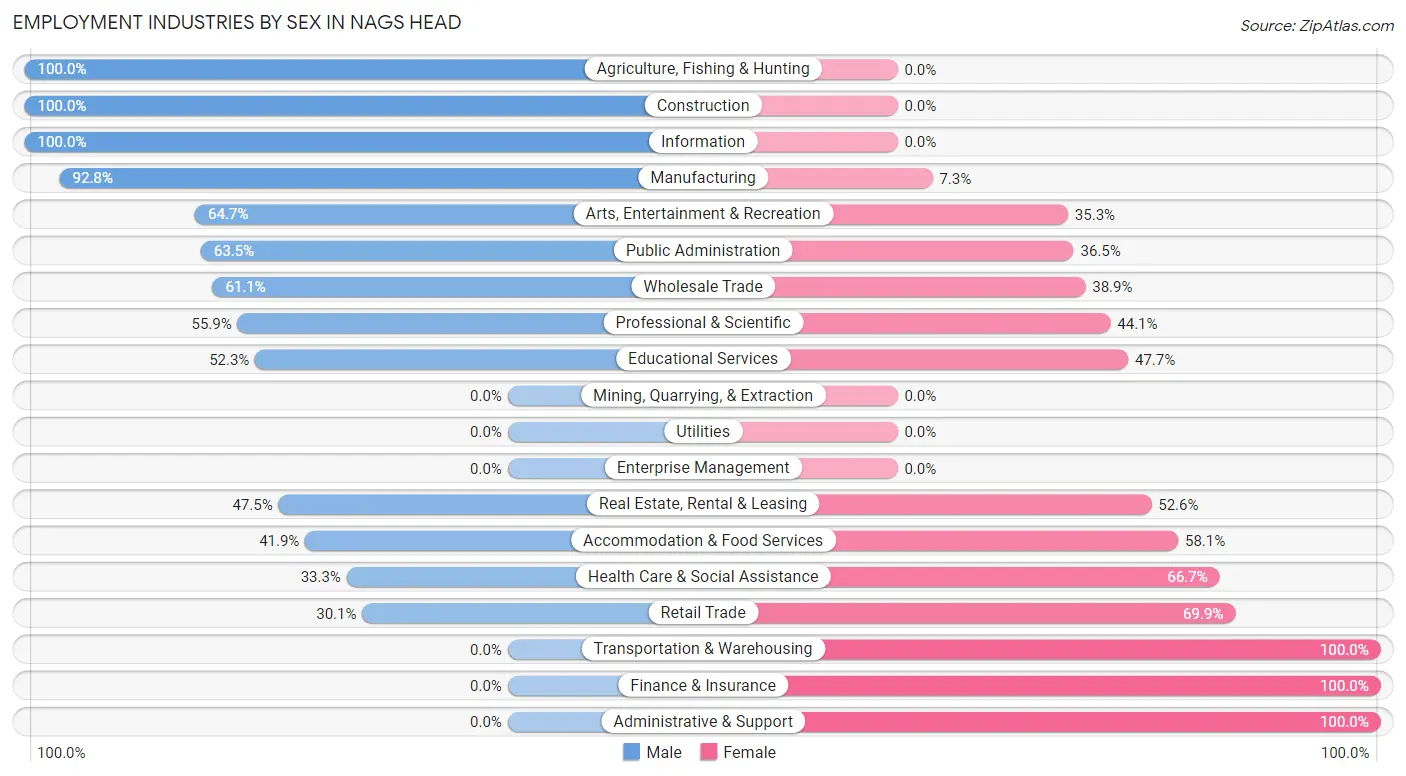
Employment Industries by Sex in Nags Head
The Nags Head industries that see more men than women are Agriculture, Fishing & Hunting (100.0%), Construction (100.0%), and Information (100.0%), whereas the industries that tend to have a higher number of women are Transportation & Warehousing (100.0%), Finance & Insurance (100.0%), and Administrative & Support (100.0%).
| Industry | Male | Female |
| Agriculture, Fishing & Hunting | 53 (100.0%) | 0 (0.0%) |
| Mining, Quarrying, & Extraction | 0 (0.0%) | 0 (0.0%) |
| Construction | 72 (100.0%) | 0 (0.0%) |
| Manufacturing | 128 (92.7%) | 10 (7.2%) |
| Wholesale Trade | 55 (61.1%) | 35 (38.9%) |
| Retail Trade | 87 (30.1%) | 202 (69.9%) |
| Transportation & Warehousing | 0 (0.0%) | 11 (100.0%) |
| Utilities | 0 (0.0%) | 0 (0.0%) |
| Information | 12 (100.0%) | 0 (0.0%) |
| Finance & Insurance | 0 (0.0%) | 52 (100.0%) |
| Real Estate, Rental & Leasing | 65 (47.4%) | 72 (52.5%) |
| Professional & Scientific | 33 (55.9%) | 26 (44.1%) |
| Enterprise Management | 0 (0.0%) | 0 (0.0%) |
| Administrative & Support | 0 (0.0%) | 14 (100.0%) |
| Educational Services | 23 (52.3%) | 21 (47.7%) |
| Health Care & Social Assistance | 27 (33.3%) | 54 (66.7%) |
| Arts, Entertainment & Recreation | 22 (64.7%) | 12 (35.3%) |
| Accommodation & Food Services | 70 (41.9%) | 97 (58.1%) |
| Public Administration | 108 (63.5%) | 62 (36.5%) |
| Total | 772 (53.0%) | 684 (47.0%) |
Education in Nags Head
School Enrollment in Nags Head
The most common levels of schooling among the 366 students in Nags Head are middle school (173 | 47.3%), high school (54 | 14.7%), and kindergarten (40 | 10.9%).
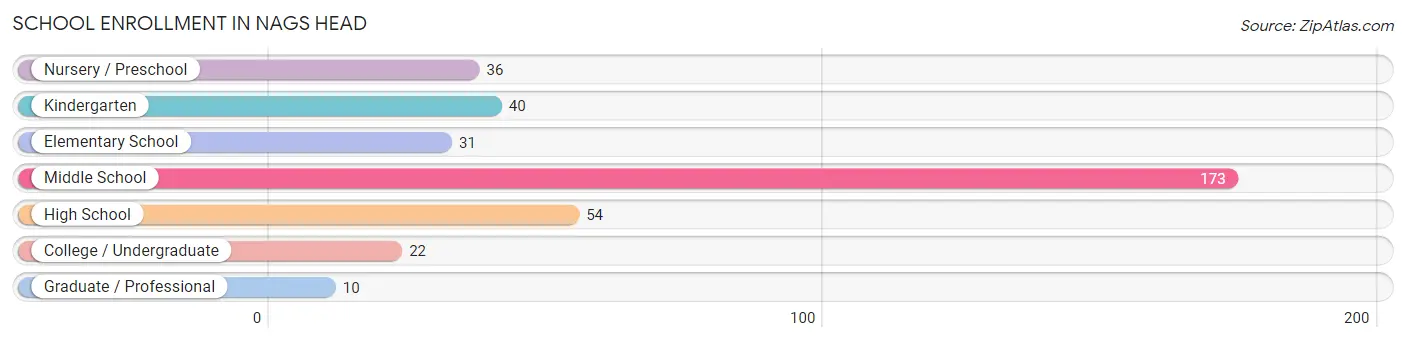
| School Level | # Students | % Students |
| Nursery / Preschool | 36 | 9.8% |
| Kindergarten | 40 | 10.9% |
| Elementary School | 31 | 8.5% |
| Middle School | 173 | 47.3% |
| High School | 54 | 14.7% |
| College / Undergraduate | 22 | 6.0% |
| Graduate / Professional | 10 | 2.7% |
| Total | 366 | 100.0% |
School Enrollment by Age by Funding Source in Nags Head
Out of a total of 366 students who are enrolled in schools in Nags Head, 62 (16.9%) attend a private institution, while the remaining 304 (83.1%) are enrolled in public schools. The age group of 5 to 9 year old has the highest likelihood of being enrolled in private schools, with 53 (49.5% in the age bracket) enrolled. Conversely, the age group of 15 to 17 year olds has the lowest likelihood of being enrolled in a private school, with 40 (100.0% in the age bracket) attending a public institution.
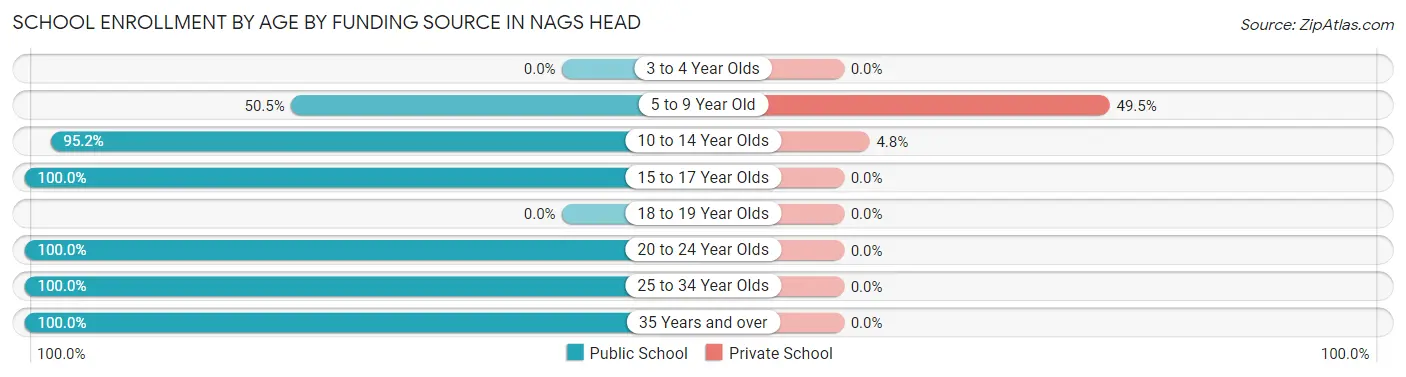
| Age Bracket | Public School | Private School |
| 3 to 4 Year Olds | 0 (0.0%) | 0 (0.0%) |
| 5 to 9 Year Old | 54 (50.5%) | 53 (49.5%) |
| 10 to 14 Year Olds | 178 (95.2%) | 9 (4.8%) |
| 15 to 17 Year Olds | 40 (100.0%) | 0 (0.0%) |
| 18 to 19 Year Olds | 0 (0.0%) | 0 (0.0%) |
| 20 to 24 Year Olds | 9 (100.0%) | 0 (0.0%) |
| 25 to 34 Year Olds | 9 (100.0%) | 0 (0.0%) |
| 35 Years and over | 14 (100.0%) | 0 (0.0%) |
| Total | 304 (83.1%) | 62 (16.9%) |
Educational Attainment by Field of Study in Nags Head
Education (345 | 23.2%), business (204 | 13.7%), science & technology (199 | 13.4%), bio, nature & agricultural (141 | 9.5%), and visual & performing arts (132 | 8.9%) are the most common fields of study among 1,487 individuals in Nags Head who have obtained a bachelor's degree or higher.
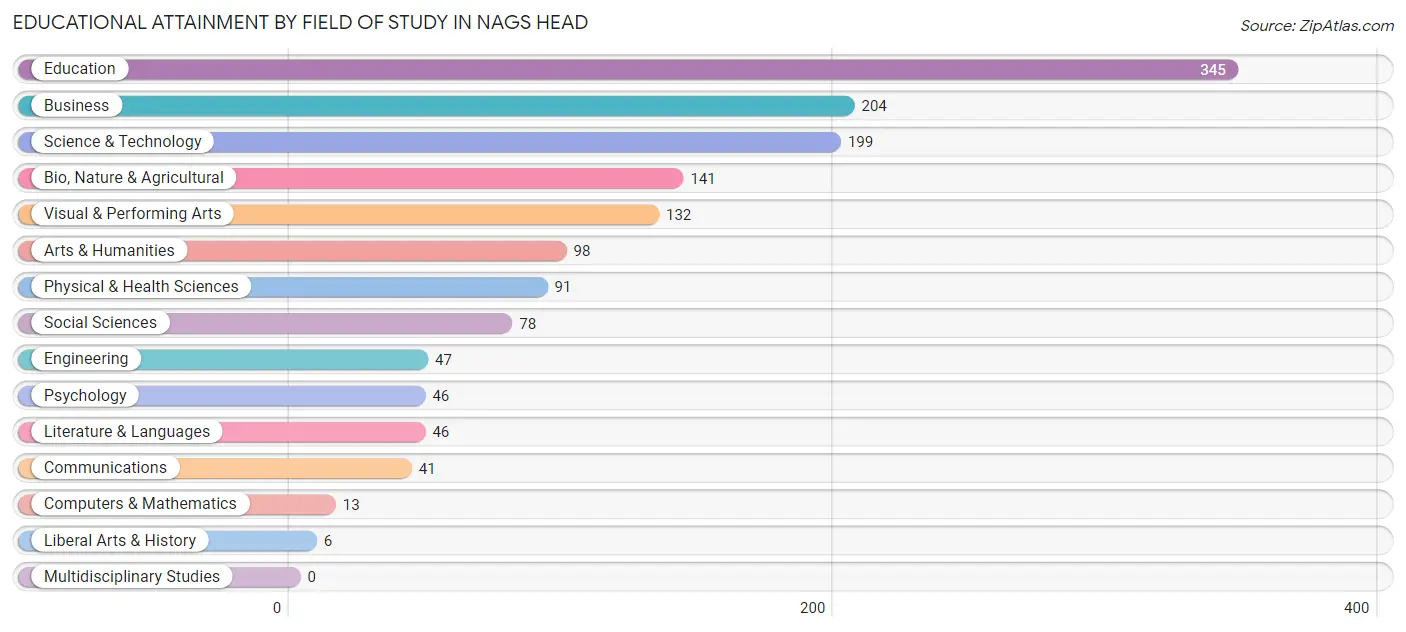
| Field of Study | # Graduates | % Graduates |
| Computers & Mathematics | 13 | 0.9% |
| Bio, Nature & Agricultural | 141 | 9.5% |
| Physical & Health Sciences | 91 | 6.1% |
| Psychology | 46 | 3.1% |
| Social Sciences | 78 | 5.2% |
| Engineering | 47 | 3.2% |
| Multidisciplinary Studies | 0 | 0.0% |
| Science & Technology | 199 | 13.4% |
| Business | 204 | 13.7% |
| Education | 345 | 23.2% |
| Literature & Languages | 46 | 3.1% |
| Liberal Arts & History | 6 | 0.4% |
| Visual & Performing Arts | 132 | 8.9% |
| Communications | 41 | 2.8% |
| Arts & Humanities | 98 | 6.6% |
| Total | 1,487 | 100.0% |
Transportation & Commute in Nags Head
Vehicle Availability by Sex in Nags Head
The most prevalent vehicle ownership categories in Nags Head are males with 2 vehicles (331, accounting for 44.1%) and females with 2 vehicles (420, making up 48.4%).
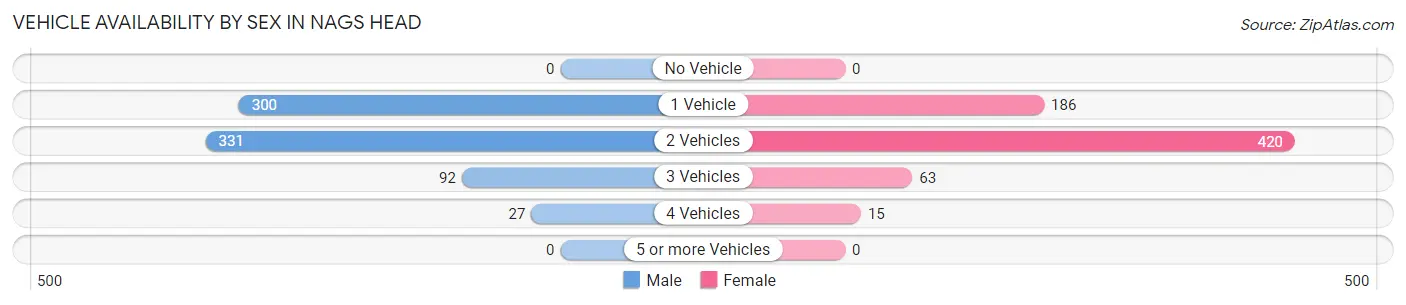
| Vehicles Available | Male | Female |
| No Vehicle | 0 (0.0%) | 0 (0.0%) |
| 1 Vehicle | 300 (40.0%) | 186 (27.2%) |
| 2 Vehicles | 331 (44.1%) | 420 (61.4%) |
| 3 Vehicles | 92 (12.3%) | 63 (9.2%) |
| 4 Vehicles | 27 (3.6%) | 15 (2.2%) |
| 5 or more Vehicles | 0 (0.0%) | 0 (0.0%) |
| Total | 750 (100.0%) | 684 (100.0%) |
Commute Time in Nags Head
The most frequently occuring commute durations in Nags Head are 5 to 9 minutes (362 commuters, 29.4%), 10 to 14 minutes (158 commuters, 12.9%), and 25 to 29 minutes (158 commuters, 12.9%).
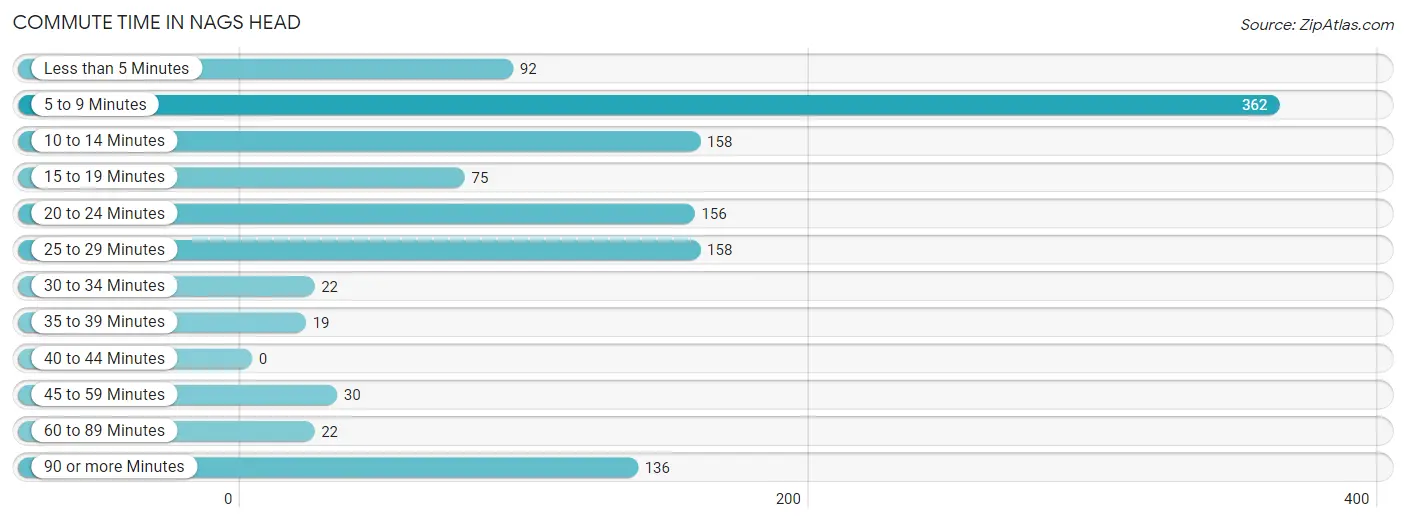
| Commute Time | # Commuters | % Commuters |
| Less than 5 Minutes | 92 | 7.5% |
| 5 to 9 Minutes | 362 | 29.4% |
| 10 to 14 Minutes | 158 | 12.9% |
| 15 to 19 Minutes | 75 | 6.1% |
| 20 to 24 Minutes | 156 | 12.7% |
| 25 to 29 Minutes | 158 | 12.9% |
| 30 to 34 Minutes | 22 | 1.8% |
| 35 to 39 Minutes | 19 | 1.5% |
| 40 to 44 Minutes | 0 | 0.0% |
| 45 to 59 Minutes | 30 | 2.4% |
| 60 to 89 Minutes | 22 | 1.8% |
| 90 or more Minutes | 136 | 11.1% |
Commute Time by Sex in Nags Head
The most common commute times in Nags Head are 20 to 24 minutes (123 commuters, 19.7%) for males and 5 to 9 minutes (279 commuters, 46.2%) for females.
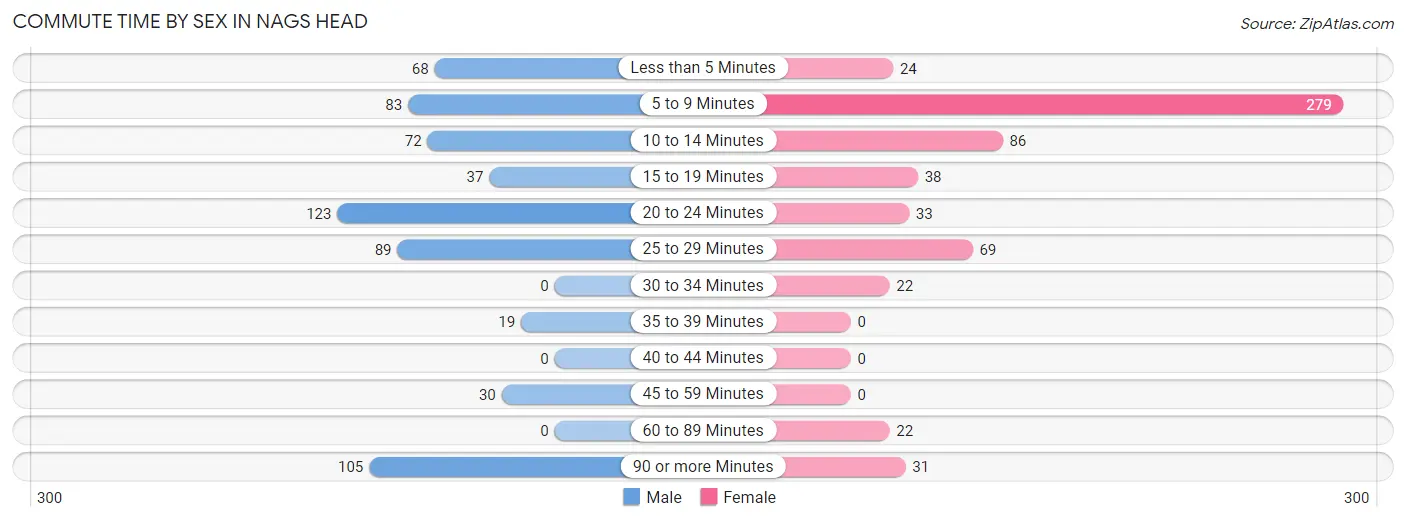
| Commute Time | Male | Female |
| Less than 5 Minutes | 68 (10.9%) | 24 (4.0%) |
| 5 to 9 Minutes | 83 (13.3%) | 279 (46.2%) |
| 10 to 14 Minutes | 72 (11.5%) | 86 (14.2%) |
| 15 to 19 Minutes | 37 (5.9%) | 38 (6.3%) |
| 20 to 24 Minutes | 123 (19.7%) | 33 (5.5%) |
| 25 to 29 Minutes | 89 (14.2%) | 69 (11.4%) |
| 30 to 34 Minutes | 0 (0.0%) | 22 (3.6%) |
| 35 to 39 Minutes | 19 (3.0%) | 0 (0.0%) |
| 40 to 44 Minutes | 0 (0.0%) | 0 (0.0%) |
| 45 to 59 Minutes | 30 (4.8%) | 0 (0.0%) |
| 60 to 89 Minutes | 0 (0.0%) | 22 (3.6%) |
| 90 or more Minutes | 105 (16.8%) | 31 (5.1%) |
Time of Departure to Work by Sex in Nags Head
The most frequent times of departure to work in Nags Head are 7:30 AM to 7:59 AM (165, 26.4%) for males and 7:30 AM to 7:59 AM (153, 25.3%) for females.
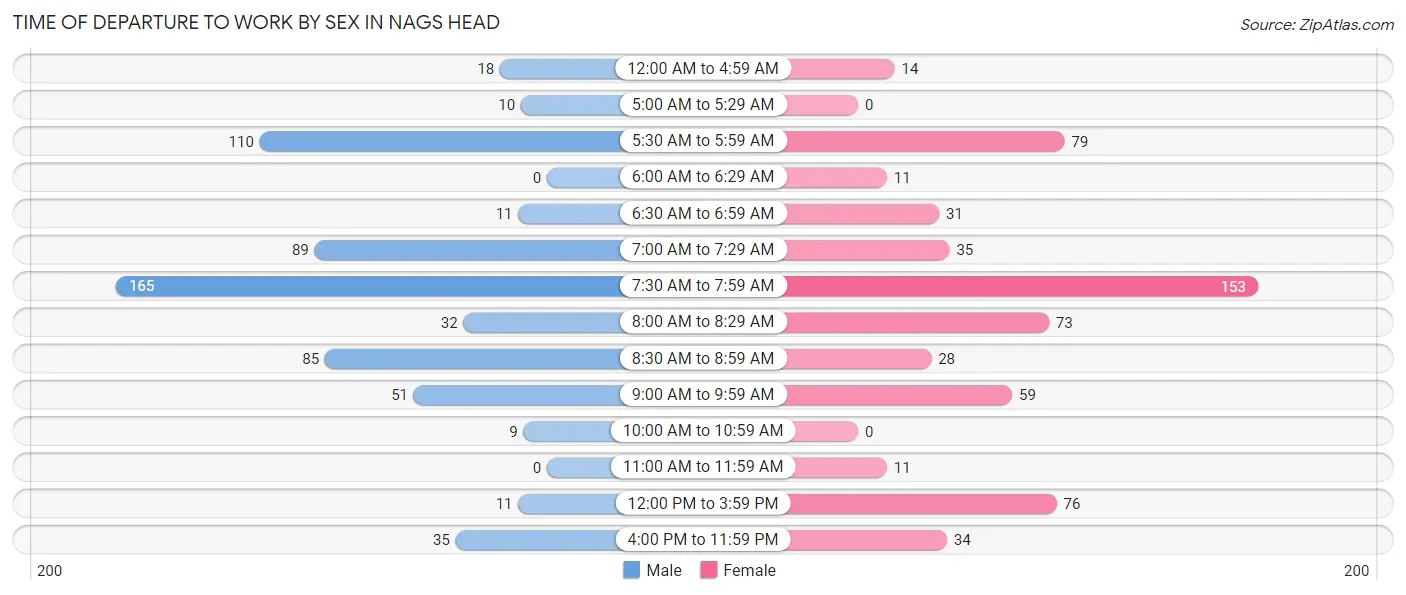
| Time of Departure | Male | Female |
| 12:00 AM to 4:59 AM | 18 (2.9%) | 14 (2.3%) |
| 5:00 AM to 5:29 AM | 10 (1.6%) | 0 (0.0%) |
| 5:30 AM to 5:59 AM | 110 (17.6%) | 79 (13.1%) |
| 6:00 AM to 6:29 AM | 0 (0.0%) | 11 (1.8%) |
| 6:30 AM to 6:59 AM | 11 (1.8%) | 31 (5.1%) |
| 7:00 AM to 7:29 AM | 89 (14.2%) | 35 (5.8%) |
| 7:30 AM to 7:59 AM | 165 (26.4%) | 153 (25.3%) |
| 8:00 AM to 8:29 AM | 32 (5.1%) | 73 (12.1%) |
| 8:30 AM to 8:59 AM | 85 (13.6%) | 28 (4.6%) |
| 9:00 AM to 9:59 AM | 51 (8.2%) | 59 (9.8%) |
| 10:00 AM to 10:59 AM | 9 (1.4%) | 0 (0.0%) |
| 11:00 AM to 11:59 AM | 0 (0.0%) | 11 (1.8%) |
| 12:00 PM to 3:59 PM | 11 (1.8%) | 76 (12.6%) |
| 4:00 PM to 11:59 PM | 35 (5.6%) | 34 (5.6%) |
| Total | 626 (100.0%) | 604 (100.0%) |
Housing Occupancy in Nags Head
Occupancy by Ownership in Nags Head
Of the total 1,595 dwellings in Nags Head, owner-occupied units account for 1,287 (80.7%), while renter-occupied units make up 308 (19.3%).
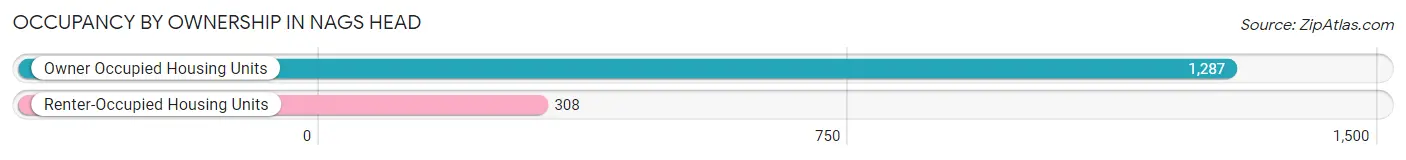
| Occupancy | # Housing Units | % Housing Units |
| Owner Occupied Housing Units | 1,287 | 80.7% |
| Renter-Occupied Housing Units | 308 | 19.3% |
| Total Occupied Housing Units | 1,595 | 100.0% |
Occupancy by Household Size in Nags Head
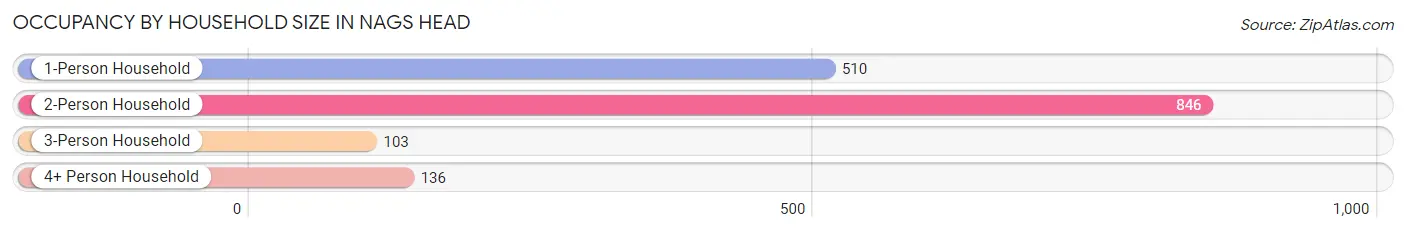
| Household Size | # Housing Units | % Housing Units |
| 1-Person Household | 510 | 32.0% |
| 2-Person Household | 846 | 53.0% |
| 3-Person Household | 103 | 6.5% |
| 4+ Person Household | 136 | 8.5% |
| Total Housing Units | 1,595 | 100.0% |
Occupancy by Ownership by Household Size in Nags Head
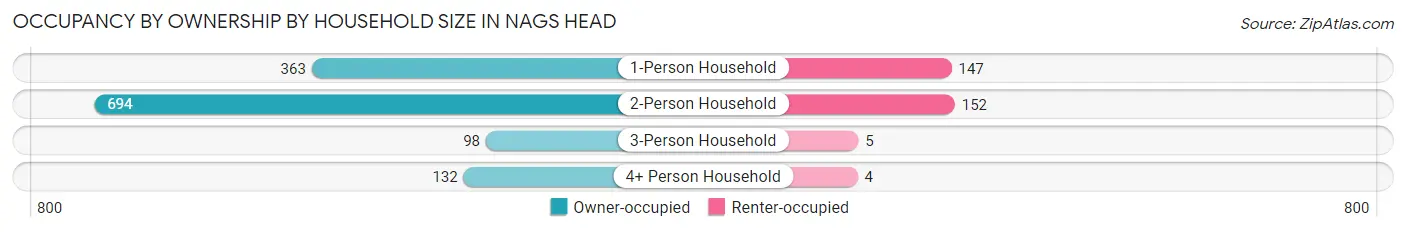
| Household Size | Owner-occupied | Renter-occupied |
| 1-Person Household | 363 (71.2%) | 147 (28.8%) |
| 2-Person Household | 694 (82.0%) | 152 (18.0%) |
| 3-Person Household | 98 (95.2%) | 5 (4.9%) |
| 4+ Person Household | 132 (97.1%) | 4 (2.9%) |
| Total Housing Units | 1,287 (80.7%) | 308 (19.3%) |
Occupancy by Educational Attainment in Nags Head
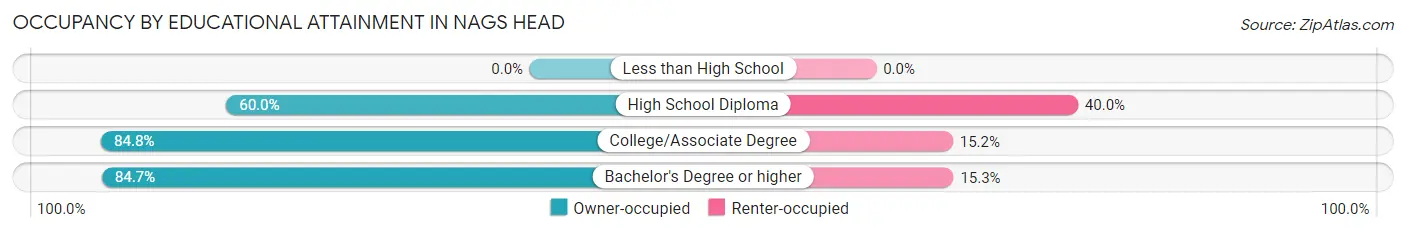
| Household Size | Owner-occupied | Renter-occupied |
| Less than High School | 0 (0.0%) | 0 (0.0%) |
| High School Diploma | 156 (60.0%) | 104 (40.0%) |
| College/Associate Degree | 335 (84.8%) | 60 (15.2%) |
| Bachelor's Degree or higher | 796 (84.7%) | 144 (15.3%) |
Occupancy by Age of Householder in Nags Head
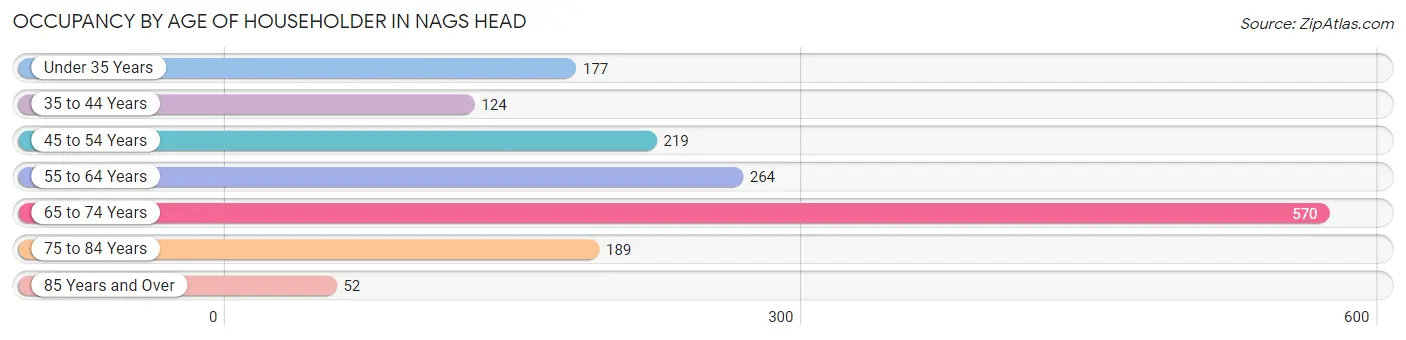
| Age Bracket | # Households | % Households |
| Under 35 Years | 177 | 11.1% |
| 35 to 44 Years | 124 | 7.8% |
| 45 to 54 Years | 219 | 13.7% |
| 55 to 64 Years | 264 | 16.6% |
| 65 to 74 Years | 570 | 35.7% |
| 75 to 84 Years | 189 | 11.8% |
| 85 Years and Over | 52 | 3.3% |
| Total | 1,595 | 100.0% |
Housing Finances in Nags Head
Median Income by Occupancy in Nags Head
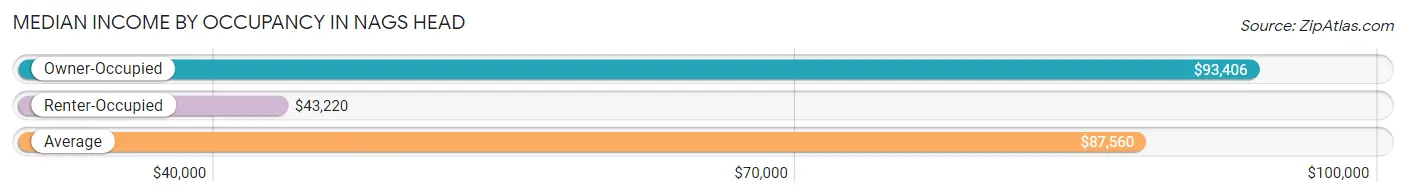
| Occupancy Type | # Households | Median Income |
| Owner-Occupied | 1,287 (80.7%) | $93,406 |
| Renter-Occupied | 308 (19.3%) | $43,220 |
| Average | 1,595 (100.0%) | $87,560 |
Occupancy by Householder Income Bracket in Nags Head
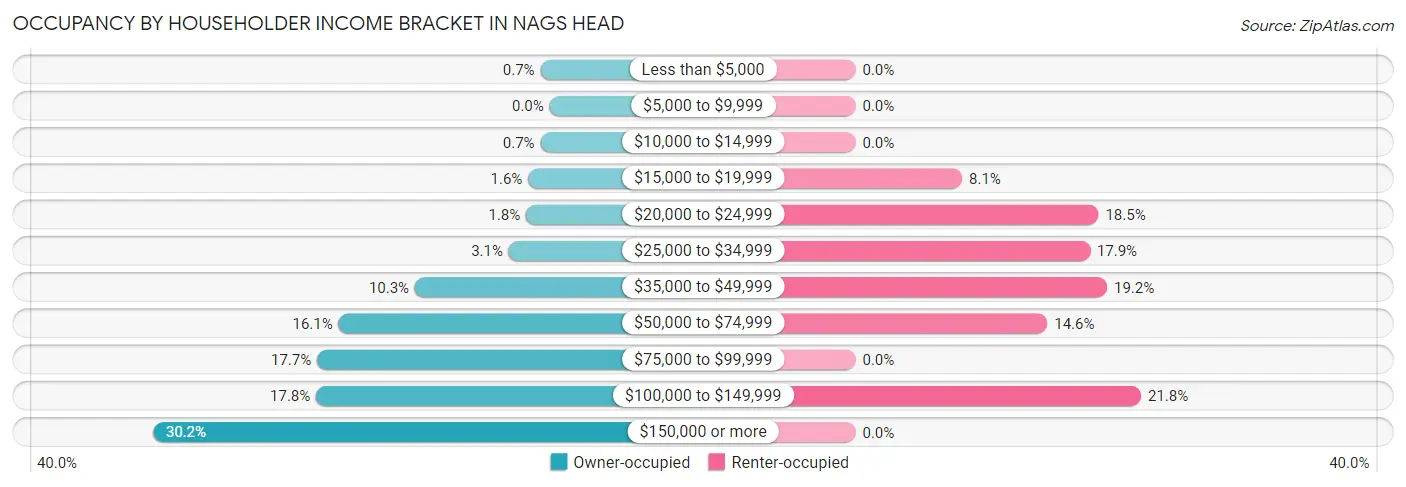
| Income Bracket | Owner-occupied | Renter-occupied |
| Less than $5,000 | 9 (0.7%) | 0 (0.0%) |
| $5,000 to $9,999 | 0 (0.0%) | 0 (0.0%) |
| $10,000 to $14,999 | 9 (0.7%) | 0 (0.0%) |
| $15,000 to $19,999 | 21 (1.6%) | 25 (8.1%) |
| $20,000 to $24,999 | 23 (1.8%) | 57 (18.5%) |
| $25,000 to $34,999 | 40 (3.1%) | 55 (17.9%) |
| $35,000 to $49,999 | 132 (10.3%) | 59 (19.2%) |
| $50,000 to $74,999 | 207 (16.1%) | 45 (14.6%) |
| $75,000 to $99,999 | 228 (17.7%) | 0 (0.0%) |
| $100,000 to $149,999 | 229 (17.8%) | 67 (21.7%) |
| $150,000 or more | 389 (30.2%) | 0 (0.0%) |
| Total | 1,287 (100.0%) | 308 (100.0%) |
Monthly Housing Cost Tiers in Nags Head
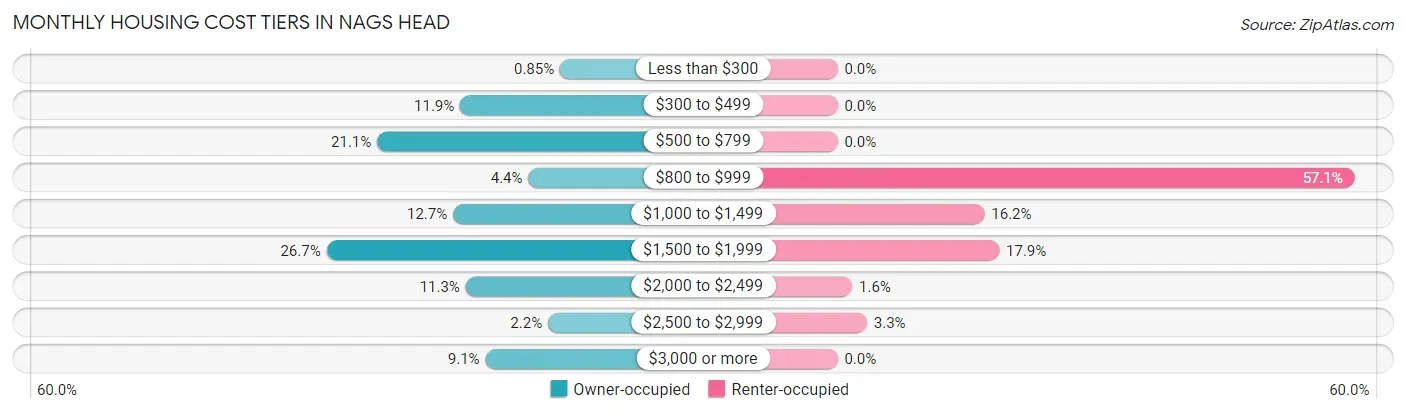
| Monthly Cost | Owner-occupied | Renter-occupied |
| Less than $300 | 11 (0.9%) | 0 (0.0%) |
| $300 to $499 | 153 (11.9%) | 0 (0.0%) |
| $500 to $799 | 271 (21.1%) | 0 (0.0%) |
| $800 to $999 | 56 (4.3%) | 176 (57.1%) |
| $1,000 to $1,499 | 163 (12.7%) | 50 (16.2%) |
| $1,500 to $1,999 | 343 (26.7%) | 55 (17.9%) |
| $2,000 to $2,499 | 145 (11.3%) | 5 (1.6%) |
| $2,500 to $2,999 | 28 (2.2%) | 10 (3.3%) |
| $3,000 or more | 117 (9.1%) | 0 (0.0%) |
| Total | 1,287 (100.0%) | 308 (100.0%) |
Physical Housing Characteristics in Nags Head
Housing Structures in Nags Head
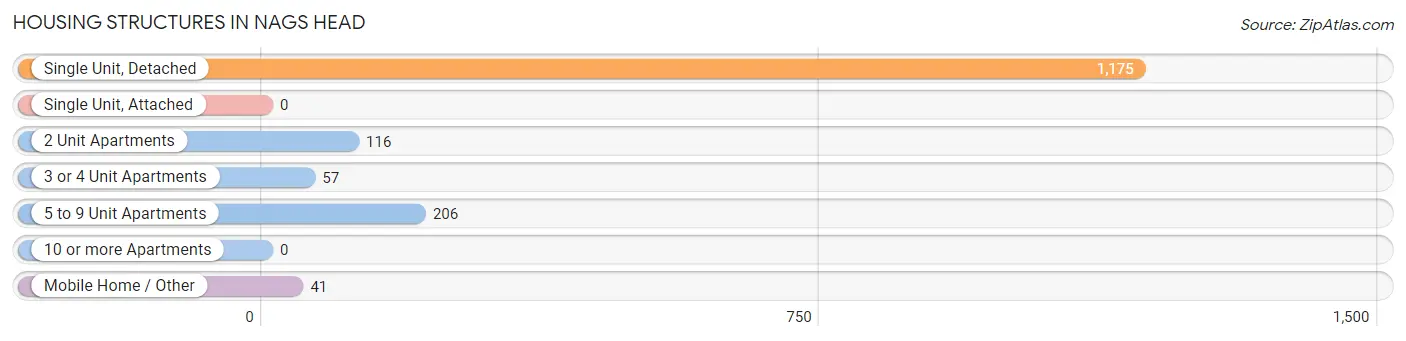
| Structure Type | # Housing Units | % Housing Units |
| Single Unit, Detached | 1,175 | 73.7% |
| Single Unit, Attached | 0 | 0.0% |
| 2 Unit Apartments | 116 | 7.3% |
| 3 or 4 Unit Apartments | 57 | 3.6% |
| 5 to 9 Unit Apartments | 206 | 12.9% |
| 10 or more Apartments | 0 | 0.0% |
| Mobile Home / Other | 41 | 2.6% |
| Total | 1,595 | 100.0% |
Housing Structures by Occupancy in Nags Head
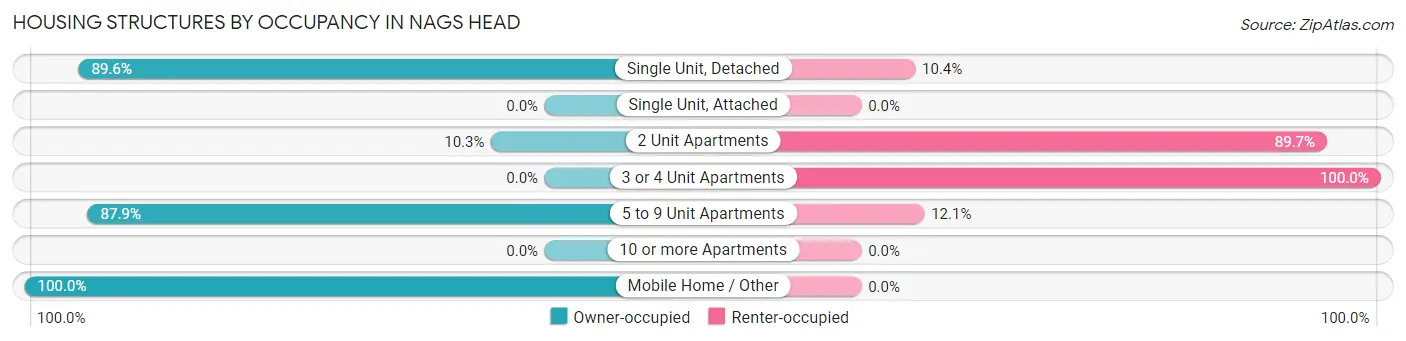
| Structure Type | Owner-occupied | Renter-occupied |
| Single Unit, Detached | 1,053 (89.6%) | 122 (10.4%) |
| Single Unit, Attached | 0 (0.0%) | 0 (0.0%) |
| 2 Unit Apartments | 12 (10.3%) | 104 (89.7%) |
| 3 or 4 Unit Apartments | 0 (0.0%) | 57 (100.0%) |
| 5 to 9 Unit Apartments | 181 (87.9%) | 25 (12.1%) |
| 10 or more Apartments | 0 (0.0%) | 0 (0.0%) |
| Mobile Home / Other | 41 (100.0%) | 0 (0.0%) |
| Total | 1,287 (80.7%) | 308 (19.3%) |
Housing Structures by Number of Rooms in Nags Head
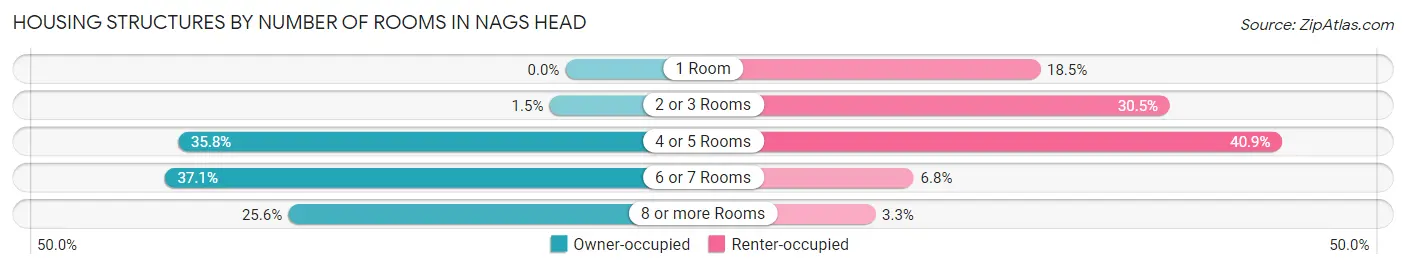
| Number of Rooms | Owner-occupied | Renter-occupied |
| 1 Room | 0 (0.0%) | 57 (18.5%) |
| 2 or 3 Rooms | 19 (1.5%) | 94 (30.5%) |
| 4 or 5 Rooms | 461 (35.8%) | 126 (40.9%) |
| 6 or 7 Rooms | 477 (37.1%) | 21 (6.8%) |
| 8 or more Rooms | 330 (25.6%) | 10 (3.3%) |
| Total | 1,287 (100.0%) | 308 (100.0%) |
Housing Structure by Heating Type in Nags Head
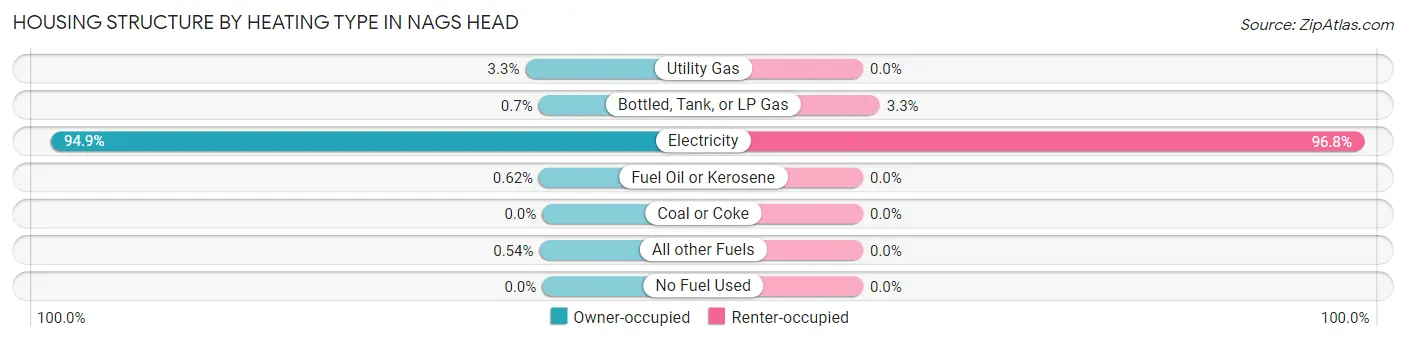
| Heating Type | Owner-occupied | Renter-occupied |
| Utility Gas | 42 (3.3%) | 0 (0.0%) |
| Bottled, Tank, or LP Gas | 9 (0.7%) | 10 (3.3%) |
| Electricity | 1,221 (94.9%) | 298 (96.8%) |
| Fuel Oil or Kerosene | 8 (0.6%) | 0 (0.0%) |
| Coal or Coke | 0 (0.0%) | 0 (0.0%) |
| All other Fuels | 7 (0.5%) | 0 (0.0%) |
| No Fuel Used | 0 (0.0%) | 0 (0.0%) |
| Total | 1,287 (100.0%) | 308 (100.0%) |
Household Vehicle Usage in Nags Head
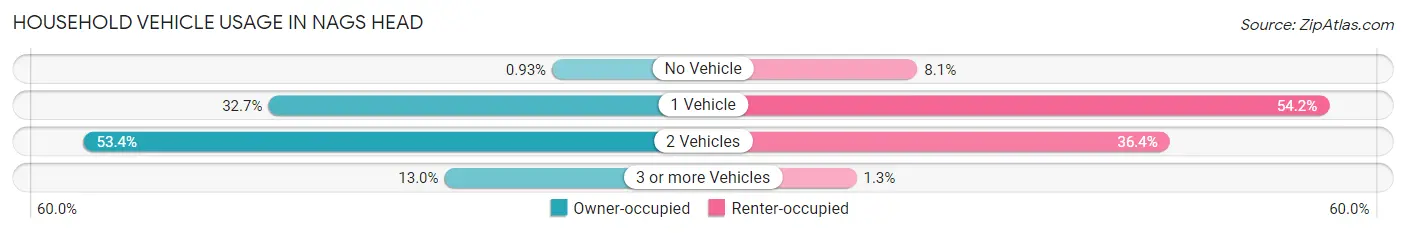
| Vehicles per Household | Owner-occupied | Renter-occupied |
| No Vehicle | 12 (0.9%) | 25 (8.1%) |
| 1 Vehicle | 421 (32.7%) | 167 (54.2%) |
| 2 Vehicles | 687 (53.4%) | 112 (36.4%) |
| 3 or more Vehicles | 167 (13.0%) | 4 (1.3%) |
| Total | 1,287 (100.0%) | 308 (100.0%) |
Real Estate & Mortgages in Nags Head
Real Estate and Mortgage Overview in Nags Head
| Characteristic | Without Mortgage | With Mortgage |
| Housing Units | 510 | 777 |
| Median Property Value | $457,000 | $405,700 |
| Median Household Income | $88,696 | $291 |
| Monthly Housing Costs | $591 | $117 |
| Real Estate Taxes | $2,361 | $0 |
Property Value by Mortgage Status in Nags Head
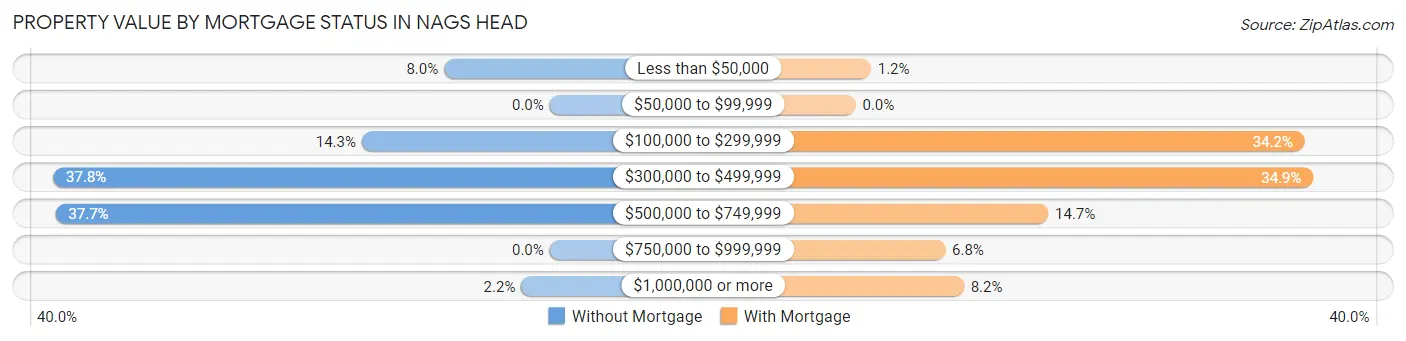
| Property Value | Without Mortgage | With Mortgage |
| Less than $50,000 | 41 (8.0%) | 9 (1.2%) |
| $50,000 to $99,999 | 0 (0.0%) | 0 (0.0%) |
| $100,000 to $299,999 | 73 (14.3%) | 266 (34.2%) |
| $300,000 to $499,999 | 193 (37.8%) | 271 (34.9%) |
| $500,000 to $749,999 | 192 (37.7%) | 114 (14.7%) |
| $750,000 to $999,999 | 0 (0.0%) | 53 (6.8%) |
| $1,000,000 or more | 11 (2.2%) | 64 (8.2%) |
| Total | 510 (100.0%) | 777 (100.0%) |
Household Income by Mortgage Status in Nags Head
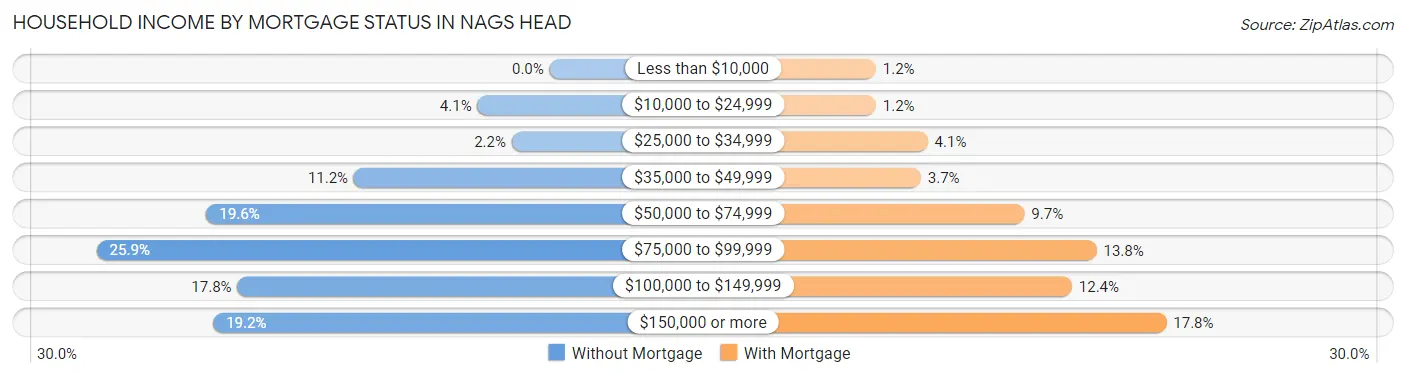
| Household Income | Without Mortgage | With Mortgage |
| Less than $10,000 | 0 (0.0%) | 9 (1.2%) |
| $10,000 to $24,999 | 21 (4.1%) | 9 (1.2%) |
| $25,000 to $34,999 | 11 (2.2%) | 32 (4.1%) |
| $35,000 to $49,999 | 57 (11.2%) | 29 (3.7%) |
| $50,000 to $74,999 | 100 (19.6%) | 75 (9.7%) |
| $75,000 to $99,999 | 132 (25.9%) | 107 (13.8%) |
| $100,000 to $149,999 | 91 (17.8%) | 96 (12.4%) |
| $150,000 or more | 98 (19.2%) | 138 (17.8%) |
| Total | 510 (100.0%) | 777 (100.0%) |
Property Value to Household Income Ratio in Nags Head
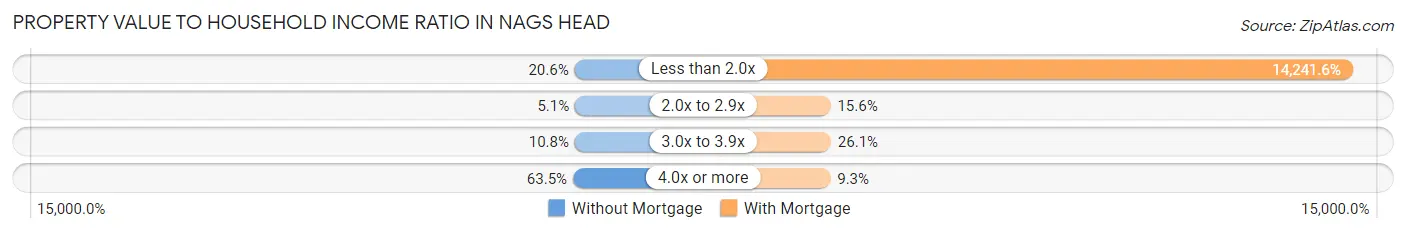
| Value-to-Income Ratio | Without Mortgage | With Mortgage |
| Less than 2.0x | 105 (20.6%) | 110,657 (14,241.6%) |
| 2.0x to 2.9x | 26 (5.1%) | 121 (15.6%) |
| 3.0x to 3.9x | 55 (10.8%) | 203 (26.1%) |
| 4.0x or more | 324 (63.5%) | 72 (9.3%) |
| Total | 510 (100.0%) | 777 (100.0%) |
Real Estate Taxes by Mortgage Status in Nags Head
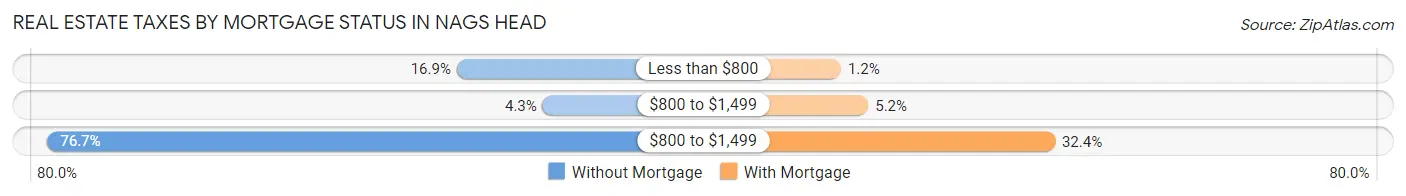
| Property Taxes | Without Mortgage | With Mortgage |
| Less than $800 | 86 (16.9%) | 9 (1.2%) |
| $800 to $1,499 | 22 (4.3%) | 40 (5.1%) |
| $800 to $1,499 | 391 (76.7%) | 252 (32.4%) |
| Total | 510 (100.0%) | 777 (100.0%) |
Health & Disability in Nags Head
Health Insurance Coverage by Age in Nags Head
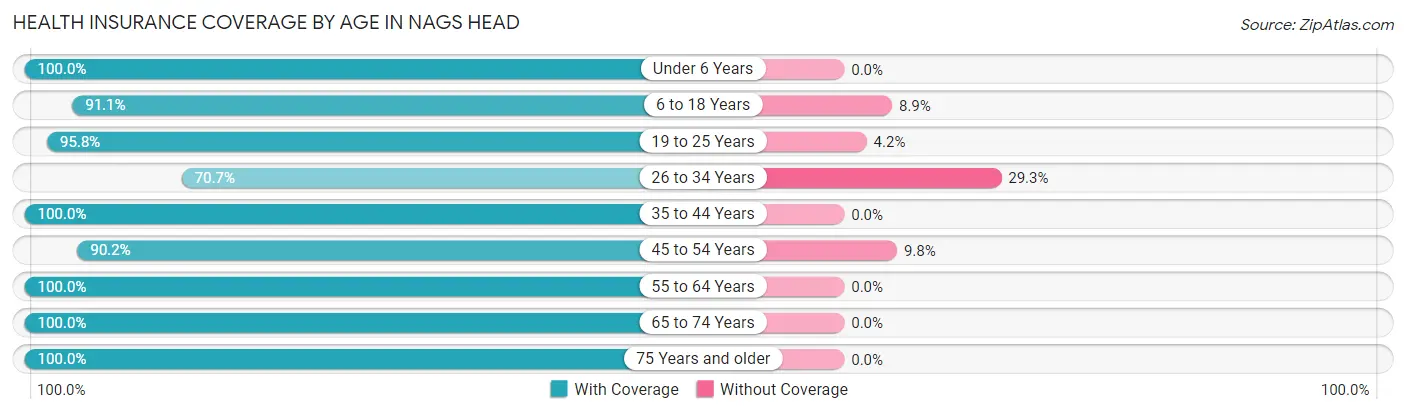
| Age Bracket | With Coverage | Without Coverage |
| Under 6 Years | 93 (100.0%) | 0 (0.0%) |
| 6 to 18 Years | 256 (91.1%) | 25 (8.9%) |
| 19 to 25 Years | 161 (95.8%) | 7 (4.2%) |
| 26 to 34 Years | 128 (70.7%) | 53 (29.3%) |
| 35 to 44 Years | 216 (100.0%) | 0 (0.0%) |
| 45 to 54 Years | 321 (90.2%) | 35 (9.8%) |
| 55 to 64 Years | 484 (100.0%) | 0 (0.0%) |
| 65 to 74 Years | 913 (100.0%) | 0 (0.0%) |
| 75 Years and older | 387 (100.0%) | 0 (0.0%) |
| Total | 2,959 (96.1%) | 120 (3.9%) |
Health Insurance Coverage by Citizenship Status in Nags Head
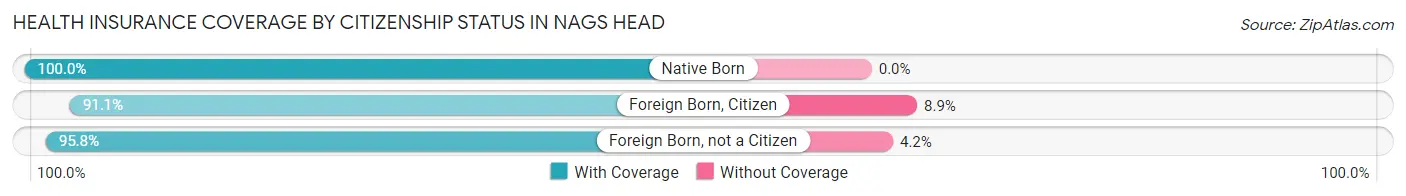
| Citizenship Status | With Coverage | Without Coverage |
| Native Born | 93 (100.0%) | 0 (0.0%) |
| Foreign Born, Citizen | 256 (91.1%) | 25 (8.9%) |
| Foreign Born, not a Citizen | 161 (95.8%) | 7 (4.2%) |
Health Insurance Coverage by Household Income in Nags Head
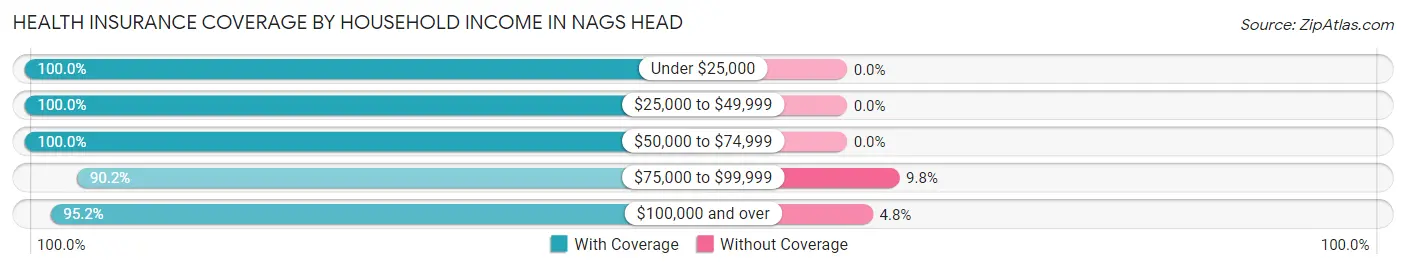
| Household Income | With Coverage | Without Coverage |
| Under $25,000 | 155 (100.0%) | 0 (0.0%) |
| $25,000 to $49,999 | 465 (100.0%) | 0 (0.0%) |
| $50,000 to $74,999 | 462 (100.0%) | 0 (0.0%) |
| $75,000 to $99,999 | 423 (90.2%) | 46 (9.8%) |
| $100,000 and over | 1,454 (95.2%) | 74 (4.8%) |
Public vs Private Health Insurance Coverage by Age in Nags Head
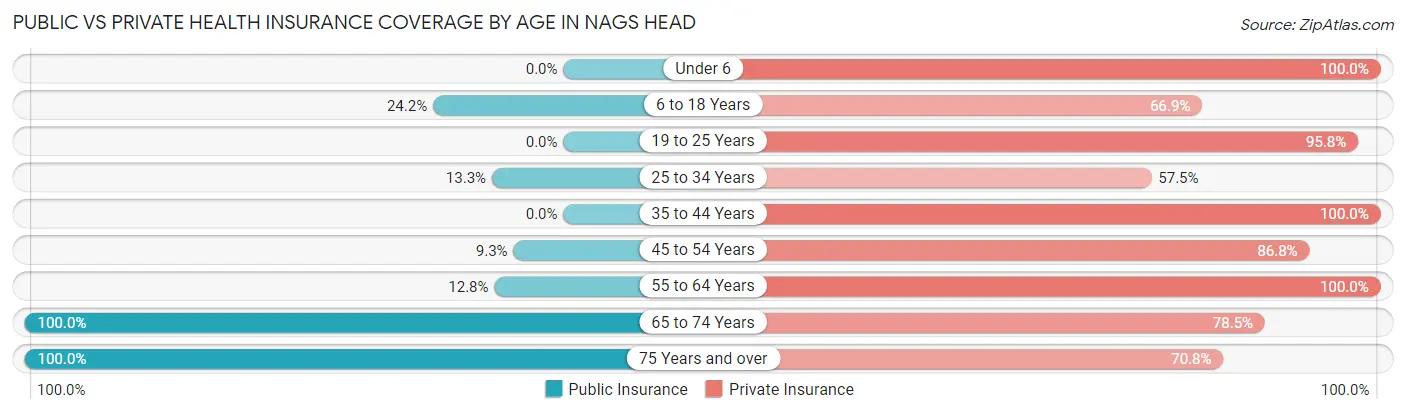
| Age Bracket | Public Insurance | Private Insurance |
| Under 6 | 0 (0.0%) | 93 (100.0%) |
| 6 to 18 Years | 68 (24.2%) | 188 (66.9%) |
| 19 to 25 Years | 0 (0.0%) | 161 (95.8%) |
| 25 to 34 Years | 24 (13.3%) | 104 (57.5%) |
| 35 to 44 Years | 0 (0.0%) | 216 (100.0%) |
| 45 to 54 Years | 33 (9.3%) | 309 (86.8%) |
| 55 to 64 Years | 62 (12.8%) | 484 (100.0%) |
| 65 to 74 Years | 913 (100.0%) | 717 (78.5%) |
| 75 Years and over | 387 (100.0%) | 274 (70.8%) |
| Total | 1,487 (48.3%) | 2,546 (82.7%) |
Disability Status by Sex by Age in Nags Head
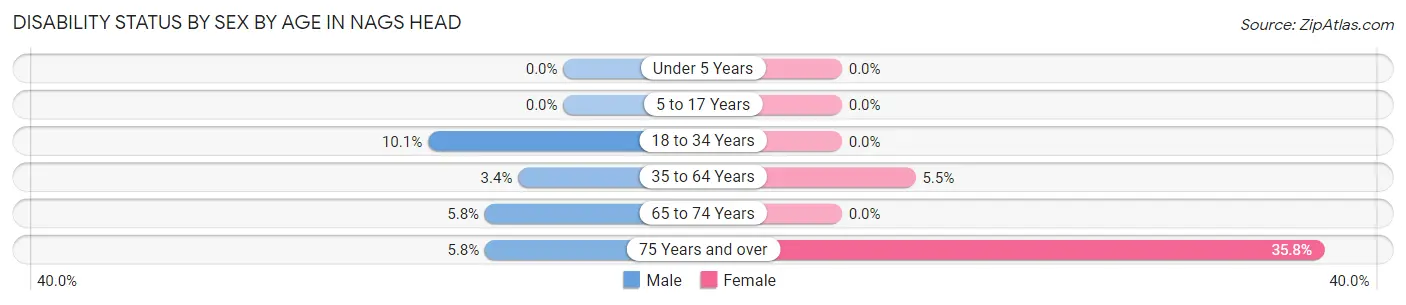
| Age Bracket | Male | Female |
| Under 5 Years | 0 (0.0%) | 0 (0.0%) |
| 5 to 17 Years | 0 (0.0%) | 0 (0.0%) |
| 18 to 34 Years | 20 (10.1%) | 0 (0.0%) |
| 35 to 64 Years | 17 (3.4%) | 30 (5.5%) |
| 65 to 74 Years | 32 (5.8%) | 0 (0.0%) |
| 75 Years and over | 9 (5.8%) | 83 (35.8%) |
Disability Class by Sex by Age in Nags Head
Disability Class: Hearing Difficulty
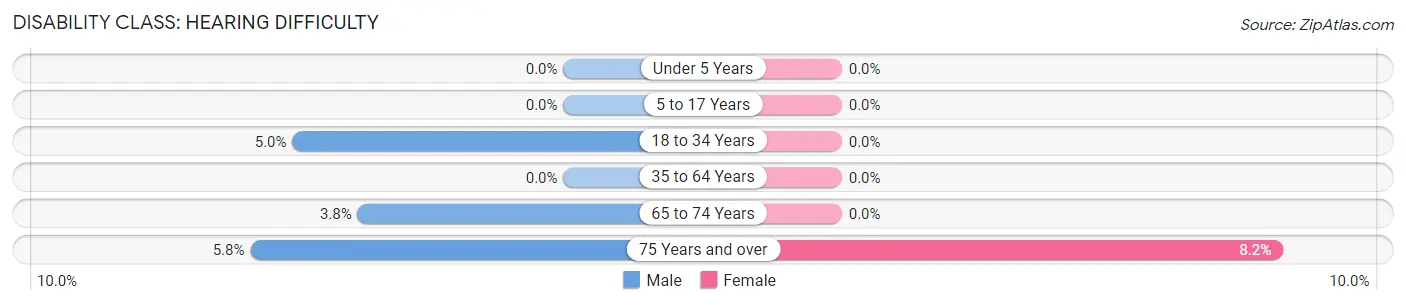
| Age Bracket | Male | Female |
| Under 5 Years | 0 (0.0%) | 0 (0.0%) |
| 5 to 17 Years | 0 (0.0%) | 0 (0.0%) |
| 18 to 34 Years | 10 (5.0%) | 0 (0.0%) |
| 35 to 64 Years | 0 (0.0%) | 0 (0.0%) |
| 65 to 74 Years | 21 (3.8%) | 0 (0.0%) |
| 75 Years and over | 9 (5.8%) | 19 (8.2%) |
Disability Class: Vision Difficulty
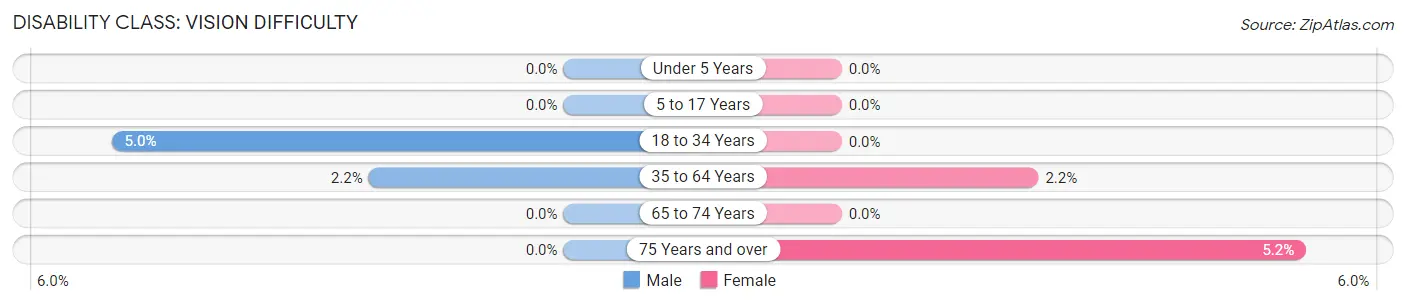
| Age Bracket | Male | Female |
| Under 5 Years | 0 (0.0%) | 0 (0.0%) |
| 5 to 17 Years | 0 (0.0%) | 0 (0.0%) |
| 18 to 34 Years | 10 (5.0%) | 0 (0.0%) |
| 35 to 64 Years | 11 (2.2%) | 12 (2.2%) |
| 65 to 74 Years | 0 (0.0%) | 0 (0.0%) |
| 75 Years and over | 0 (0.0%) | 12 (5.2%) |
Disability Class: Cognitive Difficulty
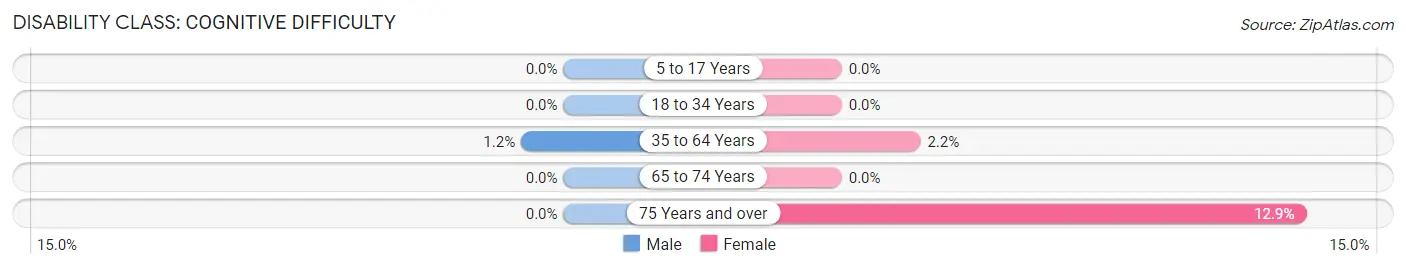
| Age Bracket | Male | Female |
| 5 to 17 Years | 0 (0.0%) | 0 (0.0%) |
| 18 to 34 Years | 0 (0.0%) | 0 (0.0%) |
| 35 to 64 Years | 6 (1.2%) | 12 (2.2%) |
| 65 to 74 Years | 0 (0.0%) | 0 (0.0%) |
| 75 Years and over | 0 (0.0%) | 30 (12.9%) |
Disability Class: Ambulatory Difficulty
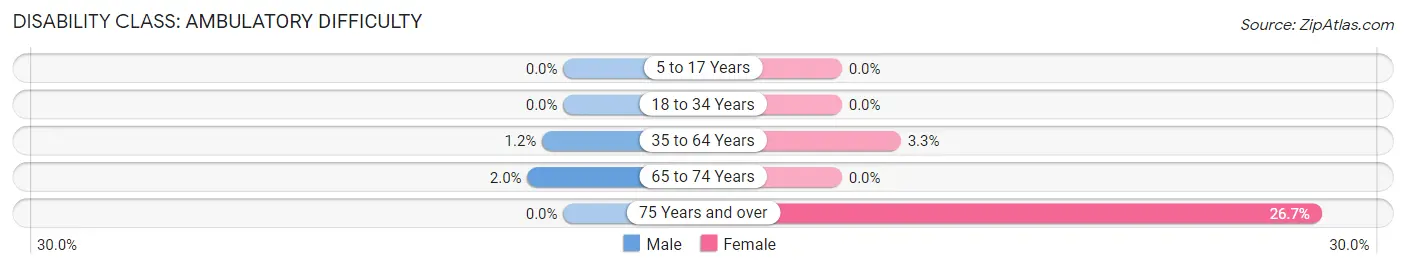
| Age Bracket | Male | Female |
| 5 to 17 Years | 0 (0.0%) | 0 (0.0%) |
| 18 to 34 Years | 0 (0.0%) | 0 (0.0%) |
| 35 to 64 Years | 6 (1.2%) | 18 (3.3%) |
| 65 to 74 Years | 11 (2.0%) | 0 (0.0%) |
| 75 Years and over | 0 (0.0%) | 62 (26.7%) |
Disability Class: Self-Care Difficulty
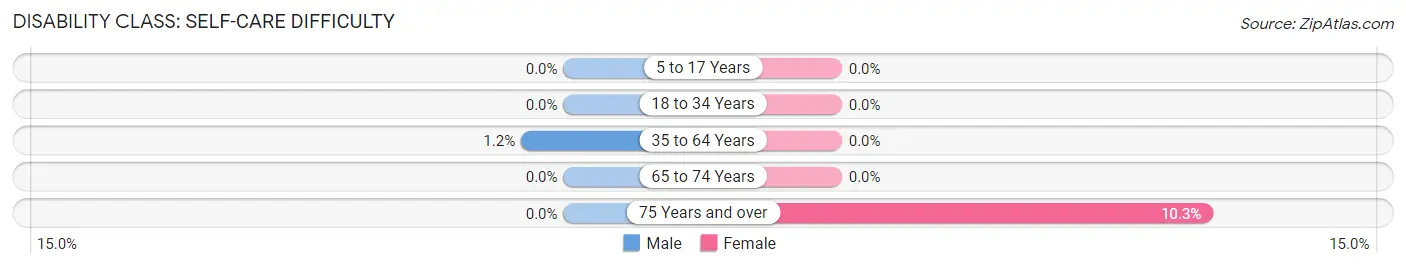
| Age Bracket | Male | Female |
| 5 to 17 Years | 0 (0.0%) | 0 (0.0%) |
| 18 to 34 Years | 0 (0.0%) | 0 (0.0%) |
| 35 to 64 Years | 6 (1.2%) | 0 (0.0%) |
| 65 to 74 Years | 0 (0.0%) | 0 (0.0%) |
| 75 Years and over | 0 (0.0%) | 24 (10.3%) |
Technology Access in Nags Head
Computing Device Access in Nags Head
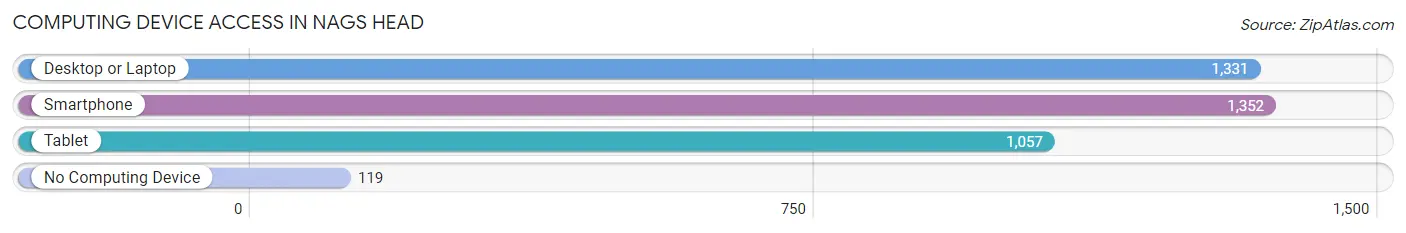
| Device Type | # Households | % Households |
| Desktop or Laptop | 1,331 | 83.5% |
| Smartphone | 1,352 | 84.8% |
| Tablet | 1,057 | 66.3% |
| No Computing Device | 119 | 7.5% |
| Total | 1,595 | 100.0% |
Internet Access in Nags Head
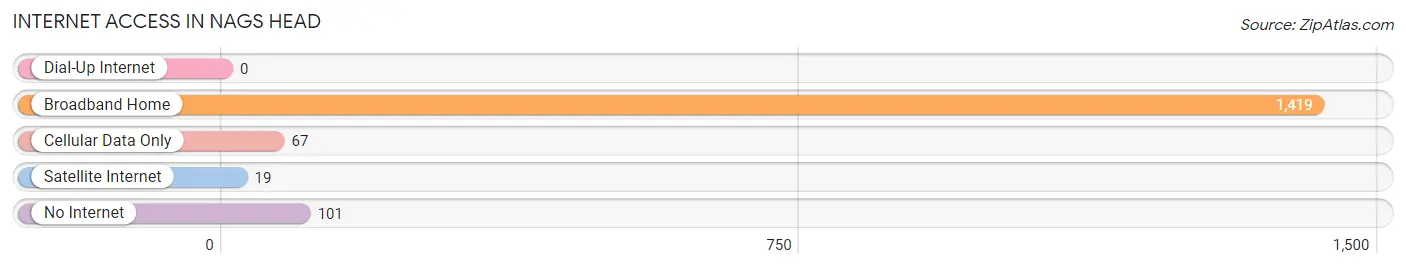
| Internet Type | # Households | % Households |
| Dial-Up Internet | 0 | 0.0% |
| Broadband Home | 1,419 | 89.0% |
| Cellular Data Only | 67 | 4.2% |
| Satellite Internet | 19 | 1.2% |
| No Internet | 101 | 6.3% |
| Total | 1,595 | 100.0% |
Nags Head Summary
Nags Head is a town located in Dare County, North Carolina, United States. It is a popular tourist destination on the Outer Banks of North Carolina, and is known for its beaches, fishing, and other recreational activities. The population was 2,757 at the 2010 census.
History
Nags Head was first settled in the early 1700s by fishermen and farmers. The town was named after the legend of the Nags Head, a ghostly horse that was said to haunt the area. The legend states that the horse would appear at night and carry away unsuspecting travelers.
The town was incorporated in 1961 and has since become a popular tourist destination. The town is home to the Nags Head Fishing Pier, which is the longest pier on the Outer Banks. The pier is a popular spot for fishing, sightseeing, and other activities.
Geography
Nags Head is located in Dare County, North Carolina, on the Outer Banks of North Carolina. The town is situated on the Atlantic Ocean, and is bordered by the towns of Kill Devil Hills to the north, Kitty Hawk to the south, and Roanoke Island to the west.
The town has a total area of 8.3 square miles, of which 8.2 square miles is land and 0.1 square miles is water. The town is located on a barrier island, and is separated from the mainland by the Roanoke Sound.
Economy
Nags Head is a popular tourist destination, and the town's economy is largely based on tourism. The town is home to a variety of hotels, restaurants, and other businesses that cater to tourists. The town is also home to the Nags Head Fishing Pier, which is a popular spot for fishing and sightseeing.
The town is also home to a variety of other businesses, including retail stores, banks, and other services. The town is also home to a variety of art galleries, museums, and other attractions.
Demographics
As of the 2010 census, there were 2,757 people, 1,093 households, and 745 families residing in the town. The population density was 336.2 people per square mile. There were 1,541 housing units at an average density of 188.2 per square mile. The racial makeup of the town was 94.2% White, 2.2% African American, 0.3% Native American, 0.9% Asian, 0.1% Pacific Islander, 0.9% from other races, and 1.4% from two or more races. Hispanic or Latino of any race were 2.2% of the population.
There were 1,093 households, out of which 28.2% had children under the age of 18 living with them, 54.2% were married couples living together, 9.2% had a female householder with no husband present, and 32.2% were non-families. 25.7% of all households were made up of individuals, and 8.2% had someone living alone who was 65 years of age or older. The average household size was 2.51 and the average family size was 3.01.
In the town, the population was spread out, with 23.2% under the age of 18, 6.7% from 18 to 24, 28.2% from 25 to 44, 28.2% from 45 to 64, and 13.7% who were 65 years of age or older. The median age was 40 years. For every 100 females, there were 97.2 males. For every 100 females age 18 and over, there were 95.2 males.
The median income for a household in the town was $50,938, and the median income for a family was $58,906. Males had a median income of $36,932 versus $27,917 for females. The per capita income for the town was $25,945. About 5.2% of families and 7.2% of the population were below the poverty line, including 8.2% of those under age 18 and 5.2% of those age 65 or over.
Common Questions
What is Per Capita Income in Nags Head?
Per Capita income in Nags Head is $55,750.
What is the Median Family Income in Nags Head?
Median Family Income in Nags Head is $111,703.
What is the Median Household income in Nags Head?
Median Household Income in Nags Head is $87,560.
What is Income or Wage Gap in Nags Head?
Income or Wage Gap in Nags Head is 5.3%.
Women in Nags Head earn 94.7 cents for every dollar earned by a man.
What is Inequality or Gini Index in Nags Head?
Inequality or Gini Index in Nags Head is 0.40.
What is the Total Population of Nags Head?
Total Population of Nags Head is 3,153.
What is the Total Male Population of Nags Head?
Total Male Population of Nags Head is 1,670.
What is the Total Female Population of Nags Head?
Total Female Population of Nags Head is 1,483.
What is the Ratio of Males per 100 Females in Nags Head?
There are 112.61 Males per 100 Females in Nags Head.
What is the Ratio of Females per 100 Males in Nags Head?
There are 88.80 Females per 100 Males in Nags Head.
What is the Median Population Age in Nags Head?
Median Population Age in Nags Head is 59.8 Years.
What is the Average Family Size in Nags Head
Average Family Size in Nags Head is 2.3 People.
What is the Average Household Size in Nags Head
Average Household Size in Nags Head is 1.9 People.
How Large is the Labor Force in Nags Head?
There are 1,483 People in the Labor Forcein in Nags Head.
What is the Percentage of People in the Labor Force in Nags Head?
52.6% of People are in the Labor Force in Nags Head.
What is the Unemployment Rate in Nags Head?
Unemployment Rate in Nags Head is 1.8%.