Fairview, NC Map & Demographics
Fairview Map
Fairview Overview
$45,860
PER CAPITA INCOME
$103,971
AVG FAMILY INCOME
$85,441
AVG HOUSEHOLD INCOME
20.4%
WAGE / INCOME GAP [ % ]
79.6¢/ $1
WAGE / INCOME GAP [ $ ]
0.46
INEQUALITY / GINI INDEX
3,512
TOTAL POPULATION
1,503
MALE POPULATION
2,009
FEMALE POPULATION
74.81
MALES / 100 FEMALES
133.67
FEMALES / 100 MALES
46.7
MEDIAN AGE
3.3
AVG FAMILY SIZE
2.9
AVG HOUSEHOLD SIZE
1,677
LABOR FORCE [ PEOPLE ]
54.2%
PERCENT IN LABOR FORCE
2.4%
UNEMPLOYMENT RATE
Fairview Zip Codes
Fairview Area Codes
Income in Fairview
Income Overview in Fairview
Per Capita Income in Fairview is $45,860, while median incomes of families and households are $103,971 and $85,441 respectively.
| Characteristic | Number | Measure |
| Per Capita Income | 3,512 | $45,860 |
| Median Family Income | 960 | $103,971 |
| Mean Family Income | 960 | $147,539 |
| Median Household Income | 1,204 | $85,441 |
| Mean Household Income | 1,204 | $128,882 |
| Income Deficit | 960 | $0 |
| Wage / Income Gap (%) | 3,512 | 20.35% |
| Wage / Income Gap ($) | 3,512 | 79.65¢ per $1 |
| Gini / Inequality Index | 3,512 | 0.46 |
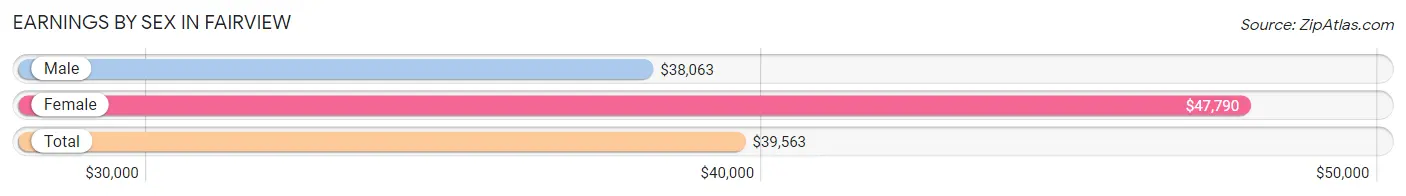
Earnings by Sex in Fairview
Average Earnings in Fairview are $39,563, $38,063 for men and $47,790 for women, a difference of 20.3%.
| Sex | Number | Average Earnings |
| Male | 1,065 (56.0%) | $38,063 |
| Female | 836 (44.0%) | $47,790 |
| Total | 1,901 (100.0%) | $39,563 |
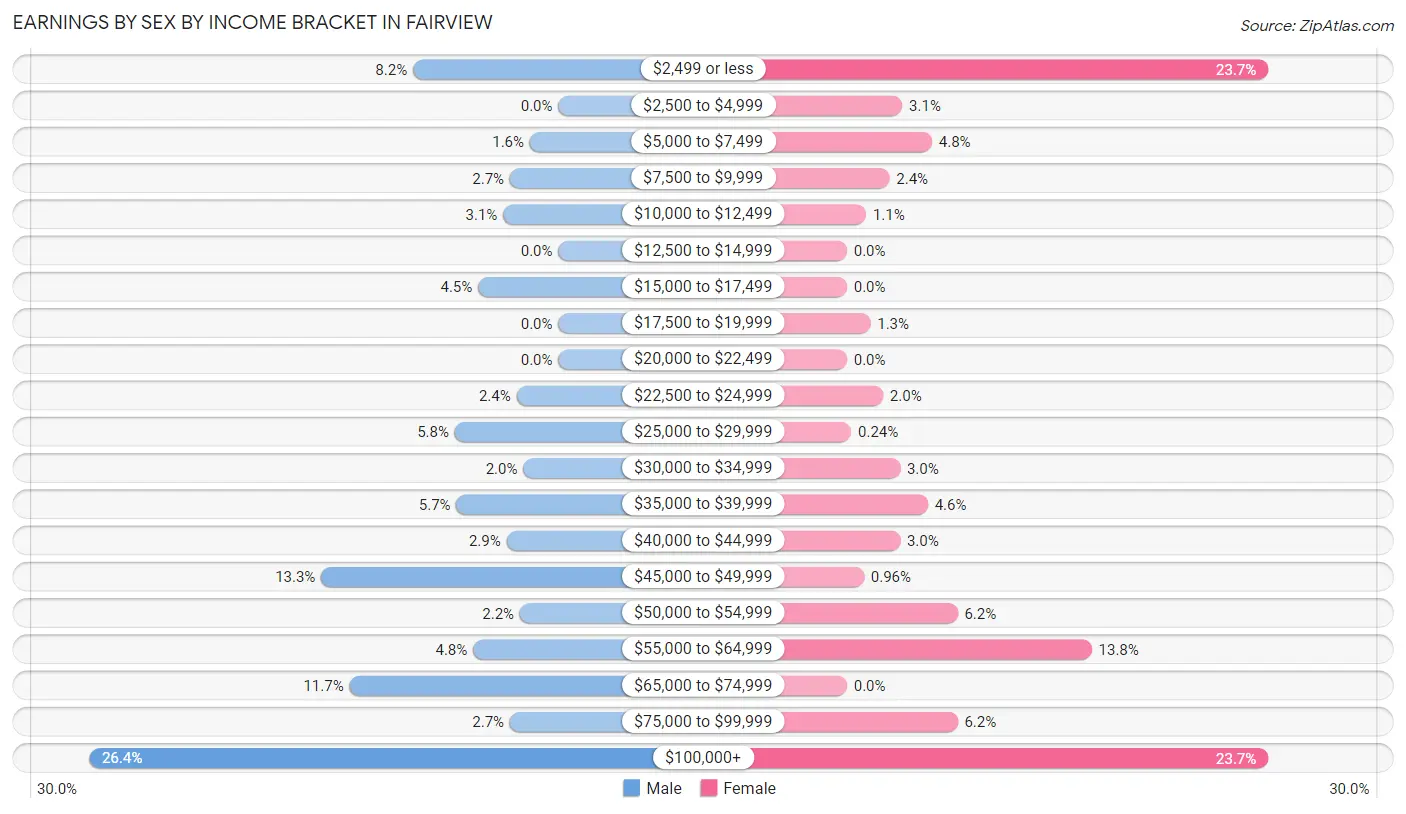
Earnings by Sex by Income Bracket in Fairview
The most common earnings brackets in Fairview are $100,000+ for men (281 | 26.4%) and $2,499 or less for women (198 | 23.7%).
| Income | Male | Female |
| $2,499 or less | 87 (8.2%) | 198 (23.7%) |
| $2,500 to $4,999 | 0 (0.0%) | 26 (3.1%) |
| $5,000 to $7,499 | 17 (1.6%) | 40 (4.8%) |
| $7,500 to $9,999 | 29 (2.7%) | 20 (2.4%) |
| $10,000 to $12,499 | 33 (3.1%) | 9 (1.1%) |
| $12,500 to $14,999 | 0 (0.0%) | 0 (0.0%) |
| $15,000 to $17,499 | 48 (4.5%) | 0 (0.0%) |
| $17,500 to $19,999 | 0 (0.0%) | 11 (1.3%) |
| $20,000 to $22,499 | 0 (0.0%) | 0 (0.0%) |
| $22,500 to $24,999 | 25 (2.4%) | 17 (2.0%) |
| $25,000 to $29,999 | 62 (5.8%) | 2 (0.2%) |
| $30,000 to $34,999 | 21 (2.0%) | 25 (3.0%) |
| $35,000 to $39,999 | 61 (5.7%) | 38 (4.5%) |
| $40,000 to $44,999 | 31 (2.9%) | 25 (3.0%) |
| $45,000 to $49,999 | 142 (13.3%) | 8 (1.0%) |
| $50,000 to $54,999 | 23 (2.2%) | 52 (6.2%) |
| $55,000 to $64,999 | 51 (4.8%) | 115 (13.8%) |
| $65,000 to $74,999 | 125 (11.7%) | 0 (0.0%) |
| $75,000 to $99,999 | 29 (2.7%) | 52 (6.2%) |
| $100,000+ | 281 (26.4%) | 198 (23.7%) |
| Total | 1,065 (100.0%) | 836 (100.0%) |
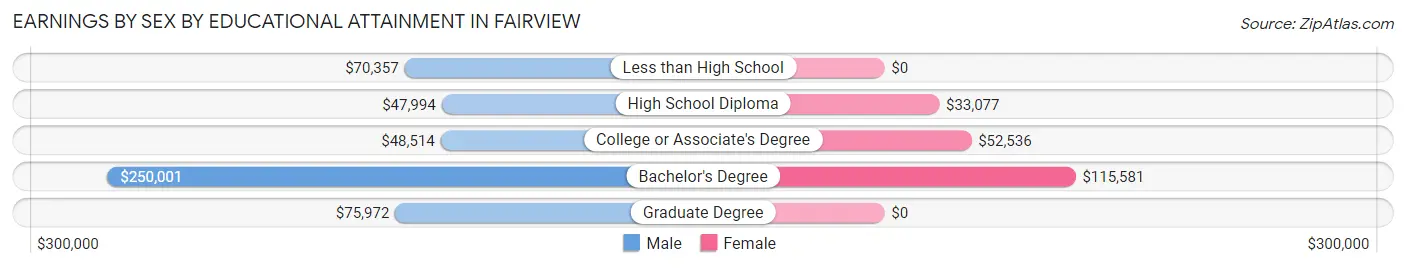
Earnings by Sex by Educational Attainment in Fairview
Average earnings in Fairview are $64,219 for men and $63,327 for women, a difference of 1.4%. Men with an educational attainment of bachelor's degree enjoy the highest average annual earnings of $250,001, while those with high school diploma education earn the least with $47,994. Women with an educational attainment of bachelor's degree earn the most with the average annual earnings of $115,581, while those with high school diploma education have the smallest earnings of $33,077.
| Educational Attainment | Male Income | Female Income |
| Less than High School | $70,357 | $0 |
| High School Diploma | $47,994 | $33,077 |
| College or Associate's Degree | $48,514 | $52,536 |
| Bachelor's Degree | $250,001 | $115,581 |
| Graduate Degree | $75,972 | $0 |
| Total | $64,219 | $63,327 |
Family Income in Fairview
Family Income Brackets in Fairview
According to the Fairview family income data, there are 228 families falling into the $200,000+ income range, which is the most common income bracket and makes up 23.7% of all families.
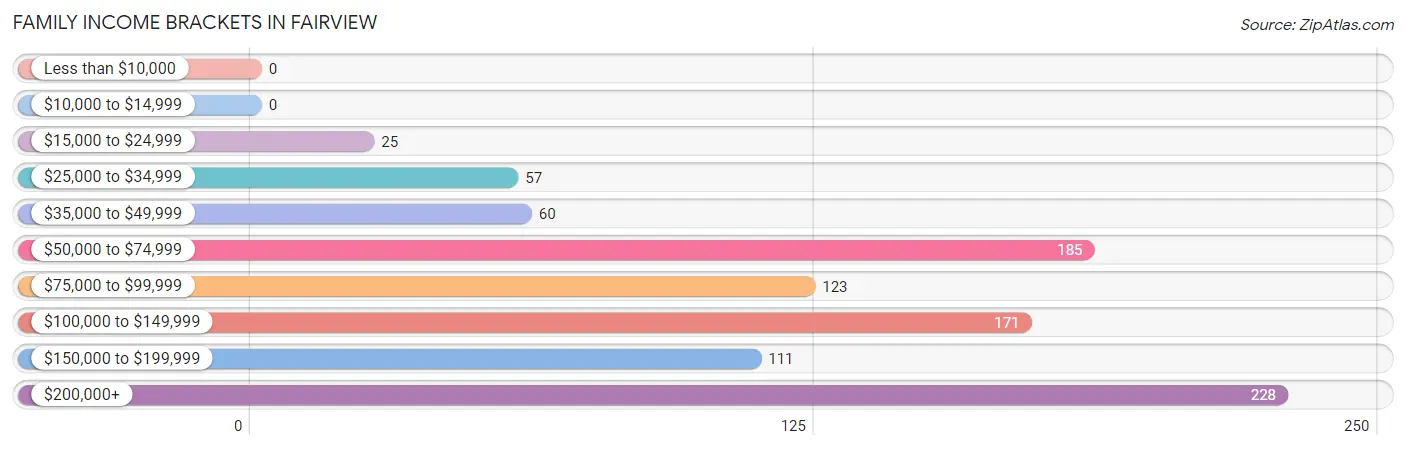
| Income Bracket | # Families | % Families |
| Less than $10,000 | 0 | 0.0% |
| $10,000 to $14,999 | 0 | 0.0% |
| $15,000 to $24,999 | 25 | 2.6% |
| $25,000 to $34,999 | 57 | 5.9% |
| $35,000 to $49,999 | 60 | 6.3% |
| $50,000 to $74,999 | 185 | 19.3% |
| $75,000 to $99,999 | 123 | 12.8% |
| $100,000 to $149,999 | 171 | 17.8% |
| $150,000 to $199,999 | 111 | 11.6% |
| $200,000+ | 228 | 23.8% |
Family Income by Famaliy Size in Fairview
4-person families (284 | 29.6%) account for the highest median family income in Fairview with $250,001 per family, while 4-person families (284 | 29.6%) have the highest median income of $62,500 per family member.
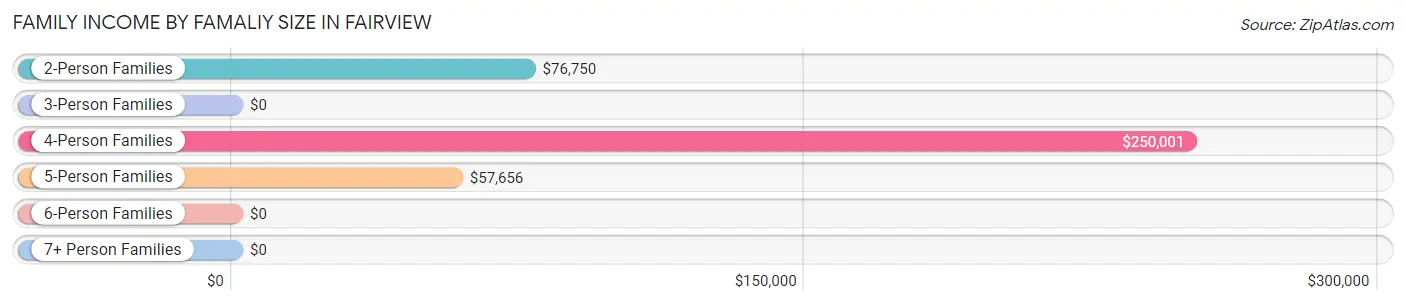
| Income Bracket | # Families | Median Income |
| 2-Person Families | 496 (51.7%) | $76,750 |
| 3-Person Families | 101 (10.5%) | $0 |
| 4-Person Families | 284 (29.6%) | $250,001 |
| 5-Person Families | 79 (8.2%) | $57,656 |
| 6-Person Families | 0 (0.0%) | $0 |
| 7+ Person Families | 0 (0.0%) | $0 |
| Total | 960 (100.0%) | $103,971 |
Family Income by Number of Earners in Fairview
The median family income in Fairview is $103,971, with families comprising 3+ earners (241) having the highest median family income of $250,001, while families with no earners (200) have the lowest median family income of $57,250, accounting for 25.1% and 20.8% of families, respectively.
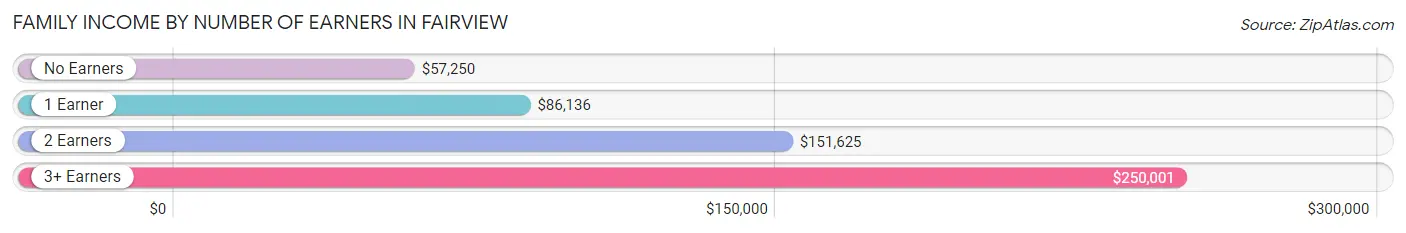
| Number of Earners | # Families | Median Income |
| No Earners | 200 (20.8%) | $57,250 |
| 1 Earner | 228 (23.7%) | $86,136 |
| 2 Earners | 291 (30.3%) | $151,625 |
| 3+ Earners | 241 (25.1%) | $250,001 |
| Total | 960 (100.0%) | $103,971 |
Household Income in Fairview
Household Income Brackets in Fairview
With 244 households falling in the category, the $50,000 to $74,999 income range is the most frequent in Fairview, accounting for 20.3% of all households.
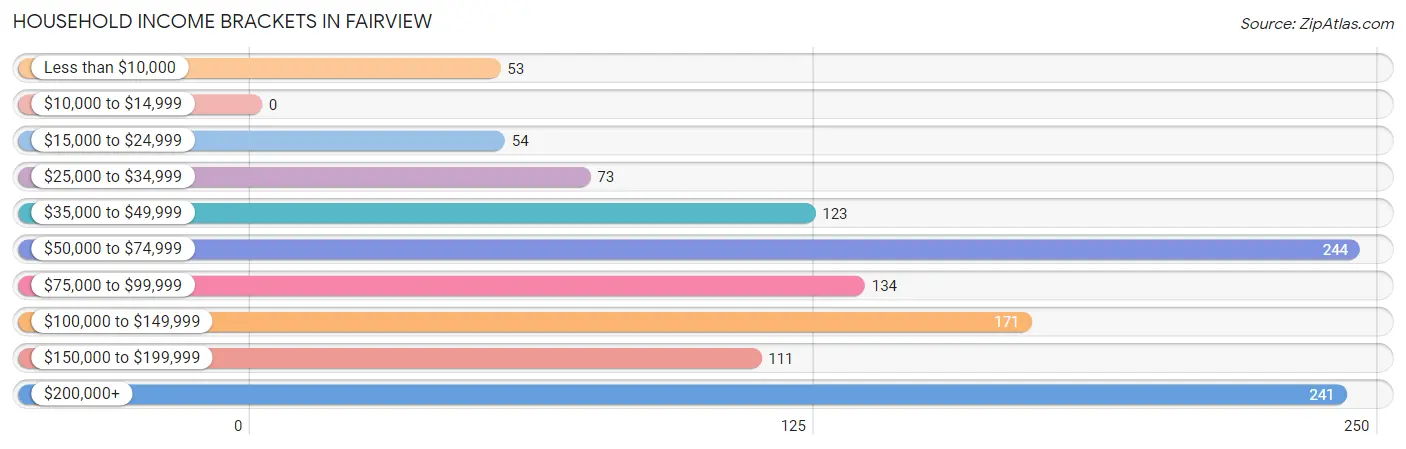
| Income Bracket | # Households | % Households |
| Less than $10,000 | 53 | 4.4% |
| $10,000 to $14,999 | 0 | 0.0% |
| $15,000 to $24,999 | 54 | 4.5% |
| $25,000 to $34,999 | 73 | 6.1% |
| $35,000 to $49,999 | 123 | 10.2% |
| $50,000 to $74,999 | 244 | 20.3% |
| $75,000 to $99,999 | 134 | 11.1% |
| $100,000 to $149,999 | 171 | 14.2% |
| $150,000 to $199,999 | 111 | 9.2% |
| $200,000+ | 241 | 20.0% |
Household Income by Householder Age in Fairview
The median household income in Fairview is $85,441, with the highest median household income of $145,469 found in the 45 to 64 years age bracket for the primary householder. A total of 671 households (55.7%) fall into this category. Meanwhile, the 15 to 24 years age bracket for the primary householder has the lowest median household income of $0, with 8 households (0.7%) in this group.
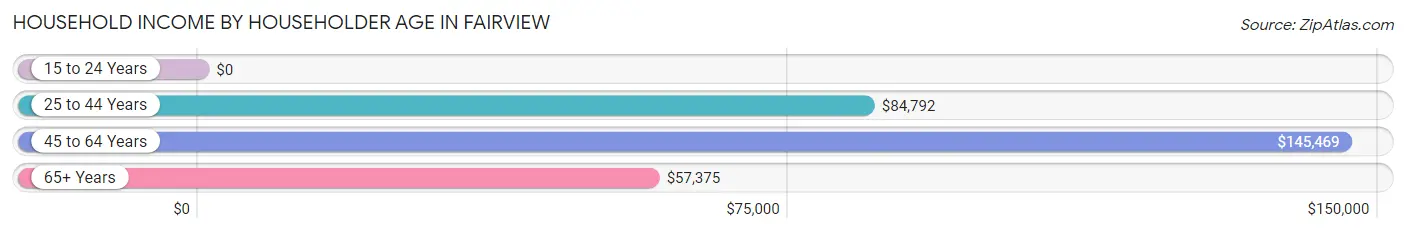
| Income Bracket | # Households | Median Income |
| 15 to 24 Years | 8 (0.7%) | $0 |
| 25 to 44 Years | 150 (12.5%) | $84,792 |
| 45 to 64 Years | 671 (55.7%) | $145,469 |
| 65+ Years | 375 (31.1%) | $57,375 |
| Total | 1,204 (100.0%) | $85,441 |
Poverty in Fairview
Income Below Poverty by Sex and Age in Fairview
With 5.6% poverty level for males and 6.2% for females among the residents of Fairview, 25 to 34 year old males and under 5 year old females are the most vulnerable to poverty, with 17 males (21.2%) and 34 females (97.1%) in their respective age groups living below the poverty level.
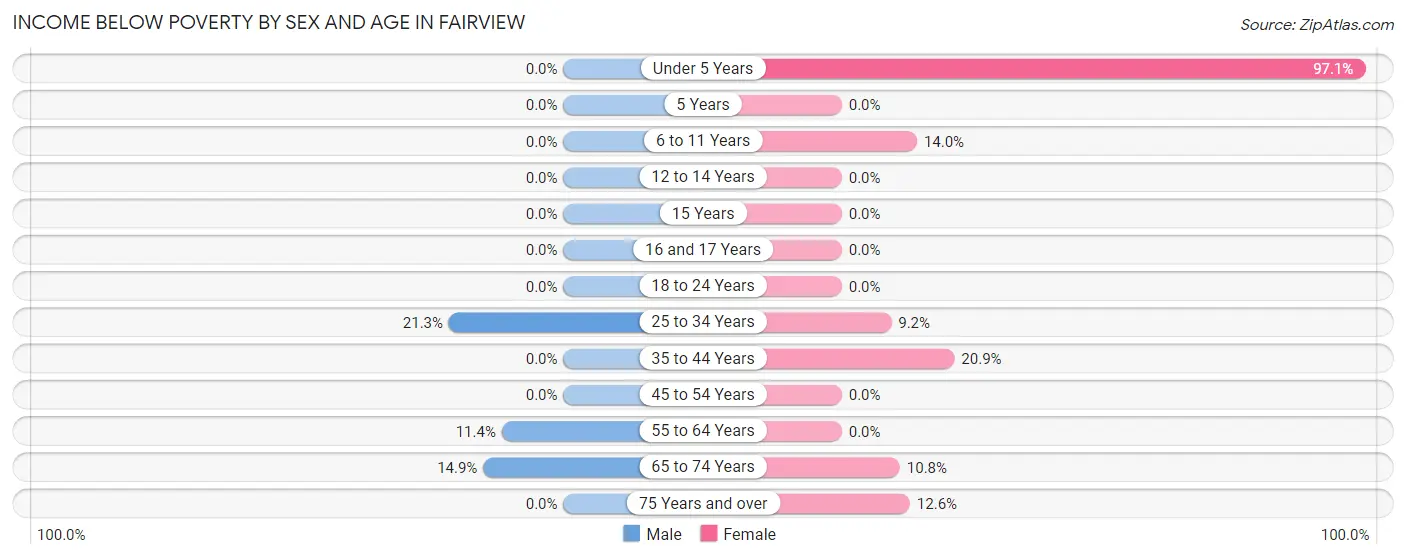
| Age Bracket | Male | Female |
| Under 5 Years | 0 (0.0%) | 34 (97.1%) |
| 5 Years | 0 (0.0%) | 0 (0.0%) |
| 6 to 11 Years | 0 (0.0%) | 18 (14.0%) |
| 12 to 14 Years | 0 (0.0%) | 0 (0.0%) |
| 15 Years | 0 (0.0%) | 0 (0.0%) |
| 16 and 17 Years | 0 (0.0%) | 0 (0.0%) |
| 18 to 24 Years | 0 (0.0%) | 0 (0.0%) |
| 25 to 34 Years | 17 (21.2%) | 9 (9.2%) |
| 35 to 44 Years | 0 (0.0%) | 28 (20.9%) |
| 45 to 54 Years | 0 (0.0%) | 0 (0.0%) |
| 55 to 64 Years | 42 (11.4%) | 0 (0.0%) |
| 65 to 74 Years | 25 (14.9%) | 25 (10.8%) |
| 75 Years and over | 0 (0.0%) | 11 (12.6%) |
| Total | 84 (5.6%) | 125 (6.2%) |
Income Above Poverty by Sex and Age in Fairview
According to the poverty statistics in Fairview, males aged 6 to 11 years and females aged 5 years are the age groups that are most secure financially, with 100.0% of males and 100.0% of females in these age groups living above the poverty line.
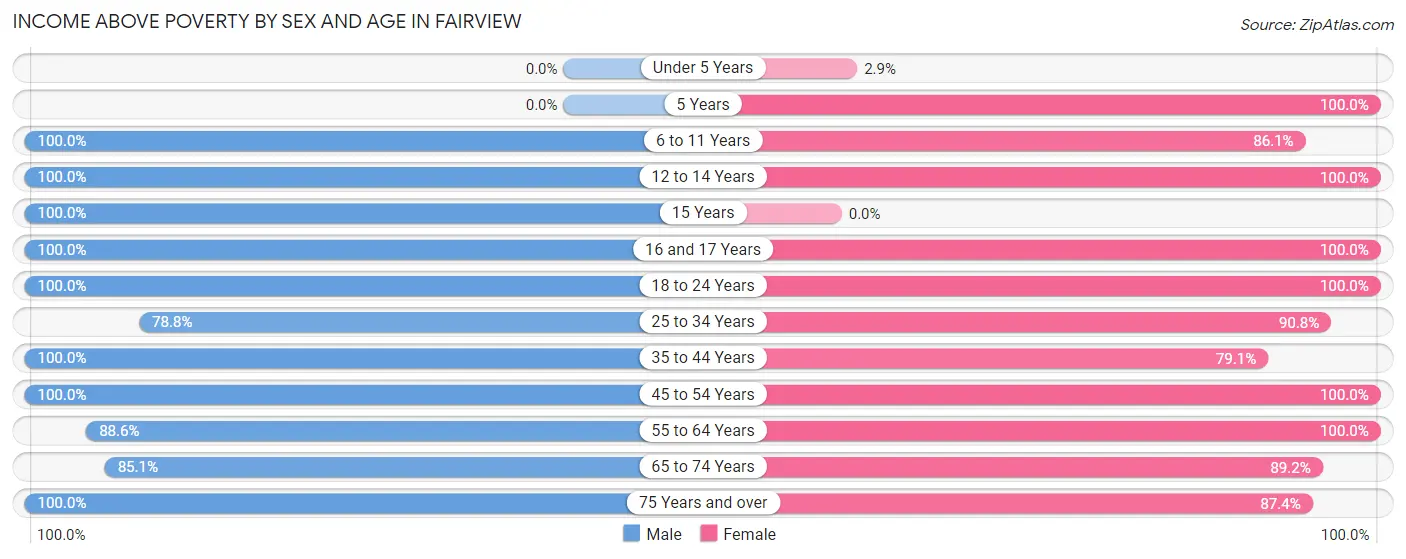
| Age Bracket | Male | Female |
| Under 5 Years | 0 (0.0%) | 1 (2.9%) |
| 5 Years | 0 (0.0%) | 26 (100.0%) |
| 6 to 11 Years | 52 (100.0%) | 111 (86.1%) |
| 12 to 14 Years | 49 (100.0%) | 110 (100.0%) |
| 15 Years | 16 (100.0%) | 0 (0.0%) |
| 16 and 17 Years | 38 (100.0%) | 227 (100.0%) |
| 18 to 24 Years | 147 (100.0%) | 408 (100.0%) |
| 25 to 34 Years | 63 (78.7%) | 89 (90.8%) |
| 35 to 44 Years | 142 (100.0%) | 106 (79.1%) |
| 45 to 54 Years | 282 (100.0%) | 270 (100.0%) |
| 55 to 64 Years | 325 (88.6%) | 253 (100.0%) |
| 65 to 74 Years | 143 (85.1%) | 207 (89.2%) |
| 75 Years and over | 162 (100.0%) | 76 (87.4%) |
| Total | 1,419 (94.4%) | 1,884 (93.8%) |
Income Below Poverty Among Married-Couple Families in Fairview
The poverty statistics for married-couple families in Fairview show that 3.9% or 34 of the total 865 families live below the poverty line. Families with 3 or 4 children have the highest poverty rate of 21.4%, comprising of 9 families. On the other hand, families with 1 or 2 children have the lowest poverty rate of 0.0%, which includes 0 families.
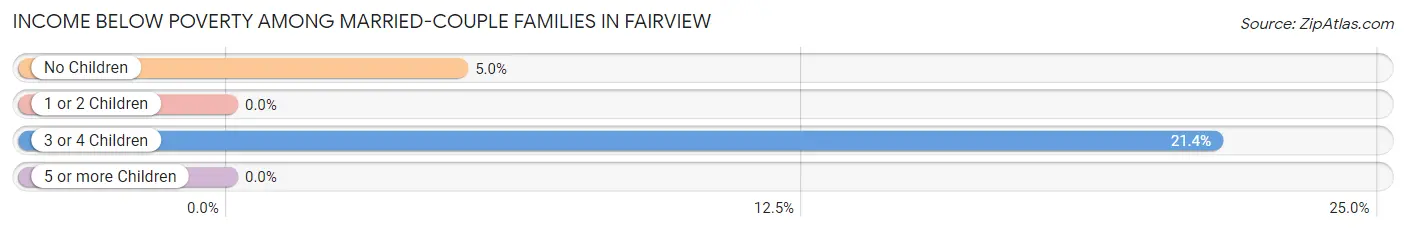
| Children | Above Poverty | Below Poverty |
| No Children | 474 (95.0%) | 25 (5.0%) |
| 1 or 2 Children | 324 (100.0%) | 0 (0.0%) |
| 3 or 4 Children | 33 (78.6%) | 9 (21.4%) |
| 5 or more Children | 0 (0.0%) | 0 (0.0%) |
| Total | 831 (96.1%) | 34 (3.9%) |
Income Below Poverty Among Single-Parent Households in Fairview
| Children | Single Father | Single Mother |
| No Children | 0 (0.0%) | 0 (0.0%) |
| 1 or 2 Children | 0 (0.0%) | 0 (0.0%) |
| 3 or 4 Children | 0 (0.0%) | 0 (0.0%) |
| 5 or more Children | 0 (0.0%) | 0 (0.0%) |
| Total | 0 (0.0%) | 0 (0.0%) |
Income Below Poverty Among Married-Couple vs Single-Parent Households in Fairview
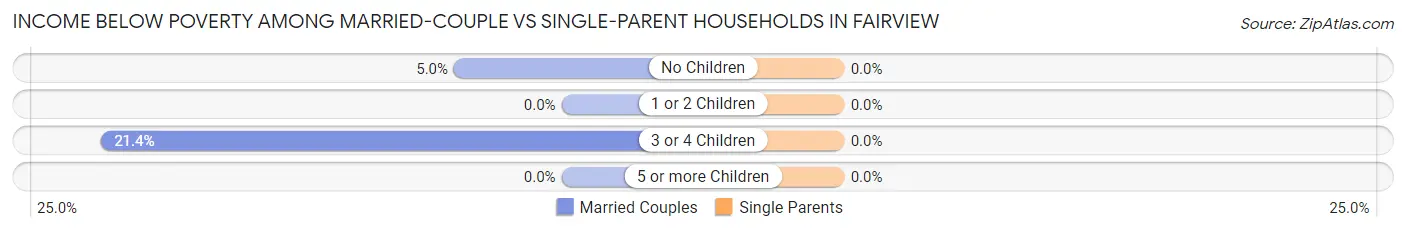
| Children | Married-Couple Families | Single-Parent Households |
| No Children | 25 (5.0%) | 0 (0.0%) |
| 1 or 2 Children | 0 (0.0%) | 0 (0.0%) |
| 3 or 4 Children | 9 (21.4%) | 0 (0.0%) |
| 5 or more Children | 0 (0.0%) | 0 (0.0%) |
| Total | 34 (3.9%) | 0 (0.0%) |
Race in Fairview
The most populous races in Fairview are White / Caucasian (3,241 | 92.3%), Two or more Races (226 | 6.4%), and Hispanic or Latino (216 | 6.1%).
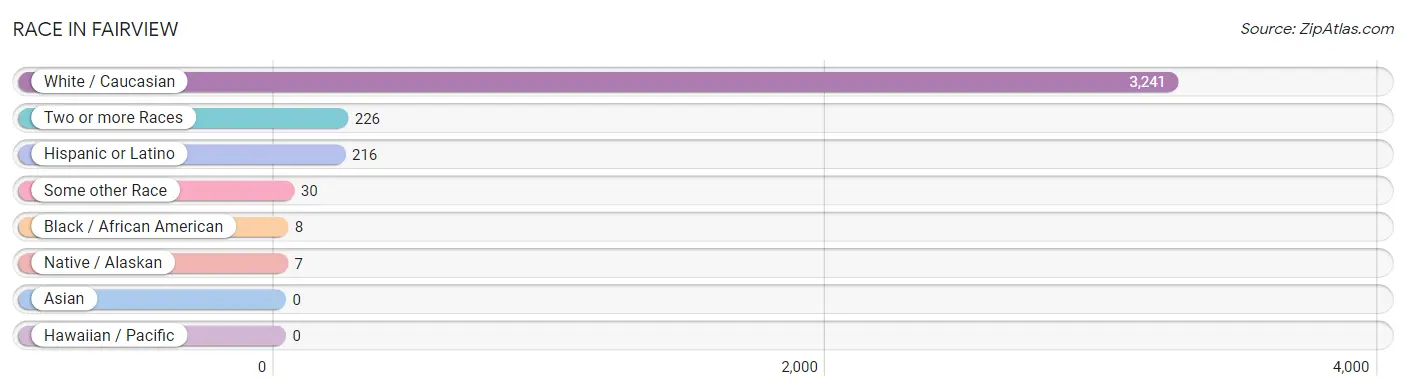
| Race | # Population | % Population |
| Asian | 0 | 0.0% |
| Black / African American | 8 | 0.2% |
| Hawaiian / Pacific | 0 | 0.0% |
| Hispanic or Latino | 216 | 6.1% |
| Native / Alaskan | 7 | 0.2% |
| White / Caucasian | 3,241 | 92.3% |
| Two or more Races | 226 | 6.4% |
| Some other Race | 30 | 0.9% |
| Total | 3,512 | 100.0% |
Ancestry in Fairview
The most populous ancestries reported in Fairview are English (563 | 16.0%), American (242 | 6.9%), German (191 | 5.4%), Irish (184 | 5.2%), and Mexican (145 | 4.1%), together accounting for 37.7% of all Fairview residents.
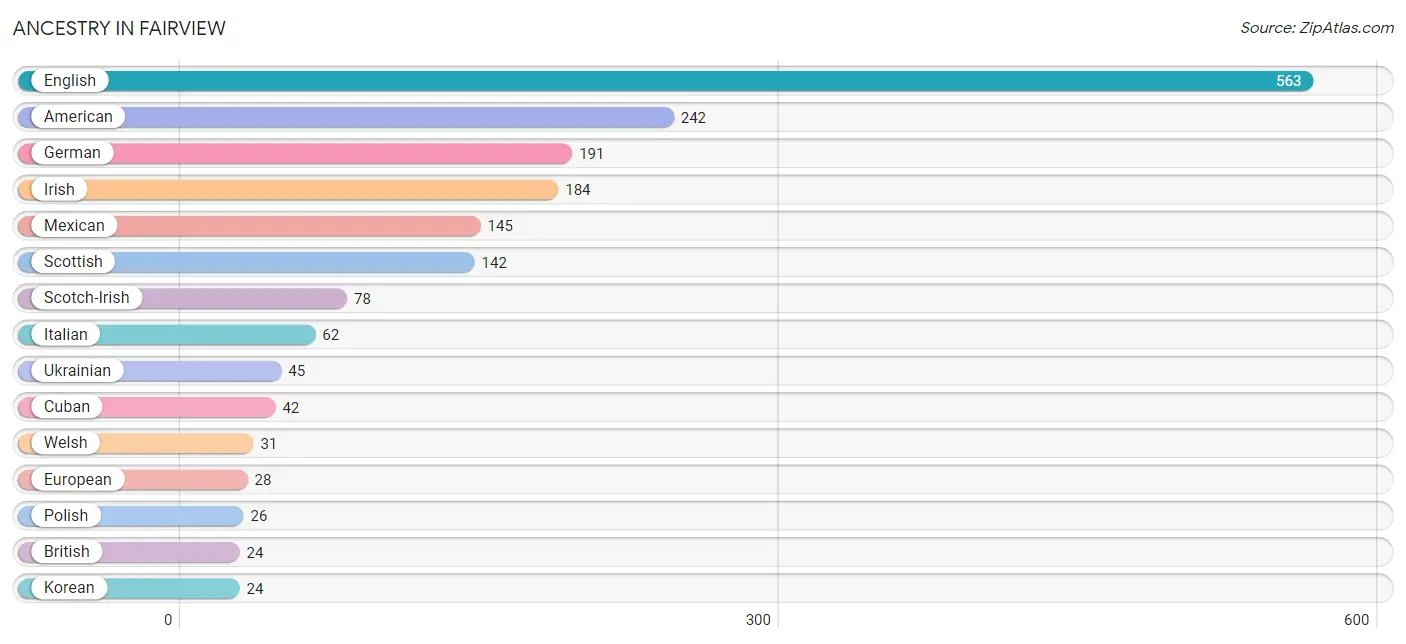
| Ancestry | # Population | % Population |
| American | 242 | 6.9% |
| British | 24 | 0.7% |
| Central American | 16 | 0.5% |
| Cherokee | 9 | 0.3% |
| Costa Rican | 8 | 0.2% |
| Croatian | 9 | 0.3% |
| Cuban | 42 | 1.2% |
| Czech | 9 | 0.3% |
| Dutch | 9 | 0.3% |
| English | 563 | 16.0% |
| European | 28 | 0.8% |
| French | 9 | 0.3% |
| German | 191 | 5.4% |
| Honduran | 8 | 0.2% |
| Hungarian | 9 | 0.3% |
| Irish | 184 | 5.2% |
| Italian | 62 | 1.8% |
| Korean | 24 | 0.7% |
| Lumbee | 7 | 0.2% |
| Mexican | 145 | 4.1% |
| Polish | 26 | 0.7% |
| Scandinavian | 8 | 0.2% |
| Scotch-Irish | 78 | 2.2% |
| Scottish | 142 | 4.0% |
| Spaniard | 13 | 0.4% |
| Swiss | 18 | 0.5% |
| Ukrainian | 45 | 1.3% |
| Welsh | 31 | 0.9% | View All 28 Rows |
Immigrants in Fairview
The most numerous immigrant groups reported in Fairview came from Caribbean (42 | 1.2%), Cuba (42 | 1.2%), Latin America (42 | 1.2%), Eastern Europe (18 | 0.5%), and Europe (18 | 0.5%), together accounting for 4.6% of all Fairview residents.
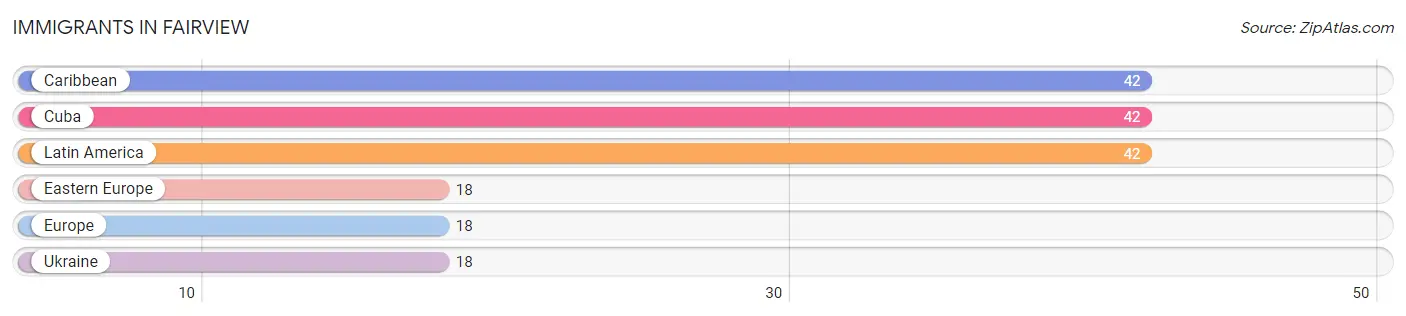
| Immigration Origin | # Population | % Population |
| Caribbean | 42 | 1.2% |
| Cuba | 42 | 1.2% |
| Eastern Europe | 18 | 0.5% |
| Europe | 18 | 0.5% |
| Latin America | 42 | 1.2% |
| Ukraine | 18 | 0.5% | View All 6 Rows |
Sex and Age in Fairview
Sex and Age in Fairview
The most populous age groups in Fairview are 55 to 59 Years (281 | 18.7%) for men and 20 to 24 Years (348 | 17.3%) for women.
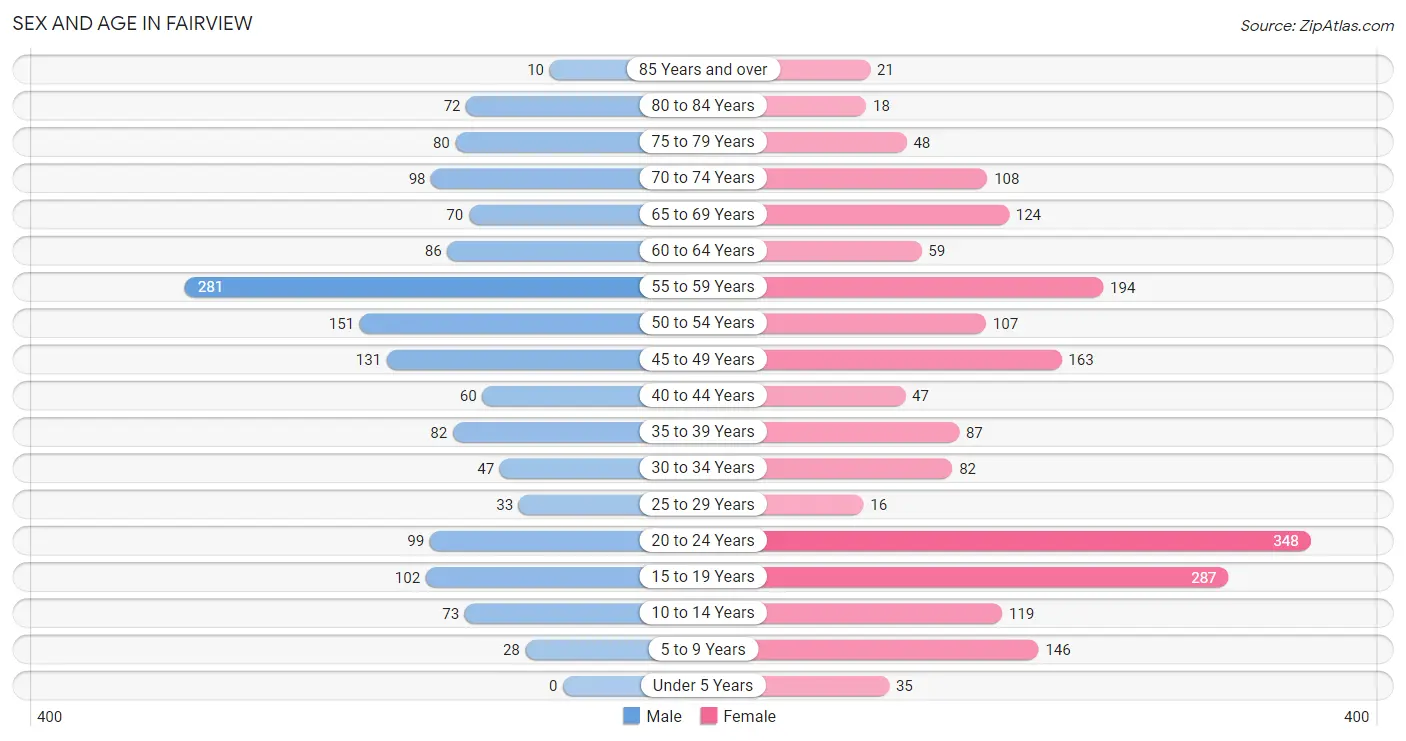
| Age Bracket | Male | Female |
| Under 5 Years | 0 (0.0%) | 35 (1.7%) |
| 5 to 9 Years | 28 (1.9%) | 146 (7.3%) |
| 10 to 14 Years | 73 (4.9%) | 119 (5.9%) |
| 15 to 19 Years | 102 (6.8%) | 287 (14.3%) |
| 20 to 24 Years | 99 (6.6%) | 348 (17.3%) |
| 25 to 29 Years | 33 (2.2%) | 16 (0.8%) |
| 30 to 34 Years | 47 (3.1%) | 82 (4.1%) |
| 35 to 39 Years | 82 (5.5%) | 87 (4.3%) |
| 40 to 44 Years | 60 (4.0%) | 47 (2.3%) |
| 45 to 49 Years | 131 (8.7%) | 163 (8.1%) |
| 50 to 54 Years | 151 (10.1%) | 107 (5.3%) |
| 55 to 59 Years | 281 (18.7%) | 194 (9.7%) |
| 60 to 64 Years | 86 (5.7%) | 59 (2.9%) |
| 65 to 69 Years | 70 (4.7%) | 124 (6.2%) |
| 70 to 74 Years | 98 (6.5%) | 108 (5.4%) |
| 75 to 79 Years | 80 (5.3%) | 48 (2.4%) |
| 80 to 84 Years | 72 (4.8%) | 18 (0.9%) |
| 85 Years and over | 10 (0.7%) | 21 (1.1%) |
| Total | 1,503 (100.0%) | 2,009 (100.0%) |
Families and Households in Fairview
Median Family Size in Fairview
The median family size in Fairview is 3.32 persons per family, with single male/father families (48 | 5.0%) accounting for the largest median family size of 4.04 persons per family. On the other hand, single female/mother families (47 | 4.9%) represent the smallest median family size with 2.28 persons per family.
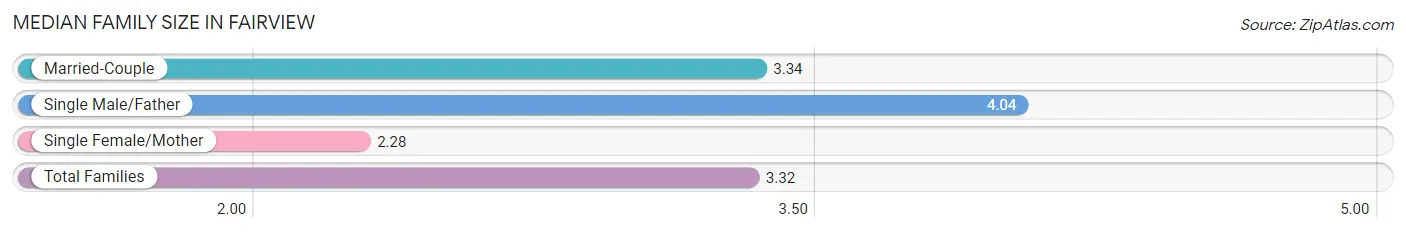
| Family Type | # Families | Family Size |
| Married-Couple | 865 (90.1%) | 3.34 |
| Single Male/Father | 48 (5.0%) | 4.04 |
| Single Female/Mother | 47 (4.9%) | 2.28 |
| Total Families | 960 (100.0%) | 3.32 |
Median Household Size in Fairview
The median household size in Fairview is 2.92 persons per household, with single male/father households (48 | 4.0%) accounting for the largest median household size of 4.63 persons per household. non-family households (244 | 20.3%) represent the smallest median household size with 1.10 persons per household.
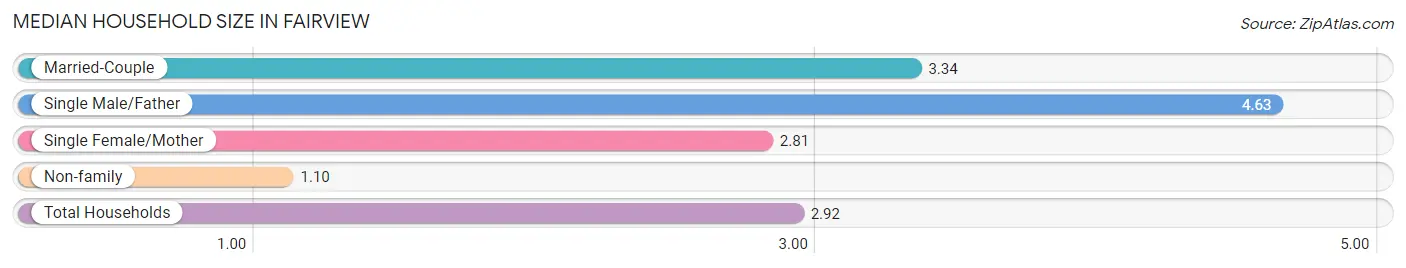
| Household Type | # Households | Household Size |
| Married-Couple | 865 (71.8%) | 3.34 |
| Single Male/Father | 48 (4.0%) | 4.63 |
| Single Female/Mother | 47 (3.9%) | 2.81 |
| Non-family | 244 (20.3%) | 1.10 |
| Total Households | 1,204 (100.0%) | 2.92 |
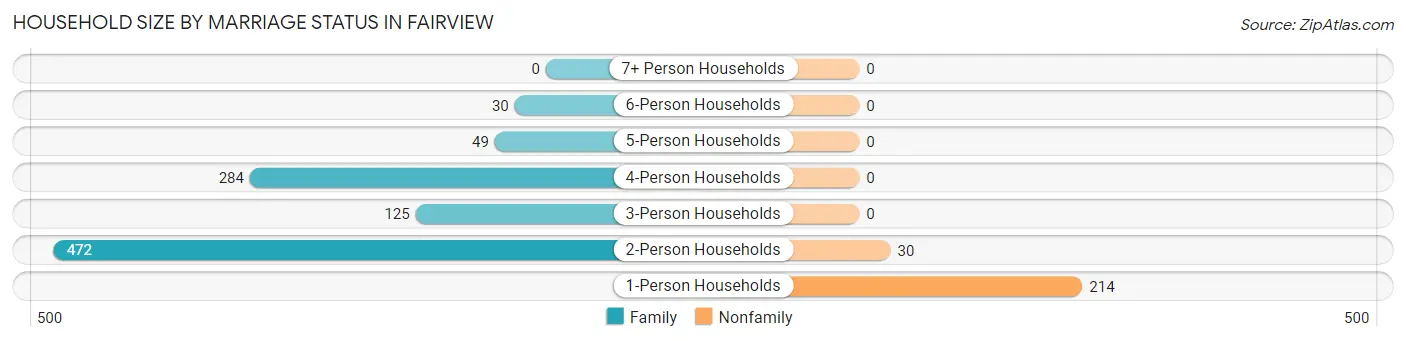
Household Size by Marriage Status in Fairview
Out of a total of 1,204 households in Fairview, 960 (79.7%) are family households, while 244 (20.3%) are nonfamily households. The most numerous type of family households are 2-person households, comprising 472, and the most common type of nonfamily households are 1-person households, comprising 214.
| Household Size | Family Households | Nonfamily Households |
| 1-Person Households | - | 214 (17.8%) |
| 2-Person Households | 472 (39.2%) | 30 (2.5%) |
| 3-Person Households | 125 (10.4%) | 0 (0.0%) |
| 4-Person Households | 284 (23.6%) | 0 (0.0%) |
| 5-Person Households | 49 (4.1%) | 0 (0.0%) |
| 6-Person Households | 30 (2.5%) | 0 (0.0%) |
| 7+ Person Households | 0 (0.0%) | 0 (0.0%) |
| Total | 960 (79.7%) | 244 (20.3%) |
Female Fertility in Fairview
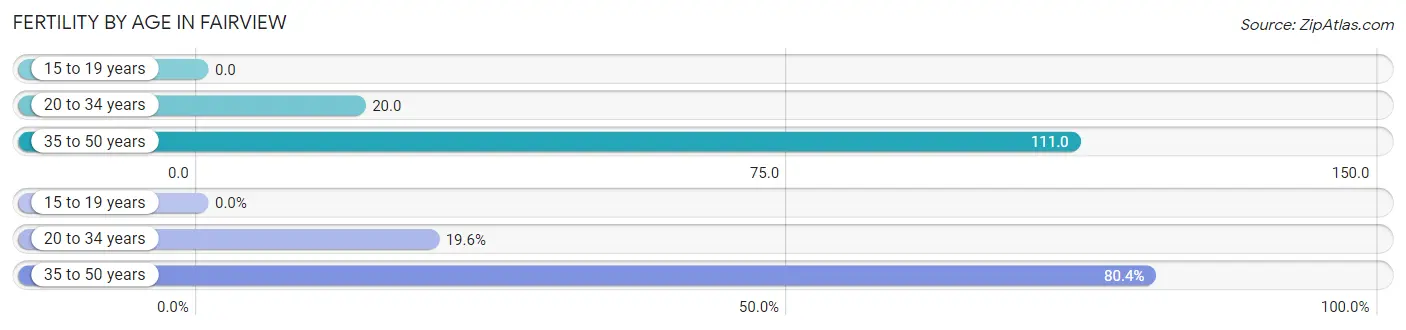
Fertility by Age in Fairview
Average fertility rate in Fairview is 43.0 births per 1,000 women. Women in the age bracket of 35 to 50 years have the highest fertility rate with 111.0 births per 1,000 women. Women in the age bracket of 35 to 50 years acount for 80.4% of all women with births.
| Age Bracket | Women with Births | Births / 1,000 Women |
| 15 to 19 years | 0 (0.0%) | 0.0 |
| 20 to 34 years | 9 (19.6%) | 20.0 |
| 35 to 50 years | 37 (80.4%) | 111.0 |
| Total | 46 (100.0%) | 43.0 |
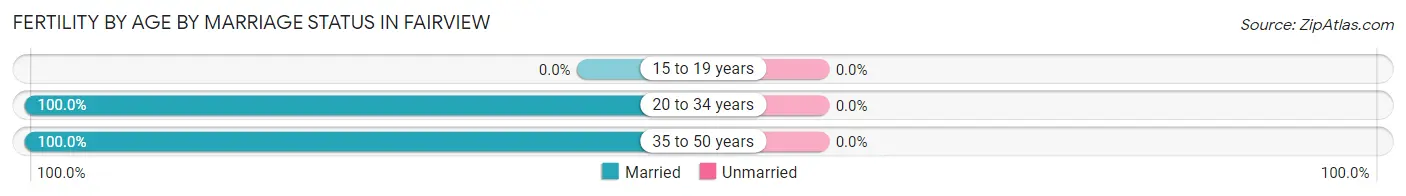
Fertility by Age by Marriage Status in Fairview
| Age Bracket | Married | Unmarried |
| 15 to 19 years | 0 (0.0%) | 0 (0.0%) |
| 20 to 34 years | 9 (100.0%) | 0 (0.0%) |
| 35 to 50 years | 37 (100.0%) | 0 (0.0%) |
| Total | 46 (100.0%) | 0 (0.0%) |
Fertility by Education in Fairview
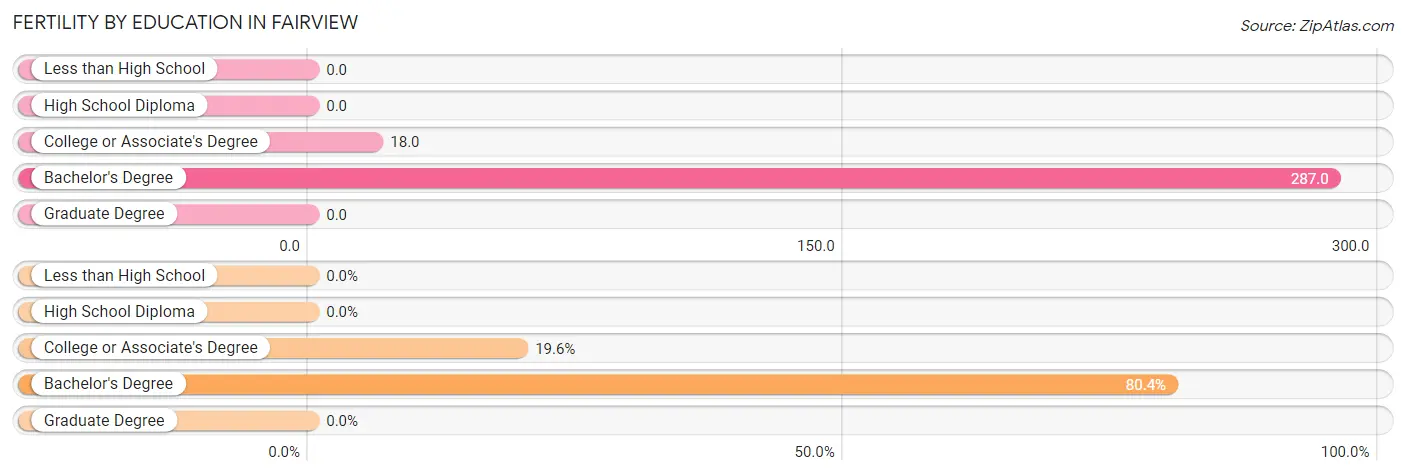
| Educational Attainment | Women with Births | Births / 1,000 Women |
| Less than High School | 0 (0.0%) | 0.0 |
| High School Diploma | 0 (0.0%) | 0.0 |
| College or Associate's Degree | 9 (19.6%) | 18.0 |
| Bachelor's Degree | 37 (80.4%) | 287.0 |
| Graduate Degree | 0 (0.0%) | 0.0 |
| Total | 46 (100.0%) | 43.0 |
Fertility by Education by Marriage Status in Fairview
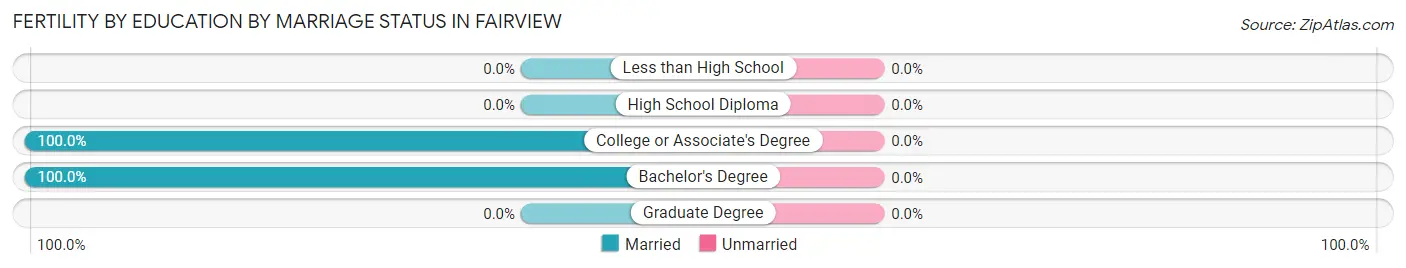
| Educational Attainment | Married | Unmarried |
| Less than High School | 0 (0.0%) | 0 (0.0%) |
| High School Diploma | 0 (0.0%) | 0 (0.0%) |
| College or Associate's Degree | 9 (100.0%) | 0 (0.0%) |
| Bachelor's Degree | 37 (100.0%) | 0 (0.0%) |
| Graduate Degree | 0 (0.0%) | 0 (0.0%) |
| Total | 46 (100.0%) | 0 (0.0%) |
Employment Characteristics in Fairview
Employment by Class of Employer in Fairview
Among the 1,610 employed individuals in Fairview, private company employees (1,197 | 74.4%), not-for-profit organizations (131 | 8.1%), and local government employees (108 | 6.7%) make up the most common classes of employment.
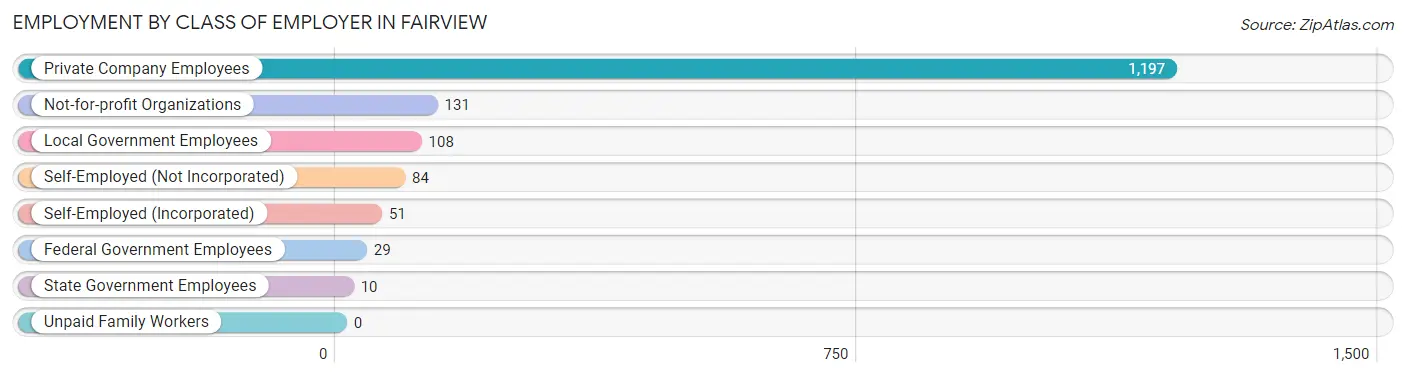
| Employer Class | # Employees | % Employees |
| Private Company Employees | 1,197 | 74.4% |
| Self-Employed (Incorporated) | 51 | 3.2% |
| Self-Employed (Not Incorporated) | 84 | 5.2% |
| Not-for-profit Organizations | 131 | 8.1% |
| Local Government Employees | 108 | 6.7% |
| State Government Employees | 10 | 0.6% |
| Federal Government Employees | 29 | 1.8% |
| Unpaid Family Workers | 0 | 0.0% |
| Total | 1,610 | 100.0% |
Employment Status by Age in Fairview
According to the labor force statistics for Fairview, out of the total population over 16 years of age (3,095), 54.2% or 1,677 individuals are in the labor force, with 2.4% or 40 of them unemployed. The age group with the highest labor force participation rate is 30 to 34 years, with 93.0% or 120 individuals in the labor force. Within the labor force, the 16 to 19 years age range has the highest percentage of unemployed individuals, with 14.9% or 15 of them being unemployed.
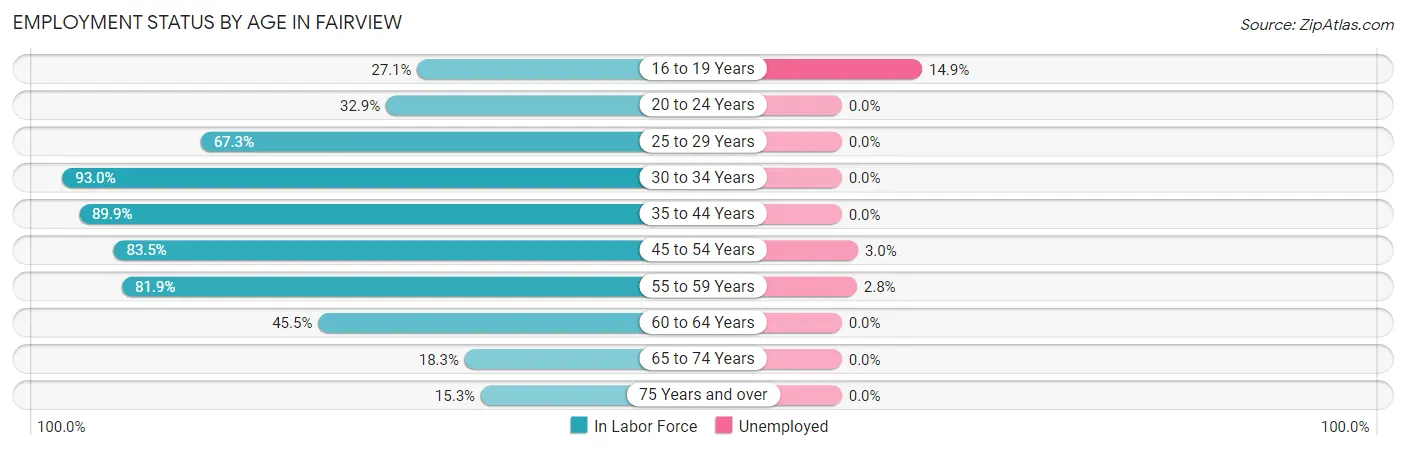
| Age Bracket | In Labor Force | Unemployed |
| 16 to 19 Years | 101 (27.1%) | 15 (14.9%) |
| 20 to 24 Years | 147 (32.9%) | 0 (0.0%) |
| 25 to 29 Years | 33 (67.3%) | 0 (0.0%) |
| 30 to 34 Years | 120 (93.0%) | 0 (0.0%) |
| 35 to 44 Years | 248 (89.9%) | 0 (0.0%) |
| 45 to 54 Years | 461 (83.5%) | 14 (3.0%) |
| 55 to 59 Years | 389 (81.9%) | 11 (2.8%) |
| 60 to 64 Years | 66 (45.5%) | 0 (0.0%) |
| 65 to 74 Years | 73 (18.3%) | 0 (0.0%) |
| 75 Years and over | 38 (15.3%) | 0 (0.0%) |
| Total | 1,677 (54.2%) | 40 (2.4%) |
Employment Status by Educational Attainment in Fairview
According to labor force statistics for Fairview, 81.0% of individuals (1,317) out of the total population between 25 and 64 years of age (1,626) are in the labor force, with 1.9% or 25 of them being unemployed. The group with the highest labor force participation rate are those with the educational attainment of bachelor's degree or higher, with 92.0% or 561 individuals in the labor force. Within the labor force, individuals with high school diploma education have the highest percentage of unemployment, with 7.9% or 25 of them being unemployed.
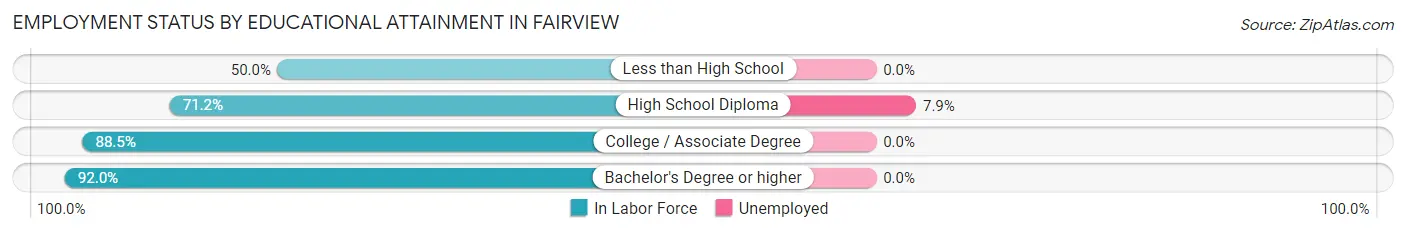
| Educational Attainment | In Labor Force | Unemployed |
| Less than High School | 86 (50.0%) | 0 (0.0%) |
| High School Diploma | 316 (71.2%) | 35 (7.9%) |
| College / Associate Degree | 354 (88.5%) | 0 (0.0%) |
| Bachelor's Degree or higher | 561 (92.0%) | 0 (0.0%) |
| Total | 1,317 (81.0%) | 31 (1.9%) |
Employment Occupations by Sex in Fairview
Management, Business, Science and Arts Occupations
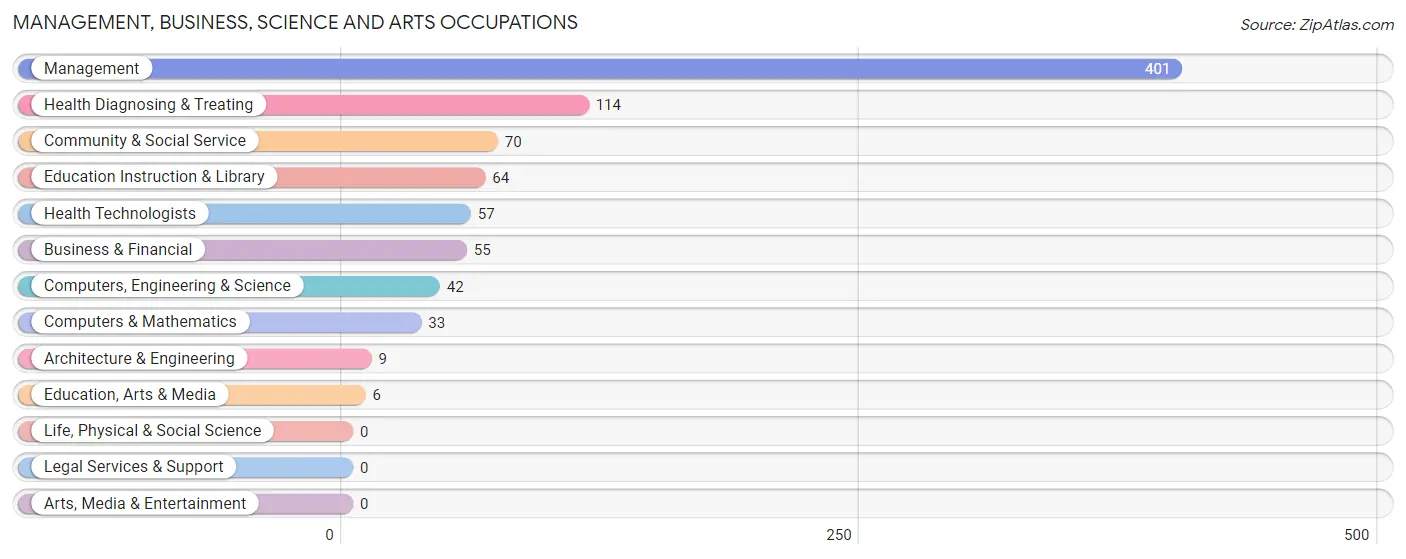
The most common Management, Business, Science and Arts occupations in Fairview are Management (401 | 24.5%), Health Diagnosing & Treating (114 | 7.0%), Community & Social Service (70 | 4.3%), Education Instruction & Library (64 | 3.9%), and Health Technologists (57 | 3.5%).
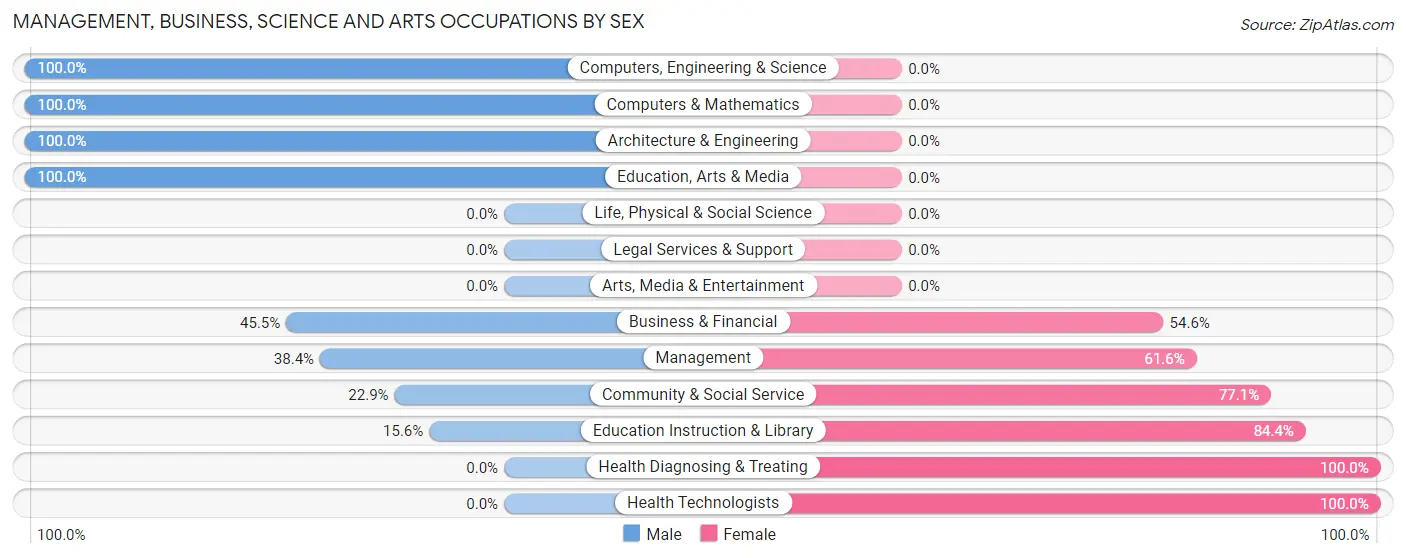
Management, Business, Science and Arts Occupations by Sex
Within the Management, Business, Science and Arts occupations in Fairview, the most male-oriented occupations are Computers, Engineering & Science (100.0%), Computers & Mathematics (100.0%), and Architecture & Engineering (100.0%), while the most female-oriented occupations are Health Diagnosing & Treating (100.0%), Health Technologists (100.0%), and Education Instruction & Library (84.4%).
| Occupation | Male | Female |
| Management | 154 (38.4%) | 247 (61.6%) |
| Business & Financial | 25 (45.5%) | 30 (54.5%) |
| Computers, Engineering & Science | 42 (100.0%) | 0 (0.0%) |
| Computers & Mathematics | 33 (100.0%) | 0 (0.0%) |
| Architecture & Engineering | 9 (100.0%) | 0 (0.0%) |
| Life, Physical & Social Science | 0 (0.0%) | 0 (0.0%) |
| Community & Social Service | 16 (22.9%) | 54 (77.1%) |
| Education, Arts & Media | 6 (100.0%) | 0 (0.0%) |
| Legal Services & Support | 0 (0.0%) | 0 (0.0%) |
| Education Instruction & Library | 10 (15.6%) | 54 (84.4%) |
| Arts, Media & Entertainment | 0 (0.0%) | 0 (0.0%) |
| Health Diagnosing & Treating | 0 (0.0%) | 114 (100.0%) |
| Health Technologists | 0 (0.0%) | 57 (100.0%) |
| Total (Category) | 237 (34.7%) | 445 (65.2%) |
| Total (Overall) | 1,017 (62.2%) | 619 (37.8%) |
Services Occupations
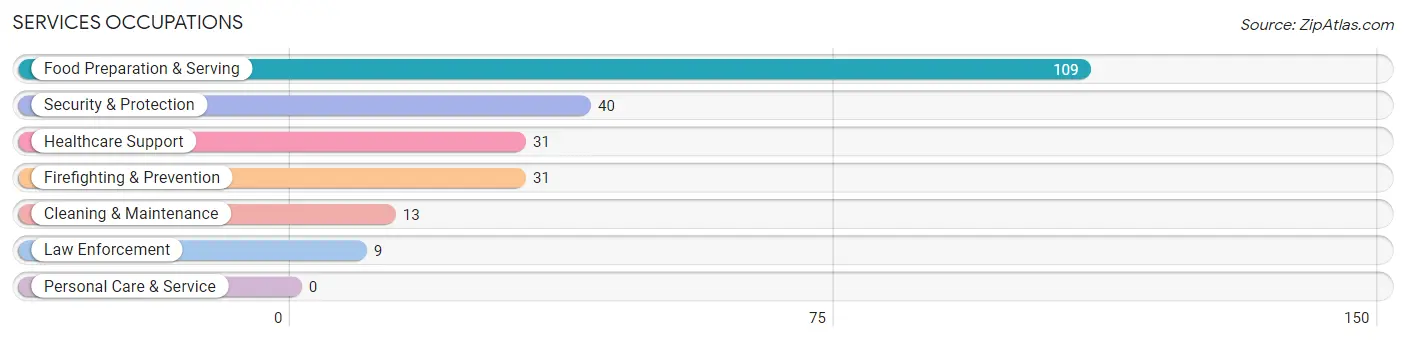
The most common Services occupations in Fairview are Food Preparation & Serving (109 | 6.7%), Security & Protection (40 | 2.4%), Healthcare Support (31 | 1.9%), Firefighting & Prevention (31 | 1.9%), and Cleaning & Maintenance (13 | 0.8%).
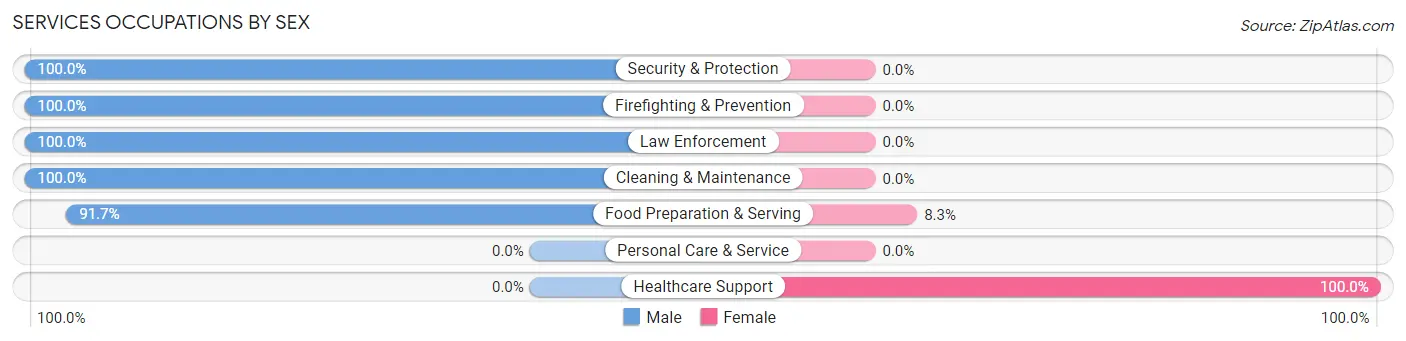
Services Occupations by Sex
Within the Services occupations in Fairview, the most male-oriented occupations are Security & Protection (100.0%), Firefighting & Prevention (100.0%), and Law Enforcement (100.0%), while the most female-oriented occupations are Healthcare Support (100.0%), and Food Preparation & Serving (8.3%).
| Occupation | Male | Female |
| Healthcare Support | 0 (0.0%) | 31 (100.0%) |
| Security & Protection | 40 (100.0%) | 0 (0.0%) |
| Firefighting & Prevention | 31 (100.0%) | 0 (0.0%) |
| Law Enforcement | 9 (100.0%) | 0 (0.0%) |
| Food Preparation & Serving | 100 (91.7%) | 9 (8.3%) |
| Cleaning & Maintenance | 13 (100.0%) | 0 (0.0%) |
| Personal Care & Service | 0 (0.0%) | 0 (0.0%) |
| Total (Category) | 153 (79.3%) | 40 (20.7%) |
| Total (Overall) | 1,017 (62.2%) | 619 (37.8%) |
Sales and Office Occupations
The most common Sales and Office occupations in Fairview are Office & Administration (185 | 11.3%), and Sales & Related (184 | 11.3%).

Sales and Office Occupations by Sex

| Occupation | Male | Female |
| Sales & Related | 156 (84.8%) | 28 (15.2%) |
| Office & Administration | 81 (43.8%) | 104 (56.2%) |
| Total (Category) | 237 (64.2%) | 132 (35.8%) |
| Total (Overall) | 1,017 (62.2%) | 619 (37.8%) |
Natural Resources, Construction and Maintenance Occupations
The most common Natural Resources, Construction and Maintenance occupations in Fairview are Construction & Extraction (128 | 7.8%), and Installation, Maintenance & Repair (104 | 6.4%).
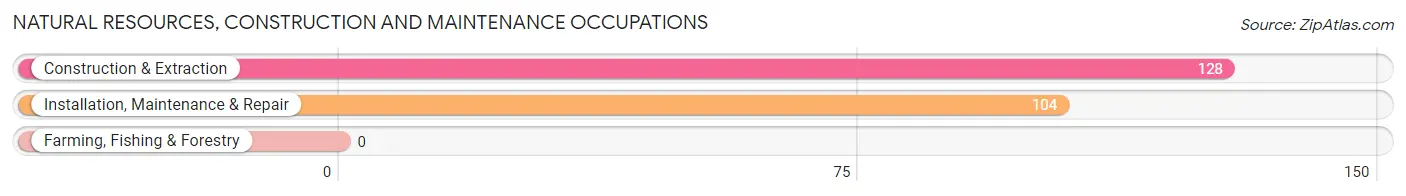
Natural Resources, Construction and Maintenance Occupations by Sex
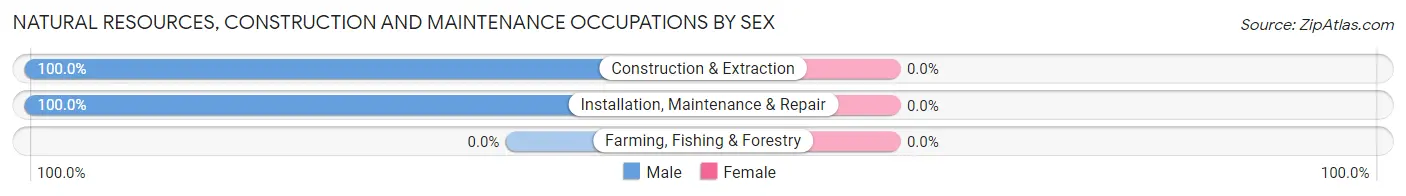
| Occupation | Male | Female |
| Farming, Fishing & Forestry | 0 (0.0%) | 0 (0.0%) |
| Construction & Extraction | 128 (100.0%) | 0 (0.0%) |
| Installation, Maintenance & Repair | 104 (100.0%) | 0 (0.0%) |
| Total (Category) | 232 (100.0%) | 0 (0.0%) |
| Total (Overall) | 1,017 (62.2%) | 619 (37.8%) |
Production, Transportation and Moving Occupations
The most common Production, Transportation and Moving occupations in Fairview are Production (80 | 4.9%), Material Moving (51 | 3.1%), and Transportation (29 | 1.8%).
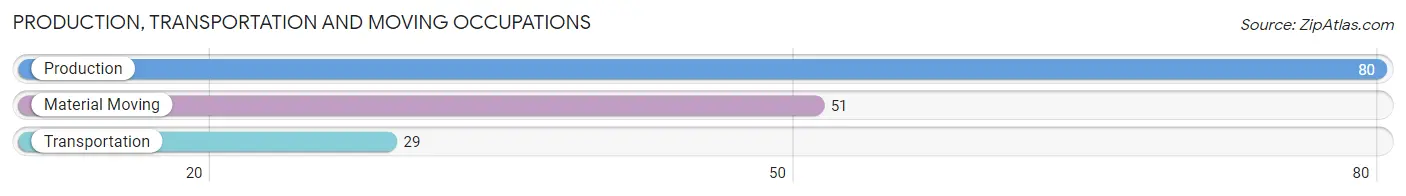
Production, Transportation and Moving Occupations by Sex
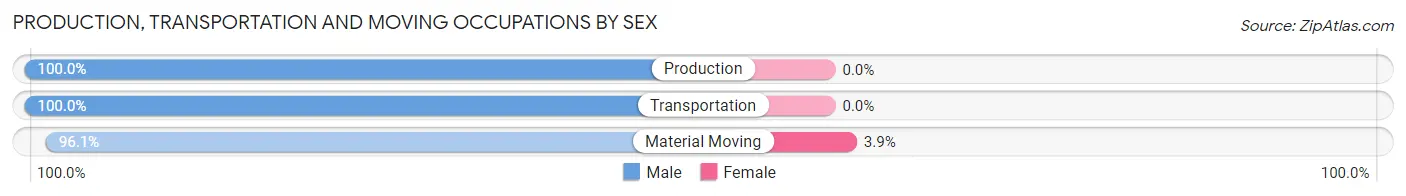
| Occupation | Male | Female |
| Production | 80 (100.0%) | 0 (0.0%) |
| Transportation | 29 (100.0%) | 0 (0.0%) |
| Material Moving | 49 (96.1%) | 2 (3.9%) |
| Total (Category) | 158 (98.8%) | 2 (1.3%) |
| Total (Overall) | 1,017 (62.2%) | 619 (37.8%) |
Employment Industries by Sex in Fairview
Employment Industries in Fairview
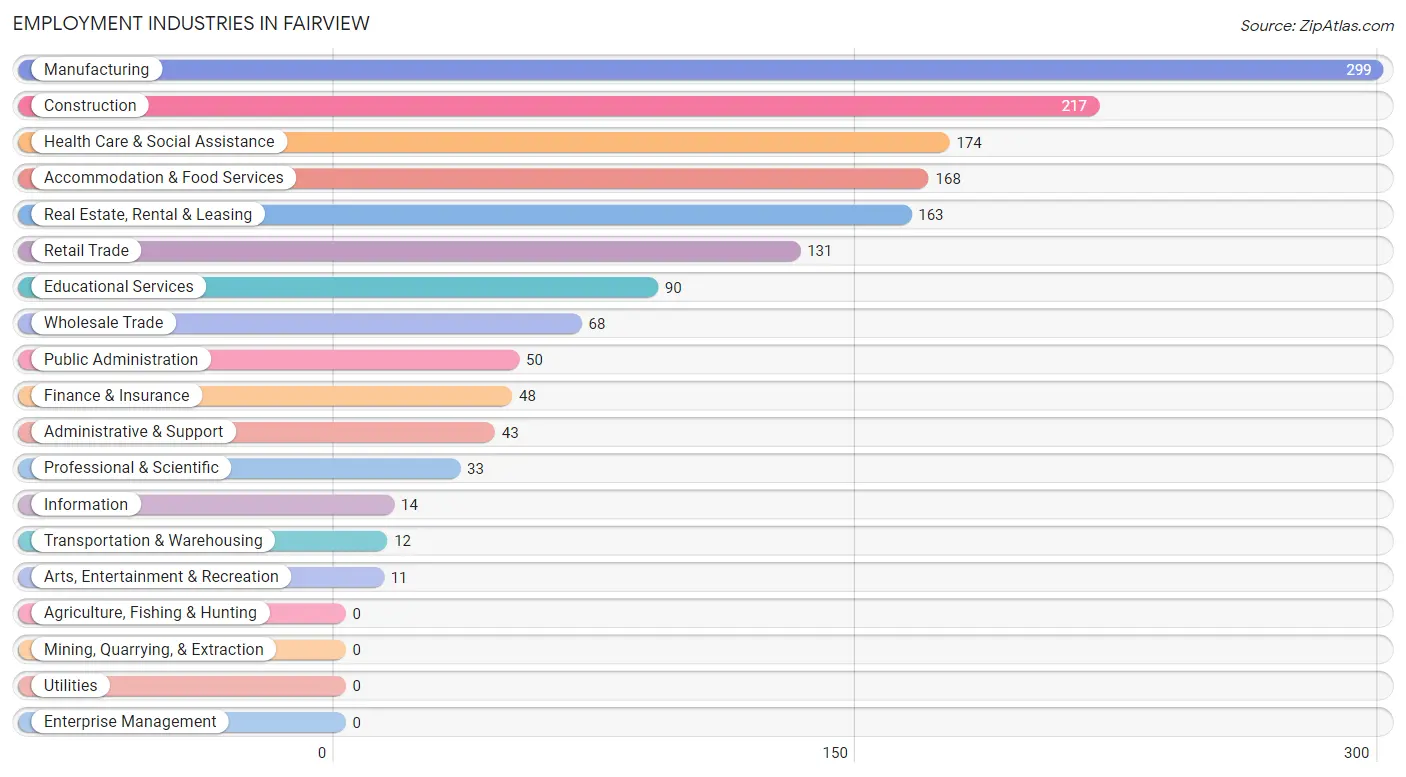
The major employment industries in Fairview include Manufacturing (299 | 18.3%), Construction (217 | 13.3%), Health Care & Social Assistance (174 | 10.6%), Accommodation & Food Services (168 | 10.3%), and Real Estate, Rental & Leasing (163 | 10.0%).
Employment Industries by Sex in Fairview
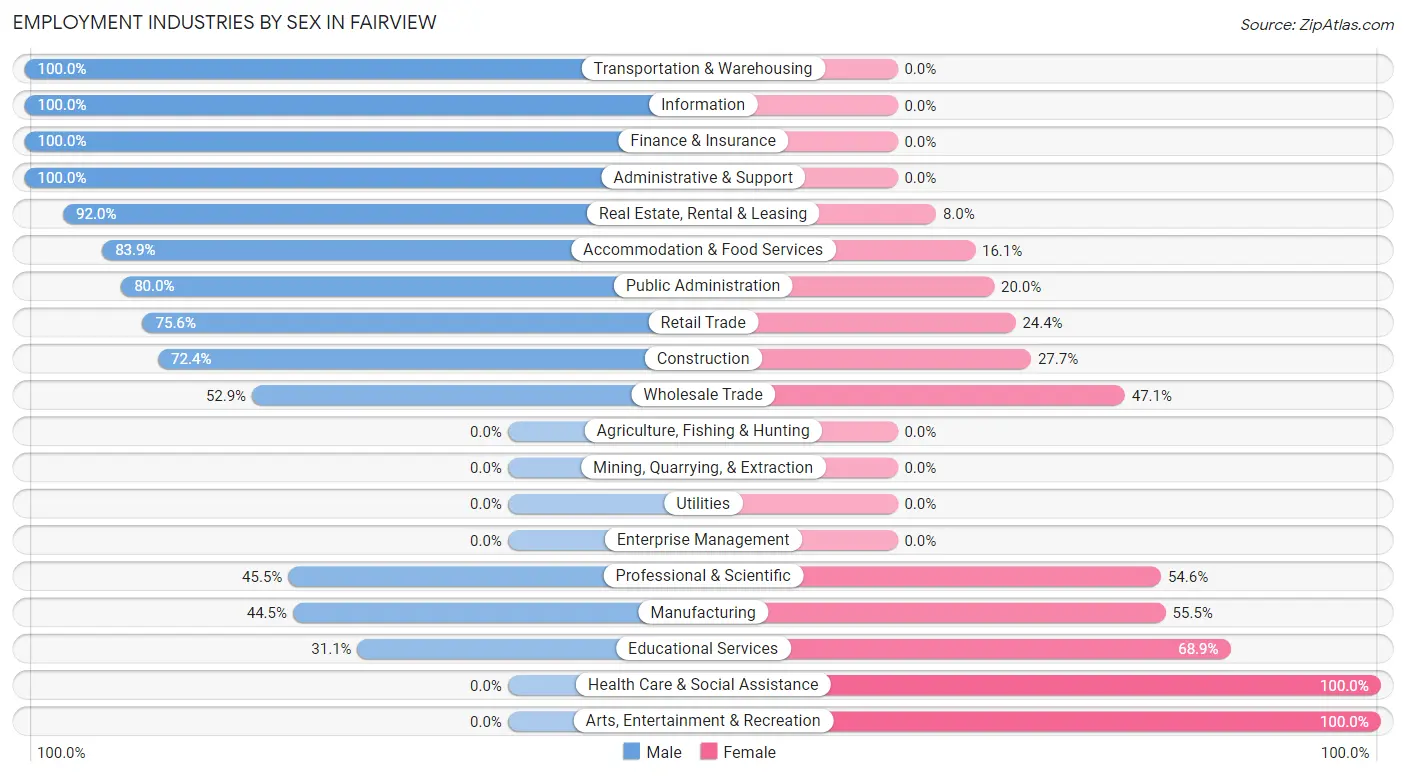
The Fairview industries that see more men than women are Transportation & Warehousing (100.0%), Information (100.0%), and Finance & Insurance (100.0%), whereas the industries that tend to have a higher number of women are Health Care & Social Assistance (100.0%), Arts, Entertainment & Recreation (100.0%), and Educational Services (68.9%).
| Industry | Male | Female |
| Agriculture, Fishing & Hunting | 0 (0.0%) | 0 (0.0%) |
| Mining, Quarrying, & Extraction | 0 (0.0%) | 0 (0.0%) |
| Construction | 157 (72.4%) | 60 (27.7%) |
| Manufacturing | 133 (44.5%) | 166 (55.5%) |
| Wholesale Trade | 36 (52.9%) | 32 (47.1%) |
| Retail Trade | 99 (75.6%) | 32 (24.4%) |
| Transportation & Warehousing | 12 (100.0%) | 0 (0.0%) |
| Utilities | 0 (0.0%) | 0 (0.0%) |
| Information | 14 (100.0%) | 0 (0.0%) |
| Finance & Insurance | 48 (100.0%) | 0 (0.0%) |
| Real Estate, Rental & Leasing | 150 (92.0%) | 13 (8.0%) |
| Professional & Scientific | 15 (45.5%) | 18 (54.5%) |
| Enterprise Management | 0 (0.0%) | 0 (0.0%) |
| Administrative & Support | 43 (100.0%) | 0 (0.0%) |
| Educational Services | 28 (31.1%) | 62 (68.9%) |
| Health Care & Social Assistance | 0 (0.0%) | 174 (100.0%) |
| Arts, Entertainment & Recreation | 0 (0.0%) | 11 (100.0%) |
| Accommodation & Food Services | 141 (83.9%) | 27 (16.1%) |
| Public Administration | 40 (80.0%) | 10 (20.0%) |
| Total | 1,017 (62.2%) | 619 (37.8%) |
Education in Fairview
School Enrollment in Fairview
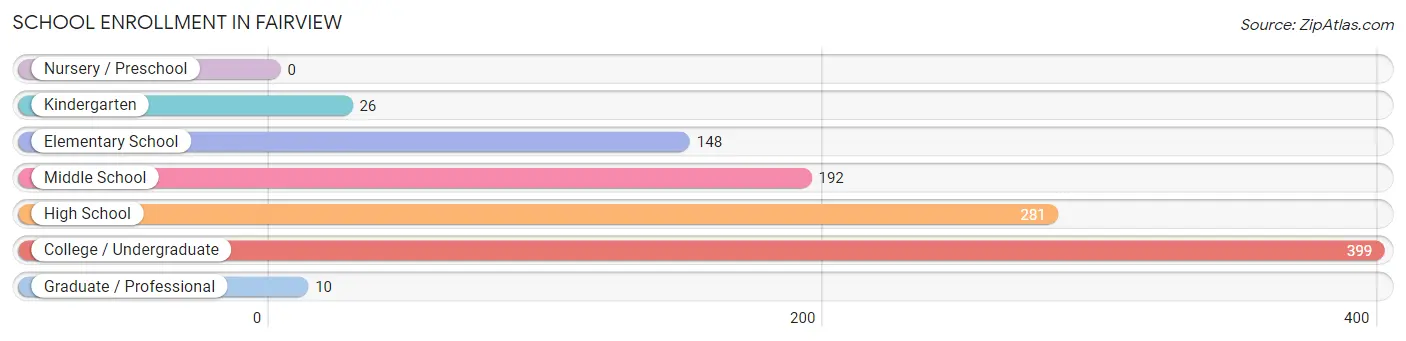
The most common levels of schooling among the 1,056 students in Fairview are college / undergraduate (399 | 37.8%), high school (281 | 26.6%), and middle school (192 | 18.2%).
| School Level | # Students | % Students |
| Nursery / Preschool | 0 | 0.0% |
| Kindergarten | 26 | 2.5% |
| Elementary School | 148 | 14.0% |
| Middle School | 192 | 18.2% |
| High School | 281 | 26.6% |
| College / Undergraduate | 399 | 37.8% |
| Graduate / Professional | 10 | 0.9% |
| Total | 1,056 | 100.0% |
School Enrollment by Age by Funding Source in Fairview
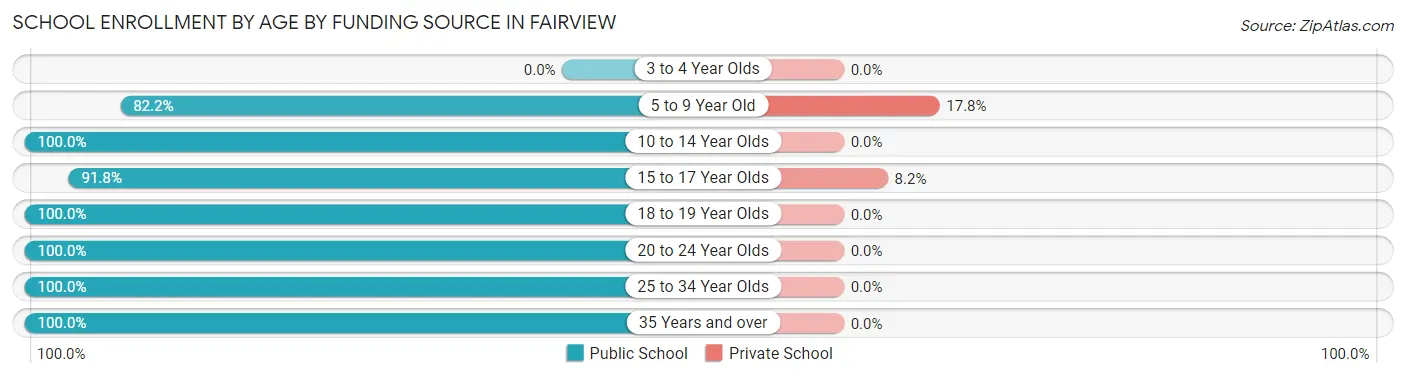
Out of a total of 1,056 students who are enrolled in schools in Fairview, 54 (5.1%) attend a private institution, while the remaining 1,002 (94.9%) are enrolled in public schools. The age group of 5 to 9 year old has the highest likelihood of being enrolled in private schools, with 31 (17.8% in the age bracket) enrolled. Conversely, the age group of 10 to 14 year olds has the lowest likelihood of being enrolled in a private school, with 192 (100.0% in the age bracket) attending a public institution.
| Age Bracket | Public School | Private School |
| 3 to 4 Year Olds | 0 (0.0%) | 0 (0.0%) |
| 5 to 9 Year Old | 143 (82.2%) | 31 (17.8%) |
| 10 to 14 Year Olds | 192 (100.0%) | 0 (0.0%) |
| 15 to 17 Year Olds | 258 (91.8%) | 23 (8.2%) |
| 18 to 19 Year Olds | 40 (100.0%) | 0 (0.0%) |
| 20 to 24 Year Olds | 354 (100.0%) | 0 (0.0%) |
| 25 to 34 Year Olds | 5 (100.0%) | 0 (0.0%) |
| 35 Years and over | 10 (100.0%) | 0 (0.0%) |
| Total | 1,002 (94.9%) | 54 (5.1%) |
Educational Attainment by Field of Study in Fairview
Business (350 | 48.4%), science & technology (81 | 11.2%), education (45 | 6.2%), arts & humanities (43 | 5.9%), and computers & mathematics (36 | 5.0%) are the most common fields of study among 723 individuals in Fairview who have obtained a bachelor's degree or higher.
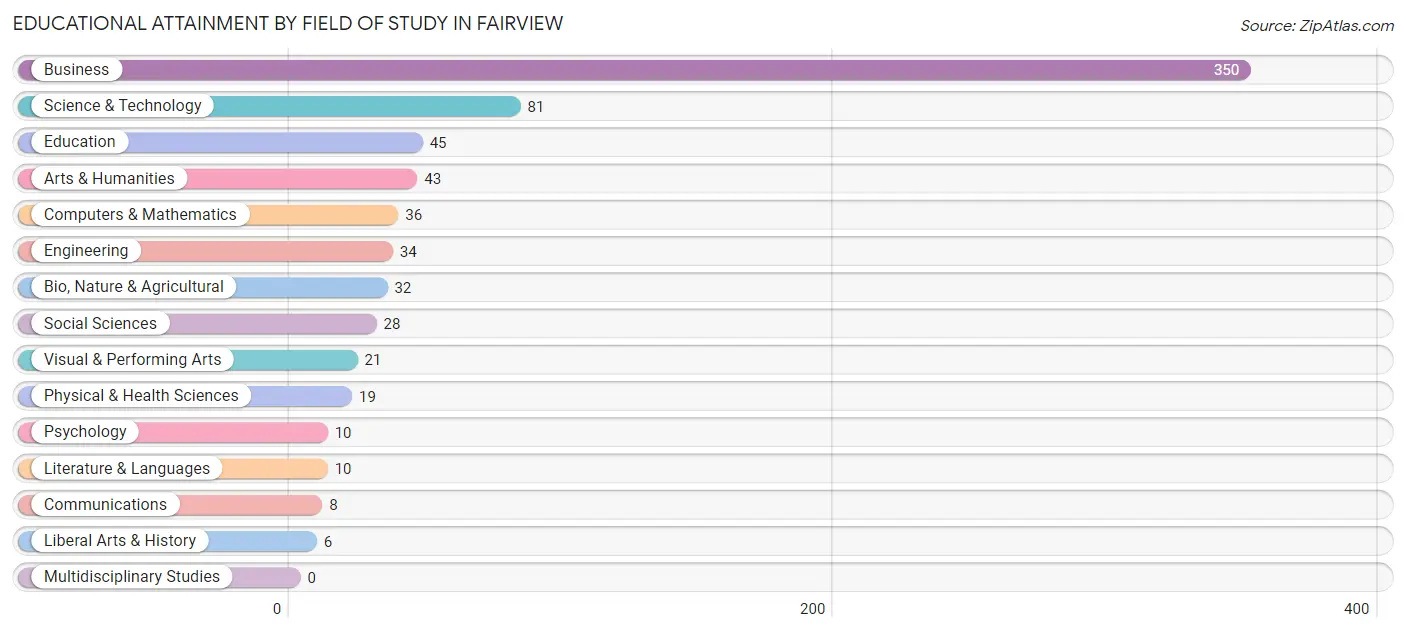
| Field of Study | # Graduates | % Graduates |
| Computers & Mathematics | 36 | 5.0% |
| Bio, Nature & Agricultural | 32 | 4.4% |
| Physical & Health Sciences | 19 | 2.6% |
| Psychology | 10 | 1.4% |
| Social Sciences | 28 | 3.9% |
| Engineering | 34 | 4.7% |
| Multidisciplinary Studies | 0 | 0.0% |
| Science & Technology | 81 | 11.2% |
| Business | 350 | 48.4% |
| Education | 45 | 6.2% |
| Literature & Languages | 10 | 1.4% |
| Liberal Arts & History | 6 | 0.8% |
| Visual & Performing Arts | 21 | 2.9% |
| Communications | 8 | 1.1% |
| Arts & Humanities | 43 | 5.9% |
| Total | 723 | 100.0% |
Transportation & Commute in Fairview
Vehicle Availability by Sex in Fairview
The most prevalent vehicle ownership categories in Fairview are males with 2 vehicles (421, accounting for 41.8%) and females with 2 vehicles (245, making up 69.9%).
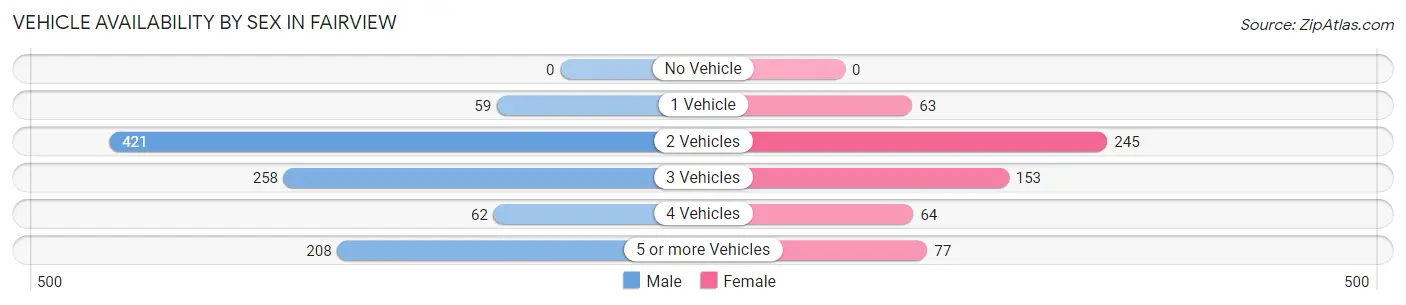
| Vehicles Available | Male | Female |
| No Vehicle | 0 (0.0%) | 0 (0.0%) |
| 1 Vehicle | 59 (5.9%) | 63 (10.5%) |
| 2 Vehicles | 421 (41.8%) | 245 (40.7%) |
| 3 Vehicles | 258 (25.6%) | 153 (25.4%) |
| 4 Vehicles | 62 (6.1%) | 64 (10.6%) |
| 5 or more Vehicles | 208 (20.6%) | 77 (12.8%) |
| Total | 1,008 (100.0%) | 602 (100.0%) |
Commute Time in Fairview
The most frequently occuring commute durations in Fairview are 30 to 34 minutes (392 commuters, 25.2%), 15 to 19 minutes (255 commuters, 16.4%), and 20 to 24 minutes (236 commuters, 15.2%).
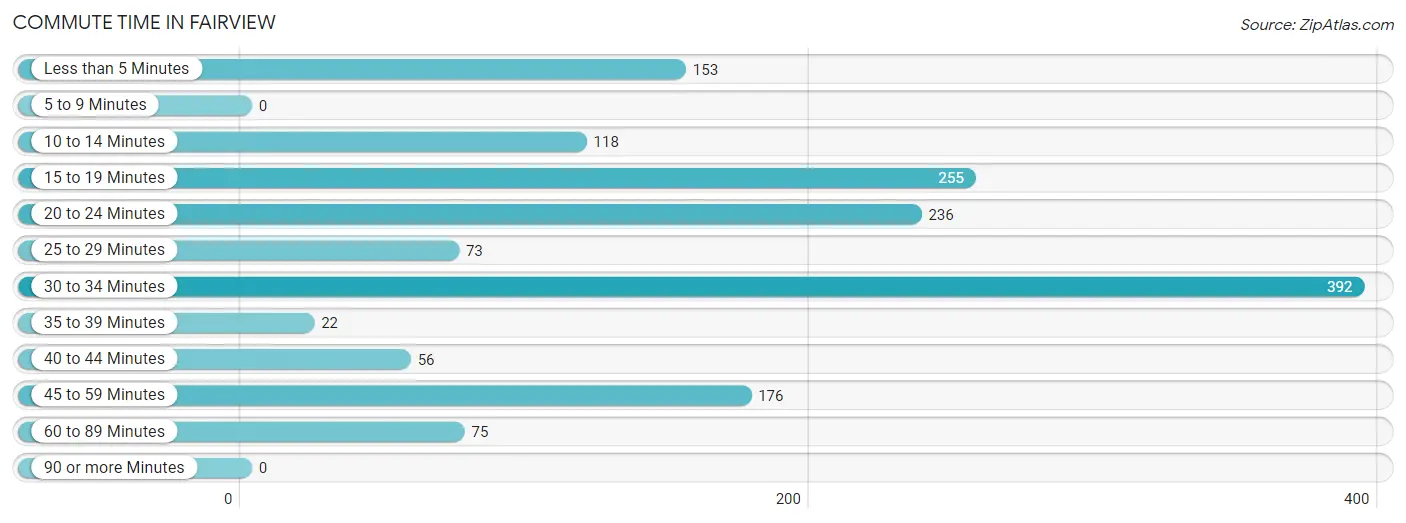
| Commute Time | # Commuters | % Commuters |
| Less than 5 Minutes | 153 | 9.8% |
| 5 to 9 Minutes | 0 | 0.0% |
| 10 to 14 Minutes | 118 | 7.6% |
| 15 to 19 Minutes | 255 | 16.4% |
| 20 to 24 Minutes | 236 | 15.2% |
| 25 to 29 Minutes | 73 | 4.7% |
| 30 to 34 Minutes | 392 | 25.2% |
| 35 to 39 Minutes | 22 | 1.4% |
| 40 to 44 Minutes | 56 | 3.6% |
| 45 to 59 Minutes | 176 | 11.3% |
| 60 to 89 Minutes | 75 | 4.8% |
| 90 or more Minutes | 0 | 0.0% |
Commute Time by Sex in Fairview
The most common commute times in Fairview are 15 to 19 minutes (239 commuters, 24.6%) for males and 30 to 34 minutes (153 commuters, 26.2%) for females.
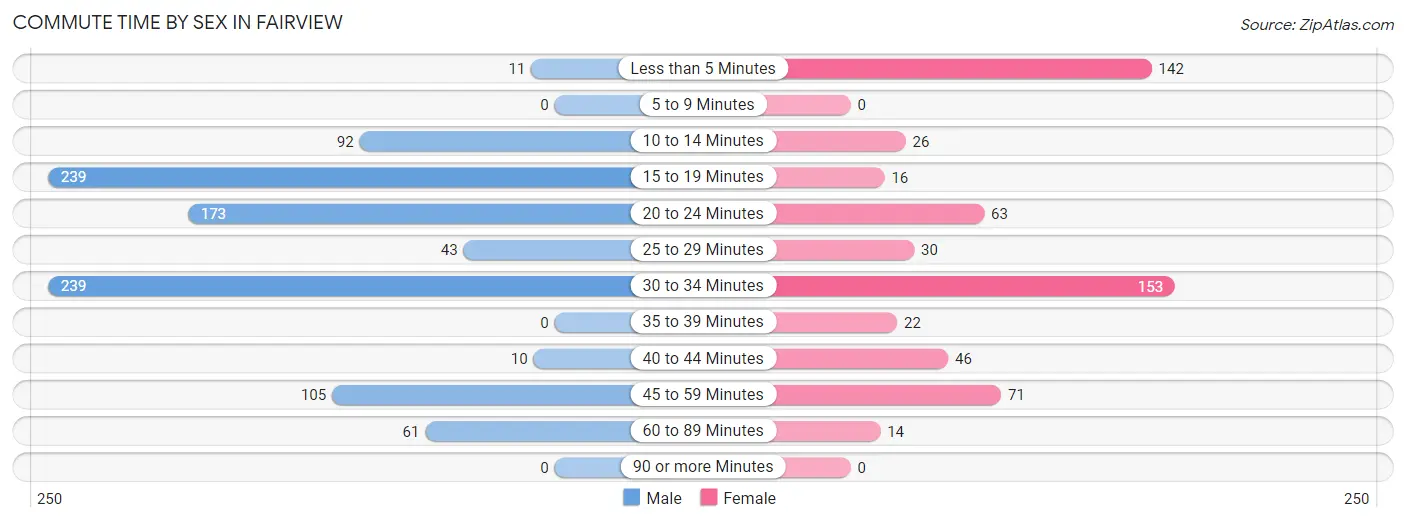
| Commute Time | Male | Female |
| Less than 5 Minutes | 11 (1.1%) | 142 (24.4%) |
| 5 to 9 Minutes | 0 (0.0%) | 0 (0.0%) |
| 10 to 14 Minutes | 92 (9.5%) | 26 (4.5%) |
| 15 to 19 Minutes | 239 (24.6%) | 16 (2.7%) |
| 20 to 24 Minutes | 173 (17.8%) | 63 (10.8%) |
| 25 to 29 Minutes | 43 (4.4%) | 30 (5.1%) |
| 30 to 34 Minutes | 239 (24.6%) | 153 (26.2%) |
| 35 to 39 Minutes | 0 (0.0%) | 22 (3.8%) |
| 40 to 44 Minutes | 10 (1.0%) | 46 (7.9%) |
| 45 to 59 Minutes | 105 (10.8%) | 71 (12.2%) |
| 60 to 89 Minutes | 61 (6.3%) | 14 (2.4%) |
| 90 or more Minutes | 0 (0.0%) | 0 (0.0%) |
Time of Departure to Work by Sex in Fairview
The most frequent times of departure to work in Fairview are 6:30 AM to 6:59 AM (248, 25.5%) for males and 7:00 AM to 7:29 AM (273, 46.8%) for females.
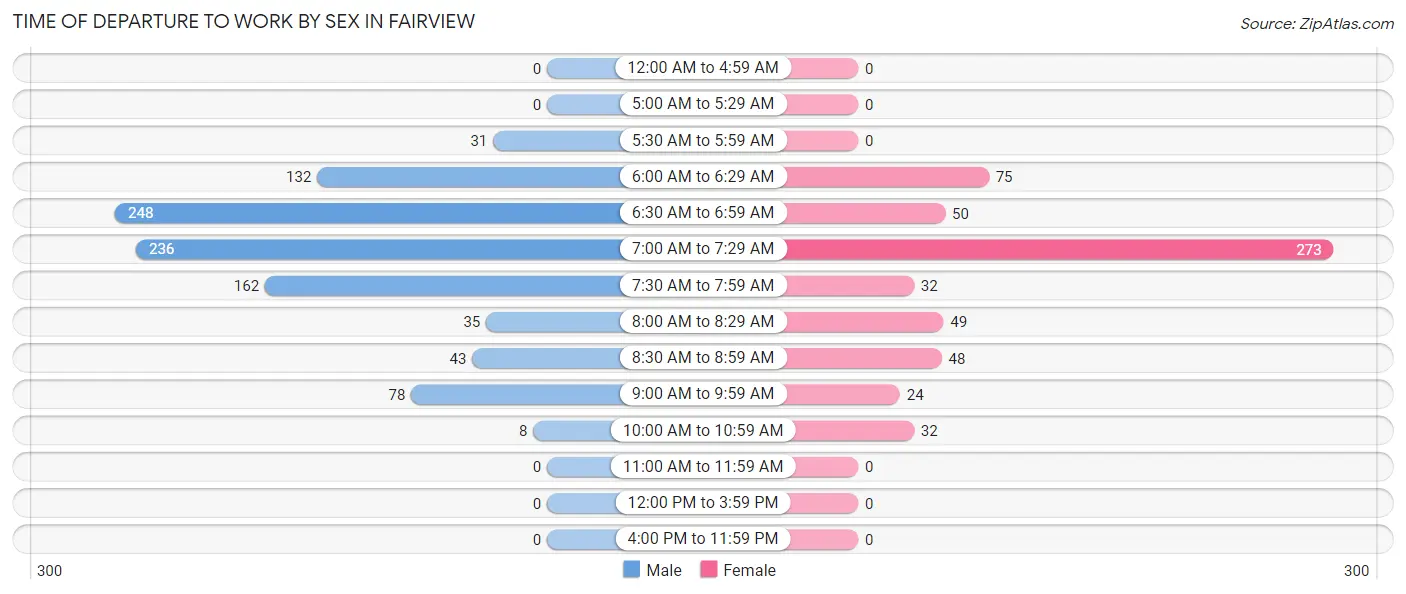
| Time of Departure | Male | Female |
| 12:00 AM to 4:59 AM | 0 (0.0%) | 0 (0.0%) |
| 5:00 AM to 5:29 AM | 0 (0.0%) | 0 (0.0%) |
| 5:30 AM to 5:59 AM | 31 (3.2%) | 0 (0.0%) |
| 6:00 AM to 6:29 AM | 132 (13.6%) | 75 (12.9%) |
| 6:30 AM to 6:59 AM | 248 (25.5%) | 50 (8.6%) |
| 7:00 AM to 7:29 AM | 236 (24.2%) | 273 (46.8%) |
| 7:30 AM to 7:59 AM | 162 (16.7%) | 32 (5.5%) |
| 8:00 AM to 8:29 AM | 35 (3.6%) | 49 (8.4%) |
| 8:30 AM to 8:59 AM | 43 (4.4%) | 48 (8.2%) |
| 9:00 AM to 9:59 AM | 78 (8.0%) | 24 (4.1%) |
| 10:00 AM to 10:59 AM | 8 (0.8%) | 32 (5.5%) |
| 11:00 AM to 11:59 AM | 0 (0.0%) | 0 (0.0%) |
| 12:00 PM to 3:59 PM | 0 (0.0%) | 0 (0.0%) |
| 4:00 PM to 11:59 PM | 0 (0.0%) | 0 (0.0%) |
| Total | 973 (100.0%) | 583 (100.0%) |
Housing Occupancy in Fairview
Occupancy by Ownership in Fairview
Of the total 847 dwellings in Fairview, owner-occupied units account for 803 (94.8%), while renter-occupied units make up 44 (5.2%).
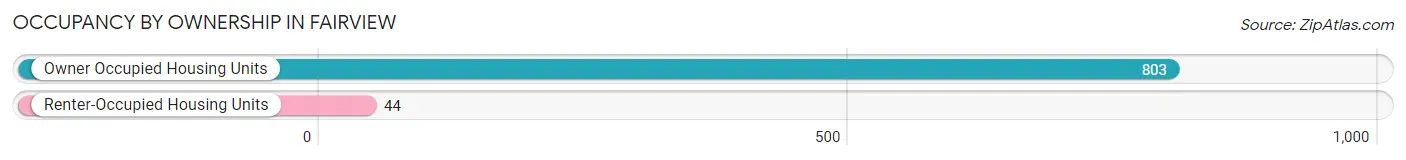
| Occupancy | # Housing Units | % Housing Units |
| Owner Occupied Housing Units | 803 | 94.8% |
| Renter-Occupied Housing Units | 44 | 5.2% |
| Total Occupied Housing Units | 847 | 100.0% |
Occupancy by Household Size in Fairview
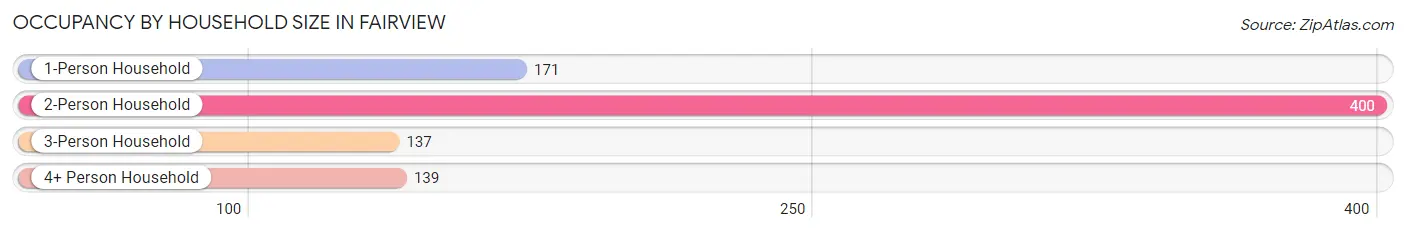
| Household Size | # Housing Units | % Housing Units |
| 1-Person Household | 171 | 20.2% |
| 2-Person Household | 400 | 47.2% |
| 3-Person Household | 137 | 16.2% |
| 4+ Person Household | 139 | 16.4% |
| Total Housing Units | 847 | 100.0% |
Occupancy by Ownership by Household Size in Fairview
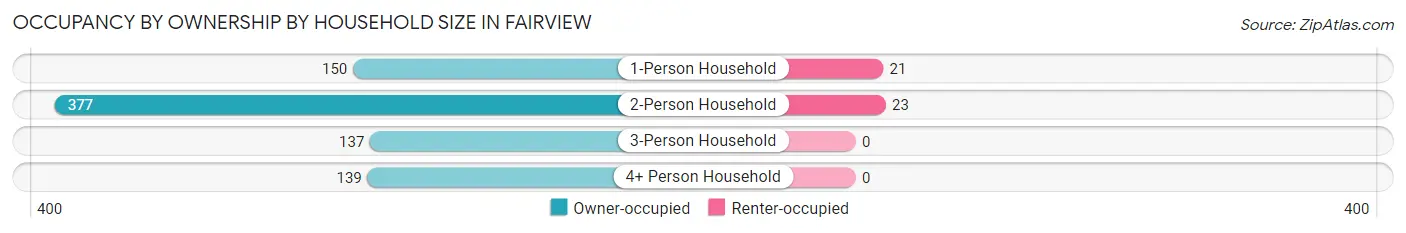
| Household Size | Owner-occupied | Renter-occupied |
| 1-Person Household | 150 (87.7%) | 21 (12.3%) |
| 2-Person Household | 377 (94.3%) | 23 (5.8%) |
| 3-Person Household | 137 (100.0%) | 0 (0.0%) |
| 4+ Person Household | 139 (100.0%) | 0 (0.0%) |
| Total Housing Units | 803 (94.8%) | 44 (5.2%) |
Occupancy by Educational Attainment in Fairview
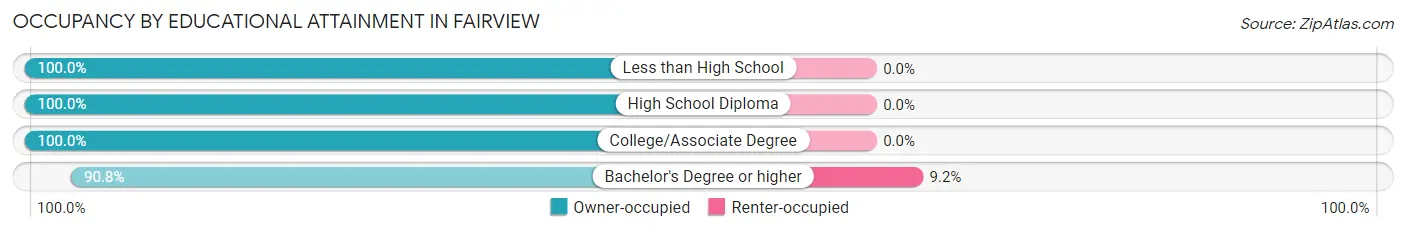
| Household Size | Owner-occupied | Renter-occupied |
| Less than High School | 26 (100.0%) | 0 (0.0%) |
| High School Diploma | 170 (100.0%) | 0 (0.0%) |
| College/Associate Degree | 173 (100.0%) | 0 (0.0%) |
| Bachelor's Degree or higher | 434 (90.8%) | 44 (9.2%) |
Occupancy by Age of Householder in Fairview
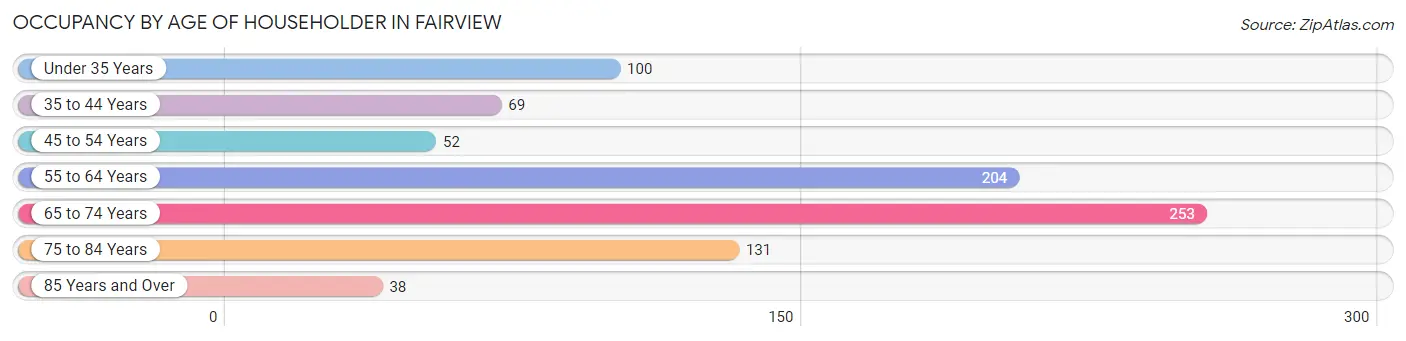
| Age Bracket | # Households | % Households |
| Under 35 Years | 100 | 11.8% |
| 35 to 44 Years | 69 | 8.2% |
| 45 to 54 Years | 52 | 6.1% |
| 55 to 64 Years | 204 | 24.1% |
| 65 to 74 Years | 253 | 29.9% |
| 75 to 84 Years | 131 | 15.5% |
| 85 Years and Over | 38 | 4.5% |
| Total | 847 | 100.0% |
Housing Finances in Fairview
Median Income by Occupancy in Fairview
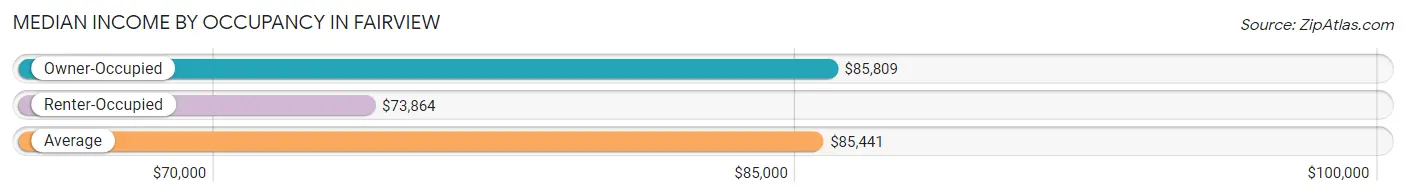
| Occupancy Type | # Households | Median Income |
| Owner-Occupied | 1,076 (89.4%) | $85,809 |
| Renter-Occupied | 128 (10.6%) | $73,864 |
| Average | 1,204 (100.0%) | $85,441 |
Occupancy by Householder Income Bracket in Fairview
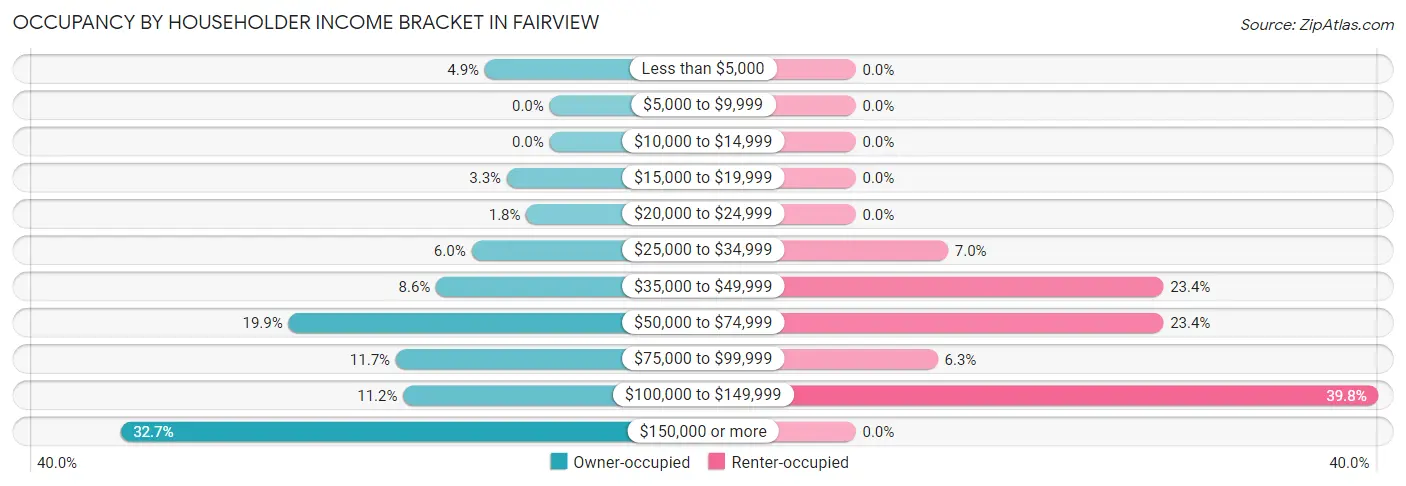
| Income Bracket | Owner-occupied | Renter-occupied |
| Less than $5,000 | 53 (4.9%) | 0 (0.0%) |
| $5,000 to $9,999 | 0 (0.0%) | 0 (0.0%) |
| $10,000 to $14,999 | 0 (0.0%) | 0 (0.0%) |
| $15,000 to $19,999 | 35 (3.3%) | 0 (0.0%) |
| $20,000 to $24,999 | 19 (1.8%) | 0 (0.0%) |
| $25,000 to $34,999 | 64 (5.9%) | 9 (7.0%) |
| $35,000 to $49,999 | 93 (8.6%) | 30 (23.4%) |
| $50,000 to $74,999 | 214 (19.9%) | 30 (23.4%) |
| $75,000 to $99,999 | 126 (11.7%) | 8 (6.2%) |
| $100,000 to $149,999 | 120 (11.2%) | 51 (39.8%) |
| $150,000 or more | 352 (32.7%) | 0 (0.0%) |
| Total | 1,076 (100.0%) | 128 (100.0%) |
Monthly Housing Cost Tiers in Fairview
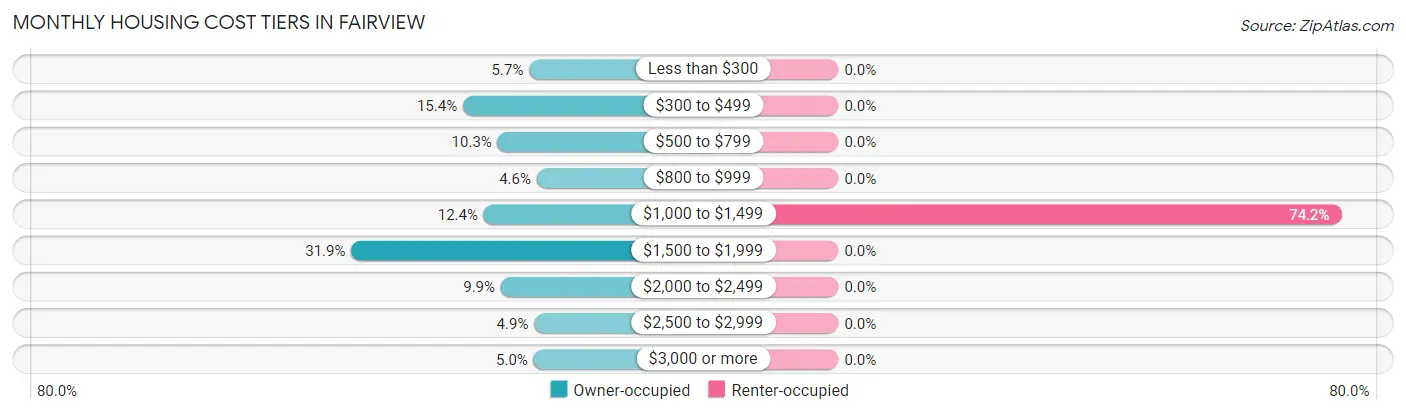
| Monthly Cost | Owner-occupied | Renter-occupied |
| Less than $300 | 61 (5.7%) | 0 (0.0%) |
| $300 to $499 | 166 (15.4%) | 0 (0.0%) |
| $500 to $799 | 111 (10.3%) | 0 (0.0%) |
| $800 to $999 | 49 (4.5%) | 0 (0.0%) |
| $1,000 to $1,499 | 133 (12.4%) | 95 (74.2%) |
| $1,500 to $1,999 | 343 (31.9%) | 0 (0.0%) |
| $2,000 to $2,499 | 106 (9.9%) | 0 (0.0%) |
| $2,500 to $2,999 | 53 (4.9%) | 0 (0.0%) |
| $3,000 or more | 54 (5.0%) | 0 (0.0%) |
| Total | 1,076 (100.0%) | 128 (100.0%) |
Physical Housing Characteristics in Fairview
Housing Structures in Fairview
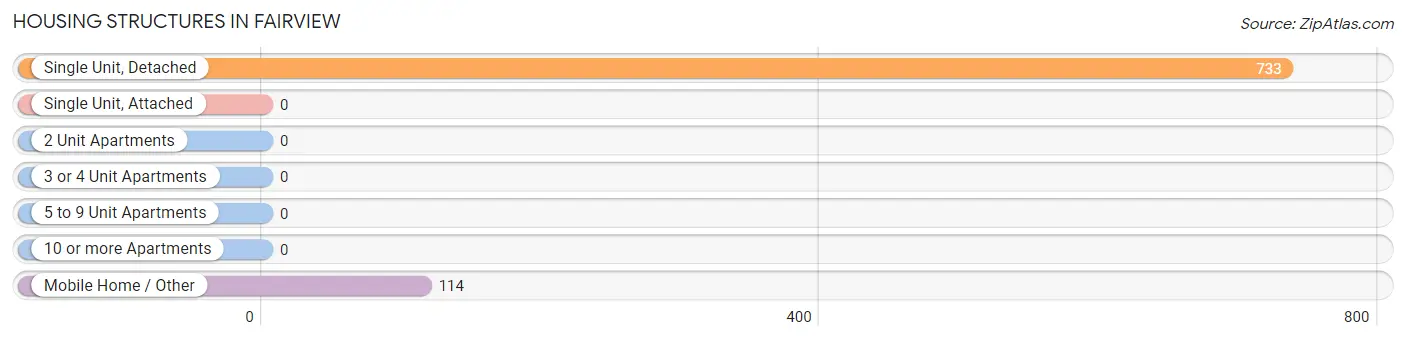
| Structure Type | # Housing Units | % Housing Units |
| Single Unit, Detached | 733 | 86.5% |
| Single Unit, Attached | 0 | 0.0% |
| 2 Unit Apartments | 0 | 0.0% |
| 3 or 4 Unit Apartments | 0 | 0.0% |
| 5 to 9 Unit Apartments | 0 | 0.0% |
| 10 or more Apartments | 0 | 0.0% |
| Mobile Home / Other | 114 | 13.5% |
| Total | 847 | 100.0% |
Housing Structures by Occupancy in Fairview
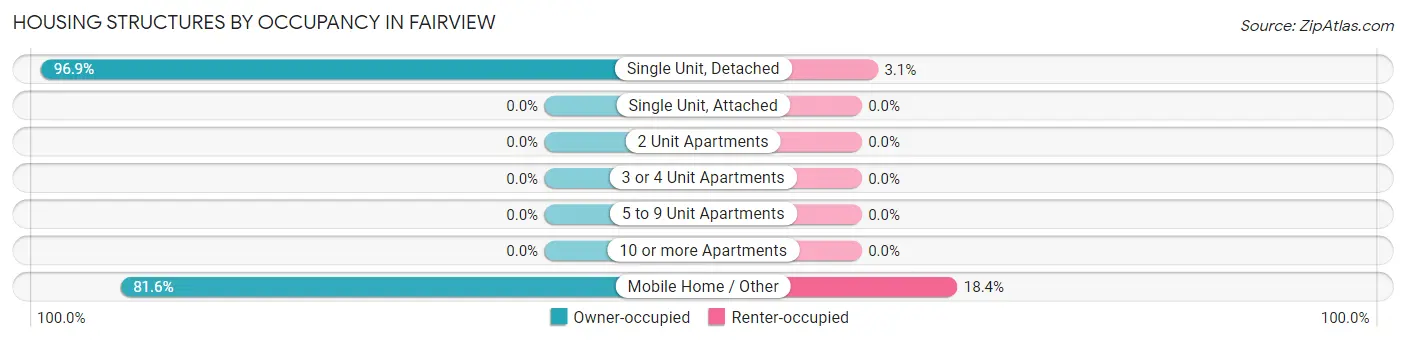
| Structure Type | Owner-occupied | Renter-occupied |
| Single Unit, Detached | 710 (96.9%) | 23 (3.1%) |
| Single Unit, Attached | 0 (0.0%) | 0 (0.0%) |
| 2 Unit Apartments | 0 (0.0%) | 0 (0.0%) |
| 3 or 4 Unit Apartments | 0 (0.0%) | 0 (0.0%) |
| 5 to 9 Unit Apartments | 0 (0.0%) | 0 (0.0%) |
| 10 or more Apartments | 0 (0.0%) | 0 (0.0%) |
| Mobile Home / Other | 93 (81.6%) | 21 (18.4%) |
| Total | 803 (94.8%) | 44 (5.2%) |
Housing Structures by Number of Rooms in Fairview
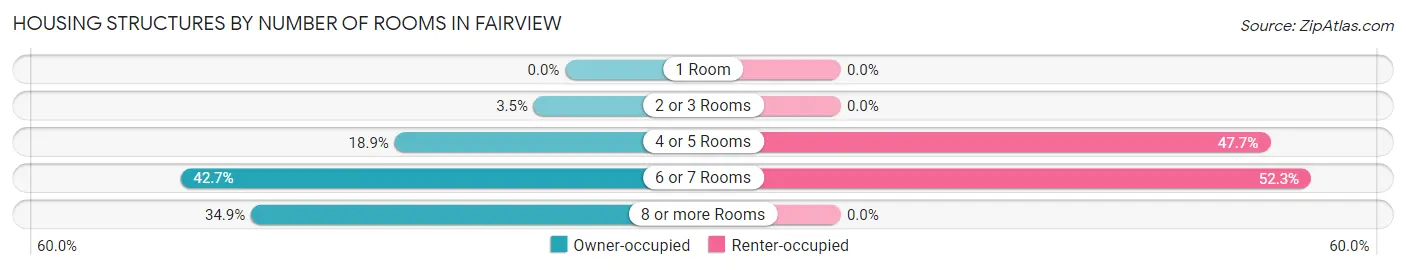
| Number of Rooms | Owner-occupied | Renter-occupied |
| 1 Room | 0 (0.0%) | 0 (0.0%) |
| 2 or 3 Rooms | 28 (3.5%) | 0 (0.0%) |
| 4 or 5 Rooms | 152 (18.9%) | 21 (47.7%) |
| 6 or 7 Rooms | 343 (42.7%) | 23 (52.3%) |
| 8 or more Rooms | 280 (34.9%) | 0 (0.0%) |
| Total | 803 (100.0%) | 44 (100.0%) |
Housing Structure by Heating Type in Fairview
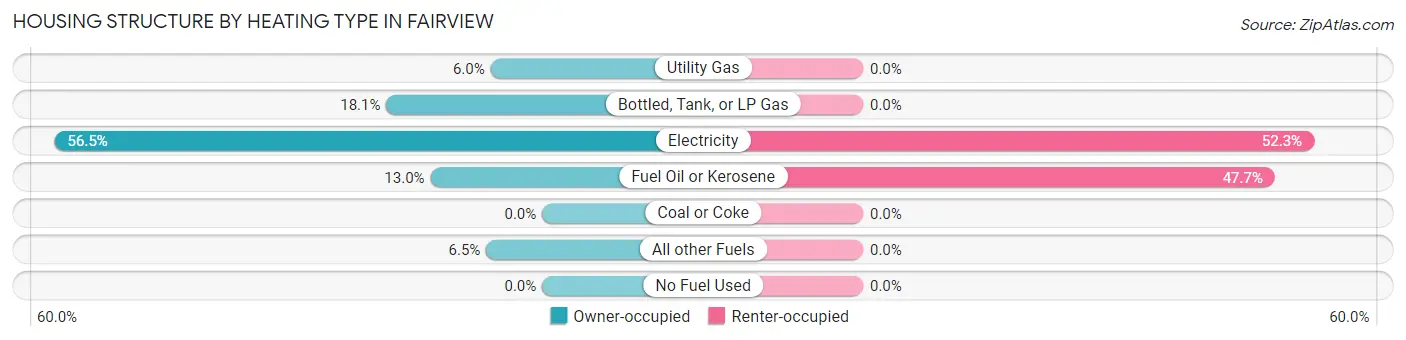
| Heating Type | Owner-occupied | Renter-occupied |
| Utility Gas | 48 (6.0%) | 0 (0.0%) |
| Bottled, Tank, or LP Gas | 145 (18.1%) | 0 (0.0%) |
| Electricity | 454 (56.5%) | 23 (52.3%) |
| Fuel Oil or Kerosene | 104 (13.0%) | 21 (47.7%) |
| Coal or Coke | 0 (0.0%) | 0 (0.0%) |
| All other Fuels | 52 (6.5%) | 0 (0.0%) |
| No Fuel Used | 0 (0.0%) | 0 (0.0%) |
| Total | 803 (100.0%) | 44 (100.0%) |
Household Vehicle Usage in Fairview
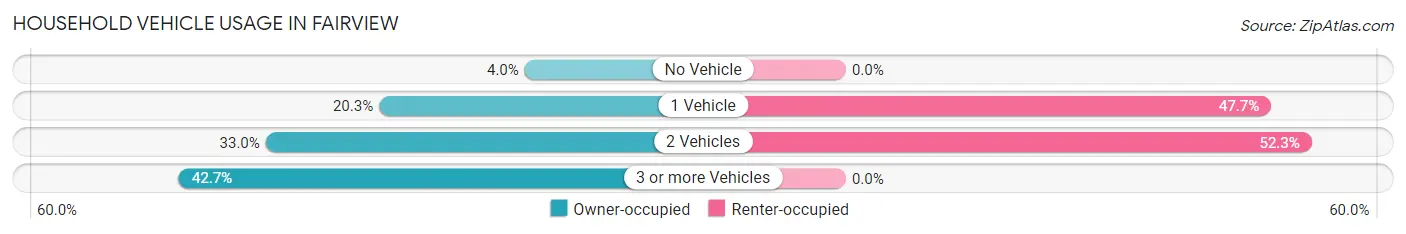
| Vehicles per Household | Owner-occupied | Renter-occupied |
| No Vehicle | 32 (4.0%) | 0 (0.0%) |
| 1 Vehicle | 163 (20.3%) | 21 (47.7%) |
| 2 Vehicles | 265 (33.0%) | 23 (52.3%) |
| 3 or more Vehicles | 343 (42.7%) | 0 (0.0%) |
| Total | 803 (100.0%) | 44 (100.0%) |
Real Estate & Mortgages in Fairview
Real Estate and Mortgage Overview in Fairview
| Characteristic | Without Mortgage | With Mortgage |
| Housing Units | 339 | 721 |
| Median Property Value | $197,200 | $314,200 |
| Median Household Income | $49,712 | $324 |
| Monthly Housing Costs | $405 | $54 |
| Real Estate Taxes | $1,780 | $11 |
Property Value by Mortgage Status in Fairview
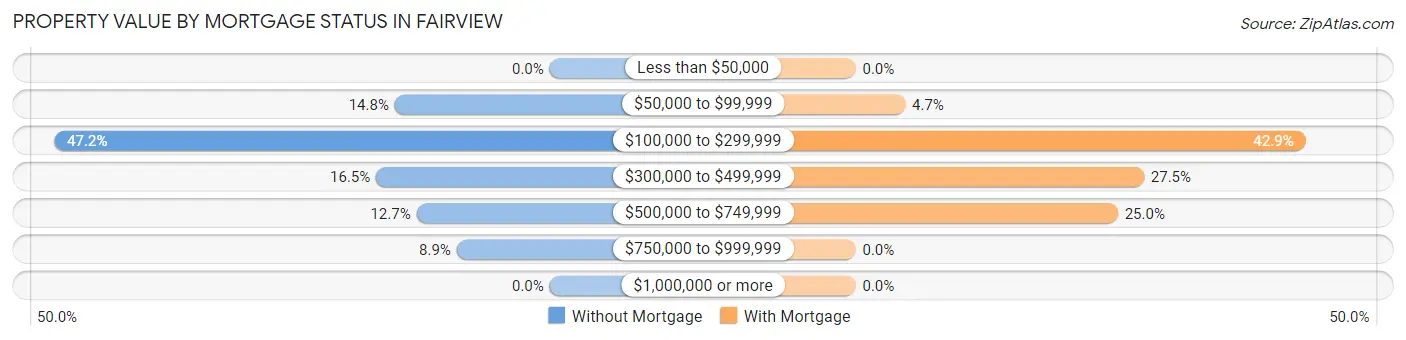
| Property Value | Without Mortgage | With Mortgage |
| Less than $50,000 | 0 (0.0%) | 0 (0.0%) |
| $50,000 to $99,999 | 50 (14.7%) | 34 (4.7%) |
| $100,000 to $299,999 | 160 (47.2%) | 309 (42.9%) |
| $300,000 to $499,999 | 56 (16.5%) | 198 (27.5%) |
| $500,000 to $749,999 | 43 (12.7%) | 180 (25.0%) |
| $750,000 to $999,999 | 30 (8.8%) | 0 (0.0%) |
| $1,000,000 or more | 0 (0.0%) | 0 (0.0%) |
| Total | 339 (100.0%) | 721 (100.0%) |
Household Income by Mortgage Status in Fairview
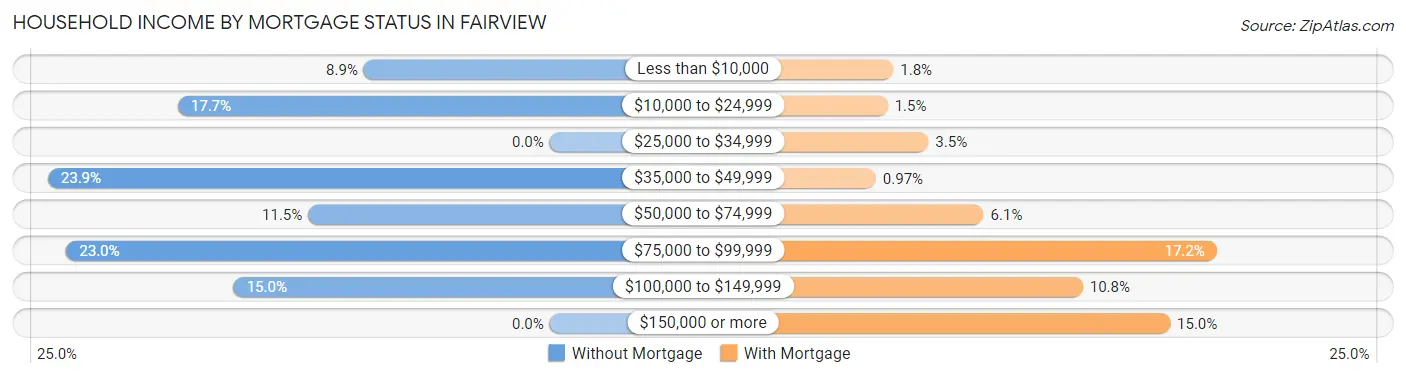
| Household Income | Without Mortgage | With Mortgage |
| Less than $10,000 | 30 (8.8%) | 13 (1.8%) |
| $10,000 to $24,999 | 60 (17.7%) | 11 (1.5%) |
| $25,000 to $34,999 | 0 (0.0%) | 25 (3.5%) |
| $35,000 to $49,999 | 81 (23.9%) | 7 (1.0%) |
| $50,000 to $74,999 | 39 (11.5%) | 44 (6.1%) |
| $75,000 to $99,999 | 78 (23.0%) | 124 (17.2%) |
| $100,000 to $149,999 | 51 (15.0%) | 78 (10.8%) |
| $150,000 or more | 0 (0.0%) | 108 (15.0%) |
| Total | 339 (100.0%) | 721 (100.0%) |
Property Value to Household Income Ratio in Fairview
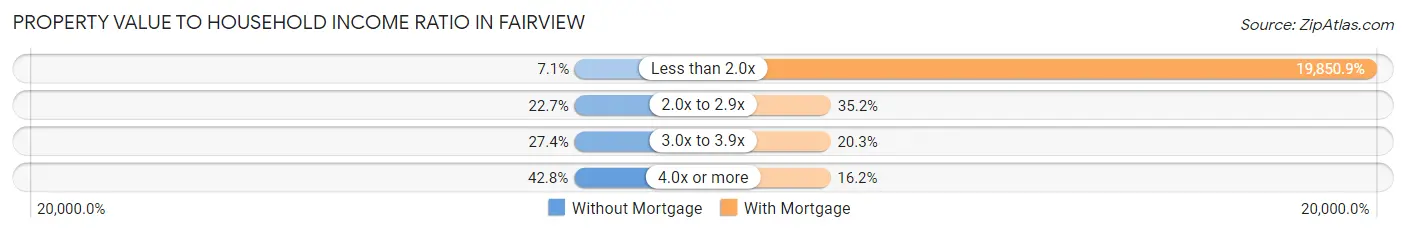
| Value-to-Income Ratio | Without Mortgage | With Mortgage |
| Less than 2.0x | 24 (7.1%) | 143,125 (19,850.9%) |
| 2.0x to 2.9x | 77 (22.7%) | 254 (35.2%) |
| 3.0x to 3.9x | 93 (27.4%) | 146 (20.3%) |
| 4.0x or more | 145 (42.8%) | 117 (16.2%) |
| Total | 339 (100.0%) | 721 (100.0%) |
Real Estate Taxes by Mortgage Status in Fairview
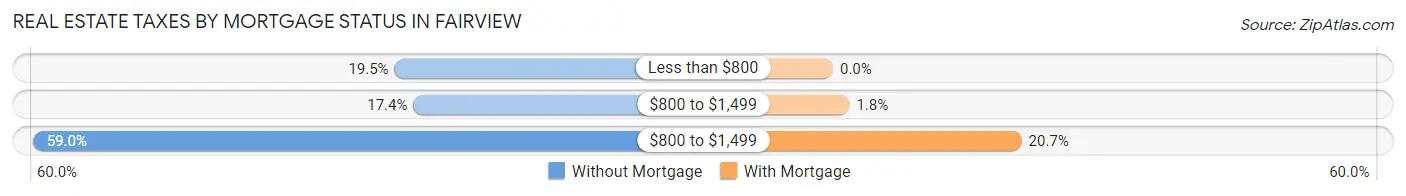
| Property Taxes | Without Mortgage | With Mortgage |
| Less than $800 | 66 (19.5%) | 0 (0.0%) |
| $800 to $1,499 | 59 (17.4%) | 13 (1.8%) |
| $800 to $1,499 | 200 (59.0%) | 149 (20.7%) |
| Total | 339 (100.0%) | 721 (100.0%) |
Health & Disability in Fairview
Health Insurance Coverage by Age in Fairview
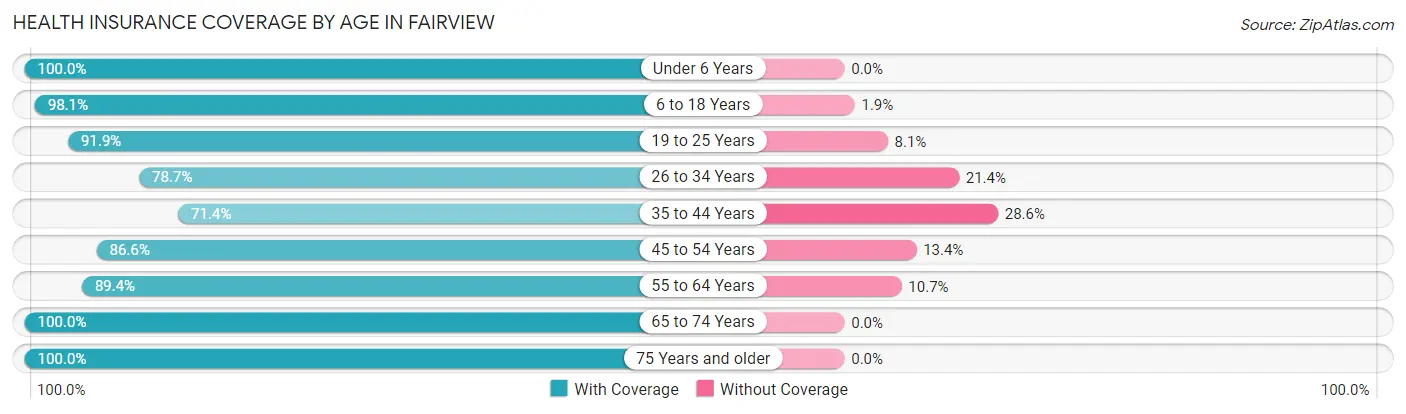
| Age Bracket | With Coverage | Without Coverage |
| Under 6 Years | 61 (100.0%) | 0 (0.0%) |
| 6 to 18 Years | 668 (98.1%) | 13 (1.9%) |
| 19 to 25 Years | 455 (91.9%) | 40 (8.1%) |
| 26 to 34 Years | 140 (78.6%) | 38 (21.3%) |
| 35 to 44 Years | 197 (71.4%) | 79 (28.6%) |
| 45 to 54 Years | 478 (86.6%) | 74 (13.4%) |
| 55 to 64 Years | 554 (89.3%) | 66 (10.6%) |
| 65 to 74 Years | 400 (100.0%) | 0 (0.0%) |
| 75 Years and older | 249 (100.0%) | 0 (0.0%) |
| Total | 3,202 (91.2%) | 310 (8.8%) |
Health Insurance Coverage by Citizenship Status in Fairview
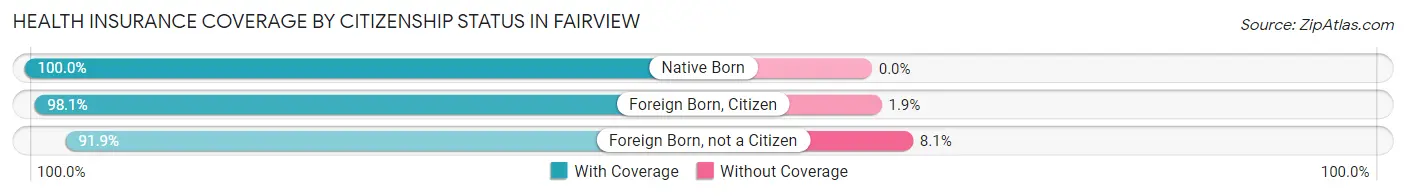
| Citizenship Status | With Coverage | Without Coverage |
| Native Born | 61 (100.0%) | 0 (0.0%) |
| Foreign Born, Citizen | 668 (98.1%) | 13 (1.9%) |
| Foreign Born, not a Citizen | 455 (91.9%) | 40 (8.1%) |
Health Insurance Coverage by Household Income in Fairview
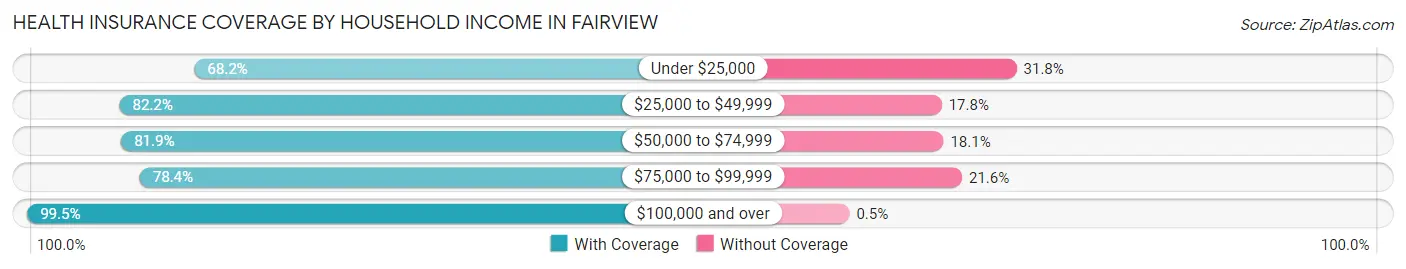
| Household Income | With Coverage | Without Coverage |
| Under $25,000 | 90 (68.2%) | 42 (31.8%) |
| $25,000 to $49,999 | 328 (82.2%) | 71 (17.8%) |
| $50,000 to $74,999 | 502 (81.9%) | 111 (18.1%) |
| $75,000 to $99,999 | 276 (78.4%) | 76 (21.6%) |
| $100,000 and over | 2,006 (99.5%) | 10 (0.5%) |
Public vs Private Health Insurance Coverage by Age in Fairview
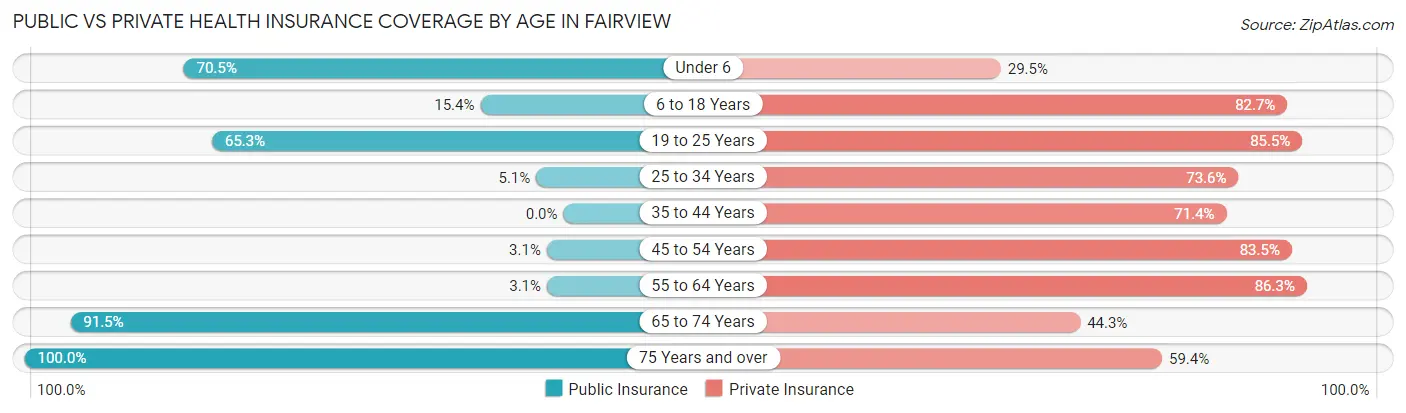
| Age Bracket | Public Insurance | Private Insurance |
| Under 6 | 43 (70.5%) | 18 (29.5%) |
| 6 to 18 Years | 105 (15.4%) | 563 (82.7%) |
| 19 to 25 Years | 323 (65.2%) | 423 (85.5%) |
| 25 to 34 Years | 9 (5.1%) | 131 (73.6%) |
| 35 to 44 Years | 0 (0.0%) | 197 (71.4%) |
| 45 to 54 Years | 17 (3.1%) | 461 (83.5%) |
| 55 to 64 Years | 19 (3.1%) | 535 (86.3%) |
| 65 to 74 Years | 366 (91.5%) | 177 (44.3%) |
| 75 Years and over | 249 (100.0%) | 148 (59.4%) |
| Total | 1,131 (32.2%) | 2,653 (75.5%) |
Disability Status by Sex by Age in Fairview
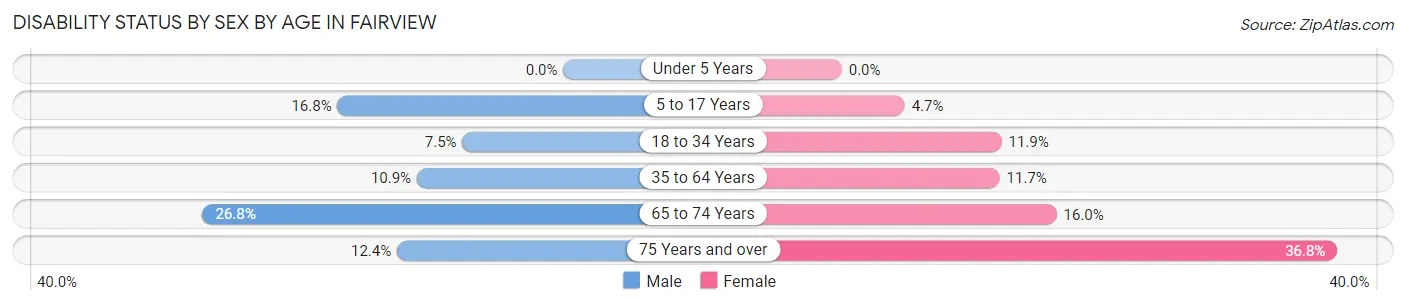
| Age Bracket | Male | Female |
| Under 5 Years | 0 (0.0%) | 0 (0.0%) |
| 5 to 17 Years | 26 (16.8%) | 23 (4.7%) |
| 18 to 34 Years | 17 (7.5%) | 60 (11.9%) |
| 35 to 64 Years | 86 (10.9%) | 77 (11.7%) |
| 65 to 74 Years | 45 (26.8%) | 37 (16.0%) |
| 75 Years and over | 20 (12.3%) | 32 (36.8%) |
Disability Class by Sex by Age in Fairview
Disability Class: Hearing Difficulty
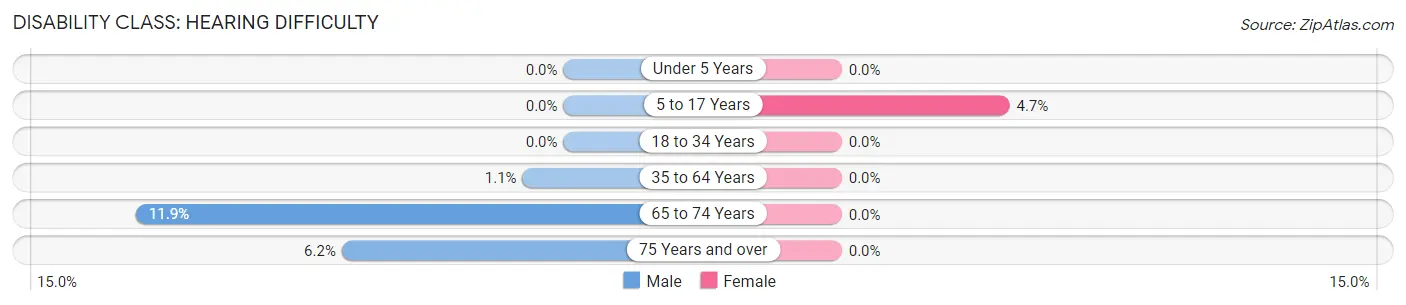
| Age Bracket | Male | Female |
| Under 5 Years | 0 (0.0%) | 0 (0.0%) |
| 5 to 17 Years | 0 (0.0%) | 23 (4.7%) |
| 18 to 34 Years | 0 (0.0%) | 0 (0.0%) |
| 35 to 64 Years | 9 (1.1%) | 0 (0.0%) |
| 65 to 74 Years | 20 (11.9%) | 0 (0.0%) |
| 75 Years and over | 10 (6.2%) | 0 (0.0%) |
Disability Class: Vision Difficulty
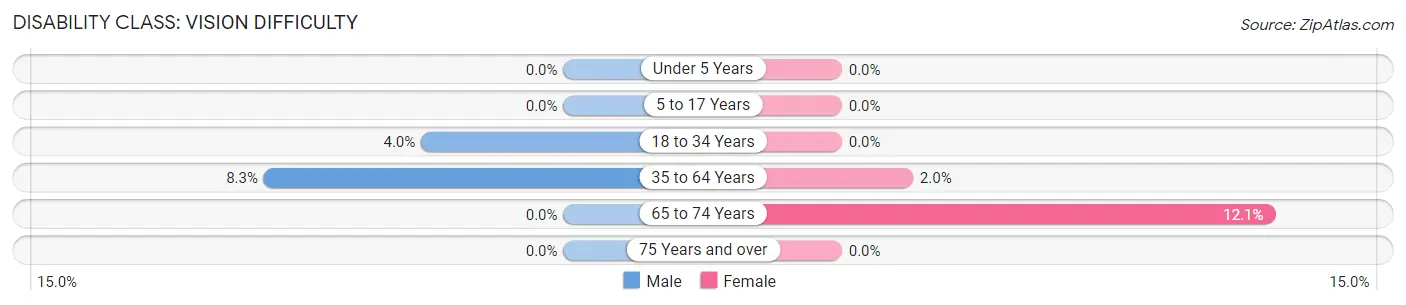
| Age Bracket | Male | Female |
| Under 5 Years | 0 (0.0%) | 0 (0.0%) |
| 5 to 17 Years | 0 (0.0%) | 0 (0.0%) |
| 18 to 34 Years | 9 (4.0%) | 0 (0.0%) |
| 35 to 64 Years | 66 (8.3%) | 13 (2.0%) |
| 65 to 74 Years | 0 (0.0%) | 28 (12.1%) |
| 75 Years and over | 0 (0.0%) | 0 (0.0%) |
Disability Class: Cognitive Difficulty
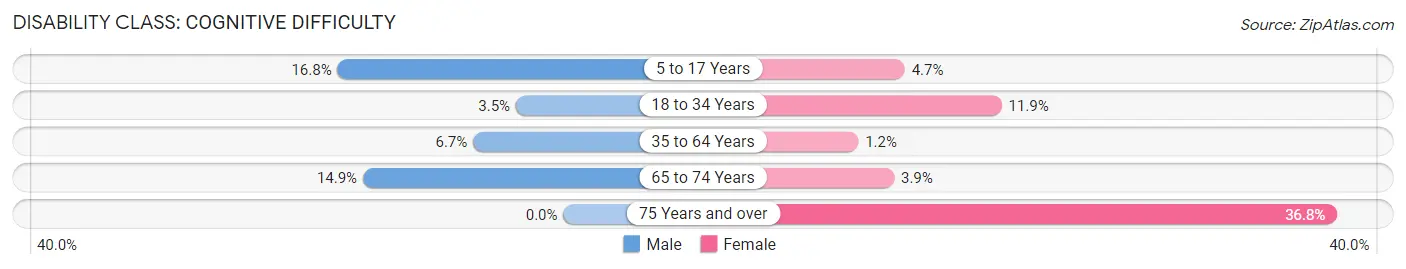
| Age Bracket | Male | Female |
| 5 to 17 Years | 26 (16.8%) | 23 (4.7%) |
| 18 to 34 Years | 8 (3.5%) | 60 (11.9%) |
| 35 to 64 Years | 53 (6.7%) | 8 (1.2%) |
| 65 to 74 Years | 25 (14.9%) | 9 (3.9%) |
| 75 Years and over | 0 (0.0%) | 32 (36.8%) |
Disability Class: Ambulatory Difficulty
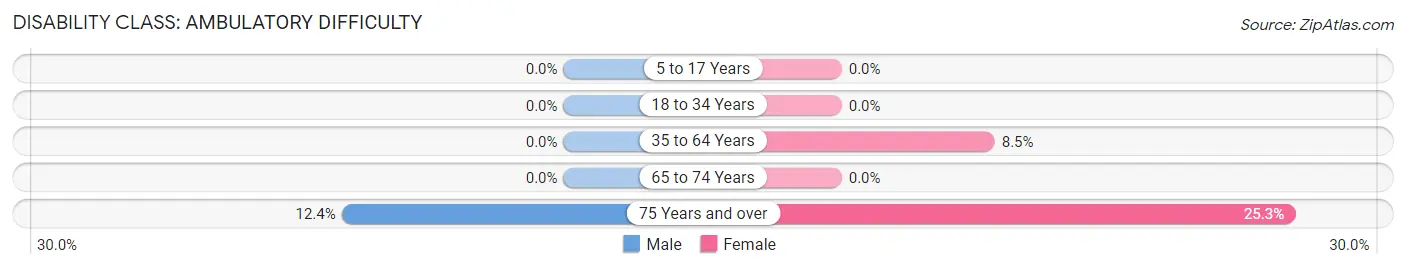
| Age Bracket | Male | Female |
| 5 to 17 Years | 0 (0.0%) | 0 (0.0%) |
| 18 to 34 Years | 0 (0.0%) | 0 (0.0%) |
| 35 to 64 Years | 0 (0.0%) | 56 (8.5%) |
| 65 to 74 Years | 0 (0.0%) | 0 (0.0%) |
| 75 Years and over | 20 (12.3%) | 22 (25.3%) |
Disability Class: Self-Care Difficulty
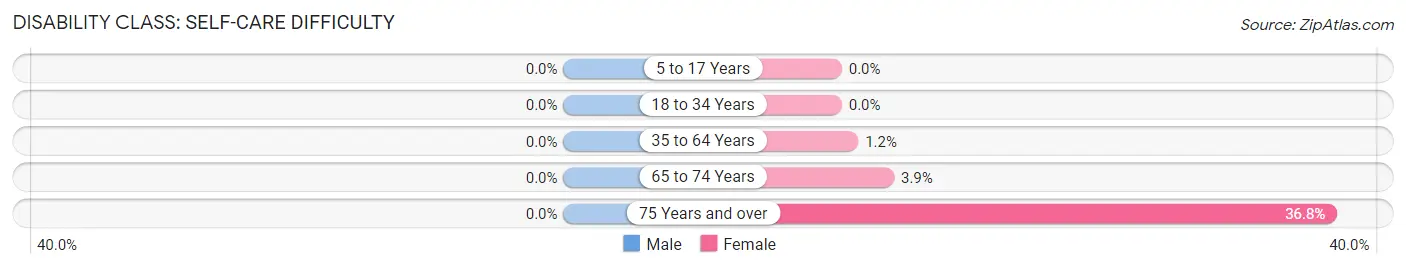
| Age Bracket | Male | Female |
| 5 to 17 Years | 0 (0.0%) | 0 (0.0%) |
| 18 to 34 Years | 0 (0.0%) | 0 (0.0%) |
| 35 to 64 Years | 0 (0.0%) | 8 (1.2%) |
| 65 to 74 Years | 0 (0.0%) | 9 (3.9%) |
| 75 Years and over | 0 (0.0%) | 32 (36.8%) |
Technology Access in Fairview
Computing Device Access in Fairview
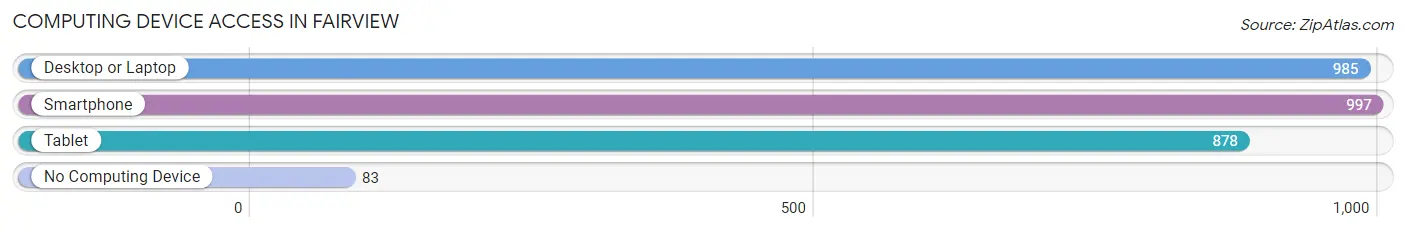
| Device Type | # Households | % Households |
| Desktop or Laptop | 985 | 81.8% |
| Smartphone | 997 | 82.8% |
| Tablet | 878 | 72.9% |
| No Computing Device | 83 | 6.9% |
| Total | 1,204 | 100.0% |
Internet Access in Fairview
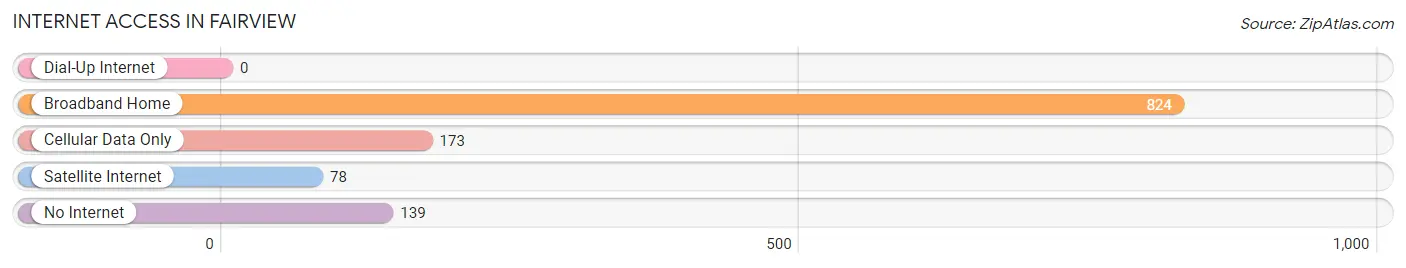
| Internet Type | # Households | % Households |
| Dial-Up Internet | 0 | 0.0% |
| Broadband Home | 824 | 68.4% |
| Cellular Data Only | 173 | 14.4% |
| Satellite Internet | 78 | 6.5% |
| No Internet | 139 | 11.5% |
| Total | 1,204 | 100.0% |
Fairview Summary
History
The town of Fairview, North Carolina is located in the foothills of the Blue Ridge Mountains in Buncombe County. It was first settled in the late 1700s by a group of settlers from Virginia. The town was originally known as “Fairview Crossroads” due to its location at the intersection of two major roads. The town was officially incorporated in 1891 and was named after the nearby Fairview Mountain.
The town of Fairview has a rich history of industry and agriculture. In the late 1800s, the town was home to several mills, including a cotton mill, a grist mill, and a sawmill. These mills provided employment for many of the town’s residents and helped to fuel the local economy. In the early 1900s, the town was also home to several dairy farms, which provided milk and other dairy products to the local population.
In the mid-1900s, the town began to experience a period of growth and development. The town was home to several businesses, including a furniture factory, a canning factory, and a brickyard. The town also had a thriving tourism industry, with several hotels and resorts located in the area.
In the late 1900s, the town experienced a period of decline. Many of the businesses and industries that had been the backbone of the town’s economy closed or moved away. The town’s population also began to decline as people moved away in search of better opportunities.
Today, Fairview is a small town with a population of just over 1,000 people. The town is home to several small businesses, including a grocery store, a hardware store, and a few restaurants. The town also has a few small parks and a public library.
Geography
Fairview is located in the foothills of the Blue Ridge Mountains in Buncombe County, North Carolina. The town is situated at an elevation of 1,400 feet and is surrounded by the Pisgah National Forest. The town is located approximately 25 miles east of Asheville and is accessible via Interstate 40.
The town of Fairview is located in a valley surrounded by mountains. The town is situated at the intersection of two major roads, US Highway 19 and NC Highway 280. The town is also located near several lakes, including Lake Junaluska, Lake Lure, and Lake Fontana.
Economy
The economy of Fairview is largely based on tourism and agriculture. The town is home to several small businesses, including a grocery store, a hardware store, and a few restaurants. The town also has a few small parks and a public library.
The town is also home to several farms, which produce a variety of crops, including corn, soybeans, and hay. The town is also home to several wineries, which produce a variety of wines.
Demographics
As of the 2010 census, the population of Fairview was 1,072. The town has a population that is predominantly white (94.3%) and has a median household income of $41,250. The town also has a high rate of poverty, with 24.3% of the population living below the poverty line. The town also has a high rate of unemployment, with 8.3% of the population unemployed.
Common Questions
What is Per Capita Income in Fairview?
Per Capita income in Fairview is $45,860.
What is the Median Family Income in Fairview?
Median Family Income in Fairview is $103,971.
What is the Median Household income in Fairview?
Median Household Income in Fairview is $85,441.
What is Income or Wage Gap in Fairview?
Income or Wage Gap in Fairview is 20.4%.
Women in Fairview earn 79.6 cents for every dollar earned by a man.
What is Inequality or Gini Index in Fairview?
Inequality or Gini Index in Fairview is 0.46.
What is the Total Population of Fairview?
Total Population of Fairview is 3,512.
What is the Total Male Population of Fairview?
Total Male Population of Fairview is 1,503.
What is the Total Female Population of Fairview?
Total Female Population of Fairview is 2,009.
What is the Ratio of Males per 100 Females in Fairview?
There are 74.81 Males per 100 Females in Fairview.
What is the Ratio of Females per 100 Males in Fairview?
There are 133.67 Females per 100 Males in Fairview.
What is the Median Population Age in Fairview?
Median Population Age in Fairview is 46.7 Years.
What is the Average Family Size in Fairview
Average Family Size in Fairview is 3.3 People.
What is the Average Household Size in Fairview
Average Household Size in Fairview is 2.9 People.
How Large is the Labor Force in Fairview?
There are 1,677 People in the Labor Forcein in Fairview.
What is the Percentage of People in the Labor Force in Fairview?
54.2% of People are in the Labor Force in Fairview.
What is the Unemployment Rate in Fairview?
Unemployment Rate in Fairview is 2.4%.