Holly Ridge, NC Map & Demographics
Holly Ridge Map
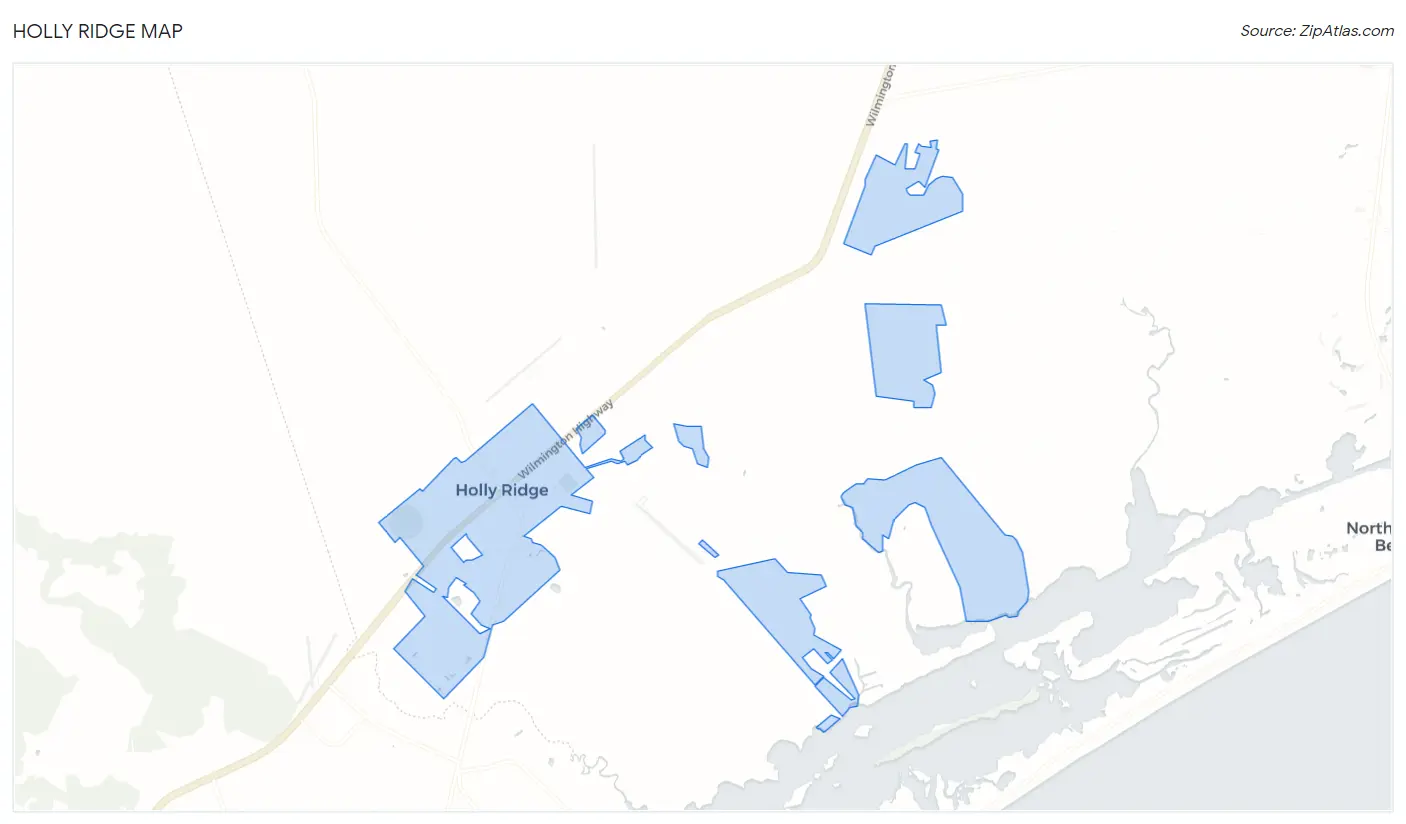
Holly Ridge Overview
$44,565
PER CAPITA INCOME
$91,776
AVG FAMILY INCOME
$90,197
AVG HOUSEHOLD INCOME
30.3%
WAGE / INCOME GAP [ % ]
69.7¢/ $1
WAGE / INCOME GAP [ $ ]
0.39
INEQUALITY / GINI INDEX
4,236
TOTAL POPULATION
2,162
MALE POPULATION
2,074
FEMALE POPULATION
104.24
MALES / 100 FEMALES
95.93
FEMALES / 100 MALES
34.2
MEDIAN AGE
3.0
AVG FAMILY SIZE
2.7
AVG HOUSEHOLD SIZE
2,645
LABOR FORCE [ PEOPLE ]
80.8%
PERCENT IN LABOR FORCE
1.0%
UNEMPLOYMENT RATE
Holly Ridge Zip Codes
Holly Ridge Area Codes
Income in Holly Ridge
Income Overview in Holly Ridge
Per Capita Income in Holly Ridge is $44,565, while median incomes of families and households are $91,776 and $90,197 respectively.
| Characteristic | Number | Measure |
| Per Capita Income | 4,236 | $44,565 |
| Median Family Income | 1,117 | $91,776 |
| Mean Family Income | 1,117 | $121,054 |
| Median Household Income | 1,583 | $90,197 |
| Mean Household Income | 1,583 | $113,528 |
| Income Deficit | 1,117 | $0 |
| Wage / Income Gap (%) | 4,236 | 30.32% |
| Wage / Income Gap ($) | 4,236 | 69.68¢ per $1 |
| Gini / Inequality Index | 4,236 | 0.39 |
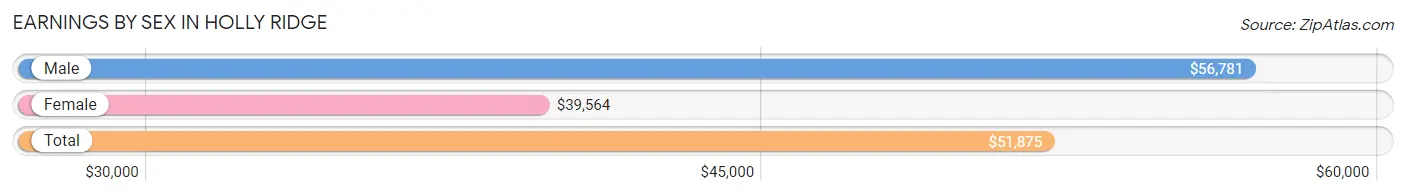
Earnings by Sex in Holly Ridge
Average Earnings in Holly Ridge are $51,875, $56,781 for men and $39,564 for women, a difference of 30.3%.
| Sex | Number | Average Earnings |
| Male | 1,539 (57.1%) | $56,781 |
| Female | 1,157 (42.9%) | $39,564 |
| Total | 2,696 (100.0%) | $51,875 |
Earnings by Sex by Income Bracket in Holly Ridge
The most common earnings brackets in Holly Ridge are $55,000 to $64,999 for men (265 | 17.2%) and $100,000+ for women (210 | 18.1%).

| Income | Male | Female |
| $2,499 or less | 18 (1.2%) | 61 (5.3%) |
| $2,500 to $4,999 | 5 (0.3%) | 0 (0.0%) |
| $5,000 to $7,499 | 37 (2.4%) | 48 (4.2%) |
| $7,500 to $9,999 | 6 (0.4%) | 14 (1.2%) |
| $10,000 to $12,499 | 86 (5.6%) | 28 (2.4%) |
| $12,500 to $14,999 | 10 (0.6%) | 36 (3.1%) |
| $15,000 to $17,499 | 52 (3.4%) | 64 (5.5%) |
| $17,500 to $19,999 | 0 (0.0%) | 0 (0.0%) |
| $20,000 to $22,499 | 6 (0.4%) | 0 (0.0%) |
| $22,500 to $24,999 | 14 (0.9%) | 36 (3.1%) |
| $25,000 to $29,999 | 6 (0.4%) | 80 (6.9%) |
| $30,000 to $34,999 | 75 (4.9%) | 107 (9.2%) |
| $35,000 to $39,999 | 18 (1.2%) | 116 (10.0%) |
| $40,000 to $44,999 | 54 (3.5%) | 57 (4.9%) |
| $45,000 to $49,999 | 173 (11.2%) | 63 (5.4%) |
| $50,000 to $54,999 | 67 (4.3%) | 80 (6.9%) |
| $55,000 to $64,999 | 265 (17.2%) | 58 (5.0%) |
| $65,000 to $74,999 | 204 (13.3%) | 56 (4.8%) |
| $75,000 to $99,999 | 253 (16.4%) | 43 (3.7%) |
| $100,000+ | 190 (12.3%) | 210 (18.1%) |
| Total | 1,539 (100.0%) | 1,157 (100.0%) |
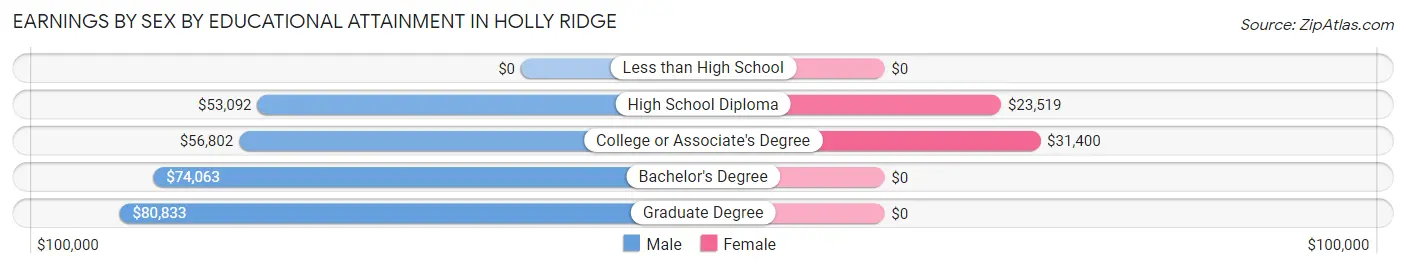
Earnings by Sex by Educational Attainment in Holly Ridge
Average earnings in Holly Ridge are $57,213 for men and $40,395 for women, a difference of 29.4%. Men with an educational attainment of graduate degree enjoy the highest average annual earnings of $80,833, while those with high school diploma education earn the least with $53,092. Women with an educational attainment of college or associate's degree earn the most with the average annual earnings of $31,400, while those with high school diploma education have the smallest earnings of $23,519.
| Educational Attainment | Male Income | Female Income |
| Less than High School | - | - |
| High School Diploma | $53,092 | $23,519 |
| College or Associate's Degree | $56,802 | $31,400 |
| Bachelor's Degree | $74,063 | $0 |
| Graduate Degree | $80,833 | $0 |
| Total | $57,213 | $40,395 |
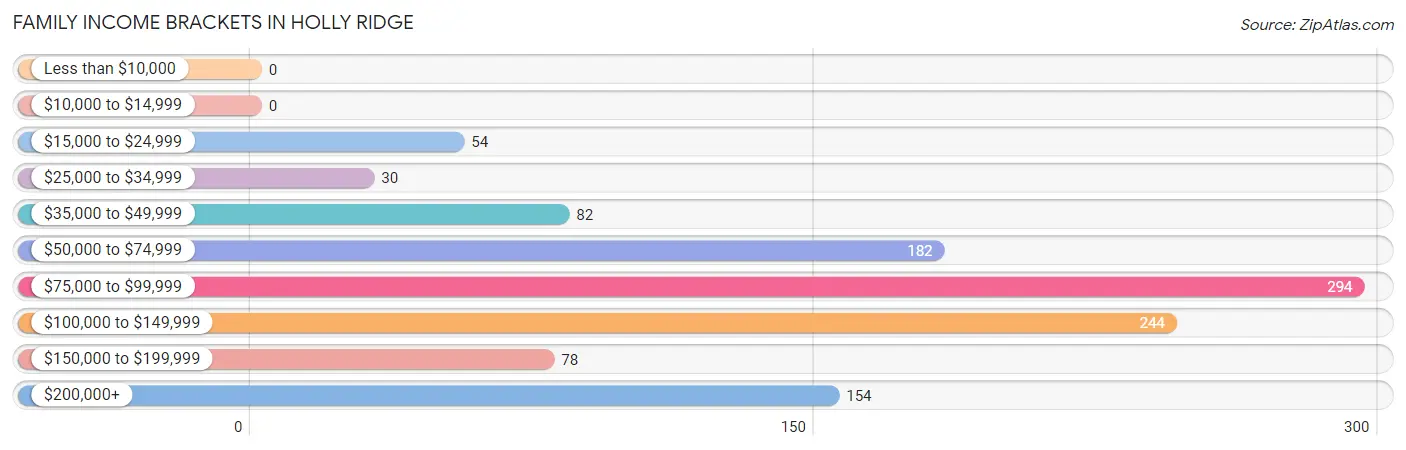
Family Income in Holly Ridge
Family Income Brackets in Holly Ridge
According to the Holly Ridge family income data, there are 294 families falling into the $75,000 to $99,999 income range, which is the most common income bracket and makes up 26.3% of all families.
| Income Bracket | # Families | % Families |
| Less than $10,000 | 0 | 0.0% |
| $10,000 to $14,999 | 0 | 0.0% |
| $15,000 to $24,999 | 54 | 4.8% |
| $25,000 to $34,999 | 30 | 2.7% |
| $35,000 to $49,999 | 82 | 7.3% |
| $50,000 to $74,999 | 182 | 16.3% |
| $75,000 to $99,999 | 294 | 26.3% |
| $100,000 to $149,999 | 244 | 21.8% |
| $150,000 to $199,999 | 78 | 7.0% |
| $200,000+ | 154 | 13.8% |
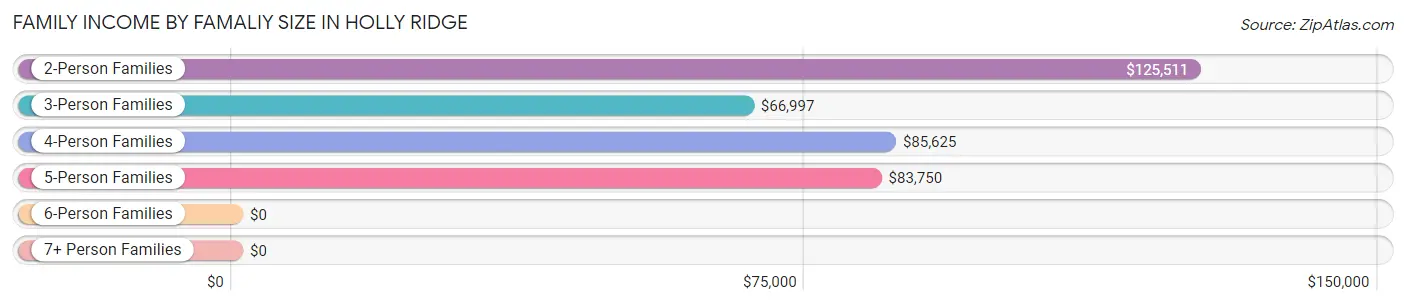
Family Income by Famaliy Size in Holly Ridge
2-person families (469 | 42.0%) account for the highest median family income in Holly Ridge with $125,511 per family, while 2-person families (469 | 42.0%) have the highest median income of $62,756 per family member.
| Income Bracket | # Families | Median Income |
| 2-Person Families | 469 (42.0%) | $125,511 |
| 3-Person Families | 441 (39.5%) | $66,997 |
| 4-Person Families | 145 (13.0%) | $85,625 |
| 5-Person Families | 48 (4.3%) | $83,750 |
| 6-Person Families | 14 (1.3%) | $0 |
| 7+ Person Families | 0 (0.0%) | $0 |
| Total | 1,117 (100.0%) | $91,776 |
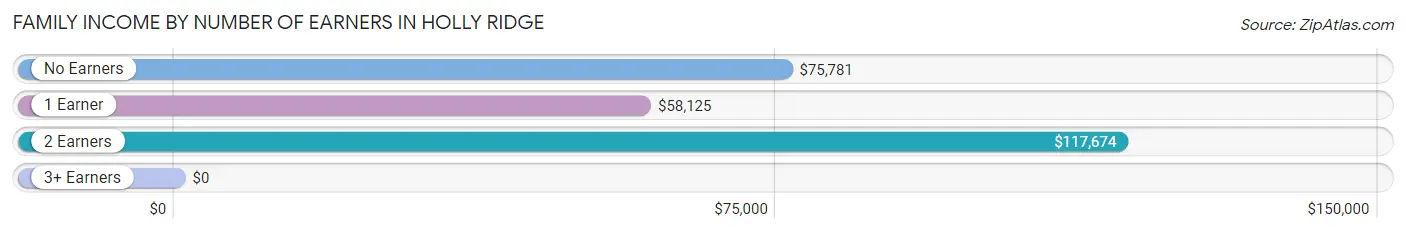
Family Income by Number of Earners in Holly Ridge
| Number of Earners | # Families | Median Income |
| No Earners | 34 (3.0%) | $75,781 |
| 1 Earner | 311 (27.8%) | $58,125 |
| 2 Earners | 772 (69.1%) | $117,674 |
| 3+ Earners | 0 (0.0%) | $0 |
| Total | 1,117 (100.0%) | $91,776 |
Household Income in Holly Ridge
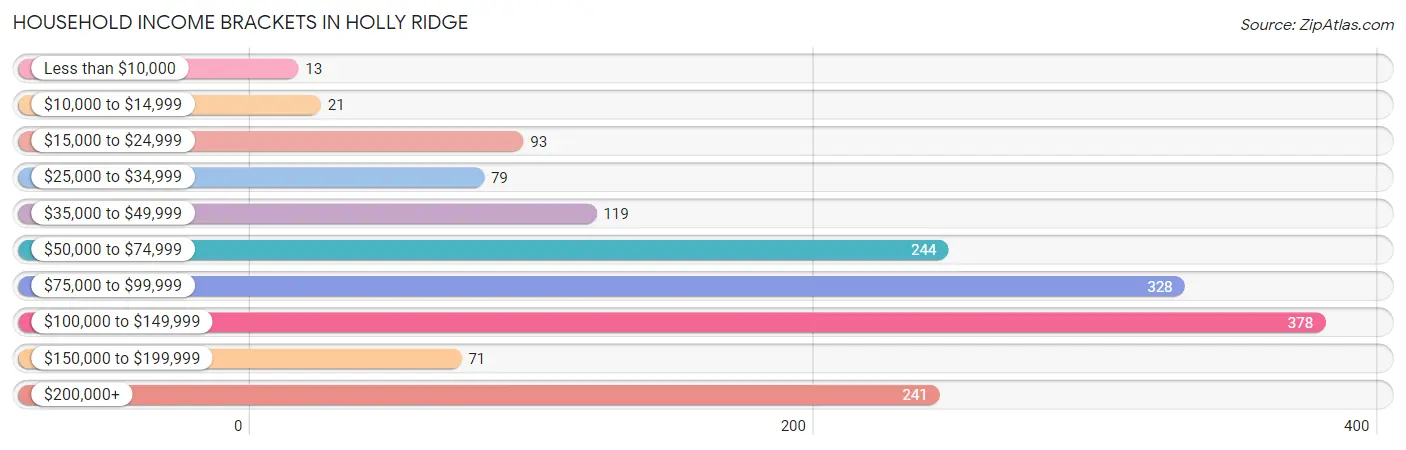
Household Income Brackets in Holly Ridge
With 378 households falling in the category, the $100,000 to $149,999 income range is the most frequent in Holly Ridge, accounting for 23.9% of all households. In contrast, only 13 households (0.8%) fall into the less than $10,000 income bracket, making it the least populous group.
| Income Bracket | # Households | % Households |
| Less than $10,000 | 13 | 0.8% |
| $10,000 to $14,999 | 21 | 1.3% |
| $15,000 to $24,999 | 93 | 5.9% |
| $25,000 to $34,999 | 79 | 5.0% |
| $35,000 to $49,999 | 119 | 7.5% |
| $50,000 to $74,999 | 244 | 15.4% |
| $75,000 to $99,999 | 328 | 20.7% |
| $100,000 to $149,999 | 378 | 23.9% |
| $150,000 to $199,999 | 71 | 4.5% |
| $200,000+ | 241 | 15.2% |
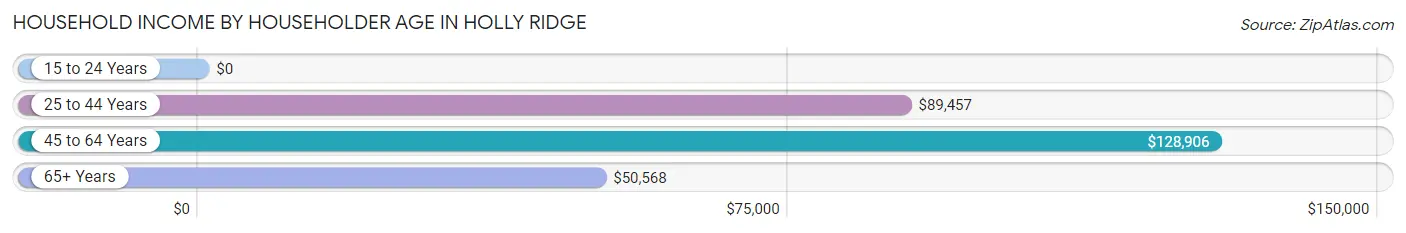
Household Income by Householder Age in Holly Ridge
The median household income in Holly Ridge is $90,197, with the highest median household income of $128,906 found in the 45 to 64 years age bracket for the primary householder. A total of 447 households (28.2%) fall into this category. Meanwhile, the 15 to 24 years age bracket for the primary householder has the lowest median household income of $0, with 10 households (0.6%) in this group.
| Income Bracket | # Households | Median Income |
| 15 to 24 Years | 10 (0.6%) | $0 |
| 25 to 44 Years | 882 (55.7%) | $89,457 |
| 45 to 64 Years | 447 (28.2%) | $128,906 |
| 65+ Years | 244 (15.4%) | $50,568 |
| Total | 1,583 (100.0%) | $90,197 |
Poverty in Holly Ridge
Income Below Poverty by Sex and Age in Holly Ridge
With 1.8% poverty level for males and 1.7% for females among the residents of Holly Ridge, 65 to 74 year old males and 25 to 34 year old females are the most vulnerable to poverty, with 14 males (9.7%) and 32 females (6.3%) in their respective age groups living below the poverty level.
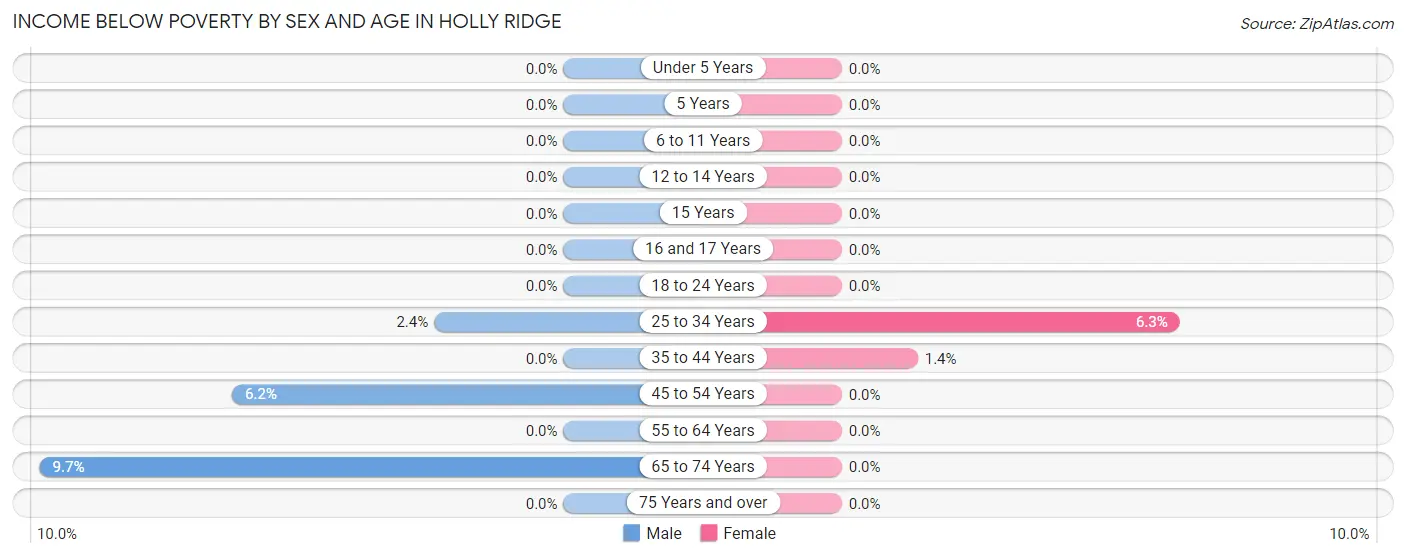
| Age Bracket | Male | Female |
| Under 5 Years | 0 (0.0%) | 0 (0.0%) |
| 5 Years | 0 (0.0%) | 0 (0.0%) |
| 6 to 11 Years | 0 (0.0%) | 0 (0.0%) |
| 12 to 14 Years | 0 (0.0%) | 0 (0.0%) |
| 15 Years | 0 (0.0%) | 0 (0.0%) |
| 16 and 17 Years | 0 (0.0%) | 0 (0.0%) |
| 18 to 24 Years | 0 (0.0%) | 0 (0.0%) |
| 25 to 34 Years | 14 (2.4%) | 32 (6.3%) |
| 35 to 44 Years | 0 (0.0%) | 4 (1.4%) |
| 45 to 54 Years | 12 (6.1%) | 0 (0.0%) |
| 55 to 64 Years | 0 (0.0%) | 0 (0.0%) |
| 65 to 74 Years | 14 (9.7%) | 0 (0.0%) |
| 75 Years and over | 0 (0.0%) | 0 (0.0%) |
| Total | 40 (1.8%) | 36 (1.7%) |
Income Above Poverty by Sex and Age in Holly Ridge
According to the poverty statistics in Holly Ridge, males aged under 5 years and females aged under 5 years are the age groups that are most secure financially, with 100.0% of males and 100.0% of females in these age groups living above the poverty line.
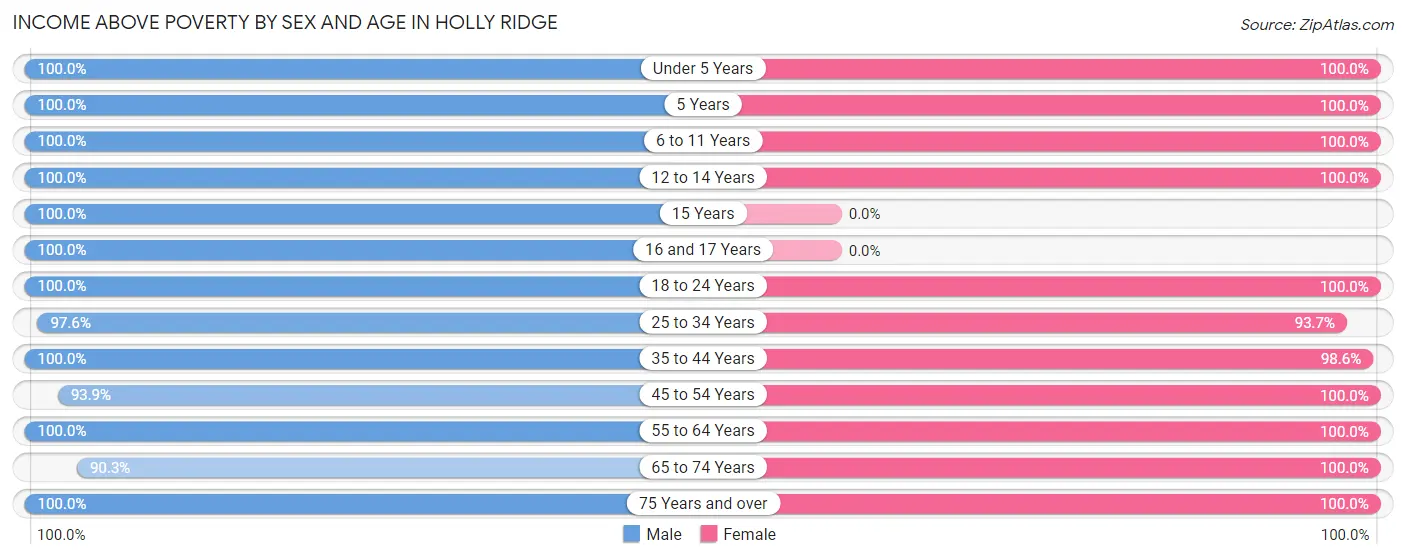
| Age Bracket | Male | Female |
| Under 5 Years | 172 (100.0%) | 141 (100.0%) |
| 5 Years | 16 (100.0%) | 11 (100.0%) |
| 6 to 11 Years | 169 (100.0%) | 292 (100.0%) |
| 12 to 14 Years | 79 (100.0%) | 43 (100.0%) |
| 15 Years | 40 (100.0%) | 0 (0.0%) |
| 16 and 17 Years | 90 (100.0%) | 0 (0.0%) |
| 18 to 24 Years | 35 (100.0%) | 57 (100.0%) |
| 25 to 34 Years | 570 (97.6%) | 478 (93.7%) |
| 35 to 44 Years | 459 (100.0%) | 279 (98.6%) |
| 45 to 54 Years | 183 (93.9%) | 295 (100.0%) |
| 55 to 64 Years | 176 (100.0%) | 226 (100.0%) |
| 65 to 74 Years | 130 (90.3%) | 113 (100.0%) |
| 75 Years and over | 3 (100.0%) | 103 (100.0%) |
| Total | 2,122 (98.2%) | 2,038 (98.3%) |
Income Below Poverty Among Married-Couple Families in Holly Ridge
The poverty statistics for married-couple families in Holly Ridge show that 1.5% or 14 of the total 964 families live below the poverty line. Families with no children have the highest poverty rate of 3.0%, comprising of 14 families. On the other hand, families with 1 or 2 children have the lowest poverty rate of 0.0%, which includes 0 families.
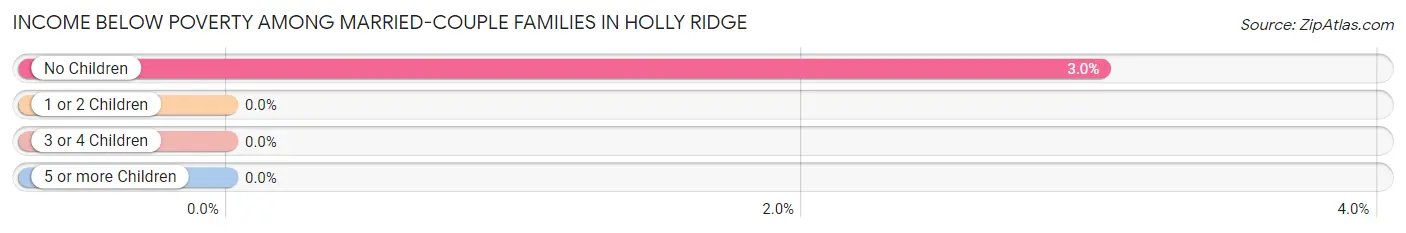
| Children | Above Poverty | Below Poverty |
| No Children | 447 (97.0%) | 14 (3.0%) |
| 1 or 2 Children | 441 (100.0%) | 0 (0.0%) |
| 3 or 4 Children | 62 (100.0%) | 0 (0.0%) |
| 5 or more Children | 0 (0.0%) | 0 (0.0%) |
| Total | 950 (98.6%) | 14 (1.5%) |
Income Below Poverty Among Single-Parent Households in Holly Ridge
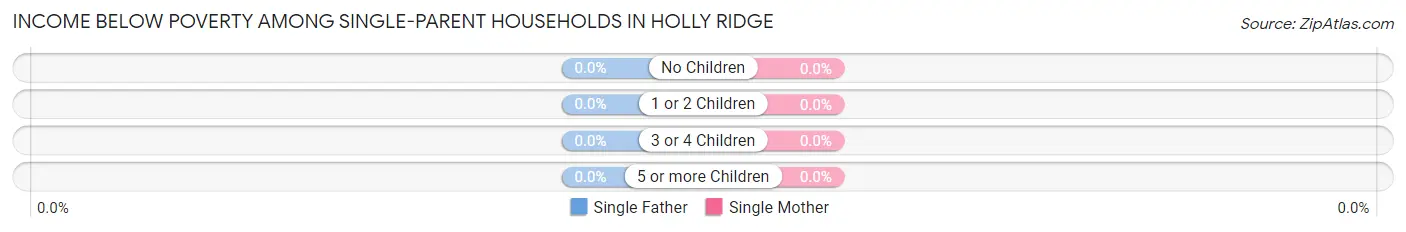
| Children | Single Father | Single Mother |
| No Children | 0 (0.0%) | 0 (0.0%) |
| 1 or 2 Children | 0 (0.0%) | 0 (0.0%) |
| 3 or 4 Children | 0 (0.0%) | 0 (0.0%) |
| 5 or more Children | 0 (0.0%) | 0 (0.0%) |
| Total | 0 (0.0%) | 0 (0.0%) |
Income Below Poverty Among Married-Couple vs Single-Parent Households in Holly Ridge
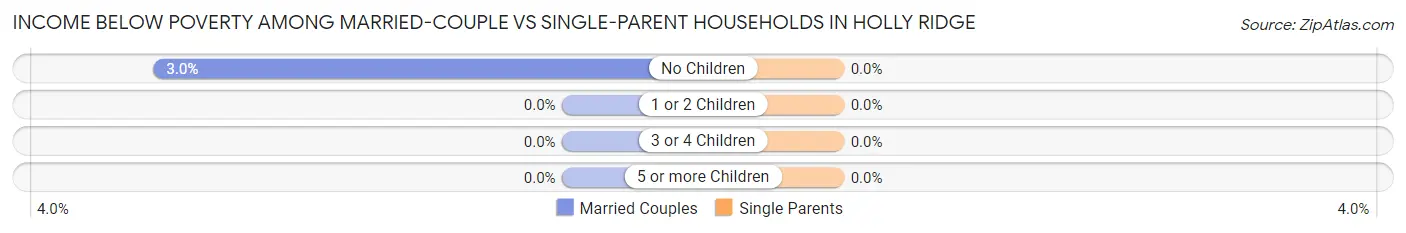
| Children | Married-Couple Families | Single-Parent Households |
| No Children | 14 (3.0%) | 0 (0.0%) |
| 1 or 2 Children | 0 (0.0%) | 0 (0.0%) |
| 3 or 4 Children | 0 (0.0%) | 0 (0.0%) |
| 5 or more Children | 0 (0.0%) | 0 (0.0%) |
| Total | 14 (1.5%) | 0 (0.0%) |
Race in Holly Ridge
The most populous races in Holly Ridge are White / Caucasian (3,858 | 91.1%), Hispanic or Latino (408 | 9.6%), and Black / African American (183 | 4.3%).
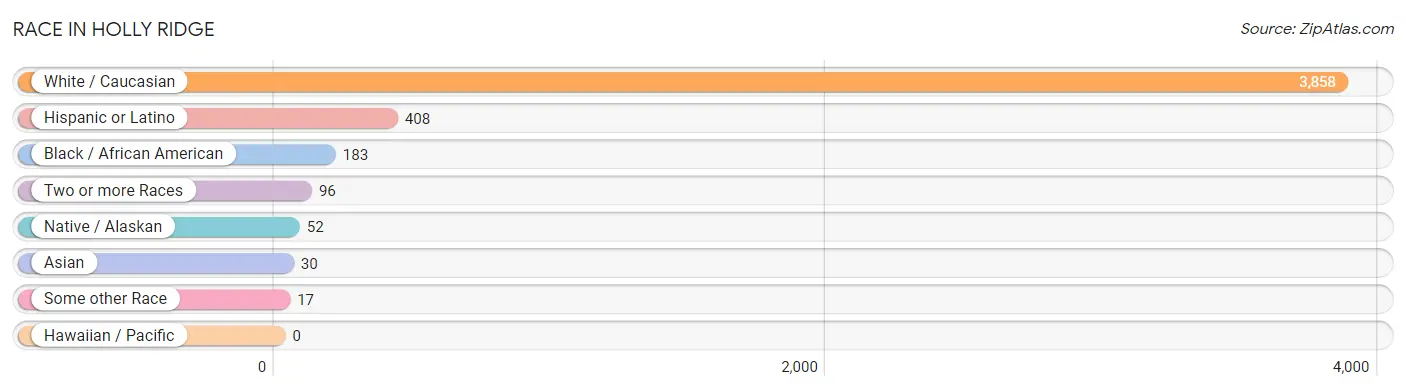
| Race | # Population | % Population |
| Asian | 30 | 0.7% |
| Black / African American | 183 | 4.3% |
| Hawaiian / Pacific | 0 | 0.0% |
| Hispanic or Latino | 408 | 9.6% |
| Native / Alaskan | 52 | 1.2% |
| White / Caucasian | 3,858 | 91.1% |
| Two or more Races | 96 | 2.3% |
| Some other Race | 17 | 0.4% |
| Total | 4,236 | 100.0% |
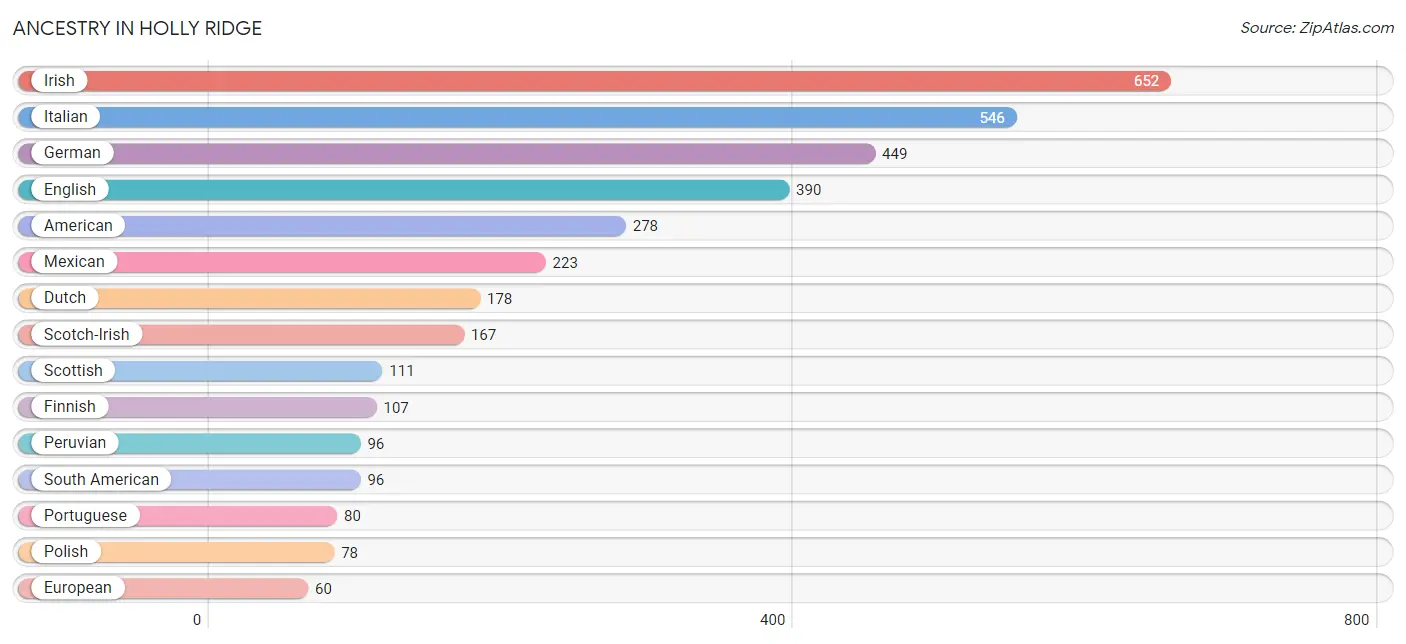
Ancestry in Holly Ridge
The most populous ancestries reported in Holly Ridge are Irish (652 | 15.4%), Italian (546 | 12.9%), German (449 | 10.6%), English (390 | 9.2%), and American (278 | 6.6%), together accounting for 54.6% of all Holly Ridge residents.
| Ancestry | # Population | % Population |
| American | 278 | 6.6% |
| Arab | 5 | 0.1% |
| Bhutanese | 7 | 0.2% |
| Burmese | 23 | 0.5% |
| Cherokee | 12 | 0.3% |
| Chippewa | 25 | 0.6% |
| Croatian | 6 | 0.1% |
| Dutch | 178 | 4.2% |
| English | 390 | 9.2% |
| European | 60 | 1.4% |
| Finnish | 107 | 2.5% |
| French | 14 | 0.3% |
| German | 449 | 10.6% |
| Greek | 46 | 1.1% |
| Guyanese | 29 | 0.7% |
| Hungarian | 31 | 0.7% |
| Irish | 652 | 15.4% |
| Italian | 546 | 12.9% |
| Korean | 26 | 0.6% |
| Lebanese | 5 | 0.1% |
| Lithuanian | 16 | 0.4% |
| Lumbee | 25 | 0.6% |
| Mexican | 223 | 5.3% |
| Norwegian | 23 | 0.5% |
| Peruvian | 96 | 2.3% |
| Polish | 78 | 1.8% |
| Portuguese | 80 | 1.9% |
| Puerto Rican | 42 | 1.0% |
| Scandinavian | 22 | 0.5% |
| Scotch-Irish | 167 | 3.9% |
| Scottish | 111 | 2.6% |
| South American | 96 | 2.3% |
| South American Indian | 5 | 0.1% |
| Spanish | 47 | 1.1% |
| Swiss | 18 | 0.4% |
| Ukrainian | 2 | 0.1% |
| Welsh | 7 | 0.2% |
| West Indian | 5 | 0.1% | View All 38 Rows |
Immigrants in Holly Ridge
The most numerous immigrant groups reported in Holly Ridge came from Latin America (127 | 3.0%), Central America (125 | 2.9%), Mexico (125 | 2.9%), Asia (30 | 0.7%), and Eastern Asia (30 | 0.7%), together accounting for 10.3% of all Holly Ridge residents.
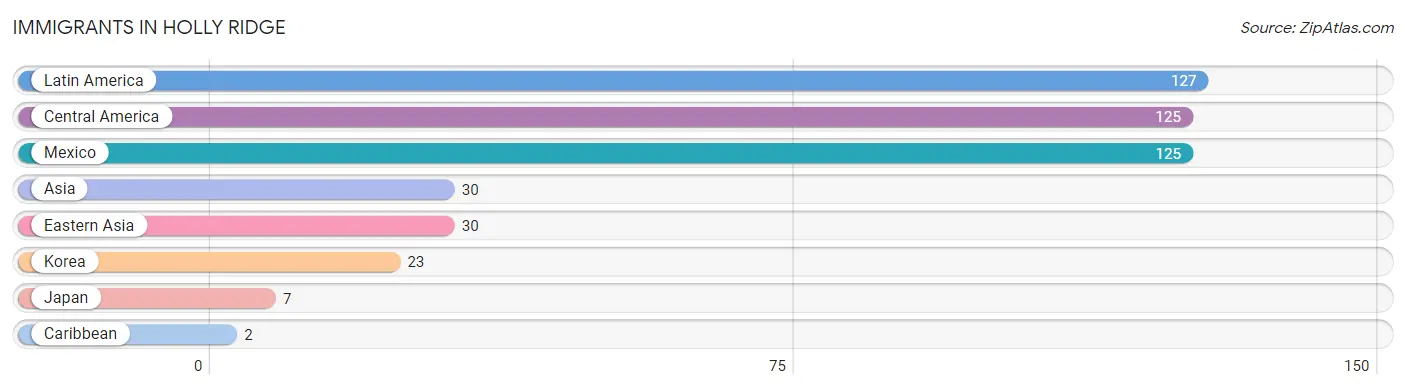
| Immigration Origin | # Population | % Population |
| Asia | 30 | 0.7% |
| Caribbean | 2 | 0.1% |
| Central America | 125 | 2.9% |
| Eastern Asia | 30 | 0.7% |
| Japan | 7 | 0.2% |
| Korea | 23 | 0.5% |
| Latin America | 127 | 3.0% |
| Mexico | 125 | 2.9% | View All 8 Rows |
Sex and Age in Holly Ridge
Sex and Age in Holly Ridge
The most populous age groups in Holly Ridge are 30 to 34 Years (401 | 18.5%) for men and 30 to 34 Years (356 | 17.2%) for women.
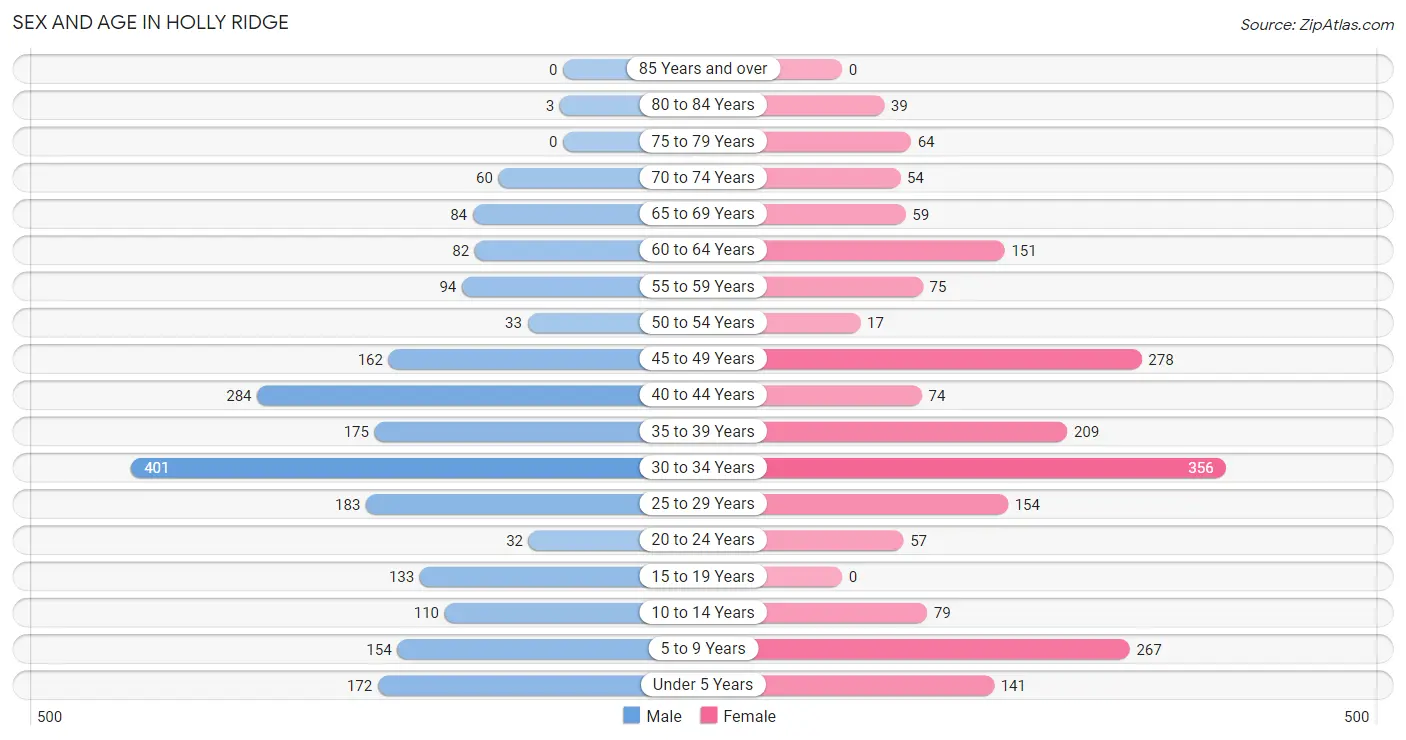
| Age Bracket | Male | Female |
| Under 5 Years | 172 (8.0%) | 141 (6.8%) |
| 5 to 9 Years | 154 (7.1%) | 267 (12.9%) |
| 10 to 14 Years | 110 (5.1%) | 79 (3.8%) |
| 15 to 19 Years | 133 (6.1%) | 0 (0.0%) |
| 20 to 24 Years | 32 (1.5%) | 57 (2.8%) |
| 25 to 29 Years | 183 (8.5%) | 154 (7.4%) |
| 30 to 34 Years | 401 (18.5%) | 356 (17.2%) |
| 35 to 39 Years | 175 (8.1%) | 209 (10.1%) |
| 40 to 44 Years | 284 (13.1%) | 74 (3.6%) |
| 45 to 49 Years | 162 (7.5%) | 278 (13.4%) |
| 50 to 54 Years | 33 (1.5%) | 17 (0.8%) |
| 55 to 59 Years | 94 (4.3%) | 75 (3.6%) |
| 60 to 64 Years | 82 (3.8%) | 151 (7.3%) |
| 65 to 69 Years | 84 (3.9%) | 59 (2.8%) |
| 70 to 74 Years | 60 (2.8%) | 54 (2.6%) |
| 75 to 79 Years | 0 (0.0%) | 64 (3.1%) |
| 80 to 84 Years | 3 (0.1%) | 39 (1.9%) |
| 85 Years and over | 0 (0.0%) | 0 (0.0%) |
| Total | 2,162 (100.0%) | 2,074 (100.0%) |
Families and Households in Holly Ridge
Median Family Size in Holly Ridge
The median family size in Holly Ridge is 3.05 persons per family, with single female/mother families (149 | 13.3%) accounting for the largest median family size of 3.56 persons per family. On the other hand, single male/father families (4 | 0.4%) represent the smallest median family size with 2.00 persons per family.
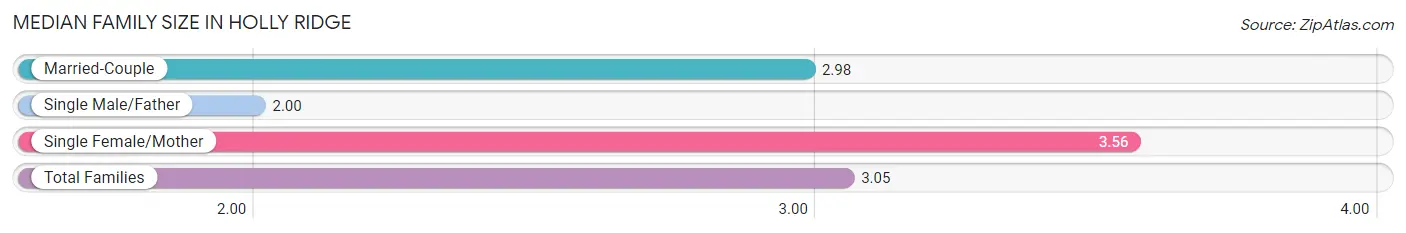
| Family Type | # Families | Family Size |
| Married-Couple | 964 (86.3%) | 2.98 |
| Single Male/Father | 4 (0.4%) | 2.00 |
| Single Female/Mother | 149 (13.3%) | 3.56 |
| Total Families | 1,117 (100.0%) | 3.05 |
Median Household Size in Holly Ridge
The median household size in Holly Ridge is 2.68 persons per household, with single female/mother households (149 | 9.4%) accounting for the largest median household size of 3.6 persons per household. non-family households (466 | 29.4%) represent the smallest median household size with 1.73 persons per household.
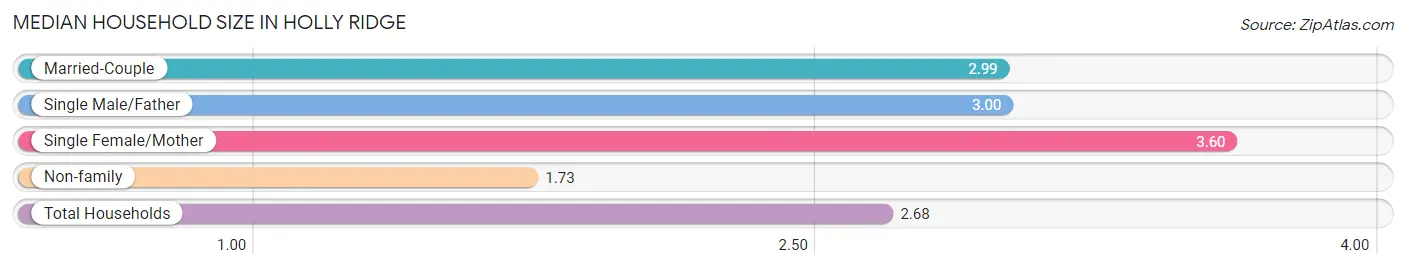
| Household Type | # Households | Household Size |
| Married-Couple | 964 (60.9%) | 2.99 |
| Single Male/Father | 4 (0.3%) | 3.00 |
| Single Female/Mother | 149 (9.4%) | 3.60 |
| Non-family | 466 (29.4%) | 1.73 |
| Total Households | 1,583 (100.0%) | 2.68 |
Household Size by Marriage Status in Holly Ridge
Out of a total of 1,583 households in Holly Ridge, 1,117 (70.6%) are family households, while 466 (29.4%) are nonfamily households. The most numerous type of family households are 2-person households, comprising 469, and the most common type of nonfamily households are 1-person households, comprising 245.
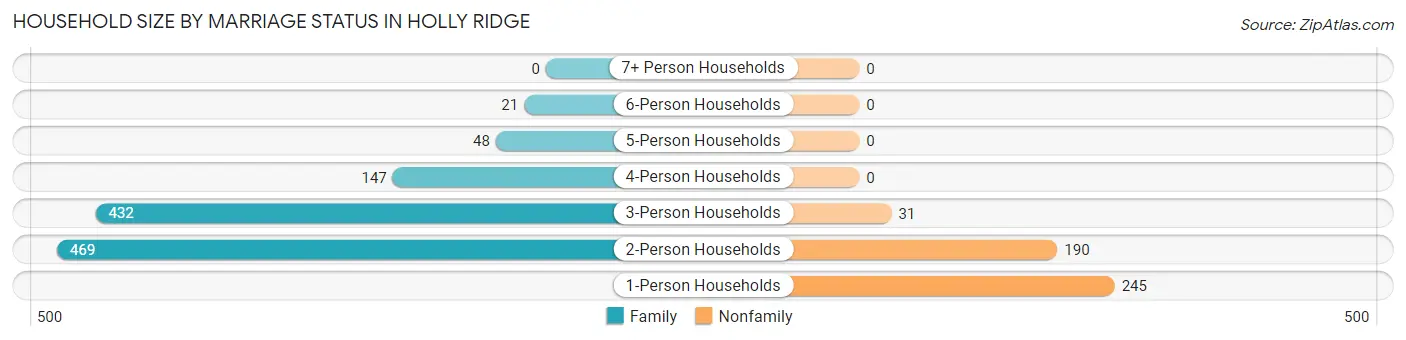
| Household Size | Family Households | Nonfamily Households |
| 1-Person Households | - | 245 (15.5%) |
| 2-Person Households | 469 (29.6%) | 190 (12.0%) |
| 3-Person Households | 432 (27.3%) | 31 (2.0%) |
| 4-Person Households | 147 (9.3%) | 0 (0.0%) |
| 5-Person Households | 48 (3.0%) | 0 (0.0%) |
| 6-Person Households | 21 (1.3%) | 0 (0.0%) |
| 7+ Person Households | 0 (0.0%) | 0 (0.0%) |
| Total | 1,117 (70.6%) | 466 (29.4%) |
Female Fertility in Holly Ridge
Fertility by Age in Holly Ridge
Average fertility rate in Holly Ridge is 87.0 births per 1,000 women. Women in the age bracket of 20 to 34 years have the highest fertility rate with 173.0 births per 1,000 women. Women in the age bracket of 20 to 34 years acount for 100.0% of all women with births.
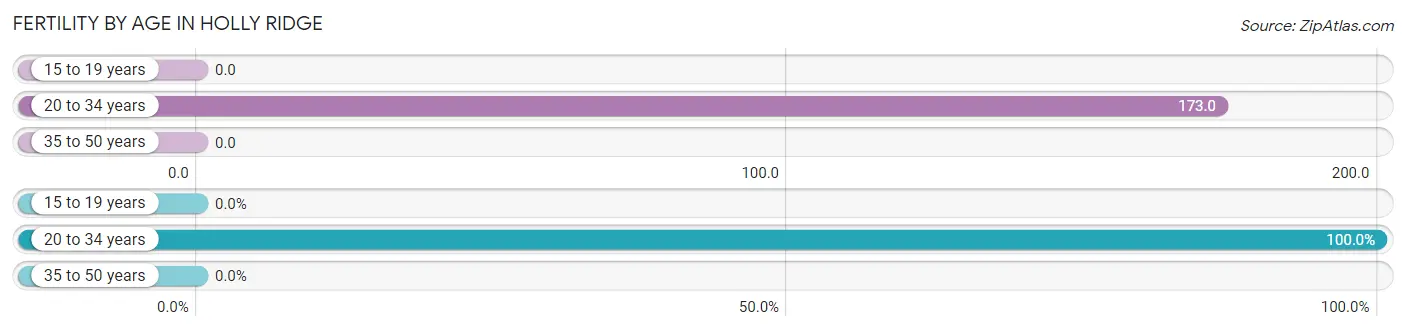
| Age Bracket | Women with Births | Births / 1,000 Women |
| 15 to 19 years | 0 (0.0%) | 0.0 |
| 20 to 34 years | 98 (100.0%) | 173.0 |
| 35 to 50 years | 0 (0.0%) | 0.0 |
| Total | 98 (100.0%) | 87.0 |
Fertility by Age by Marriage Status in Holly Ridge
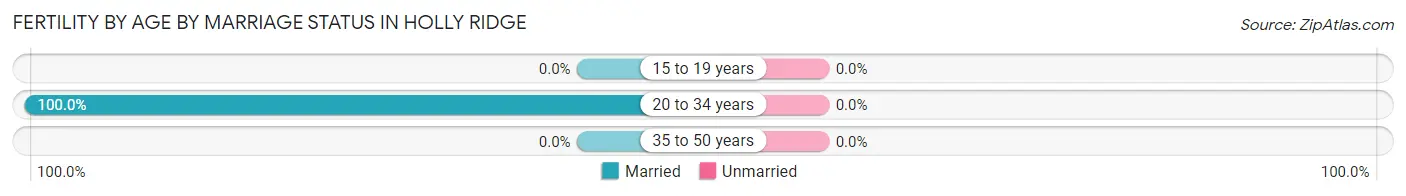
| Age Bracket | Married | Unmarried |
| 15 to 19 years | 0 (0.0%) | 0 (0.0%) |
| 20 to 34 years | 98 (100.0%) | 0 (0.0%) |
| 35 to 50 years | 0 (0.0%) | 0 (0.0%) |
| Total | 98 (100.0%) | 0 (0.0%) |
Fertility by Education in Holly Ridge
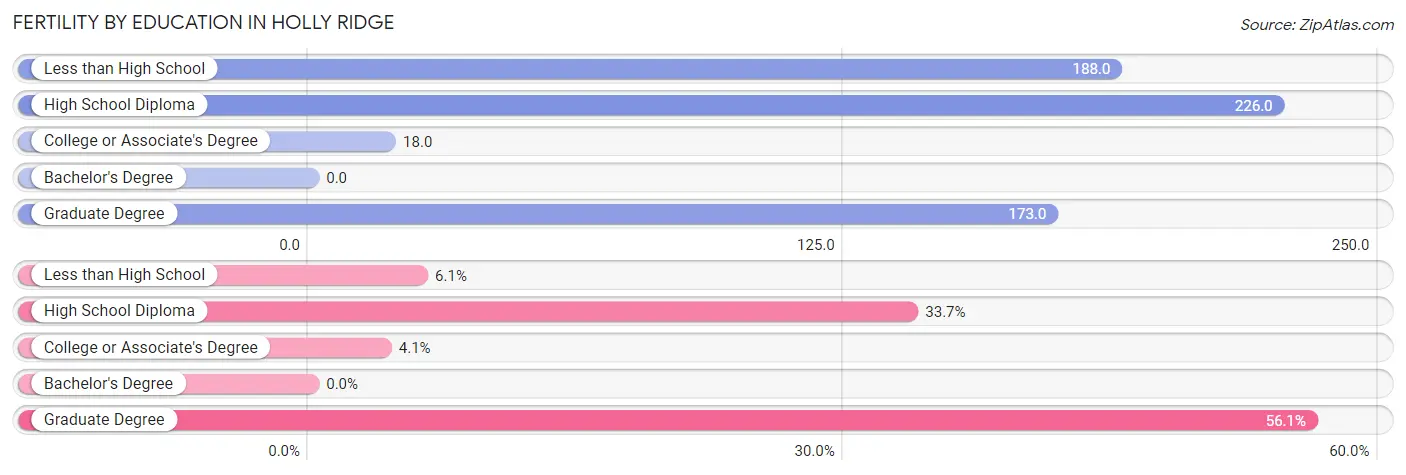
| Educational Attainment | Women with Births | Births / 1,000 Women |
| Less than High School | 6 (6.1%) | 188.0 |
| High School Diploma | 33 (33.7%) | 226.0 |
| College or Associate's Degree | 4 (4.1%) | 18.0 |
| Bachelor's Degree | 0 (0.0%) | 0.0 |
| Graduate Degree | 55 (56.1%) | 173.0 |
| Total | 98 (100.0%) | 87.0 |
Fertility by Education by Marriage Status in Holly Ridge
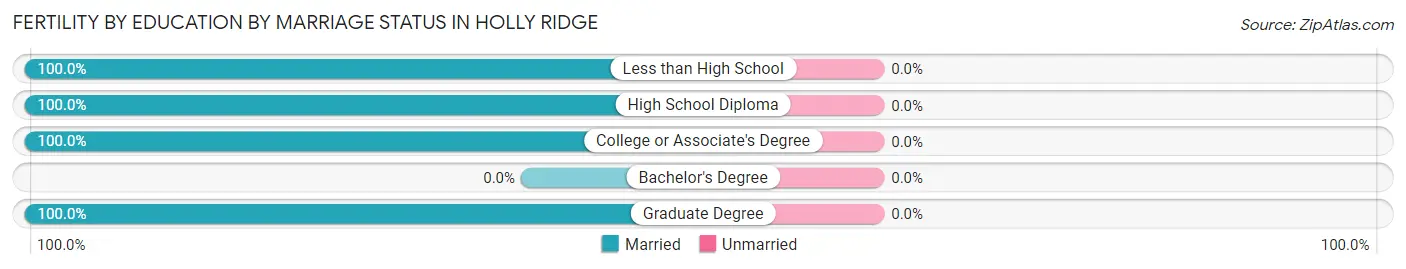
| Educational Attainment | Married | Unmarried |
| Less than High School | 6 (100.0%) | 0 (0.0%) |
| High School Diploma | 33 (100.0%) | 0 (0.0%) |
| College or Associate's Degree | 4 (100.0%) | 0 (0.0%) |
| Bachelor's Degree | 0 (0.0%) | 0 (0.0%) |
| Graduate Degree | 55 (100.0%) | 0 (0.0%) |
| Total | 98 (100.0%) | 0 (0.0%) |
Employment Characteristics in Holly Ridge
Employment by Class of Employer in Holly Ridge
Among the 2,623 employed individuals in Holly Ridge, private company employees (1,617 | 61.7%), federal government employees (585 | 22.3%), and local government employees (129 | 4.9%) make up the most common classes of employment.
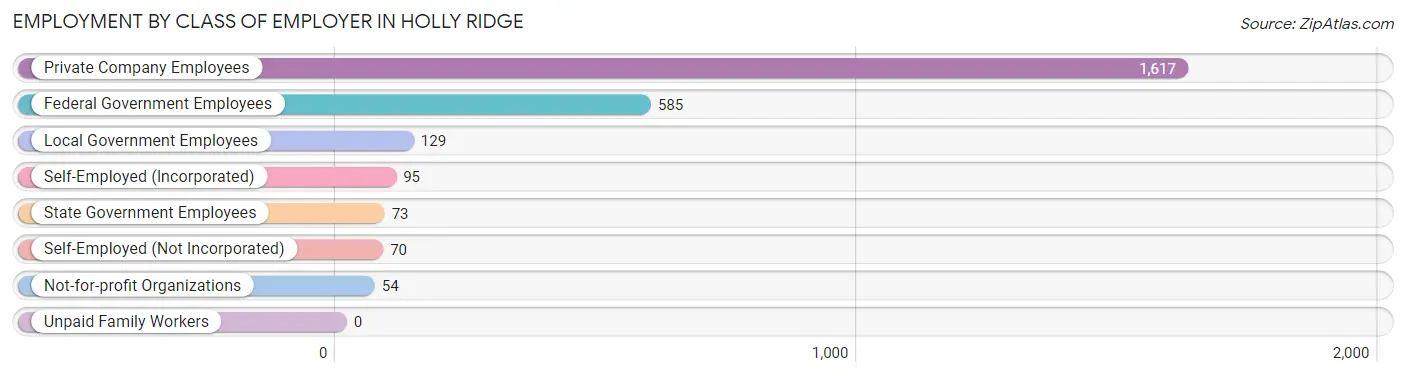
| Employer Class | # Employees | % Employees |
| Private Company Employees | 1,617 | 61.7% |
| Self-Employed (Incorporated) | 95 | 3.6% |
| Self-Employed (Not Incorporated) | 70 | 2.7% |
| Not-for-profit Organizations | 54 | 2.1% |
| Local Government Employees | 129 | 4.9% |
| State Government Employees | 73 | 2.8% |
| Federal Government Employees | 585 | 22.3% |
| Unpaid Family Workers | 0 | 0.0% |
| Total | 2,623 | 100.0% |
Employment Status by Age in Holly Ridge
According to the labor force statistics for Holly Ridge, out of the total population over 16 years of age (3,273), 80.8% or 2,645 individuals are in the labor force, with 1.0% or 26 of them unemployed. The age group with the highest labor force participation rate is 20 to 24 years, with 100.0% or 89 individuals in the labor force. Within the labor force, the 65 to 74 years age range has the highest percentage of unemployed individuals, with 6.3% or 7 of them being unemployed.
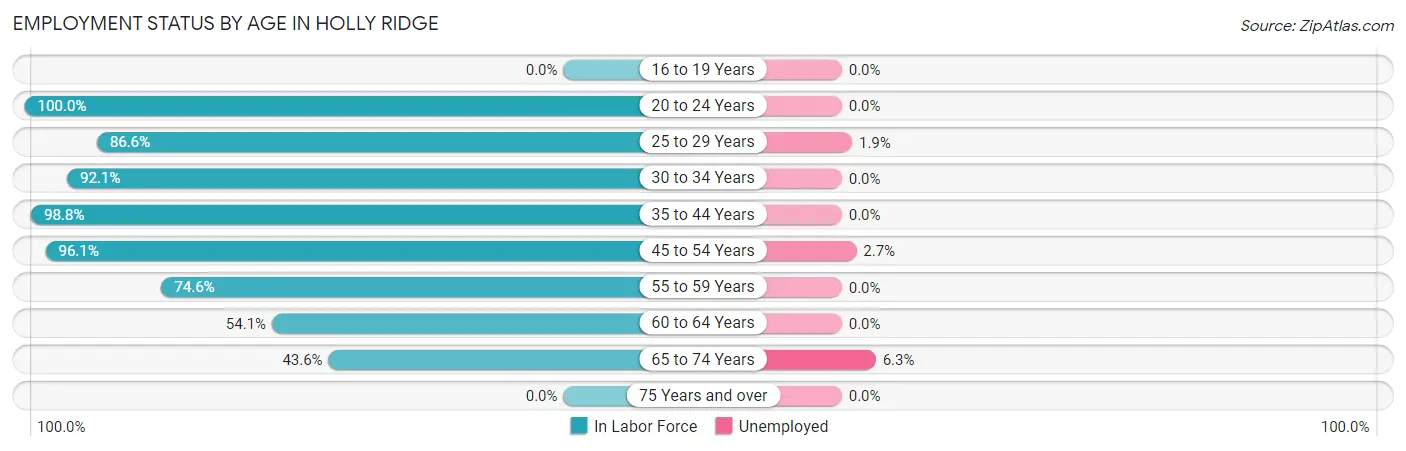
| Age Bracket | In Labor Force | Unemployed |
| 16 to 19 Years | 0 (0.0%) | 0 (0.0%) |
| 20 to 24 Years | 89 (100.0%) | 0 (0.0%) |
| 25 to 29 Years | 292 (86.6%) | 6 (1.9%) |
| 30 to 34 Years | 697 (92.1%) | 0 (0.0%) |
| 35 to 44 Years | 733 (98.8%) | 0 (0.0%) |
| 45 to 54 Years | 471 (96.1%) | 13 (2.7%) |
| 55 to 59 Years | 126 (74.6%) | 0 (0.0%) |
| 60 to 64 Years | 126 (54.1%) | 0 (0.0%) |
| 65 to 74 Years | 112 (43.6%) | 7 (6.3%) |
| 75 Years and over | 0 (0.0%) | 0 (0.0%) |
| Total | 2,645 (80.8%) | 26 (1.0%) |
Employment Status by Educational Attainment in Holly Ridge
According to labor force statistics for Holly Ridge, 89.6% of individuals (2,444) out of the total population between 25 and 64 years of age (2,728) are in the labor force, with 0.8% or 20 of them being unemployed. The group with the highest labor force participation rate are those with the educational attainment of bachelor's degree or higher, with 92.5% or 1,312 individuals in the labor force. Within the labor force, individuals with less than high school education have the highest percentage of unemployment, with 8.1% or 12 of them being unemployed.
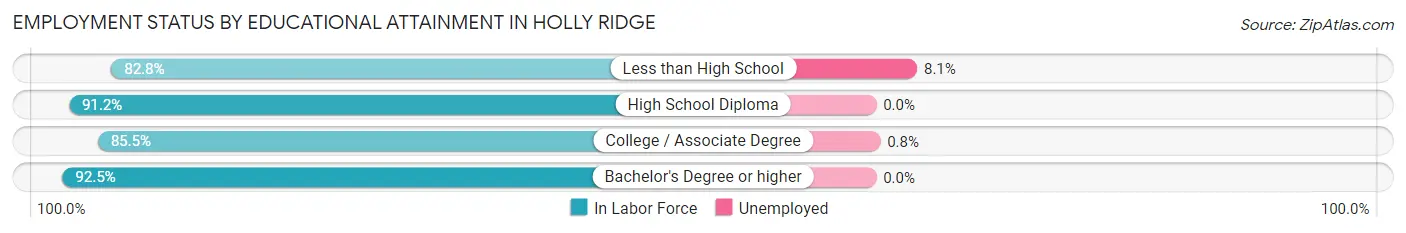
| Educational Attainment | In Labor Force | Unemployed |
| Less than High School | 154 (82.8%) | 15 (8.1%) |
| High School Diploma | 289 (91.2%) | 0 (0.0%) |
| College / Associate Degree | 690 (85.5%) | 6 (0.8%) |
| Bachelor's Degree or higher | 1,312 (92.5%) | 0 (0.0%) |
| Total | 2,444 (89.6%) | 22 (0.8%) |
Employment Occupations by Sex in Holly Ridge
Management, Business, Science and Arts Occupations
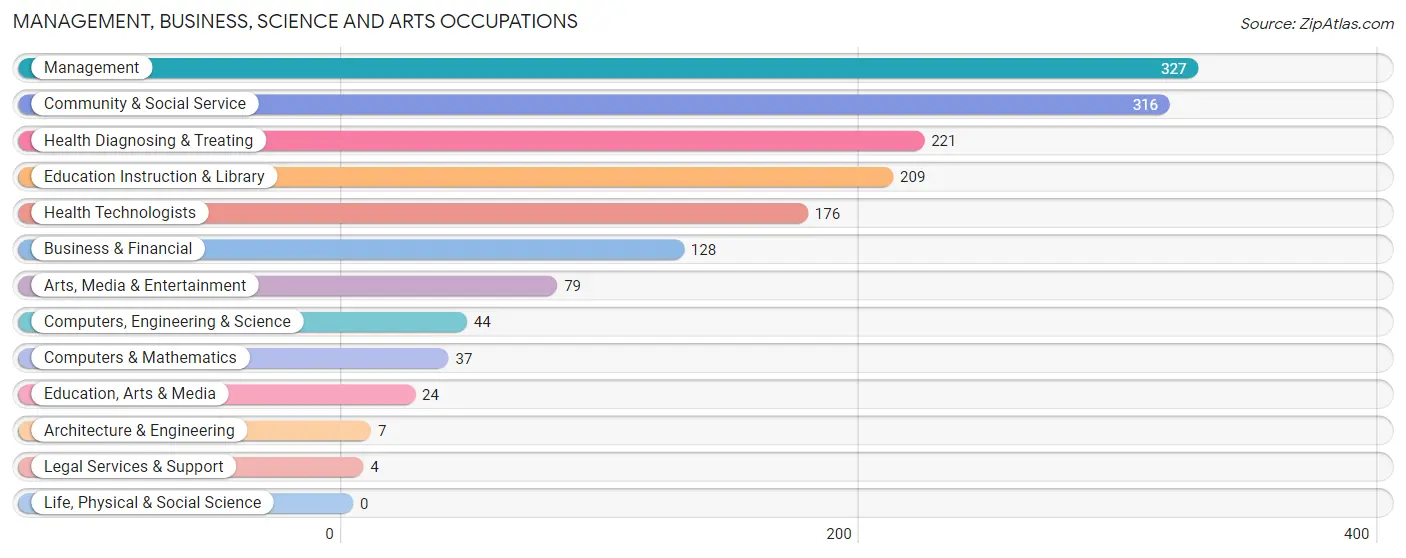
The most common Management, Business, Science and Arts occupations in Holly Ridge are Management (327 | 14.9%), Community & Social Service (316 | 14.4%), Health Diagnosing & Treating (221 | 10.1%), Education Instruction & Library (209 | 9.5%), and Health Technologists (176 | 8.0%).
Management, Business, Science and Arts Occupations by Sex
Within the Management, Business, Science and Arts occupations in Holly Ridge, the most male-oriented occupations are Architecture & Engineering (100.0%), Arts, Media & Entertainment (60.8%), and Computers, Engineering & Science (54.5%), while the most female-oriented occupations are Legal Services & Support (100.0%), Education Instruction & Library (92.3%), and Business & Financial (78.9%).
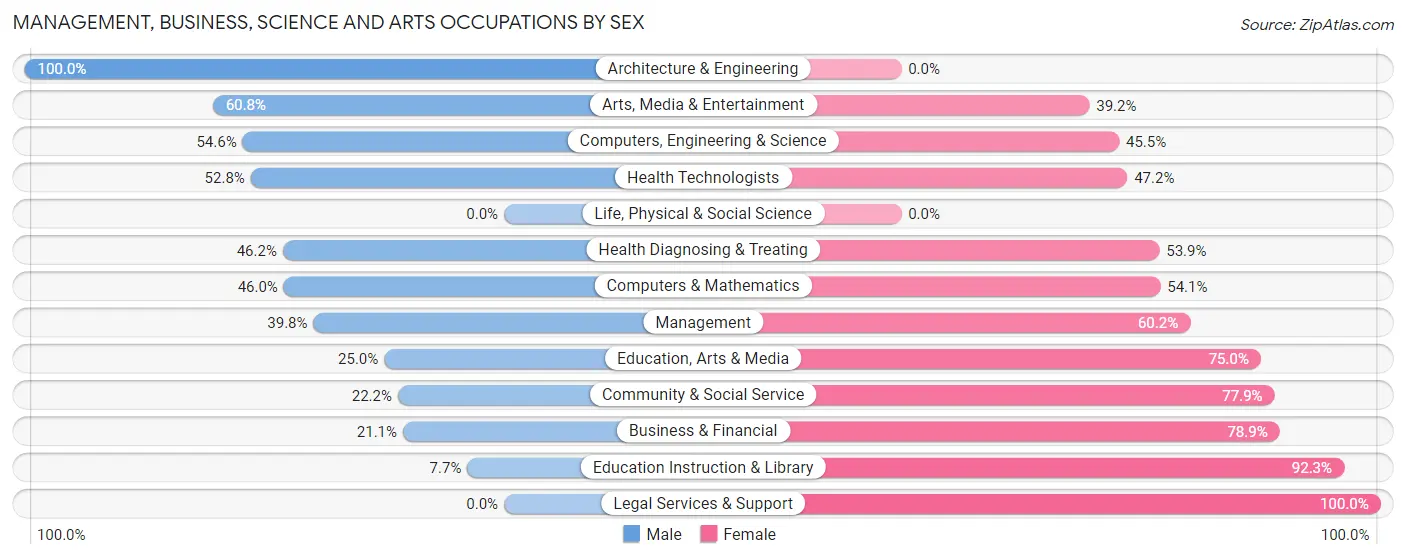
| Occupation | Male | Female |
| Management | 130 (39.8%) | 197 (60.2%) |
| Business & Financial | 27 (21.1%) | 101 (78.9%) |
| Computers, Engineering & Science | 24 (54.5%) | 20 (45.5%) |
| Computers & Mathematics | 17 (46.0%) | 20 (54.0%) |
| Architecture & Engineering | 7 (100.0%) | 0 (0.0%) |
| Life, Physical & Social Science | 0 (0.0%) | 0 (0.0%) |
| Community & Social Service | 70 (22.2%) | 246 (77.8%) |
| Education, Arts & Media | 6 (25.0%) | 18 (75.0%) |
| Legal Services & Support | 0 (0.0%) | 4 (100.0%) |
| Education Instruction & Library | 16 (7.7%) | 193 (92.3%) |
| Arts, Media & Entertainment | 48 (60.8%) | 31 (39.2%) |
| Health Diagnosing & Treating | 102 (46.2%) | 119 (53.8%) |
| Health Technologists | 93 (52.8%) | 83 (47.2%) |
| Total (Category) | 353 (34.1%) | 683 (65.9%) |
| Total (Overall) | 1,075 (49.0%) | 1,119 (51.0%) |
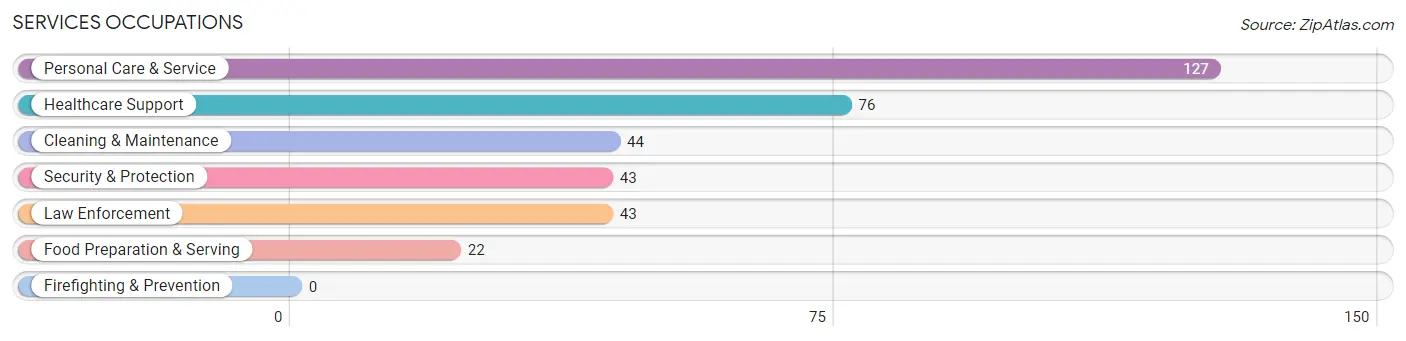
Services Occupations
The most common Services occupations in Holly Ridge are Personal Care & Service (127 | 5.8%), Healthcare Support (76 | 3.5%), Cleaning & Maintenance (44 | 2.0%), Security & Protection (43 | 2.0%), and Law Enforcement (43 | 2.0%).
Services Occupations by Sex
Within the Services occupations in Holly Ridge, the most male-oriented occupations are Cleaning & Maintenance (100.0%), Food Preparation & Serving (50.0%), and Security & Protection (30.2%), while the most female-oriented occupations are Healthcare Support (100.0%), Personal Care & Service (95.3%), and Security & Protection (69.8%).
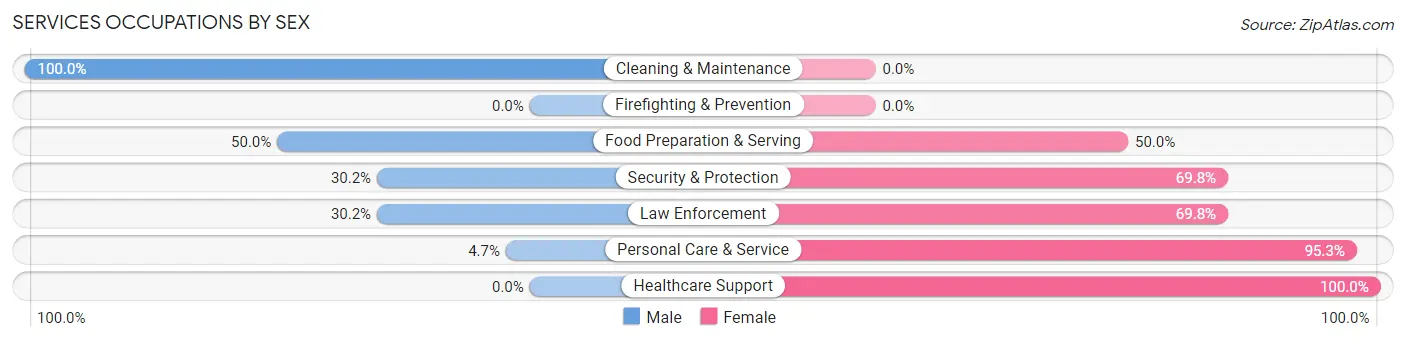
| Occupation | Male | Female |
| Healthcare Support | 0 (0.0%) | 76 (100.0%) |
| Security & Protection | 13 (30.2%) | 30 (69.8%) |
| Firefighting & Prevention | 0 (0.0%) | 0 (0.0%) |
| Law Enforcement | 13 (30.2%) | 30 (69.8%) |
| Food Preparation & Serving | 11 (50.0%) | 11 (50.0%) |
| Cleaning & Maintenance | 44 (100.0%) | 0 (0.0%) |
| Personal Care & Service | 6 (4.7%) | 121 (95.3%) |
| Total (Category) | 74 (23.7%) | 238 (76.3%) |
| Total (Overall) | 1,075 (49.0%) | 1,119 (51.0%) |
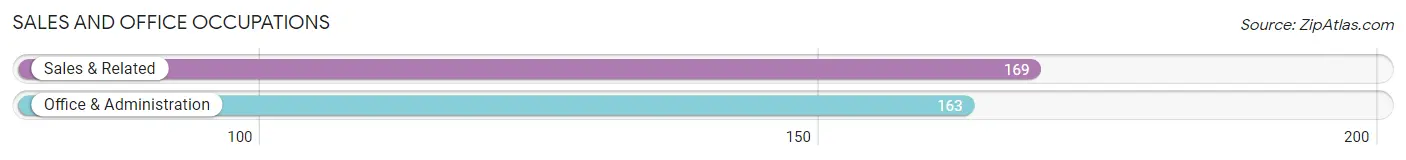
Sales and Office Occupations
The most common Sales and Office occupations in Holly Ridge are Sales & Related (169 | 7.7%), and Office & Administration (163 | 7.4%).
Sales and Office Occupations by Sex
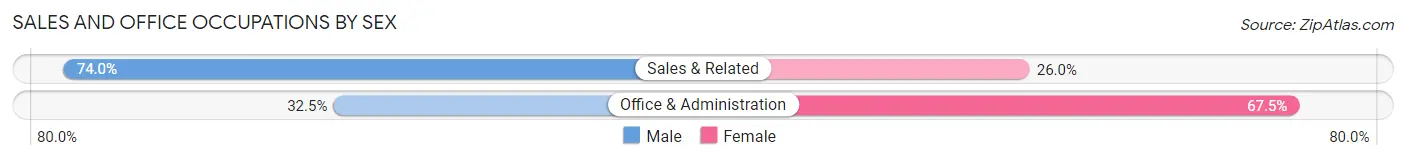
| Occupation | Male | Female |
| Sales & Related | 125 (74.0%) | 44 (26.0%) |
| Office & Administration | 53 (32.5%) | 110 (67.5%) |
| Total (Category) | 178 (53.6%) | 154 (46.4%) |
| Total (Overall) | 1,075 (49.0%) | 1,119 (51.0%) |
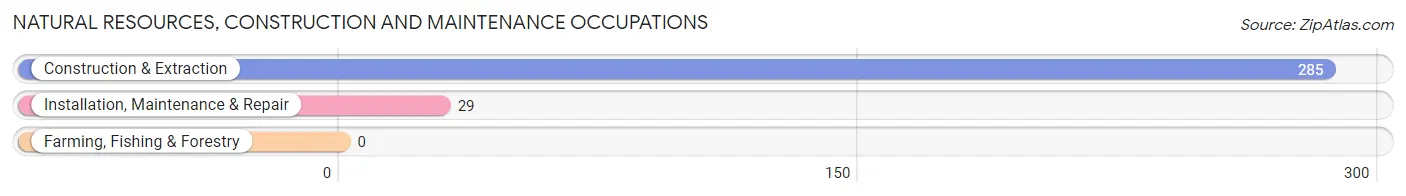
Natural Resources, Construction and Maintenance Occupations
The most common Natural Resources, Construction and Maintenance occupations in Holly Ridge are Construction & Extraction (285 | 13.0%), and Installation, Maintenance & Repair (29 | 1.3%).
Natural Resources, Construction and Maintenance Occupations by Sex
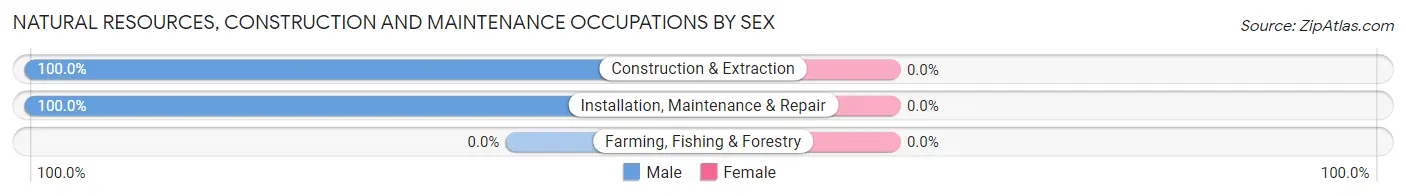
| Occupation | Male | Female |
| Farming, Fishing & Forestry | 0 (0.0%) | 0 (0.0%) |
| Construction & Extraction | 285 (100.0%) | 0 (0.0%) |
| Installation, Maintenance & Repair | 29 (100.0%) | 0 (0.0%) |
| Total (Category) | 314 (100.0%) | 0 (0.0%) |
| Total (Overall) | 1,075 (49.0%) | 1,119 (51.0%) |
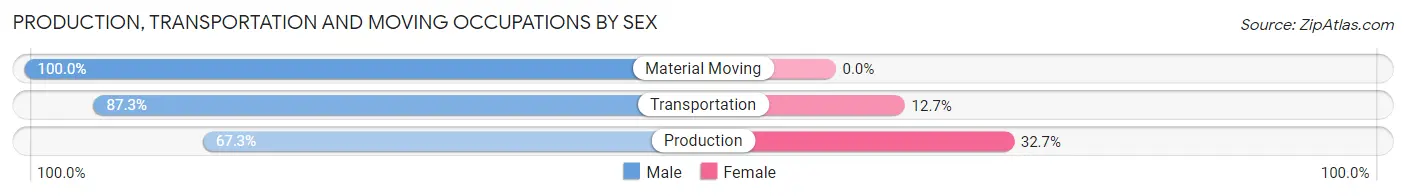
Production, Transportation and Moving Occupations
The most common Production, Transportation and Moving occupations in Holly Ridge are Production (107 | 4.9%), Transportation (71 | 3.2%), and Material Moving (22 | 1.0%).
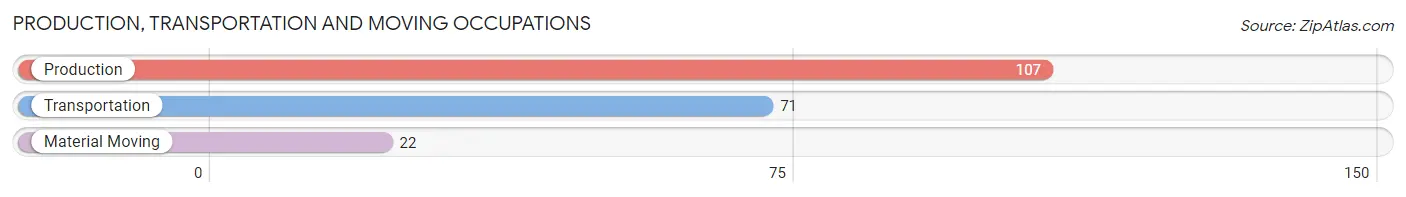
Production, Transportation and Moving Occupations by Sex
| Occupation | Male | Female |
| Production | 72 (67.3%) | 35 (32.7%) |
| Transportation | 62 (87.3%) | 9 (12.7%) |
| Material Moving | 22 (100.0%) | 0 (0.0%) |
| Total (Category) | 156 (78.0%) | 44 (22.0%) |
| Total (Overall) | 1,075 (49.0%) | 1,119 (51.0%) |
Employment Industries by Sex in Holly Ridge
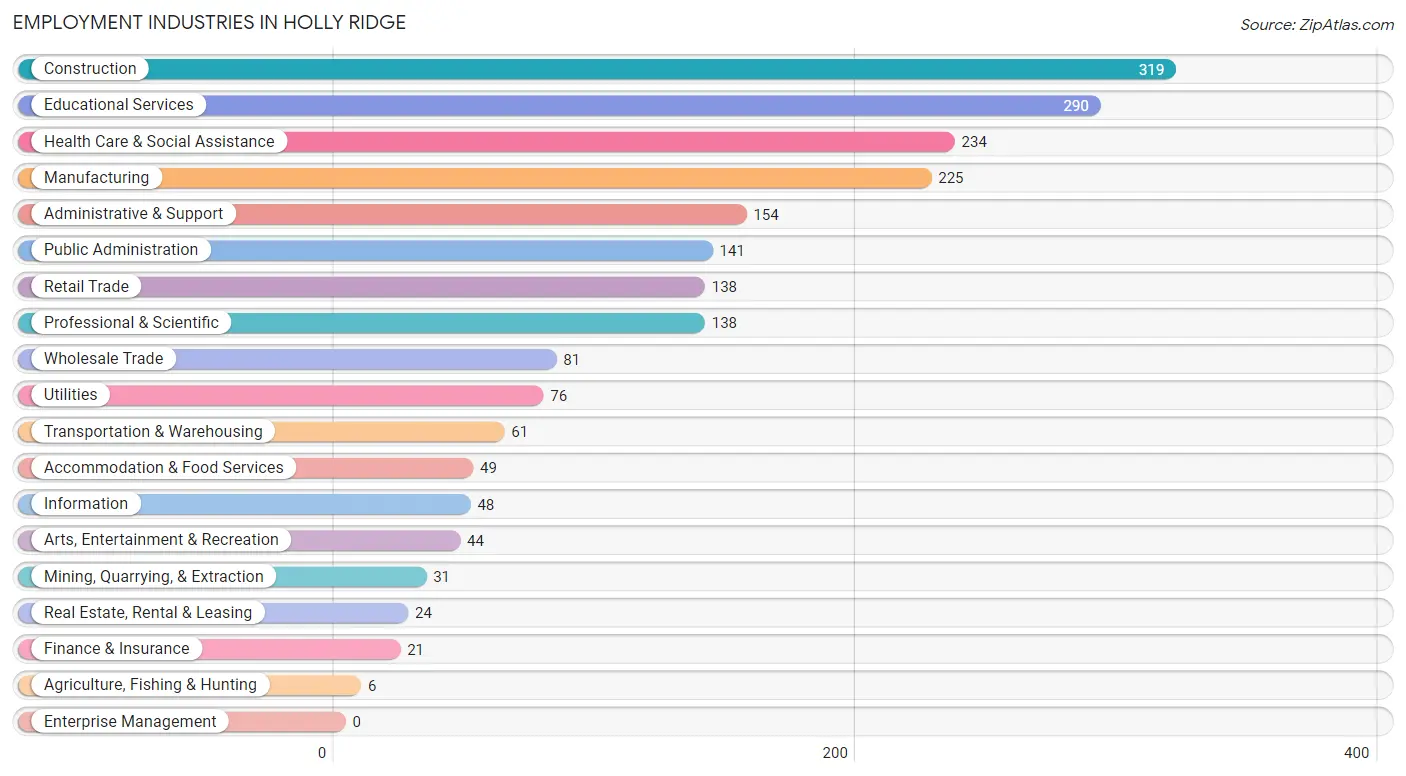
Employment Industries in Holly Ridge
The major employment industries in Holly Ridge include Construction (319 | 14.5%), Educational Services (290 | 13.2%), Health Care & Social Assistance (234 | 10.7%), Manufacturing (225 | 10.3%), and Administrative & Support (154 | 7.0%).
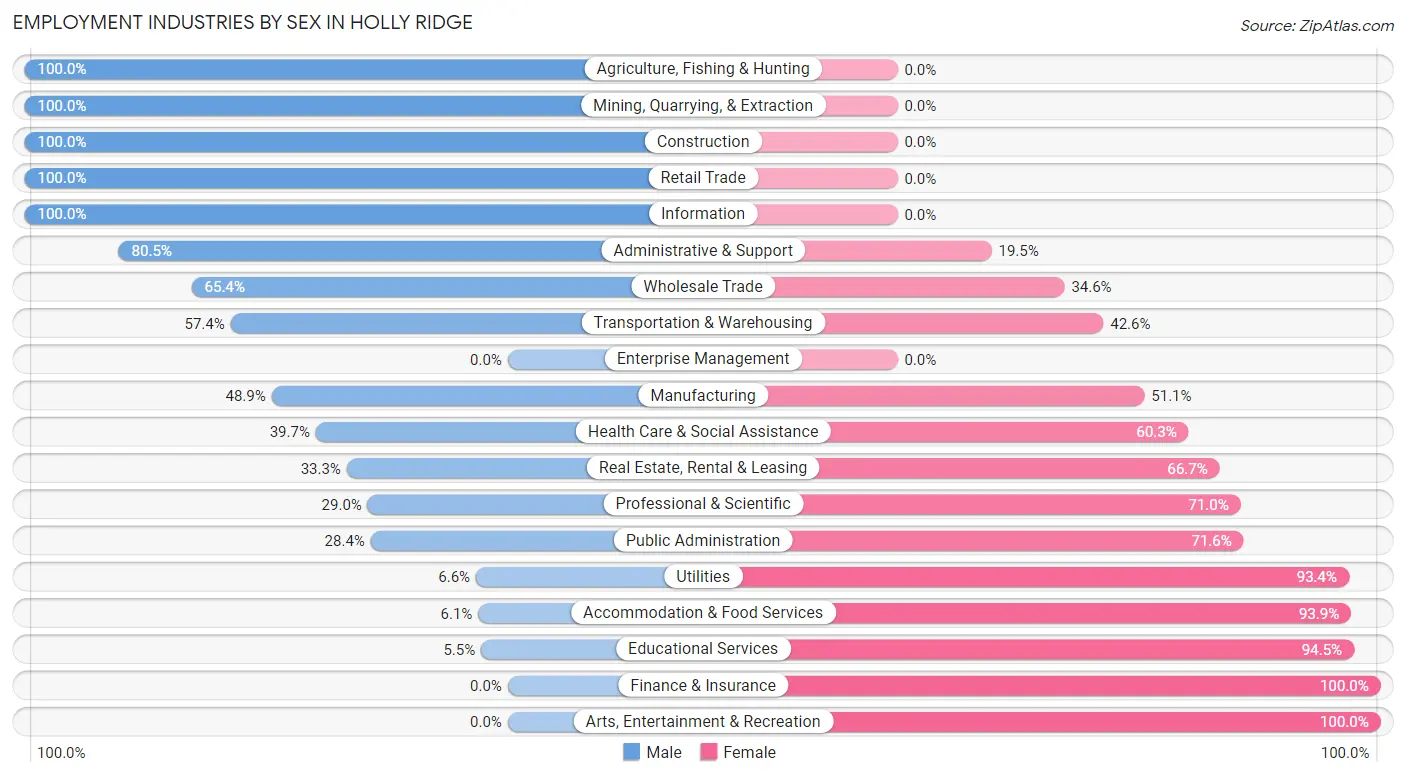
Employment Industries by Sex in Holly Ridge
The Holly Ridge industries that see more men than women are Agriculture, Fishing & Hunting (100.0%), Mining, Quarrying, & Extraction (100.0%), and Construction (100.0%), whereas the industries that tend to have a higher number of women are Finance & Insurance (100.0%), Arts, Entertainment & Recreation (100.0%), and Educational Services (94.5%).
| Industry | Male | Female |
| Agriculture, Fishing & Hunting | 6 (100.0%) | 0 (0.0%) |
| Mining, Quarrying, & Extraction | 31 (100.0%) | 0 (0.0%) |
| Construction | 319 (100.0%) | 0 (0.0%) |
| Manufacturing | 110 (48.9%) | 115 (51.1%) |
| Wholesale Trade | 53 (65.4%) | 28 (34.6%) |
| Retail Trade | 138 (100.0%) | 0 (0.0%) |
| Transportation & Warehousing | 35 (57.4%) | 26 (42.6%) |
| Utilities | 5 (6.6%) | 71 (93.4%) |
| Information | 48 (100.0%) | 0 (0.0%) |
| Finance & Insurance | 0 (0.0%) | 21 (100.0%) |
| Real Estate, Rental & Leasing | 8 (33.3%) | 16 (66.7%) |
| Professional & Scientific | 40 (29.0%) | 98 (71.0%) |
| Enterprise Management | 0 (0.0%) | 0 (0.0%) |
| Administrative & Support | 124 (80.5%) | 30 (19.5%) |
| Educational Services | 16 (5.5%) | 274 (94.5%) |
| Health Care & Social Assistance | 93 (39.7%) | 141 (60.3%) |
| Arts, Entertainment & Recreation | 0 (0.0%) | 44 (100.0%) |
| Accommodation & Food Services | 3 (6.1%) | 46 (93.9%) |
| Public Administration | 40 (28.4%) | 101 (71.6%) |
| Total | 1,075 (49.0%) | 1,119 (51.0%) |
Education in Holly Ridge
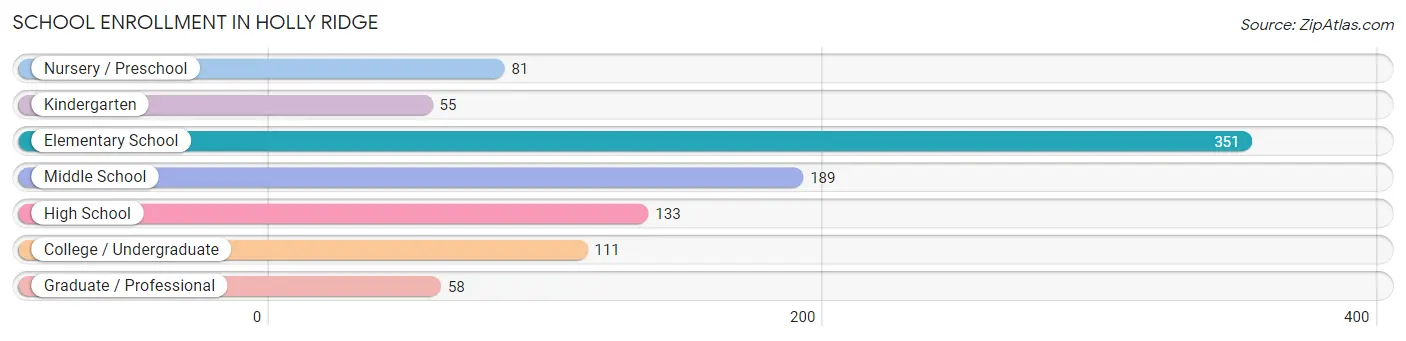
School Enrollment in Holly Ridge
The most common levels of schooling among the 978 students in Holly Ridge are elementary school (351 | 35.9%), middle school (189 | 19.3%), and high school (133 | 13.6%).
| School Level | # Students | % Students |
| Nursery / Preschool | 81 | 8.3% |
| Kindergarten | 55 | 5.6% |
| Elementary School | 351 | 35.9% |
| Middle School | 189 | 19.3% |
| High School | 133 | 13.6% |
| College / Undergraduate | 111 | 11.4% |
| Graduate / Professional | 58 | 5.9% |
| Total | 978 | 100.0% |
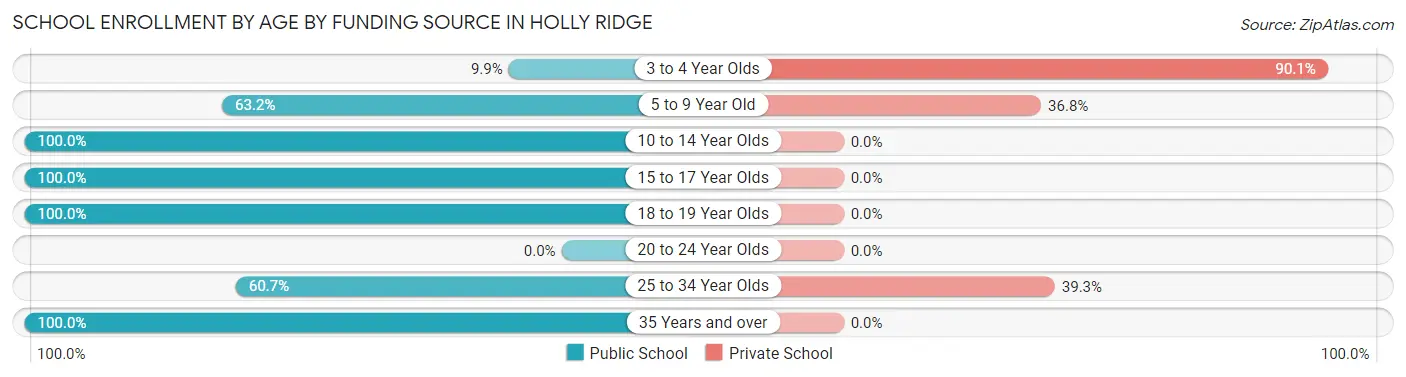
School Enrollment by Age by Funding Source in Holly Ridge
Out of a total of 978 students who are enrolled in schools in Holly Ridge, 241 (24.6%) attend a private institution, while the remaining 737 (75.4%) are enrolled in public schools. The age group of 3 to 4 year olds has the highest likelihood of being enrolled in private schools, with 64 (90.1% in the age bracket) enrolled. Conversely, the age group of 10 to 14 year olds has the lowest likelihood of being enrolled in a private school, with 189 (100.0% in the age bracket) attending a public institution.
| Age Bracket | Public School | Private School |
| 3 to 4 Year Olds | 7 (9.9%) | 64 (90.1%) |
| 5 to 9 Year Old | 263 (63.2%) | 153 (36.8%) |
| 10 to 14 Year Olds | 189 (100.0%) | 0 (0.0%) |
| 15 to 17 Year Olds | 130 (100.0%) | 0 (0.0%) |
| 18 to 19 Year Olds | 3 (100.0%) | 0 (0.0%) |
| 20 to 24 Year Olds | 0 (0.0%) | 0 (0.0%) |
| 25 to 34 Year Olds | 37 (60.7%) | 24 (39.3%) |
| 35 Years and over | 108 (100.0%) | 0 (0.0%) |
| Total | 737 (75.4%) | 241 (24.6%) |
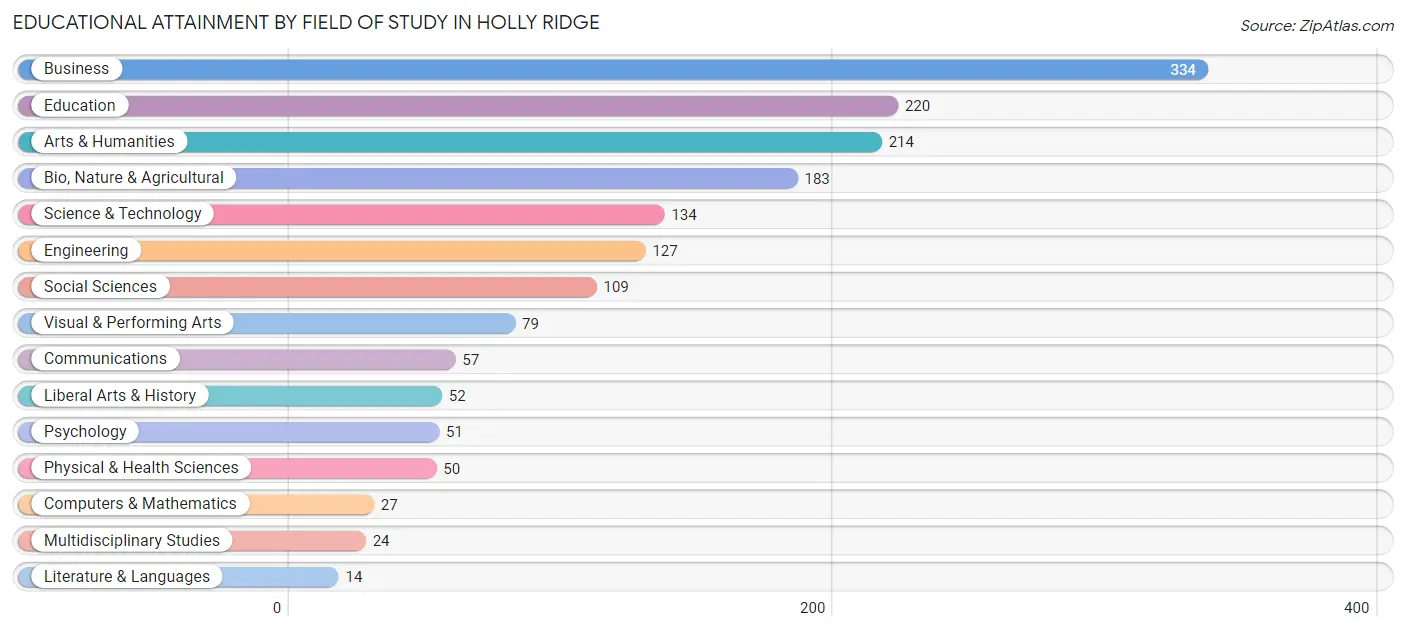
Educational Attainment by Field of Study in Holly Ridge
Business (334 | 19.9%), education (220 | 13.1%), arts & humanities (214 | 12.8%), bio, nature & agricultural (183 | 10.9%), and science & technology (134 | 8.0%) are the most common fields of study among 1,675 individuals in Holly Ridge who have obtained a bachelor's degree or higher.
| Field of Study | # Graduates | % Graduates |
| Computers & Mathematics | 27 | 1.6% |
| Bio, Nature & Agricultural | 183 | 10.9% |
| Physical & Health Sciences | 50 | 3.0% |
| Psychology | 51 | 3.0% |
| Social Sciences | 109 | 6.5% |
| Engineering | 127 | 7.6% |
| Multidisciplinary Studies | 24 | 1.4% |
| Science & Technology | 134 | 8.0% |
| Business | 334 | 19.9% |
| Education | 220 | 13.1% |
| Literature & Languages | 14 | 0.8% |
| Liberal Arts & History | 52 | 3.1% |
| Visual & Performing Arts | 79 | 4.7% |
| Communications | 57 | 3.4% |
| Arts & Humanities | 214 | 12.8% |
| Total | 1,675 | 100.0% |
Transportation & Commute in Holly Ridge
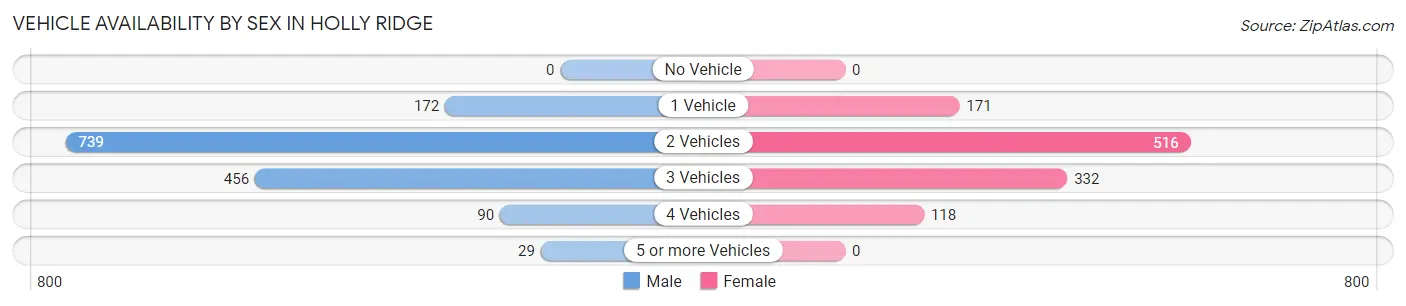
Vehicle Availability by Sex in Holly Ridge
The most prevalent vehicle ownership categories in Holly Ridge are males with 2 vehicles (739, accounting for 49.7%) and females with 2 vehicles (516, making up 65.0%).
| Vehicles Available | Male | Female |
| No Vehicle | 0 (0.0%) | 0 (0.0%) |
| 1 Vehicle | 172 (11.6%) | 171 (15.0%) |
| 2 Vehicles | 739 (49.7%) | 516 (45.4%) |
| 3 Vehicles | 456 (30.7%) | 332 (29.2%) |
| 4 Vehicles | 90 (6.1%) | 118 (10.4%) |
| 5 or more Vehicles | 29 (1.9%) | 0 (0.0%) |
| Total | 1,486 (100.0%) | 1,137 (100.0%) |
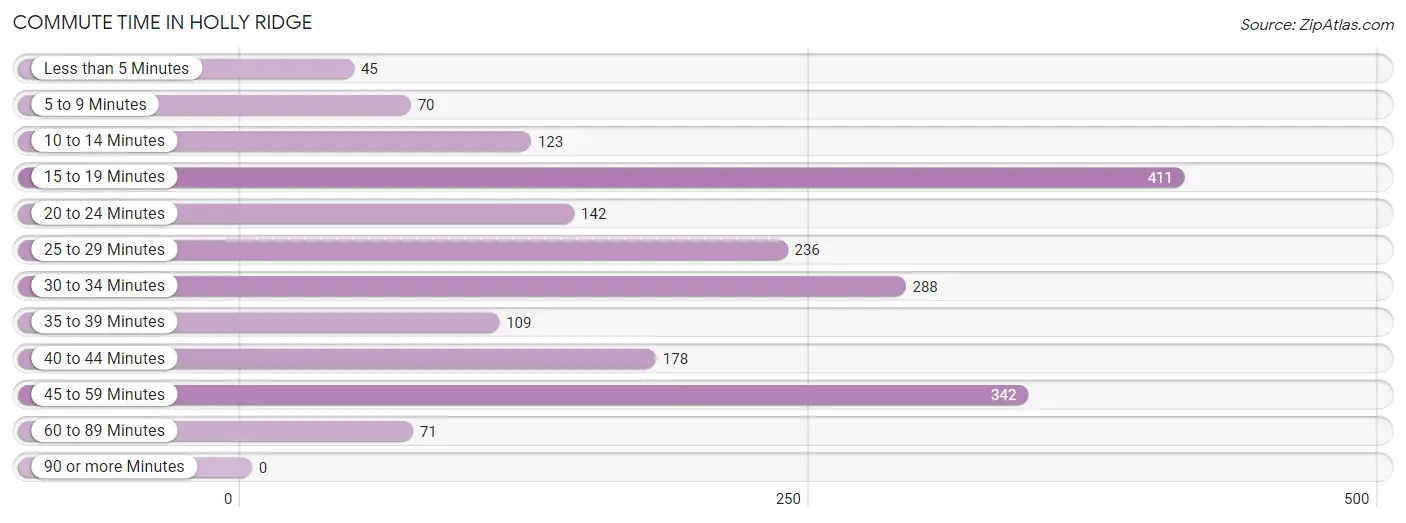
Commute Time in Holly Ridge
The most frequently occuring commute durations in Holly Ridge are 15 to 19 minutes (411 commuters, 20.4%), 45 to 59 minutes (342 commuters, 17.0%), and 30 to 34 minutes (288 commuters, 14.3%).
| Commute Time | # Commuters | % Commuters |
| Less than 5 Minutes | 45 | 2.2% |
| 5 to 9 Minutes | 70 | 3.5% |
| 10 to 14 Minutes | 123 | 6.1% |
| 15 to 19 Minutes | 411 | 20.4% |
| 20 to 24 Minutes | 142 | 7.0% |
| 25 to 29 Minutes | 236 | 11.7% |
| 30 to 34 Minutes | 288 | 14.3% |
| 35 to 39 Minutes | 109 | 5.4% |
| 40 to 44 Minutes | 178 | 8.8% |
| 45 to 59 Minutes | 342 | 17.0% |
| 60 to 89 Minutes | 71 | 3.5% |
| 90 or more Minutes | 0 | 0.0% |
Commute Time by Sex in Holly Ridge
The most common commute times in Holly Ridge are 45 to 59 minutes (287 commuters, 22.9%) for males and 15 to 19 minutes (193 commuters, 25.3%) for females.
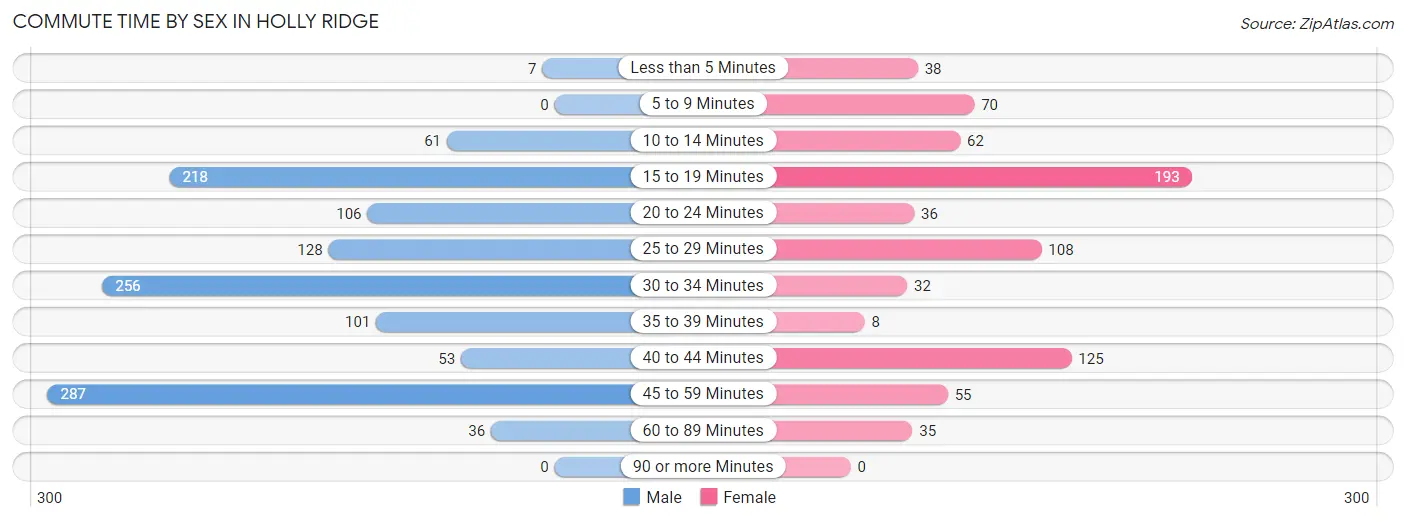
| Commute Time | Male | Female |
| Less than 5 Minutes | 7 (0.6%) | 38 (5.0%) |
| 5 to 9 Minutes | 0 (0.0%) | 70 (9.2%) |
| 10 to 14 Minutes | 61 (4.9%) | 62 (8.1%) |
| 15 to 19 Minutes | 218 (17.4%) | 193 (25.3%) |
| 20 to 24 Minutes | 106 (8.5%) | 36 (4.7%) |
| 25 to 29 Minutes | 128 (10.2%) | 108 (14.2%) |
| 30 to 34 Minutes | 256 (20.4%) | 32 (4.2%) |
| 35 to 39 Minutes | 101 (8.1%) | 8 (1.1%) |
| 40 to 44 Minutes | 53 (4.2%) | 125 (16.4%) |
| 45 to 59 Minutes | 287 (22.9%) | 55 (7.2%) |
| 60 to 89 Minutes | 36 (2.9%) | 35 (4.6%) |
| 90 or more Minutes | 0 (0.0%) | 0 (0.0%) |
Time of Departure to Work by Sex in Holly Ridge
The most frequent times of departure to work in Holly Ridge are 7:00 AM to 7:29 AM (339, 27.1%) for males and 7:00 AM to 7:29 AM (131, 17.2%) for females.
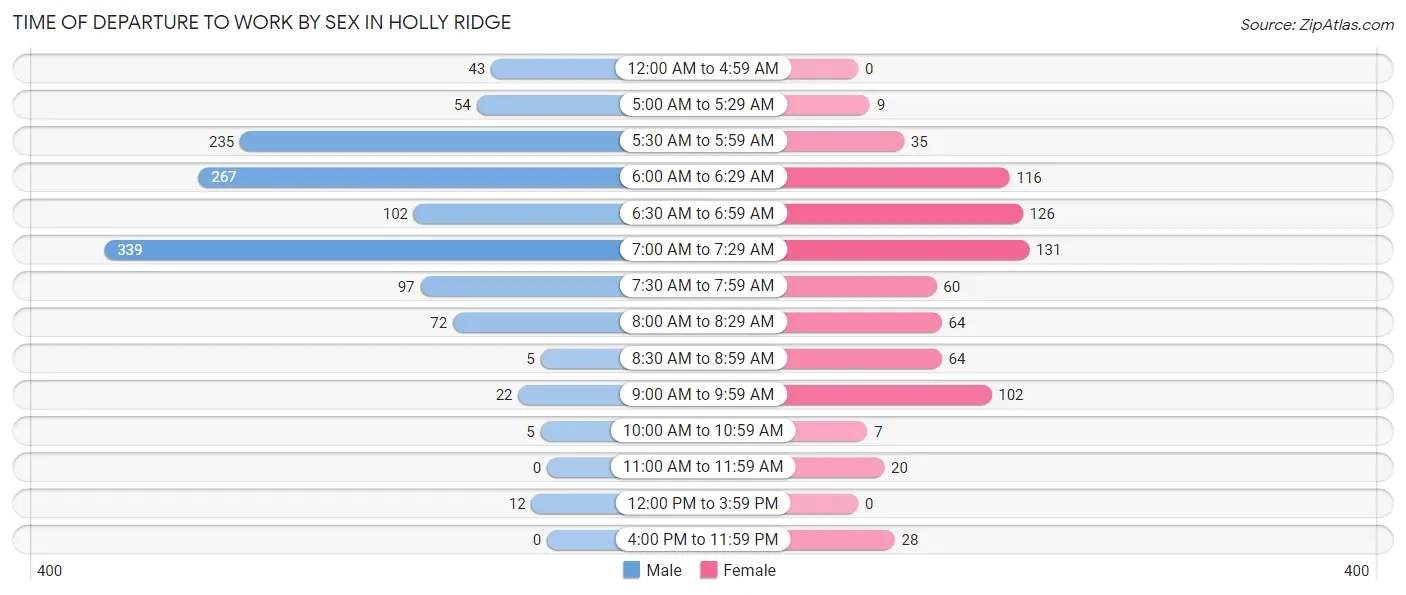
| Time of Departure | Male | Female |
| 12:00 AM to 4:59 AM | 43 (3.4%) | 0 (0.0%) |
| 5:00 AM to 5:29 AM | 54 (4.3%) | 9 (1.2%) |
| 5:30 AM to 5:59 AM | 235 (18.8%) | 35 (4.6%) |
| 6:00 AM to 6:29 AM | 267 (21.3%) | 116 (15.2%) |
| 6:30 AM to 6:59 AM | 102 (8.1%) | 126 (16.5%) |
| 7:00 AM to 7:29 AM | 339 (27.1%) | 131 (17.2%) |
| 7:30 AM to 7:59 AM | 97 (7.7%) | 60 (7.9%) |
| 8:00 AM to 8:29 AM | 72 (5.8%) | 64 (8.4%) |
| 8:30 AM to 8:59 AM | 5 (0.4%) | 64 (8.4%) |
| 9:00 AM to 9:59 AM | 22 (1.8%) | 102 (13.4%) |
| 10:00 AM to 10:59 AM | 5 (0.4%) | 7 (0.9%) |
| 11:00 AM to 11:59 AM | 0 (0.0%) | 20 (2.6%) |
| 12:00 PM to 3:59 PM | 12 (1.0%) | 0 (0.0%) |
| 4:00 PM to 11:59 PM | 0 (0.0%) | 28 (3.7%) |
| Total | 1,253 (100.0%) | 762 (100.0%) |
Housing Occupancy in Holly Ridge
Occupancy by Ownership in Holly Ridge
Of the total 1,583 dwellings in Holly Ridge, owner-occupied units account for 1,238 (78.2%), while renter-occupied units make up 345 (21.8%).
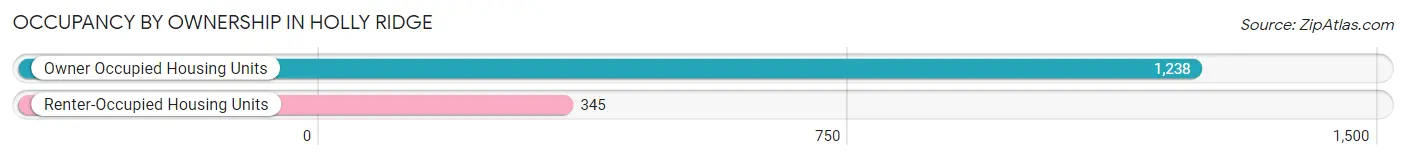
| Occupancy | # Housing Units | % Housing Units |
| Owner Occupied Housing Units | 1,238 | 78.2% |
| Renter-Occupied Housing Units | 345 | 21.8% |
| Total Occupied Housing Units | 1,583 | 100.0% |
Occupancy by Household Size in Holly Ridge
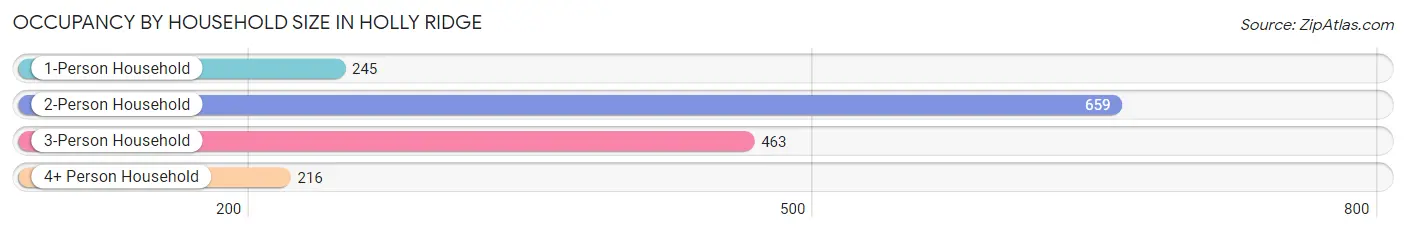
| Household Size | # Housing Units | % Housing Units |
| 1-Person Household | 245 | 15.5% |
| 2-Person Household | 659 | 41.6% |
| 3-Person Household | 463 | 29.2% |
| 4+ Person Household | 216 | 13.6% |
| Total Housing Units | 1,583 | 100.0% |
Occupancy by Ownership by Household Size in Holly Ridge
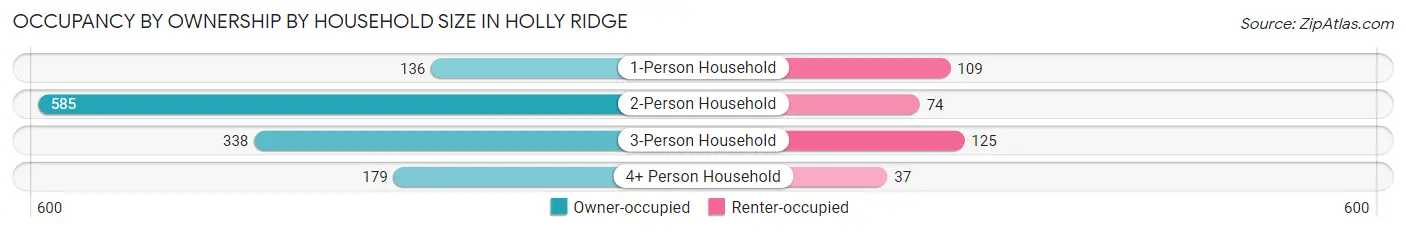
| Household Size | Owner-occupied | Renter-occupied |
| 1-Person Household | 136 (55.5%) | 109 (44.5%) |
| 2-Person Household | 585 (88.8%) | 74 (11.2%) |
| 3-Person Household | 338 (73.0%) | 125 (27.0%) |
| 4+ Person Household | 179 (82.9%) | 37 (17.1%) |
| Total Housing Units | 1,238 (78.2%) | 345 (21.8%) |
Occupancy by Educational Attainment in Holly Ridge
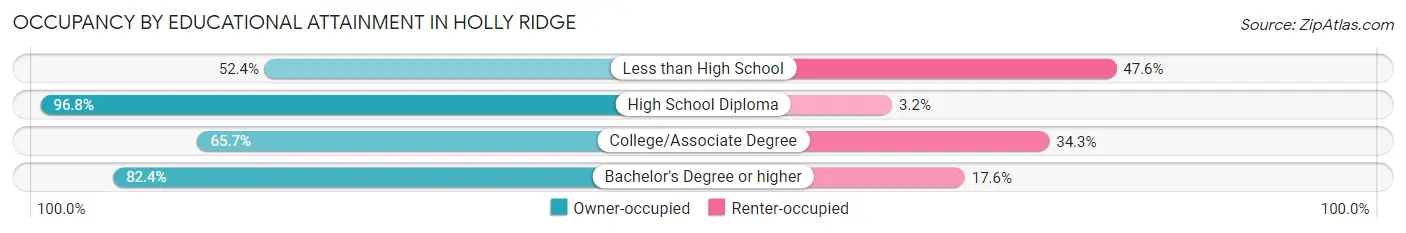
| Household Size | Owner-occupied | Renter-occupied |
| Less than High School | 55 (52.4%) | 50 (47.6%) |
| High School Diploma | 183 (96.8%) | 6 (3.2%) |
| College/Associate Degree | 245 (65.7%) | 128 (34.3%) |
| Bachelor's Degree or higher | 755 (82.4%) | 161 (17.6%) |
Occupancy by Age of Householder in Holly Ridge
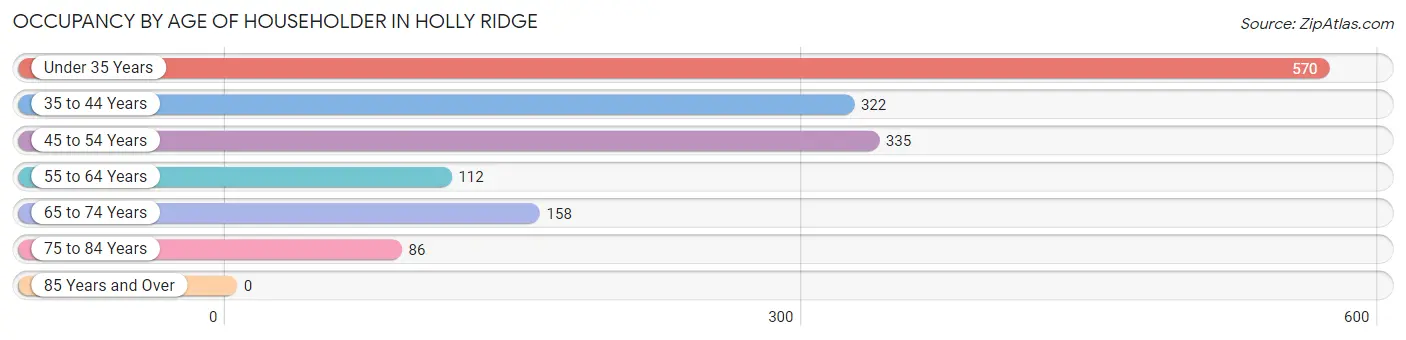
| Age Bracket | # Households | % Households |
| Under 35 Years | 570 | 36.0% |
| 35 to 44 Years | 322 | 20.3% |
| 45 to 54 Years | 335 | 21.2% |
| 55 to 64 Years | 112 | 7.1% |
| 65 to 74 Years | 158 | 10.0% |
| 75 to 84 Years | 86 | 5.4% |
| 85 Years and Over | 0 | 0.0% |
| Total | 1,583 | 100.0% |
Housing Finances in Holly Ridge
Median Income by Occupancy in Holly Ridge
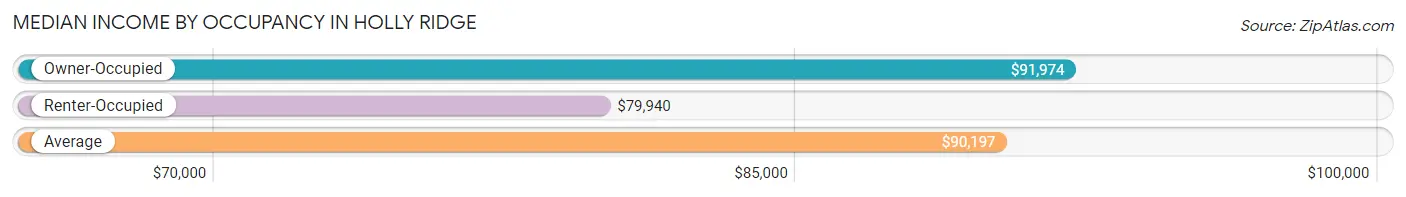
| Occupancy Type | # Households | Median Income |
| Owner-Occupied | 1,238 (78.2%) | $91,974 |
| Renter-Occupied | 345 (21.8%) | $79,940 |
| Average | 1,583 (100.0%) | $90,197 |
Occupancy by Householder Income Bracket in Holly Ridge
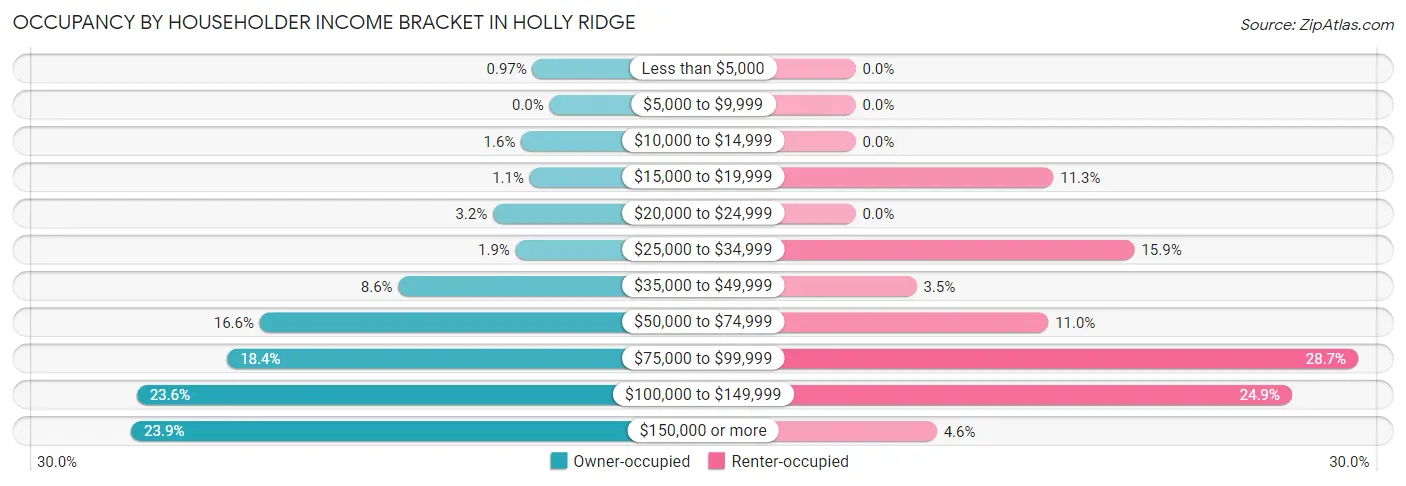
| Income Bracket | Owner-occupied | Renter-occupied |
| Less than $5,000 | 12 (1.0%) | 0 (0.0%) |
| $5,000 to $9,999 | 0 (0.0%) | 0 (0.0%) |
| $10,000 to $14,999 | 20 (1.6%) | 0 (0.0%) |
| $15,000 to $19,999 | 14 (1.1%) | 39 (11.3%) |
| $20,000 to $24,999 | 40 (3.2%) | 0 (0.0%) |
| $25,000 to $34,999 | 24 (1.9%) | 55 (15.9%) |
| $35,000 to $49,999 | 107 (8.6%) | 12 (3.5%) |
| $50,000 to $74,999 | 205 (16.6%) | 38 (11.0%) |
| $75,000 to $99,999 | 228 (18.4%) | 99 (28.7%) |
| $100,000 to $149,999 | 292 (23.6%) | 86 (24.9%) |
| $150,000 or more | 296 (23.9%) | 16 (4.6%) |
| Total | 1,238 (100.0%) | 345 (100.0%) |
Monthly Housing Cost Tiers in Holly Ridge
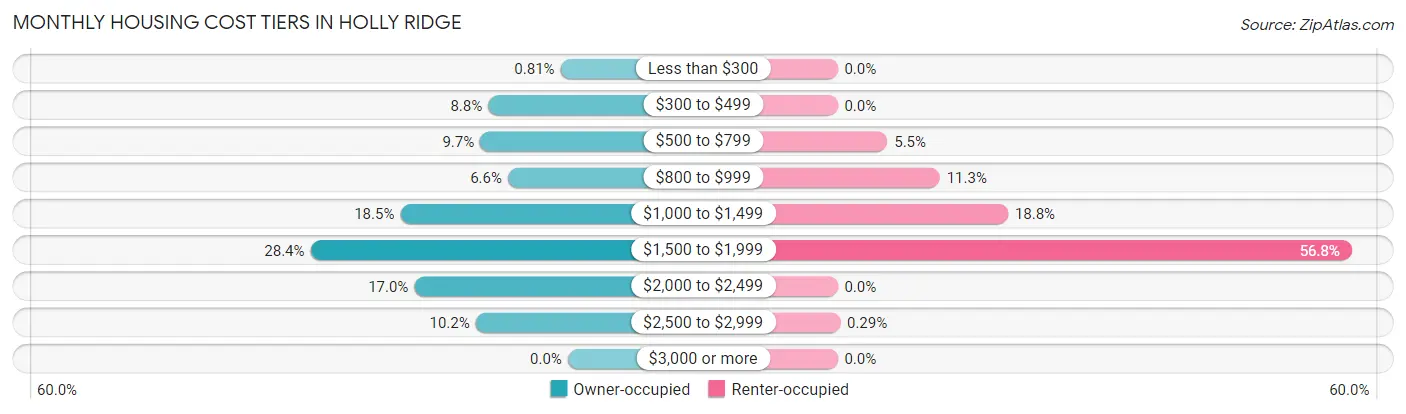
| Monthly Cost | Owner-occupied | Renter-occupied |
| Less than $300 | 10 (0.8%) | 0 (0.0%) |
| $300 to $499 | 109 (8.8%) | 0 (0.0%) |
| $500 to $799 | 120 (9.7%) | 19 (5.5%) |
| $800 to $999 | 82 (6.6%) | 39 (11.3%) |
| $1,000 to $1,499 | 229 (18.5%) | 65 (18.8%) |
| $1,500 to $1,999 | 352 (28.4%) | 196 (56.8%) |
| $2,000 to $2,499 | 210 (17.0%) | 0 (0.0%) |
| $2,500 to $2,999 | 126 (10.2%) | 1 (0.3%) |
| $3,000 or more | 0 (0.0%) | 0 (0.0%) |
| Total | 1,238 (100.0%) | 345 (100.0%) |
Physical Housing Characteristics in Holly Ridge
Housing Structures in Holly Ridge
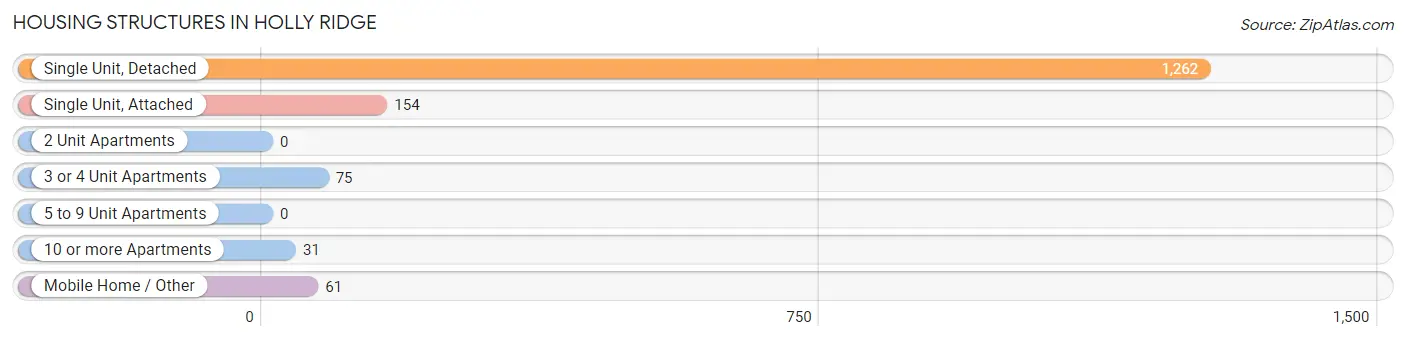
| Structure Type | # Housing Units | % Housing Units |
| Single Unit, Detached | 1,262 | 79.7% |
| Single Unit, Attached | 154 | 9.7% |
| 2 Unit Apartments | 0 | 0.0% |
| 3 or 4 Unit Apartments | 75 | 4.7% |
| 5 to 9 Unit Apartments | 0 | 0.0% |
| 10 or more Apartments | 31 | 2.0% |
| Mobile Home / Other | 61 | 3.8% |
| Total | 1,583 | 100.0% |
Housing Structures by Occupancy in Holly Ridge
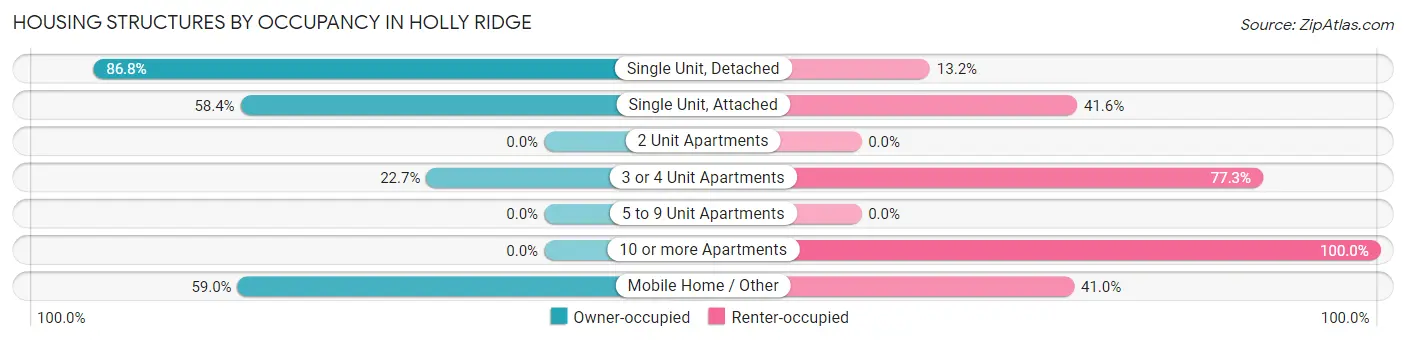
| Structure Type | Owner-occupied | Renter-occupied |
| Single Unit, Detached | 1,095 (86.8%) | 167 (13.2%) |
| Single Unit, Attached | 90 (58.4%) | 64 (41.6%) |
| 2 Unit Apartments | 0 (0.0%) | 0 (0.0%) |
| 3 or 4 Unit Apartments | 17 (22.7%) | 58 (77.3%) |
| 5 to 9 Unit Apartments | 0 (0.0%) | 0 (0.0%) |
| 10 or more Apartments | 0 (0.0%) | 31 (100.0%) |
| Mobile Home / Other | 36 (59.0%) | 25 (41.0%) |
| Total | 1,238 (78.2%) | 345 (21.8%) |
Housing Structures by Number of Rooms in Holly Ridge
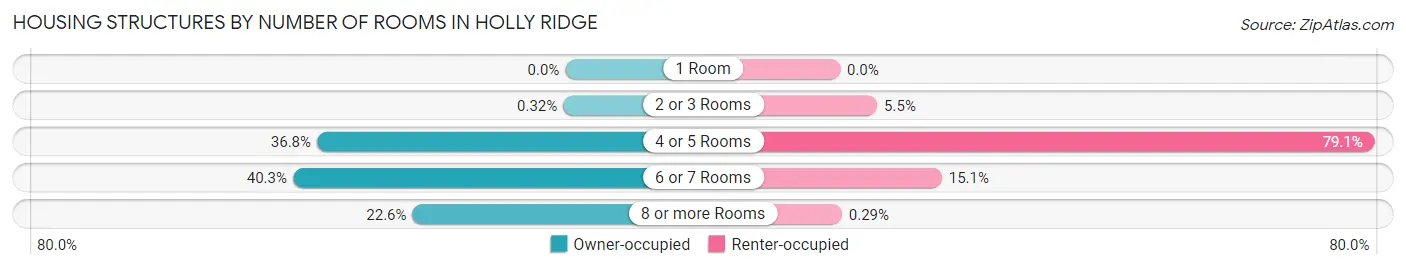
| Number of Rooms | Owner-occupied | Renter-occupied |
| 1 Room | 0 (0.0%) | 0 (0.0%) |
| 2 or 3 Rooms | 4 (0.3%) | 19 (5.5%) |
| 4 or 5 Rooms | 455 (36.7%) | 273 (79.1%) |
| 6 or 7 Rooms | 499 (40.3%) | 52 (15.1%) |
| 8 or more Rooms | 280 (22.6%) | 1 (0.3%) |
| Total | 1,238 (100.0%) | 345 (100.0%) |
Housing Structure by Heating Type in Holly Ridge
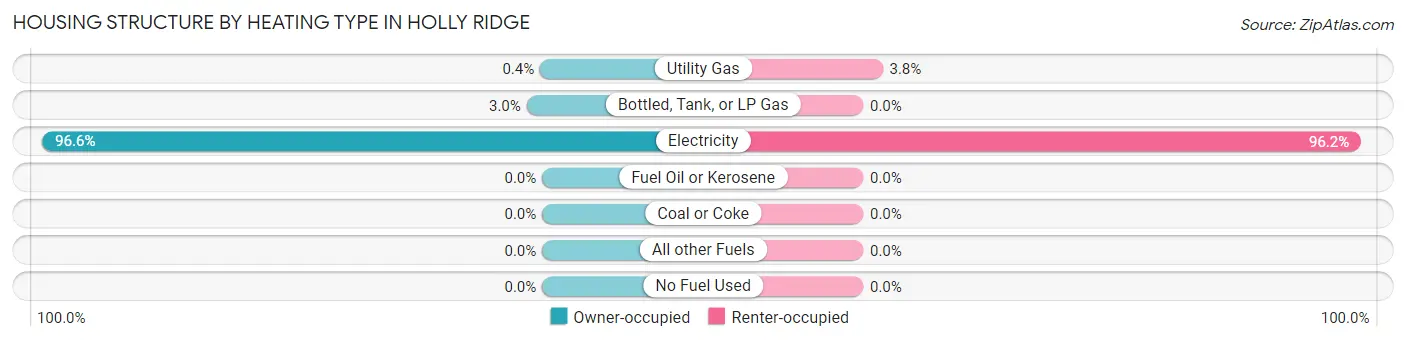
| Heating Type | Owner-occupied | Renter-occupied |
| Utility Gas | 5 (0.4%) | 13 (3.8%) |
| Bottled, Tank, or LP Gas | 37 (3.0%) | 0 (0.0%) |
| Electricity | 1,196 (96.6%) | 332 (96.2%) |
| Fuel Oil or Kerosene | 0 (0.0%) | 0 (0.0%) |
| Coal or Coke | 0 (0.0%) | 0 (0.0%) |
| All other Fuels | 0 (0.0%) | 0 (0.0%) |
| No Fuel Used | 0 (0.0%) | 0 (0.0%) |
| Total | 1,238 (100.0%) | 345 (100.0%) |
Household Vehicle Usage in Holly Ridge
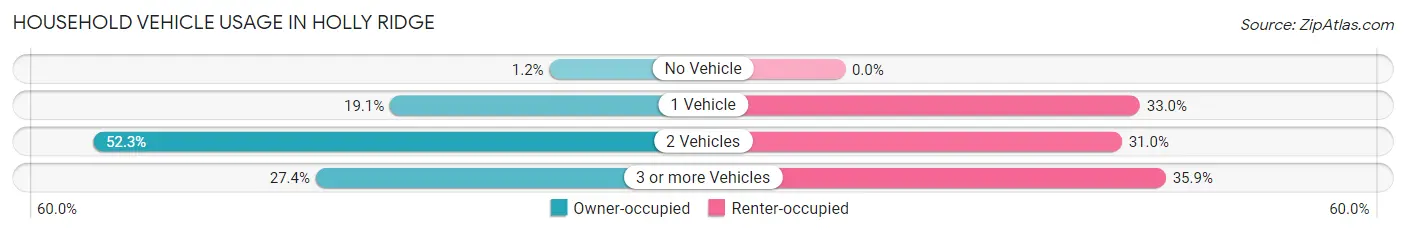
| Vehicles per Household | Owner-occupied | Renter-occupied |
| No Vehicle | 15 (1.2%) | 0 (0.0%) |
| 1 Vehicle | 236 (19.1%) | 114 (33.0%) |
| 2 Vehicles | 648 (52.3%) | 107 (31.0%) |
| 3 or more Vehicles | 339 (27.4%) | 124 (35.9%) |
| Total | 1,238 (100.0%) | 345 (100.0%) |
Real Estate & Mortgages in Holly Ridge
Real Estate and Mortgage Overview in Holly Ridge
| Characteristic | Without Mortgage | With Mortgage |
| Housing Units | 275 | 963 |
| Median Property Value | $229,300 | $275,900 |
| Median Household Income | - | - |
| Monthly Housing Costs | $539 | $0 |
| Real Estate Taxes | $1,867 | $0 |
Property Value by Mortgage Status in Holly Ridge
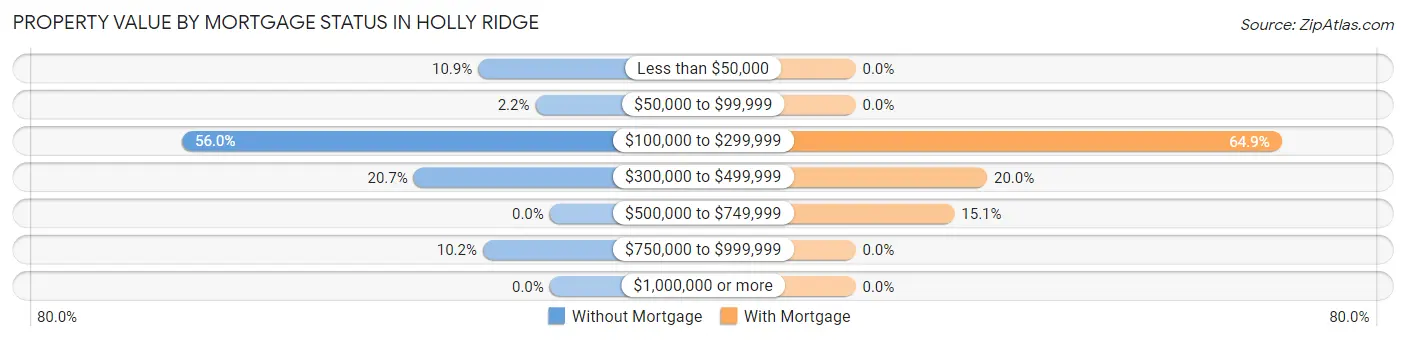
| Property Value | Without Mortgage | With Mortgage |
| Less than $50,000 | 30 (10.9%) | 0 (0.0%) |
| $50,000 to $99,999 | 6 (2.2%) | 0 (0.0%) |
| $100,000 to $299,999 | 154 (56.0%) | 625 (64.9%) |
| $300,000 to $499,999 | 57 (20.7%) | 193 (20.0%) |
| $500,000 to $749,999 | 0 (0.0%) | 145 (15.1%) |
| $750,000 to $999,999 | 28 (10.2%) | 0 (0.0%) |
| $1,000,000 or more | 0 (0.0%) | 0 (0.0%) |
| Total | 275 (100.0%) | 963 (100.0%) |
Household Income by Mortgage Status in Holly Ridge
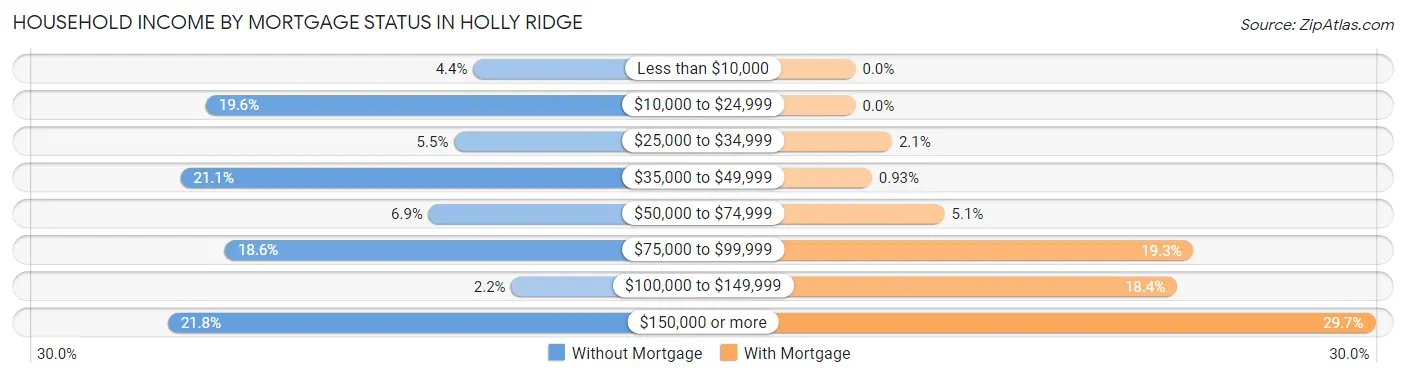
| Household Income | Without Mortgage | With Mortgage |
| Less than $10,000 | 12 (4.4%) | 0 (0.0%) |
| $10,000 to $24,999 | 54 (19.6%) | 0 (0.0%) |
| $25,000 to $34,999 | 15 (5.4%) | 20 (2.1%) |
| $35,000 to $49,999 | 58 (21.1%) | 9 (0.9%) |
| $50,000 to $74,999 | 19 (6.9%) | 49 (5.1%) |
| $75,000 to $99,999 | 51 (18.5%) | 186 (19.3%) |
| $100,000 to $149,999 | 6 (2.2%) | 177 (18.4%) |
| $150,000 or more | 60 (21.8%) | 286 (29.7%) |
| Total | 275 (100.0%) | 963 (100.0%) |
Property Value to Household Income Ratio in Holly Ridge
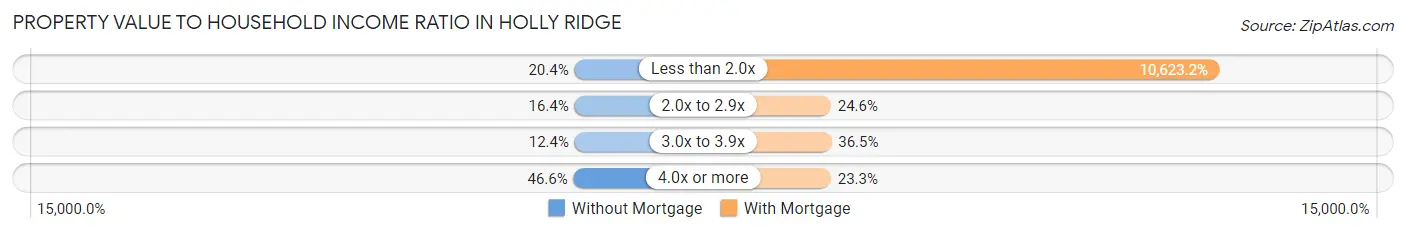
| Value-to-Income Ratio | Without Mortgage | With Mortgage |
| Less than 2.0x | 56 (20.4%) | 102,301 (10,623.2%) |
| 2.0x to 2.9x | 45 (16.4%) | 237 (24.6%) |
| 3.0x to 3.9x | 34 (12.4%) | 351 (36.4%) |
| 4.0x or more | 128 (46.6%) | 224 (23.3%) |
| Total | 275 (100.0%) | 963 (100.0%) |
Real Estate Taxes by Mortgage Status in Holly Ridge
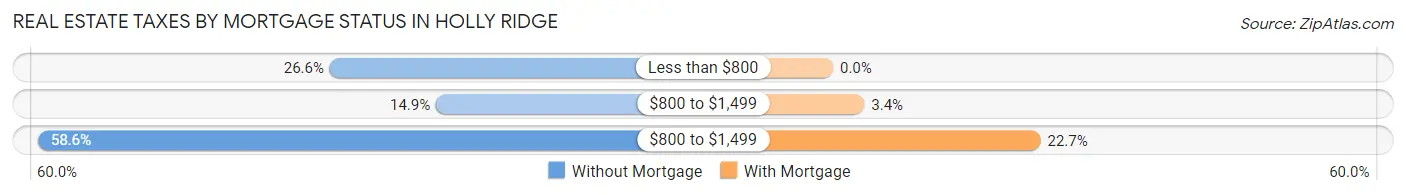
| Property Taxes | Without Mortgage | With Mortgage |
| Less than $800 | 73 (26.6%) | 0 (0.0%) |
| $800 to $1,499 | 41 (14.9%) | 33 (3.4%) |
| $800 to $1,499 | 161 (58.6%) | 219 (22.7%) |
| Total | 275 (100.0%) | 963 (100.0%) |
Health & Disability in Holly Ridge
Health Insurance Coverage by Age in Holly Ridge
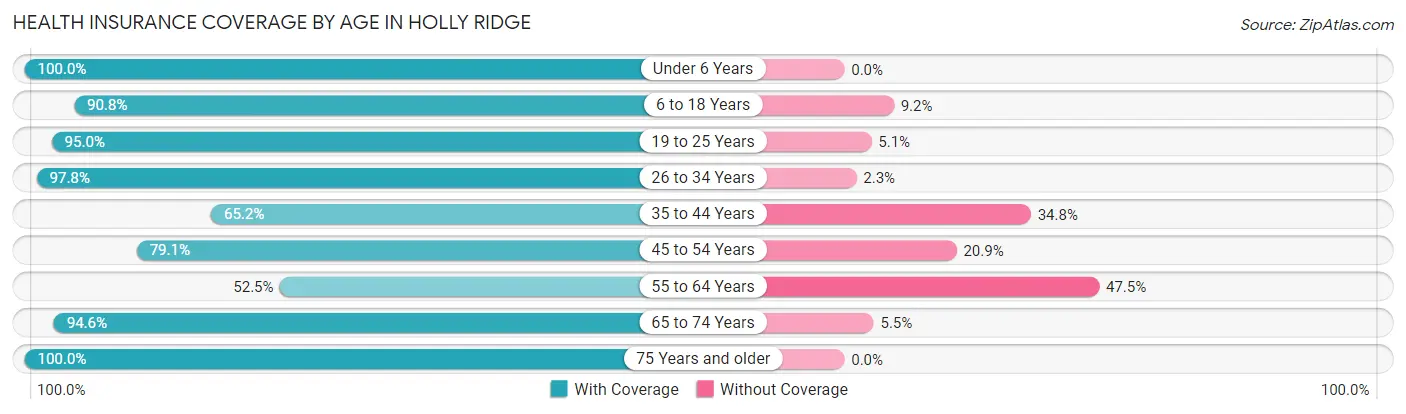
| Age Bracket | With Coverage | Without Coverage |
| Under 6 Years | 340 (100.0%) | 0 (0.0%) |
| 6 to 18 Years | 650 (90.8%) | 66 (9.2%) |
| 19 to 25 Years | 94 (95.0%) | 5 (5.1%) |
| 26 to 34 Years | 738 (97.8%) | 17 (2.2%) |
| 35 to 44 Years | 439 (65.2%) | 234 (34.8%) |
| 45 to 54 Years | 363 (79.1%) | 96 (20.9%) |
| 55 to 64 Years | 211 (52.5%) | 191 (47.5%) |
| 65 to 74 Years | 243 (94.6%) | 14 (5.4%) |
| 75 Years and older | 106 (100.0%) | 0 (0.0%) |
| Total | 3,184 (83.6%) | 623 (16.4%) |
Health Insurance Coverage by Citizenship Status in Holly Ridge
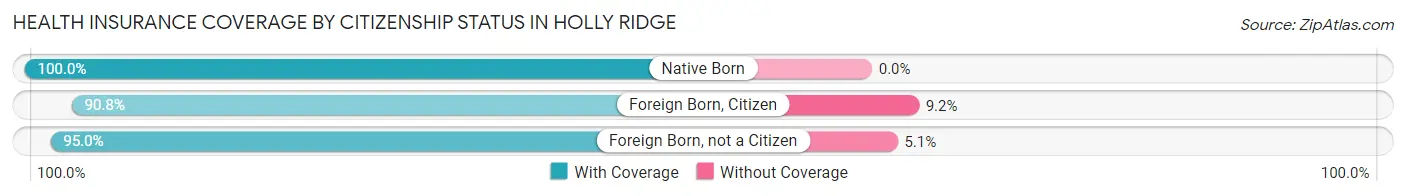
| Citizenship Status | With Coverage | Without Coverage |
| Native Born | 340 (100.0%) | 0 (0.0%) |
| Foreign Born, Citizen | 650 (90.8%) | 66 (9.2%) |
| Foreign Born, not a Citizen | 94 (95.0%) | 5 (5.1%) |
Health Insurance Coverage by Household Income in Holly Ridge
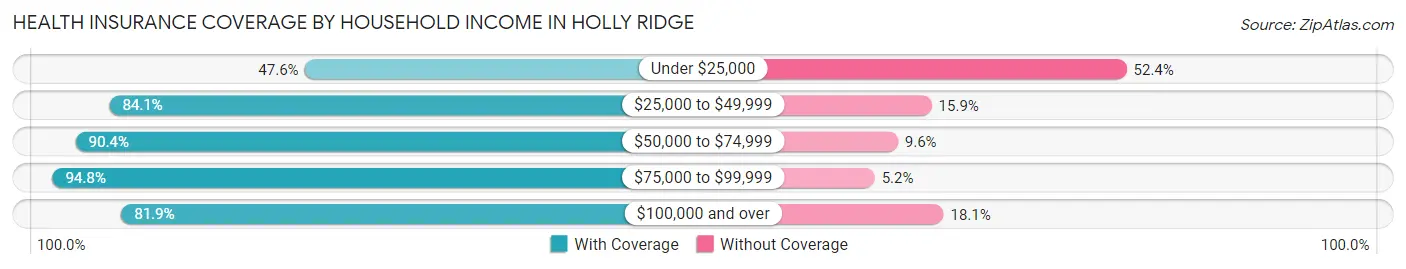
| Household Income | With Coverage | Without Coverage |
| Under $25,000 | 157 (47.6%) | 173 (52.4%) |
| $25,000 to $49,999 | 365 (84.1%) | 69 (15.9%) |
| $50,000 to $74,999 | 473 (90.4%) | 50 (9.6%) |
| $75,000 to $99,999 | 925 (94.8%) | 51 (5.2%) |
| $100,000 and over | 1,264 (81.9%) | 280 (18.1%) |
Public vs Private Health Insurance Coverage by Age in Holly Ridge
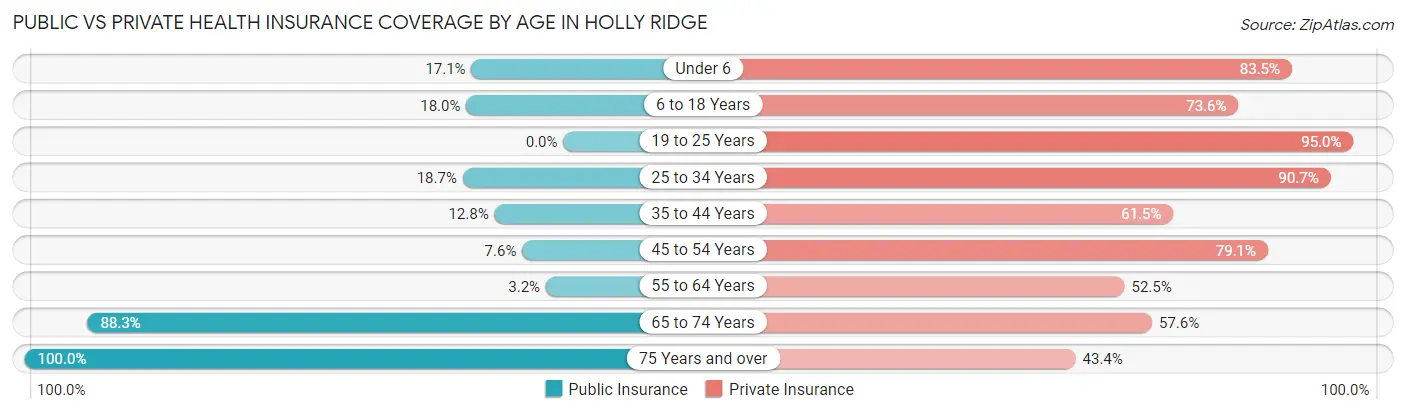
| Age Bracket | Public Insurance | Private Insurance |
| Under 6 | 58 (17.1%) | 284 (83.5%) |
| 6 to 18 Years | 129 (18.0%) | 527 (73.6%) |
| 19 to 25 Years | 0 (0.0%) | 94 (95.0%) |
| 25 to 34 Years | 141 (18.7%) | 685 (90.7%) |
| 35 to 44 Years | 86 (12.8%) | 414 (61.5%) |
| 45 to 54 Years | 35 (7.6%) | 363 (79.1%) |
| 55 to 64 Years | 13 (3.2%) | 211 (52.5%) |
| 65 to 74 Years | 227 (88.3%) | 148 (57.6%) |
| 75 Years and over | 106 (100.0%) | 46 (43.4%) |
| Total | 795 (20.9%) | 2,772 (72.8%) |
Disability Status by Sex by Age in Holly Ridge
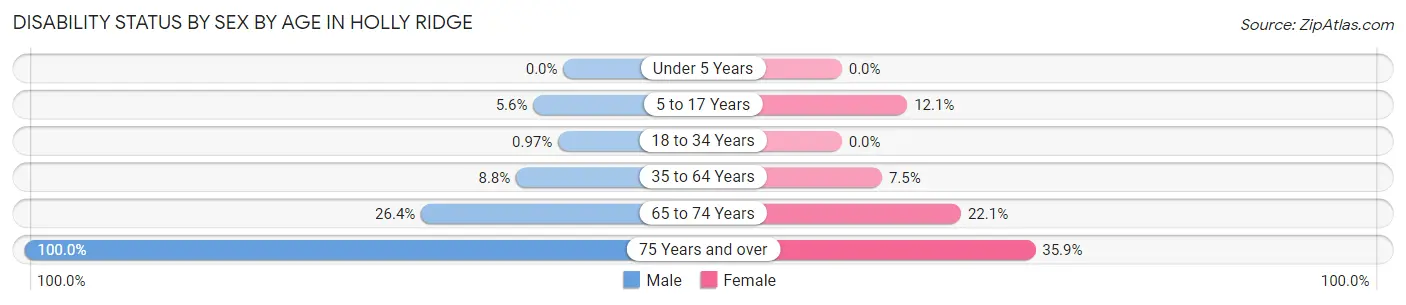
| Age Bracket | Male | Female |
| Under 5 Years | 0 (0.0%) | 0 (0.0%) |
| 5 to 17 Years | 22 (5.6%) | 42 (12.1%) |
| 18 to 34 Years | 3 (1.0%) | 0 (0.0%) |
| 35 to 64 Years | 64 (8.8%) | 60 (7.5%) |
| 65 to 74 Years | 38 (26.4%) | 25 (22.1%) |
| 75 Years and over | 3 (100.0%) | 37 (35.9%) |
Disability Class by Sex by Age in Holly Ridge
Disability Class: Hearing Difficulty
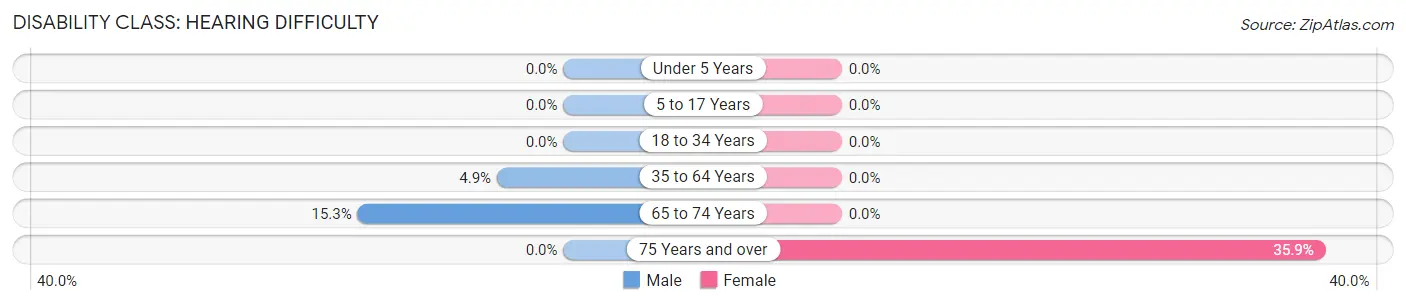
| Age Bracket | Male | Female |
| Under 5 Years | 0 (0.0%) | 0 (0.0%) |
| 5 to 17 Years | 0 (0.0%) | 0 (0.0%) |
| 18 to 34 Years | 0 (0.0%) | 0 (0.0%) |
| 35 to 64 Years | 36 (4.9%) | 0 (0.0%) |
| 65 to 74 Years | 22 (15.3%) | 0 (0.0%) |
| 75 Years and over | 0 (0.0%) | 37 (35.9%) |
Disability Class: Vision Difficulty
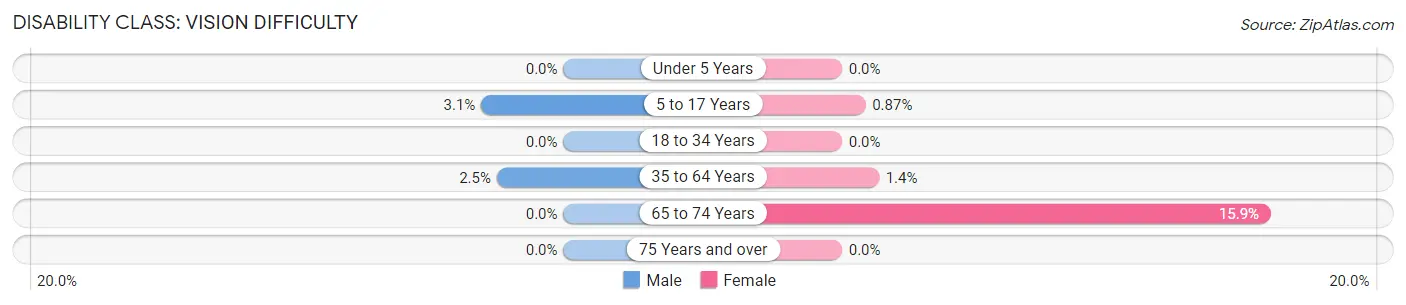
| Age Bracket | Male | Female |
| Under 5 Years | 0 (0.0%) | 0 (0.0%) |
| 5 to 17 Years | 12 (3.0%) | 3 (0.9%) |
| 18 to 34 Years | 0 (0.0%) | 0 (0.0%) |
| 35 to 64 Years | 18 (2.5%) | 11 (1.4%) |
| 65 to 74 Years | 0 (0.0%) | 18 (15.9%) |
| 75 Years and over | 0 (0.0%) | 0 (0.0%) |
Disability Class: Cognitive Difficulty
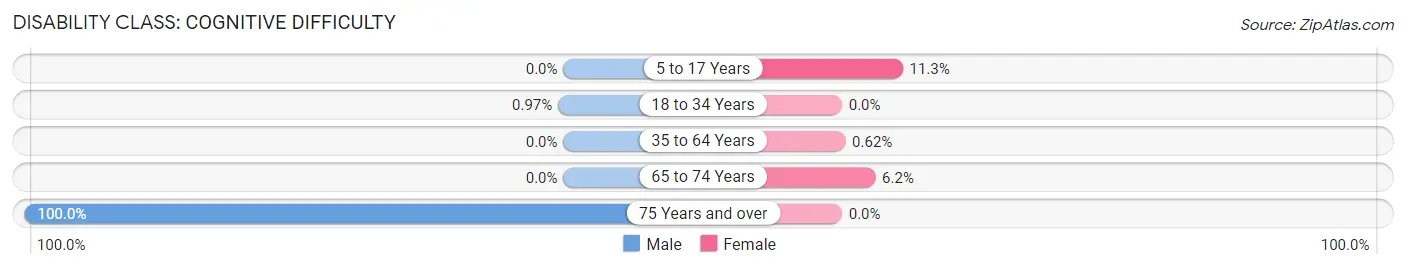
| Age Bracket | Male | Female |
| 5 to 17 Years | 0 (0.0%) | 39 (11.3%) |
| 18 to 34 Years | 3 (1.0%) | 0 (0.0%) |
| 35 to 64 Years | 0 (0.0%) | 5 (0.6%) |
| 65 to 74 Years | 0 (0.0%) | 7 (6.2%) |
| 75 Years and over | 3 (100.0%) | 0 (0.0%) |
Disability Class: Ambulatory Difficulty
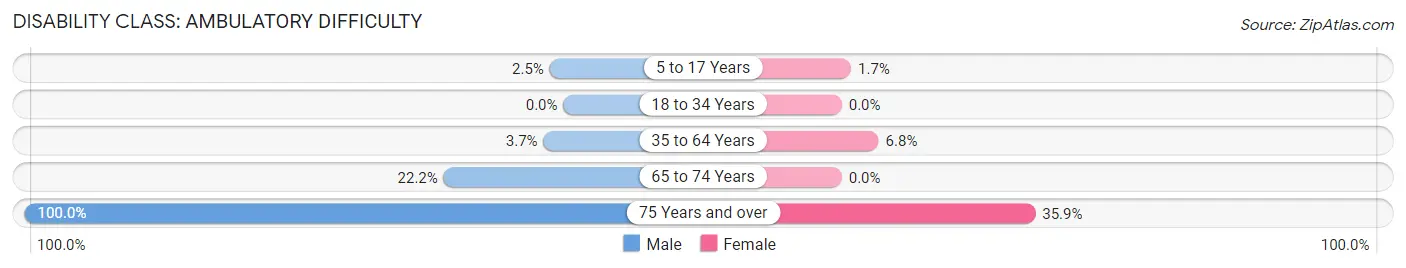
| Age Bracket | Male | Female |
| 5 to 17 Years | 10 (2.5%) | 6 (1.7%) |
| 18 to 34 Years | 0 (0.0%) | 0 (0.0%) |
| 35 to 64 Years | 27 (3.7%) | 55 (6.8%) |
| 65 to 74 Years | 32 (22.2%) | 0 (0.0%) |
| 75 Years and over | 3 (100.0%) | 37 (35.9%) |
Disability Class: Self-Care Difficulty
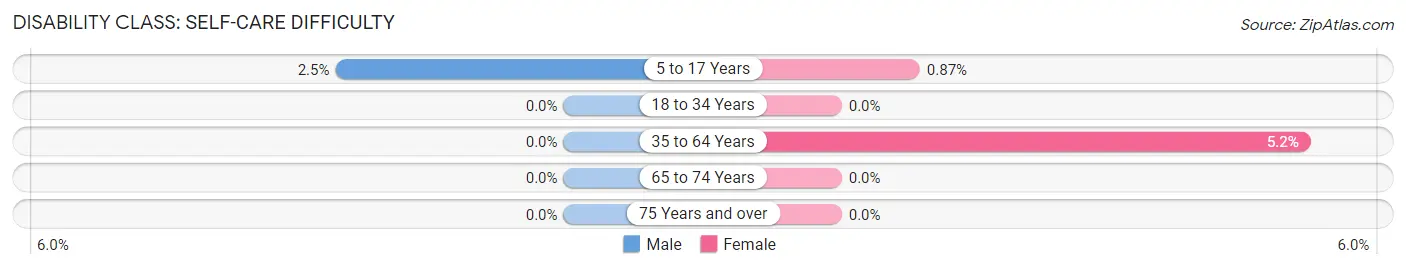
| Age Bracket | Male | Female |
| 5 to 17 Years | 10 (2.5%) | 3 (0.9%) |
| 18 to 34 Years | 0 (0.0%) | 0 (0.0%) |
| 35 to 64 Years | 0 (0.0%) | 42 (5.2%) |
| 65 to 74 Years | 0 (0.0%) | 0 (0.0%) |
| 75 Years and over | 0 (0.0%) | 0 (0.0%) |
Technology Access in Holly Ridge
Computing Device Access in Holly Ridge
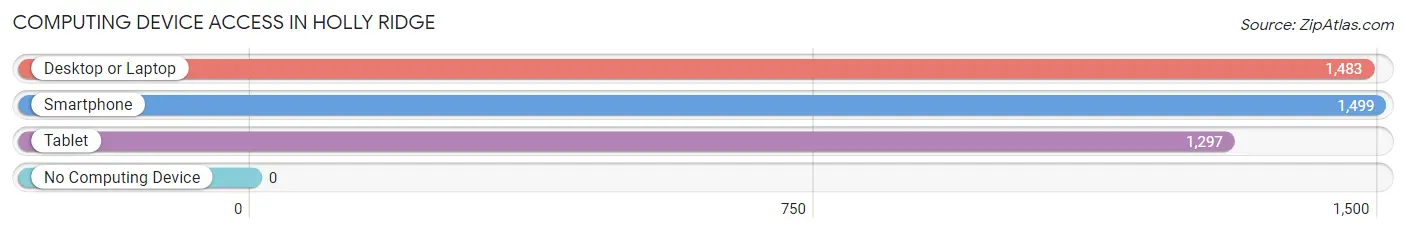
| Device Type | # Households | % Households |
| Desktop or Laptop | 1,483 | 93.7% |
| Smartphone | 1,499 | 94.7% |
| Tablet | 1,297 | 81.9% |
| No Computing Device | 0 | 0.0% |
| Total | 1,583 | 100.0% |
Internet Access in Holly Ridge
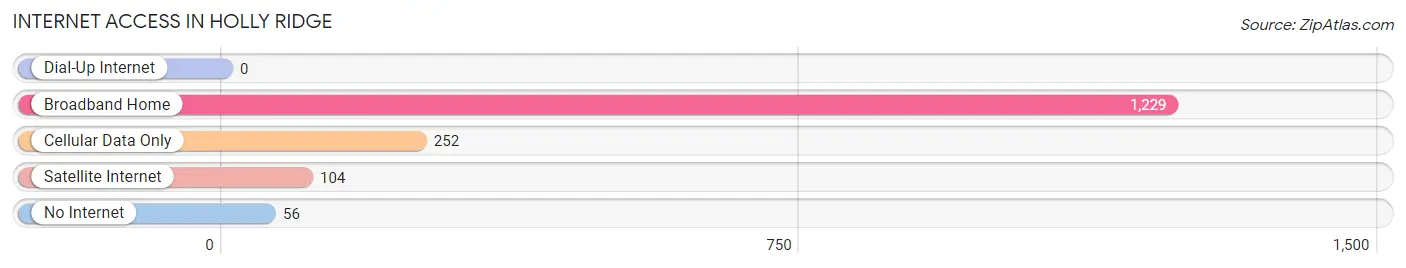
| Internet Type | # Households | % Households |
| Dial-Up Internet | 0 | 0.0% |
| Broadband Home | 1,229 | 77.6% |
| Cellular Data Only | 252 | 15.9% |
| Satellite Internet | 104 | 6.6% |
| No Internet | 56 | 3.5% |
| Total | 1,583 | 100.0% |
Holly Ridge Summary
Holly Ridge is a small town located in Onslow County, North Carolina. It is situated on the banks of the New River, approximately 25 miles north of Jacksonville. The town was founded in 1887 and has a population of approximately 2,000 people.
Geography
Holly Ridge is located in the Coastal Plain region of North Carolina. The town is situated on the banks of the New River, which is a tributary of the Neuse River. The town is surrounded by a variety of natural features, including the Croatan National Forest, the White Oak River, and the Holly Shelter Game Land. The town is also located near the Atlantic Ocean, which is approximately 25 miles away.
The town has a humid subtropical climate, with hot, humid summers and mild winters. The average annual temperature is around 70 degrees Fahrenheit, with an average high of around 90 degrees in the summer and an average low of around 50 degrees in the winter. The town receives an average of around 50 inches of precipitation per year, with most of it falling in the summer months.
Economy
Holly Ridge has a small but diverse economy. The town is home to a variety of businesses, including retail stores, restaurants, and professional services. The town is also home to a number of manufacturing companies, including a furniture factory and a boat manufacturing plant. The town is also home to a number of agricultural operations, including a dairy farm and a vegetable farm.
The town is also home to a number of military installations, including Camp Lejeune and the Marine Corps Air Station New River. These installations provide a significant economic boost to the town, as they employ a large number of people and generate a significant amount of revenue.
Demographics
As of the 2010 census, the population of Holly Ridge was 2,039. The town has a population that is predominantly white, with a small percentage of African Americans and Hispanics. The median household income in the town is around $45,000, and the median home value is around $150,000.
The town is served by the Onslow County School System, which includes two elementary schools, one middle school, and one high school. The town is also home to a number of churches, including the Holly Ridge United Methodist Church and the Holly Ridge Baptist Church.
Conclusion
Holly Ridge is a small town located in Onslow County, North Carolina. The town was founded in 1887 and has a population of approximately 2,000 people. The town is situated on the banks of the New River and is surrounded by a variety of natural features. The town has a humid subtropical climate and a small but diverse economy. The population of the town is predominantly white, with a small percentage of African Americans and Hispanics. The town is served by the Onslow County School System and is home to a number of churches.
Common Questions
What is Per Capita Income in Holly Ridge?
Per Capita income in Holly Ridge is $44,565.
What is the Median Family Income in Holly Ridge?
Median Family Income in Holly Ridge is $91,776.
What is the Median Household income in Holly Ridge?
Median Household Income in Holly Ridge is $90,197.
What is Income or Wage Gap in Holly Ridge?
Income or Wage Gap in Holly Ridge is 30.3%.
Women in Holly Ridge earn 69.7 cents for every dollar earned by a man.
What is Inequality or Gini Index in Holly Ridge?
Inequality or Gini Index in Holly Ridge is 0.39.
What is the Total Population of Holly Ridge?
Total Population of Holly Ridge is 4,236.
What is the Total Male Population of Holly Ridge?
Total Male Population of Holly Ridge is 2,162.
What is the Total Female Population of Holly Ridge?
Total Female Population of Holly Ridge is 2,074.
What is the Ratio of Males per 100 Females in Holly Ridge?
There are 104.24 Males per 100 Females in Holly Ridge.
What is the Ratio of Females per 100 Males in Holly Ridge?
There are 95.93 Females per 100 Males in Holly Ridge.
What is the Median Population Age in Holly Ridge?
Median Population Age in Holly Ridge is 34.2 Years.
What is the Average Family Size in Holly Ridge
Average Family Size in Holly Ridge is 3.0 People.
What is the Average Household Size in Holly Ridge
Average Household Size in Holly Ridge is 2.7 People.
How Large is the Labor Force in Holly Ridge?
There are 2,645 People in the Labor Forcein in Holly Ridge.
What is the Percentage of People in the Labor Force in Holly Ridge?
80.8% of People are in the Labor Force in Holly Ridge.
What is the Unemployment Rate in Holly Ridge?
Unemployment Rate in Holly Ridge is 1.0%.