Cities with the Highest Percentage of Population Employed in Sales & Related in Mississippi
RELATED REPORTS & OPTIONS
Sales & Related
Mississippi
Compare Cities
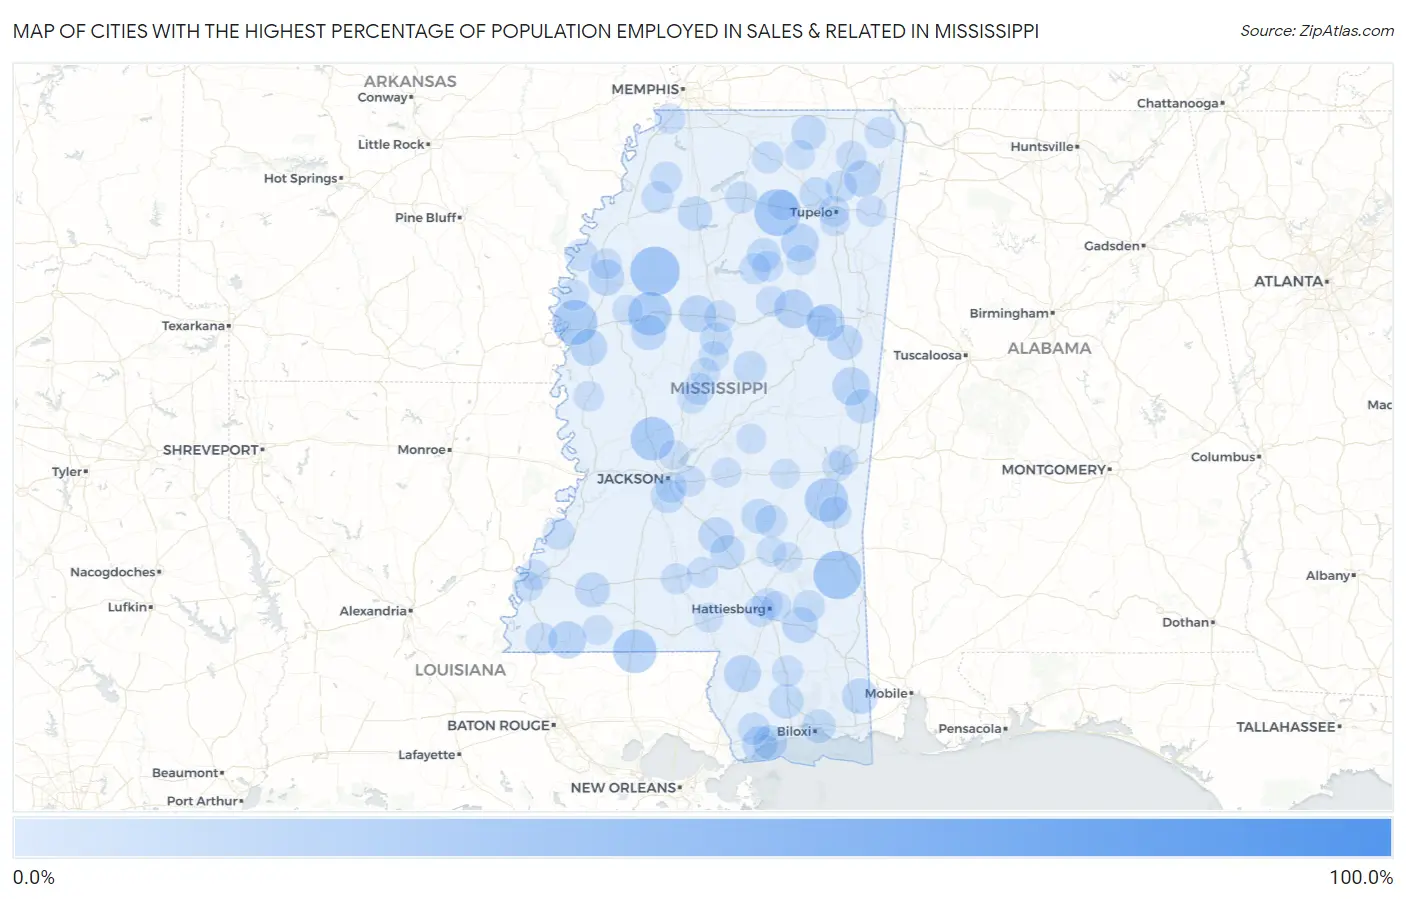
Map of Cities with the Highest Percentage of Population Employed in Sales & Related in Mississippi
0.0%
100.0%
Cities with the Highest Percentage of Population Employed in Sales & Related in Mississippi
| City | % Employed | vs State | vs National | |
| 1. | Jacinto | 100.0% | 9.8%(+90.2)#1 | 9.6%(+90.4)#41 |
| 2. | Baxterville | 63.7% | 9.8%(+54.0)#2 | 9.6%(+54.1)#77 |
| 3. | Longview | 52.7% | 9.8%(+42.9)#3 | 9.6%(+43.1)#156 |
| 4. | Bond | 43.8% | 9.8%(+34.1)#4 | 9.6%(+34.2)#253 |
| 5. | Fernwood | 41.3% | 9.8%(+31.5)#5 | 9.6%(+31.7)#290 |
| 6. | Lakeview | 39.5% | 9.8%(+29.7)#6 | 9.6%(+29.9)#324 |
| 7. | Glendora | 39.1% | 9.8%(+29.4)#7 | 9.6%(+29.5)#330 |
| 8. | Clara | 37.6% | 9.8%(+27.8)#8 | 9.6%(+28.0)#363 |
| 9. | Toccopola | 35.5% | 9.8%(+25.7)#9 | 9.6%(+25.9)#408 |
| 10. | Metcalfe | 32.9% | 9.8%(+23.2)#10 | 9.6%(+23.3)#497 |
| 11. | Mississippi Valley State University | 31.2% | 9.8%(+21.5)#11 | 9.6%(+21.6)#569 |
| 12. | Osyka | 31.2% | 9.8%(+21.4)#12 | 9.6%(+21.6)#573 |
| 13. | Kearney Park | 31.1% | 9.8%(+21.3)#13 | 9.6%(+21.5)#576 |
| 14. | Stonewall | 31.0% | 9.8%(+21.2)#14 | 9.6%(+21.4)#581 |
| 15. | Maben | 25.0% | 9.8%(+15.2)#15 | 9.6%(+15.4)#989 |
| 16. | Shuqualak | 23.5% | 9.8%(+13.8)#16 | 9.6%(+13.9)#1,157 |
| 17. | New Houlka | 23.4% | 9.8%(+13.6)#17 | 9.6%(+13.8)#1,174 |
| 18. | Centreville | 22.8% | 9.8%(+13.0)#18 | 9.6%(+13.2)#1,266 |
| 19. | Mississippi State | 22.7% | 9.8%(+12.9)#19 | 9.6%(+13.1)#1,285 |
| 20. | Poplarville | 22.5% | 9.8%(+12.7)#20 | 9.6%(+12.9)#1,314 |
| 21. | North Carrollton | 22.1% | 9.8%(+12.4)#21 | 9.6%(+12.5)#1,366 |
| 22. | Arcola | 22.0% | 9.8%(+12.2)#22 | 9.6%(+12.4)#1,392 |
| 23. | Renova | 21.3% | 9.8%(+11.5)#23 | 9.6%(+11.7)#1,515 |
| 24. | Marietta | 21.2% | 9.8%(+11.5)#24 | 9.6%(+11.7)#1,524 |
| 25. | New Augusta | 20.8% | 9.8%(+11.0)#25 | 9.6%(+11.2)#1,625 |
| 26. | Hurley | 20.7% | 9.8%(+10.9)#26 | 9.6%(+11.1)#1,633 |
| 27. | Magee | 20.5% | 9.8%(+10.7)#27 | 9.6%(+10.9)#1,670 |
| 28. | Bay St Louis | 20.3% | 9.8%(+10.5)#28 | 9.6%(+10.7)#1,716 |
| 29. | Morgan City | 20.0% | 9.8%(+10.2)#29 | 9.6%(+10.4)#1,778 |
| 30. | Crawford | 19.8% | 9.8%(+9.99)#30 | 9.6%(+10.2)#1,845 |
| 31. | Bude | 19.4% | 9.8%(+9.67)#31 | 9.6%(+9.85)#1,924 |
| 32. | Falkner | 19.2% | 9.8%(+9.47)#32 | 9.6%(+9.65)#1,986 |
| 33. | Sylvarena | 19.2% | 9.8%(+9.45)#33 | 9.6%(+9.64)#1,998 |
| 34. | Saucier | 19.2% | 9.8%(+9.38)#34 | 9.6%(+9.56)#2,018 |
| 35. | Courtland | 18.9% | 9.8%(+9.14)#35 | 9.6%(+9.32)#2,084 |
| 36. | Mount Olive | 18.8% | 9.8%(+8.98)#36 | 9.6%(+9.16)#2,126 |
| 37. | Scooba | 18.8% | 9.8%(+8.97)#37 | 9.6%(+9.15)#2,128 |
| 38. | Henderson Point | 18.8% | 9.8%(+8.97)#38 | 9.6%(+9.15)#2,134 |
| 39. | Arkabutla | 18.7% | 9.8%(+8.89)#39 | 9.6%(+9.07)#2,167 |
| 40. | Cleary | 18.1% | 9.8%(+8.33)#40 | 9.6%(+8.51)#2,330 |
| 41. | Pittsboro | 18.1% | 9.8%(+8.28)#41 | 9.6%(+8.46)#2,339 |
| 42. | St Martin | 18.0% | 9.8%(+8.27)#42 | 9.6%(+8.45)#2,341 |
| 43. | Rena Lara | 17.5% | 9.8%(+7.75)#43 | 9.6%(+7.93)#2,495 |
| 44. | Blue Springs | 17.4% | 9.8%(+7.61)#44 | 9.6%(+7.80)#2,554 |
| 45. | Ethel | 17.2% | 9.8%(+7.39)#45 | 9.6%(+7.58)#2,642 |
| 46. | Vaiden | 16.9% | 9.8%(+7.12)#46 | 9.6%(+7.31)#2,769 |
| 47. | Gunnison | 16.3% | 9.8%(+6.50)#47 | 9.6%(+6.68)#3,104 |
| 48. | Bay Springs | 16.1% | 9.8%(+6.33)#48 | 9.6%(+6.51)#3,226 |
| 49. | Quitman | 15.9% | 9.8%(+6.17)#49 | 9.6%(+6.35)#3,325 |
| 50. | Alcorn State University | 15.9% | 9.8%(+6.10)#50 | 9.6%(+6.28)#3,365 |
| 51. | Goodman | 15.9% | 9.8%(+6.08)#51 | 9.6%(+6.26)#3,381 |
| 52. | Kiln | 15.8% | 9.8%(+6.02)#52 | 9.6%(+6.20)#3,408 |
| 53. | Richton | 15.7% | 9.8%(+5.94)#53 | 9.6%(+6.12)#3,470 |
| 54. | University | 15.7% | 9.8%(+5.93)#54 | 9.6%(+6.11)#3,479 |
| 55. | Darling | 15.7% | 9.8%(+5.91)#55 | 9.6%(+6.09)#3,492 |
| 56. | Woodville | 15.5% | 9.8%(+5.74)#56 | 9.6%(+5.93)#3,594 |
| 57. | Potts Camp | 15.3% | 9.8%(+5.54)#57 | 9.6%(+5.72)#3,714 |
| 58. | Guntown | 15.1% | 9.8%(+5.35)#58 | 9.6%(+5.53)#3,841 |
| 59. | Crenshaw | 15.1% | 9.8%(+5.34)#59 | 9.6%(+5.53)#3,844 |
| 60. | Winona | 15.0% | 9.8%(+5.25)#60 | 9.6%(+5.43)#3,915 |
| 61. | Big Creek | 14.9% | 9.8%(+5.15)#61 | 9.6%(+5.33)#3,991 |
| 62. | Wiggins | 14.8% | 9.8%(+5.01)#62 | 9.6%(+5.20)#4,090 |
| 63. | Glendale | 14.6% | 9.8%(+4.77)#63 | 9.6%(+4.96)#4,267 |
| 64. | Calhoun City | 14.5% | 9.8%(+4.76)#64 | 9.6%(+4.95)#4,279 |
| 65. | Burnsville | 14.5% | 9.8%(+4.73)#65 | 9.6%(+4.92)#4,299 |
| 66. | West Hattiesburg | 14.5% | 9.8%(+4.71)#66 | 9.6%(+4.89)#4,312 |
| 67. | Booneville | 14.3% | 9.8%(+4.55)#67 | 9.6%(+4.73)#4,444 |
| 68. | Richland | 14.3% | 9.8%(+4.54)#68 | 9.6%(+4.72)#4,452 |
| 69. | Benoit | 14.3% | 9.8%(+4.51)#69 | 9.6%(+4.69)#4,478 |
| 70. | Starkville | 14.3% | 9.8%(+4.48)#70 | 9.6%(+4.66)#4,543 |
| 71. | Monticello | 14.2% | 9.8%(+4.47)#71 | 9.6%(+4.65)#4,550 |
| 72. | Prentiss | 14.2% | 9.8%(+4.45)#72 | 9.6%(+4.63)#4,567 |
| 73. | Fulton | 14.1% | 9.8%(+4.30)#73 | 9.6%(+4.49)#4,700 |
| 74. | Tupelo | 14.0% | 9.8%(+4.21)#74 | 9.6%(+4.40)#4,780 |
| 75. | Morgantown | 14.0% | 9.8%(+4.21)#75 | 9.6%(+4.39)#4,785 |
| 76. | Mound Bayou | 13.9% | 9.8%(+4.14)#76 | 9.6%(+4.32)#4,841 |
| 77. | Walthall | 13.9% | 9.8%(+4.11)#77 | 9.6%(+4.29)#4,876 |
| 78. | Brandon | 13.8% | 9.8%(+4.07)#78 | 9.6%(+4.25)#4,916 |
| 79. | Walls | 13.8% | 9.8%(+3.98)#79 | 9.6%(+4.16)#4,997 |
| 80. | Rolling Fork | 13.5% | 9.8%(+3.76)#80 | 9.6%(+3.94)#5,225 |
| 81. | Meridian | 13.5% | 9.8%(+3.72)#81 | 9.6%(+3.90)#5,262 |
| 82. | Cloverdale | 13.5% | 9.8%(+3.70)#82 | 9.6%(+3.89)#5,274 |
| 83. | West | 13.5% | 9.8%(+3.68)#83 | 9.6%(+3.87)#5,303 |
| 84. | Thaxton | 13.5% | 9.8%(+3.68)#84 | 9.6%(+3.86)#5,308 |
| 85. | Sunflower | 13.4% | 9.8%(+3.66)#85 | 9.6%(+3.84)#5,324 |
| 86. | Houston | 13.4% | 9.8%(+3.63)#86 | 9.6%(+3.81)#5,363 |
| 87. | Verona | 13.3% | 9.8%(+3.56)#87 | 9.6%(+3.74)#5,438 |
| 88. | Marion | 13.2% | 9.8%(+3.43)#88 | 9.6%(+3.62)#5,608 |
| 89. | Newton | 13.2% | 9.8%(+3.40)#89 | 9.6%(+3.58)#5,652 |
| 90. | Blue Mountain | 13.1% | 9.8%(+3.33)#90 | 9.6%(+3.52)#5,746 |
| 91. | Soso | 13.1% | 9.8%(+3.28)#91 | 9.6%(+3.47)#5,801 |
| 92. | Morton | 13.0% | 9.8%(+3.24)#92 | 9.6%(+3.43)#5,856 |
| 93. | Liberty | 13.0% | 9.8%(+3.21)#93 | 9.6%(+3.39)#5,891 |
| 94. | Madison | 13.0% | 9.8%(+3.20)#94 | 9.6%(+3.38)#5,904 |
| 95. | Walnut Grove | 13.0% | 9.8%(+3.18)#95 | 9.6%(+3.37)#5,928 |
| 96. | Pickens | 13.0% | 9.8%(+3.18)#96 | 9.6%(+3.36)#5,936 |
| 97. | Durant | 12.9% | 9.8%(+3.16)#97 | 9.6%(+3.35)#5,959 |
| 98. | Laurel | 12.9% | 9.8%(+3.14)#98 | 9.6%(+3.32)#6,004 |
| 99. | Petal | 12.9% | 9.8%(+3.12)#99 | 9.6%(+3.31)#6,039 |
| 100. | Columbia | 12.9% | 9.8%(+3.10)#100 | 9.6%(+3.28)#6,067 |
Common Questions
What are the Top 10 Cities with the Highest Percentage of Population Employed in Sales & Related in Mississippi?
Top 10 Cities with the Highest Percentage of Population Employed in Sales & Related in Mississippi are:
#1
39.1%
#2
37.6%
#3
35.5%
#4
32.9%
#5
31.2%
#6
31.2%
#7
31.1%
#8
31.0%
#9
25.0%
#10
23.5%
What city has the Highest Percentage of Population Employed in Sales & Related in Mississippi?
Glendora has the Highest Percentage of Population Employed in Sales & Related in Mississippi with 39.1%.
What is the Percentage of Population Employed in Sales & Related in the State of Mississippi?
Percentage of Population Employed in Sales & Related in Mississippi is 9.8%.
What is the Percentage of Population Employed in Sales & Related in the United States?
Percentage of Population Employed in Sales & Related in the United States is 9.6%.