Richton, MS Map & Demographics
Richton Map
Richton Overview
$20,111
PER CAPITA INCOME
$34,301
AVG FAMILY INCOME
$33,621
AVG HOUSEHOLD INCOME
$14,703
FAMILY INCOME DEFICIT
0.48
INEQUALITY / GINI INDEX
1,150
TOTAL POPULATION
602
MALE POPULATION
548
FEMALE POPULATION
109.85
MALES / 100 FEMALES
91.03
FEMALES / 100 MALES
42.3
MEDIAN AGE
3.2
AVG FAMILY SIZE
2.6
AVG HOUSEHOLD SIZE
376
LABOR FORCE [ PEOPLE ]
41.5%
PERCENT IN LABOR FORCE
Richton Zip Codes
Richton Area Codes
Income in Richton
Income Overview in Richton
Per Capita Income in Richton is $20,111, while median incomes of families and households are $34,301 and $33,621 respectively.
| Characteristic | Number | Measure |
| Per Capita Income | 1,150 | $20,111 |
| Median Family Income | 280 | $34,301 |
| Mean Family Income | 280 | $61,372 |
| Median Household Income | 393 | $33,621 |
| Mean Household Income | 393 | $51,775 |
| Income Deficit | 280 | $14,703 |
| Wage / Income Gap (%) | 1,150 | 0.00% |
| Wage / Income Gap ($) | 1,150 | 100.00¢ per $1 |
| Gini / Inequality Index | 1,150 | 0.48 |
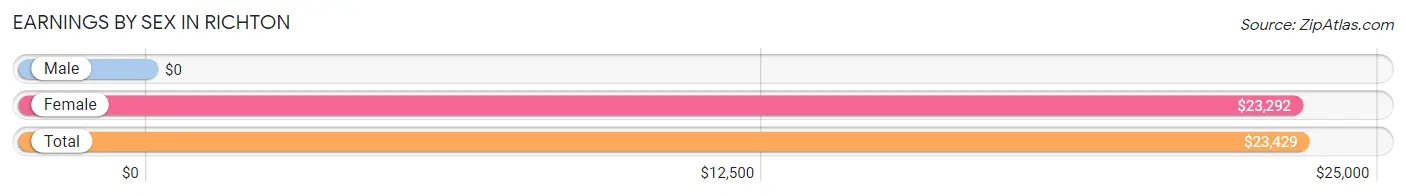
Earnings by Sex in Richton
| Sex | Number | Average Earnings |
| Male | 226 (56.4%) | $0 |
| Female | 175 (43.6%) | $23,292 |
| Total | 401 (100.0%) | $23,429 |
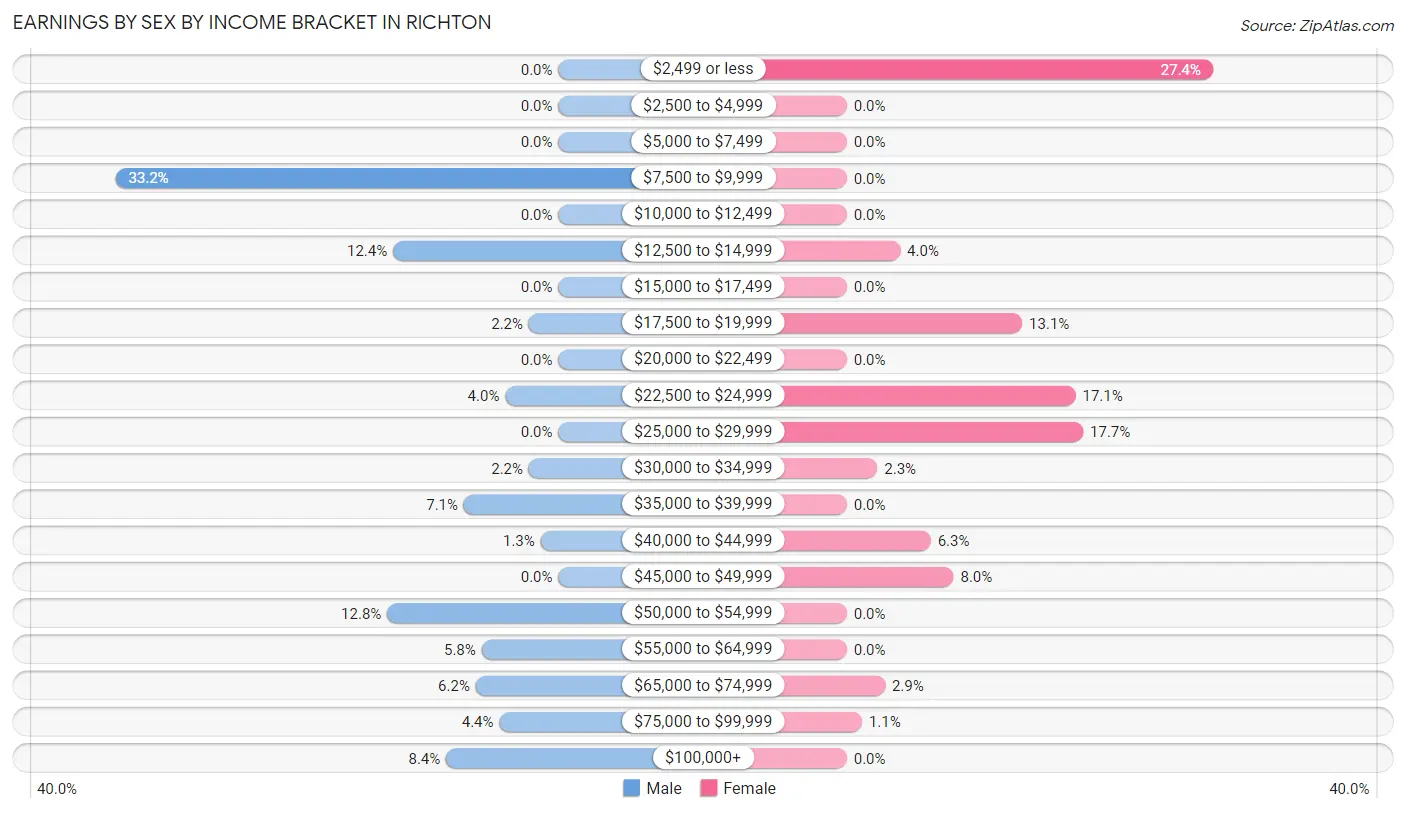
Earnings by Sex by Income Bracket in Richton
The most common earnings brackets in Richton are $7,500 to $9,999 for men (75 | 33.2%) and $2,499 or less for women (48 | 27.4%).
| Income | Male | Female |
| $2,499 or less | 0 (0.0%) | 48 (27.4%) |
| $2,500 to $4,999 | 0 (0.0%) | 0 (0.0%) |
| $5,000 to $7,499 | 0 (0.0%) | 0 (0.0%) |
| $7,500 to $9,999 | 75 (33.2%) | 0 (0.0%) |
| $10,000 to $12,499 | 0 (0.0%) | 0 (0.0%) |
| $12,500 to $14,999 | 28 (12.4%) | 7 (4.0%) |
| $15,000 to $17,499 | 0 (0.0%) | 0 (0.0%) |
| $17,500 to $19,999 | 5 (2.2%) | 23 (13.1%) |
| $20,000 to $22,499 | 0 (0.0%) | 0 (0.0%) |
| $22,500 to $24,999 | 9 (4.0%) | 30 (17.1%) |
| $25,000 to $29,999 | 0 (0.0%) | 31 (17.7%) |
| $30,000 to $34,999 | 5 (2.2%) | 4 (2.3%) |
| $35,000 to $39,999 | 16 (7.1%) | 0 (0.0%) |
| $40,000 to $44,999 | 3 (1.3%) | 11 (6.3%) |
| $45,000 to $49,999 | 0 (0.0%) | 14 (8.0%) |
| $50,000 to $54,999 | 29 (12.8%) | 0 (0.0%) |
| $55,000 to $64,999 | 13 (5.8%) | 0 (0.0%) |
| $65,000 to $74,999 | 14 (6.2%) | 5 (2.9%) |
| $75,000 to $99,999 | 10 (4.4%) | 2 (1.1%) |
| $100,000+ | 19 (8.4%) | 0 (0.0%) |
| Total | 226 (100.0%) | 175 (100.0%) |
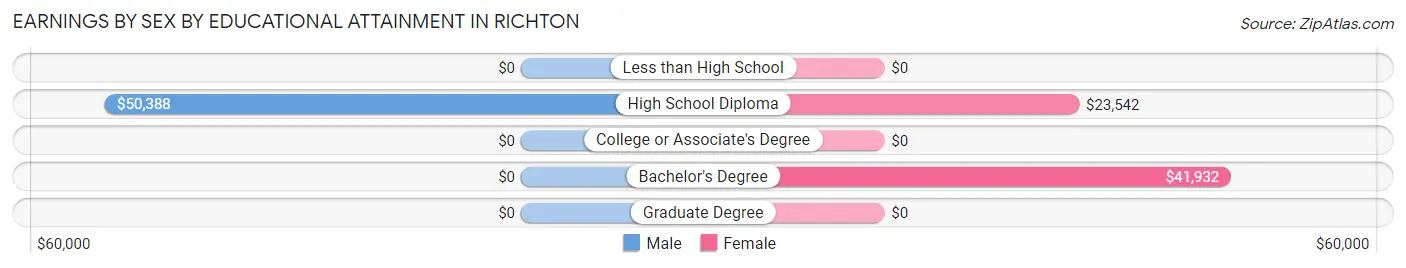
Earnings by Sex by Educational Attainment in Richton
Average earnings in Richton are $50,388 for men and $24,083 for women, a difference of 52.2%. Men with an educational attainment of high school diploma enjoy the highest average annual earnings of $50,388, while those with high school diploma education earn the least with $50,388. Women with an educational attainment of bachelor's degree earn the most with the average annual earnings of $41,932, while those with high school diploma education have the smallest earnings of $23,542.
| Educational Attainment | Male Income | Female Income |
| Less than High School | - | - |
| High School Diploma | $50,388 | $23,542 |
| College or Associate's Degree | - | - |
| Bachelor's Degree | - | - |
| Graduate Degree | - | - |
| Total | $50,388 | $24,083 |
Family Income in Richton
Family Income Brackets in Richton
According to the Richton family income data, there are 97 families falling into the $25,000 to $34,999 income range, which is the most common income bracket and makes up 34.6% of all families.
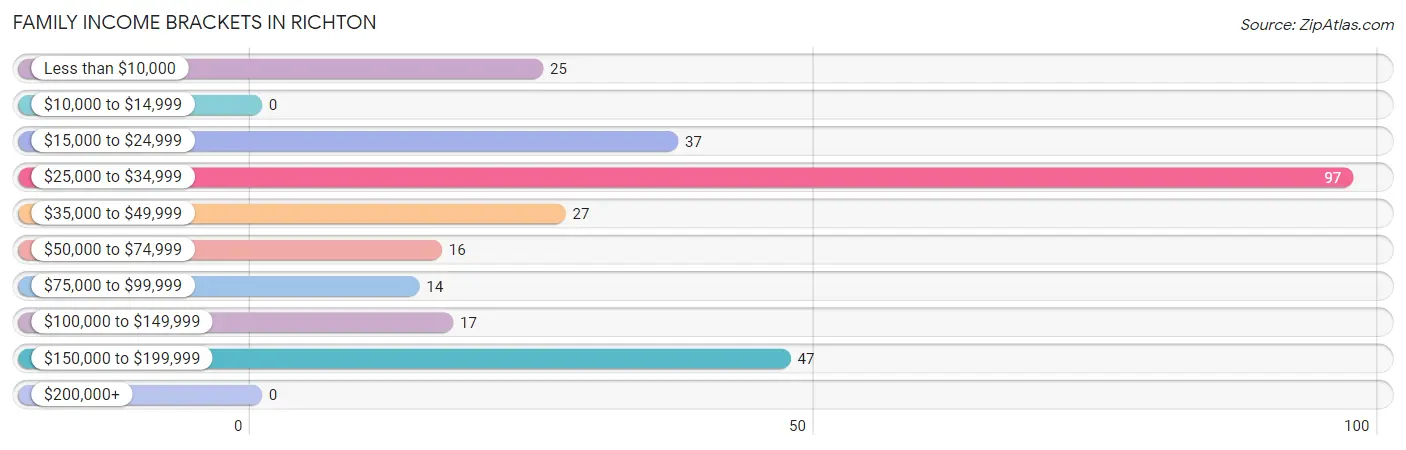
| Income Bracket | # Families | % Families |
| Less than $10,000 | 25 | 8.9% |
| $10,000 to $14,999 | 0 | 0.0% |
| $15,000 to $24,999 | 37 | 13.2% |
| $25,000 to $34,999 | 97 | 34.6% |
| $35,000 to $49,999 | 27 | 9.6% |
| $50,000 to $74,999 | 16 | 5.7% |
| $75,000 to $99,999 | 14 | 5.0% |
| $100,000 to $149,999 | 17 | 6.1% |
| $150,000 to $199,999 | 47 | 16.8% |
| $200,000+ | 0 | 0.0% |
Family Income by Famaliy Size in Richton
2-person families (182 | 65.0%) account for the highest median family income in Richton with $33,713 per family, while 2-person families (182 | 65.0%) have the highest median income of $16,856 per family member.
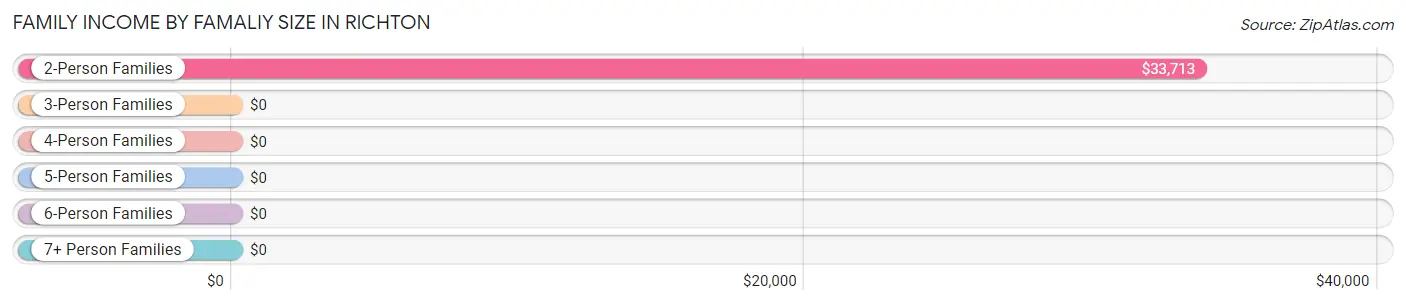
| Income Bracket | # Families | Median Income |
| 2-Person Families | 182 (65.0%) | $33,713 |
| 3-Person Families | 35 (12.5%) | $0 |
| 4-Person Families | 17 (6.1%) | $0 |
| 5-Person Families | 0 (0.0%) | $0 |
| 6-Person Families | 35 (12.5%) | $0 |
| 7+ Person Families | 11 (3.9%) | $0 |
| Total | 280 (100.0%) | $34,301 |
Family Income by Number of Earners in Richton
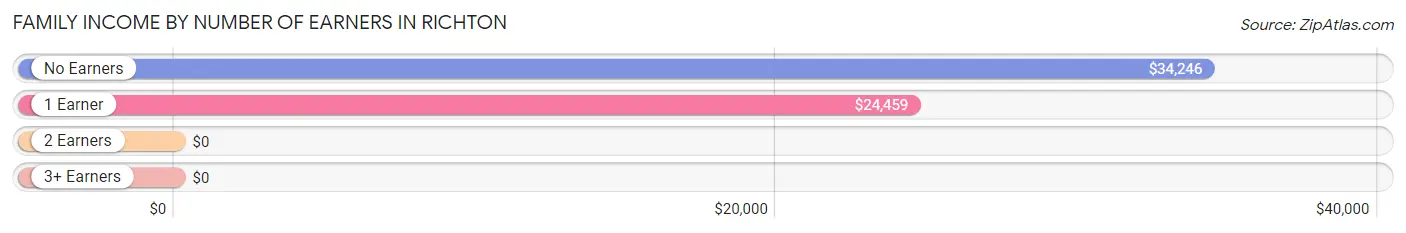
| Number of Earners | # Families | Median Income |
| No Earners | 107 (38.2%) | $34,246 |
| 1 Earner | 96 (34.3%) | $24,459 |
| 2 Earners | 48 (17.1%) | $0 |
| 3+ Earners | 29 (10.4%) | $0 |
| Total | 280 (100.0%) | $34,301 |
Household Income in Richton
Household Income Brackets in Richton
With 101 households falling in the category, the $25,000 to $34,999 income range is the most frequent in Richton, accounting for 25.7% of all households.
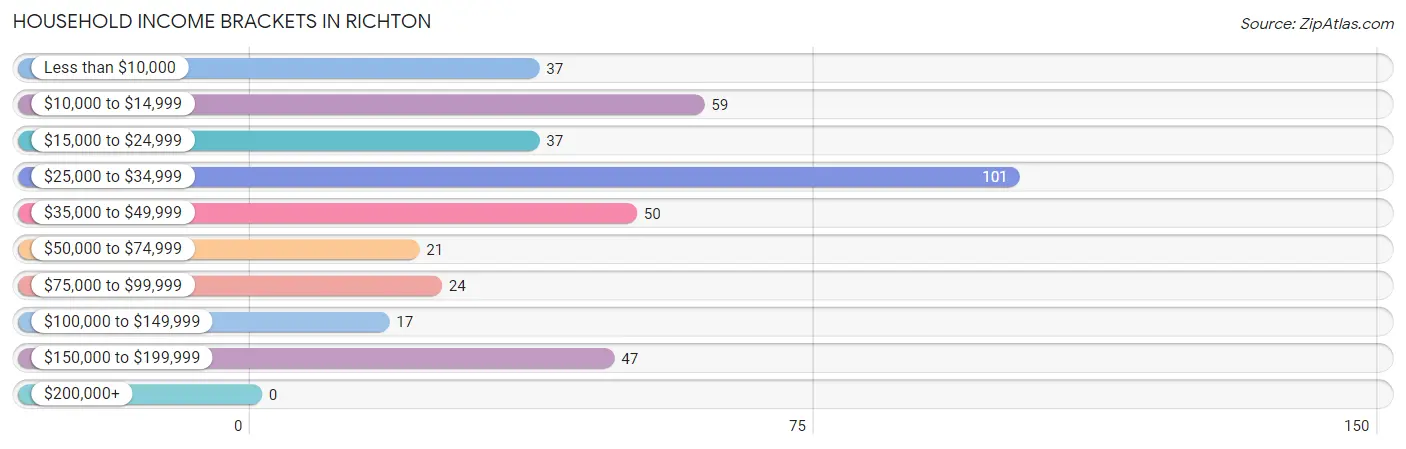
| Income Bracket | # Households | % Households |
| Less than $10,000 | 37 | 9.4% |
| $10,000 to $14,999 | 59 | 15.0% |
| $15,000 to $24,999 | 37 | 9.4% |
| $25,000 to $34,999 | 101 | 25.7% |
| $35,000 to $49,999 | 50 | 12.7% |
| $50,000 to $74,999 | 21 | 5.3% |
| $75,000 to $99,999 | 24 | 6.1% |
| $100,000 to $149,999 | 17 | 4.3% |
| $150,000 to $199,999 | 47 | 12.0% |
| $200,000+ | 0 | 0.0% |
Household Income by Householder Age in Richton
The median household income in Richton is $33,621, with the highest median household income of $33,438 found in the 65+ years age bracket for the primary householder. A total of 191 households (48.6%) fall into this category. Meanwhile, the 15 to 24 years age bracket for the primary householder has the lowest median household income of $0, with 4 households (1.0%) in this group.
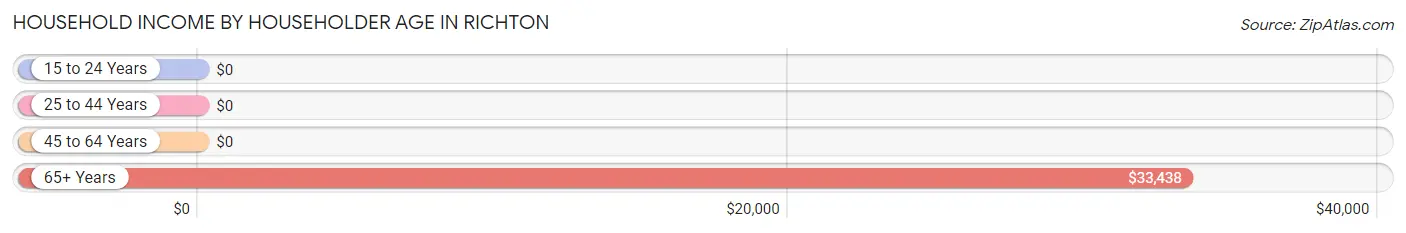
| Income Bracket | # Households | Median Income |
| 15 to 24 Years | 4 (1.0%) | $0 |
| 25 to 44 Years | 119 (30.3%) | $0 |
| 45 to 64 Years | 79 (20.1%) | $0 |
| 65+ Years | 191 (48.6%) | $33,438 |
| Total | 393 (100.0%) | $33,621 |
Poverty in Richton
Income Below Poverty by Sex and Age in Richton
With 15.4% poverty level for males and 28.4% for females among the residents of Richton, 6 to 11 year old males and 12 to 14 year old females are the most vulnerable to poverty, with 23 males (56.1%) and 45 females (100.0%) in their respective age groups living below the poverty level.
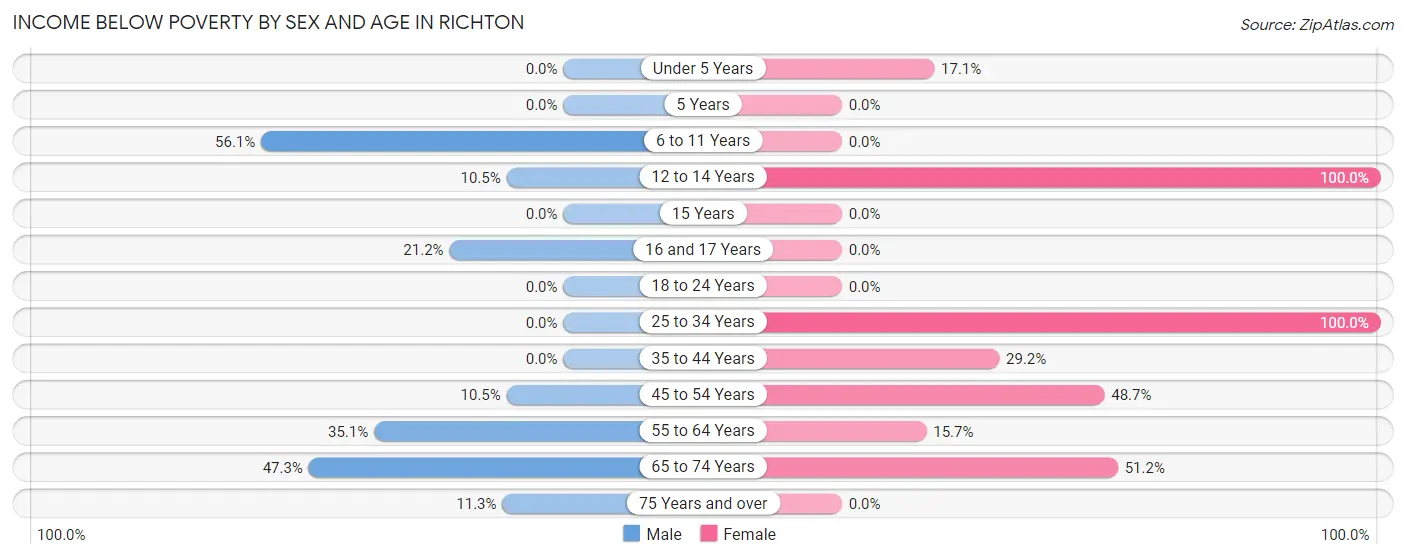
| Age Bracket | Male | Female |
| Under 5 Years | 0 (0.0%) | 6 (17.1%) |
| 5 Years | 0 (0.0%) | 0 (0.0%) |
| 6 to 11 Years | 23 (56.1%) | 0 (0.0%) |
| 12 to 14 Years | 6 (10.5%) | 45 (100.0%) |
| 15 Years | 0 (0.0%) | 0 (0.0%) |
| 16 and 17 Years | 11 (21.1%) | 0 (0.0%) |
| 18 to 24 Years | 0 (0.0%) | 0 (0.0%) |
| 25 to 34 Years | 0 (0.0%) | 7 (100.0%) |
| 35 to 44 Years | 0 (0.0%) | 33 (29.2%) |
| 45 to 54 Years | 4 (10.5%) | 19 (48.7%) |
| 55 to 64 Years | 13 (35.1%) | 8 (15.7%) |
| 65 to 74 Years | 26 (47.3%) | 21 (51.2%) |
| 75 Years and over | 6 (11.3%) | 0 (0.0%) |
| Total | 89 (15.4%) | 139 (28.4%) |
Income Above Poverty by Sex and Age in Richton
According to the poverty statistics in Richton, males aged under 5 years and females aged 6 to 11 years are the age groups that are most secure financially, with 100.0% of males and 100.0% of females in these age groups living above the poverty line.
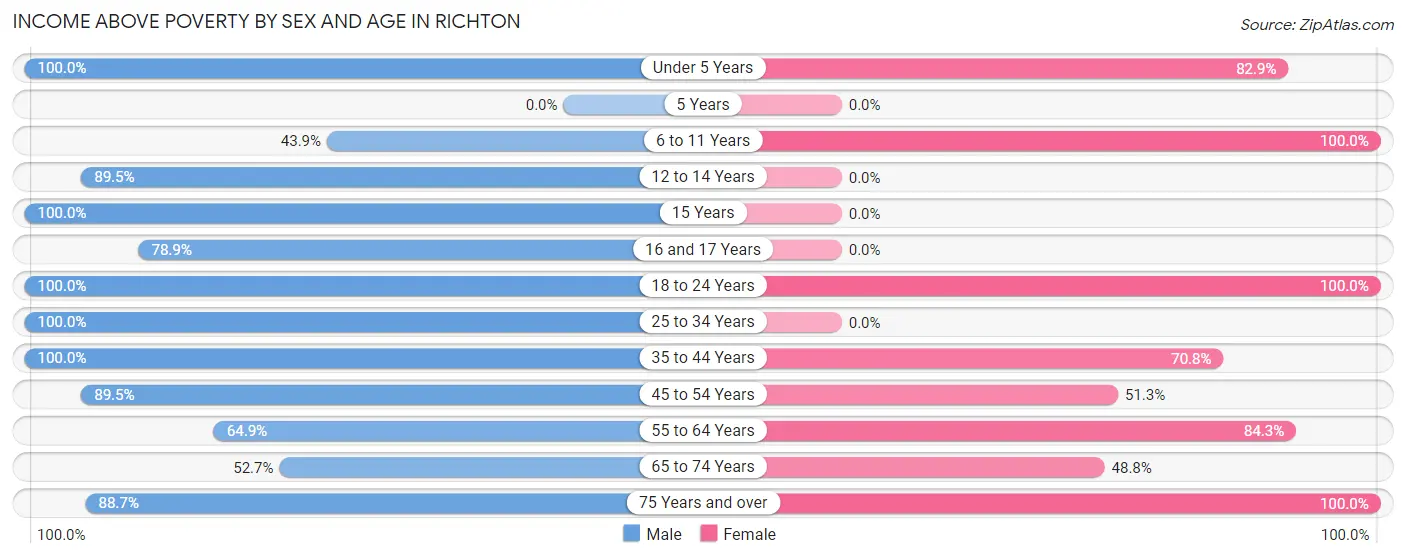
| Age Bracket | Male | Female |
| Under 5 Years | 12 (100.0%) | 29 (82.9%) |
| 5 Years | 0 (0.0%) | 0 (0.0%) |
| 6 to 11 Years | 18 (43.9%) | 15 (100.0%) |
| 12 to 14 Years | 51 (89.5%) | 0 (0.0%) |
| 15 Years | 39 (100.0%) | 0 (0.0%) |
| 16 and 17 Years | 41 (78.8%) | 0 (0.0%) |
| 18 to 24 Years | 77 (100.0%) | 34 (100.0%) |
| 25 to 34 Years | 42 (100.0%) | 0 (0.0%) |
| 35 to 44 Years | 74 (100.0%) | 80 (70.8%) |
| 45 to 54 Years | 34 (89.5%) | 20 (51.3%) |
| 55 to 64 Years | 24 (64.9%) | 43 (84.3%) |
| 65 to 74 Years | 29 (52.7%) | 20 (48.8%) |
| 75 Years and over | 47 (88.7%) | 109 (100.0%) |
| Total | 488 (84.6%) | 350 (71.6%) |
Income Below Poverty Among Married-Couple Families in Richton
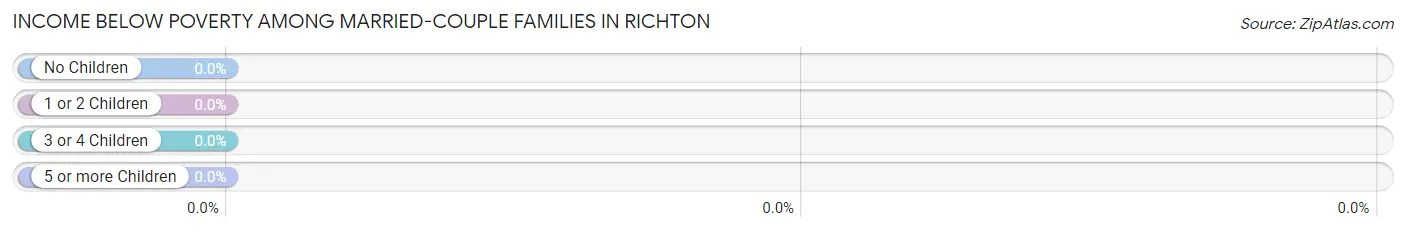
| Children | Above Poverty | Below Poverty |
| No Children | 103 (100.0%) | 0 (0.0%) |
| 1 or 2 Children | 46 (100.0%) | 0 (0.0%) |
| 3 or 4 Children | 0 (0.0%) | 0 (0.0%) |
| 5 or more Children | 11 (100.0%) | 0 (0.0%) |
| Total | 160 (100.0%) | 0 (0.0%) |
Income Below Poverty Among Single-Parent Households in Richton
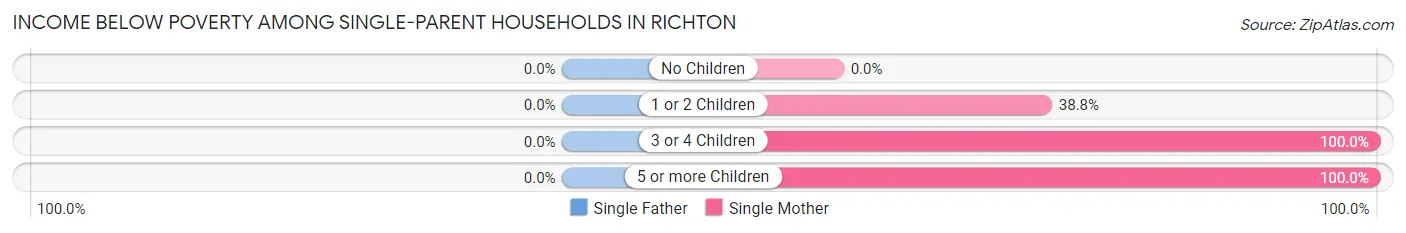
| Children | Single Father | Single Mother |
| No Children | 0 (0.0%) | 0 (0.0%) |
| 1 or 2 Children | 0 (0.0%) | 19 (38.8%) |
| 3 or 4 Children | 0 (0.0%) | 7 (100.0%) |
| 5 or more Children | 0 (0.0%) | 6 (100.0%) |
| Total | 0 (0.0%) | 32 (28.3%) |
Income Below Poverty Among Married-Couple vs Single-Parent Households in Richton
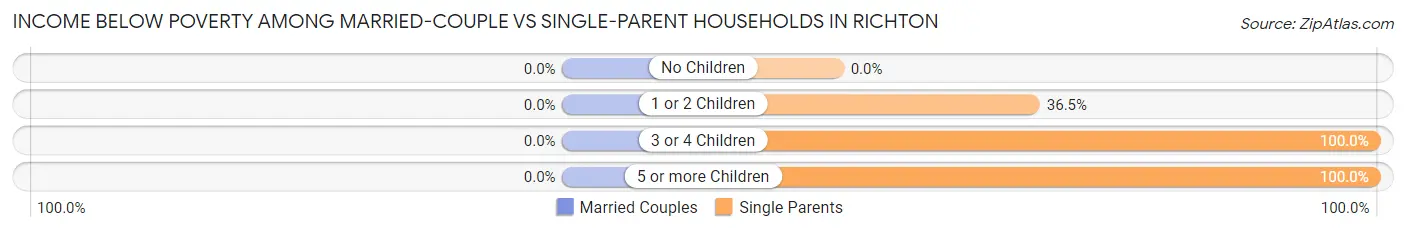
| Children | Married-Couple Families | Single-Parent Households |
| No Children | 0 (0.0%) | 0 (0.0%) |
| 1 or 2 Children | 0 (0.0%) | 19 (36.5%) |
| 3 or 4 Children | 0 (0.0%) | 7 (100.0%) |
| 5 or more Children | 0 (0.0%) | 6 (100.0%) |
| Total | 0 (0.0%) | 32 (26.7%) |
Race in Richton
The most populous races in Richton are White / Caucasian (857 | 74.5%), and Black / African American (293 | 25.5%).
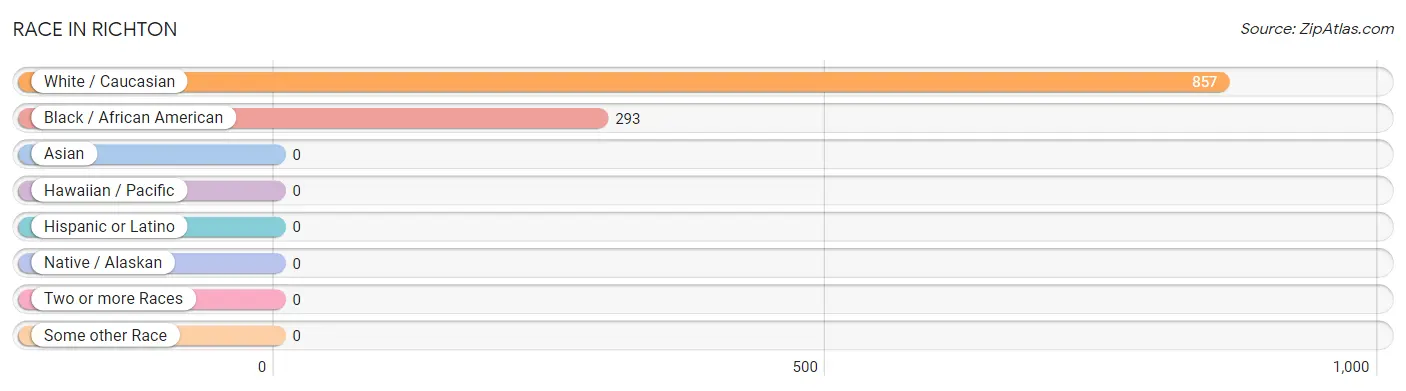
| Race | # Population | % Population |
| Asian | 0 | 0.0% |
| Black / African American | 293 | 25.5% |
| Hawaiian / Pacific | 0 | 0.0% |
| Hispanic or Latino | 0 | 0.0% |
| Native / Alaskan | 0 | 0.0% |
| White / Caucasian | 857 | 74.5% |
| Two or more Races | 0 | 0.0% |
| Some other Race | 0 | 0.0% |
| Total | 1,150 | 100.0% |
Ancestry in Richton
The most populous ancestries reported in Richton are American (298 | 25.9%), Irish (191 | 16.6%), Scotch-Irish (121 | 10.5%), German (30 | 2.6%), and Polish (16 | 1.4%), together accounting for 57.0% of all Richton residents.
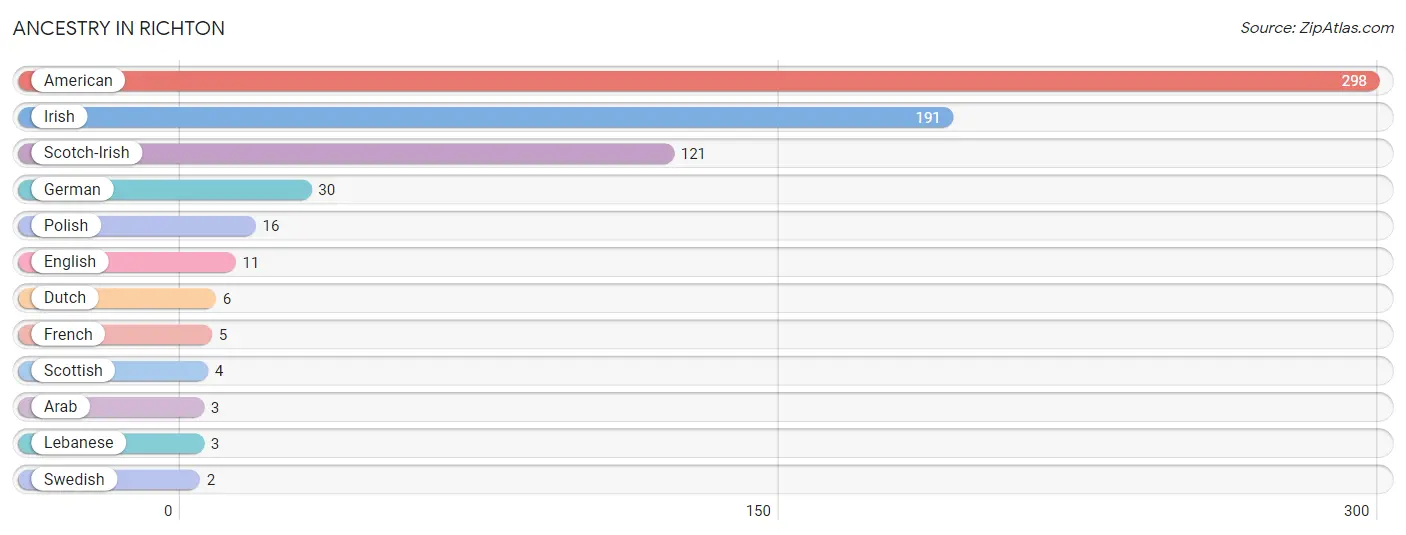
| Ancestry | # Population | % Population |
| American | 298 | 25.9% |
| Arab | 3 | 0.3% |
| Dutch | 6 | 0.5% |
| English | 11 | 1.0% |
| French | 5 | 0.4% |
| German | 30 | 2.6% |
| Irish | 191 | 16.6% |
| Lebanese | 3 | 0.3% |
| Polish | 16 | 1.4% |
| Scotch-Irish | 121 | 10.5% |
| Scottish | 4 | 0.4% |
| Swedish | 2 | 0.2% | View All 12 Rows |
Immigrants in Richton

| Immigration Origin | # Population | % Population | View All 0 Rows |
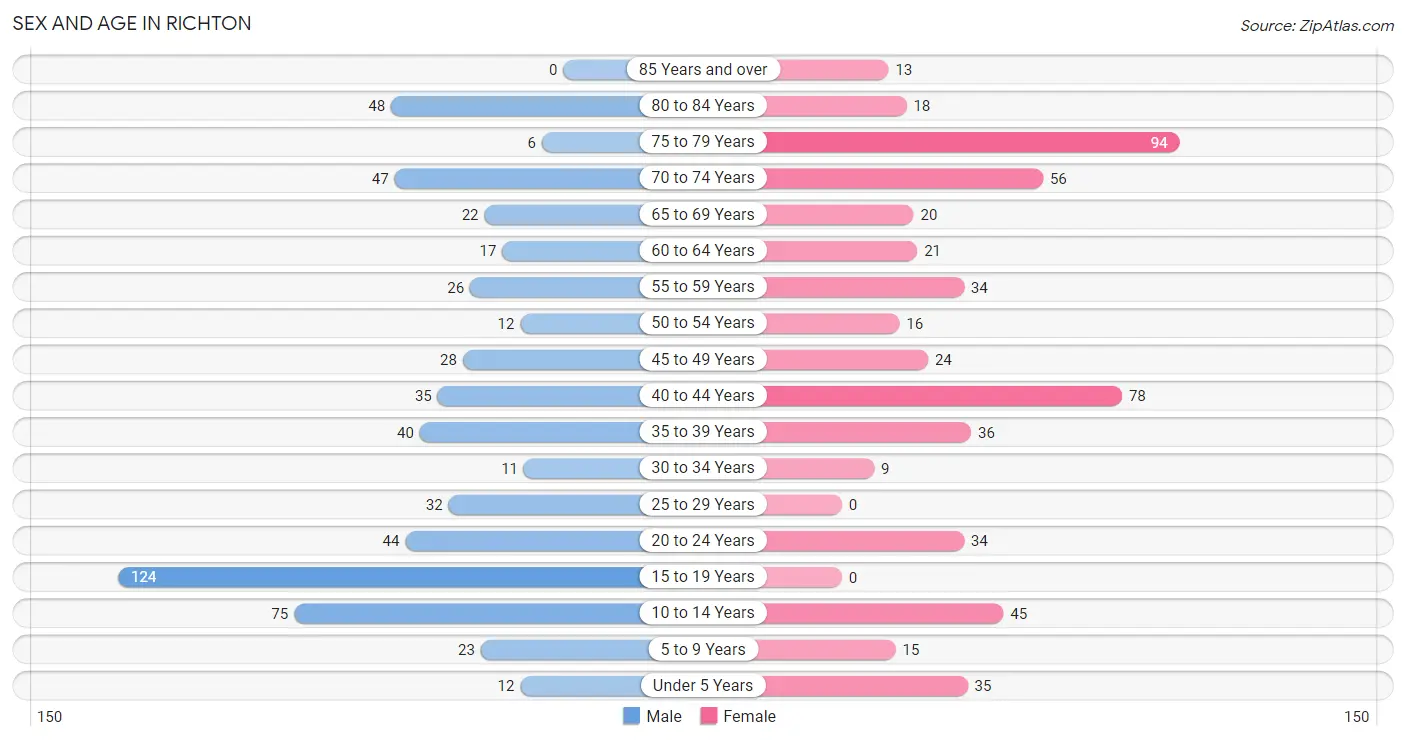
Sex and Age in Richton
Sex and Age in Richton
The most populous age groups in Richton are 15 to 19 Years (124 | 20.6%) for men and 75 to 79 Years (94 | 17.2%) for women.
| Age Bracket | Male | Female |
| Under 5 Years | 12 (2.0%) | 35 (6.4%) |
| 5 to 9 Years | 23 (3.8%) | 15 (2.7%) |
| 10 to 14 Years | 75 (12.5%) | 45 (8.2%) |
| 15 to 19 Years | 124 (20.6%) | 0 (0.0%) |
| 20 to 24 Years | 44 (7.3%) | 34 (6.2%) |
| 25 to 29 Years | 32 (5.3%) | 0 (0.0%) |
| 30 to 34 Years | 11 (1.8%) | 9 (1.6%) |
| 35 to 39 Years | 40 (6.6%) | 36 (6.6%) |
| 40 to 44 Years | 35 (5.8%) | 78 (14.2%) |
| 45 to 49 Years | 28 (4.6%) | 24 (4.4%) |
| 50 to 54 Years | 12 (2.0%) | 16 (2.9%) |
| 55 to 59 Years | 26 (4.3%) | 34 (6.2%) |
| 60 to 64 Years | 17 (2.8%) | 21 (3.8%) |
| 65 to 69 Years | 22 (3.6%) | 20 (3.6%) |
| 70 to 74 Years | 47 (7.8%) | 56 (10.2%) |
| 75 to 79 Years | 6 (1.0%) | 94 (17.2%) |
| 80 to 84 Years | 48 (8.0%) | 18 (3.3%) |
| 85 Years and over | 0 (0.0%) | 13 (2.4%) |
| Total | 602 (100.0%) | 548 (100.0%) |
Families and Households in Richton
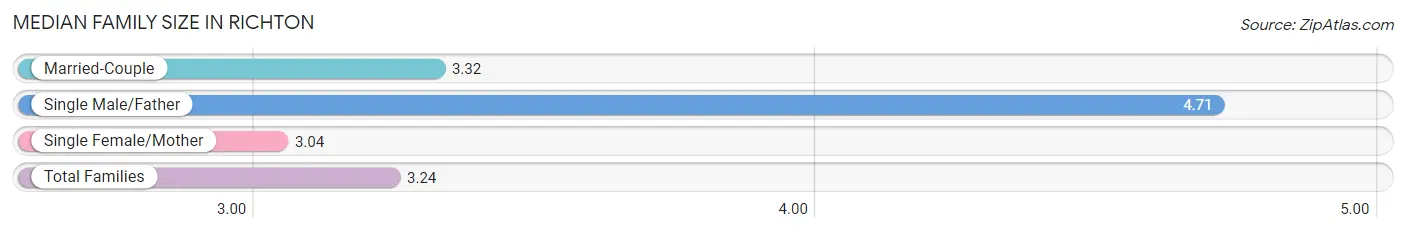
Median Family Size in Richton
The median family size in Richton is 3.24 persons per family, with single male/father families (7 | 2.5%) accounting for the largest median family size of 4.71 persons per family. On the other hand, single female/mother families (113 | 40.4%) represent the smallest median family size with 3.04 persons per family.
| Family Type | # Families | Family Size |
| Married-Couple | 160 (57.1%) | 3.32 |
| Single Male/Father | 7 (2.5%) | 4.71 |
| Single Female/Mother | 113 (40.4%) | 3.04 |
| Total Families | 280 (100.0%) | 3.24 |
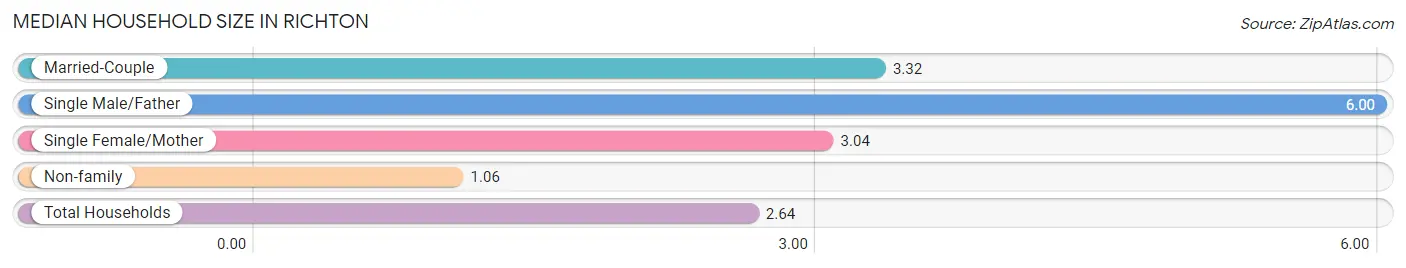
Median Household Size in Richton
The median household size in Richton is 2.64 persons per household, with single male/father households (7 | 1.8%) accounting for the largest median household size of 6 persons per household. non-family households (113 | 28.7%) represent the smallest median household size with 1.06 persons per household.
| Household Type | # Households | Household Size |
| Married-Couple | 160 (40.7%) | 3.32 |
| Single Male/Father | 7 (1.8%) | 6.00 |
| Single Female/Mother | 113 (28.7%) | 3.04 |
| Non-family | 113 (28.7%) | 1.06 |
| Total Households | 393 (100.0%) | 2.64 |
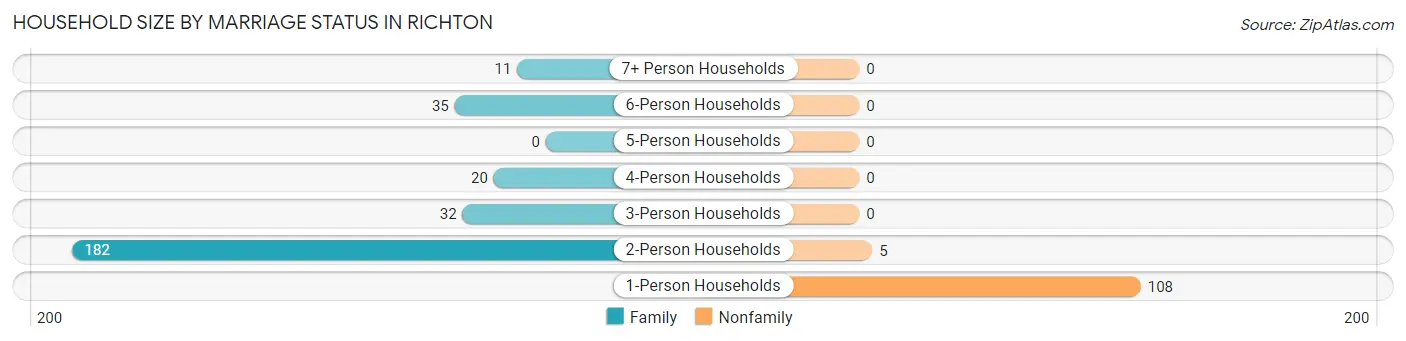
Household Size by Marriage Status in Richton
Out of a total of 393 households in Richton, 280 (71.3%) are family households, while 113 (28.7%) are nonfamily households. The most numerous type of family households are 2-person households, comprising 182, and the most common type of nonfamily households are 1-person households, comprising 108.
| Household Size | Family Households | Nonfamily Households |
| 1-Person Households | - | 108 (27.5%) |
| 2-Person Households | 182 (46.3%) | 5 (1.3%) |
| 3-Person Households | 32 (8.1%) | 0 (0.0%) |
| 4-Person Households | 20 (5.1%) | 0 (0.0%) |
| 5-Person Households | 0 (0.0%) | 0 (0.0%) |
| 6-Person Households | 35 (8.9%) | 0 (0.0%) |
| 7+ Person Households | 11 (2.8%) | 0 (0.0%) |
| Total | 280 (71.3%) | 113 (28.7%) |
Female Fertility in Richton
Fertility by Age in Richton
Average fertility rate in Richton is 39.0 births per 1,000 women. Women in the age bracket of 20 to 34 years have the highest fertility rate with 163.0 births per 1,000 women. Women in the age bracket of 20 to 34 years acount for 100.0% of all women with births.
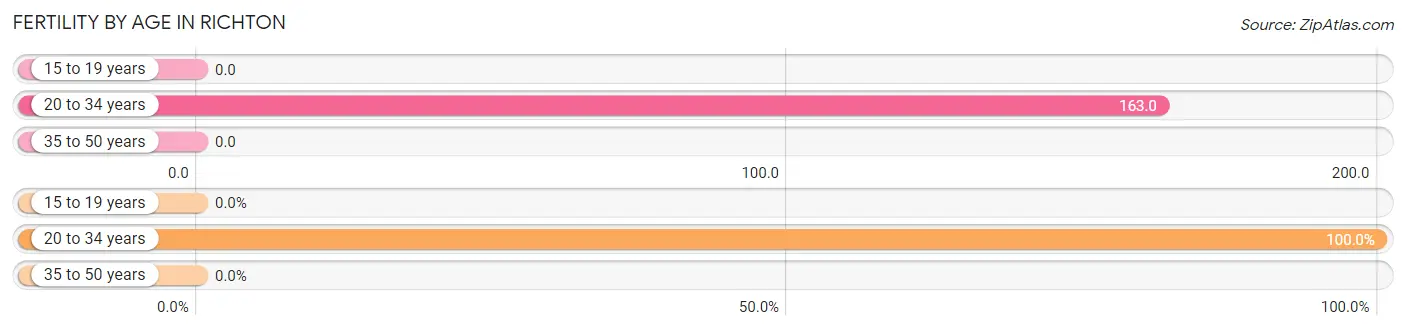
| Age Bracket | Women with Births | Births / 1,000 Women |
| 15 to 19 years | 0 (0.0%) | 0.0 |
| 20 to 34 years | 7 (100.0%) | 163.0 |
| 35 to 50 years | 0 (0.0%) | 0.0 |
| Total | 7 (100.0%) | 39.0 |
Fertility by Age by Marriage Status in Richton
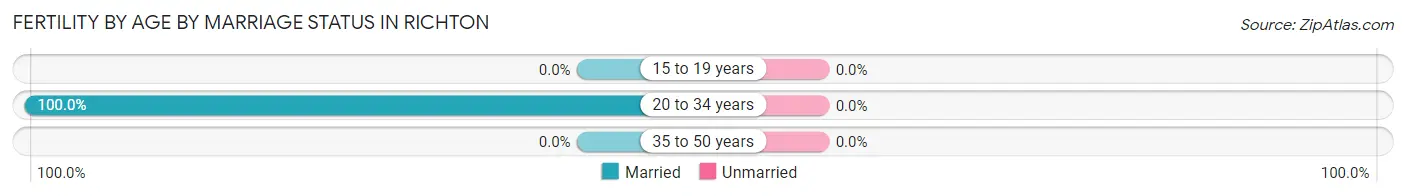
| Age Bracket | Married | Unmarried |
| 15 to 19 years | 0 (0.0%) | 0 (0.0%) |
| 20 to 34 years | 7 (100.0%) | 0 (0.0%) |
| 35 to 50 years | 0 (0.0%) | 0 (0.0%) |
| Total | 7 (100.0%) | 0 (0.0%) |
Fertility by Education in Richton
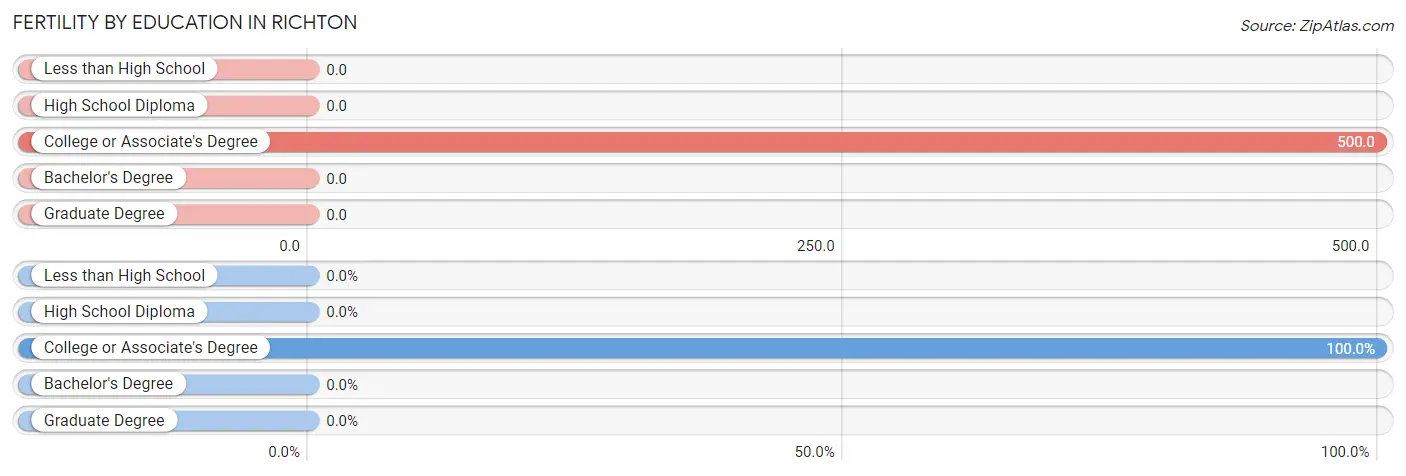
| Educational Attainment | Women with Births | Births / 1,000 Women |
| Less than High School | 0 (0.0%) | 0.0 |
| High School Diploma | 0 (0.0%) | 0.0 |
| College or Associate's Degree | 7 (100.0%) | 500.0 |
| Bachelor's Degree | 0 (0.0%) | 0.0 |
| Graduate Degree | 0 (0.0%) | 0.0 |
| Total | 7 (100.0%) | 39.0 |
Fertility by Education by Marriage Status in Richton
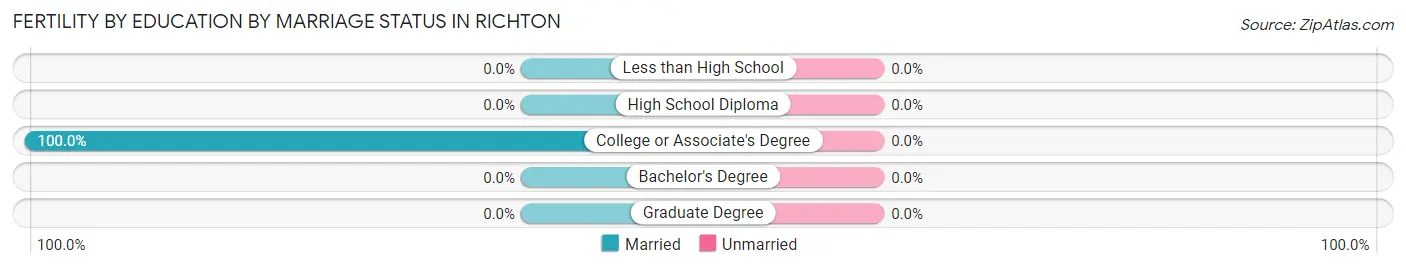
| Educational Attainment | Married | Unmarried |
| Less than High School | 0 (0.0%) | 0 (0.0%) |
| High School Diploma | 0 (0.0%) | 0 (0.0%) |
| College or Associate's Degree | 7 (100.0%) | 0 (0.0%) |
| Bachelor's Degree | 0 (0.0%) | 0 (0.0%) |
| Graduate Degree | 0 (0.0%) | 0 (0.0%) |
| Total | 7 (100.0%) | 0 (0.0%) |
Employment Characteristics in Richton
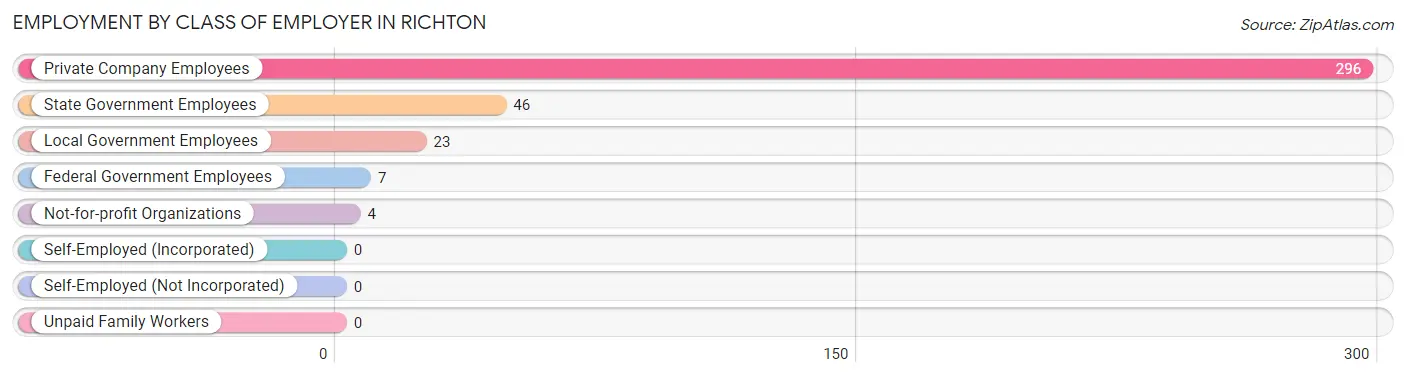
Employment by Class of Employer in Richton
Among the 376 employed individuals in Richton, private company employees (296 | 78.7%), state government employees (46 | 12.2%), and local government employees (23 | 6.1%) make up the most common classes of employment.
| Employer Class | # Employees | % Employees |
| Private Company Employees | 296 | 78.7% |
| Self-Employed (Incorporated) | 0 | 0.0% |
| Self-Employed (Not Incorporated) | 0 | 0.0% |
| Not-for-profit Organizations | 4 | 1.1% |
| Local Government Employees | 23 | 6.1% |
| State Government Employees | 46 | 12.2% |
| Federal Government Employees | 7 | 1.9% |
| Unpaid Family Workers | 0 | 0.0% |
| Total | 376 | 100.0% |
Employment Status by Age in Richton
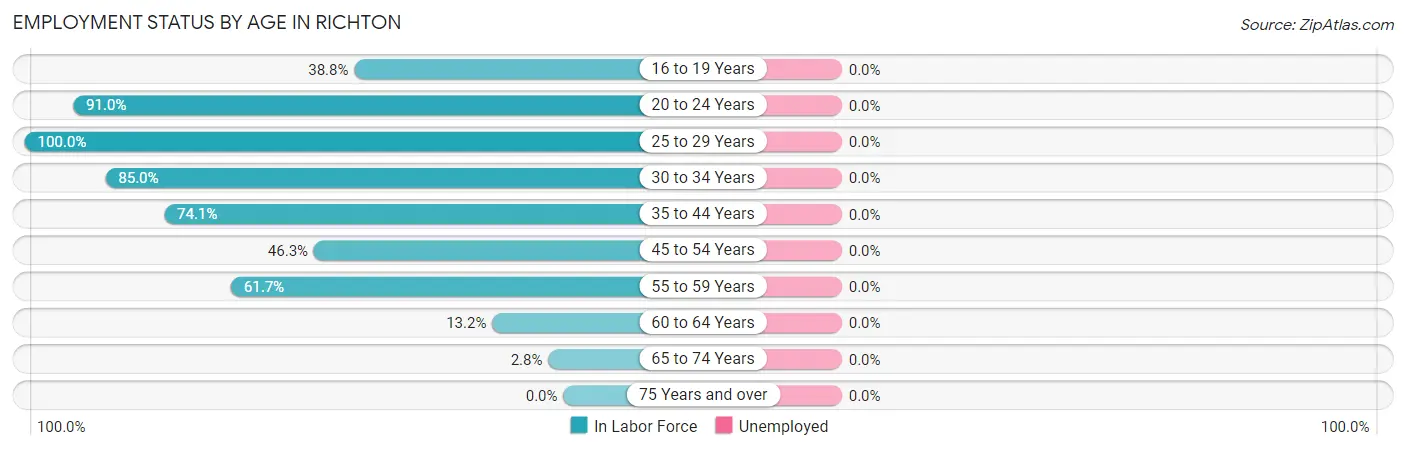
| Age Bracket | In Labor Force | Unemployed |
| 16 to 19 Years | 33 (38.8%) | 0 (0.0%) |
| 20 to 24 Years | 71 (91.0%) | 0 (0.0%) |
| 25 to 29 Years | 32 (100.0%) | 0 (0.0%) |
| 30 to 34 Years | 17 (85.0%) | 0 (0.0%) |
| 35 to 44 Years | 140 (74.1%) | 0 (0.0%) |
| 45 to 54 Years | 37 (46.3%) | 0 (0.0%) |
| 55 to 59 Years | 37 (61.7%) | 0 (0.0%) |
| 60 to 64 Years | 5 (13.2%) | 0 (0.0%) |
| 65 to 74 Years | 4 (2.8%) | 0 (0.0%) |
| 75 Years and over | 0 (0.0%) | 0 (0.0%) |
| Total | 376 (41.5%) | 0 (0.0%) |
Employment Status by Educational Attainment in Richton
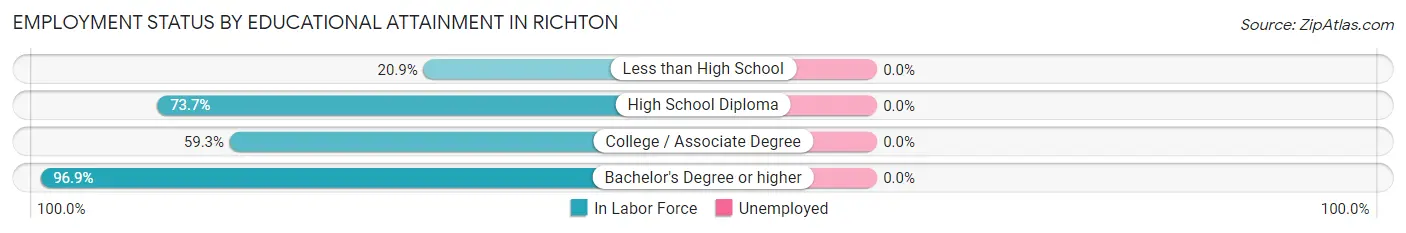
| Educational Attainment | In Labor Force | Unemployed |
| Less than High School | 19 (20.9%) | 0 (0.0%) |
| High School Diploma | 154 (73.7%) | 0 (0.0%) |
| College / Associate Degree | 32 (59.3%) | 0 (0.0%) |
| Bachelor's Degree or higher | 63 (96.9%) | 0 (0.0%) |
| Total | 268 (64.0%) | 0 (0.0%) |
Employment Occupations by Sex in Richton
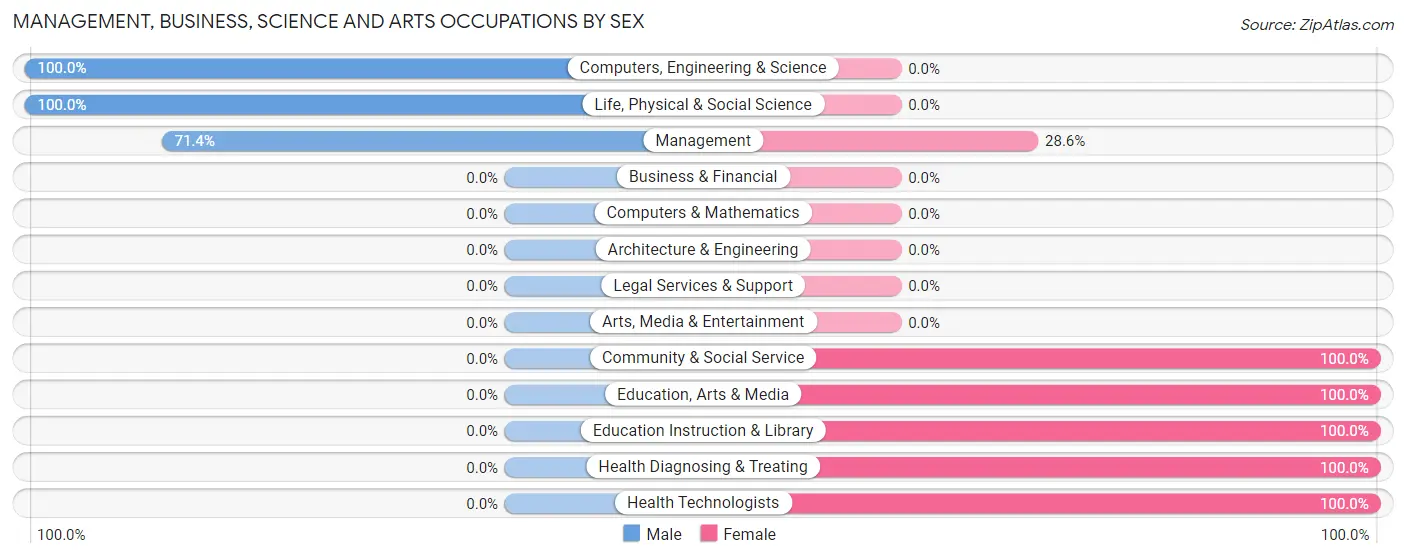
Management, Business, Science and Arts Occupations
The most common Management, Business, Science and Arts occupations in Richton are Community & Social Service (26 | 7.0%), Education Instruction & Library (21 | 5.7%), Computers, Engineering & Science (10 | 2.7%), Life, Physical & Social Science (10 | 2.7%), and Management (7 | 1.9%).
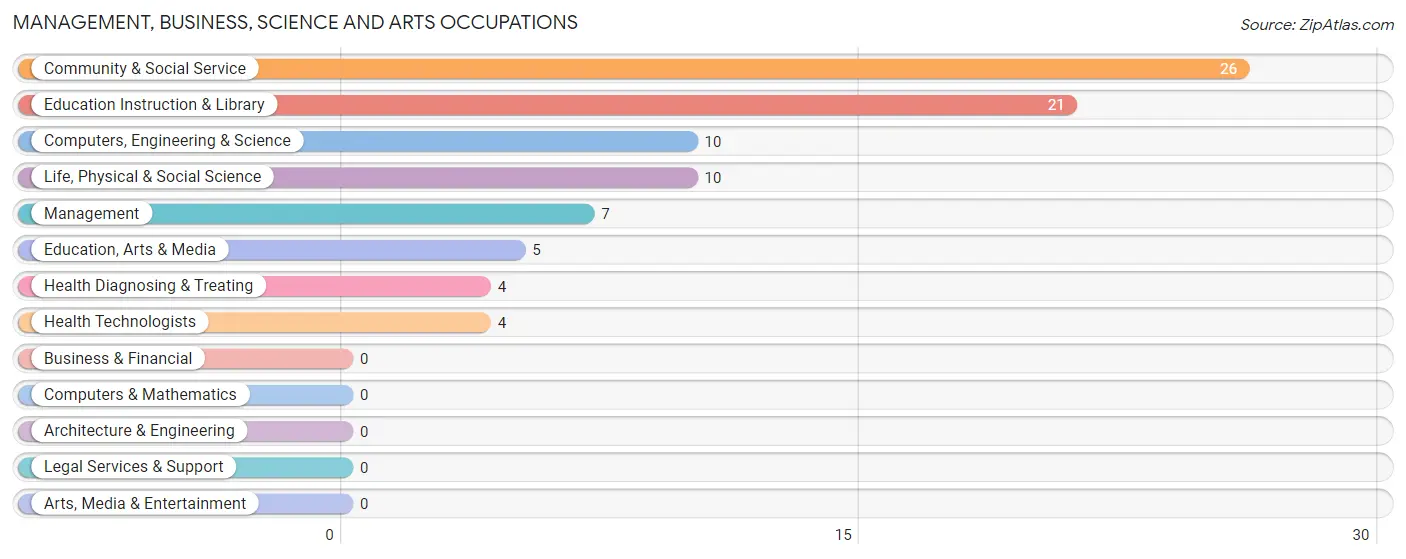
Management, Business, Science and Arts Occupations by Sex
Within the Management, Business, Science and Arts occupations in Richton, the most male-oriented occupations are Computers, Engineering & Science (100.0%), Life, Physical & Social Science (100.0%), and Management (71.4%), while the most female-oriented occupations are Community & Social Service (100.0%), Education, Arts & Media (100.0%), and Education Instruction & Library (100.0%).
| Occupation | Male | Female |
| Management | 5 (71.4%) | 2 (28.6%) |
| Business & Financial | 0 (0.0%) | 0 (0.0%) |
| Computers, Engineering & Science | 10 (100.0%) | 0 (0.0%) |
| Computers & Mathematics | 0 (0.0%) | 0 (0.0%) |
| Architecture & Engineering | 0 (0.0%) | 0 (0.0%) |
| Life, Physical & Social Science | 10 (100.0%) | 0 (0.0%) |
| Community & Social Service | 0 (0.0%) | 26 (100.0%) |
| Education, Arts & Media | 0 (0.0%) | 5 (100.0%) |
| Legal Services & Support | 0 (0.0%) | 0 (0.0%) |
| Education Instruction & Library | 0 (0.0%) | 21 (100.0%) |
| Arts, Media & Entertainment | 0 (0.0%) | 0 (0.0%) |
| Health Diagnosing & Treating | 0 (0.0%) | 4 (100.0%) |
| Health Technologists | 0 (0.0%) | 4 (100.0%) |
| Total (Category) | 15 (31.9%) | 32 (68.1%) |
| Total (Overall) | 213 (57.7%) | 156 (42.3%) |
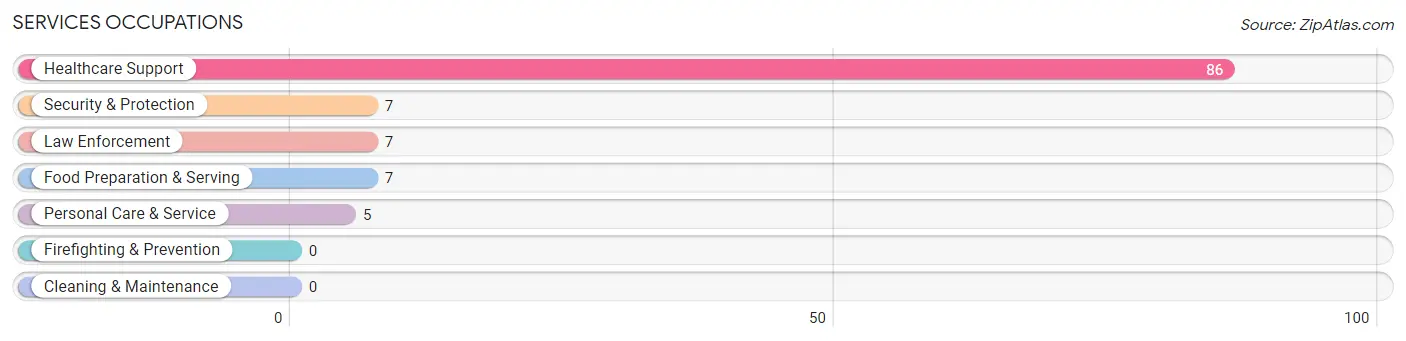
Services Occupations
The most common Services occupations in Richton are Healthcare Support (86 | 23.3%), Security & Protection (7 | 1.9%), Law Enforcement (7 | 1.9%), Food Preparation & Serving (7 | 1.9%), and Personal Care & Service (5 | 1.4%).
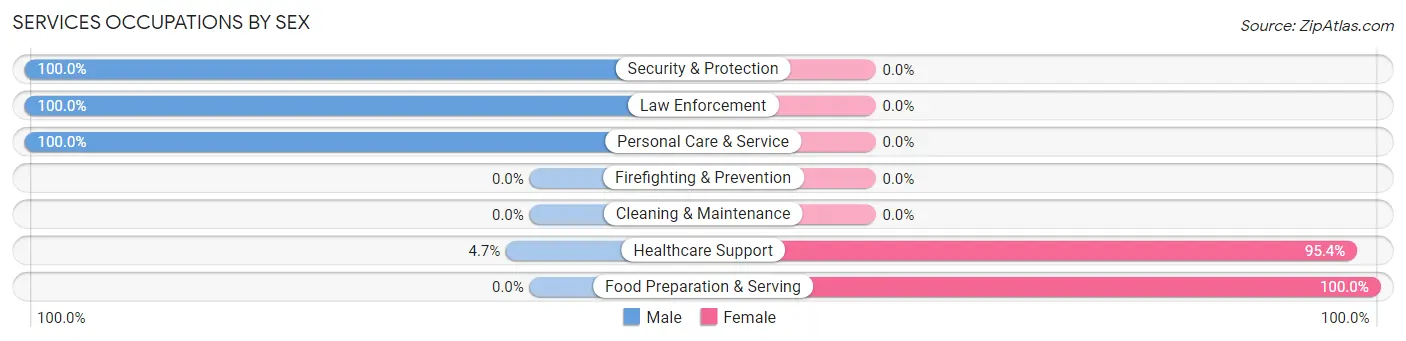
Services Occupations by Sex
Within the Services occupations in Richton, the most male-oriented occupations are Security & Protection (100.0%), Law Enforcement (100.0%), and Personal Care & Service (100.0%), while the most female-oriented occupations are Food Preparation & Serving (100.0%), and Healthcare Support (95.4%).
| Occupation | Male | Female |
| Healthcare Support | 4 (4.6%) | 82 (95.4%) |
| Security & Protection | 7 (100.0%) | 0 (0.0%) |
| Firefighting & Prevention | 0 (0.0%) | 0 (0.0%) |
| Law Enforcement | 7 (100.0%) | 0 (0.0%) |
| Food Preparation & Serving | 0 (0.0%) | 7 (100.0%) |
| Cleaning & Maintenance | 0 (0.0%) | 0 (0.0%) |
| Personal Care & Service | 5 (100.0%) | 0 (0.0%) |
| Total (Category) | 16 (15.2%) | 89 (84.8%) |
| Total (Overall) | 213 (57.7%) | 156 (42.3%) |
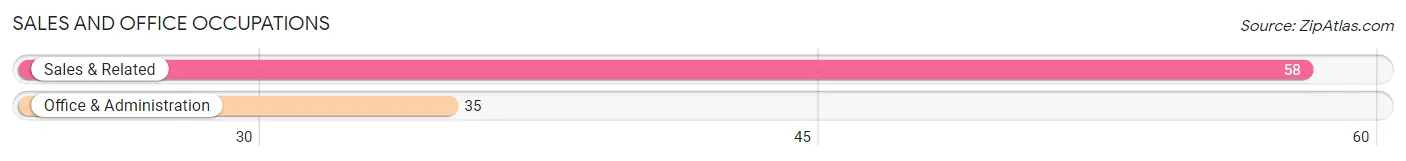
Sales and Office Occupations
The most common Sales and Office occupations in Richton are Sales & Related (58 | 15.7%), and Office & Administration (35 | 9.5%).
Sales and Office Occupations by Sex
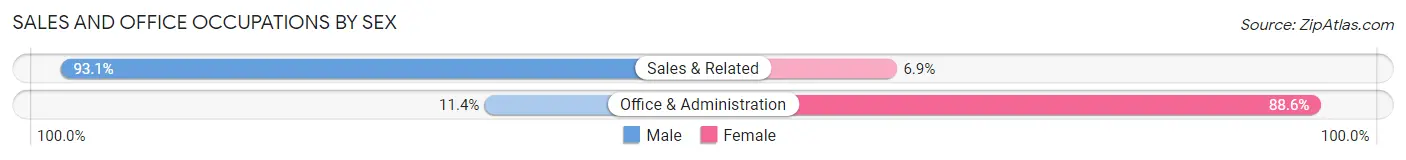
| Occupation | Male | Female |
| Sales & Related | 54 (93.1%) | 4 (6.9%) |
| Office & Administration | 4 (11.4%) | 31 (88.6%) |
| Total (Category) | 58 (62.4%) | 35 (37.6%) |
| Total (Overall) | 213 (57.7%) | 156 (42.3%) |
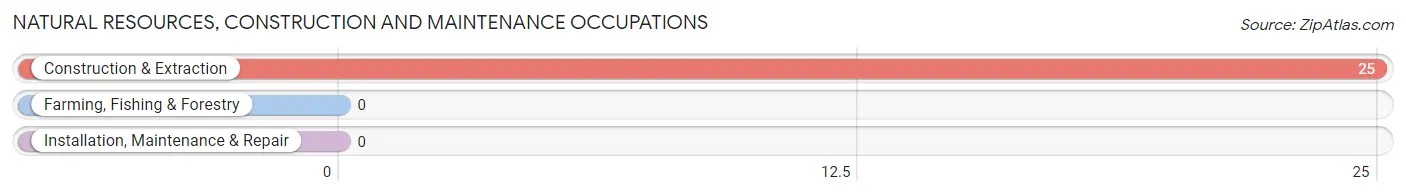
Natural Resources, Construction and Maintenance Occupations
The most common Natural Resources, Construction and Maintenance occupations in Richton are , and Construction & Extraction (25 | 6.8%).
Natural Resources, Construction and Maintenance Occupations by Sex
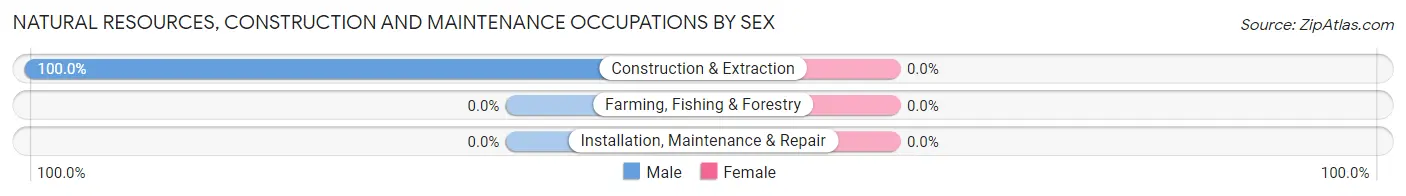
| Occupation | Male | Female |
| Farming, Fishing & Forestry | 0 (0.0%) | 0 (0.0%) |
| Construction & Extraction | 25 (100.0%) | 0 (0.0%) |
| Installation, Maintenance & Repair | 0 (0.0%) | 0 (0.0%) |
| Total (Category) | 25 (100.0%) | 0 (0.0%) |
| Total (Overall) | 213 (57.7%) | 156 (42.3%) |
Production, Transportation and Moving Occupations
The most common Production, Transportation and Moving occupations in Richton are Material Moving (55 | 14.9%), Production (29 | 7.9%), and Transportation (15 | 4.1%).
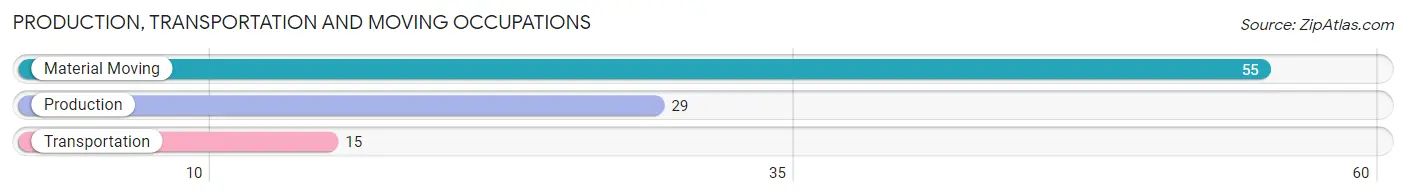
Production, Transportation and Moving Occupations by Sex
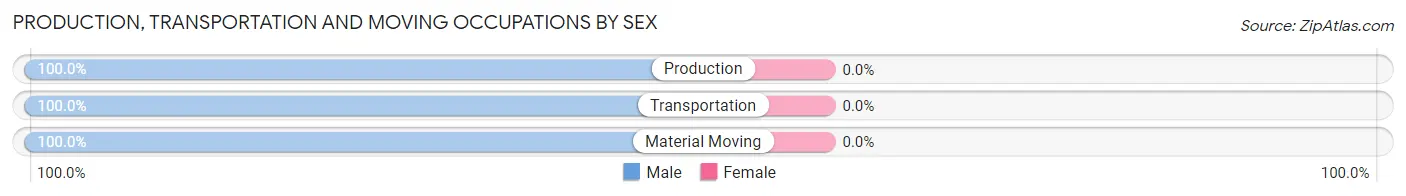
| Occupation | Male | Female |
| Production | 29 (100.0%) | 0 (0.0%) |
| Transportation | 15 (100.0%) | 0 (0.0%) |
| Material Moving | 55 (100.0%) | 0 (0.0%) |
| Total (Category) | 99 (100.0%) | 0 (0.0%) |
| Total (Overall) | 213 (57.7%) | 156 (42.3%) |
Employment Industries by Sex in Richton
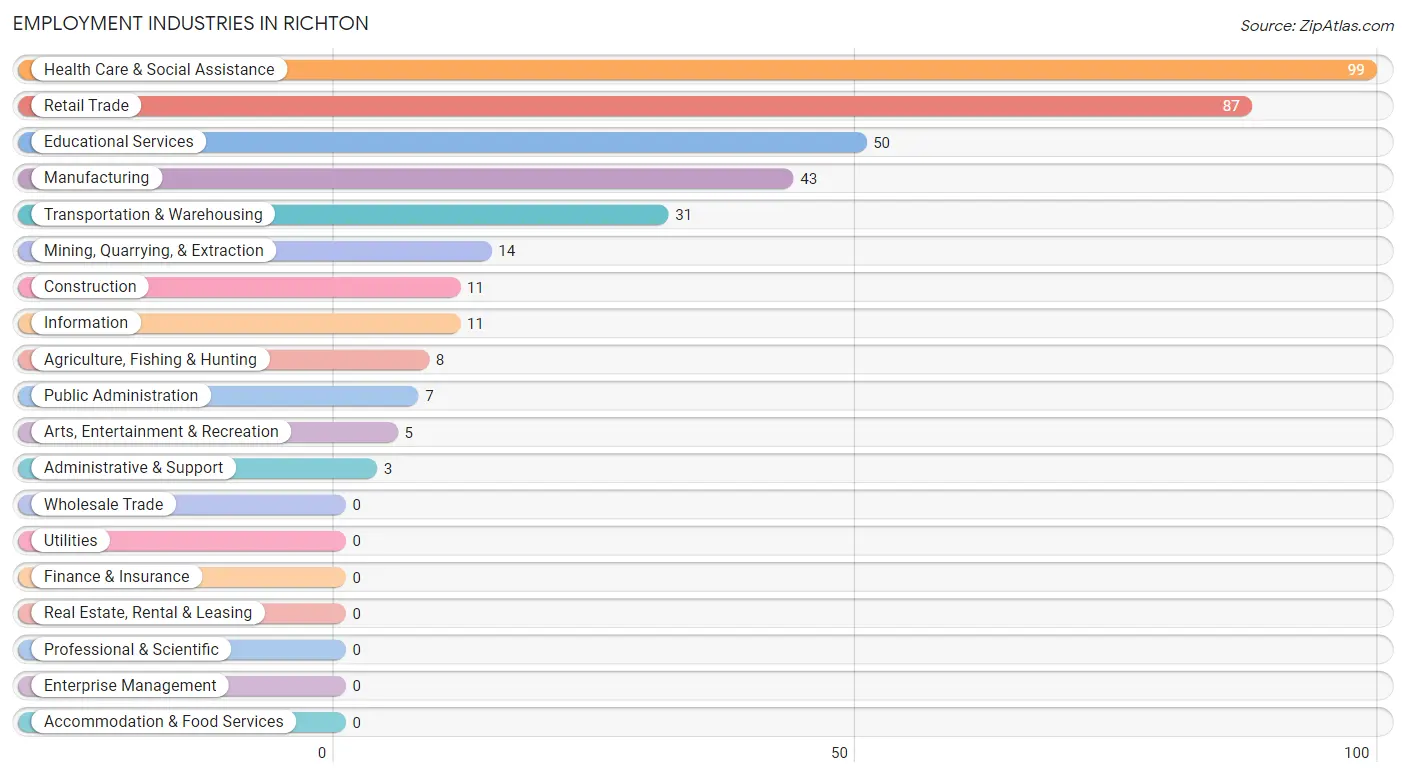
Employment Industries in Richton
The major employment industries in Richton include Health Care & Social Assistance (99 | 26.8%), Retail Trade (87 | 23.6%), Educational Services (50 | 13.6%), Manufacturing (43 | 11.7%), and Transportation & Warehousing (31 | 8.4%).
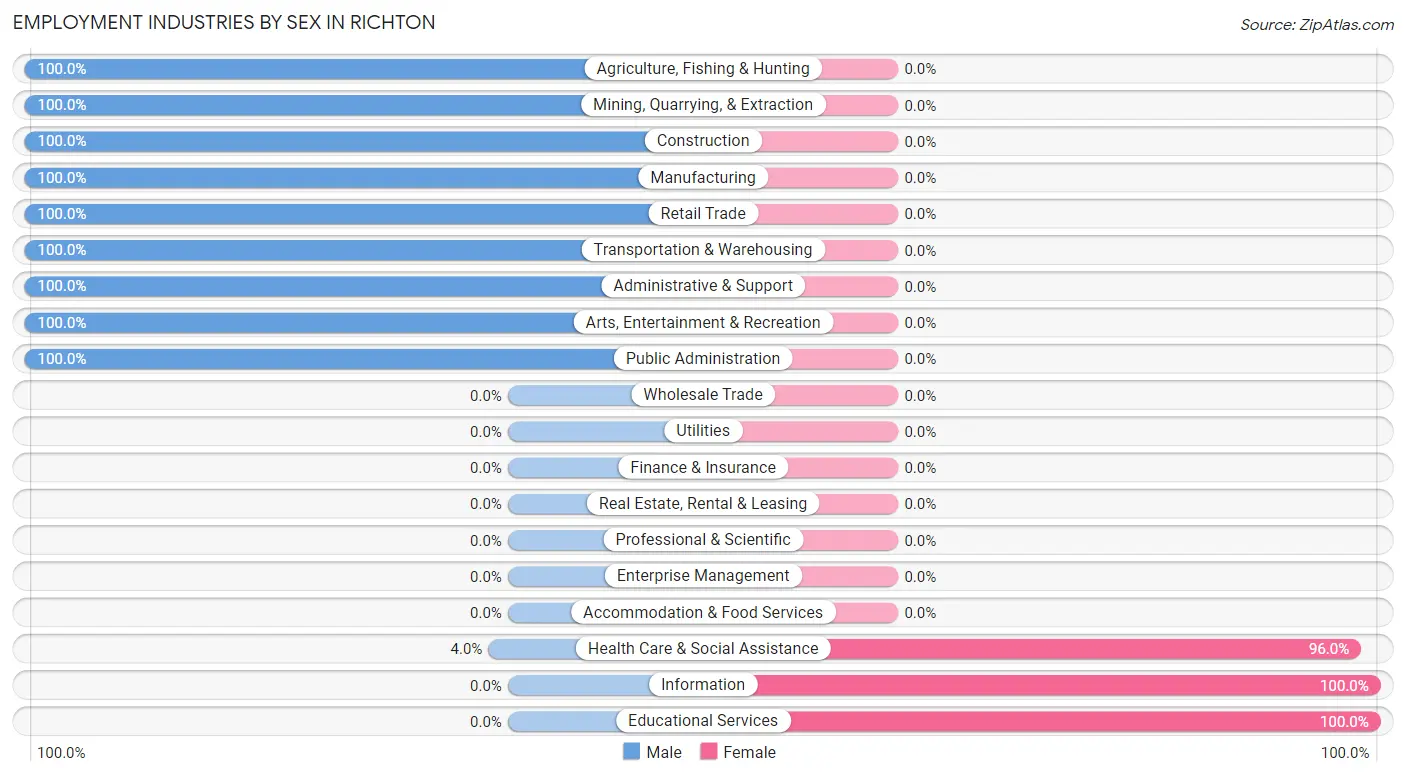
Employment Industries by Sex in Richton
The Richton industries that see more men than women are Agriculture, Fishing & Hunting (100.0%), Mining, Quarrying, & Extraction (100.0%), and Construction (100.0%), whereas the industries that tend to have a higher number of women are Information (100.0%), Educational Services (100.0%), and Health Care & Social Assistance (96.0%).
| Industry | Male | Female |
| Agriculture, Fishing & Hunting | 8 (100.0%) | 0 (0.0%) |
| Mining, Quarrying, & Extraction | 14 (100.0%) | 0 (0.0%) |
| Construction | 11 (100.0%) | 0 (0.0%) |
| Manufacturing | 43 (100.0%) | 0 (0.0%) |
| Wholesale Trade | 0 (0.0%) | 0 (0.0%) |
| Retail Trade | 87 (100.0%) | 0 (0.0%) |
| Transportation & Warehousing | 31 (100.0%) | 0 (0.0%) |
| Utilities | 0 (0.0%) | 0 (0.0%) |
| Information | 0 (0.0%) | 11 (100.0%) |
| Finance & Insurance | 0 (0.0%) | 0 (0.0%) |
| Real Estate, Rental & Leasing | 0 (0.0%) | 0 (0.0%) |
| Professional & Scientific | 0 (0.0%) | 0 (0.0%) |
| Enterprise Management | 0 (0.0%) | 0 (0.0%) |
| Administrative & Support | 3 (100.0%) | 0 (0.0%) |
| Educational Services | 0 (0.0%) | 50 (100.0%) |
| Health Care & Social Assistance | 4 (4.0%) | 95 (96.0%) |
| Arts, Entertainment & Recreation | 5 (100.0%) | 0 (0.0%) |
| Accommodation & Food Services | 0 (0.0%) | 0 (0.0%) |
| Public Administration | 7 (100.0%) | 0 (0.0%) |
| Total | 213 (57.7%) | 156 (42.3%) |
Education in Richton
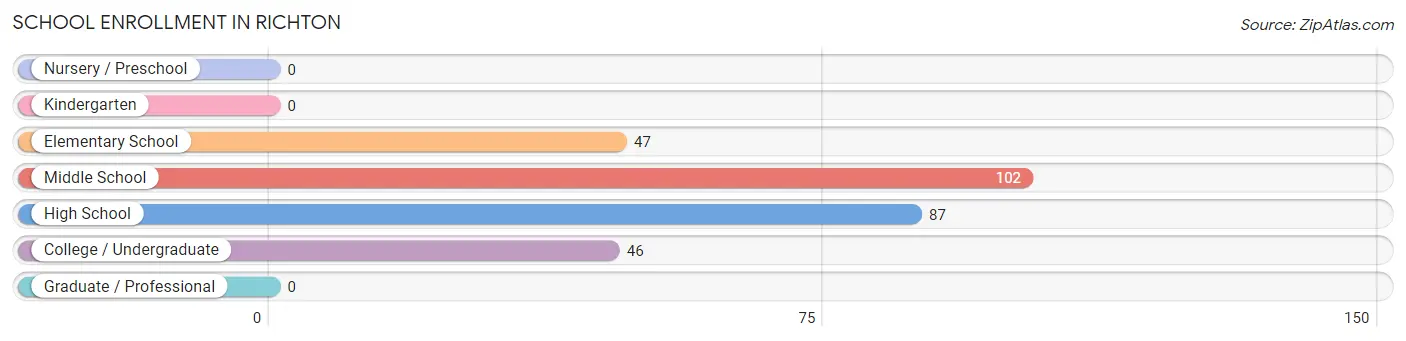
School Enrollment in Richton
The most common levels of schooling among the 282 students in Richton are middle school (102 | 36.2%), high school (87 | 30.8%), and elementary school (47 | 16.7%).
| School Level | # Students | % Students |
| Nursery / Preschool | 0 | 0.0% |
| Kindergarten | 0 | 0.0% |
| Elementary School | 47 | 16.7% |
| Middle School | 102 | 36.2% |
| High School | 87 | 30.8% |
| College / Undergraduate | 46 | 16.3% |
| Graduate / Professional | 0 | 0.0% |
| Total | 282 | 100.0% |
School Enrollment by Age by Funding Source in Richton
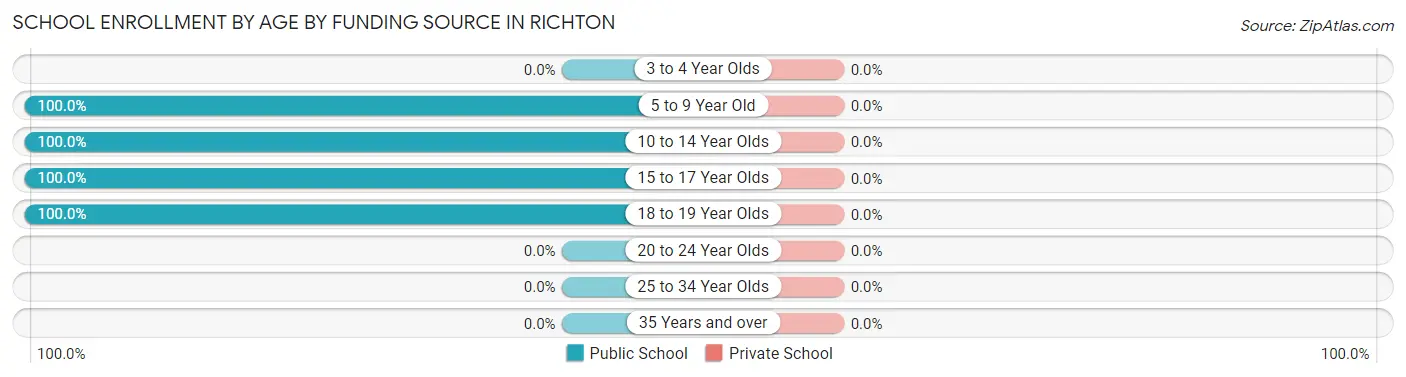
| Age Bracket | Public School | Private School |
| 3 to 4 Year Olds | 0 (0.0%) | 0 (0.0%) |
| 5 to 9 Year Old | 38 (100.0%) | 0 (0.0%) |
| 10 to 14 Year Olds | 120 (100.0%) | 0 (0.0%) |
| 15 to 17 Year Olds | 91 (100.0%) | 0 (0.0%) |
| 18 to 19 Year Olds | 33 (100.0%) | 0 (0.0%) |
| 20 to 24 Year Olds | 0 (0.0%) | 0 (0.0%) |
| 25 to 34 Year Olds | 0 (0.0%) | 0 (0.0%) |
| 35 Years and over | 0 (0.0%) | 0 (0.0%) |
| Total | 282 (100.0%) | 0 (0.0%) |
Educational Attainment by Field of Study in Richton
Education (36 | 26.3%), science & technology (24 | 17.5%), business (22 | 16.1%), physical & health sciences (21 | 15.3%), and arts & humanities (15 | 11.0%) are the most common fields of study among 137 individuals in Richton who have obtained a bachelor's degree or higher.
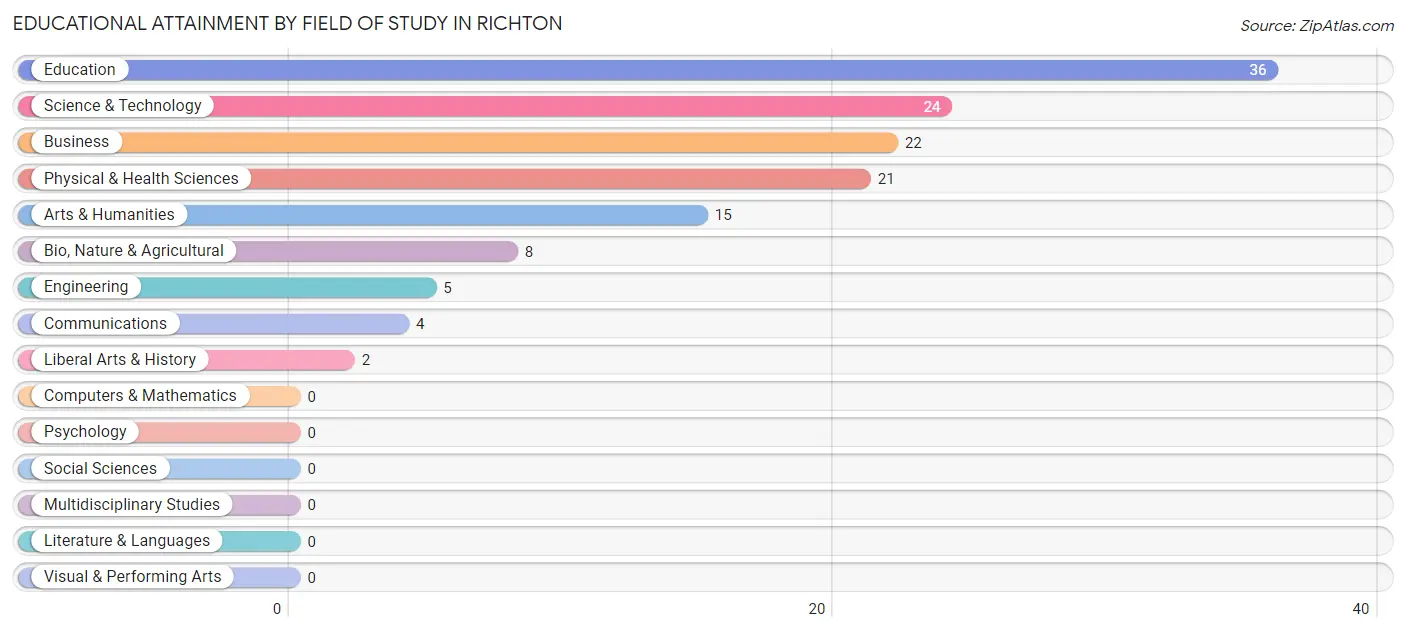
| Field of Study | # Graduates | % Graduates |
| Computers & Mathematics | 0 | 0.0% |
| Bio, Nature & Agricultural | 8 | 5.8% |
| Physical & Health Sciences | 21 | 15.3% |
| Psychology | 0 | 0.0% |
| Social Sciences | 0 | 0.0% |
| Engineering | 5 | 3.6% |
| Multidisciplinary Studies | 0 | 0.0% |
| Science & Technology | 24 | 17.5% |
| Business | 22 | 16.1% |
| Education | 36 | 26.3% |
| Literature & Languages | 0 | 0.0% |
| Liberal Arts & History | 2 | 1.5% |
| Visual & Performing Arts | 0 | 0.0% |
| Communications | 4 | 2.9% |
| Arts & Humanities | 15 | 11.0% |
| Total | 137 | 100.0% |
Transportation & Commute in Richton
Vehicle Availability by Sex in Richton
The most prevalent vehicle ownership categories in Richton are males with 5 or more vehicles (95, accounting for 43.8%) and females with 5 or more vehicles (24, making up 60.9%).
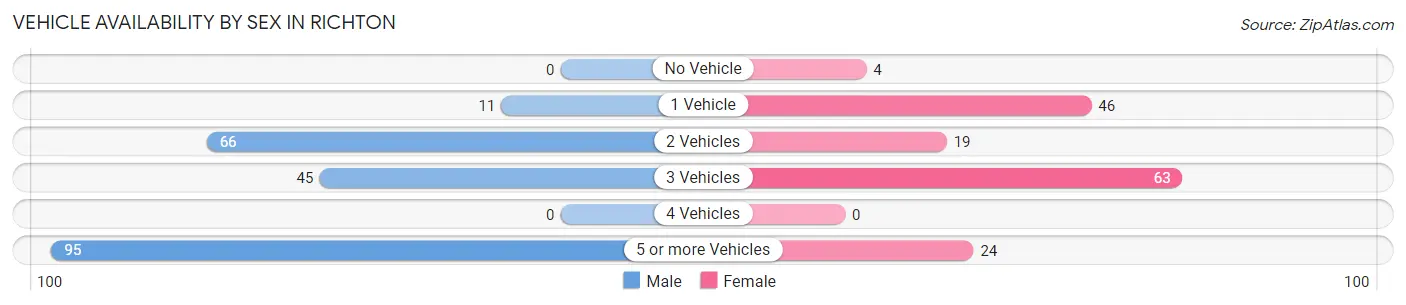
| Vehicles Available | Male | Female |
| No Vehicle | 0 (0.0%) | 4 (2.6%) |
| 1 Vehicle | 11 (5.1%) | 46 (29.5%) |
| 2 Vehicles | 66 (30.4%) | 19 (12.2%) |
| 3 Vehicles | 45 (20.7%) | 63 (40.4%) |
| 4 Vehicles | 0 (0.0%) | 0 (0.0%) |
| 5 or more Vehicles | 95 (43.8%) | 24 (15.4%) |
| Total | 217 (100.0%) | 156 (100.0%) |
Commute Time in Richton
The most frequently occuring commute durations in Richton are 5 to 9 minutes (85 commuters, 23.1%), less than 5 minutes (70 commuters, 19.0%), and 20 to 24 minutes (62 commuters, 16.9%).
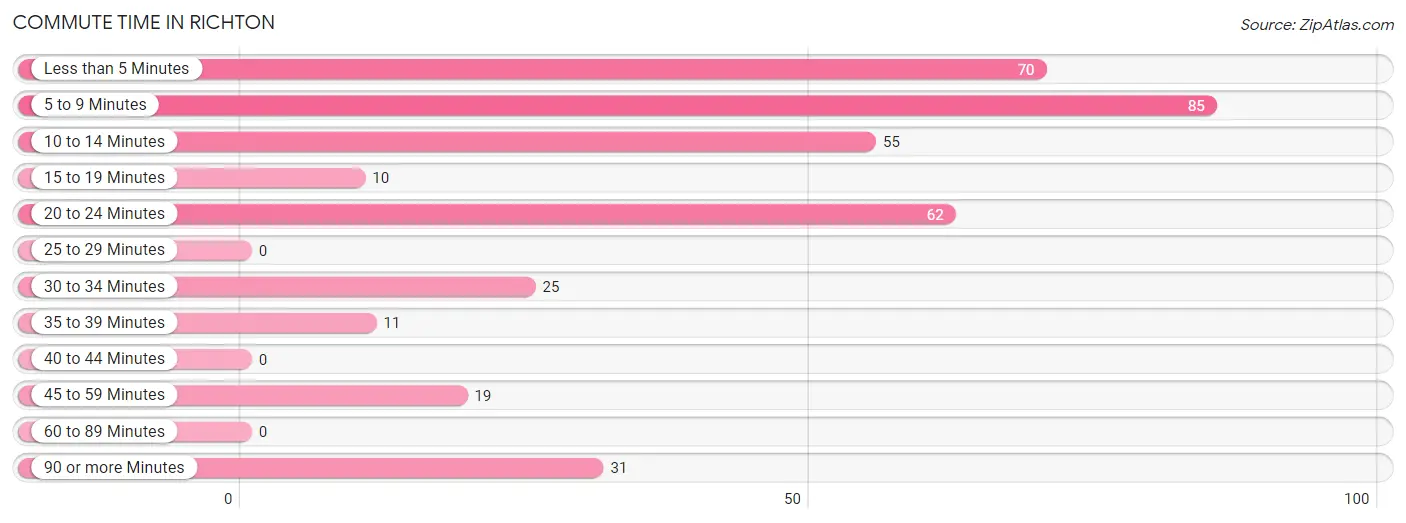
| Commute Time | # Commuters | % Commuters |
| Less than 5 Minutes | 70 | 19.0% |
| 5 to 9 Minutes | 85 | 23.1% |
| 10 to 14 Minutes | 55 | 14.9% |
| 15 to 19 Minutes | 10 | 2.7% |
| 20 to 24 Minutes | 62 | 16.9% |
| 25 to 29 Minutes | 0 | 0.0% |
| 30 to 34 Minutes | 25 | 6.8% |
| 35 to 39 Minutes | 11 | 3.0% |
| 40 to 44 Minutes | 0 | 0.0% |
| 45 to 59 Minutes | 19 | 5.2% |
| 60 to 89 Minutes | 0 | 0.0% |
| 90 or more Minutes | 31 | 8.4% |
Commute Time by Sex in Richton
The most common commute times in Richton are 20 to 24 minutes (62 commuters, 28.7%) for males and 10 to 14 minutes (52 commuters, 34.2%) for females.
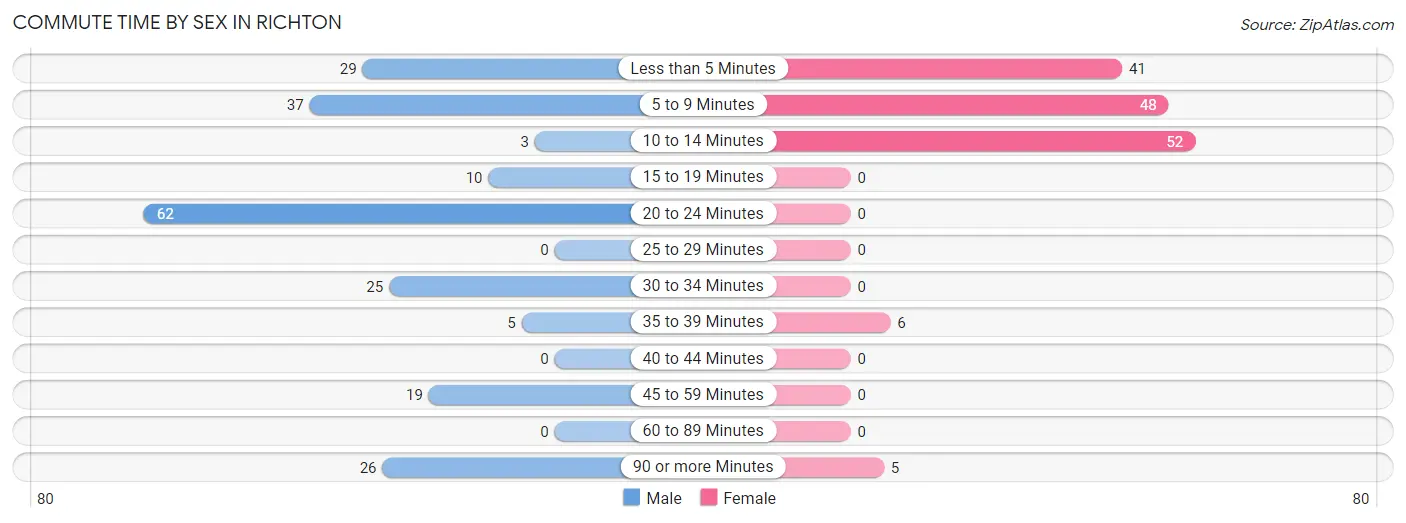
| Commute Time | Male | Female |
| Less than 5 Minutes | 29 (13.4%) | 41 (27.0%) |
| 5 to 9 Minutes | 37 (17.1%) | 48 (31.6%) |
| 10 to 14 Minutes | 3 (1.4%) | 52 (34.2%) |
| 15 to 19 Minutes | 10 (4.6%) | 0 (0.0%) |
| 20 to 24 Minutes | 62 (28.7%) | 0 (0.0%) |
| 25 to 29 Minutes | 0 (0.0%) | 0 (0.0%) |
| 30 to 34 Minutes | 25 (11.6%) | 0 (0.0%) |
| 35 to 39 Minutes | 5 (2.3%) | 6 (4.0%) |
| 40 to 44 Minutes | 0 (0.0%) | 0 (0.0%) |
| 45 to 59 Minutes | 19 (8.8%) | 0 (0.0%) |
| 60 to 89 Minutes | 0 (0.0%) | 0 (0.0%) |
| 90 or more Minutes | 26 (12.0%) | 5 (3.3%) |
Time of Departure to Work by Sex in Richton
The most frequent times of departure to work in Richton are 12:00 PM to 3:59 PM (92, 42.6%) for males and 7:00 AM to 7:29 AM (63, 41.4%) for females.
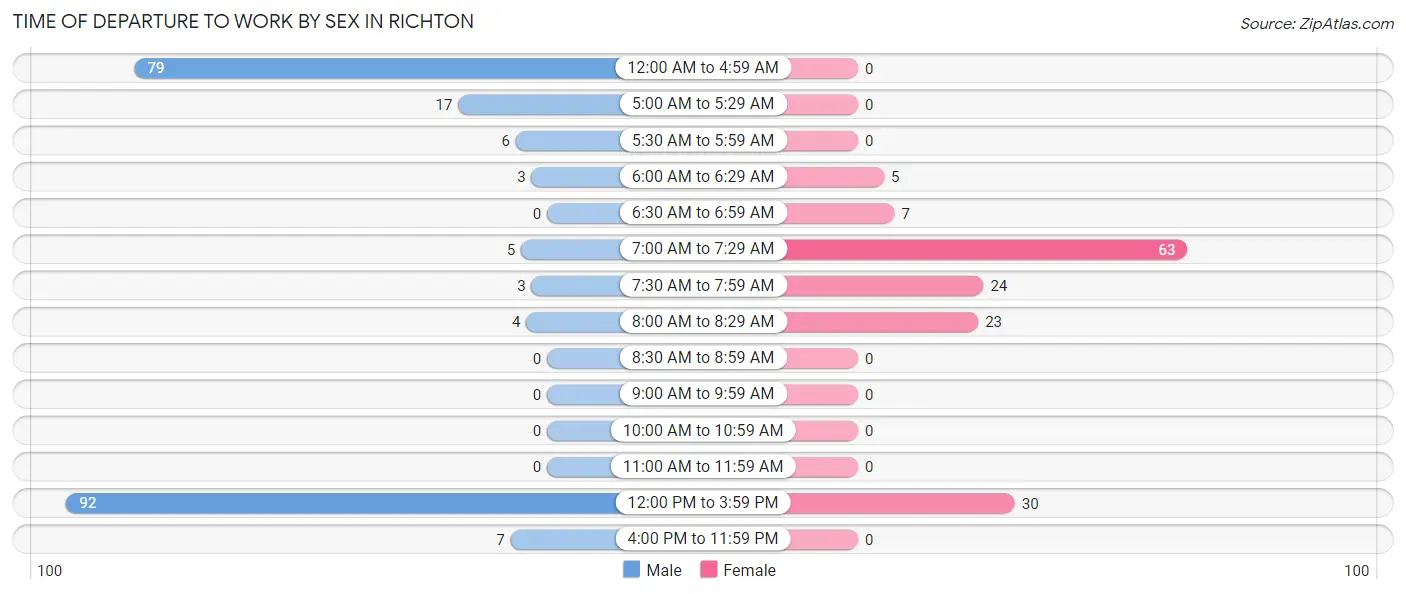
| Time of Departure | Male | Female |
| 12:00 AM to 4:59 AM | 79 (36.6%) | 0 (0.0%) |
| 5:00 AM to 5:29 AM | 17 (7.9%) | 0 (0.0%) |
| 5:30 AM to 5:59 AM | 6 (2.8%) | 0 (0.0%) |
| 6:00 AM to 6:29 AM | 3 (1.4%) | 5 (3.3%) |
| 6:30 AM to 6:59 AM | 0 (0.0%) | 7 (4.6%) |
| 7:00 AM to 7:29 AM | 5 (2.3%) | 63 (41.4%) |
| 7:30 AM to 7:59 AM | 3 (1.4%) | 24 (15.8%) |
| 8:00 AM to 8:29 AM | 4 (1.8%) | 23 (15.1%) |
| 8:30 AM to 8:59 AM | 0 (0.0%) | 0 (0.0%) |
| 9:00 AM to 9:59 AM | 0 (0.0%) | 0 (0.0%) |
| 10:00 AM to 10:59 AM | 0 (0.0%) | 0 (0.0%) |
| 11:00 AM to 11:59 AM | 0 (0.0%) | 0 (0.0%) |
| 12:00 PM to 3:59 PM | 92 (42.6%) | 30 (19.7%) |
| 4:00 PM to 11:59 PM | 7 (3.2%) | 0 (0.0%) |
| Total | 216 (100.0%) | 152 (100.0%) |
Housing Occupancy in Richton
Occupancy by Ownership in Richton
Of the total 393 dwellings in Richton, owner-occupied units account for 272 (69.2%), while renter-occupied units make up 121 (30.8%).
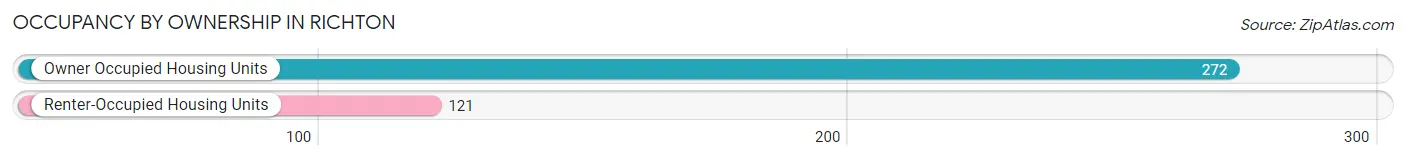
| Occupancy | # Housing Units | % Housing Units |
| Owner Occupied Housing Units | 272 | 69.2% |
| Renter-Occupied Housing Units | 121 | 30.8% |
| Total Occupied Housing Units | 393 | 100.0% |
Occupancy by Household Size in Richton
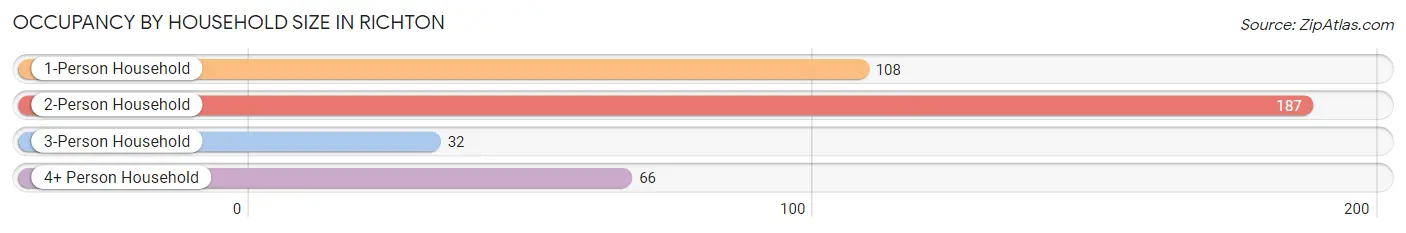
| Household Size | # Housing Units | % Housing Units |
| 1-Person Household | 108 | 27.5% |
| 2-Person Household | 187 | 47.6% |
| 3-Person Household | 32 | 8.1% |
| 4+ Person Household | 66 | 16.8% |
| Total Housing Units | 393 | 100.0% |
Occupancy by Ownership by Household Size in Richton
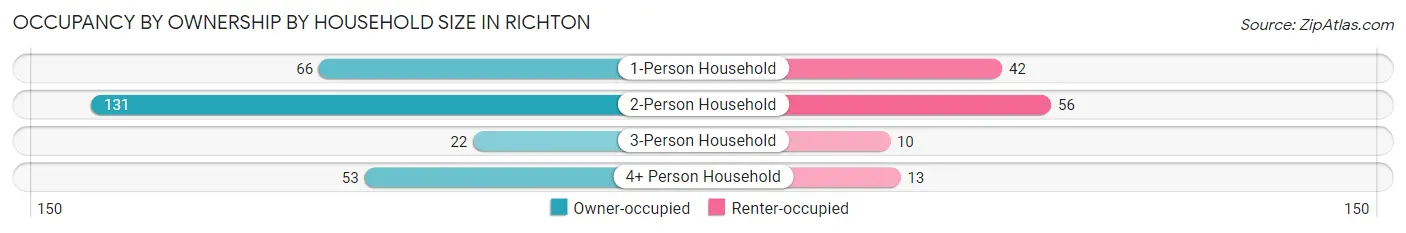
| Household Size | Owner-occupied | Renter-occupied |
| 1-Person Household | 66 (61.1%) | 42 (38.9%) |
| 2-Person Household | 131 (70.1%) | 56 (29.9%) |
| 3-Person Household | 22 (68.8%) | 10 (31.2%) |
| 4+ Person Household | 53 (80.3%) | 13 (19.7%) |
| Total Housing Units | 272 (69.2%) | 121 (30.8%) |
Occupancy by Educational Attainment in Richton
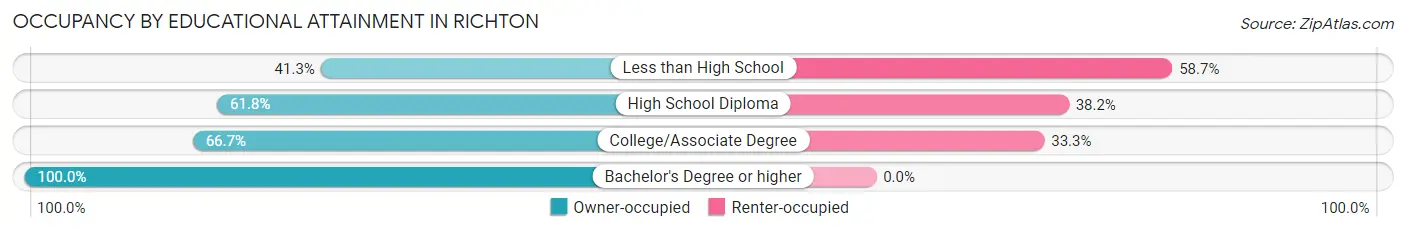
| Household Size | Owner-occupied | Renter-occupied |
| Less than High School | 19 (41.3%) | 27 (58.7%) |
| High School Diploma | 81 (61.8%) | 50 (38.2%) |
| College/Associate Degree | 88 (66.7%) | 44 (33.3%) |
| Bachelor's Degree or higher | 84 (100.0%) | 0 (0.0%) |
Occupancy by Age of Householder in Richton
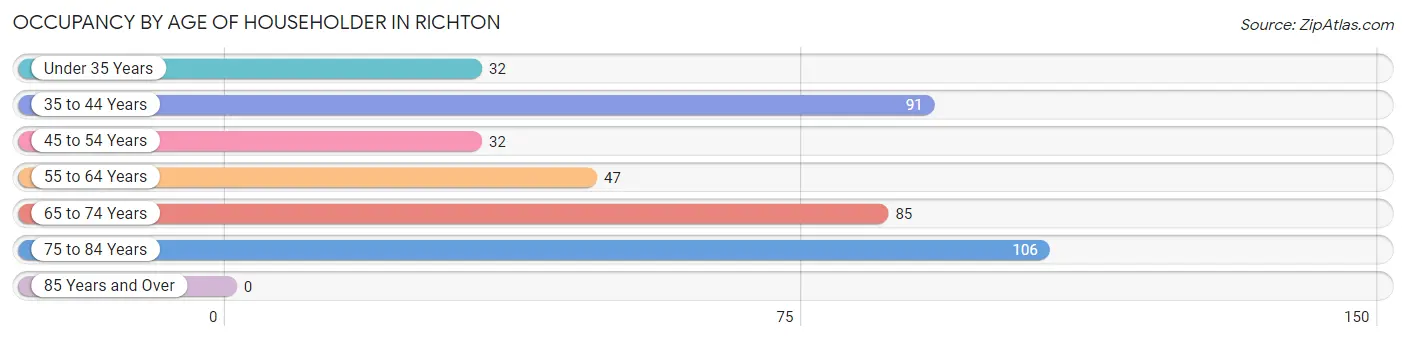
| Age Bracket | # Households | % Households |
| Under 35 Years | 32 | 8.1% |
| 35 to 44 Years | 91 | 23.2% |
| 45 to 54 Years | 32 | 8.1% |
| 55 to 64 Years | 47 | 12.0% |
| 65 to 74 Years | 85 | 21.6% |
| 75 to 84 Years | 106 | 27.0% |
| 85 Years and Over | 0 | 0.0% |
| Total | 393 | 100.0% |
Housing Finances in Richton
Median Income by Occupancy in Richton
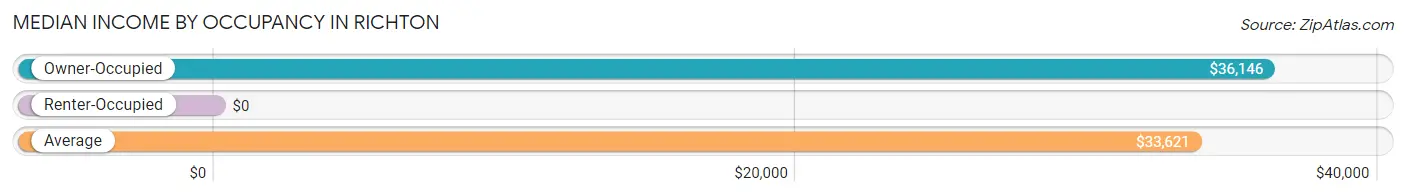
| Occupancy Type | # Households | Median Income |
| Owner-Occupied | 272 (69.2%) | $36,146 |
| Renter-Occupied | 121 (30.8%) | $0 |
| Average | 393 (100.0%) | $33,621 |
Occupancy by Householder Income Bracket in Richton
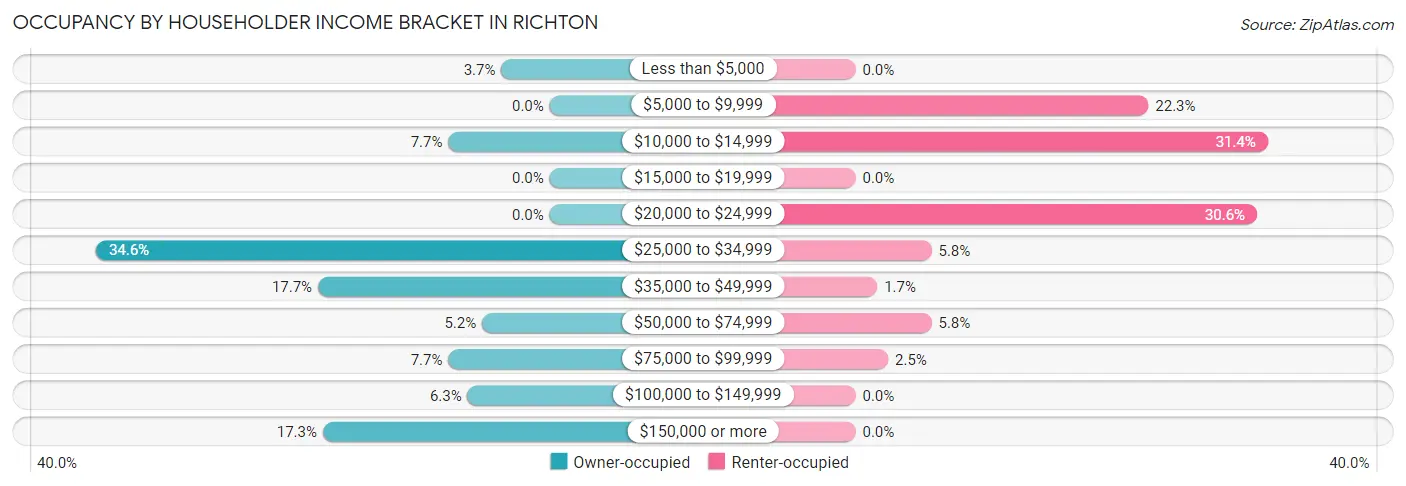
| Income Bracket | Owner-occupied | Renter-occupied |
| Less than $5,000 | 10 (3.7%) | 0 (0.0%) |
| $5,000 to $9,999 | 0 (0.0%) | 27 (22.3%) |
| $10,000 to $14,999 | 21 (7.7%) | 38 (31.4%) |
| $15,000 to $19,999 | 0 (0.0%) | 0 (0.0%) |
| $20,000 to $24,999 | 0 (0.0%) | 37 (30.6%) |
| $25,000 to $34,999 | 94 (34.6%) | 7 (5.8%) |
| $35,000 to $49,999 | 48 (17.6%) | 2 (1.7%) |
| $50,000 to $74,999 | 14 (5.1%) | 7 (5.8%) |
| $75,000 to $99,999 | 21 (7.7%) | 3 (2.5%) |
| $100,000 to $149,999 | 17 (6.2%) | 0 (0.0%) |
| $150,000 or more | 47 (17.3%) | 0 (0.0%) |
| Total | 272 (100.0%) | 121 (100.0%) |
Monthly Housing Cost Tiers in Richton
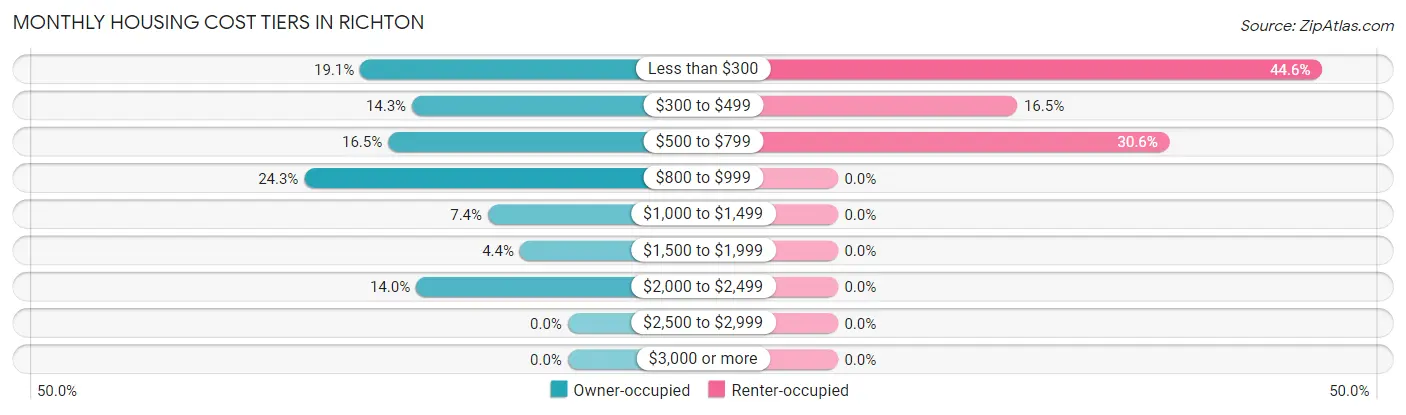
| Monthly Cost | Owner-occupied | Renter-occupied |
| Less than $300 | 52 (19.1%) | 54 (44.6%) |
| $300 to $499 | 39 (14.3%) | 20 (16.5%) |
| $500 to $799 | 45 (16.5%) | 37 (30.6%) |
| $800 to $999 | 66 (24.3%) | 0 (0.0%) |
| $1,000 to $1,499 | 20 (7.3%) | 0 (0.0%) |
| $1,500 to $1,999 | 12 (4.4%) | 0 (0.0%) |
| $2,000 to $2,499 | 38 (14.0%) | 0 (0.0%) |
| $2,500 to $2,999 | 0 (0.0%) | 0 (0.0%) |
| $3,000 or more | 0 (0.0%) | 0 (0.0%) |
| Total | 272 (100.0%) | 121 (100.0%) |
Physical Housing Characteristics in Richton
Housing Structures in Richton
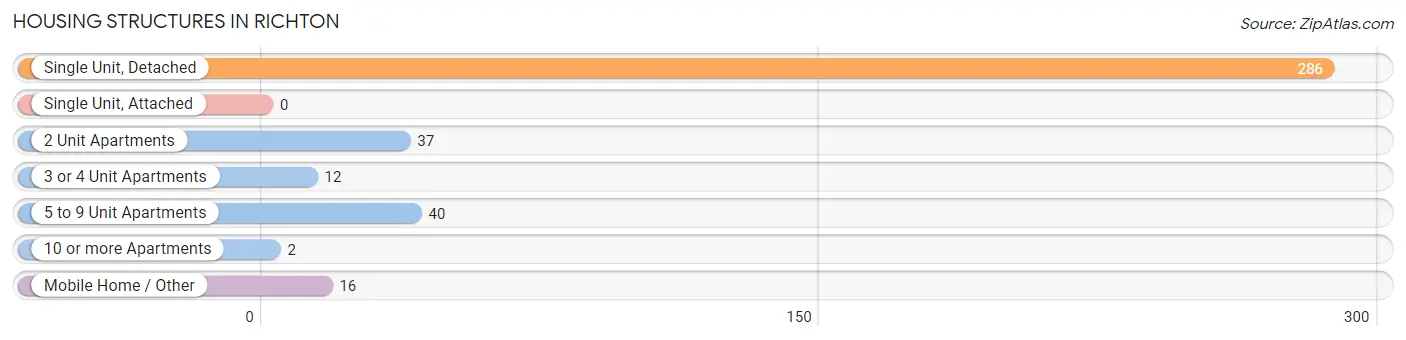
| Structure Type | # Housing Units | % Housing Units |
| Single Unit, Detached | 286 | 72.8% |
| Single Unit, Attached | 0 | 0.0% |
| 2 Unit Apartments | 37 | 9.4% |
| 3 or 4 Unit Apartments | 12 | 3.0% |
| 5 to 9 Unit Apartments | 40 | 10.2% |
| 10 or more Apartments | 2 | 0.5% |
| Mobile Home / Other | 16 | 4.1% |
| Total | 393 | 100.0% |
Housing Structures by Occupancy in Richton
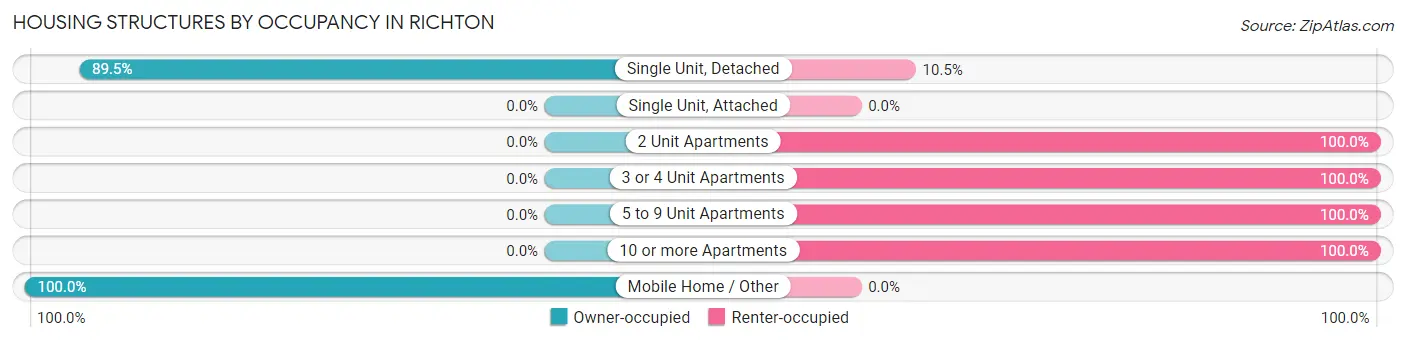
| Structure Type | Owner-occupied | Renter-occupied |
| Single Unit, Detached | 256 (89.5%) | 30 (10.5%) |
| Single Unit, Attached | 0 (0.0%) | 0 (0.0%) |
| 2 Unit Apartments | 0 (0.0%) | 37 (100.0%) |
| 3 or 4 Unit Apartments | 0 (0.0%) | 12 (100.0%) |
| 5 to 9 Unit Apartments | 0 (0.0%) | 40 (100.0%) |
| 10 or more Apartments | 0 (0.0%) | 2 (100.0%) |
| Mobile Home / Other | 16 (100.0%) | 0 (0.0%) |
| Total | 272 (69.2%) | 121 (30.8%) |
Housing Structures by Number of Rooms in Richton
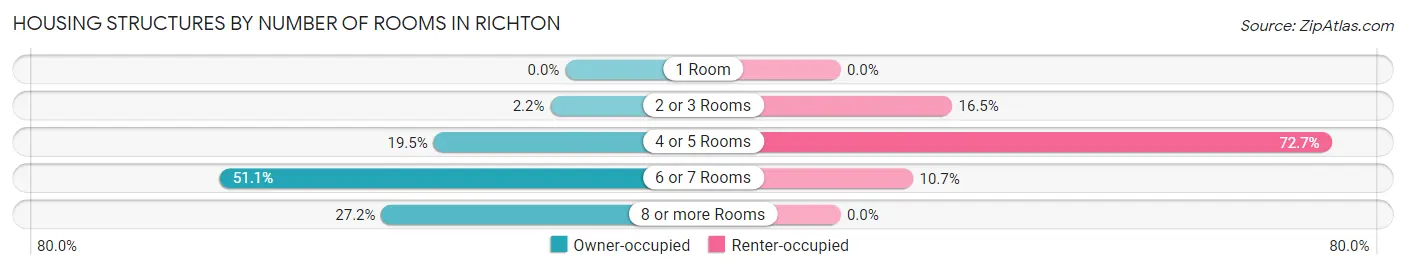
| Number of Rooms | Owner-occupied | Renter-occupied |
| 1 Room | 0 (0.0%) | 0 (0.0%) |
| 2 or 3 Rooms | 6 (2.2%) | 20 (16.5%) |
| 4 or 5 Rooms | 53 (19.5%) | 88 (72.7%) |
| 6 or 7 Rooms | 139 (51.1%) | 13 (10.7%) |
| 8 or more Rooms | 74 (27.2%) | 0 (0.0%) |
| Total | 272 (100.0%) | 121 (100.0%) |
Housing Structure by Heating Type in Richton
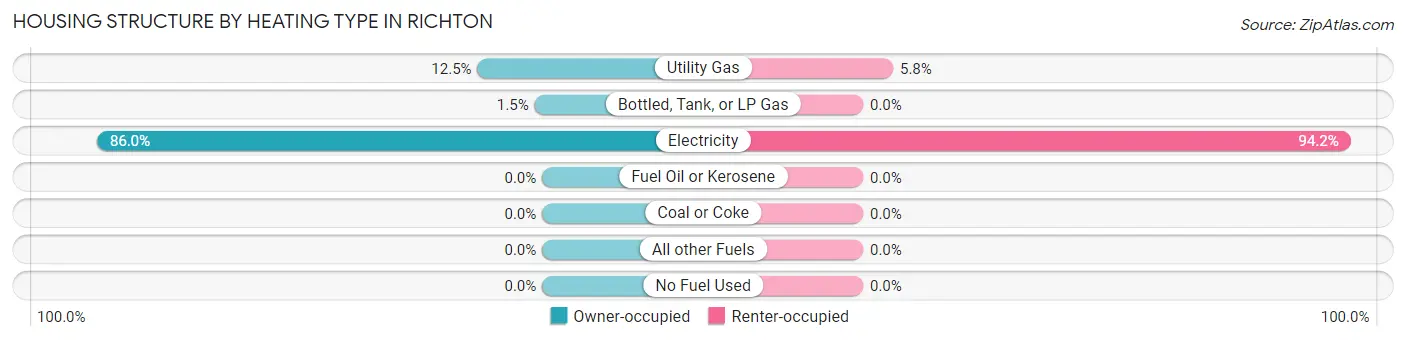
| Heating Type | Owner-occupied | Renter-occupied |
| Utility Gas | 34 (12.5%) | 7 (5.8%) |
| Bottled, Tank, or LP Gas | 4 (1.5%) | 0 (0.0%) |
| Electricity | 234 (86.0%) | 114 (94.2%) |
| Fuel Oil or Kerosene | 0 (0.0%) | 0 (0.0%) |
| Coal or Coke | 0 (0.0%) | 0 (0.0%) |
| All other Fuels | 0 (0.0%) | 0 (0.0%) |
| No Fuel Used | 0 (0.0%) | 0 (0.0%) |
| Total | 272 (100.0%) | 121 (100.0%) |
Household Vehicle Usage in Richton
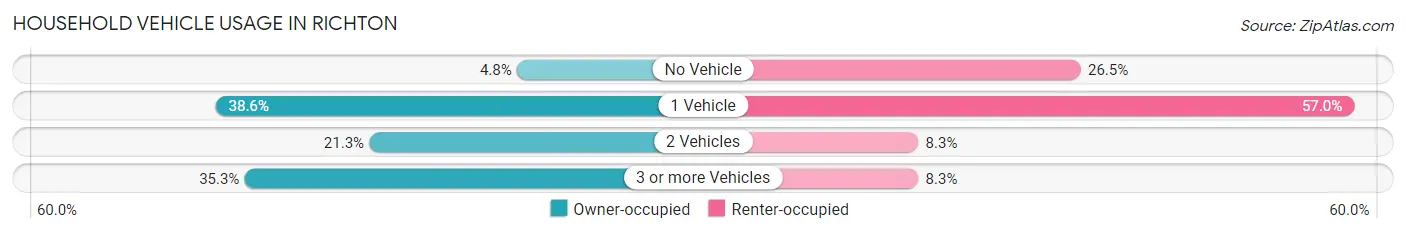
| Vehicles per Household | Owner-occupied | Renter-occupied |
| No Vehicle | 13 (4.8%) | 32 (26.5%) |
| 1 Vehicle | 105 (38.6%) | 69 (57.0%) |
| 2 Vehicles | 58 (21.3%) | 10 (8.3%) |
| 3 or more Vehicles | 96 (35.3%) | 10 (8.3%) |
| Total | 272 (100.0%) | 121 (100.0%) |
Real Estate & Mortgages in Richton
Real Estate and Mortgage Overview in Richton
| Characteristic | Without Mortgage | With Mortgage |
| Housing Units | 120 | 152 |
| Median Property Value | $135,000 | $146,700 |
| Median Household Income | $32,197 | $39 |
| Monthly Housing Costs | $371 | $0 |
| Real Estate Taxes | $1,094 | $80 |
Property Value by Mortgage Status in Richton
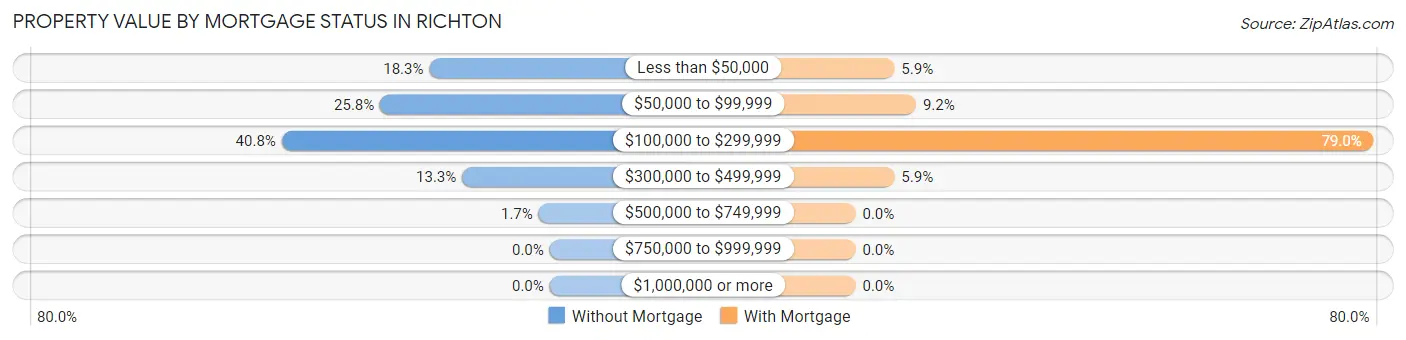
| Property Value | Without Mortgage | With Mortgage |
| Less than $50,000 | 22 (18.3%) | 9 (5.9%) |
| $50,000 to $99,999 | 31 (25.8%) | 14 (9.2%) |
| $100,000 to $299,999 | 49 (40.8%) | 120 (78.9%) |
| $300,000 to $499,999 | 16 (13.3%) | 9 (5.9%) |
| $500,000 to $749,999 | 2 (1.7%) | 0 (0.0%) |
| $750,000 to $999,999 | 0 (0.0%) | 0 (0.0%) |
| $1,000,000 or more | 0 (0.0%) | 0 (0.0%) |
| Total | 120 (100.0%) | 152 (100.0%) |
Household Income by Mortgage Status in Richton
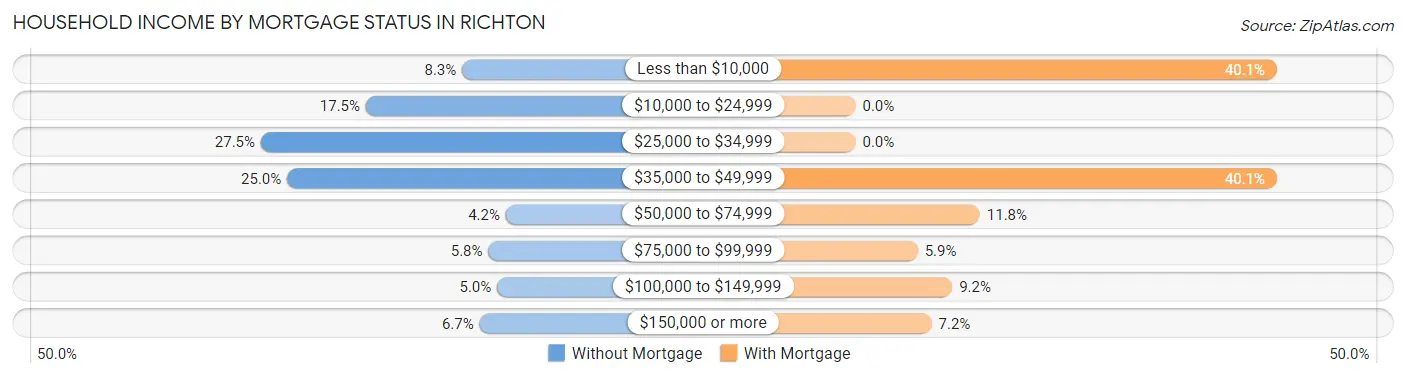
| Household Income | Without Mortgage | With Mortgage |
| Less than $10,000 | 10 (8.3%) | 61 (40.1%) |
| $10,000 to $24,999 | 21 (17.5%) | 0 (0.0%) |
| $25,000 to $34,999 | 33 (27.5%) | 0 (0.0%) |
| $35,000 to $49,999 | 30 (25.0%) | 61 (40.1%) |
| $50,000 to $74,999 | 5 (4.2%) | 18 (11.8%) |
| $75,000 to $99,999 | 7 (5.8%) | 9 (5.9%) |
| $100,000 to $149,999 | 6 (5.0%) | 14 (9.2%) |
| $150,000 or more | 8 (6.7%) | 11 (7.2%) |
| Total | 120 (100.0%) | 152 (100.0%) |
Property Value to Household Income Ratio in Richton
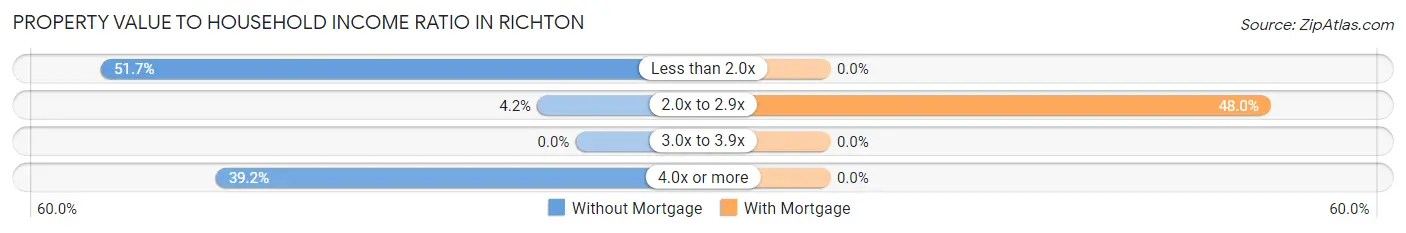
| Value-to-Income Ratio | Without Mortgage | With Mortgage |
| Less than 2.0x | 62 (51.7%) | 0 (0.0%) |
| 2.0x to 2.9x | 5 (4.2%) | 73 (48.0%) |
| 3.0x to 3.9x | 0 (0.0%) | 0 (0.0%) |
| 4.0x or more | 47 (39.2%) | 0 (0.0%) |
| Total | 120 (100.0%) | 152 (100.0%) |
Real Estate Taxes by Mortgage Status in Richton
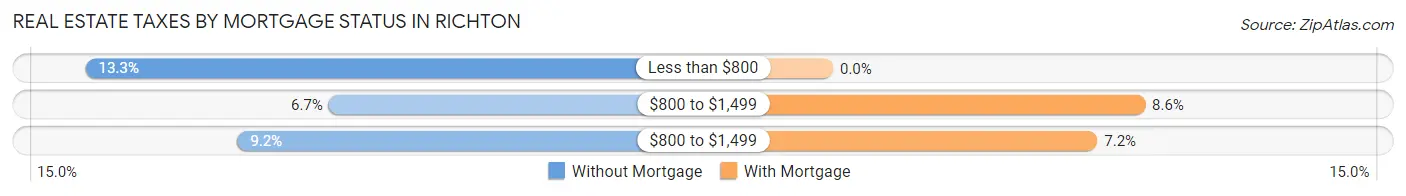
| Property Taxes | Without Mortgage | With Mortgage |
| Less than $800 | 16 (13.3%) | 0 (0.0%) |
| $800 to $1,499 | 8 (6.7%) | 13 (8.6%) |
| $800 to $1,499 | 11 (9.2%) | 11 (7.2%) |
| Total | 120 (100.0%) | 152 (100.0%) |
Health & Disability in Richton
Health Insurance Coverage by Age in Richton
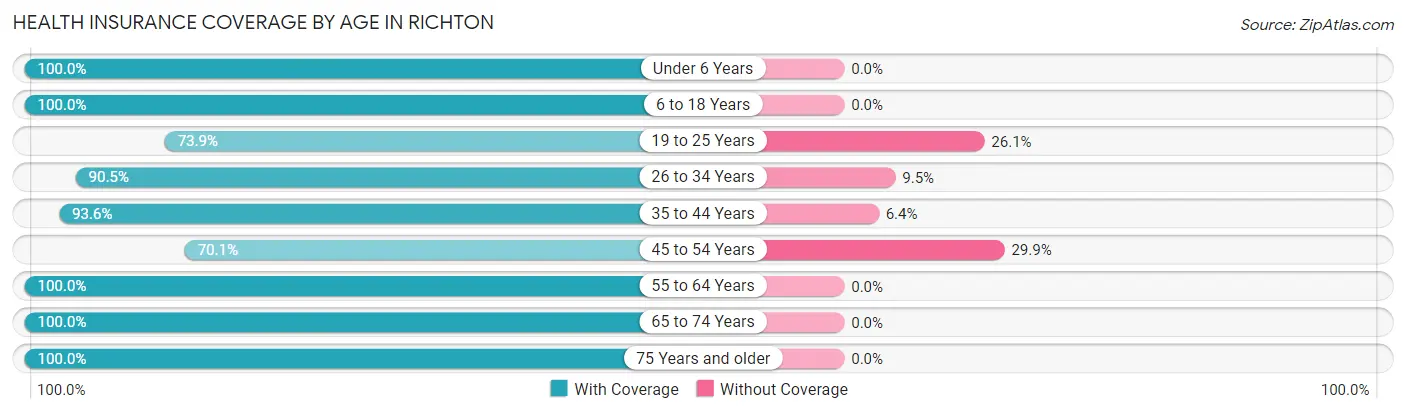
| Age Bracket | With Coverage | Without Coverage |
| Under 6 Years | 47 (100.0%) | 0 (0.0%) |
| 6 to 18 Years | 249 (100.0%) | 0 (0.0%) |
| 19 to 25 Years | 82 (73.9%) | 29 (26.1%) |
| 26 to 34 Years | 38 (90.5%) | 4 (9.5%) |
| 35 to 44 Years | 175 (93.6%) | 12 (6.4%) |
| 45 to 54 Years | 54 (70.1%) | 23 (29.9%) |
| 55 to 64 Years | 88 (100.0%) | 0 (0.0%) |
| 65 to 74 Years | 96 (100.0%) | 0 (0.0%) |
| 75 Years and older | 162 (100.0%) | 0 (0.0%) |
| Total | 991 (93.6%) | 68 (6.4%) |
Health Insurance Coverage by Citizenship Status in Richton
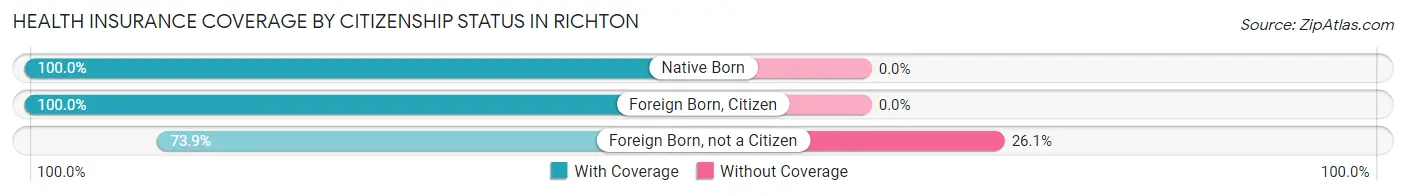
| Citizenship Status | With Coverage | Without Coverage |
| Native Born | 47 (100.0%) | 0 (0.0%) |
| Foreign Born, Citizen | 249 (100.0%) | 0 (0.0%) |
| Foreign Born, not a Citizen | 82 (73.9%) | 29 (26.1%) |
Health Insurance Coverage by Household Income in Richton
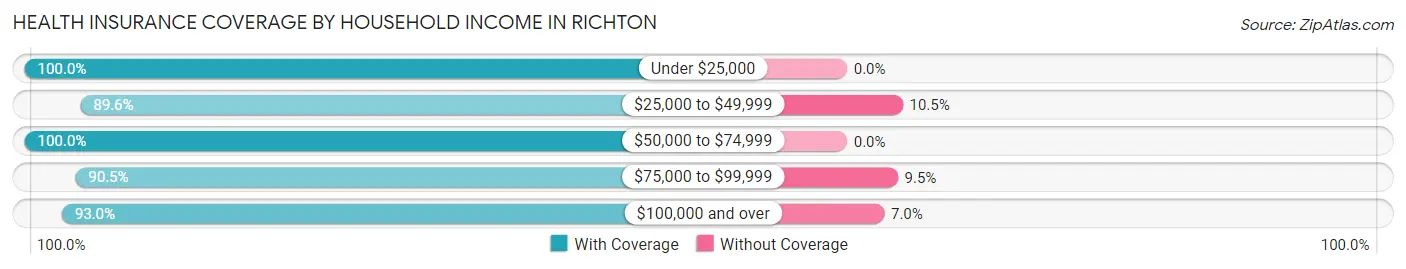
| Household Income | With Coverage | Without Coverage |
| Under $25,000 | 263 (100.0%) | 0 (0.0%) |
| $25,000 to $49,999 | 300 (89.5%) | 35 (10.4%) |
| $50,000 to $74,999 | 31 (100.0%) | 0 (0.0%) |
| $75,000 to $99,999 | 38 (90.5%) | 4 (9.5%) |
| $100,000 and over | 333 (93.0%) | 25 (7.0%) |
Public vs Private Health Insurance Coverage by Age in Richton
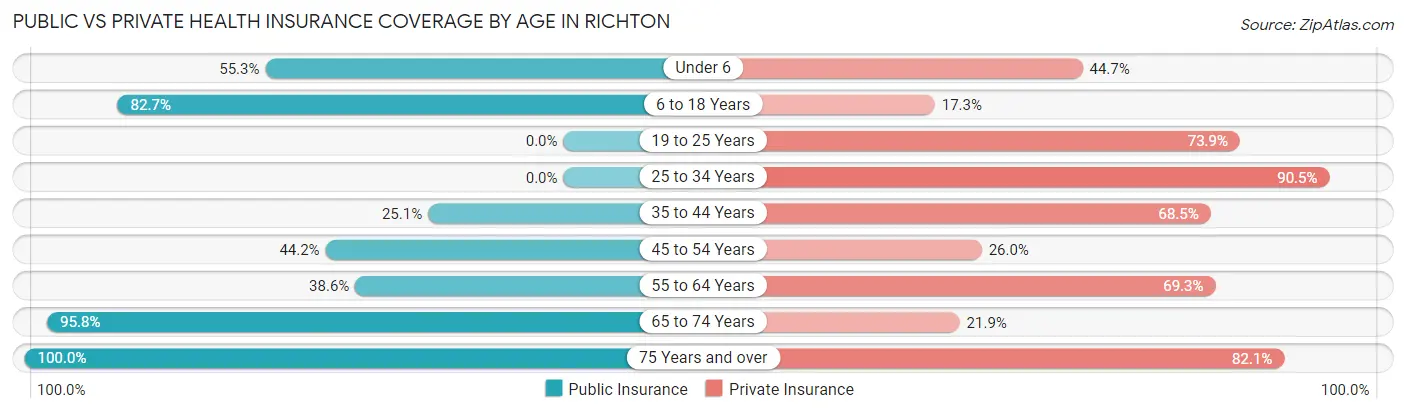
| Age Bracket | Public Insurance | Private Insurance |
| Under 6 | 26 (55.3%) | 21 (44.7%) |
| 6 to 18 Years | 206 (82.7%) | 43 (17.3%) |
| 19 to 25 Years | 0 (0.0%) | 82 (73.9%) |
| 25 to 34 Years | 0 (0.0%) | 38 (90.5%) |
| 35 to 44 Years | 47 (25.1%) | 128 (68.4%) |
| 45 to 54 Years | 34 (44.2%) | 20 (26.0%) |
| 55 to 64 Years | 34 (38.6%) | 61 (69.3%) |
| 65 to 74 Years | 92 (95.8%) | 21 (21.9%) |
| 75 Years and over | 162 (100.0%) | 133 (82.1%) |
| Total | 601 (56.8%) | 547 (51.6%) |
Disability Status by Sex by Age in Richton
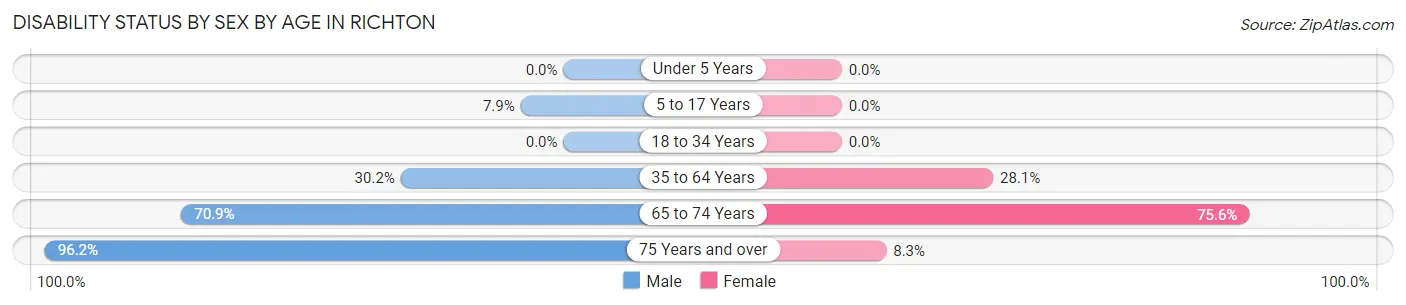
| Age Bracket | Male | Female |
| Under 5 Years | 0 (0.0%) | 0 (0.0%) |
| 5 to 17 Years | 15 (7.9%) | 0 (0.0%) |
| 18 to 34 Years | 0 (0.0%) | 0 (0.0%) |
| 35 to 64 Years | 45 (30.2%) | 57 (28.1%) |
| 65 to 74 Years | 39 (70.9%) | 31 (75.6%) |
| 75 Years and over | 51 (96.2%) | 9 (8.3%) |
Disability Class by Sex by Age in Richton
Disability Class: Hearing Difficulty
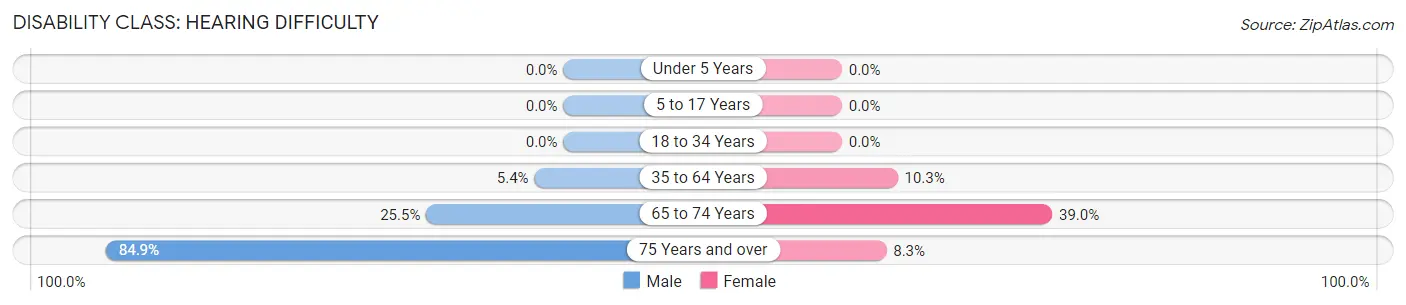
| Age Bracket | Male | Female |
| Under 5 Years | 0 (0.0%) | 0 (0.0%) |
| 5 to 17 Years | 0 (0.0%) | 0 (0.0%) |
| 18 to 34 Years | 0 (0.0%) | 0 (0.0%) |
| 35 to 64 Years | 8 (5.4%) | 21 (10.3%) |
| 65 to 74 Years | 14 (25.5%) | 16 (39.0%) |
| 75 Years and over | 45 (84.9%) | 9 (8.3%) |
Disability Class: Vision Difficulty
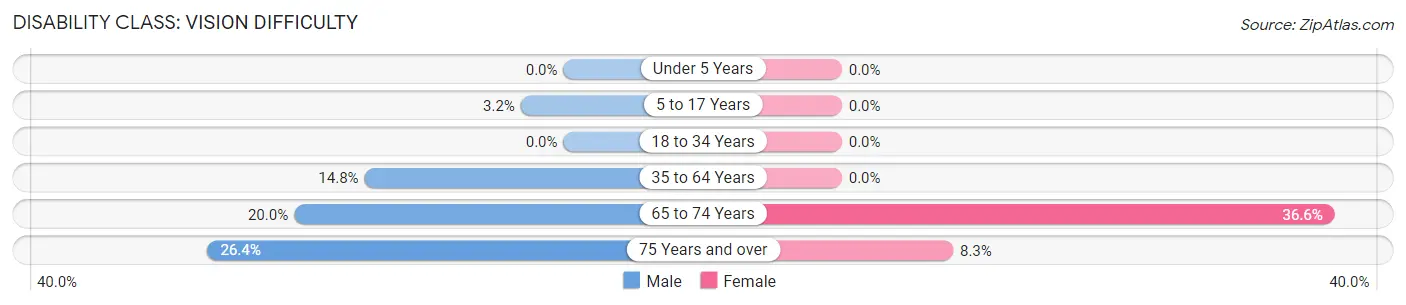
| Age Bracket | Male | Female |
| Under 5 Years | 0 (0.0%) | 0 (0.0%) |
| 5 to 17 Years | 6 (3.2%) | 0 (0.0%) |
| 18 to 34 Years | 0 (0.0%) | 0 (0.0%) |
| 35 to 64 Years | 22 (14.8%) | 0 (0.0%) |
| 65 to 74 Years | 11 (20.0%) | 15 (36.6%) |
| 75 Years and over | 14 (26.4%) | 9 (8.3%) |
Disability Class: Cognitive Difficulty
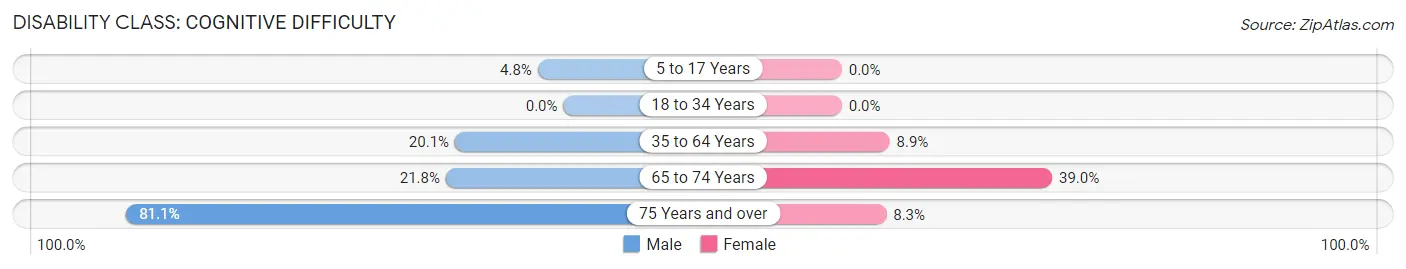
| Age Bracket | Male | Female |
| 5 to 17 Years | 9 (4.8%) | 0 (0.0%) |
| 18 to 34 Years | 0 (0.0%) | 0 (0.0%) |
| 35 to 64 Years | 30 (20.1%) | 18 (8.9%) |
| 65 to 74 Years | 12 (21.8%) | 16 (39.0%) |
| 75 Years and over | 43 (81.1%) | 9 (8.3%) |
Disability Class: Ambulatory Difficulty
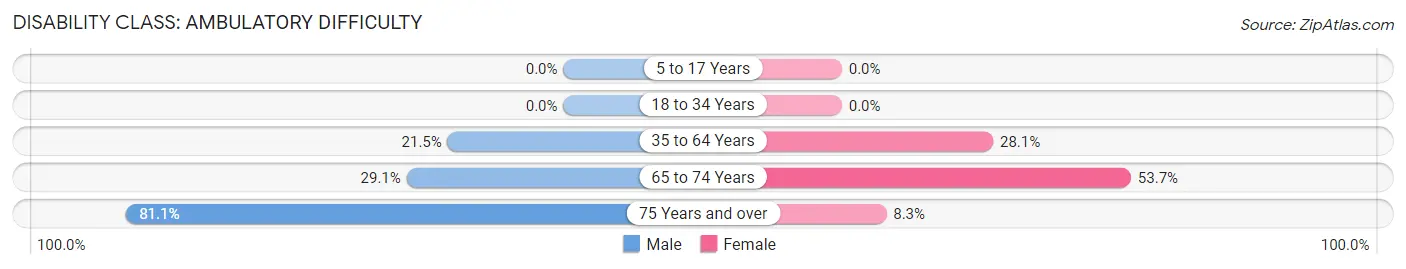
| Age Bracket | Male | Female |
| 5 to 17 Years | 0 (0.0%) | 0 (0.0%) |
| 18 to 34 Years | 0 (0.0%) | 0 (0.0%) |
| 35 to 64 Years | 32 (21.5%) | 57 (28.1%) |
| 65 to 74 Years | 16 (29.1%) | 22 (53.7%) |
| 75 Years and over | 43 (81.1%) | 9 (8.3%) |
Disability Class: Self-Care Difficulty
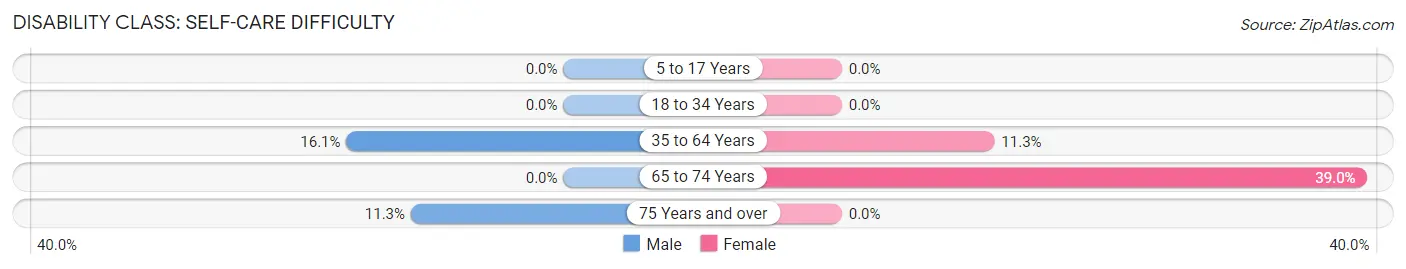
| Age Bracket | Male | Female |
| 5 to 17 Years | 0 (0.0%) | 0 (0.0%) |
| 18 to 34 Years | 0 (0.0%) | 0 (0.0%) |
| 35 to 64 Years | 24 (16.1%) | 23 (11.3%) |
| 65 to 74 Years | 0 (0.0%) | 16 (39.0%) |
| 75 Years and over | 6 (11.3%) | 0 (0.0%) |
Technology Access in Richton
Computing Device Access in Richton
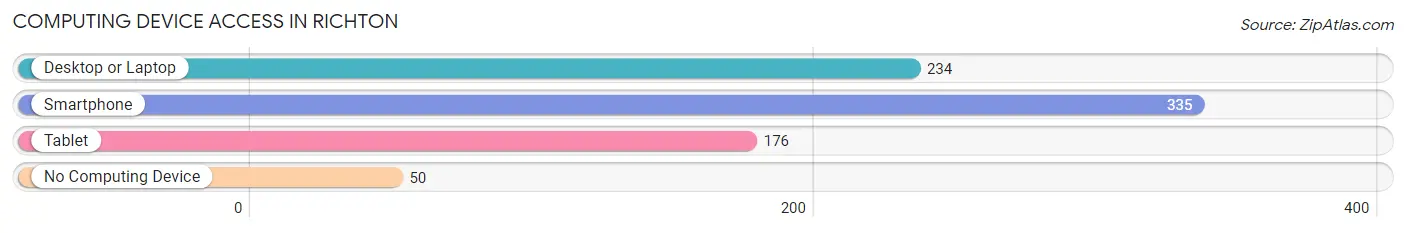
| Device Type | # Households | % Households |
| Desktop or Laptop | 234 | 59.5% |
| Smartphone | 335 | 85.2% |
| Tablet | 176 | 44.8% |
| No Computing Device | 50 | 12.7% |
| Total | 393 | 100.0% |
Internet Access in Richton
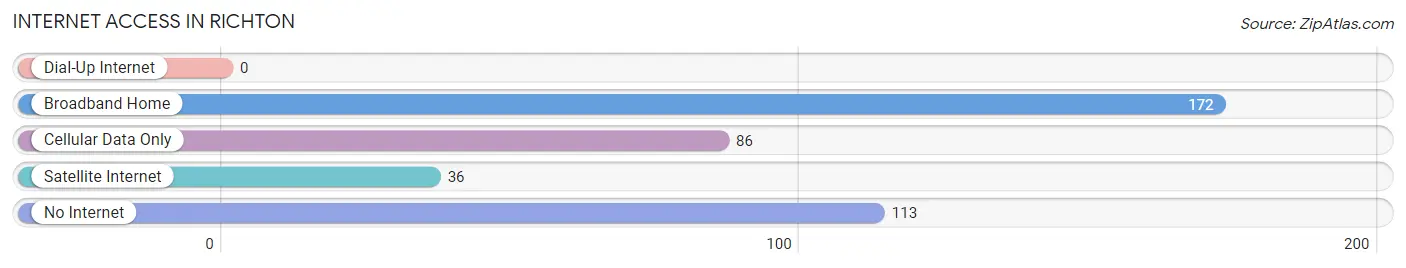
| Internet Type | # Households | % Households |
| Dial-Up Internet | 0 | 0.0% |
| Broadband Home | 172 | 43.8% |
| Cellular Data Only | 86 | 21.9% |
| Satellite Internet | 36 | 9.2% |
| No Internet | 113 | 28.7% |
| Total | 393 | 100.0% |
Richton Summary
Richton, Mississippi is a small town located in Perry County, Mississippi. It is situated in the southeastern part of the state, approximately 40 miles northeast of Hattiesburg and 60 miles southwest of Meridian. The town was founded in 1883 and has a population of 1,717 as of the 2010 census.
Geography
Richton is located in the southeastern part of Perry County, Mississippi. It is situated at the intersection of U.S. Route 11 and Mississippi Highway 42. The town is located in the Piney Woods region of the state, and is surrounded by forests and rolling hills. The town is located approximately 40 miles northeast of Hattiesburg and 60 miles southwest of Meridian.
Climate
Richton has a humid subtropical climate, with hot, humid summers and mild winters. The average annual temperature is 64°F, with an average high of 81°F in July and an average low of 46°F in January. The average annual precipitation is 56 inches, with an average of 4.5 inches of snowfall per year.
Demographics
As of the 2010 census, Richton had a population of 1,717. The racial makeup of the town was 79.2% White, 19.2% African American, 0.3% Native American, 0.2% Asian, 0.1% Pacific Islander, 0.2% from other races, and 0.9% from two or more races. Hispanic or Latino of any race were 1.2% of the population.
Economy
Richton’s economy is largely based on agriculture and forestry. The town is home to several small businesses, including a lumber mill, a sawmill, and a feed mill. The town is also home to a number of small retail stores, restaurants, and other services.
Education
Richton is served by the Perry County School District. The town is home to Richton Elementary School, Richton Middle School, and Richton High School. The town also has a public library, the Richton Public Library.
History
Richton was founded in 1883 by a group of settlers from Georgia. The town was named after a local landowner, Richard Rich. The town was incorporated in 1887 and has remained a small, rural community ever since.
Richton was the site of a major battle during the Civil War. On April 12, 1865, Confederate forces under the command of General Nathan Bedford Forrest clashed with Union forces under the command of General Benjamin Grierson. The battle ended in a Confederate victory, and the town was spared from destruction.
Richton has been home to a number of notable people, including former Mississippi Governor William Winter, former U.S. Senator Trent Lott, and former NFL player and coach Steve Mariucci.
Richton is a small, rural town with a rich history and a strong sense of community. The town is home to a number of small businesses and is surrounded by forests and rolling hills. Richton is a great place to live, work, and raise a family.
Common Questions
What is Per Capita Income in Richton?
Per Capita income in Richton is $20,111.
What is the Median Family Income in Richton?
Median Family Income in Richton is $34,301.
What is the Median Household income in Richton?
Median Household Income in Richton is $33,621.
What is Family Income Deficit in Richton?
Family Income Deficit in Richton is $14,703.
Families that are below poverty line in Richton earn $14,703 less on average than the poverty threshold level.
What is Inequality or Gini Index in Richton?
Inequality or Gini Index in Richton is 0.48.
What is the Total Population of Richton?
Total Population of Richton is 1,150.
What is the Total Male Population of Richton?
Total Male Population of Richton is 602.
What is the Total Female Population of Richton?
Total Female Population of Richton is 548.
What is the Ratio of Males per 100 Females in Richton?
There are 109.85 Males per 100 Females in Richton.
What is the Ratio of Females per 100 Males in Richton?
There are 91.03 Females per 100 Males in Richton.
What is the Median Population Age in Richton?
Median Population Age in Richton is 42.3 Years.
What is the Average Family Size in Richton
Average Family Size in Richton is 3.2 People.
What is the Average Household Size in Richton
Average Household Size in Richton is 2.6 People.
How Large is the Labor Force in Richton?
There are 376 People in the Labor Forcein in Richton.
What is the Percentage of People in the Labor Force in Richton?
41.5% of People are in the Labor Force in Richton.