Benoit, MS Map & Demographics
Benoit Map
Benoit Overview
$20,865
PER CAPITA INCOME
74.1%
WAGE / INCOME GAP [ % ]
25.9¢/ $1
WAGE / INCOME GAP [ $ ]
$14,895
FAMILY INCOME DEFICIT
0.55
INEQUALITY / GINI INDEX
547
TOTAL POPULATION
242
MALE POPULATION
305
FEMALE POPULATION
79.34
MALES / 100 FEMALES
126.03
FEMALES / 100 MALES
39.6
MEDIAN AGE
4.0
AVG FAMILY SIZE
3.0
AVG HOUSEHOLD SIZE
198
LABOR FORCE [ PEOPLE ]
48.2%
PERCENT IN LABOR FORCE
15.2%
UNEMPLOYMENT RATE
Benoit Zip Codes
Benoit Area Codes
Income in Benoit
Income Overview in Benoit
| Characteristic | Number | Measure |
| Per Capita Income | 547 | $20,865 |
| Median Family Income | 121 | $0 |
| Mean Family Income | 121 | $81,389 |
| Median Household Income | 185 | $0 |
| Mean Household Income | 185 | $62,062 |
| Income Deficit | 121 | $14,895 |
| Wage / Income Gap (%) | 547 | 74.06% |
| Wage / Income Gap ($) | 547 | 25.94¢ per $1 |
| Gini / Inequality Index | 547 | 0.55 |
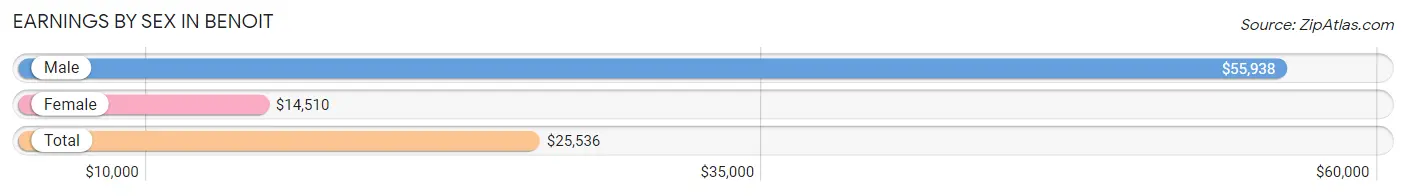
Earnings by Sex in Benoit
Average Earnings in Benoit are $25,536, $55,938 for men and $14,510 for women, a difference of 74.1%.
| Sex | Number | Average Earnings |
| Male | 83 (45.4%) | $55,938 |
| Female | 100 (54.6%) | $14,510 |
| Total | 183 (100.0%) | $25,536 |
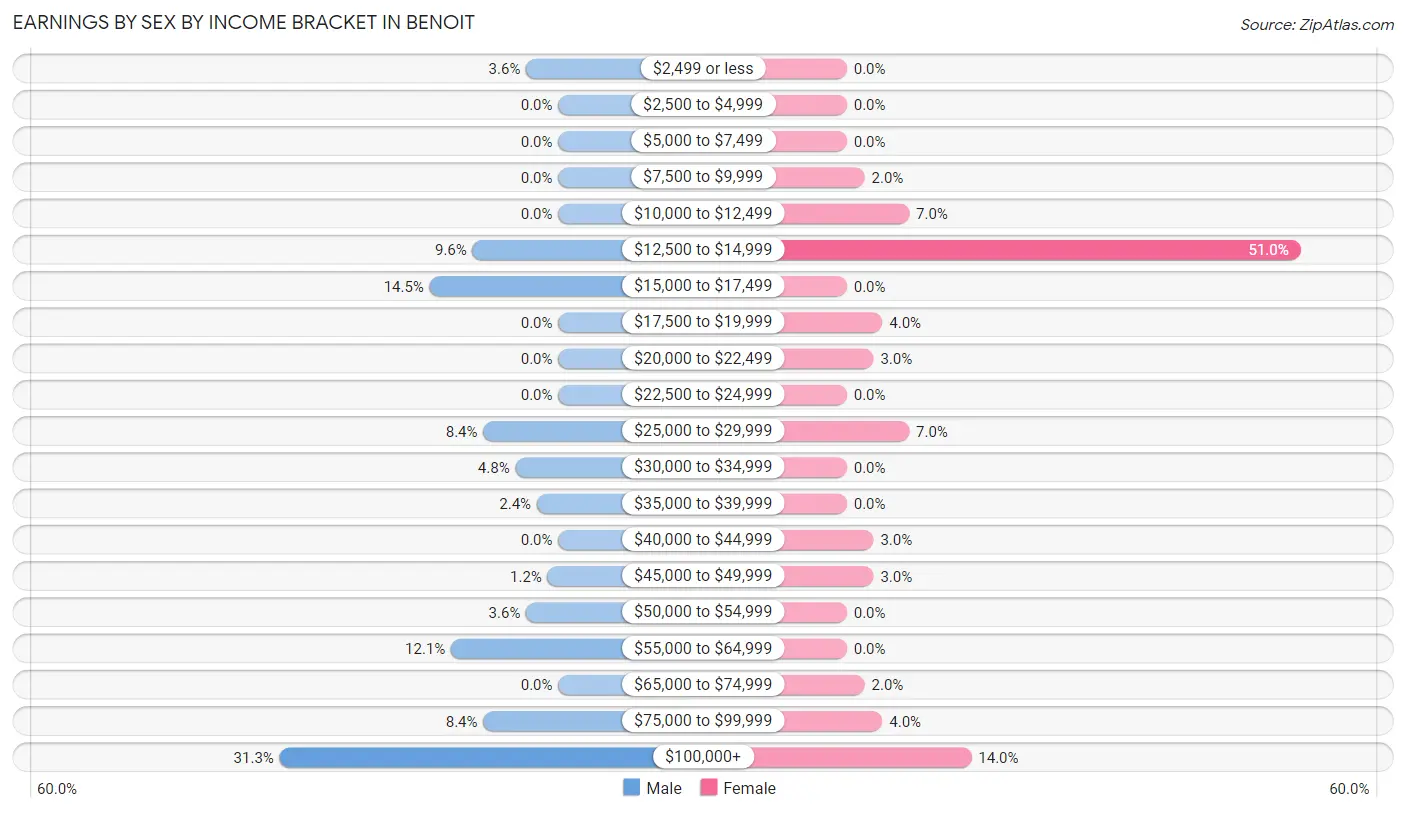
Earnings by Sex by Income Bracket in Benoit
The most common earnings brackets in Benoit are $100,000+ for men (26 | 31.3%) and $12,500 to $14,999 for women (51 | 51.0%).
| Income | Male | Female |
| $2,499 or less | 3 (3.6%) | 0 (0.0%) |
| $2,500 to $4,999 | 0 (0.0%) | 0 (0.0%) |
| $5,000 to $7,499 | 0 (0.0%) | 0 (0.0%) |
| $7,500 to $9,999 | 0 (0.0%) | 2 (2.0%) |
| $10,000 to $12,499 | 0 (0.0%) | 7 (7.0%) |
| $12,500 to $14,999 | 8 (9.6%) | 51 (51.0%) |
| $15,000 to $17,499 | 12 (14.5%) | 0 (0.0%) |
| $17,500 to $19,999 | 0 (0.0%) | 4 (4.0%) |
| $20,000 to $22,499 | 0 (0.0%) | 3 (3.0%) |
| $22,500 to $24,999 | 0 (0.0%) | 0 (0.0%) |
| $25,000 to $29,999 | 7 (8.4%) | 7 (7.0%) |
| $30,000 to $34,999 | 4 (4.8%) | 0 (0.0%) |
| $35,000 to $39,999 | 2 (2.4%) | 0 (0.0%) |
| $40,000 to $44,999 | 0 (0.0%) | 3 (3.0%) |
| $45,000 to $49,999 | 1 (1.2%) | 3 (3.0%) |
| $50,000 to $54,999 | 3 (3.6%) | 0 (0.0%) |
| $55,000 to $64,999 | 10 (12.0%) | 0 (0.0%) |
| $65,000 to $74,999 | 0 (0.0%) | 2 (2.0%) |
| $75,000 to $99,999 | 7 (8.4%) | 4 (4.0%) |
| $100,000+ | 26 (31.3%) | 14 (14.0%) |
| Total | 83 (100.0%) | 100 (100.0%) |
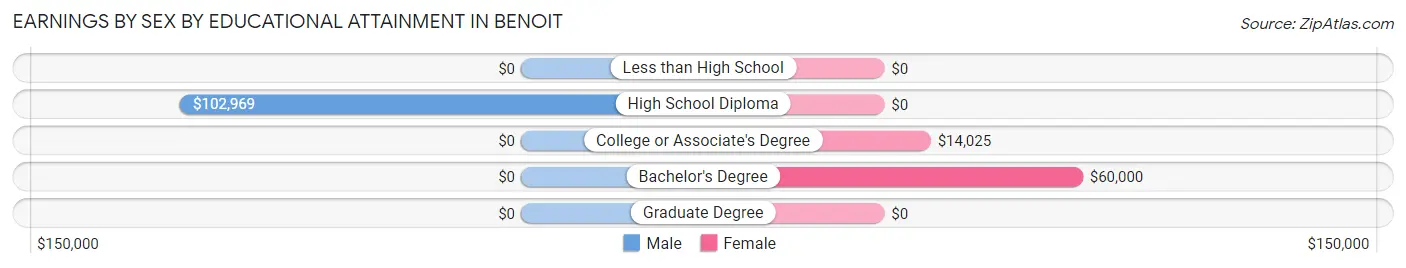
Earnings by Sex by Educational Attainment in Benoit
| Educational Attainment | Male Income | Female Income |
| Less than High School | - | - |
| High School Diploma | $102,969 | $0 |
| College or Associate's Degree | - | - |
| Bachelor's Degree | - | - |
| Graduate Degree | - | - |
| Total | - | - |
Family Income in Benoit
Family Income Brackets in Benoit
According to the Benoit family income data, there are 31 families falling into the $100,000 to $149,999 income range, which is the most common income bracket and makes up 25.6% of all families.
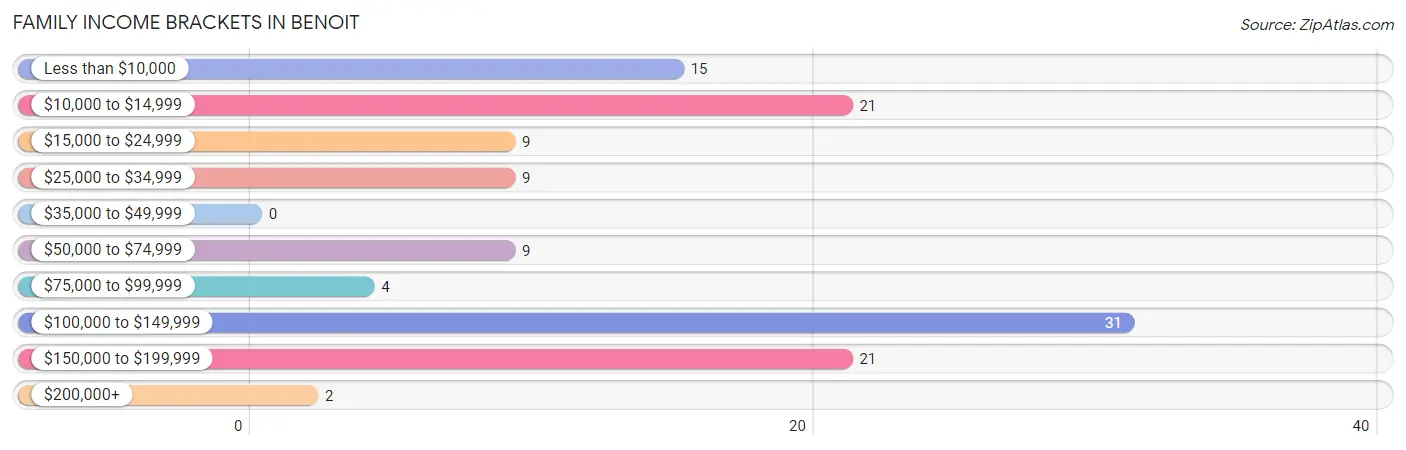
| Income Bracket | # Families | % Families |
| Less than $10,000 | 15 | 12.4% |
| $10,000 to $14,999 | 21 | 17.4% |
| $15,000 to $24,999 | 9 | 7.4% |
| $25,000 to $34,999 | 9 | 7.4% |
| $35,000 to $49,999 | 0 | 0.0% |
| $50,000 to $74,999 | 9 | 7.4% |
| $75,000 to $99,999 | 4 | 3.3% |
| $100,000 to $149,999 | 31 | 25.6% |
| $150,000 to $199,999 | 21 | 17.4% |
| $200,000+ | 2 | 1.7% |
Family Income by Famaliy Size in Benoit
| Income Bracket | # Families | Median Income |
| 2-Person Families | 43 (35.5%) | $0 |
| 3-Person Families | 18 (14.9%) | $0 |
| 4-Person Families | 49 (40.5%) | $0 |
| 5-Person Families | 0 (0.0%) | $0 |
| 6-Person Families | 0 (0.0%) | $0 |
| 7+ Person Families | 11 (9.1%) | $0 |
| Total | 121 (100.0%) | $0 |
Family Income by Number of Earners in Benoit
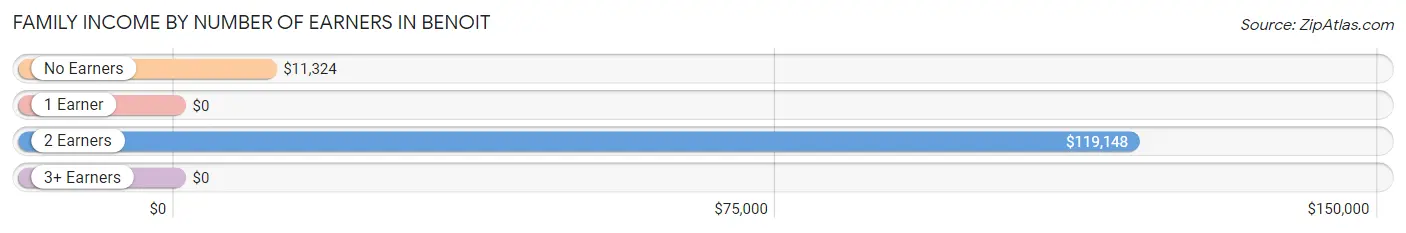
| Number of Earners | # Families | Median Income |
| No Earners | 42 (34.7%) | $11,324 |
| 1 Earner | 30 (24.8%) | $0 |
| 2 Earners | 43 (35.5%) | $119,148 |
| 3+ Earners | 6 (5.0%) | $0 |
| Total | 121 (100.0%) | $0 |
Household Income in Benoit
Household Income Brackets in Benoit
With 48 households falling in the category, the $10,000 to $14,999 income range is the most frequent in Benoit, accounting for 26.0% of all households.
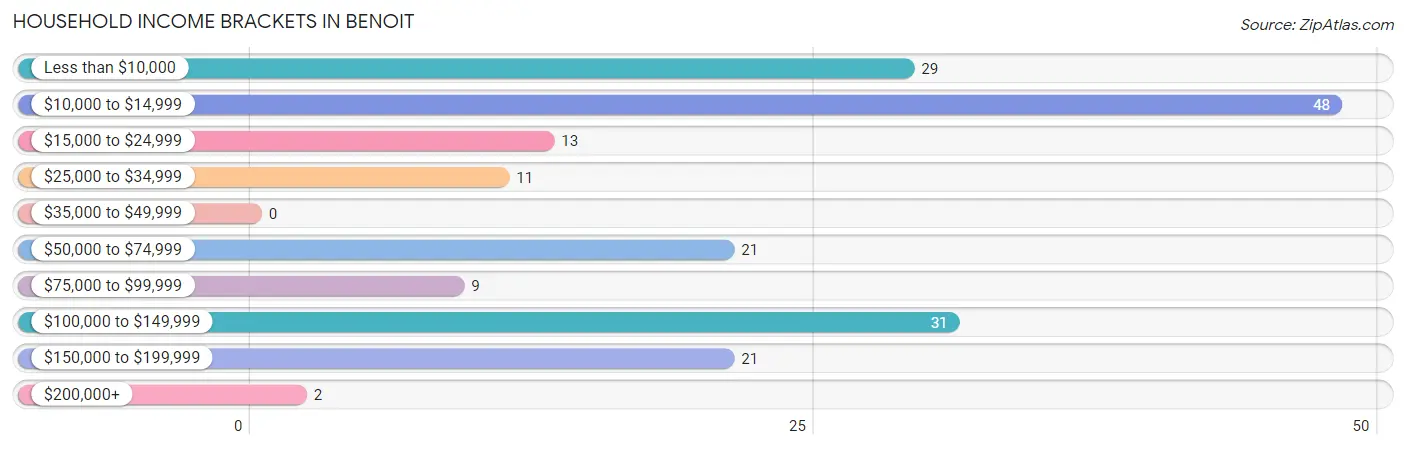
| Income Bracket | # Households | % Households |
| Less than $10,000 | 29 | 15.7% |
| $10,000 to $14,999 | 48 | 25.9% |
| $15,000 to $24,999 | 13 | 7.0% |
| $25,000 to $34,999 | 11 | 5.9% |
| $35,000 to $49,999 | 0 | 0.0% |
| $50,000 to $74,999 | 21 | 11.4% |
| $75,000 to $99,999 | 9 | 4.9% |
| $100,000 to $149,999 | 31 | 16.8% |
| $150,000 to $199,999 | 21 | 11.4% |
| $200,000+ | 2 | 1.1% |
Household Income by Householder Age in Benoit
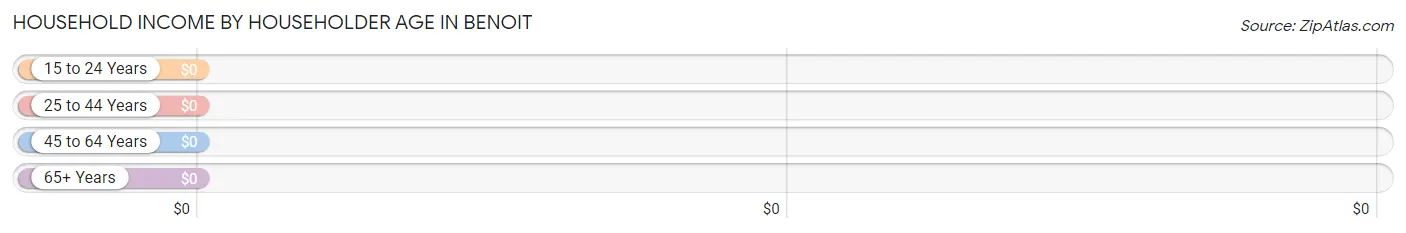
| Income Bracket | # Households | Median Income |
| 15 to 24 Years | 1 (0.5%) | $0 |
| 25 to 44 Years | 40 (21.6%) | $0 |
| 45 to 64 Years | 77 (41.6%) | $0 |
| 65+ Years | 67 (36.2%) | $0 |
| Total | 185 (100.0%) | $0 |
Poverty in Benoit
Income Below Poverty by Sex and Age in Benoit
With 44.6% poverty level for males and 36.4% for females among the residents of Benoit, under 5 year old males and 5 year old females are the most vulnerable to poverty, with 13 males (100.0%) and 3 females (100.0%) in their respective age groups living below the poverty level.
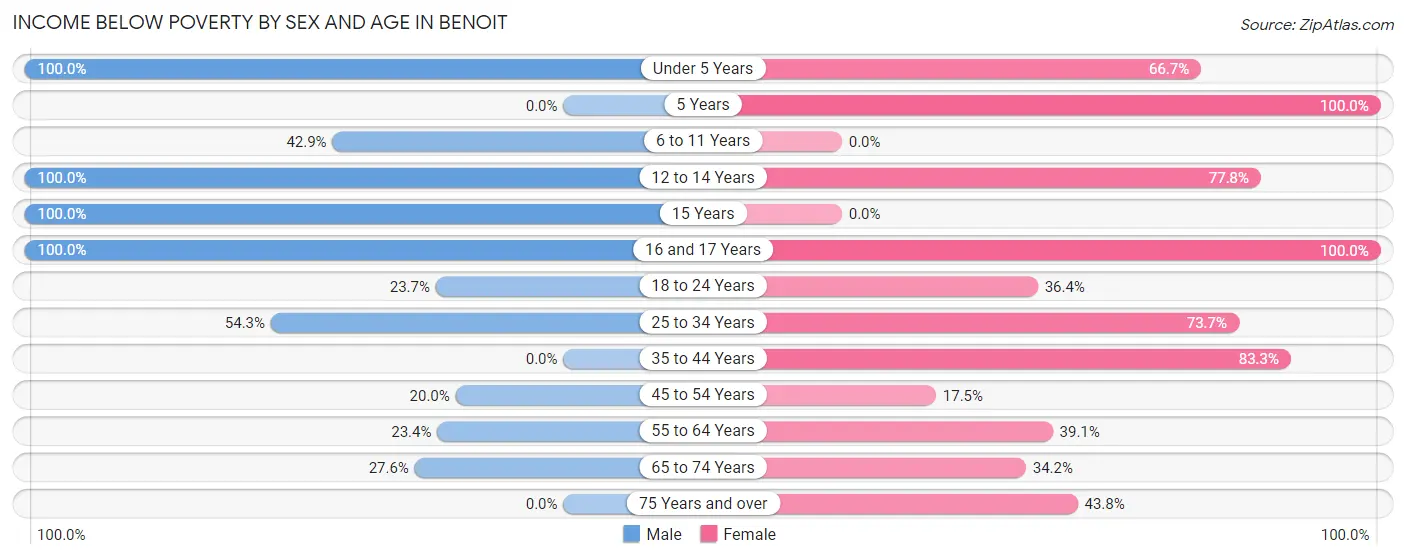
| Age Bracket | Male | Female |
| Under 5 Years | 13 (100.0%) | 8 (66.7%) |
| 5 Years | 0 (0.0%) | 3 (100.0%) |
| 6 to 11 Years | 9 (42.9%) | 0 (0.0%) |
| 12 to 14 Years | 12 (100.0%) | 7 (77.8%) |
| 15 Years | 10 (100.0%) | 0 (0.0%) |
| 16 and 17 Years | 14 (100.0%) | 5 (100.0%) |
| 18 to 24 Years | 9 (23.7%) | 4 (36.4%) |
| 25 to 34 Years | 19 (54.3%) | 14 (73.7%) |
| 35 to 44 Years | 0 (0.0%) | 20 (83.3%) |
| 45 to 54 Years | 3 (20.0%) | 11 (17.5%) |
| 55 to 64 Years | 11 (23.4%) | 18 (39.1%) |
| 65 to 74 Years | 8 (27.6%) | 14 (34.2%) |
| 75 Years and over | 0 (0.0%) | 7 (43.8%) |
| Total | 108 (44.6%) | 111 (36.4%) |
Income Above Poverty by Sex and Age in Benoit
According to the poverty statistics in Benoit, males aged 35 to 44 years and females aged 6 to 11 years are the age groups that are most secure financially, with 100.0% of males and 100.0% of females in these age groups living above the poverty line.
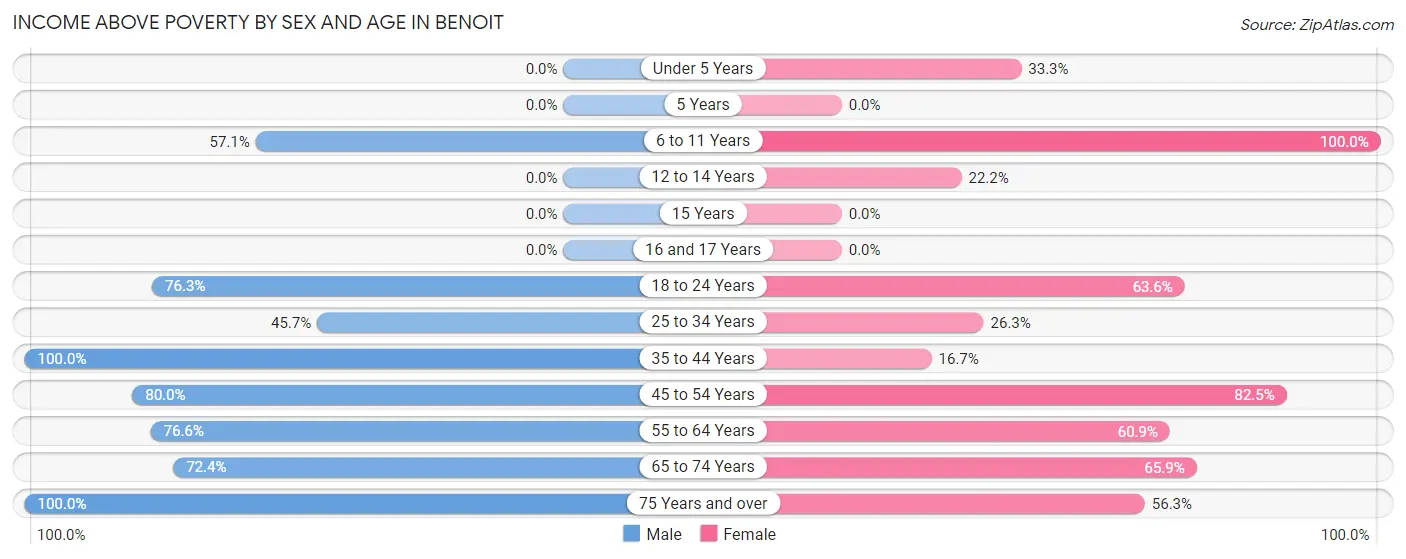
| Age Bracket | Male | Female |
| Under 5 Years | 0 (0.0%) | 4 (33.3%) |
| 5 Years | 0 (0.0%) | 0 (0.0%) |
| 6 to 11 Years | 12 (57.1%) | 56 (100.0%) |
| 12 to 14 Years | 0 (0.0%) | 2 (22.2%) |
| 15 Years | 0 (0.0%) | 0 (0.0%) |
| 16 and 17 Years | 0 (0.0%) | 0 (0.0%) |
| 18 to 24 Years | 29 (76.3%) | 7 (63.6%) |
| 25 to 34 Years | 16 (45.7%) | 5 (26.3%) |
| 35 to 44 Years | 4 (100.0%) | 4 (16.7%) |
| 45 to 54 Years | 12 (80.0%) | 52 (82.5%) |
| 55 to 64 Years | 36 (76.6%) | 28 (60.9%) |
| 65 to 74 Years | 21 (72.4%) | 27 (65.8%) |
| 75 Years and over | 4 (100.0%) | 9 (56.2%) |
| Total | 134 (55.4%) | 194 (63.6%) |
Income Below Poverty Among Married-Couple Families in Benoit
The poverty statistics for married-couple families in Benoit show that 13.8% or 11 of the total 80 families live below the poverty line. Families with no children have the highest poverty rate of 21.0%, comprising of 8 families. On the other hand, families with 1 or 2 children have the lowest poverty rate of 7.1%, which includes 3 families.
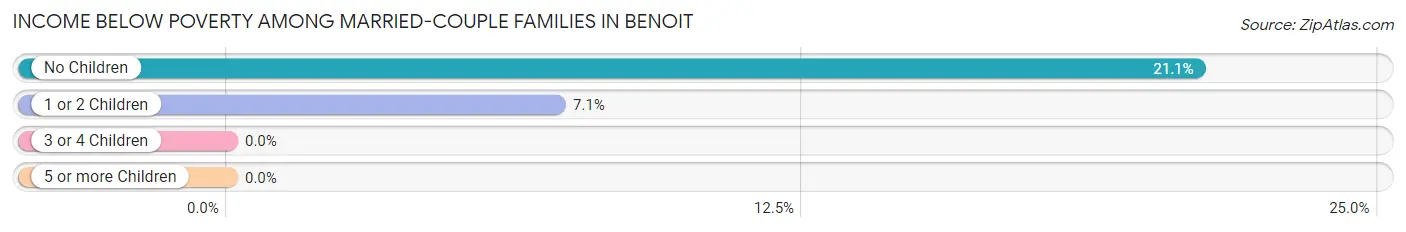
| Children | Above Poverty | Below Poverty |
| No Children | 30 (78.9%) | 8 (21.0%) |
| 1 or 2 Children | 39 (92.9%) | 3 (7.1%) |
| 3 or 4 Children | 0 (0.0%) | 0 (0.0%) |
| 5 or more Children | 0 (0.0%) | 0 (0.0%) |
| Total | 69 (86.3%) | 11 (13.8%) |
Income Below Poverty Among Single-Parent Households in Benoit
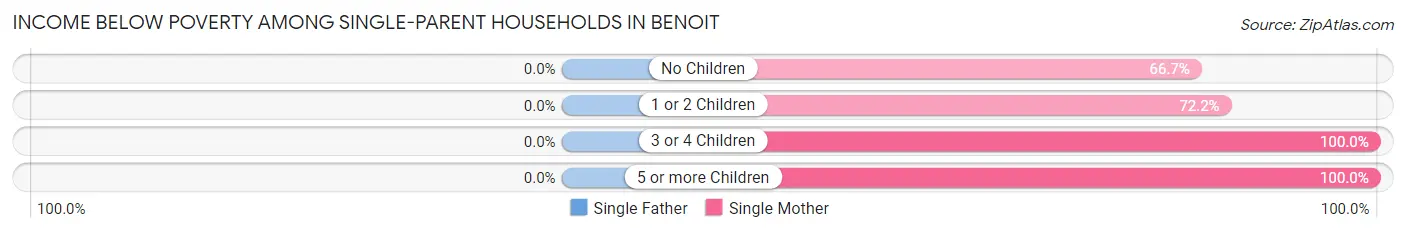
| Children | Single Father | Single Mother |
| No Children | 0 (0.0%) | 6 (66.7%) |
| 1 or 2 Children | 0 (0.0%) | 13 (72.2%) |
| 3 or 4 Children | 0 (0.0%) | 8 (100.0%) |
| 5 or more Children | 0 (0.0%) | 5 (100.0%) |
| Total | 0 (0.0%) | 32 (80.0%) |
Income Below Poverty Among Married-Couple vs Single-Parent Households in Benoit
The poverty data for Benoit shows that 11 of the married-couple family households (13.8%) and 32 of the single-parent households (78.0%) are living below the poverty level. Within the married-couple family households, those with no children have the highest poverty rate, with 8 households (21.0%) falling below the poverty line. Among the single-parent households, those with 3 or 4 children have the highest poverty rate, with 8 household (100.0%) living below poverty.
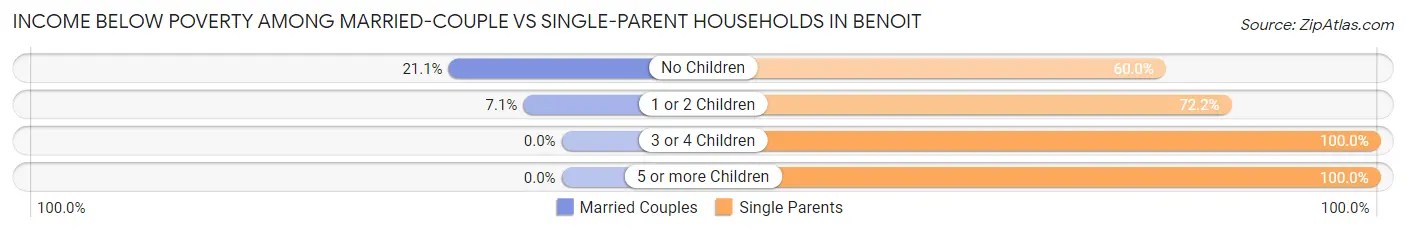
| Children | Married-Couple Families | Single-Parent Households |
| No Children | 8 (21.0%) | 6 (60.0%) |
| 1 or 2 Children | 3 (7.1%) | 13 (72.2%) |
| 3 or 4 Children | 0 (0.0%) | 8 (100.0%) |
| 5 or more Children | 0 (0.0%) | 5 (100.0%) |
| Total | 11 (13.8%) | 32 (78.0%) |
Race in Benoit
The most populous races in Benoit are Black / African American (320 | 58.5%), White / Caucasian (222 | 40.6%), and Hispanic or Latino (7 | 1.3%).
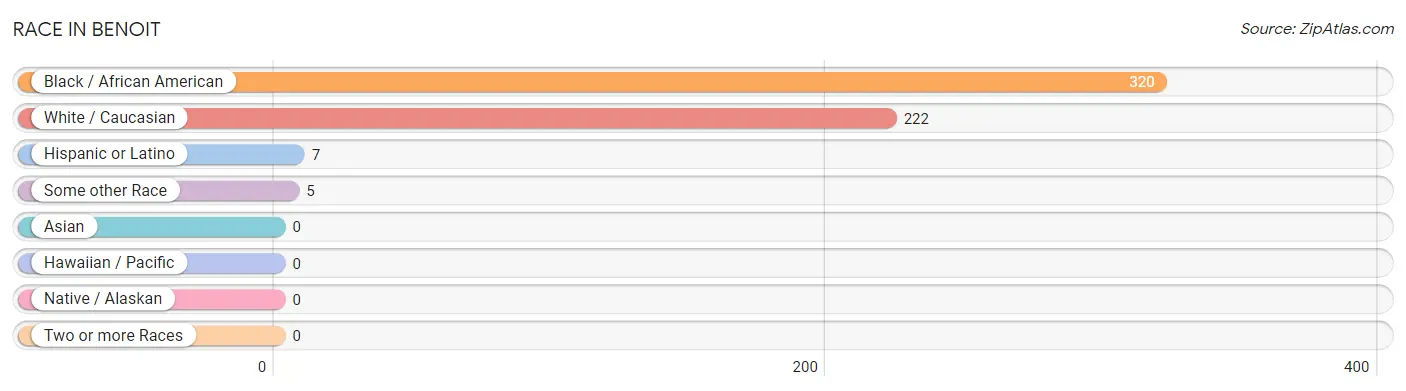
| Race | # Population | % Population |
| Asian | 0 | 0.0% |
| Black / African American | 320 | 58.5% |
| Hawaiian / Pacific | 0 | 0.0% |
| Hispanic or Latino | 7 | 1.3% |
| Native / Alaskan | 0 | 0.0% |
| White / Caucasian | 222 | 40.6% |
| Two or more Races | 0 | 0.0% |
| Some other Race | 5 | 0.9% |
| Total | 547 | 100.0% |
Ancestry in Benoit
The most populous ancestries reported in Benoit are American (43 | 7.9%), English (37 | 6.8%), Mexican (7 | 1.3%), Irish (4 | 0.7%), and German (3 | 0.5%), together accounting for 17.2% of all Benoit residents.
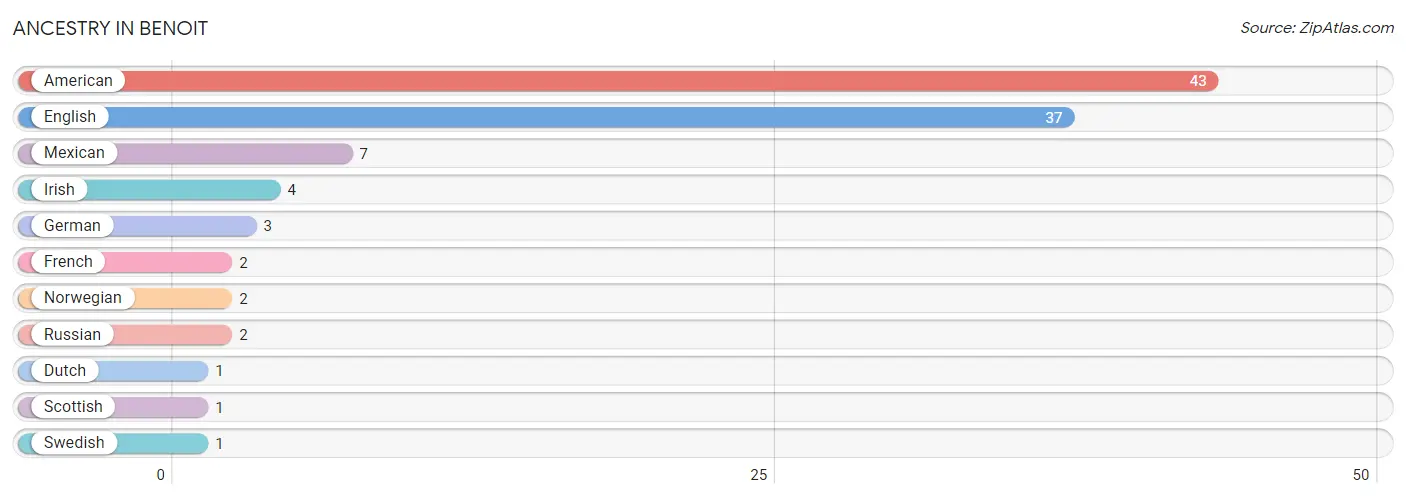
| Ancestry | # Population | % Population |
| American | 43 | 7.9% |
| Dutch | 1 | 0.2% |
| English | 37 | 6.8% |
| French | 2 | 0.4% |
| German | 3 | 0.5% |
| Irish | 4 | 0.7% |
| Mexican | 7 | 1.3% |
| Norwegian | 2 | 0.4% |
| Russian | 2 | 0.4% |
| Scottish | 1 | 0.2% |
| Swedish | 1 | 0.2% | View All 11 Rows |
Immigrants in Benoit
The most numerous immigrant groups reported in Benoit came from Central America (3 | 0.5%), Latin America (3 | 0.5%), and Mexico (3 | 0.5%), together accounting for 1.7% of all Benoit residents.
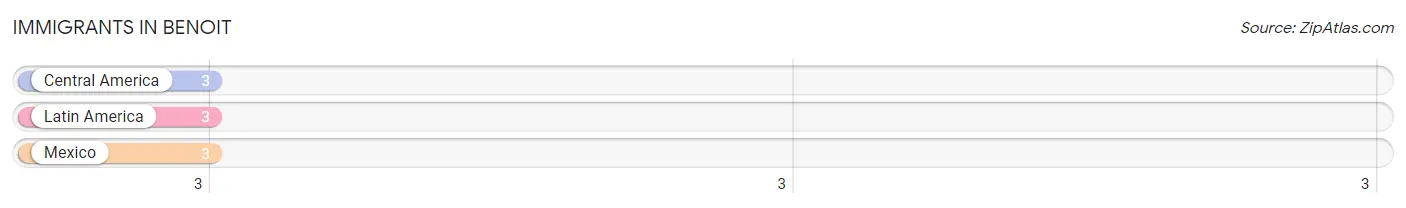
| Immigration Origin | # Population | % Population |
| Central America | 3 | 0.5% |
| Latin America | 3 | 0.5% |
| Mexico | 3 | 0.5% | View All 3 Rows |
Sex and Age in Benoit
Sex and Age in Benoit
The most populous age groups in Benoit are 20 to 24 Years (38 | 15.7%) for men and 45 to 49 Years (58 | 19.0%) for women.
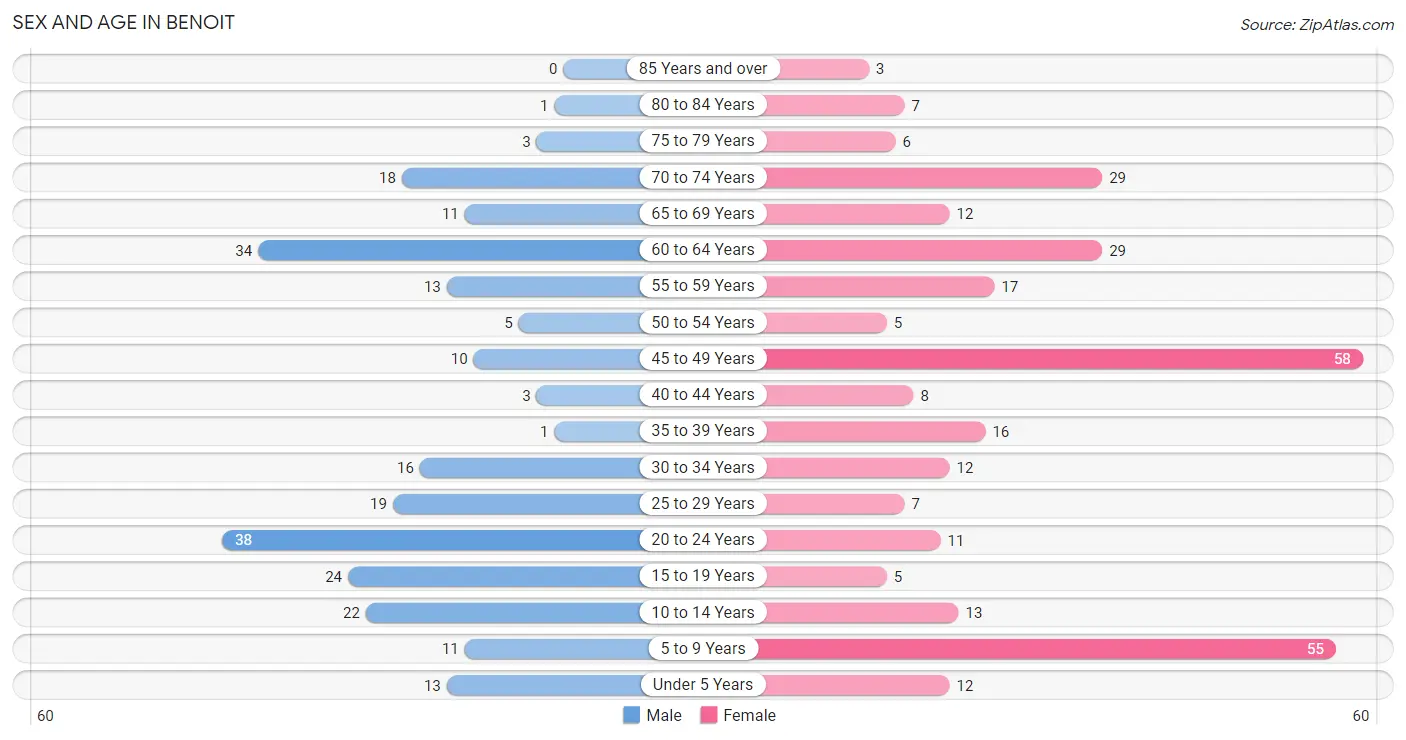
| Age Bracket | Male | Female |
| Under 5 Years | 13 (5.4%) | 12 (3.9%) |
| 5 to 9 Years | 11 (4.5%) | 55 (18.0%) |
| 10 to 14 Years | 22 (9.1%) | 13 (4.3%) |
| 15 to 19 Years | 24 (9.9%) | 5 (1.6%) |
| 20 to 24 Years | 38 (15.7%) | 11 (3.6%) |
| 25 to 29 Years | 19 (7.9%) | 7 (2.3%) |
| 30 to 34 Years | 16 (6.6%) | 12 (3.9%) |
| 35 to 39 Years | 1 (0.4%) | 16 (5.2%) |
| 40 to 44 Years | 3 (1.2%) | 8 (2.6%) |
| 45 to 49 Years | 10 (4.1%) | 58 (19.0%) |
| 50 to 54 Years | 5 (2.1%) | 5 (1.6%) |
| 55 to 59 Years | 13 (5.4%) | 17 (5.6%) |
| 60 to 64 Years | 34 (14.1%) | 29 (9.5%) |
| 65 to 69 Years | 11 (4.5%) | 12 (3.9%) |
| 70 to 74 Years | 18 (7.4%) | 29 (9.5%) |
| 75 to 79 Years | 3 (1.2%) | 6 (2.0%) |
| 80 to 84 Years | 1 (0.4%) | 7 (2.3%) |
| 85 Years and over | 0 (0.0%) | 3 (1.0%) |
| Total | 242 (100.0%) | 305 (100.0%) |
Families and Households in Benoit
Median Family Size in Benoit
The median family size in Benoit is 3.98 persons per family, with single female/mother families (40 | 33.1%) accounting for the largest median family size of 4.33 persons per family. On the other hand, married-couple families (80 | 66.1%) represent the smallest median family size with 3.80 persons per family.
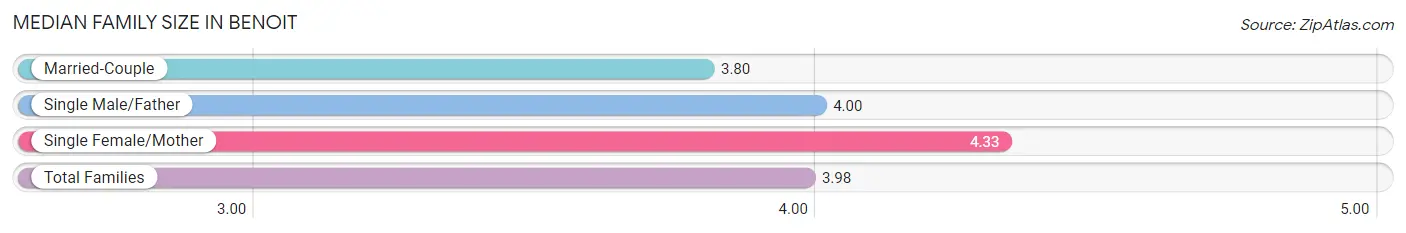
| Family Type | # Families | Family Size |
| Married-Couple | 80 (66.1%) | 3.80 |
| Single Male/Father | 1 (0.8%) | 4.00 |
| Single Female/Mother | 40 (33.1%) | 4.33 |
| Total Families | 121 (100.0%) | 3.98 |
Median Household Size in Benoit
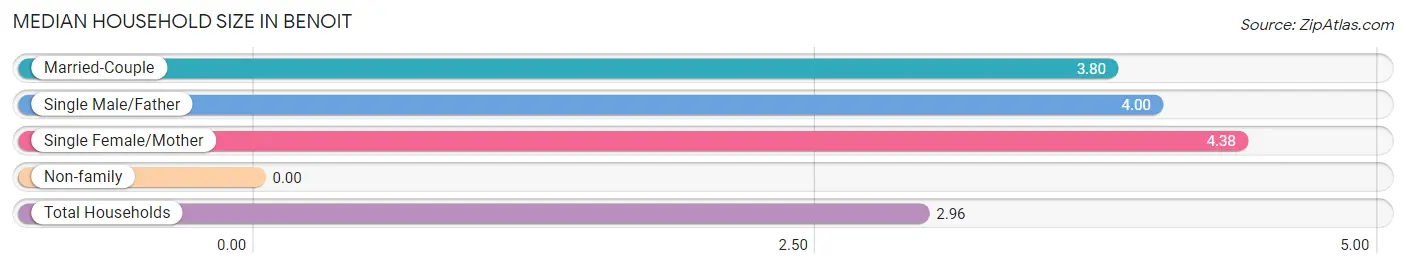
| Household Type | # Households | Household Size |
| Married-Couple | 80 (43.2%) | 3.80 |
| Single Male/Father | 1 (0.5%) | 4.00 |
| Single Female/Mother | 40 (21.6%) | 4.38 |
| Non-family | 64 (34.6%) | - |
| Total Households | 185 (100.0%) | 2.96 |
Household Size by Marriage Status in Benoit
Out of a total of 185 households in Benoit, 121 (65.4%) are family households, while 64 (34.6%) are nonfamily households. The most numerous type of family households are 4-person households, comprising 49, and the most common type of nonfamily households are 1-person households, comprising 64.
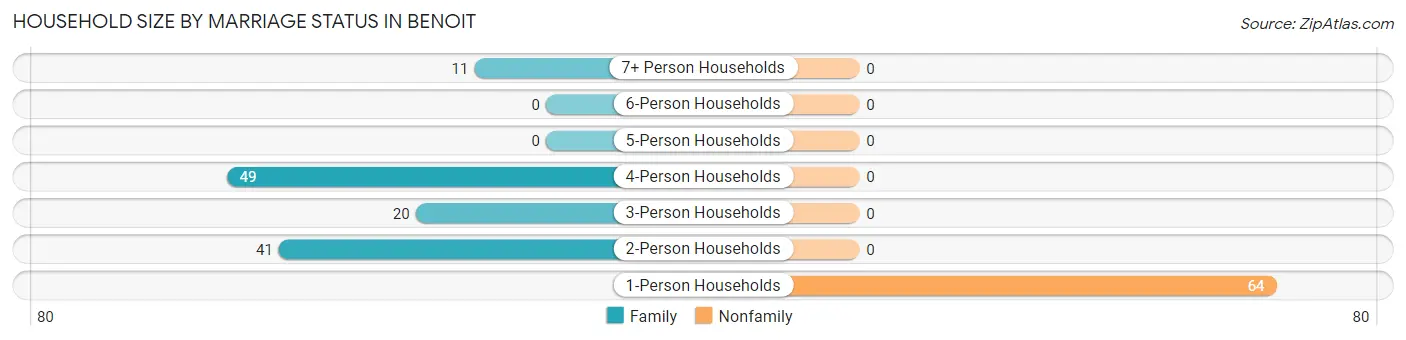
| Household Size | Family Households | Nonfamily Households |
| 1-Person Households | - | 64 (34.6%) |
| 2-Person Households | 41 (22.2%) | 0 (0.0%) |
| 3-Person Households | 20 (10.8%) | 0 (0.0%) |
| 4-Person Households | 49 (26.5%) | 0 (0.0%) |
| 5-Person Households | 0 (0.0%) | 0 (0.0%) |
| 6-Person Households | 0 (0.0%) | 0 (0.0%) |
| 7+ Person Households | 11 (5.9%) | 0 (0.0%) |
| Total | 121 (65.4%) | 64 (34.6%) |
Female Fertility in Benoit
Fertility by Age in Benoit
Average fertility rate in Benoit is 34.0 births per 1,000 women. Women in the age bracket of 20 to 34 years have the highest fertility rate with 133.0 births per 1,000 women. Women in the age bracket of 20 to 34 years acount for 100.0% of all women with births.
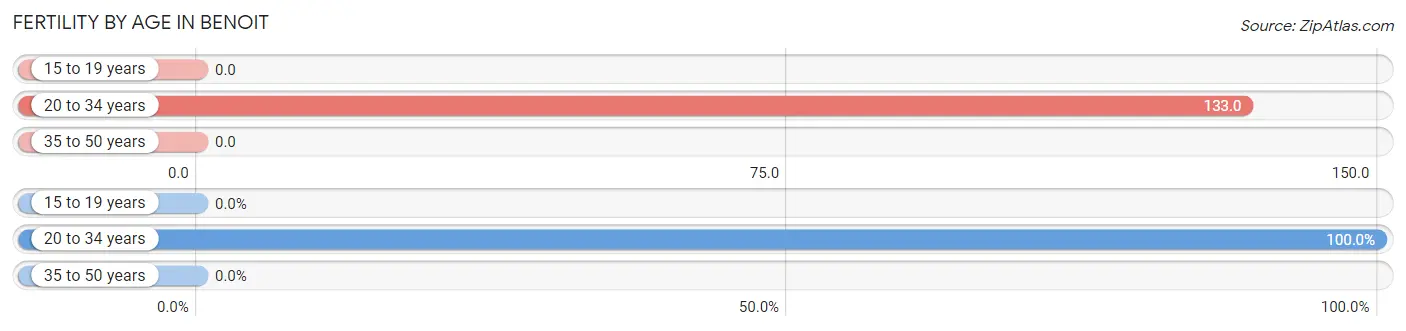
| Age Bracket | Women with Births | Births / 1,000 Women |
| 15 to 19 years | 0 (0.0%) | 0.0 |
| 20 to 34 years | 4 (100.0%) | 133.0 |
| 35 to 50 years | 0 (0.0%) | 0.0 |
| Total | 4 (100.0%) | 34.0 |
Fertility by Age by Marriage Status in Benoit
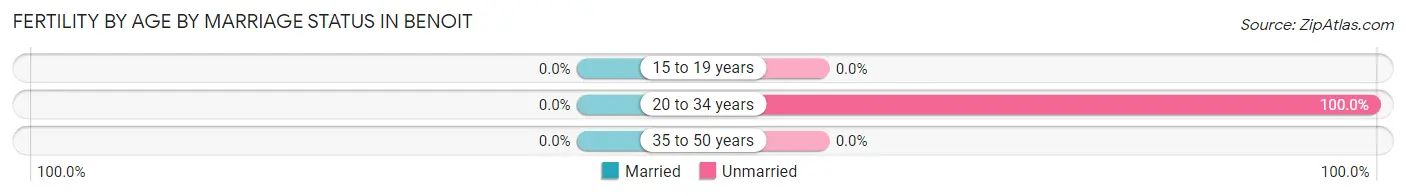
| Age Bracket | Married | Unmarried |
| 15 to 19 years | 0 (0.0%) | 0 (0.0%) |
| 20 to 34 years | 0 (0.0%) | 4 (100.0%) |
| 35 to 50 years | 0 (0.0%) | 0 (0.0%) |
| Total | 0 (0.0%) | 4 (100.0%) |
Fertility by Education in Benoit

| Educational Attainment | Women with Births | Births / 1,000 Women |
| Less than High School | 0 (0.0%) | 0.0 |
| High School Diploma | 4 (100.0%) | 308.0 |
| College or Associate's Degree | 0 (0.0%) | 0.0 |
| Bachelor's Degree | 0 (0.0%) | 0.0 |
| Graduate Degree | 0 (0.0%) | 0.0 |
| Total | 4 (100.0%) | 34.0 |
Fertility by Education by Marriage Status in Benoit
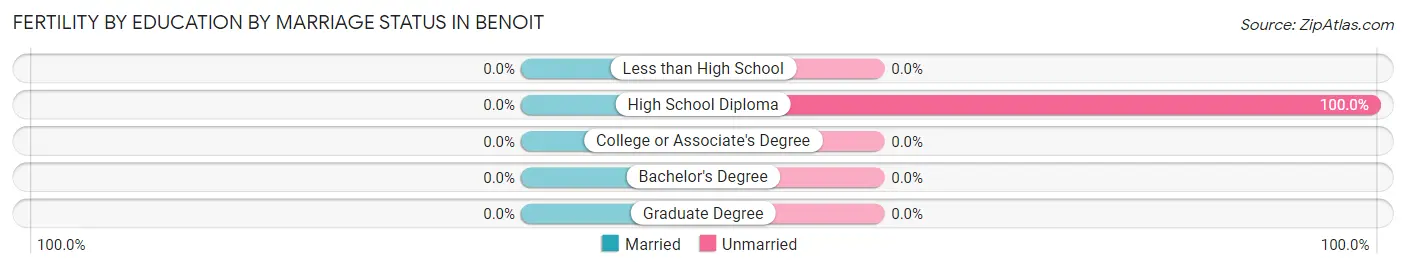
| Educational Attainment | Married | Unmarried |
| Less than High School | 0 (0.0%) | 0 (0.0%) |
| High School Diploma | 0 (0.0%) | 4 (100.0%) |
| College or Associate's Degree | 0 (0.0%) | 0 (0.0%) |
| Bachelor's Degree | 0 (0.0%) | 0 (0.0%) |
| Graduate Degree | 0 (0.0%) | 0 (0.0%) |
| Total | 0 (0.0%) | 4 (100.0%) |
Employment Characteristics in Benoit
Employment by Class of Employer in Benoit
Among the 165 employed individuals in Benoit, private company employees (91 | 55.1%), not-for-profit organizations (47 | 28.5%), and state government employees (16 | 9.7%) make up the most common classes of employment.
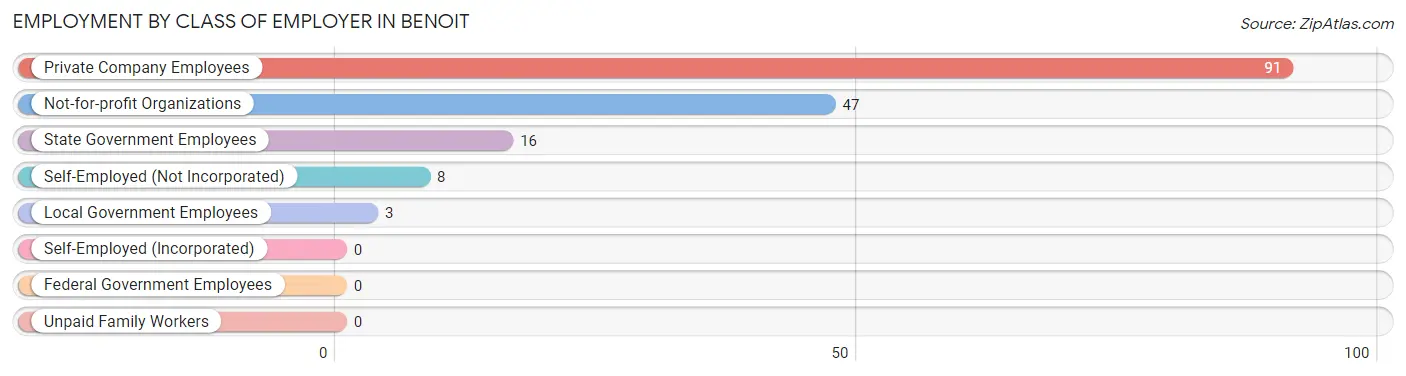
| Employer Class | # Employees | % Employees |
| Private Company Employees | 91 | 55.1% |
| Self-Employed (Incorporated) | 0 | 0.0% |
| Self-Employed (Not Incorporated) | 8 | 4.9% |
| Not-for-profit Organizations | 47 | 28.5% |
| Local Government Employees | 3 | 1.8% |
| State Government Employees | 16 | 9.7% |
| Federal Government Employees | 0 | 0.0% |
| Unpaid Family Workers | 0 | 0.0% |
| Total | 165 | 100.0% |
Employment Status by Age in Benoit
According to the labor force statistics for Benoit, out of the total population over 16 years of age (411), 48.2% or 198 individuals are in the labor force, with 15.2% or 30 of them unemployed. The age group with the highest labor force participation rate is 45 to 54 years, with 87.2% or 68 individuals in the labor force. Within the labor force, the 25 to 29 years age range has the highest percentage of unemployed individuals, with 100.0% or 7 of them being unemployed.
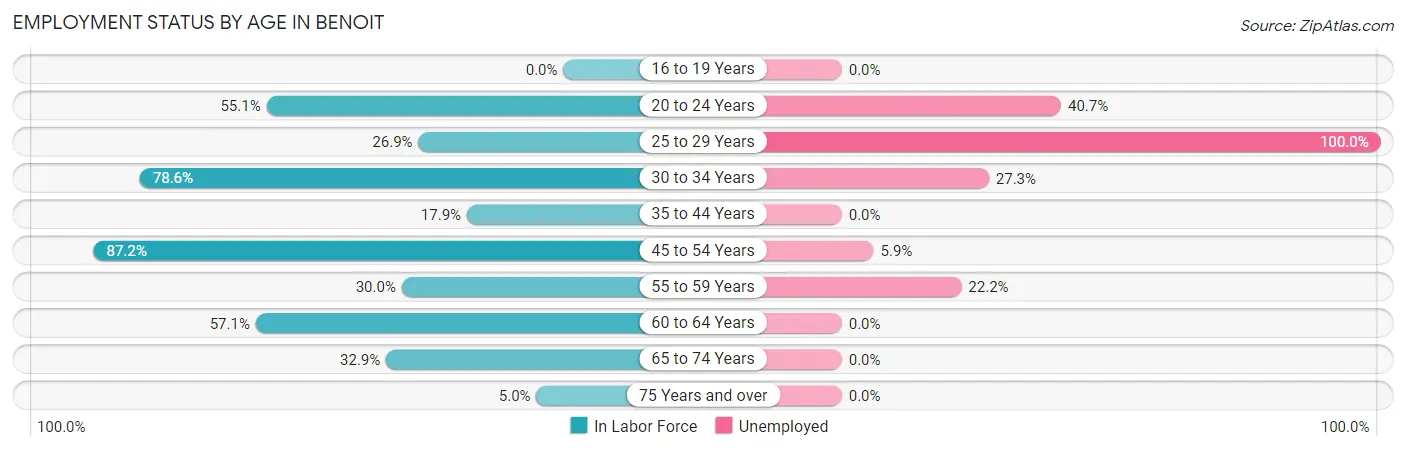
| Age Bracket | In Labor Force | Unemployed |
| 16 to 19 Years | 0 (0.0%) | 0 (0.0%) |
| 20 to 24 Years | 27 (55.1%) | 11 (40.7%) |
| 25 to 29 Years | 7 (26.9%) | 7 (100.0%) |
| 30 to 34 Years | 22 (78.6%) | 6 (27.3%) |
| 35 to 44 Years | 5 (17.9%) | 0 (0.0%) |
| 45 to 54 Years | 68 (87.2%) | 4 (5.9%) |
| 55 to 59 Years | 9 (30.0%) | 2 (22.2%) |
| 60 to 64 Years | 36 (57.1%) | 0 (0.0%) |
| 65 to 74 Years | 23 (32.9%) | 0 (0.0%) |
| 75 Years and over | 1 (5.0%) | 0 (0.0%) |
| Total | 198 (48.2%) | 30 (15.2%) |
Employment Status by Educational Attainment in Benoit
According to labor force statistics for Benoit, 58.1% of individuals (147) out of the total population between 25 and 64 years of age (253) are in the labor force, with 12.9% or 19 of them being unemployed. The group with the highest labor force participation rate are those with the educational attainment of college / associate degree, with 93.2% or 82 individuals in the labor force. Within the labor force, individuals with less than high school education have the highest percentage of unemployment, with 60.0% or 3 of them being unemployed.
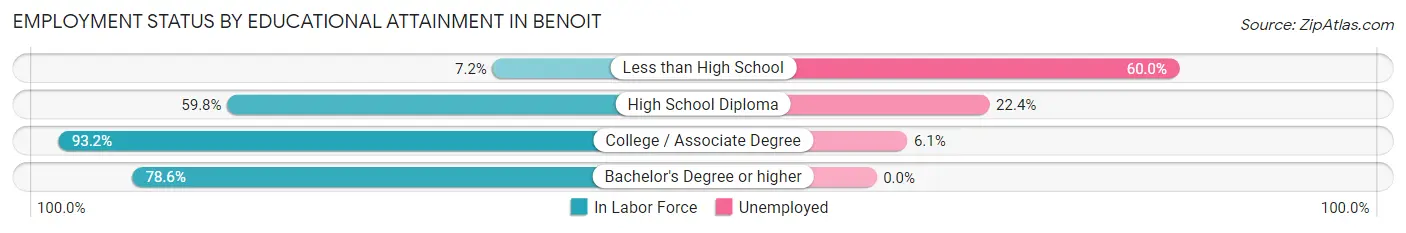
| Educational Attainment | In Labor Force | Unemployed |
| Less than High School | 5 (7.2%) | 41 (60.0%) |
| High School Diploma | 49 (59.8%) | 18 (22.4%) |
| College / Associate Degree | 82 (93.2%) | 5 (6.1%) |
| Bachelor's Degree or higher | 11 (78.6%) | 0 (0.0%) |
| Total | 147 (58.1%) | 33 (12.9%) |
Employment Occupations by Sex in Benoit
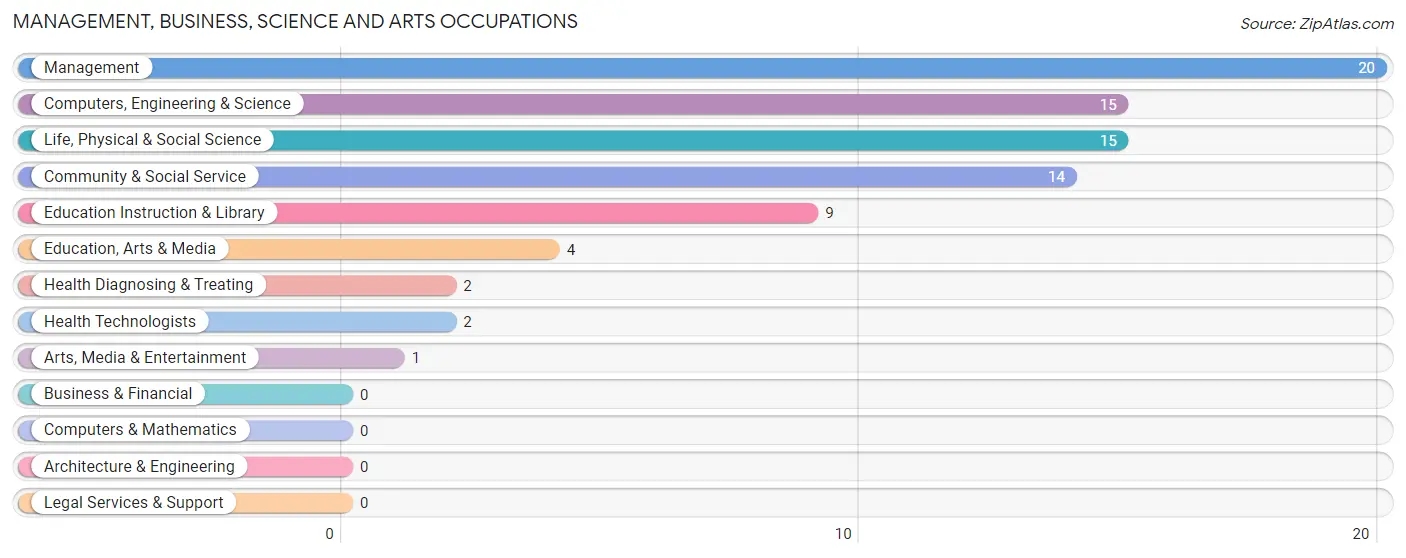
Management, Business, Science and Arts Occupations
The most common Management, Business, Science and Arts occupations in Benoit are Management (20 | 11.9%), Computers, Engineering & Science (15 | 8.9%), Life, Physical & Social Science (15 | 8.9%), Community & Social Service (14 | 8.3%), and Education Instruction & Library (9 | 5.4%).
Management, Business, Science and Arts Occupations by Sex
Within the Management, Business, Science and Arts occupations in Benoit, the most male-oriented occupations are Computers, Engineering & Science (46.7%), Life, Physical & Social Science (46.7%), and Education Instruction & Library (22.2%), while the most female-oriented occupations are Education, Arts & Media (100.0%), Arts, Media & Entertainment (100.0%), and Health Diagnosing & Treating (100.0%).
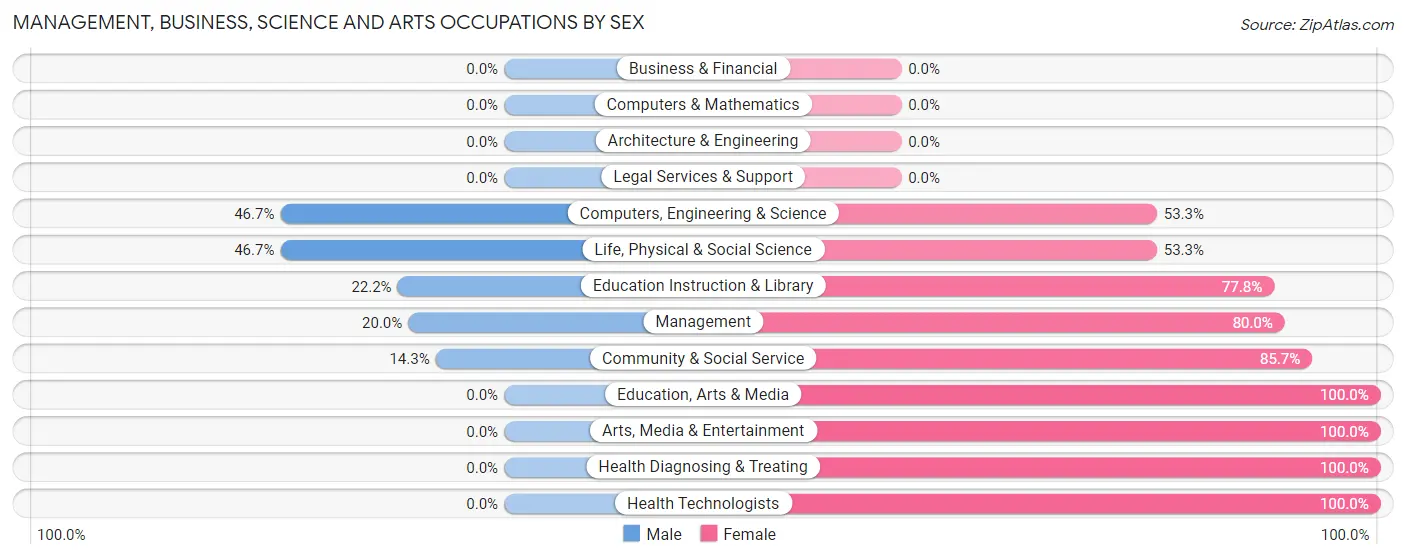
| Occupation | Male | Female |
| Management | 4 (20.0%) | 16 (80.0%) |
| Business & Financial | 0 (0.0%) | 0 (0.0%) |
| Computers, Engineering & Science | 7 (46.7%) | 8 (53.3%) |
| Computers & Mathematics | 0 (0.0%) | 0 (0.0%) |
| Architecture & Engineering | 0 (0.0%) | 0 (0.0%) |
| Life, Physical & Social Science | 7 (46.7%) | 8 (53.3%) |
| Community & Social Service | 2 (14.3%) | 12 (85.7%) |
| Education, Arts & Media | 0 (0.0%) | 4 (100.0%) |
| Legal Services & Support | 0 (0.0%) | 0 (0.0%) |
| Education Instruction & Library | 2 (22.2%) | 7 (77.8%) |
| Arts, Media & Entertainment | 0 (0.0%) | 1 (100.0%) |
| Health Diagnosing & Treating | 0 (0.0%) | 2 (100.0%) |
| Health Technologists | 0 (0.0%) | 2 (100.0%) |
| Total (Category) | 13 (25.5%) | 38 (74.5%) |
| Total (Overall) | 74 (44.1%) | 94 (55.9%) |
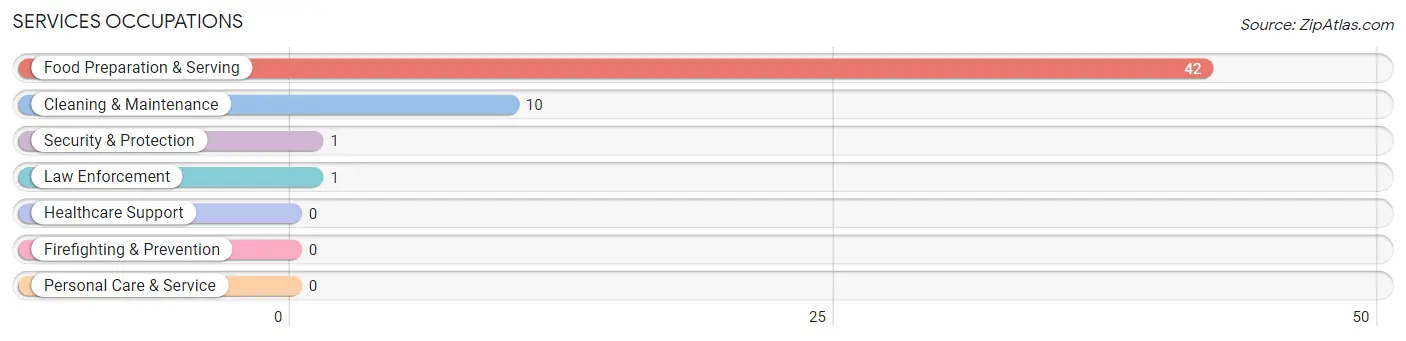
Services Occupations
The most common Services occupations in Benoit are Food Preparation & Serving (42 | 25.0%), Cleaning & Maintenance (10 | 5.9%), Security & Protection (1 | 0.6%), and Law Enforcement (1 | 0.6%).
Services Occupations by Sex
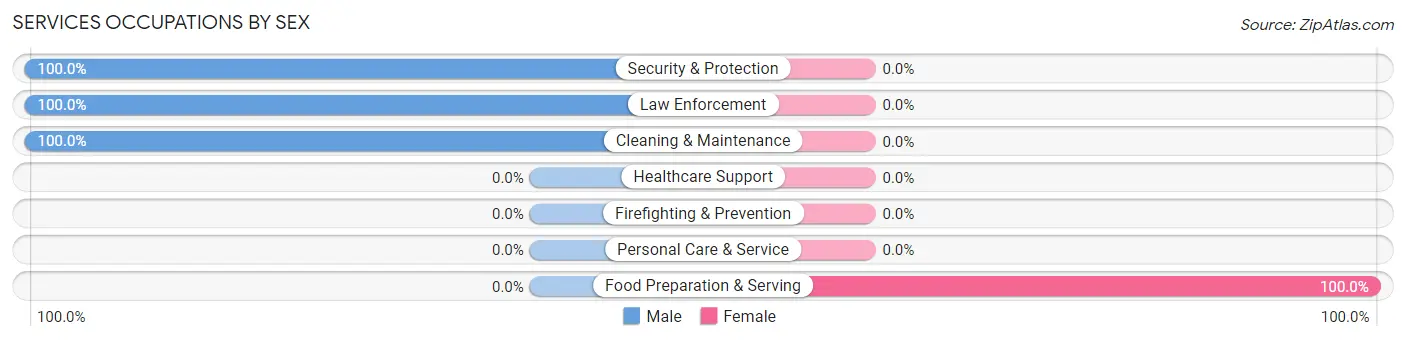
| Occupation | Male | Female |
| Healthcare Support | 0 (0.0%) | 0 (0.0%) |
| Security & Protection | 1 (100.0%) | 0 (0.0%) |
| Firefighting & Prevention | 0 (0.0%) | 0 (0.0%) |
| Law Enforcement | 1 (100.0%) | 0 (0.0%) |
| Food Preparation & Serving | 0 (0.0%) | 42 (100.0%) |
| Cleaning & Maintenance | 10 (100.0%) | 0 (0.0%) |
| Personal Care & Service | 0 (0.0%) | 0 (0.0%) |
| Total (Category) | 11 (20.7%) | 42 (79.2%) |
| Total (Overall) | 74 (44.1%) | 94 (55.9%) |
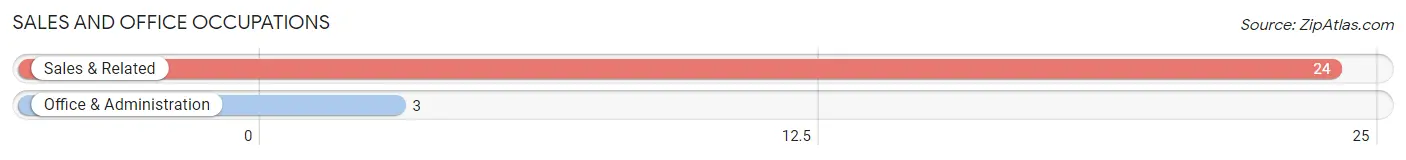
Sales and Office Occupations
The most common Sales and Office occupations in Benoit are Sales & Related (24 | 14.3%), and Office & Administration (3 | 1.8%).
Sales and Office Occupations by Sex
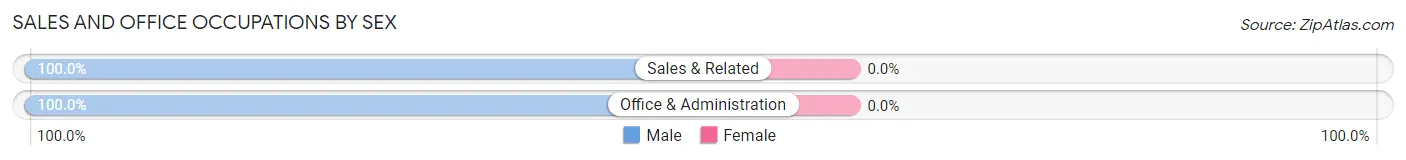
| Occupation | Male | Female |
| Sales & Related | 24 (100.0%) | 0 (0.0%) |
| Office & Administration | 3 (100.0%) | 0 (0.0%) |
| Total (Category) | 27 (100.0%) | 0 (0.0%) |
| Total (Overall) | 74 (44.1%) | 94 (55.9%) |
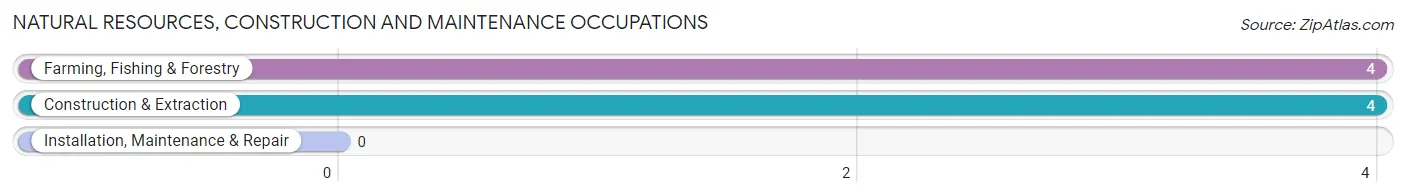
Natural Resources, Construction and Maintenance Occupations
The most common Natural Resources, Construction and Maintenance occupations in Benoit are Farming, Fishing & Forestry (4 | 2.4%), and Construction & Extraction (4 | 2.4%).
Natural Resources, Construction and Maintenance Occupations by Sex
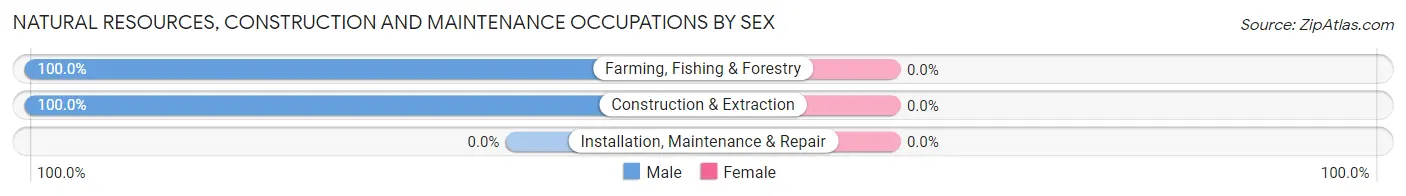
| Occupation | Male | Female |
| Farming, Fishing & Forestry | 4 (100.0%) | 0 (0.0%) |
| Construction & Extraction | 4 (100.0%) | 0 (0.0%) |
| Installation, Maintenance & Repair | 0 (0.0%) | 0 (0.0%) |
| Total (Category) | 8 (100.0%) | 0 (0.0%) |
| Total (Overall) | 74 (44.1%) | 94 (55.9%) |
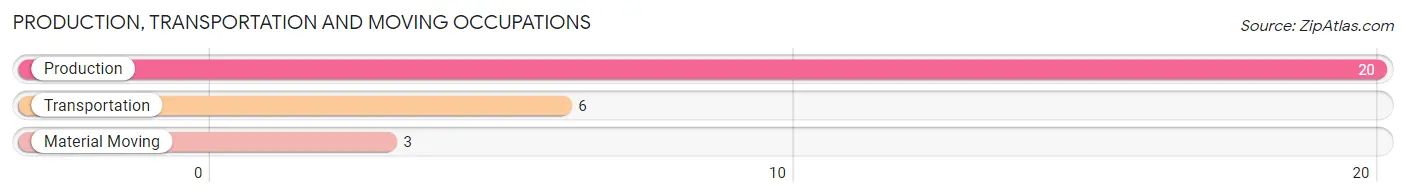
Production, Transportation and Moving Occupations
The most common Production, Transportation and Moving occupations in Benoit are Production (20 | 11.9%), Transportation (6 | 3.6%), and Material Moving (3 | 1.8%).
Production, Transportation and Moving Occupations by Sex
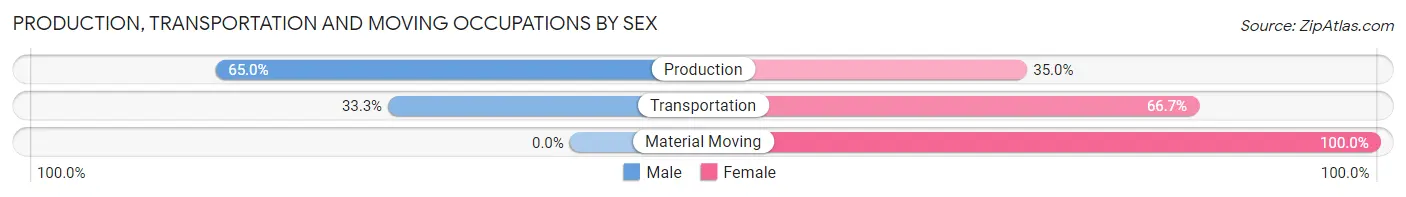
| Occupation | Male | Female |
| Production | 13 (65.0%) | 7 (35.0%) |
| Transportation | 2 (33.3%) | 4 (66.7%) |
| Material Moving | 0 (0.0%) | 3 (100.0%) |
| Total (Category) | 15 (51.7%) | 14 (48.3%) |
| Total (Overall) | 74 (44.1%) | 94 (55.9%) |
Employment Industries by Sex in Benoit
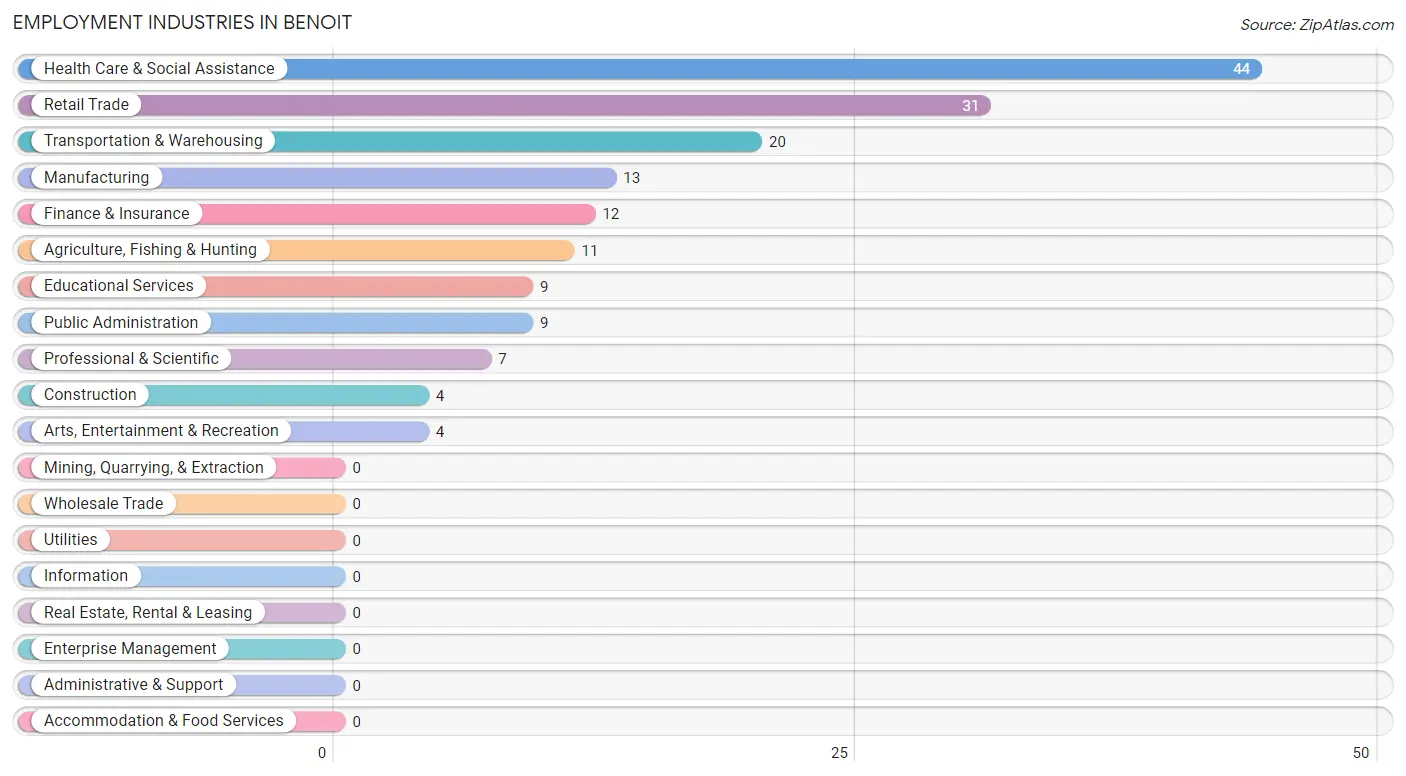
Employment Industries in Benoit
The major employment industries in Benoit include Health Care & Social Assistance (44 | 26.2%), Retail Trade (31 | 18.4%), Transportation & Warehousing (20 | 11.9%), Manufacturing (13 | 7.7%), and Finance & Insurance (12 | 7.1%).
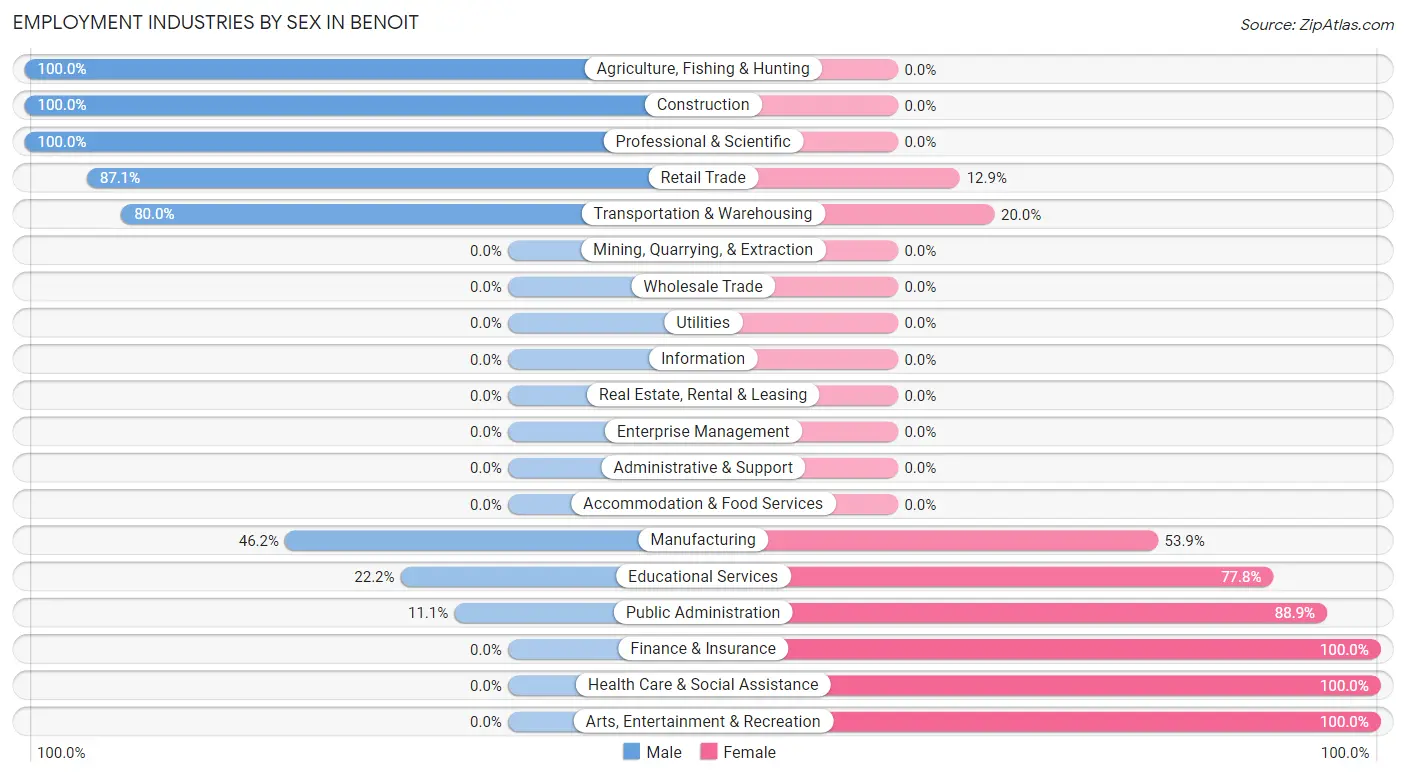
Employment Industries by Sex in Benoit
The Benoit industries that see more men than women are Agriculture, Fishing & Hunting (100.0%), Construction (100.0%), and Professional & Scientific (100.0%), whereas the industries that tend to have a higher number of women are Finance & Insurance (100.0%), Health Care & Social Assistance (100.0%), and Arts, Entertainment & Recreation (100.0%).
| Industry | Male | Female |
| Agriculture, Fishing & Hunting | 11 (100.0%) | 0 (0.0%) |
| Mining, Quarrying, & Extraction | 0 (0.0%) | 0 (0.0%) |
| Construction | 4 (100.0%) | 0 (0.0%) |
| Manufacturing | 6 (46.2%) | 7 (53.8%) |
| Wholesale Trade | 0 (0.0%) | 0 (0.0%) |
| Retail Trade | 27 (87.1%) | 4 (12.9%) |
| Transportation & Warehousing | 16 (80.0%) | 4 (20.0%) |
| Utilities | 0 (0.0%) | 0 (0.0%) |
| Information | 0 (0.0%) | 0 (0.0%) |
| Finance & Insurance | 0 (0.0%) | 12 (100.0%) |
| Real Estate, Rental & Leasing | 0 (0.0%) | 0 (0.0%) |
| Professional & Scientific | 7 (100.0%) | 0 (0.0%) |
| Enterprise Management | 0 (0.0%) | 0 (0.0%) |
| Administrative & Support | 0 (0.0%) | 0 (0.0%) |
| Educational Services | 2 (22.2%) | 7 (77.8%) |
| Health Care & Social Assistance | 0 (0.0%) | 44 (100.0%) |
| Arts, Entertainment & Recreation | 0 (0.0%) | 4 (100.0%) |
| Accommodation & Food Services | 0 (0.0%) | 0 (0.0%) |
| Public Administration | 1 (11.1%) | 8 (88.9%) |
| Total | 74 (44.1%) | 94 (55.9%) |
Education in Benoit
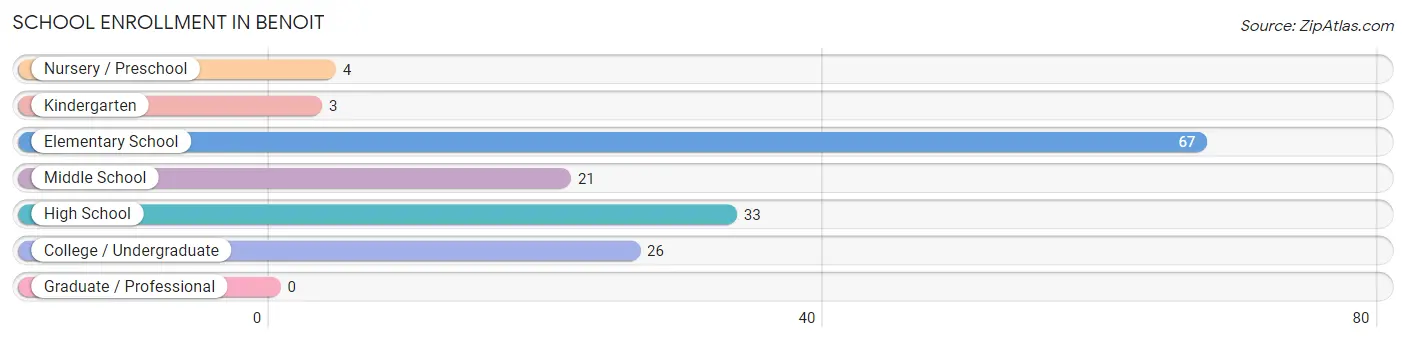
School Enrollment in Benoit
The most common levels of schooling among the 154 students in Benoit are elementary school (67 | 43.5%), high school (33 | 21.4%), and college / undergraduate (26 | 16.9%).
| School Level | # Students | % Students |
| Nursery / Preschool | 4 | 2.6% |
| Kindergarten | 3 | 1.9% |
| Elementary School | 67 | 43.5% |
| Middle School | 21 | 13.6% |
| High School | 33 | 21.4% |
| College / Undergraduate | 26 | 16.9% |
| Graduate / Professional | 0 | 0.0% |
| Total | 154 | 100.0% |
School Enrollment by Age by Funding Source in Benoit
Out of a total of 154 students who are enrolled in schools in Benoit, 2 (1.3%) attend a private institution, while the remaining 152 (98.7%) are enrolled in public schools. The age group of 10 to 14 year olds has the highest likelihood of being enrolled in private schools, with 2 (6.9% in the age bracket) enrolled. Conversely, the age group of 3 to 4 year olds has the lowest likelihood of being enrolled in a private school, with 4 (100.0% in the age bracket) attending a public institution.
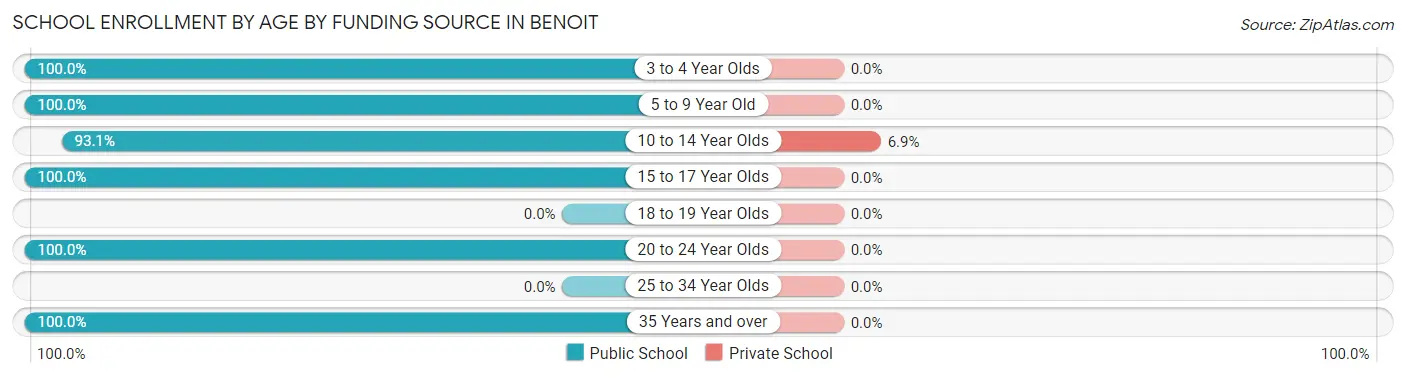
| Age Bracket | Public School | Private School |
| 3 to 4 Year Olds | 4 (100.0%) | 0 (0.0%) |
| 5 to 9 Year Old | 66 (100.0%) | 0 (0.0%) |
| 10 to 14 Year Olds | 27 (93.1%) | 2 (6.9%) |
| 15 to 17 Year Olds | 29 (100.0%) | 0 (0.0%) |
| 18 to 19 Year Olds | 0 (0.0%) | 0 (0.0%) |
| 20 to 24 Year Olds | 23 (100.0%) | 0 (0.0%) |
| 25 to 34 Year Olds | 0 (0.0%) | 0 (0.0%) |
| 35 Years and over | 3 (100.0%) | 0 (0.0%) |
| Total | 152 (98.7%) | 2 (1.3%) |
Educational Attainment by Field of Study in Benoit
Education (9 | 27.3%), bio, nature & agricultural (5 | 15.1%), business (5 | 15.1%), liberal arts & history (5 | 15.1%), and science & technology (4 | 12.1%) are the most common fields of study among 33 individuals in Benoit who have obtained a bachelor's degree or higher.
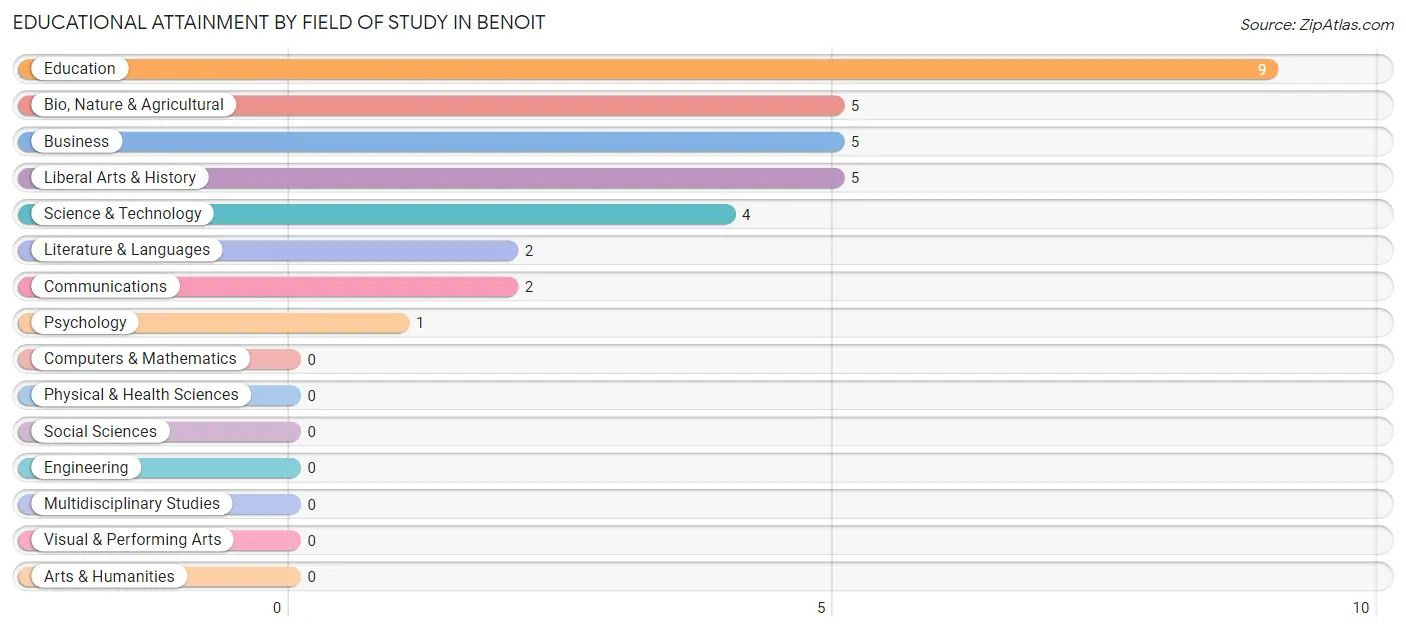
| Field of Study | # Graduates | % Graduates |
| Computers & Mathematics | 0 | 0.0% |
| Bio, Nature & Agricultural | 5 | 15.1% |
| Physical & Health Sciences | 0 | 0.0% |
| Psychology | 1 | 3.0% |
| Social Sciences | 0 | 0.0% |
| Engineering | 0 | 0.0% |
| Multidisciplinary Studies | 0 | 0.0% |
| Science & Technology | 4 | 12.1% |
| Business | 5 | 15.1% |
| Education | 9 | 27.3% |
| Literature & Languages | 2 | 6.1% |
| Liberal Arts & History | 5 | 15.1% |
| Visual & Performing Arts | 0 | 0.0% |
| Communications | 2 | 6.1% |
| Arts & Humanities | 0 | 0.0% |
| Total | 33 | 100.0% |
Transportation & Commute in Benoit
Vehicle Availability by Sex in Benoit
The most prevalent vehicle ownership categories in Benoit are males with 2 vehicles (37, accounting for 52.1%) and females with 2 vehicles (15, making up 39.4%).
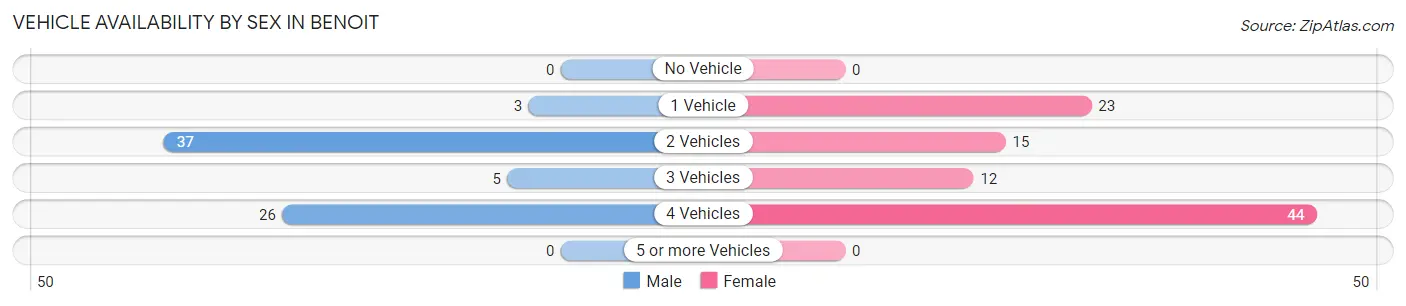
| Vehicles Available | Male | Female |
| No Vehicle | 0 (0.0%) | 0 (0.0%) |
| 1 Vehicle | 3 (4.2%) | 23 (24.5%) |
| 2 Vehicles | 37 (52.1%) | 15 (16.0%) |
| 3 Vehicles | 5 (7.0%) | 12 (12.8%) |
| 4 Vehicles | 26 (36.6%) | 44 (46.8%) |
| 5 or more Vehicles | 0 (0.0%) | 0 (0.0%) |
| Total | 71 (100.0%) | 94 (100.0%) |
Commute Time in Benoit
The most frequently occuring commute durations in Benoit are 30 to 34 minutes (65 commuters, 39.9%), 90 or more minutes (26 commuters, 16.0%), and 25 to 29 minutes (21 commuters, 12.9%).
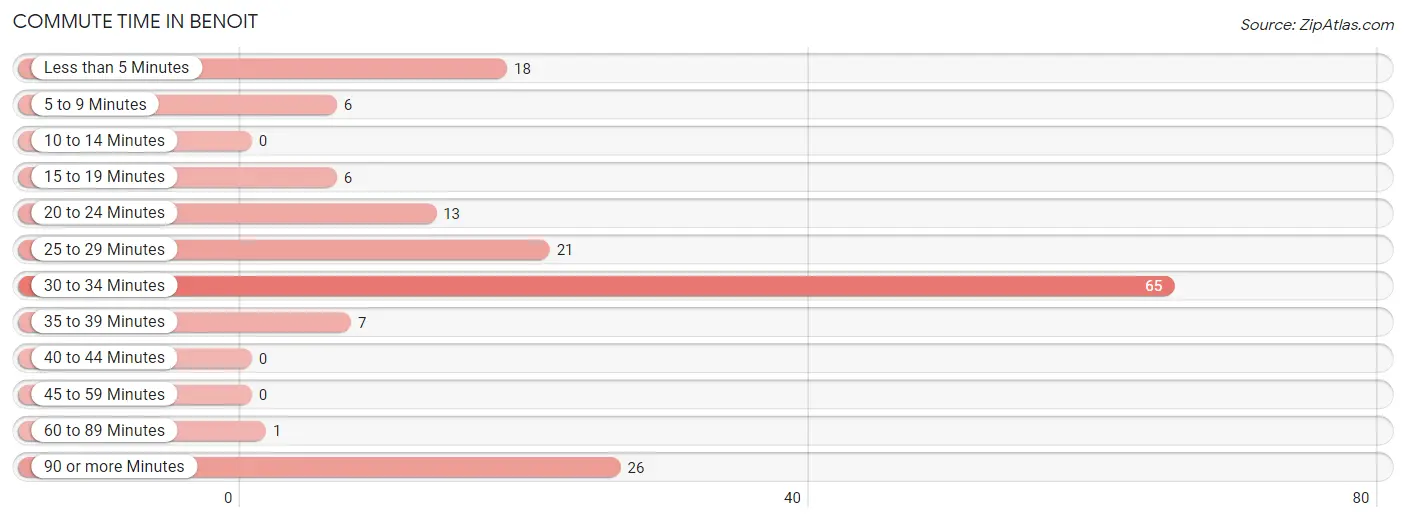
| Commute Time | # Commuters | % Commuters |
| Less than 5 Minutes | 18 | 11.0% |
| 5 to 9 Minutes | 6 | 3.7% |
| 10 to 14 Minutes | 0 | 0.0% |
| 15 to 19 Minutes | 6 | 3.7% |
| 20 to 24 Minutes | 13 | 8.0% |
| 25 to 29 Minutes | 21 | 12.9% |
| 30 to 34 Minutes | 65 | 39.9% |
| 35 to 39 Minutes | 7 | 4.3% |
| 40 to 44 Minutes | 0 | 0.0% |
| 45 to 59 Minutes | 0 | 0.0% |
| 60 to 89 Minutes | 1 | 0.6% |
| 90 or more Minutes | 26 | 16.0% |
Commute Time by Sex in Benoit
The most common commute times in Benoit are 90 or more minutes (26 commuters, 36.6%) for males and 30 to 34 minutes (61 commuters, 66.3%) for females.
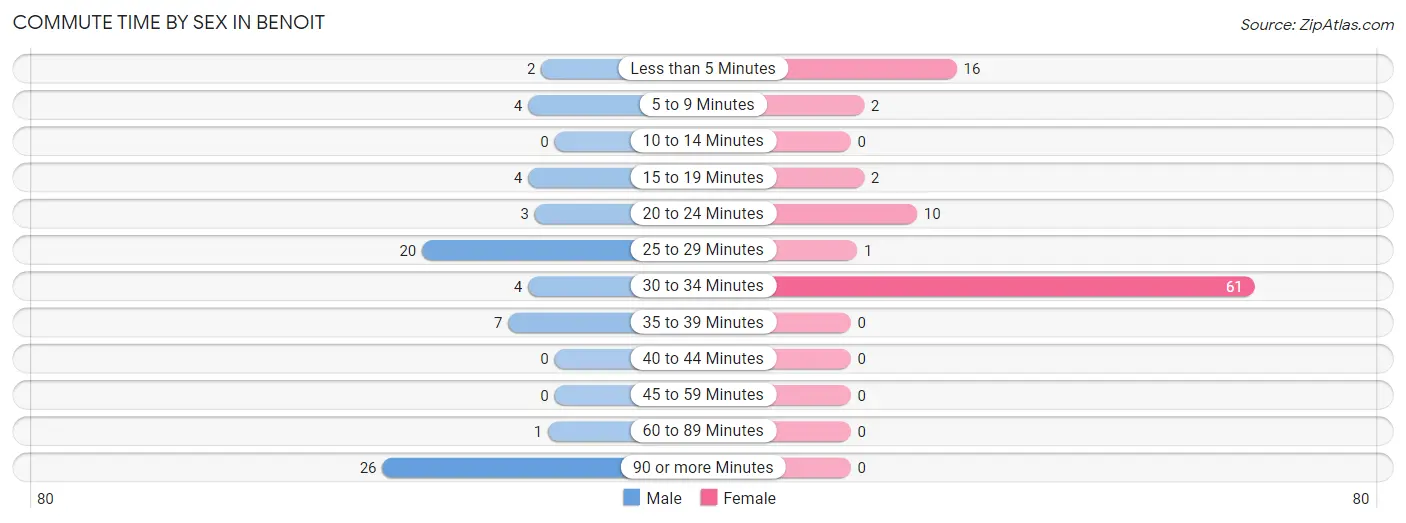
| Commute Time | Male | Female |
| Less than 5 Minutes | 2 (2.8%) | 16 (17.4%) |
| 5 to 9 Minutes | 4 (5.6%) | 2 (2.2%) |
| 10 to 14 Minutes | 0 (0.0%) | 0 (0.0%) |
| 15 to 19 Minutes | 4 (5.6%) | 2 (2.2%) |
| 20 to 24 Minutes | 3 (4.2%) | 10 (10.9%) |
| 25 to 29 Minutes | 20 (28.2%) | 1 (1.1%) |
| 30 to 34 Minutes | 4 (5.6%) | 61 (66.3%) |
| 35 to 39 Minutes | 7 (9.9%) | 0 (0.0%) |
| 40 to 44 Minutes | 0 (0.0%) | 0 (0.0%) |
| 45 to 59 Minutes | 0 (0.0%) | 0 (0.0%) |
| 60 to 89 Minutes | 1 (1.4%) | 0 (0.0%) |
| 90 or more Minutes | 26 (36.6%) | 0 (0.0%) |
Time of Departure to Work by Sex in Benoit
The most frequent times of departure to work in Benoit are 6:00 AM to 6:29 AM (40, 56.3%) for males and 10:00 AM to 10:59 AM (47, 51.1%) for females.
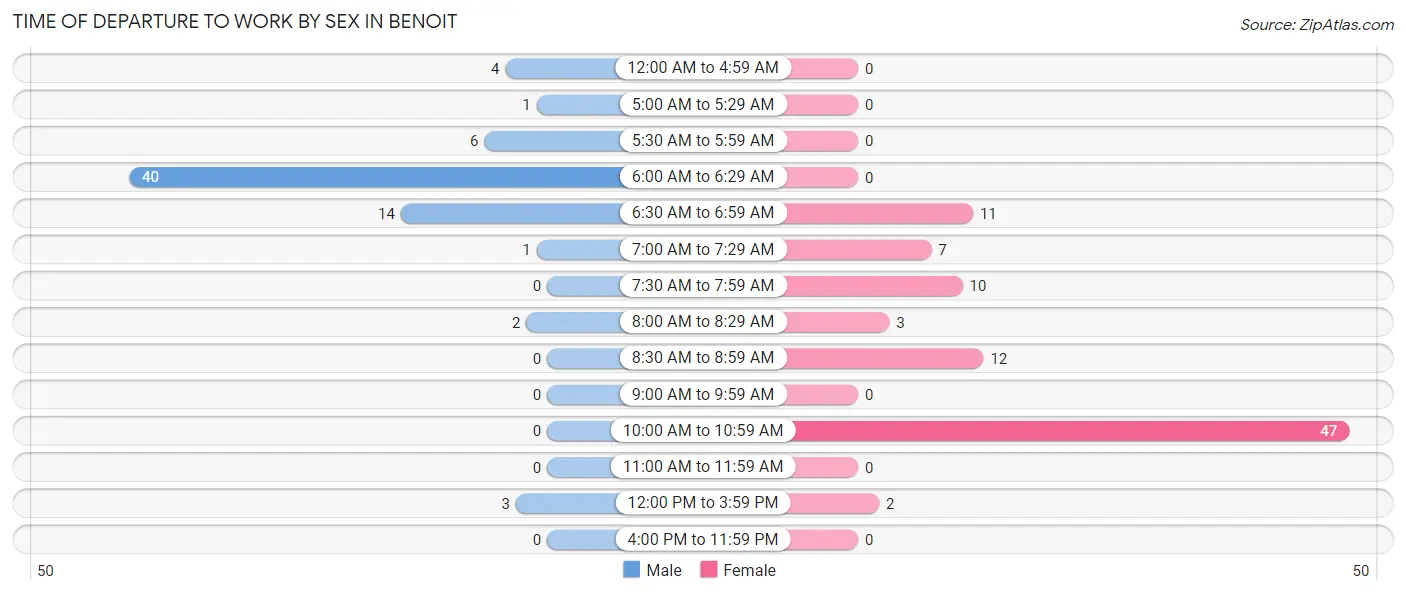
| Time of Departure | Male | Female |
| 12:00 AM to 4:59 AM | 4 (5.6%) | 0 (0.0%) |
| 5:00 AM to 5:29 AM | 1 (1.4%) | 0 (0.0%) |
| 5:30 AM to 5:59 AM | 6 (8.5%) | 0 (0.0%) |
| 6:00 AM to 6:29 AM | 40 (56.3%) | 0 (0.0%) |
| 6:30 AM to 6:59 AM | 14 (19.7%) | 11 (12.0%) |
| 7:00 AM to 7:29 AM | 1 (1.4%) | 7 (7.6%) |
| 7:30 AM to 7:59 AM | 0 (0.0%) | 10 (10.9%) |
| 8:00 AM to 8:29 AM | 2 (2.8%) | 3 (3.3%) |
| 8:30 AM to 8:59 AM | 0 (0.0%) | 12 (13.0%) |
| 9:00 AM to 9:59 AM | 0 (0.0%) | 0 (0.0%) |
| 10:00 AM to 10:59 AM | 0 (0.0%) | 47 (51.1%) |
| 11:00 AM to 11:59 AM | 0 (0.0%) | 0 (0.0%) |
| 12:00 PM to 3:59 PM | 3 (4.2%) | 2 (2.2%) |
| 4:00 PM to 11:59 PM | 0 (0.0%) | 0 (0.0%) |
| Total | 71 (100.0%) | 92 (100.0%) |
Housing Occupancy in Benoit
Occupancy by Ownership in Benoit
Of the total 185 dwellings in Benoit, owner-occupied units account for 128 (69.2%), while renter-occupied units make up 57 (30.8%).
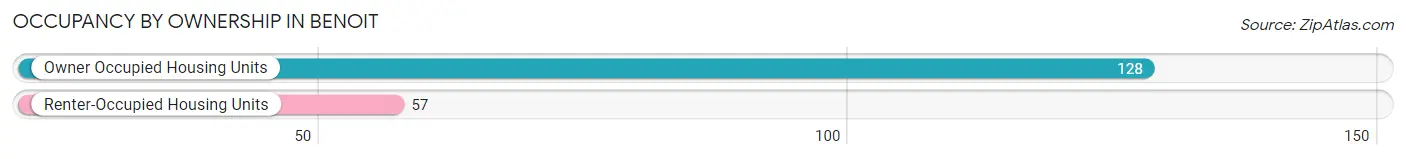
| Occupancy | # Housing Units | % Housing Units |
| Owner Occupied Housing Units | 128 | 69.2% |
| Renter-Occupied Housing Units | 57 | 30.8% |
| Total Occupied Housing Units | 185 | 100.0% |
Occupancy by Household Size in Benoit
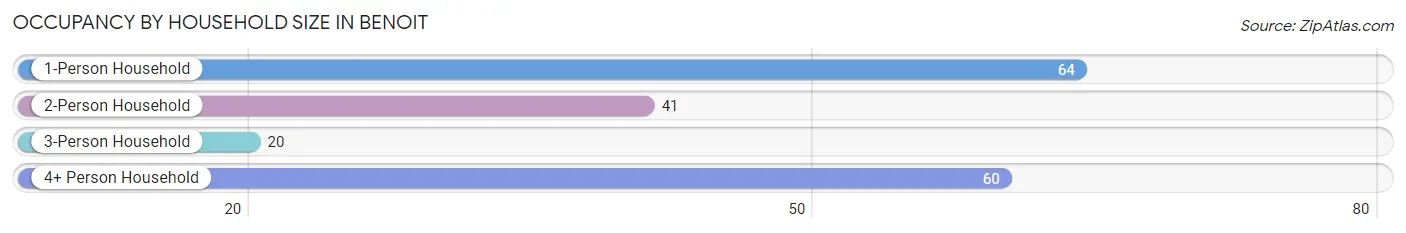
| Household Size | # Housing Units | % Housing Units |
| 1-Person Household | 64 | 34.6% |
| 2-Person Household | 41 | 22.2% |
| 3-Person Household | 20 | 10.8% |
| 4+ Person Household | 60 | 32.4% |
| Total Housing Units | 185 | 100.0% |
Occupancy by Ownership by Household Size in Benoit
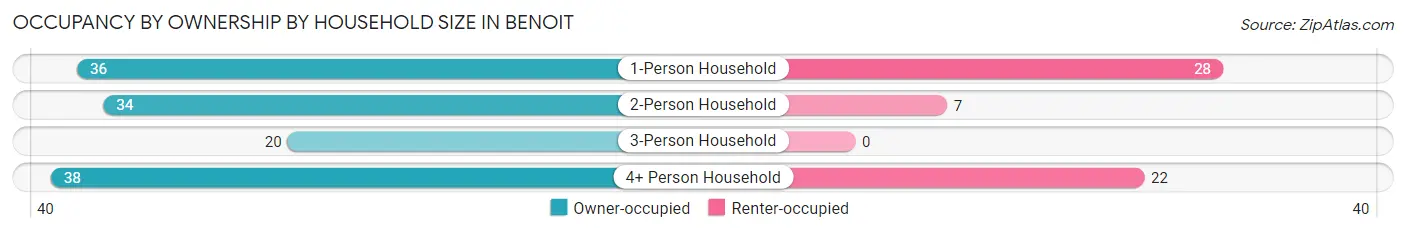
| Household Size | Owner-occupied | Renter-occupied |
| 1-Person Household | 36 (56.2%) | 28 (43.8%) |
| 2-Person Household | 34 (82.9%) | 7 (17.1%) |
| 3-Person Household | 20 (100.0%) | 0 (0.0%) |
| 4+ Person Household | 38 (63.3%) | 22 (36.7%) |
| Total Housing Units | 128 (69.2%) | 57 (30.8%) |
Occupancy by Educational Attainment in Benoit
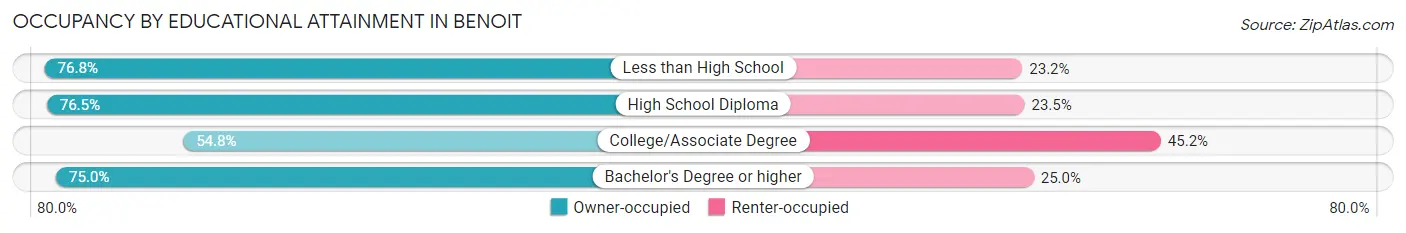
| Household Size | Owner-occupied | Renter-occupied |
| Less than High School | 53 (76.8%) | 16 (23.2%) |
| High School Diploma | 26 (76.5%) | 8 (23.5%) |
| College/Associate Degree | 34 (54.8%) | 28 (45.2%) |
| Bachelor's Degree or higher | 15 (75.0%) | 5 (25.0%) |
Occupancy by Age of Householder in Benoit
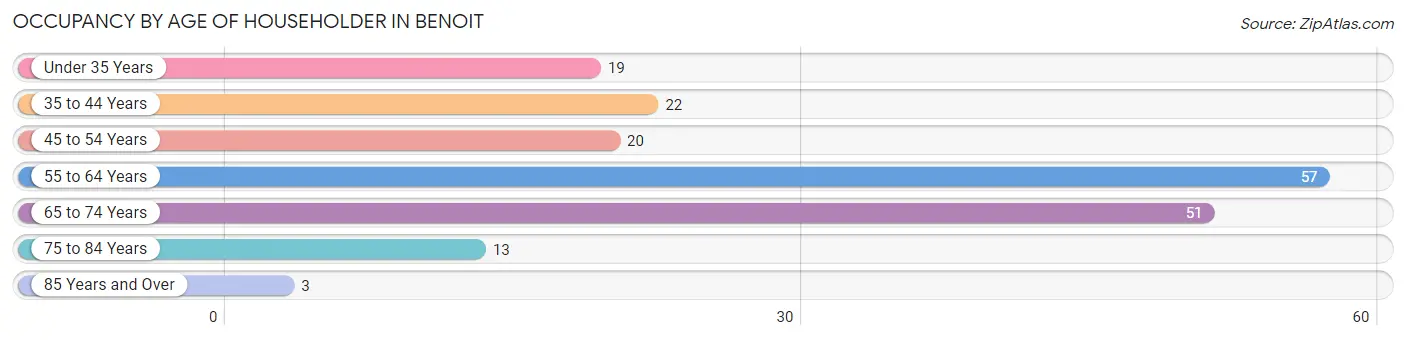
| Age Bracket | # Households | % Households |
| Under 35 Years | 19 | 10.3% |
| 35 to 44 Years | 22 | 11.9% |
| 45 to 54 Years | 20 | 10.8% |
| 55 to 64 Years | 57 | 30.8% |
| 65 to 74 Years | 51 | 27.6% |
| 75 to 84 Years | 13 | 7.0% |
| 85 Years and Over | 3 | 1.6% |
| Total | 185 | 100.0% |
Housing Finances in Benoit
Median Income by Occupancy in Benoit
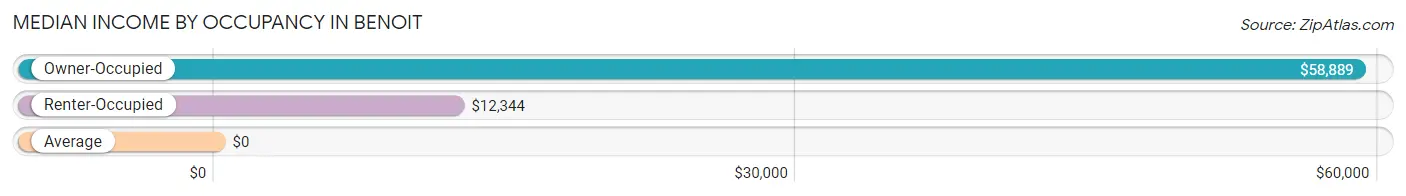
| Occupancy Type | # Households | Median Income |
| Owner-Occupied | 128 (69.2%) | $58,889 |
| Renter-Occupied | 57 (30.8%) | $12,344 |
| Average | 185 (100.0%) | $0 |
Occupancy by Householder Income Bracket in Benoit
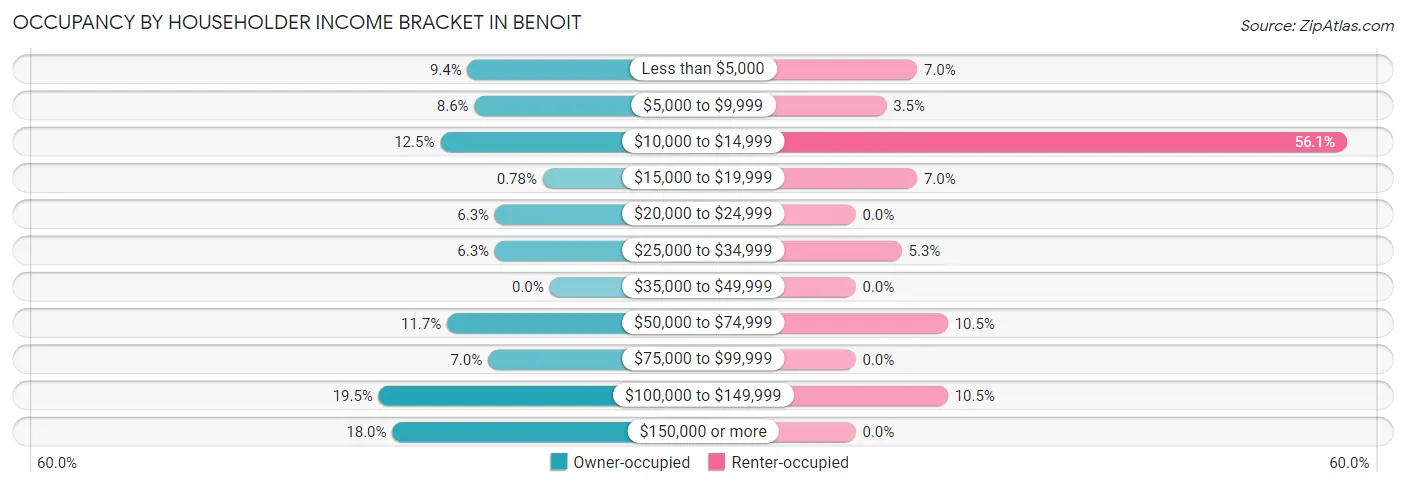
| Income Bracket | Owner-occupied | Renter-occupied |
| Less than $5,000 | 12 (9.4%) | 4 (7.0%) |
| $5,000 to $9,999 | 11 (8.6%) | 2 (3.5%) |
| $10,000 to $14,999 | 16 (12.5%) | 32 (56.1%) |
| $15,000 to $19,999 | 1 (0.8%) | 4 (7.0%) |
| $20,000 to $24,999 | 8 (6.2%) | 0 (0.0%) |
| $25,000 to $34,999 | 8 (6.2%) | 3 (5.3%) |
| $35,000 to $49,999 | 0 (0.0%) | 0 (0.0%) |
| $50,000 to $74,999 | 15 (11.7%) | 6 (10.5%) |
| $75,000 to $99,999 | 9 (7.0%) | 0 (0.0%) |
| $100,000 to $149,999 | 25 (19.5%) | 6 (10.5%) |
| $150,000 or more | 23 (18.0%) | 0 (0.0%) |
| Total | 128 (100.0%) | 57 (100.0%) |
Monthly Housing Cost Tiers in Benoit
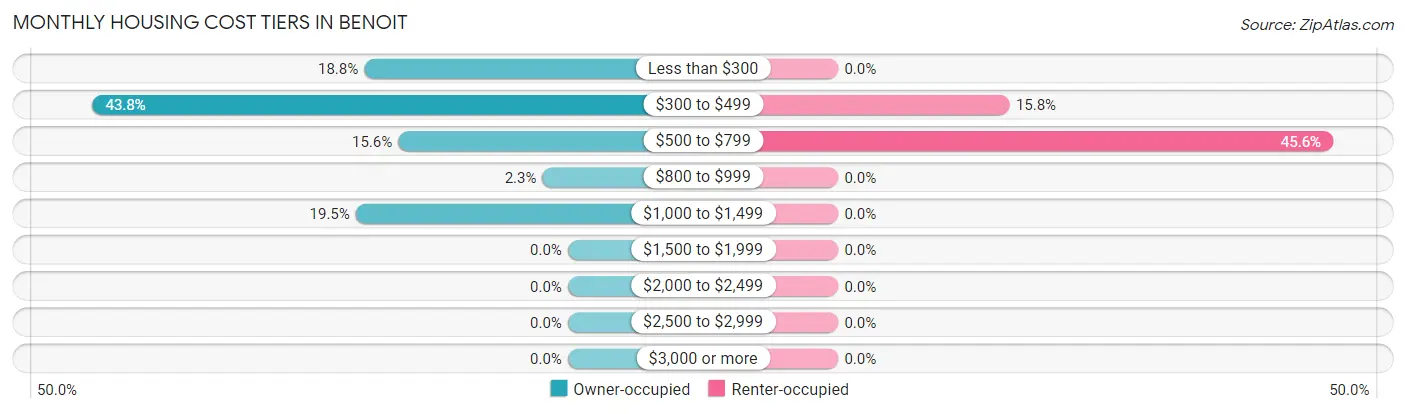
| Monthly Cost | Owner-occupied | Renter-occupied |
| Less than $300 | 24 (18.8%) | 0 (0.0%) |
| $300 to $499 | 56 (43.8%) | 9 (15.8%) |
| $500 to $799 | 20 (15.6%) | 26 (45.6%) |
| $800 to $999 | 3 (2.3%) | 0 (0.0%) |
| $1,000 to $1,499 | 25 (19.5%) | 0 (0.0%) |
| $1,500 to $1,999 | 0 (0.0%) | 0 (0.0%) |
| $2,000 to $2,499 | 0 (0.0%) | 0 (0.0%) |
| $2,500 to $2,999 | 0 (0.0%) | 0 (0.0%) |
| $3,000 or more | 0 (0.0%) | 0 (0.0%) |
| Total | 128 (100.0%) | 57 (100.0%) |
Physical Housing Characteristics in Benoit
Housing Structures in Benoit
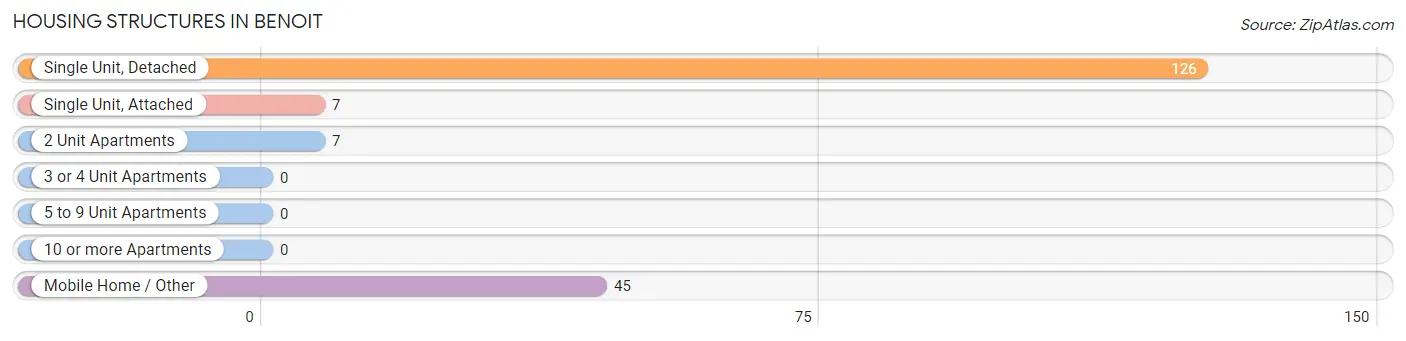
| Structure Type | # Housing Units | % Housing Units |
| Single Unit, Detached | 126 | 68.1% |
| Single Unit, Attached | 7 | 3.8% |
| 2 Unit Apartments | 7 | 3.8% |
| 3 or 4 Unit Apartments | 0 | 0.0% |
| 5 to 9 Unit Apartments | 0 | 0.0% |
| 10 or more Apartments | 0 | 0.0% |
| Mobile Home / Other | 45 | 24.3% |
| Total | 185 | 100.0% |
Housing Structures by Occupancy in Benoit
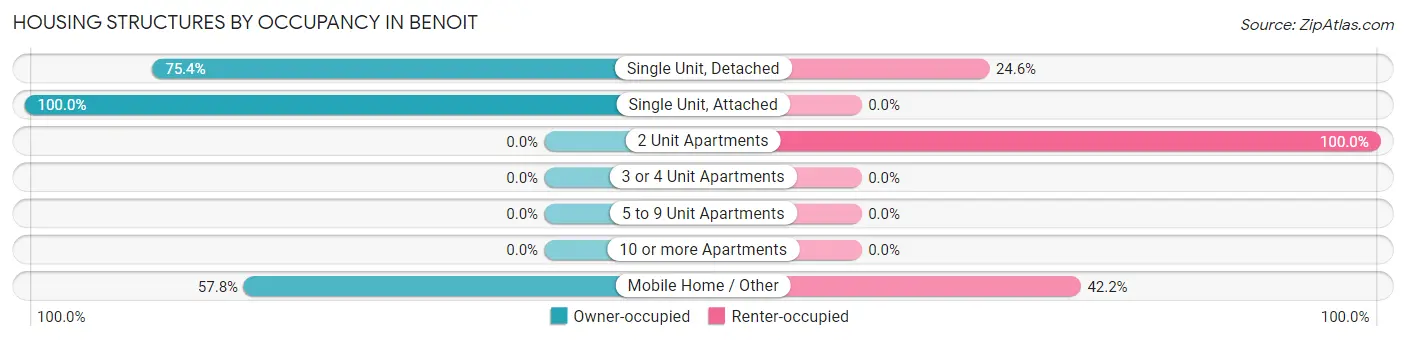
| Structure Type | Owner-occupied | Renter-occupied |
| Single Unit, Detached | 95 (75.4%) | 31 (24.6%) |
| Single Unit, Attached | 7 (100.0%) | 0 (0.0%) |
| 2 Unit Apartments | 0 (0.0%) | 7 (100.0%) |
| 3 or 4 Unit Apartments | 0 (0.0%) | 0 (0.0%) |
| 5 to 9 Unit Apartments | 0 (0.0%) | 0 (0.0%) |
| 10 or more Apartments | 0 (0.0%) | 0 (0.0%) |
| Mobile Home / Other | 26 (57.8%) | 19 (42.2%) |
| Total | 128 (69.2%) | 57 (30.8%) |
Housing Structures by Number of Rooms in Benoit
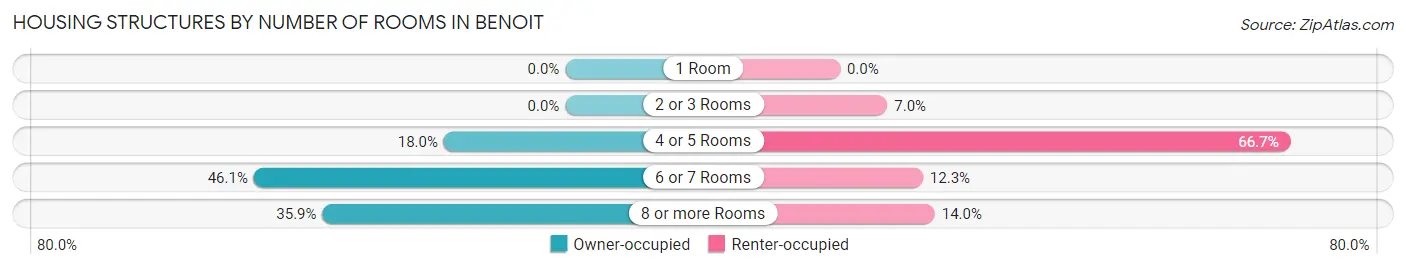
| Number of Rooms | Owner-occupied | Renter-occupied |
| 1 Room | 0 (0.0%) | 0 (0.0%) |
| 2 or 3 Rooms | 0 (0.0%) | 4 (7.0%) |
| 4 or 5 Rooms | 23 (18.0%) | 38 (66.7%) |
| 6 or 7 Rooms | 59 (46.1%) | 7 (12.3%) |
| 8 or more Rooms | 46 (35.9%) | 8 (14.0%) |
| Total | 128 (100.0%) | 57 (100.0%) |
Housing Structure by Heating Type in Benoit
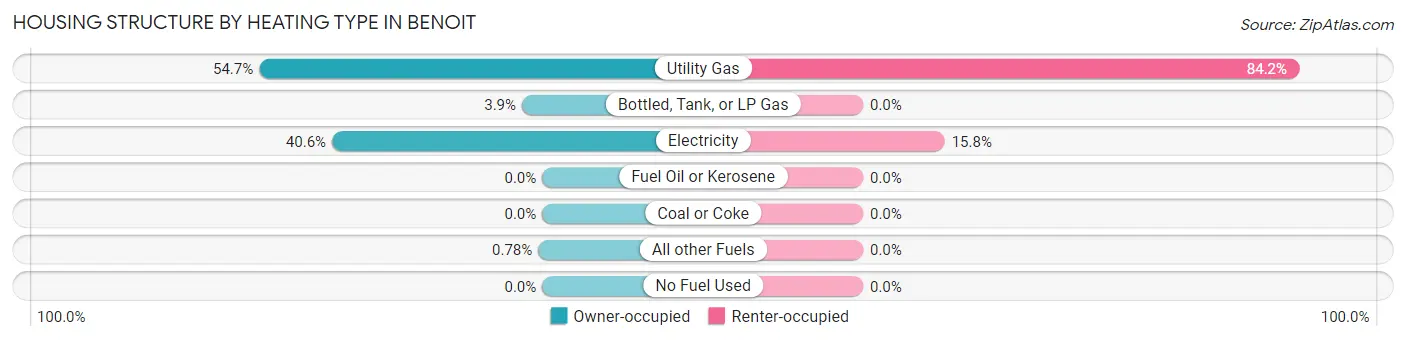
| Heating Type | Owner-occupied | Renter-occupied |
| Utility Gas | 70 (54.7%) | 48 (84.2%) |
| Bottled, Tank, or LP Gas | 5 (3.9%) | 0 (0.0%) |
| Electricity | 52 (40.6%) | 9 (15.8%) |
| Fuel Oil or Kerosene | 0 (0.0%) | 0 (0.0%) |
| Coal or Coke | 0 (0.0%) | 0 (0.0%) |
| All other Fuels | 1 (0.8%) | 0 (0.0%) |
| No Fuel Used | 0 (0.0%) | 0 (0.0%) |
| Total | 128 (100.0%) | 57 (100.0%) |
Household Vehicle Usage in Benoit
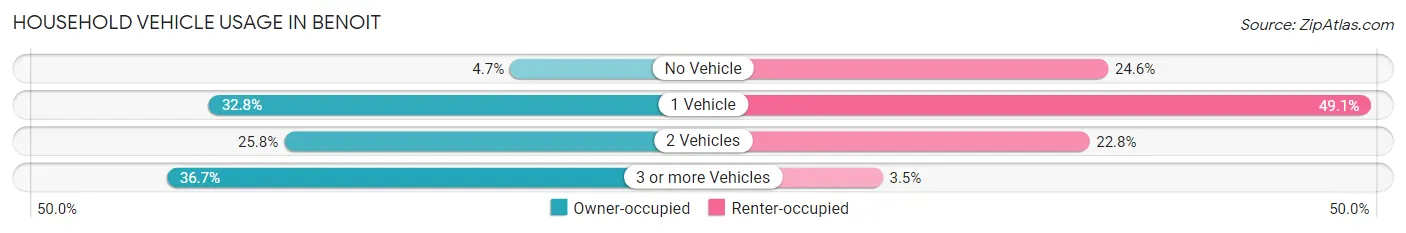
| Vehicles per Household | Owner-occupied | Renter-occupied |
| No Vehicle | 6 (4.7%) | 14 (24.6%) |
| 1 Vehicle | 42 (32.8%) | 28 (49.1%) |
| 2 Vehicles | 33 (25.8%) | 13 (22.8%) |
| 3 or more Vehicles | 47 (36.7%) | 2 (3.5%) |
| Total | 128 (100.0%) | 57 (100.0%) |
Real Estate & Mortgages in Benoit
Real Estate and Mortgage Overview in Benoit
| Characteristic | Without Mortgage | With Mortgage |
| Housing Units | 90 | 38 |
| Median Property Value | $60,000 | $155,700 |
| Median Household Income | - | - |
| Monthly Housing Costs | $403 | $0 |
| Real Estate Taxes | - | - |
Property Value by Mortgage Status in Benoit
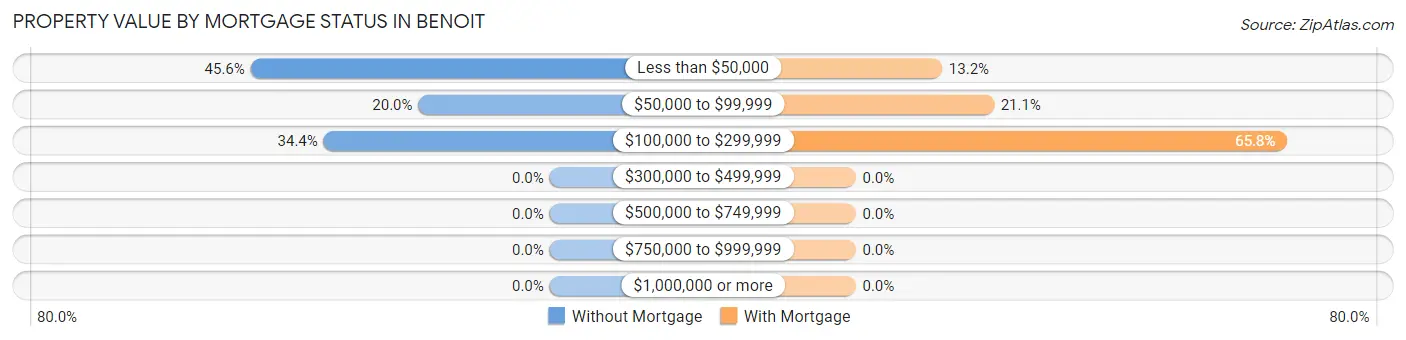
| Property Value | Without Mortgage | With Mortgage |
| Less than $50,000 | 41 (45.6%) | 5 (13.2%) |
| $50,000 to $99,999 | 18 (20.0%) | 8 (21.0%) |
| $100,000 to $299,999 | 31 (34.4%) | 25 (65.8%) |
| $300,000 to $499,999 | 0 (0.0%) | 0 (0.0%) |
| $500,000 to $749,999 | 0 (0.0%) | 0 (0.0%) |
| $750,000 to $999,999 | 0 (0.0%) | 0 (0.0%) |
| $1,000,000 or more | 0 (0.0%) | 0 (0.0%) |
| Total | 90 (100.0%) | 38 (100.0%) |
Household Income by Mortgage Status in Benoit
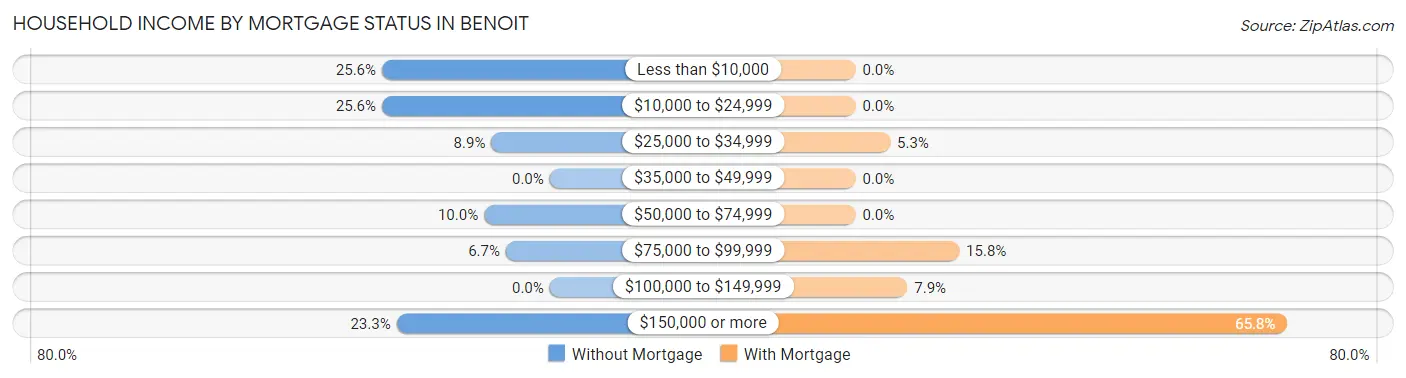
| Household Income | Without Mortgage | With Mortgage |
| Less than $10,000 | 23 (25.6%) | 0 (0.0%) |
| $10,000 to $24,999 | 23 (25.6%) | 0 (0.0%) |
| $25,000 to $34,999 | 8 (8.9%) | 2 (5.3%) |
| $35,000 to $49,999 | 0 (0.0%) | 0 (0.0%) |
| $50,000 to $74,999 | 9 (10.0%) | 0 (0.0%) |
| $75,000 to $99,999 | 6 (6.7%) | 6 (15.8%) |
| $100,000 to $149,999 | 0 (0.0%) | 3 (7.9%) |
| $150,000 or more | 21 (23.3%) | 25 (65.8%) |
| Total | 90 (100.0%) | 38 (100.0%) |
Property Value to Household Income Ratio in Benoit
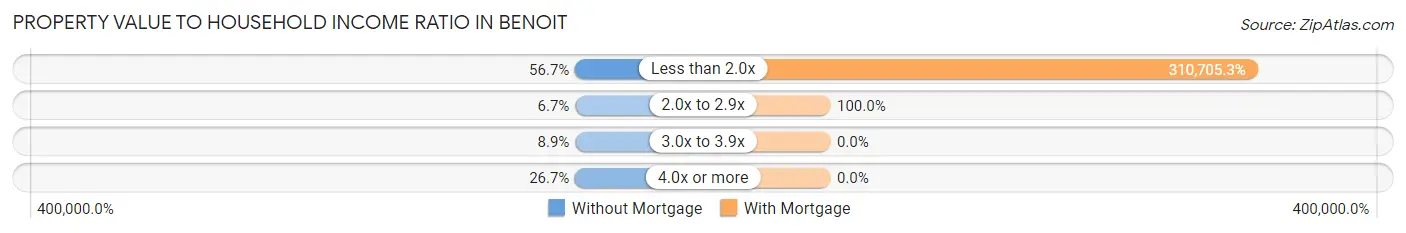
| Value-to-Income Ratio | Without Mortgage | With Mortgage |
| Less than 2.0x | 51 (56.7%) | 118,068 (310,705.3%) |
| 2.0x to 2.9x | 6 (6.7%) | 38 (100.0%) |
| 3.0x to 3.9x | 8 (8.9%) | 0 (0.0%) |
| 4.0x or more | 24 (26.7%) | 0 (0.0%) |
| Total | 90 (100.0%) | 38 (100.0%) |
Real Estate Taxes by Mortgage Status in Benoit
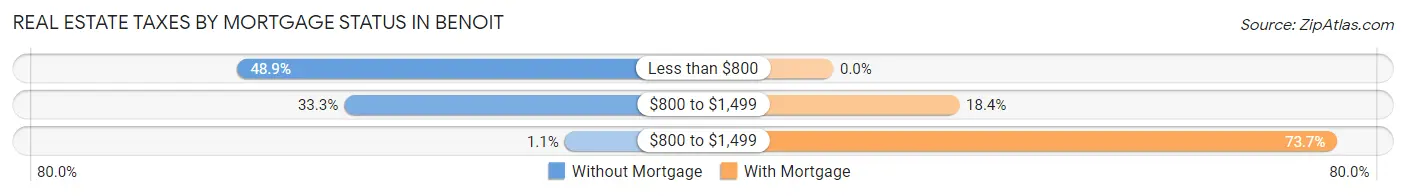
| Property Taxes | Without Mortgage | With Mortgage |
| Less than $800 | 44 (48.9%) | 0 (0.0%) |
| $800 to $1,499 | 30 (33.3%) | 7 (18.4%) |
| $800 to $1,499 | 1 (1.1%) | 28 (73.7%) |
| Total | 90 (100.0%) | 38 (100.0%) |
Health & Disability in Benoit
Health Insurance Coverage by Age in Benoit
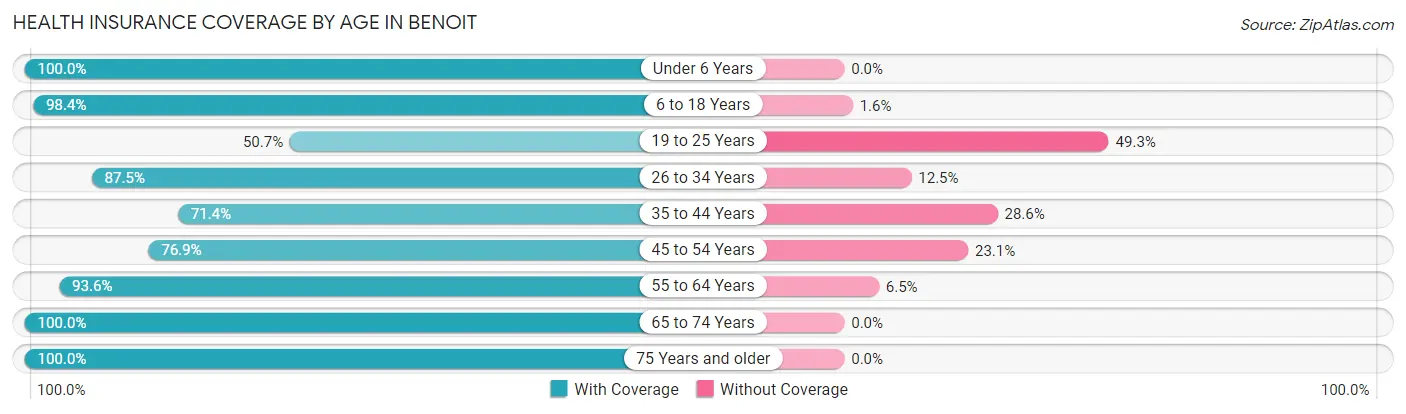
| Age Bracket | With Coverage | Without Coverage |
| Under 6 Years | 28 (100.0%) | 0 (0.0%) |
| 6 to 18 Years | 125 (98.4%) | 2 (1.6%) |
| 19 to 25 Years | 36 (50.7%) | 35 (49.3%) |
| 26 to 34 Years | 28 (87.5%) | 4 (12.5%) |
| 35 to 44 Years | 20 (71.4%) | 8 (28.6%) |
| 45 to 54 Years | 60 (76.9%) | 18 (23.1%) |
| 55 to 64 Years | 87 (93.5%) | 6 (6.5%) |
| 65 to 74 Years | 70 (100.0%) | 0 (0.0%) |
| 75 Years and older | 20 (100.0%) | 0 (0.0%) |
| Total | 474 (86.7%) | 73 (13.4%) |
Health Insurance Coverage by Citizenship Status in Benoit
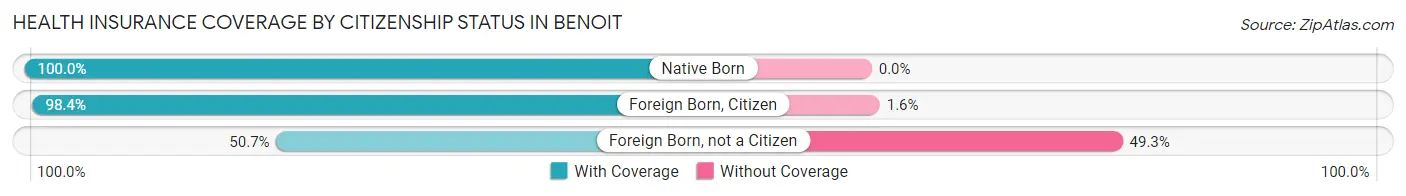
| Citizenship Status | With Coverage | Without Coverage |
| Native Born | 28 (100.0%) | 0 (0.0%) |
| Foreign Born, Citizen | 125 (98.4%) | 2 (1.6%) |
| Foreign Born, not a Citizen | 36 (50.7%) | 35 (49.3%) |
Health Insurance Coverage by Household Income in Benoit
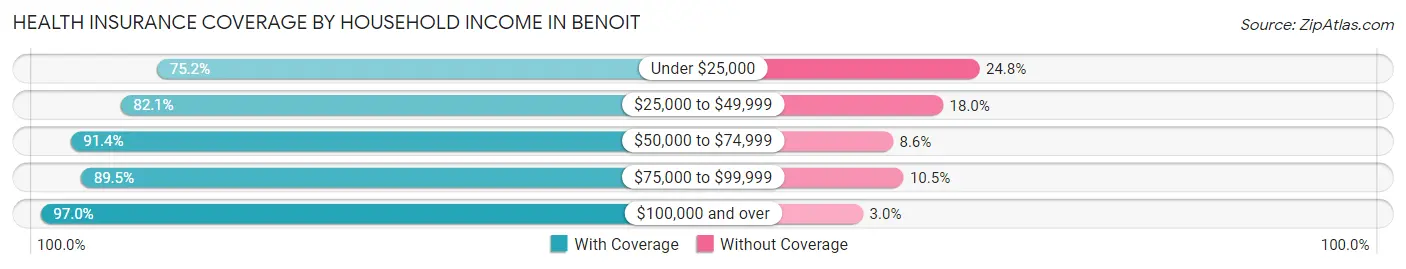
| Household Income | With Coverage | Without Coverage |
| Under $25,000 | 164 (75.2%) | 54 (24.8%) |
| $25,000 to $49,999 | 32 (82.1%) | 7 (17.9%) |
| $50,000 to $74,999 | 32 (91.4%) | 3 (8.6%) |
| $75,000 to $99,999 | 17 (89.5%) | 2 (10.5%) |
| $100,000 and over | 229 (97.0%) | 7 (3.0%) |
Public vs Private Health Insurance Coverage by Age in Benoit
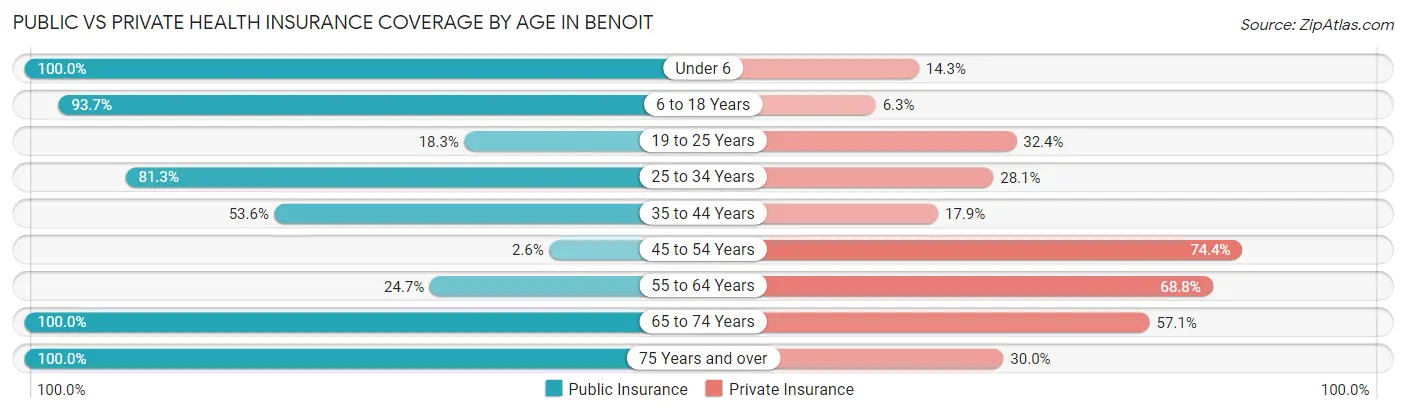
| Age Bracket | Public Insurance | Private Insurance |
| Under 6 | 28 (100.0%) | 4 (14.3%) |
| 6 to 18 Years | 119 (93.7%) | 8 (6.3%) |
| 19 to 25 Years | 13 (18.3%) | 23 (32.4%) |
| 25 to 34 Years | 26 (81.2%) | 9 (28.1%) |
| 35 to 44 Years | 15 (53.6%) | 5 (17.9%) |
| 45 to 54 Years | 2 (2.6%) | 58 (74.4%) |
| 55 to 64 Years | 23 (24.7%) | 64 (68.8%) |
| 65 to 74 Years | 70 (100.0%) | 40 (57.1%) |
| 75 Years and over | 20 (100.0%) | 6 (30.0%) |
| Total | 316 (57.8%) | 217 (39.7%) |
Disability Status by Sex by Age in Benoit
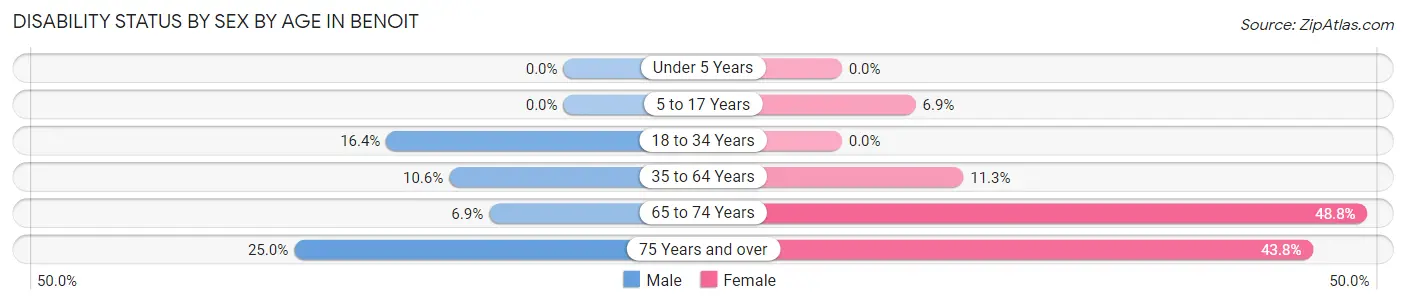
| Age Bracket | Male | Female |
| Under 5 Years | 0 (0.0%) | 0 (0.0%) |
| 5 to 17 Years | 0 (0.0%) | 5 (6.9%) |
| 18 to 34 Years | 12 (16.4%) | 0 (0.0%) |
| 35 to 64 Years | 7 (10.6%) | 15 (11.3%) |
| 65 to 74 Years | 2 (6.9%) | 20 (48.8%) |
| 75 Years and over | 1 (25.0%) | 7 (43.8%) |
Disability Class by Sex by Age in Benoit
Disability Class: Hearing Difficulty
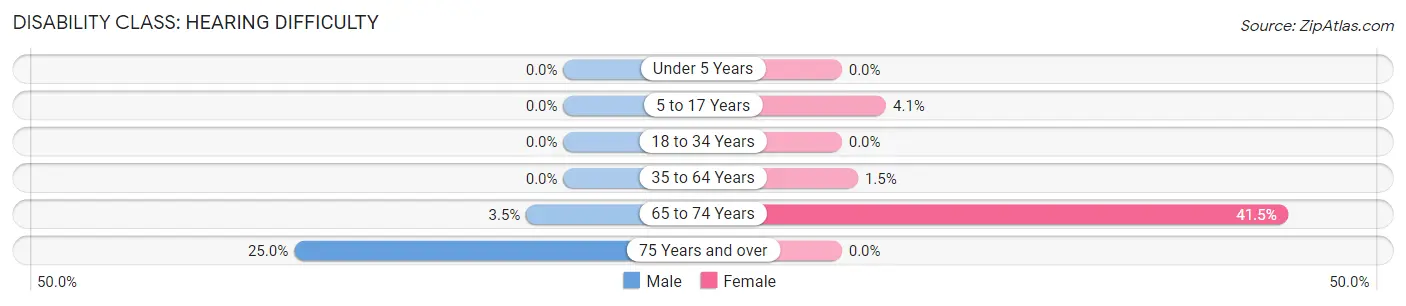
| Age Bracket | Male | Female |
| Under 5 Years | 0 (0.0%) | 0 (0.0%) |
| 5 to 17 Years | 0 (0.0%) | 3 (4.1%) |
| 18 to 34 Years | 0 (0.0%) | 0 (0.0%) |
| 35 to 64 Years | 0 (0.0%) | 2 (1.5%) |
| 65 to 74 Years | 1 (3.5%) | 17 (41.5%) |
| 75 Years and over | 1 (25.0%) | 0 (0.0%) |
Disability Class: Vision Difficulty
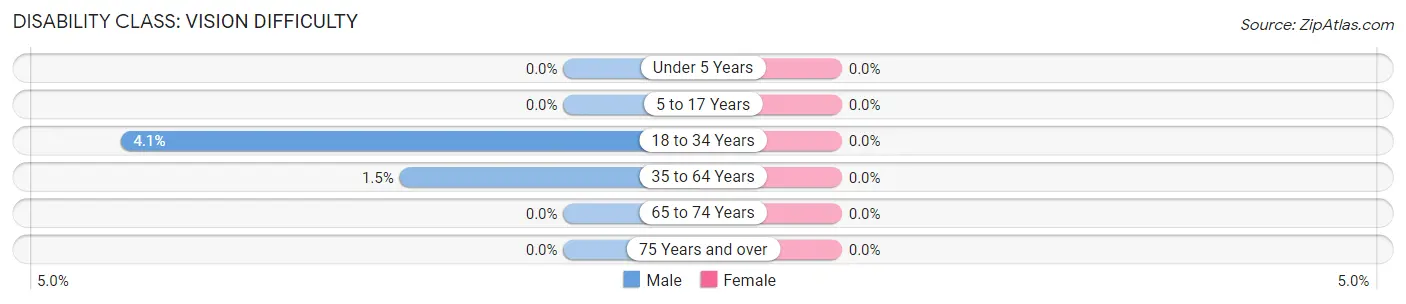
| Age Bracket | Male | Female |
| Under 5 Years | 0 (0.0%) | 0 (0.0%) |
| 5 to 17 Years | 0 (0.0%) | 0 (0.0%) |
| 18 to 34 Years | 3 (4.1%) | 0 (0.0%) |
| 35 to 64 Years | 1 (1.5%) | 0 (0.0%) |
| 65 to 74 Years | 0 (0.0%) | 0 (0.0%) |
| 75 Years and over | 0 (0.0%) | 0 (0.0%) |
Disability Class: Cognitive Difficulty
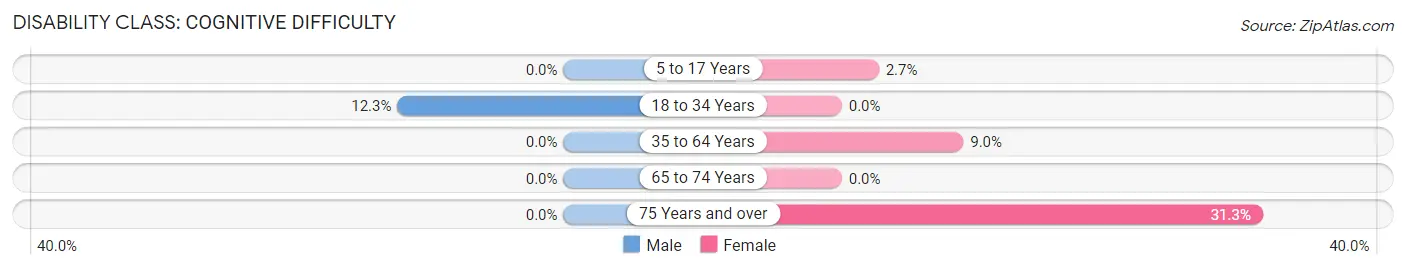
| Age Bracket | Male | Female |
| 5 to 17 Years | 0 (0.0%) | 2 (2.7%) |
| 18 to 34 Years | 9 (12.3%) | 0 (0.0%) |
| 35 to 64 Years | 0 (0.0%) | 12 (9.0%) |
| 65 to 74 Years | 0 (0.0%) | 0 (0.0%) |
| 75 Years and over | 0 (0.0%) | 5 (31.2%) |
Disability Class: Ambulatory Difficulty
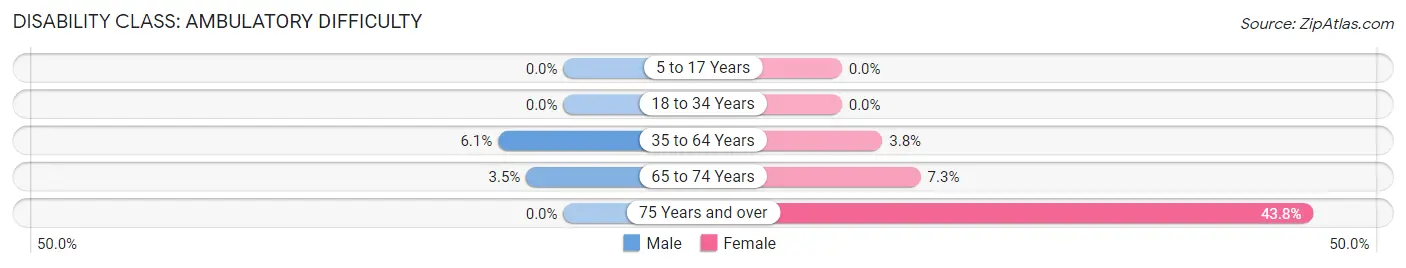
| Age Bracket | Male | Female |
| 5 to 17 Years | 0 (0.0%) | 0 (0.0%) |
| 18 to 34 Years | 0 (0.0%) | 0 (0.0%) |
| 35 to 64 Years | 4 (6.1%) | 5 (3.8%) |
| 65 to 74 Years | 1 (3.5%) | 3 (7.3%) |
| 75 Years and over | 0 (0.0%) | 7 (43.8%) |
Disability Class: Self-Care Difficulty
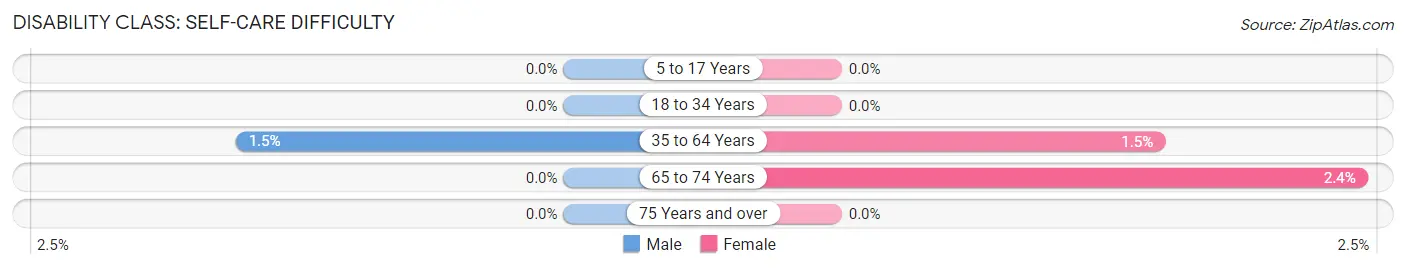
| Age Bracket | Male | Female |
| 5 to 17 Years | 0 (0.0%) | 0 (0.0%) |
| 18 to 34 Years | 0 (0.0%) | 0 (0.0%) |
| 35 to 64 Years | 1 (1.5%) | 2 (1.5%) |
| 65 to 74 Years | 0 (0.0%) | 1 (2.4%) |
| 75 Years and over | 0 (0.0%) | 0 (0.0%) |
Technology Access in Benoit
Computing Device Access in Benoit
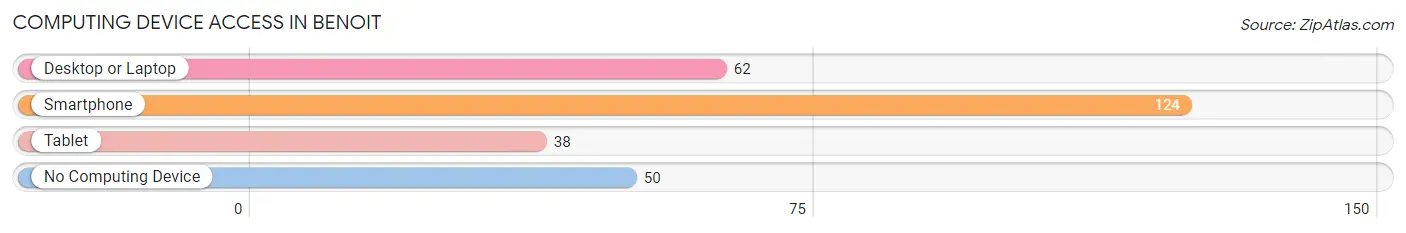
| Device Type | # Households | % Households |
| Desktop or Laptop | 62 | 33.5% |
| Smartphone | 124 | 67.0% |
| Tablet | 38 | 20.5% |
| No Computing Device | 50 | 27.0% |
| Total | 185 | 100.0% |
Internet Access in Benoit
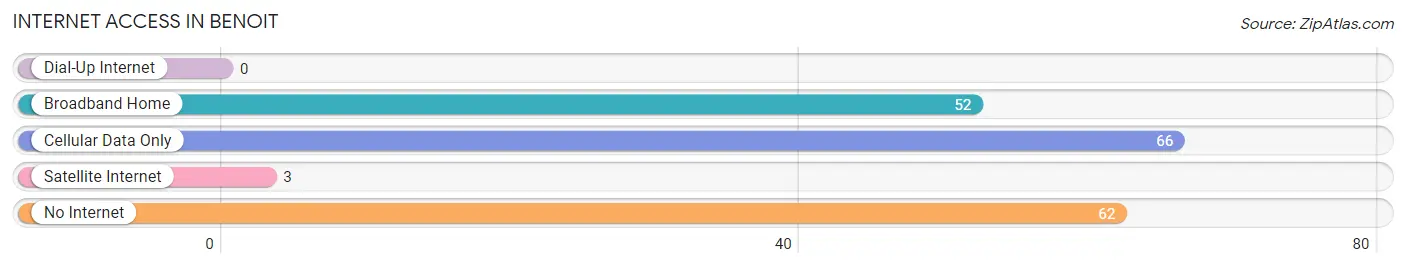
| Internet Type | # Households | % Households |
| Dial-Up Internet | 0 | 0.0% |
| Broadband Home | 52 | 28.1% |
| Cellular Data Only | 66 | 35.7% |
| Satellite Internet | 3 | 1.6% |
| No Internet | 62 | 33.5% |
| Total | 185 | 100.0% |
Benoit Summary
Benoit is a small town located in Bolivar County, Mississippi. It is situated on the banks of the Sunflower River, about 20 miles south of the state capital of Jackson. The town has a population of approximately 1,000 people and is part of the larger Mound Bayou metropolitan area.
History
Benoit was founded in 1871 by freed slaves who had been emancipated after the Civil War. The town was named after a French-Canadian settler, Pierre Benoit, who had settled in the area in the early 1800s. The town was originally a farming community, but it soon became a center for the lumber industry. The town was also home to a number of churches, schools, and businesses.
In the early 1900s, Benoit was a thriving community with a population of over 1,000 people. The town was home to a number of businesses, including a sawmill, a cotton gin, a grist mill, and a general store. The town also had a number of churches, including the First Baptist Church, the Second Baptist Church, and the Methodist Church.
In the late 1940s, the town began to decline as the lumber industry moved away and the population began to decline. By the 1970s, the population had dropped to just over 500 people. In the 1980s, the town began to experience a resurgence as new businesses moved into the area and the population began to grow again.
Geography
Benoit is located in the northwest corner of Bolivar County, Mississippi. The town is situated on the banks of the Sunflower River, about 20 miles south of the state capital of Jackson. The town is surrounded by a number of small towns and rural communities, including Mound Bayou, Shaw, and Shelby.
The town is located in a flat, low-lying area, with an elevation of just over 200 feet. The climate in Benoit is humid subtropical, with hot, humid summers and mild winters. The average annual temperature is around 70 degrees Fahrenheit.
Economy
Benoit is a small, rural town with a population of just over 1,000 people. The town is home to a number of small businesses, including a grocery store, a hardware store, and a few restaurants. The town is also home to a number of churches, schools, and other community organizations.
The town is home to a number of small farms, which produce a variety of crops, including cotton, soybeans, corn, and wheat. The town is also home to a number of small manufacturing businesses, which produce a variety of products, including furniture, clothing, and textiles.
Demographics
As of the 2010 census, the population of Benoit was 1,039 people. The racial makeup of the town was 79.3% African American, 19.2% White, 0.3% Native American, 0.2% Asian, and 0.9% from other races. The median household income in Benoit was $25,000, and the median family income was $30,000. The town had a poverty rate of 33.3%.
Conclusion
Benoit is a small town located in Bolivar County, Mississippi. The town has a population of approximately 1,000 people and is part of the larger Mound Bayou metropolitan area. The town was founded in 1871 by freed slaves and was once a thriving community with a number of businesses and churches. In recent years, the town has experienced a resurgence as new businesses have moved into the area and the population has begun to grow again. The town is home to a number of small businesses, farms, and manufacturing businesses, and has a population that is predominantly African American.
Common Questions
What is Per Capita Income in Benoit?
Per Capita income in Benoit is $20,865.
What is Income or Wage Gap in Benoit?
Income or Wage Gap in Benoit is 74.1%.
Women in Benoit earn 25.9 cents for every dollar earned by a man.
What is Family Income Deficit in Benoit?
Family Income Deficit in Benoit is $14,895.
Families that are below poverty line in Benoit earn $14,895 less on average than the poverty threshold level.
What is Inequality or Gini Index in Benoit?
Inequality or Gini Index in Benoit is 0.55.
What is the Total Population of Benoit?
Total Population of Benoit is 547.
What is the Total Male Population of Benoit?
Total Male Population of Benoit is 242.
What is the Total Female Population of Benoit?
Total Female Population of Benoit is 305.
What is the Ratio of Males per 100 Females in Benoit?
There are 79.34 Males per 100 Females in Benoit.
What is the Ratio of Females per 100 Males in Benoit?
There are 126.03 Females per 100 Males in Benoit.
What is the Median Population Age in Benoit?
Median Population Age in Benoit is 39.6 Years.
What is the Average Family Size in Benoit
Average Family Size in Benoit is 4.0 People.
What is the Average Household Size in Benoit
Average Household Size in Benoit is 3.0 People.
How Large is the Labor Force in Benoit?
There are 198 People in the Labor Forcein in Benoit.
What is the Percentage of People in the Labor Force in Benoit?
48.2% of People are in the Labor Force in Benoit.
What is the Unemployment Rate in Benoit?
Unemployment Rate in Benoit is 15.2%.