Henderson Point, MS Map & Demographics
Henderson Point Map
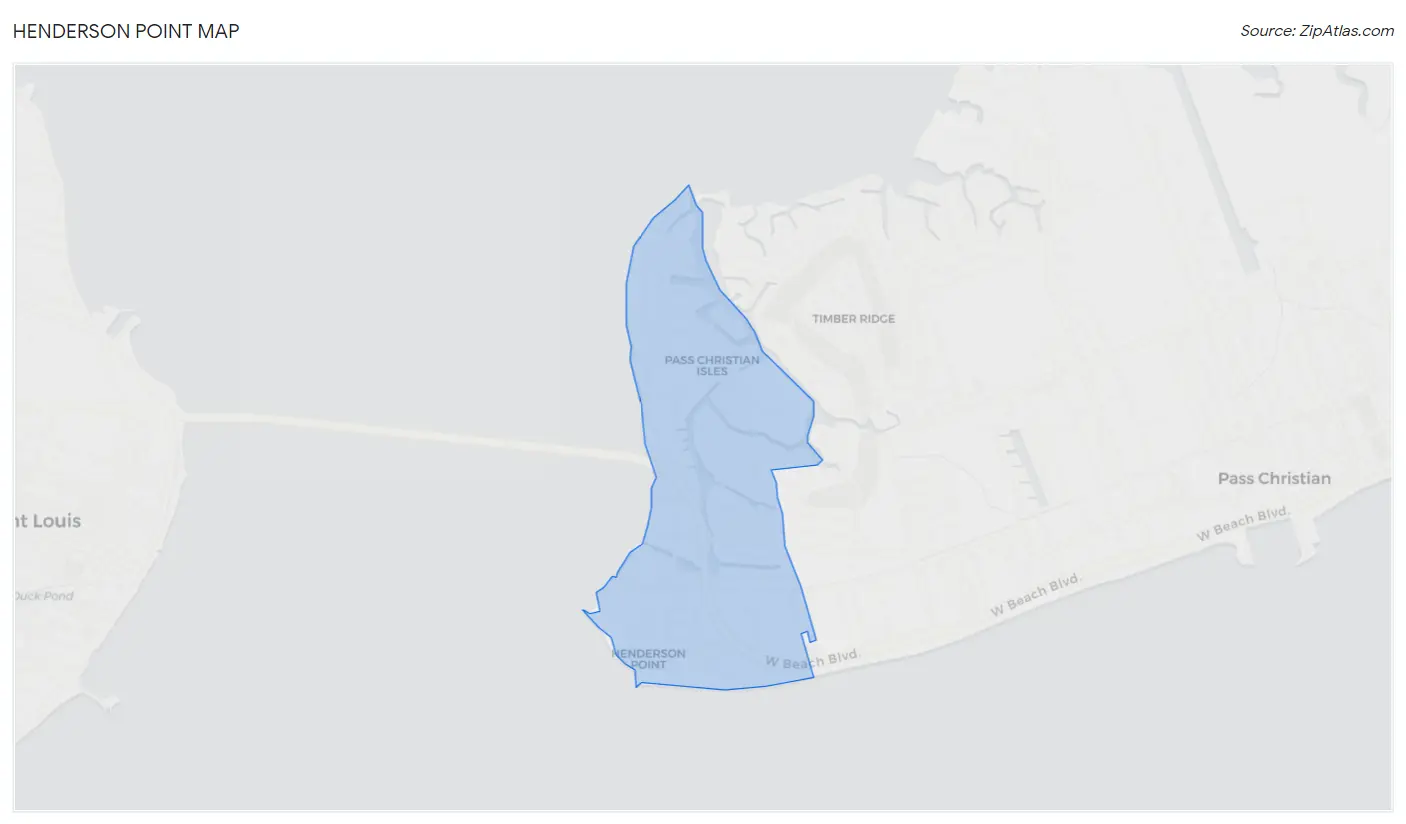
Henderson Point Overview
$31,409
PER CAPITA INCOME
$60,993
AVG FAMILY INCOME
$50,556
AVG HOUSEHOLD INCOME
0.34
INEQUALITY / GINI INDEX
211
TOTAL POPULATION
55
MALE POPULATION
156
FEMALE POPULATION
35.26
MALES / 100 FEMALES
283.64
FEMALES / 100 MALES
63.1
MEDIAN AGE
2.5
AVG FAMILY SIZE
1.7
AVG HOUSEHOLD SIZE
16
LABOR FORCE [ PEOPLE ]
7.6%
PERCENT IN LABOR FORCE
Income in Henderson Point
Income Overview in Henderson Point
Per Capita Income in Henderson Point is $31,409, while median incomes of families and households are $60,993 and $50,556 respectively.
| Characteristic | Number | Measure |
| Per Capita Income | 211 | $31,409 |
| Median Family Income | 61 | $60,993 |
| Mean Family Income | 61 | $65,043 |
| Median Household Income | 122 | $50,556 |
| Mean Household Income | 122 | $54,091 |
| Income Deficit | 61 | $0 |
| Wage / Income Gap (%) | 211 | 0.00% |
| Wage / Income Gap ($) | 211 | 100.00¢ per $1 |
| Gini / Inequality Index | 211 | 0.34 |
Earnings by Sex in Henderson Point
| Sex | Number | Average Earnings |
| Male | 13 (27.1%) | $0 |
| Female | 35 (72.9%) | $0 |
| Total | 48 (100.0%) | $0 |
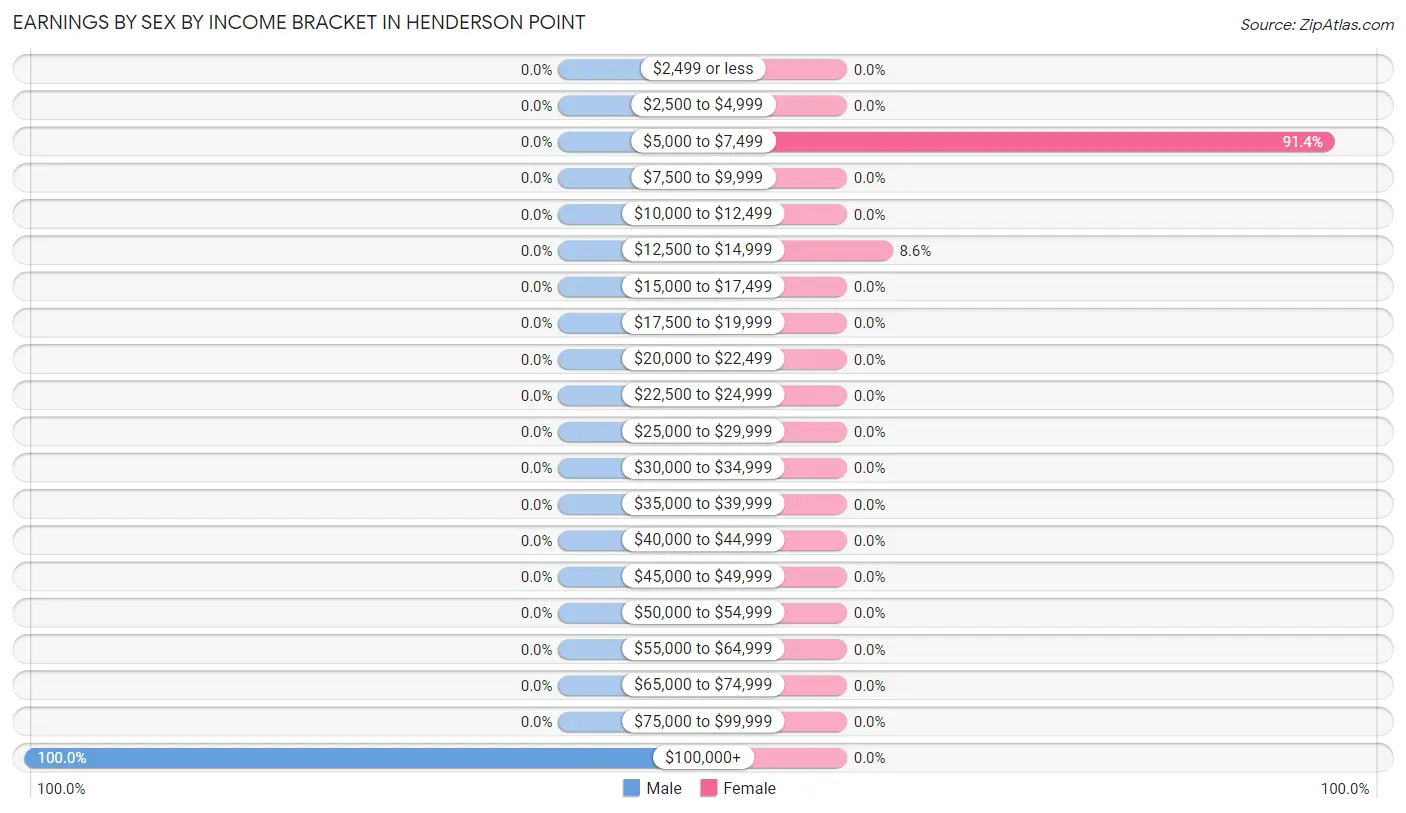
Earnings by Sex by Income Bracket in Henderson Point
The most common earnings brackets in Henderson Point are $100,000+ for men (13 | 100.0%) and $5,000 to $7,499 for women (32 | 91.4%).
| Income | Male | Female |
| $2,499 or less | 0 (0.0%) | 0 (0.0%) |
| $2,500 to $4,999 | 0 (0.0%) | 0 (0.0%) |
| $5,000 to $7,499 | 0 (0.0%) | 32 (91.4%) |
| $7,500 to $9,999 | 0 (0.0%) | 0 (0.0%) |
| $10,000 to $12,499 | 0 (0.0%) | 0 (0.0%) |
| $12,500 to $14,999 | 0 (0.0%) | 3 (8.6%) |
| $15,000 to $17,499 | 0 (0.0%) | 0 (0.0%) |
| $17,500 to $19,999 | 0 (0.0%) | 0 (0.0%) |
| $20,000 to $22,499 | 0 (0.0%) | 0 (0.0%) |
| $22,500 to $24,999 | 0 (0.0%) | 0 (0.0%) |
| $25,000 to $29,999 | 0 (0.0%) | 0 (0.0%) |
| $30,000 to $34,999 | 0 (0.0%) | 0 (0.0%) |
| $35,000 to $39,999 | 0 (0.0%) | 0 (0.0%) |
| $40,000 to $44,999 | 0 (0.0%) | 0 (0.0%) |
| $45,000 to $49,999 | 0 (0.0%) | 0 (0.0%) |
| $50,000 to $54,999 | 0 (0.0%) | 0 (0.0%) |
| $55,000 to $64,999 | 0 (0.0%) | 0 (0.0%) |
| $65,000 to $74,999 | 0 (0.0%) | 0 (0.0%) |
| $75,000 to $99,999 | 0 (0.0%) | 0 (0.0%) |
| $100,000+ | 13 (100.0%) | 0 (0.0%) |
| Total | 13 (100.0%) | 35 (100.0%) |
Earnings by Sex by Educational Attainment in Henderson Point
| Educational Attainment | Male Income | Female Income |
| Less than High School | - | - |
| High School Diploma | - | - |
| College or Associate's Degree | - | - |
| Bachelor's Degree | - | - |
| Graduate Degree | - | - |
| Total | - | - |
Family Income in Henderson Point
Family Income Brackets in Henderson Point
According to the Henderson Point family income data, there are 50 families falling into the $50,000 to $74,999 income range, which is the most common income bracket and makes up 82.0% of all families.
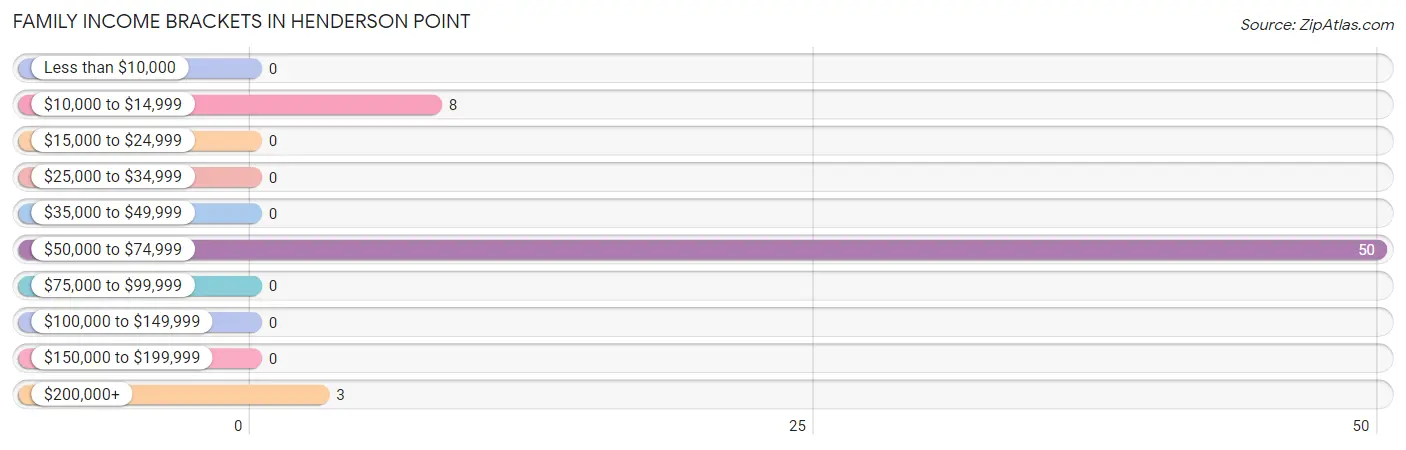
| Income Bracket | # Families | % Families |
| Less than $10,000 | 0 | 0.0% |
| $10,000 to $14,999 | 8 | 13.1% |
| $15,000 to $24,999 | 0 | 0.0% |
| $25,000 to $34,999 | 0 | 0.0% |
| $35,000 to $49,999 | 0 | 0.0% |
| $50,000 to $74,999 | 50 | 82.0% |
| $75,000 to $99,999 | 0 | 0.0% |
| $100,000 to $149,999 | 0 | 0.0% |
| $150,000 to $199,999 | 0 | 0.0% |
| $200,000+ | 3 | 4.9% |
Family Income by Famaliy Size in Henderson Point
2-person families (53 | 86.9%) account for the highest median family income in Henderson Point with $61,287 per family, while 2-person families (53 | 86.9%) have the highest median income of $30,644 per family member.
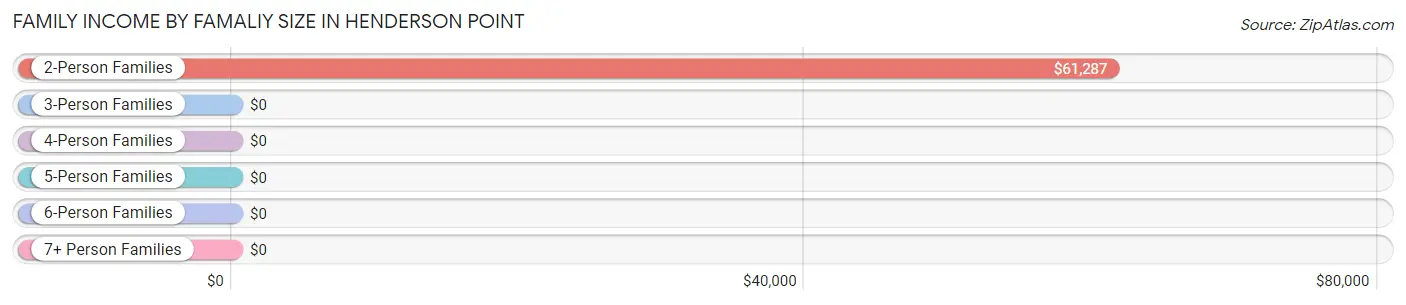
| Income Bracket | # Families | Median Income |
| 2-Person Families | 53 (86.9%) | $61,287 |
| 3-Person Families | 8 (13.1%) | $0 |
| 4-Person Families | 0 (0.0%) | $0 |
| 5-Person Families | 0 (0.0%) | $0 |
| 6-Person Families | 0 (0.0%) | $0 |
| 7+ Person Families | 0 (0.0%) | $0 |
| Total | 61 (100.0%) | $60,993 |
Family Income by Number of Earners in Henderson Point
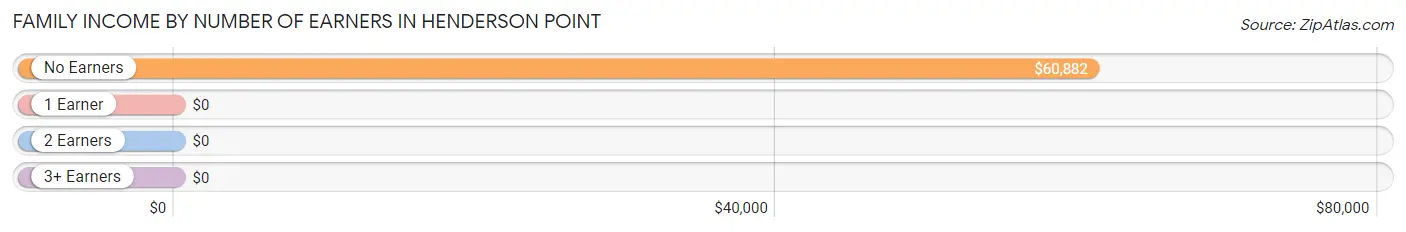
| Number of Earners | # Families | Median Income |
| No Earners | 58 (95.1%) | $60,882 |
| 1 Earner | 0 (0.0%) | $0 |
| 2 Earners | 3 (4.9%) | $0 |
| 3+ Earners | 0 (0.0%) | $0 |
| Total | 61 (100.0%) | $60,993 |
Household Income in Henderson Point
Household Income Brackets in Henderson Point
With 50 households falling in the category, the $50,000 to $74,999 income range is the most frequent in Henderson Point, accounting for 41.0% of all households.
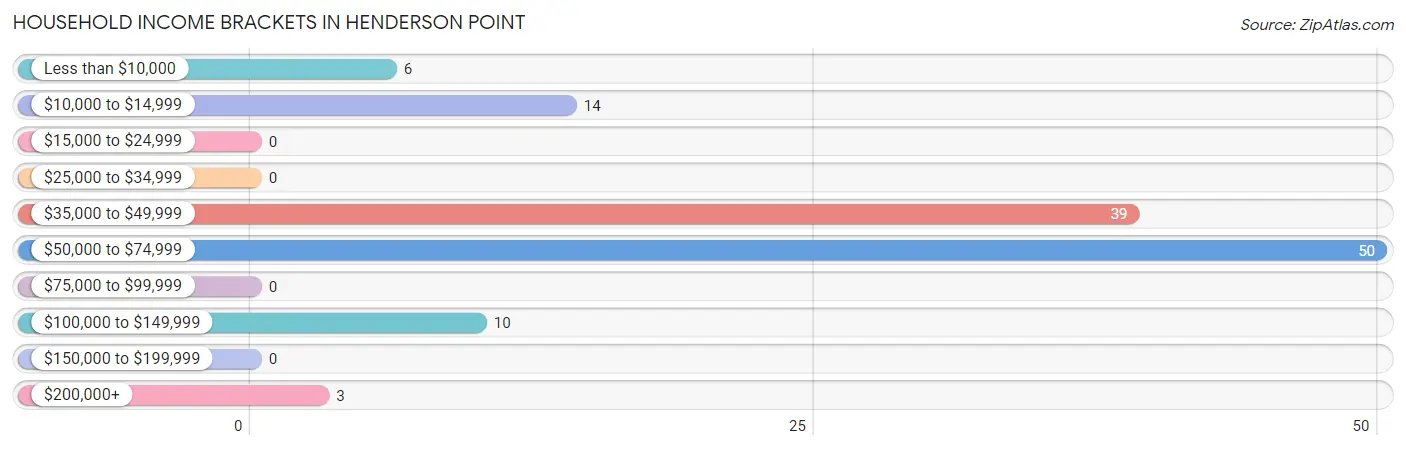
| Income Bracket | # Households | % Households |
| Less than $10,000 | 6 | 4.9% |
| $10,000 to $14,999 | 14 | 11.5% |
| $15,000 to $24,999 | 0 | 0.0% |
| $25,000 to $34,999 | 0 | 0.0% |
| $35,000 to $49,999 | 39 | 32.0% |
| $50,000 to $74,999 | 50 | 41.0% |
| $75,000 to $99,999 | 0 | 0.0% |
| $100,000 to $149,999 | 10 | 8.2% |
| $150,000 to $199,999 | 0 | 0.0% |
| $200,000+ | 3 | 2.5% |
Household Income by Householder Age in Henderson Point
The median household income in Henderson Point is $50,556, with the highest median household income of $60,184 found in the 65+ years age bracket for the primary householder. A total of 77 households (63.1%) fall into this category.
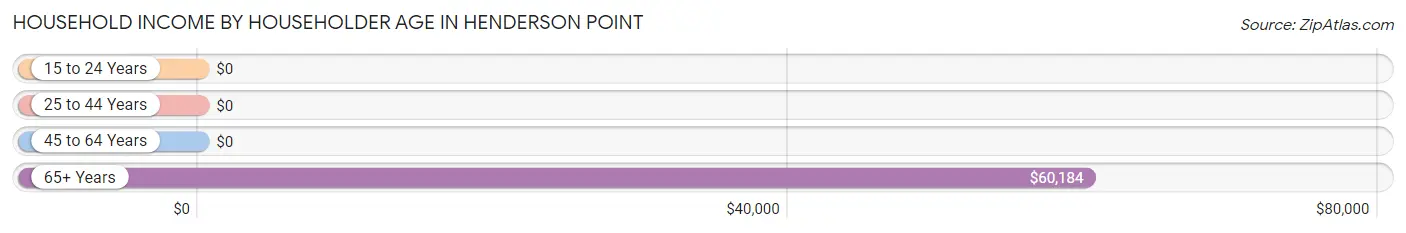
| Income Bracket | # Households | Median Income |
| 15 to 24 Years | 0 (0.0%) | $0 |
| 25 to 44 Years | 0 (0.0%) | $0 |
| 45 to 64 Years | 45 (36.9%) | $0 |
| 65+ Years | 77 (63.1%) | $60,184 |
| Total | 122 (100.0%) | $50,556 |
Poverty in Henderson Point
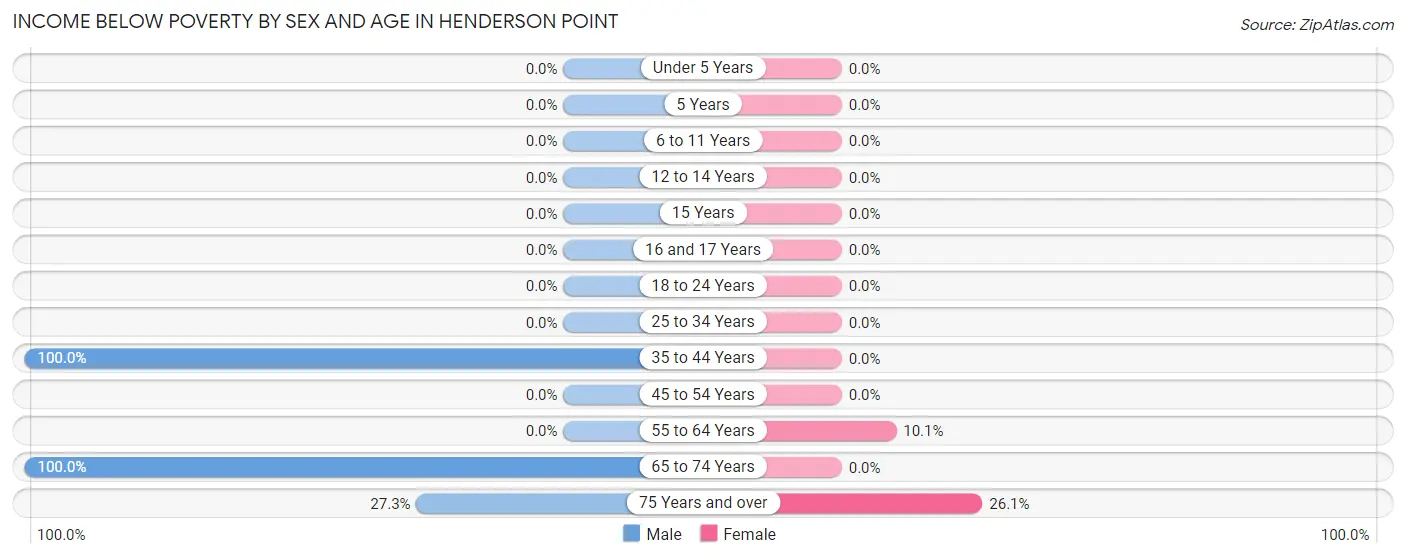
Income Below Poverty by Sex and Age in Henderson Point
With 47.3% poverty level for males and 9.6% for females among the residents of Henderson Point, 35 to 44 year old males and 75 year old and over females are the most vulnerable to poverty, with 12 males (100.0%) and 6 females (26.1%) in their respective age groups living below the poverty level.
| Age Bracket | Male | Female |
| Under 5 Years | 0 (0.0%) | 0 (0.0%) |
| 5 Years | 0 (0.0%) | 0 (0.0%) |
| 6 to 11 Years | 0 (0.0%) | 0 (0.0%) |
| 12 to 14 Years | 0 (0.0%) | 0 (0.0%) |
| 15 Years | 0 (0.0%) | 0 (0.0%) |
| 16 and 17 Years | 0 (0.0%) | 0 (0.0%) |
| 18 to 24 Years | 0 (0.0%) | 0 (0.0%) |
| 25 to 34 Years | 0 (0.0%) | 0 (0.0%) |
| 35 to 44 Years | 12 (100.0%) | 0 (0.0%) |
| 45 to 54 Years | 0 (0.0%) | 0 (0.0%) |
| 55 to 64 Years | 0 (0.0%) | 9 (10.1%) |
| 65 to 74 Years | 8 (100.0%) | 0 (0.0%) |
| 75 Years and over | 6 (27.3%) | 6 (26.1%) |
| Total | 26 (47.3%) | 15 (9.6%) |
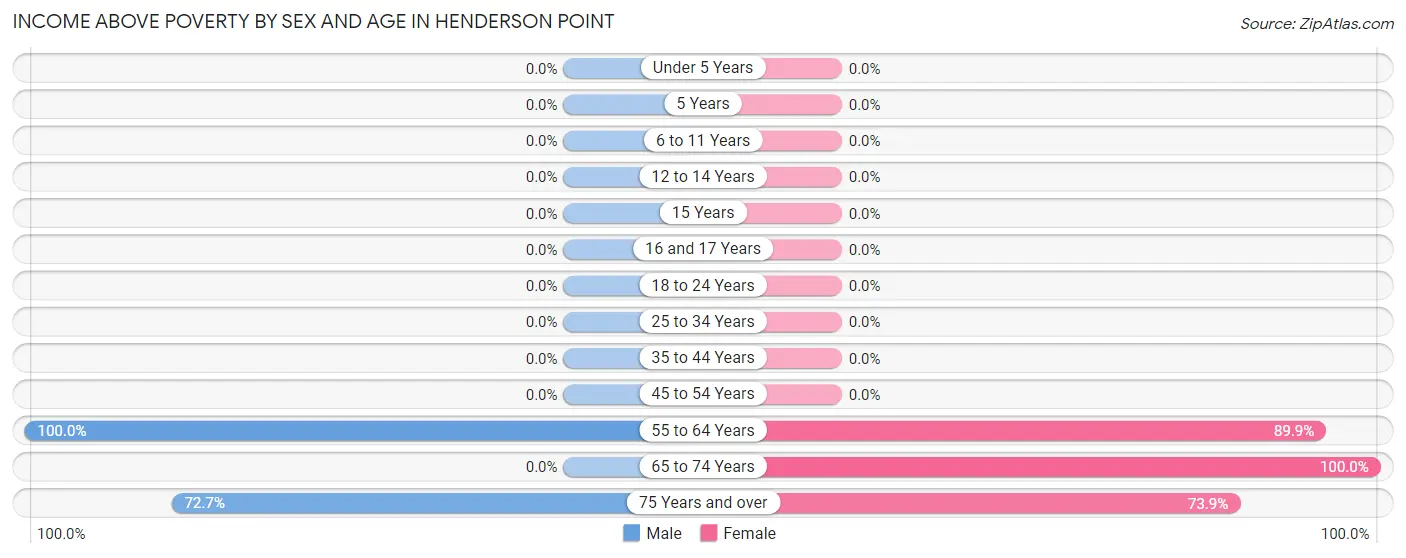
Income Above Poverty by Sex and Age in Henderson Point
According to the poverty statistics in Henderson Point, males aged 55 to 64 years and females aged 65 to 74 years are the age groups that are most secure financially, with 100.0% of males and 100.0% of females in these age groups living above the poverty line.
| Age Bracket | Male | Female |
| Under 5 Years | 0 (0.0%) | 0 (0.0%) |
| 5 Years | 0 (0.0%) | 0 (0.0%) |
| 6 to 11 Years | 0 (0.0%) | 0 (0.0%) |
| 12 to 14 Years | 0 (0.0%) | 0 (0.0%) |
| 15 Years | 0 (0.0%) | 0 (0.0%) |
| 16 and 17 Years | 0 (0.0%) | 0 (0.0%) |
| 18 to 24 Years | 0 (0.0%) | 0 (0.0%) |
| 25 to 34 Years | 0 (0.0%) | 0 (0.0%) |
| 35 to 44 Years | 0 (0.0%) | 0 (0.0%) |
| 45 to 54 Years | 0 (0.0%) | 0 (0.0%) |
| 55 to 64 Years | 13 (100.0%) | 80 (89.9%) |
| 65 to 74 Years | 0 (0.0%) | 44 (100.0%) |
| 75 Years and over | 16 (72.7%) | 17 (73.9%) |
| Total | 29 (52.7%) | 141 (90.4%) |
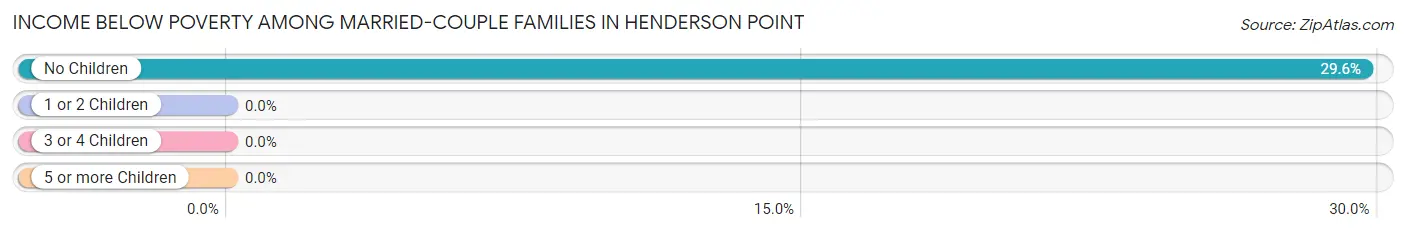
Income Below Poverty Among Married-Couple Families in Henderson Point
The poverty statistics for married-couple families in Henderson Point show that 29.6% or 8 of the total 27 families live below the poverty line. Families with no children have the highest poverty rate of 29.6%, comprising of 8 families. On the other hand, families with no children have the lowest poverty rate of 29.6%, which includes 8 families.
| Children | Above Poverty | Below Poverty |
| No Children | 19 (70.4%) | 8 (29.6%) |
| 1 or 2 Children | 0 (0.0%) | 0 (0.0%) |
| 3 or 4 Children | 0 (0.0%) | 0 (0.0%) |
| 5 or more Children | 0 (0.0%) | 0 (0.0%) |
| Total | 19 (70.4%) | 8 (29.6%) |
Income Below Poverty Among Single-Parent Households in Henderson Point
| Children | Single Father | Single Mother |
| No Children | 0 (0.0%) | 0 (0.0%) |
| 1 or 2 Children | 0 (0.0%) | 0 (0.0%) |
| 3 or 4 Children | 0 (0.0%) | 0 (0.0%) |
| 5 or more Children | 0 (0.0%) | 0 (0.0%) |
| Total | 0 (0.0%) | 0 (0.0%) |
Income Below Poverty Among Married-Couple vs Single-Parent Households in Henderson Point
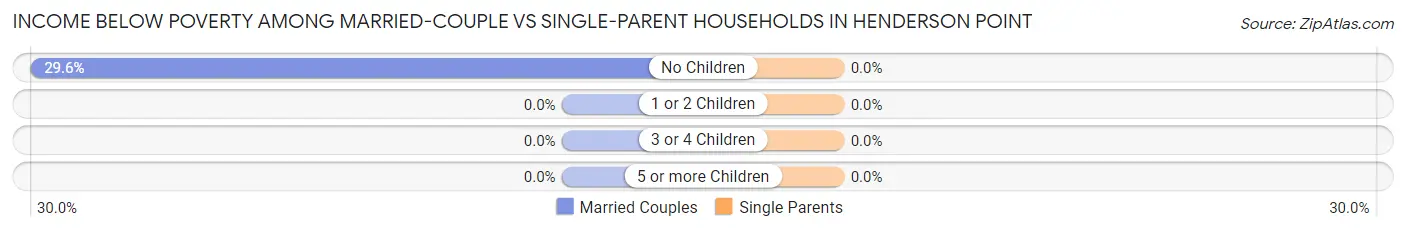
| Children | Married-Couple Families | Single-Parent Households |
| No Children | 8 (29.6%) | 0 (0.0%) |
| 1 or 2 Children | 0 (0.0%) | 0 (0.0%) |
| 3 or 4 Children | 0 (0.0%) | 0 (0.0%) |
| 5 or more Children | 0 (0.0%) | 0 (0.0%) |
| Total | 8 (29.6%) | 0 (0.0%) |
Race in Henderson Point
The most populous races in Henderson Point are , and White / Caucasian (211 | 100.0%).
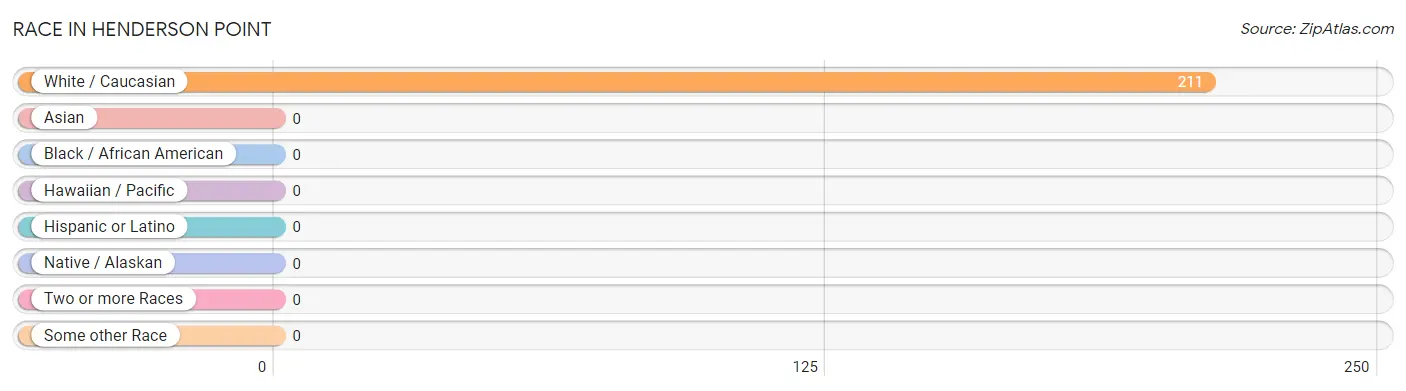
| Race | # Population | % Population |
| Asian | 0 | 0.0% |
| Black / African American | 0 | 0.0% |
| Hawaiian / Pacific | 0 | 0.0% |
| Hispanic or Latino | 0 | 0.0% |
| Native / Alaskan | 0 | 0.0% |
| White / Caucasian | 211 | 100.0% |
| Two or more Races | 0 | 0.0% |
| Some other Race | 0 | 0.0% |
| Total | 211 | 100.0% |
Ancestry in Henderson Point
The most populous ancestries reported in Henderson Point are English (113 | 53.5%), Irish (47 | 22.3%), French (38 | 18.0%), British (32 | 15.2%), and Polish (9 | 4.3%), together accounting for 113.3% of all Henderson Point residents.
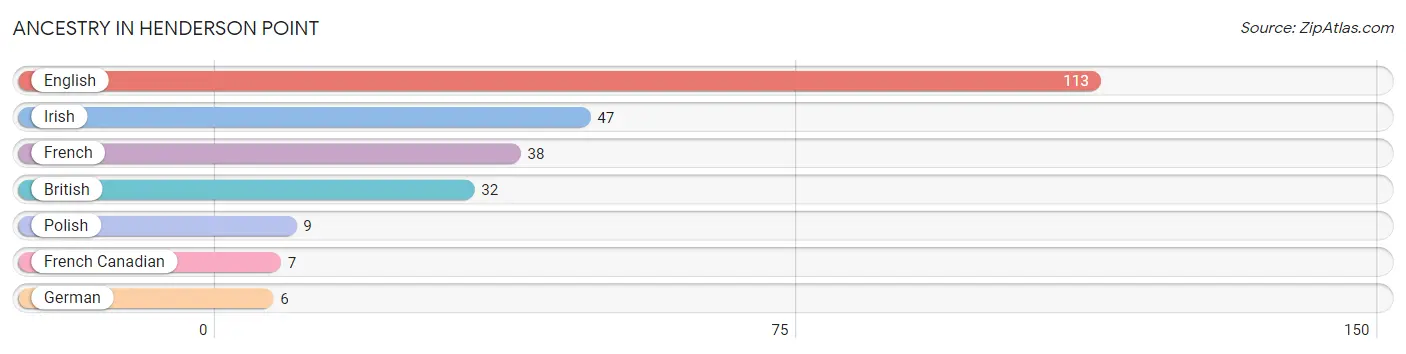
| Ancestry | # Population | % Population |
| British | 32 | 15.2% |
| English | 113 | 53.5% |
| French | 38 | 18.0% |
| French Canadian | 7 | 3.3% |
| German | 6 | 2.8% |
| Irish | 47 | 22.3% |
| Polish | 9 | 4.3% | View All 7 Rows |
Immigrants in Henderson Point

| Immigration Origin | # Population | % Population | View All 0 Rows |
Sex and Age in Henderson Point
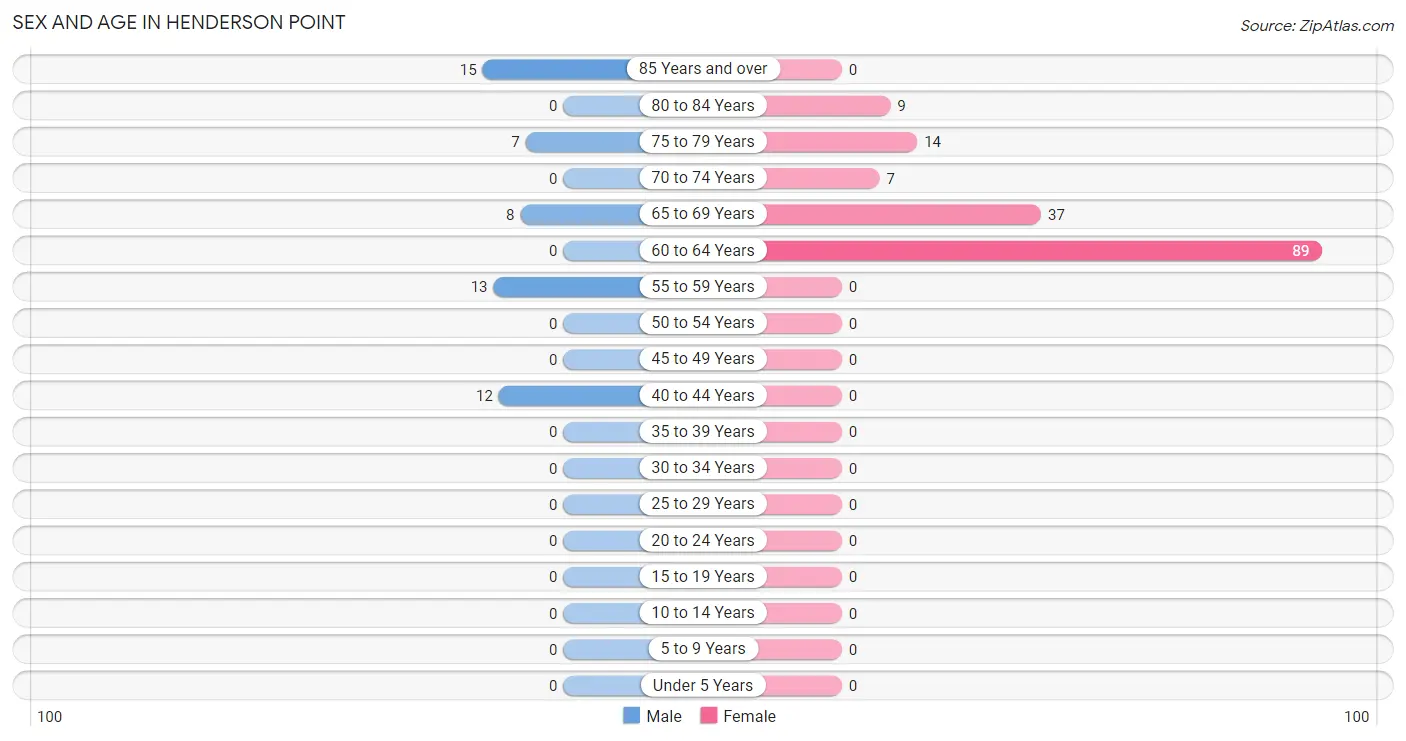
Sex and Age in Henderson Point
The most populous age groups in Henderson Point are 85 Years and over (15 | 27.3%) for men and 60 to 64 Years (89 | 57.1%) for women.
| Age Bracket | Male | Female |
| Under 5 Years | 0 (0.0%) | 0 (0.0%) |
| 5 to 9 Years | 0 (0.0%) | 0 (0.0%) |
| 10 to 14 Years | 0 (0.0%) | 0 (0.0%) |
| 15 to 19 Years | 0 (0.0%) | 0 (0.0%) |
| 20 to 24 Years | 0 (0.0%) | 0 (0.0%) |
| 25 to 29 Years | 0 (0.0%) | 0 (0.0%) |
| 30 to 34 Years | 0 (0.0%) | 0 (0.0%) |
| 35 to 39 Years | 0 (0.0%) | 0 (0.0%) |
| 40 to 44 Years | 12 (21.8%) | 0 (0.0%) |
| 45 to 49 Years | 0 (0.0%) | 0 (0.0%) |
| 50 to 54 Years | 0 (0.0%) | 0 (0.0%) |
| 55 to 59 Years | 13 (23.6%) | 0 (0.0%) |
| 60 to 64 Years | 0 (0.0%) | 89 (57.1%) |
| 65 to 69 Years | 8 (14.5%) | 37 (23.7%) |
| 70 to 74 Years | 0 (0.0%) | 7 (4.5%) |
| 75 to 79 Years | 7 (12.7%) | 14 (9.0%) |
| 80 to 84 Years | 0 (0.0%) | 9 (5.8%) |
| 85 Years and over | 15 (27.3%) | 0 (0.0%) |
| Total | 55 (100.0%) | 156 (100.0%) |
Families and Households in Henderson Point
Median Family Size in Henderson Point
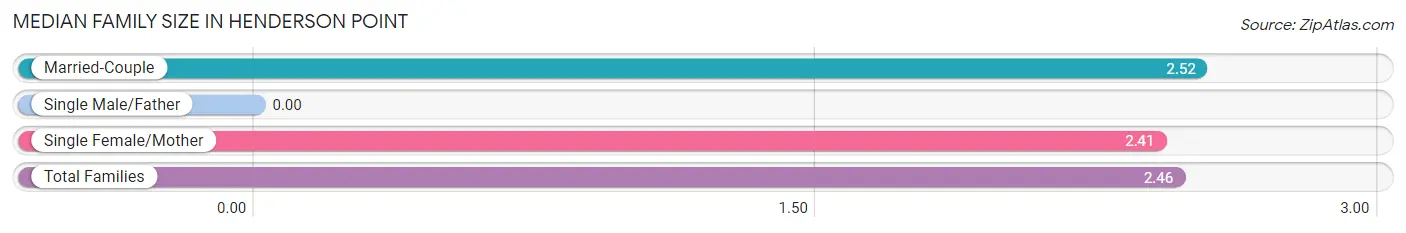
| Family Type | # Families | Family Size |
| Married-Couple | 27 (44.3%) | 2.52 |
| Single Male/Father | 0 (0.0%) | - |
| Single Female/Mother | 34 (55.7%) | 2.41 |
| Total Families | 61 (100.0%) | 2.46 |
Median Household Size in Henderson Point
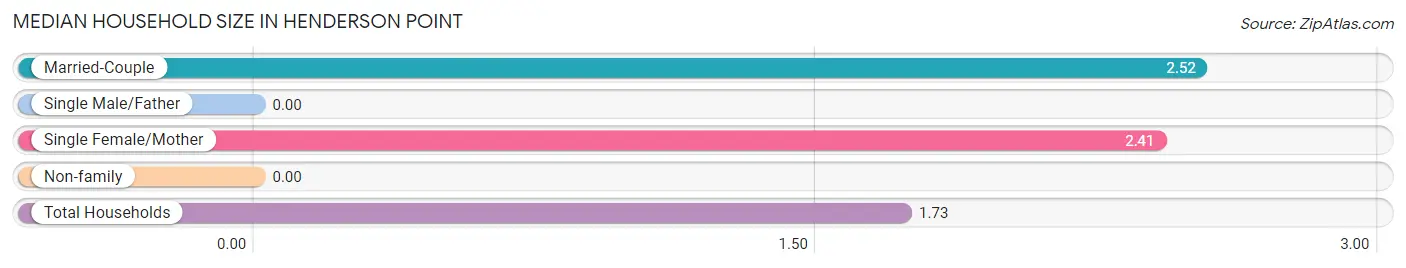
| Household Type | # Households | Household Size |
| Married-Couple | 27 (22.1%) | 2.52 |
| Single Male/Father | 0 (0.0%) | - |
| Single Female/Mother | 34 (27.9%) | 2.41 |
| Non-family | 61 (50.0%) | - |
| Total Households | 122 (100.0%) | 1.73 |
Household Size by Marriage Status in Henderson Point
Out of a total of 122 households in Henderson Point, 61 (50.0%) are family households, while 61 (50.0%) are nonfamily households. The most numerous type of family households are 2-person households, comprising 53, and the most common type of nonfamily households are 1-person households, comprising 61.
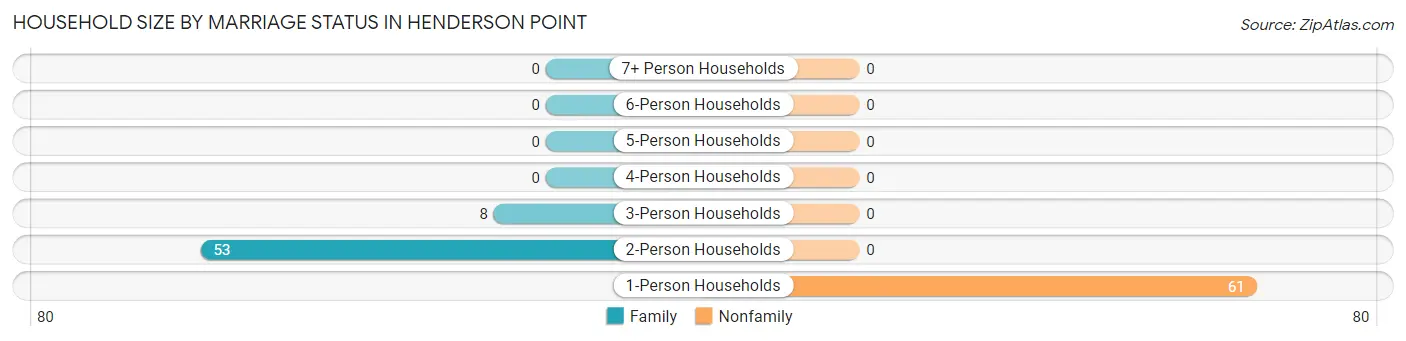
| Household Size | Family Households | Nonfamily Households |
| 1-Person Households | - | 61 (50.0%) |
| 2-Person Households | 53 (43.4%) | 0 (0.0%) |
| 3-Person Households | 8 (6.6%) | 0 (0.0%) |
| 4-Person Households | 0 (0.0%) | 0 (0.0%) |
| 5-Person Households | 0 (0.0%) | 0 (0.0%) |
| 6-Person Households | 0 (0.0%) | 0 (0.0%) |
| 7+ Person Households | 0 (0.0%) | 0 (0.0%) |
| Total | 61 (50.0%) | 61 (50.0%) |
Female Fertility in Henderson Point
Fertility by Age in Henderson Point
| Age Bracket | Women with Births | Births / 1,000 Women |
| 15 to 19 years | 0 (0.0%) | 0.0 |
| 20 to 34 years | 0 (0.0%) | 0.0 |
| 35 to 50 years | 0 (0.0%) | 0.0 |
| Total | 0 (0.0%) | 0.0 |
Fertility by Age by Marriage Status in Henderson Point
| Age Bracket | Married | Unmarried |
| 15 to 19 years | 0 (0.0%) | 0 (0.0%) |
| 20 to 34 years | 0 (0.0%) | 0 (0.0%) |
| 35 to 50 years | 0 (0.0%) | 0 (0.0%) |
| Total | 0 (0.0%) | 0 (0.0%) |
Fertility by Education in Henderson Point
| Educational Attainment | Women with Births | Births / 1,000 Women |
| Less than High School | 0 (0.0%) | 0.0 |
| High School Diploma | 0 (0.0%) | 0.0 |
| College or Associate's Degree | 0 (0.0%) | 0.0 |
| Bachelor's Degree | 0 (0.0%) | 0.0 |
| Graduate Degree | 0 (0.0%) | 0.0 |
| Total | 0 (0.0%) | 0.0 |
Fertility by Education by Marriage Status in Henderson Point
| Educational Attainment | Married | Unmarried |
| Less than High School | 0 (0.0%) | 0 (0.0%) |
| High School Diploma | 0 (0.0%) | 0 (0.0%) |
| College or Associate's Degree | 0 (0.0%) | 0 (0.0%) |
| Bachelor's Degree | 0 (0.0%) | 0 (0.0%) |
| Graduate Degree | 0 (0.0%) | 0 (0.0%) |
| Total | 0 (0.0%) | 0 (0.0%) |
Employment Characteristics in Henderson Point
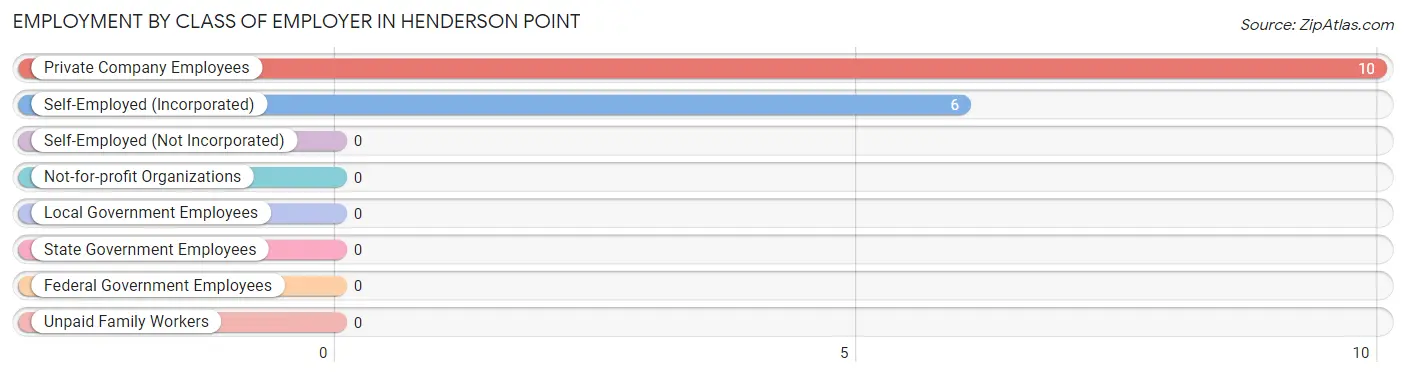
Employment by Class of Employer in Henderson Point
Among the 16 employed individuals in Henderson Point, private company employees (10 | 62.5%), and self-employed (incorporated) (6 | 37.5%) make up the most common classes of employment.
| Employer Class | # Employees | % Employees |
| Private Company Employees | 10 | 62.5% |
| Self-Employed (Incorporated) | 6 | 37.5% |
| Self-Employed (Not Incorporated) | 0 | 0.0% |
| Not-for-profit Organizations | 0 | 0.0% |
| Local Government Employees | 0 | 0.0% |
| State Government Employees | 0 | 0.0% |
| Federal Government Employees | 0 | 0.0% |
| Unpaid Family Workers | 0 | 0.0% |
| Total | 16 | 100.0% |
Employment Status by Age in Henderson Point
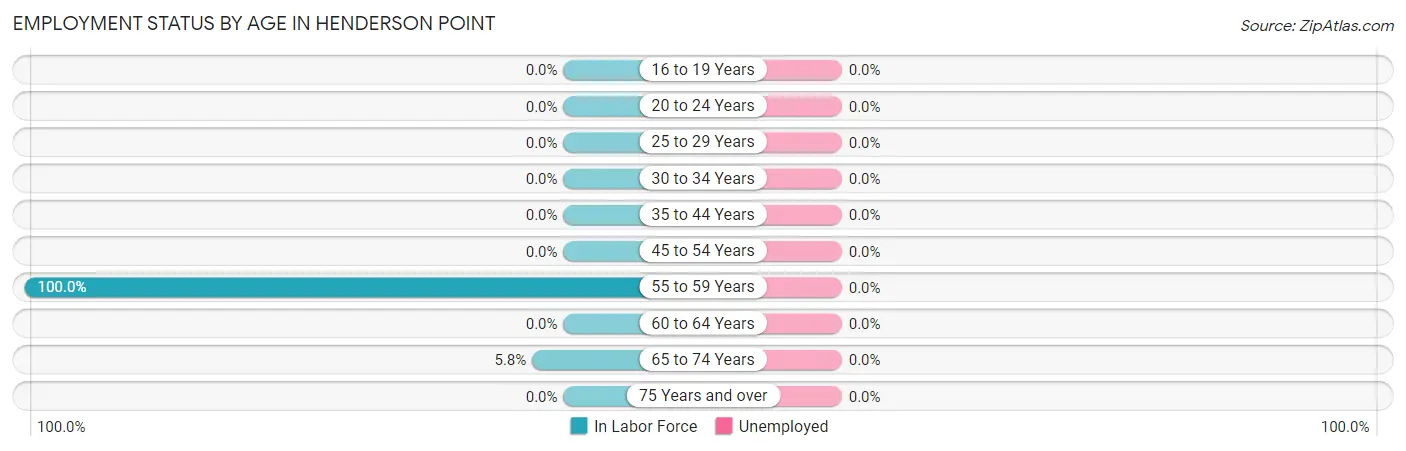
| Age Bracket | In Labor Force | Unemployed |
| 16 to 19 Years | 0 (0.0%) | 0 (0.0%) |
| 20 to 24 Years | 0 (0.0%) | 0 (0.0%) |
| 25 to 29 Years | 0 (0.0%) | 0 (0.0%) |
| 30 to 34 Years | 0 (0.0%) | 0 (0.0%) |
| 35 to 44 Years | 0 (0.0%) | 0 (0.0%) |
| 45 to 54 Years | 0 (0.0%) | 0 (0.0%) |
| 55 to 59 Years | 13 (100.0%) | 0 (0.0%) |
| 60 to 64 Years | 0 (0.0%) | 0 (0.0%) |
| 65 to 74 Years | 3 (5.8%) | 0 (0.0%) |
| 75 Years and over | 0 (0.0%) | 0 (0.0%) |
| Total | 16 (7.6%) | 0 (0.0%) |
Employment Status by Educational Attainment in Henderson Point
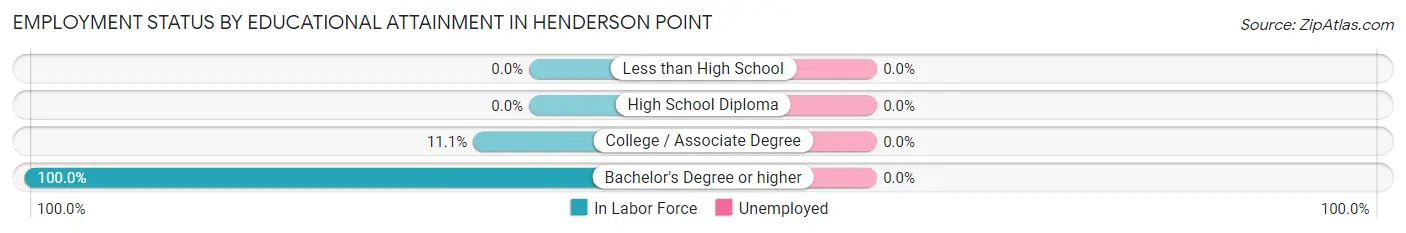
| Educational Attainment | In Labor Force | Unemployed |
| Less than High School | 0 (0.0%) | 0 (0.0%) |
| High School Diploma | 0 (0.0%) | 0 (0.0%) |
| College / Associate Degree | 10 (11.1%) | 0 (0.0%) |
| Bachelor's Degree or higher | 3 (100.0%) | 0 (0.0%) |
| Total | 13 (11.4%) | 0 (0.0%) |
Employment Occupations by Sex in Henderson Point
Management, Business, Science and Arts Occupations
The most common Management, Business, Science and Arts occupations in Henderson Point are Community & Social Service (3 | 18.8%), and Legal Services & Support (3 | 18.8%).
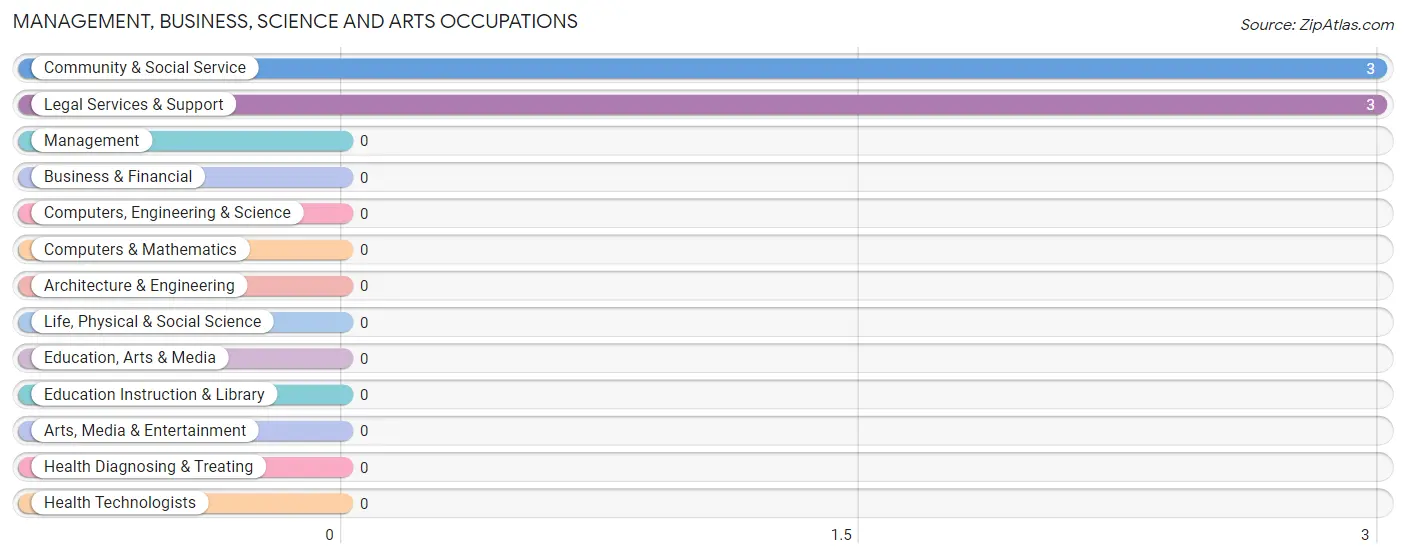
Management, Business, Science and Arts Occupations by Sex
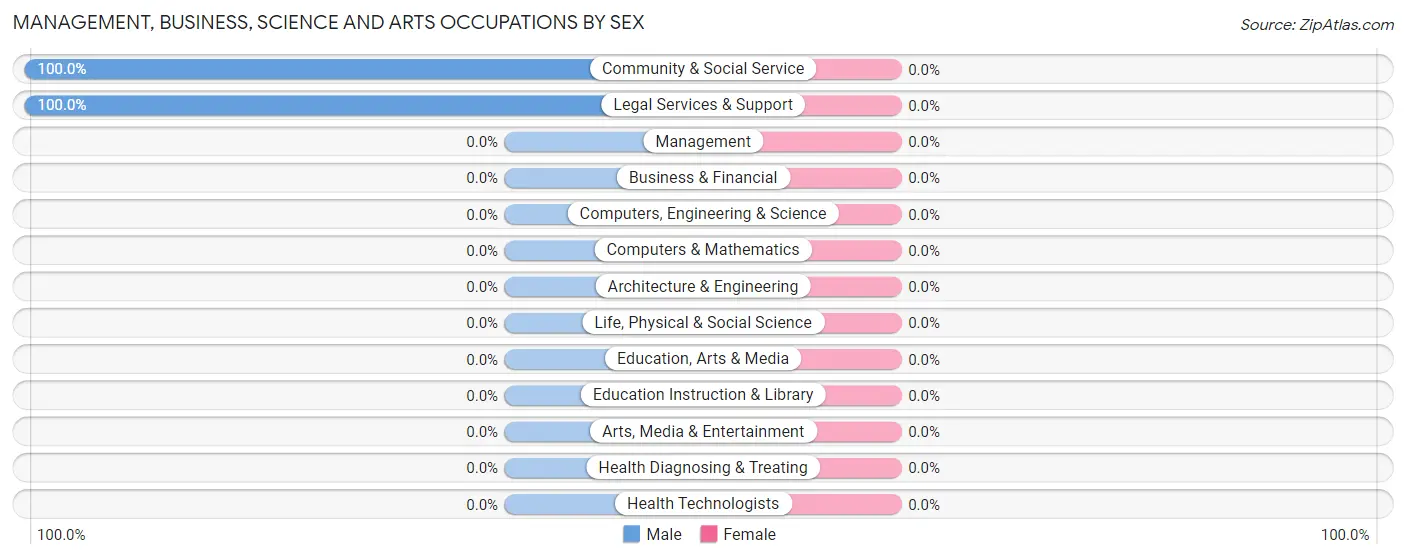
| Occupation | Male | Female |
| Management | 0 (0.0%) | 0 (0.0%) |
| Business & Financial | 0 (0.0%) | 0 (0.0%) |
| Computers, Engineering & Science | 0 (0.0%) | 0 (0.0%) |
| Computers & Mathematics | 0 (0.0%) | 0 (0.0%) |
| Architecture & Engineering | 0 (0.0%) | 0 (0.0%) |
| Life, Physical & Social Science | 0 (0.0%) | 0 (0.0%) |
| Community & Social Service | 3 (100.0%) | 0 (0.0%) |
| Education, Arts & Media | 0 (0.0%) | 0 (0.0%) |
| Legal Services & Support | 3 (100.0%) | 0 (0.0%) |
| Education Instruction & Library | 0 (0.0%) | 0 (0.0%) |
| Arts, Media & Entertainment | 0 (0.0%) | 0 (0.0%) |
| Health Diagnosing & Treating | 0 (0.0%) | 0 (0.0%) |
| Health Technologists | 0 (0.0%) | 0 (0.0%) |
| Total (Category) | 3 (100.0%) | 0 (0.0%) |
| Total (Overall) | 13 (81.2%) | 3 (18.8%) |
Services Occupations
Services Occupations by Sex
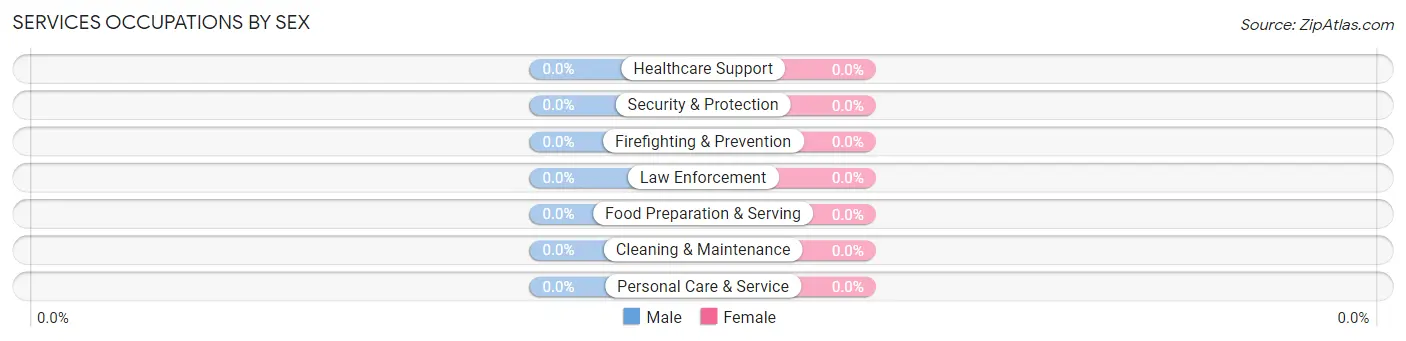
| Occupation | Male | Female |
| Healthcare Support | 0 (0.0%) | 0 (0.0%) |
| Security & Protection | 0 (0.0%) | 0 (0.0%) |
| Firefighting & Prevention | 0 (0.0%) | 0 (0.0%) |
| Law Enforcement | 0 (0.0%) | 0 (0.0%) |
| Food Preparation & Serving | 0 (0.0%) | 0 (0.0%) |
| Cleaning & Maintenance | 0 (0.0%) | 0 (0.0%) |
| Personal Care & Service | 0 (0.0%) | 0 (0.0%) |
| Total (Category) | 0 (0.0%) | 0 (0.0%) |
| Total (Overall) | 13 (81.2%) | 3 (18.8%) |
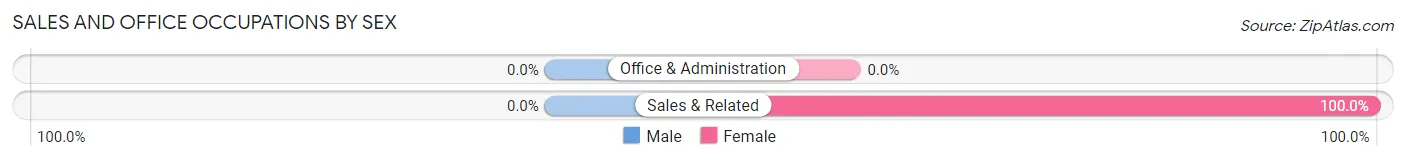
Sales and Office Occupations
The most common Sales and Office occupations in Henderson Point are , and Sales & Related (3 | 18.8%).
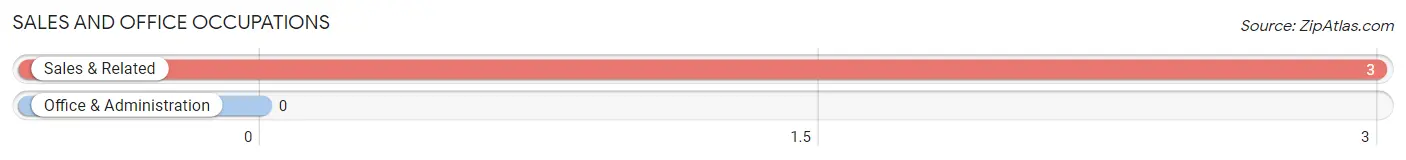
Sales and Office Occupations by Sex
| Occupation | Male | Female |
| Sales & Related | 0 (0.0%) | 3 (100.0%) |
| Office & Administration | 0 (0.0%) | 0 (0.0%) |
| Total (Category) | 0 (0.0%) | 3 (100.0%) |
| Total (Overall) | 13 (81.2%) | 3 (18.8%) |
Natural Resources, Construction and Maintenance Occupations
The most common Natural Resources, Construction and Maintenance occupations in Henderson Point are , and Installation, Maintenance & Repair (10 | 62.5%).
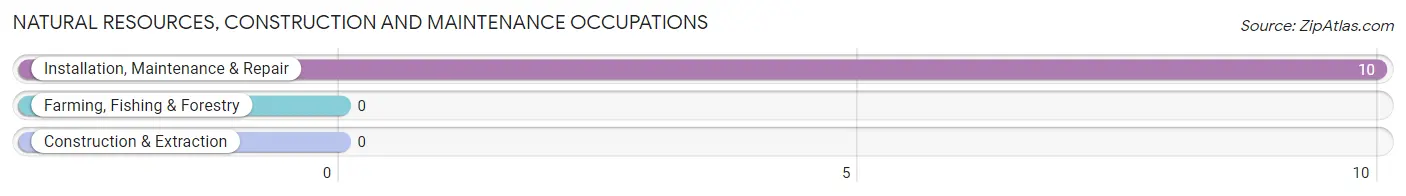
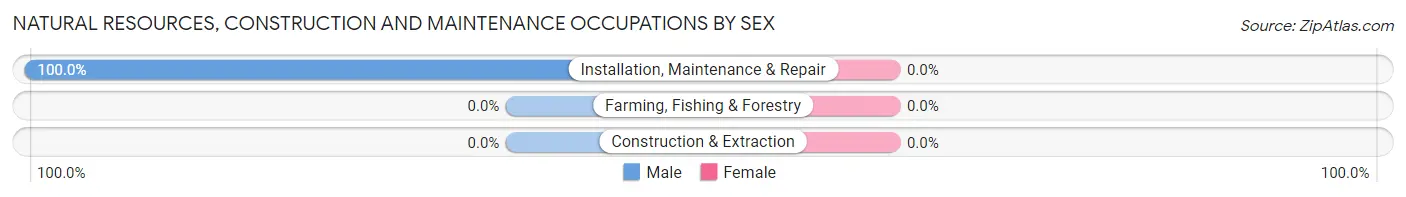
Natural Resources, Construction and Maintenance Occupations by Sex
| Occupation | Male | Female |
| Farming, Fishing & Forestry | 0 (0.0%) | 0 (0.0%) |
| Construction & Extraction | 0 (0.0%) | 0 (0.0%) |
| Installation, Maintenance & Repair | 10 (100.0%) | 0 (0.0%) |
| Total (Category) | 10 (100.0%) | 0 (0.0%) |
| Total (Overall) | 13 (81.2%) | 3 (18.8%) |
Production, Transportation and Moving Occupations
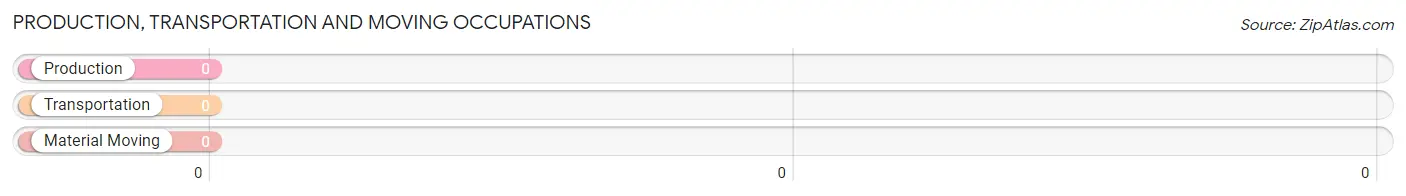
Production, Transportation and Moving Occupations by Sex
| Occupation | Male | Female |
| Production | 0 (0.0%) | 0 (0.0%) |
| Transportation | 0 (0.0%) | 0 (0.0%) |
| Material Moving | 0 (0.0%) | 0 (0.0%) |
| Total (Category) | 0 (0.0%) | 0 (0.0%) |
| Total (Overall) | 13 (81.2%) | 3 (18.8%) |
Employment Industries by Sex in Henderson Point
Employment Industries in Henderson Point
The major employment industries in Henderson Point include Manufacturing (10 | 62.5%), Retail Trade (3 | 18.8%), and Professional & Scientific (3 | 18.8%).
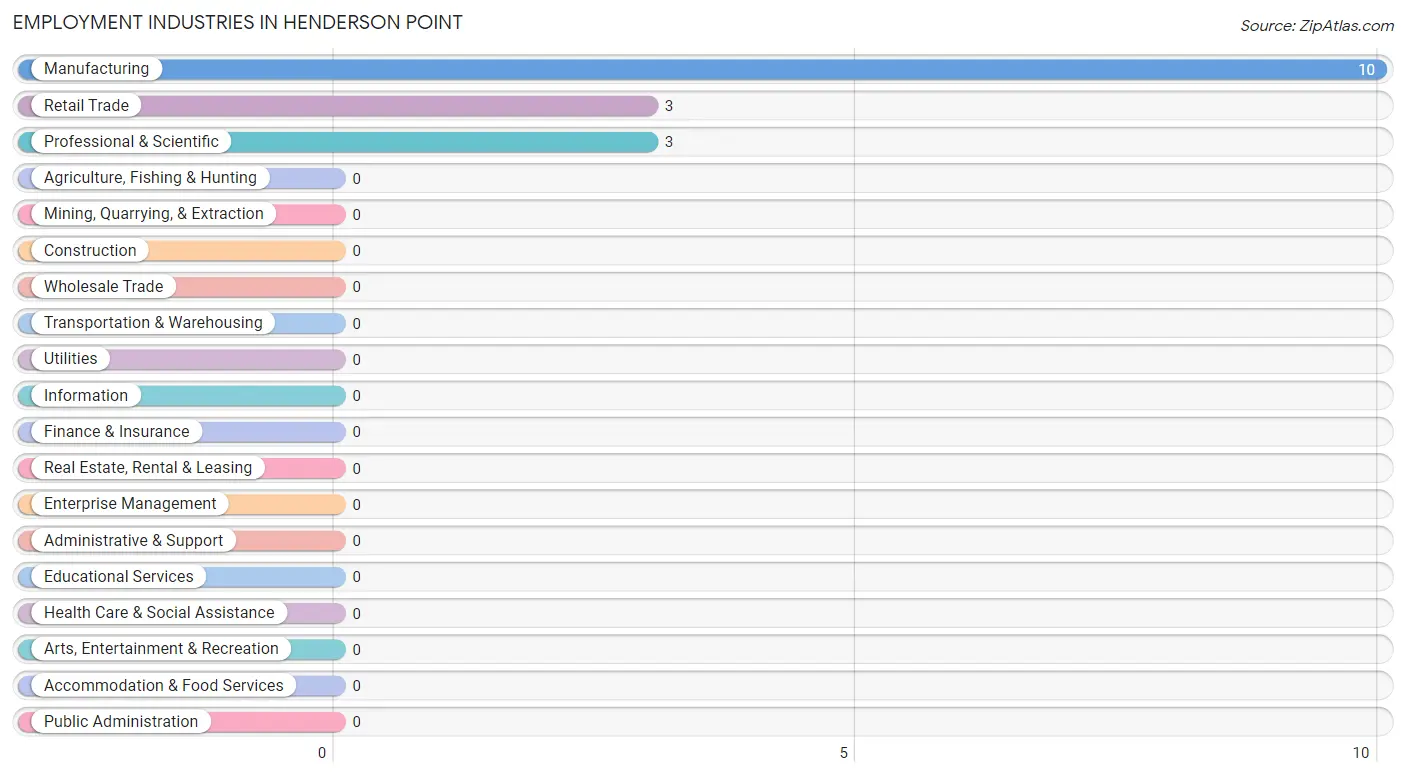
Employment Industries by Sex in Henderson Point
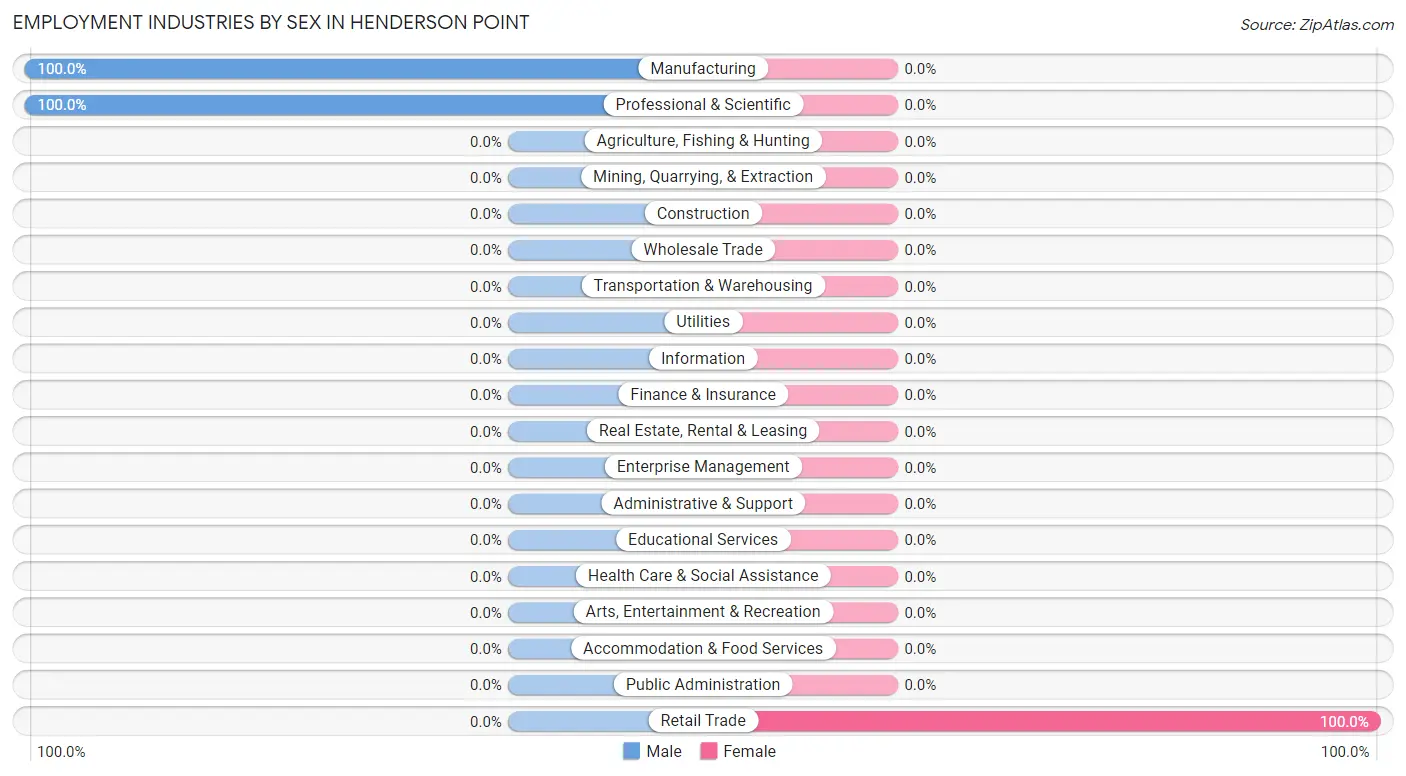
| Industry | Male | Female |
| Agriculture, Fishing & Hunting | 0 (0.0%) | 0 (0.0%) |
| Mining, Quarrying, & Extraction | 0 (0.0%) | 0 (0.0%) |
| Construction | 0 (0.0%) | 0 (0.0%) |
| Manufacturing | 10 (100.0%) | 0 (0.0%) |
| Wholesale Trade | 0 (0.0%) | 0 (0.0%) |
| Retail Trade | 0 (0.0%) | 3 (100.0%) |
| Transportation & Warehousing | 0 (0.0%) | 0 (0.0%) |
| Utilities | 0 (0.0%) | 0 (0.0%) |
| Information | 0 (0.0%) | 0 (0.0%) |
| Finance & Insurance | 0 (0.0%) | 0 (0.0%) |
| Real Estate, Rental & Leasing | 0 (0.0%) | 0 (0.0%) |
| Professional & Scientific | 3 (100.0%) | 0 (0.0%) |
| Enterprise Management | 0 (0.0%) | 0 (0.0%) |
| Administrative & Support | 0 (0.0%) | 0 (0.0%) |
| Educational Services | 0 (0.0%) | 0 (0.0%) |
| Health Care & Social Assistance | 0 (0.0%) | 0 (0.0%) |
| Arts, Entertainment & Recreation | 0 (0.0%) | 0 (0.0%) |
| Accommodation & Food Services | 0 (0.0%) | 0 (0.0%) |
| Public Administration | 0 (0.0%) | 0 (0.0%) |
| Total | 13 (81.2%) | 3 (18.8%) |
Education in Henderson Point
School Enrollment in Henderson Point
| School Level | # Students | % Students |
| Nursery / Preschool | 0 | 0.0% |
| Kindergarten | 0 | 0.0% |
| Elementary School | 0 | 0.0% |
| Middle School | 0 | 0.0% |
| High School | 0 | 0.0% |
| College / Undergraduate | 0 | 0.0% |
| Graduate / Professional | 0 | 0.0% |
| Total | 0 | 0.0% |
School Enrollment by Age by Funding Source in Henderson Point
| Age Bracket | Public School | Private School |
| 3 to 4 Year Olds | 0 (0.0%) | 0 (0.0%) |
| 5 to 9 Year Old | 0 (0.0%) | 0 (0.0%) |
| 10 to 14 Year Olds | 0 (0.0%) | 0 (0.0%) |
| 15 to 17 Year Olds | 0 (0.0%) | 0 (0.0%) |
| 18 to 19 Year Olds | 0 (0.0%) | 0 (0.0%) |
| 20 to 24 Year Olds | 0 (0.0%) | 0 (0.0%) |
| 25 to 34 Year Olds | 0 (0.0%) | 0 (0.0%) |
| 35 Years and over | 0 (0.0%) | 0 (0.0%) |
| Total | 0 (0.0%) | 0 (0.0%) |
Educational Attainment by Field of Study in Henderson Point
Science & technology (34 | 58.6%), education (18 | 31.0%), and psychology (6 | 10.3%) are the most common fields of study among 58 individuals in Henderson Point who have obtained a bachelor's degree or higher.

| Field of Study | # Graduates | % Graduates |
| Computers & Mathematics | 0 | 0.0% |
| Bio, Nature & Agricultural | 0 | 0.0% |
| Physical & Health Sciences | 0 | 0.0% |
| Psychology | 6 | 10.3% |
| Social Sciences | 0 | 0.0% |
| Engineering | 0 | 0.0% |
| Multidisciplinary Studies | 0 | 0.0% |
| Science & Technology | 34 | 58.6% |
| Business | 0 | 0.0% |
| Education | 18 | 31.0% |
| Literature & Languages | 0 | 0.0% |
| Liberal Arts & History | 0 | 0.0% |
| Visual & Performing Arts | 0 | 0.0% |
| Communications | 0 | 0.0% |
| Arts & Humanities | 0 | 0.0% |
| Total | 58 | 100.0% |
Transportation & Commute in Henderson Point
Vehicle Availability by Sex in Henderson Point
The most prevalent vehicle ownership categories in Henderson Point are males with 2 vehicles (10, accounting for 76.9%) and females with 2 vehicles (0, making up 333.3%).
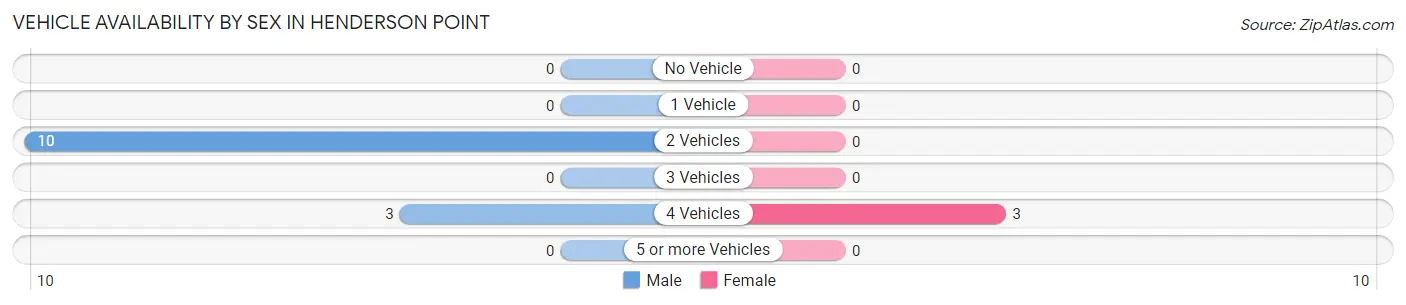
| Vehicles Available | Male | Female |
| No Vehicle | 0 (0.0%) | 0 (0.0%) |
| 1 Vehicle | 0 (0.0%) | 0 (0.0%) |
| 2 Vehicles | 10 (76.9%) | 0 (0.0%) |
| 3 Vehicles | 0 (0.0%) | 0 (0.0%) |
| 4 Vehicles | 3 (23.1%) | 3 (100.0%) |
| 5 or more Vehicles | 0 (0.0%) | 0 (0.0%) |
| Total | 13 (100.0%) | 3 (100.0%) |
Commute Time in Henderson Point
The most frequently occuring commute durations in Henderson Point are 10 to 14 minutes (10 commuters, 62.5%), 20 to 24 minutes (3 commuters, 18.8%), and 60 to 89 minutes (3 commuters, 18.8%).
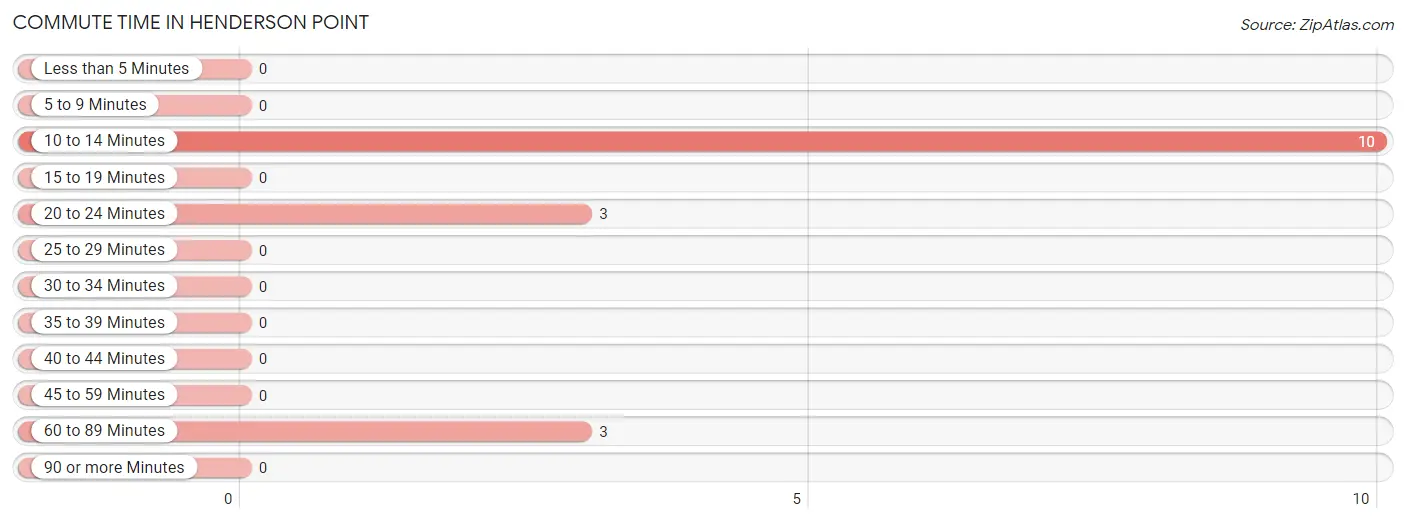
| Commute Time | # Commuters | % Commuters |
| Less than 5 Minutes | 0 | 0.0% |
| 5 to 9 Minutes | 0 | 0.0% |
| 10 to 14 Minutes | 10 | 62.5% |
| 15 to 19 Minutes | 0 | 0.0% |
| 20 to 24 Minutes | 3 | 18.8% |
| 25 to 29 Minutes | 0 | 0.0% |
| 30 to 34 Minutes | 0 | 0.0% |
| 35 to 39 Minutes | 0 | 0.0% |
| 40 to 44 Minutes | 0 | 0.0% |
| 45 to 59 Minutes | 0 | 0.0% |
| 60 to 89 Minutes | 3 | 18.8% |
| 90 or more Minutes | 0 | 0.0% |
Commute Time by Sex in Henderson Point
The most common commute times in Henderson Point are 10 to 14 minutes (10 commuters, 76.9%) for males and 60 to 89 minutes (3 commuters, 100.0%) for females.
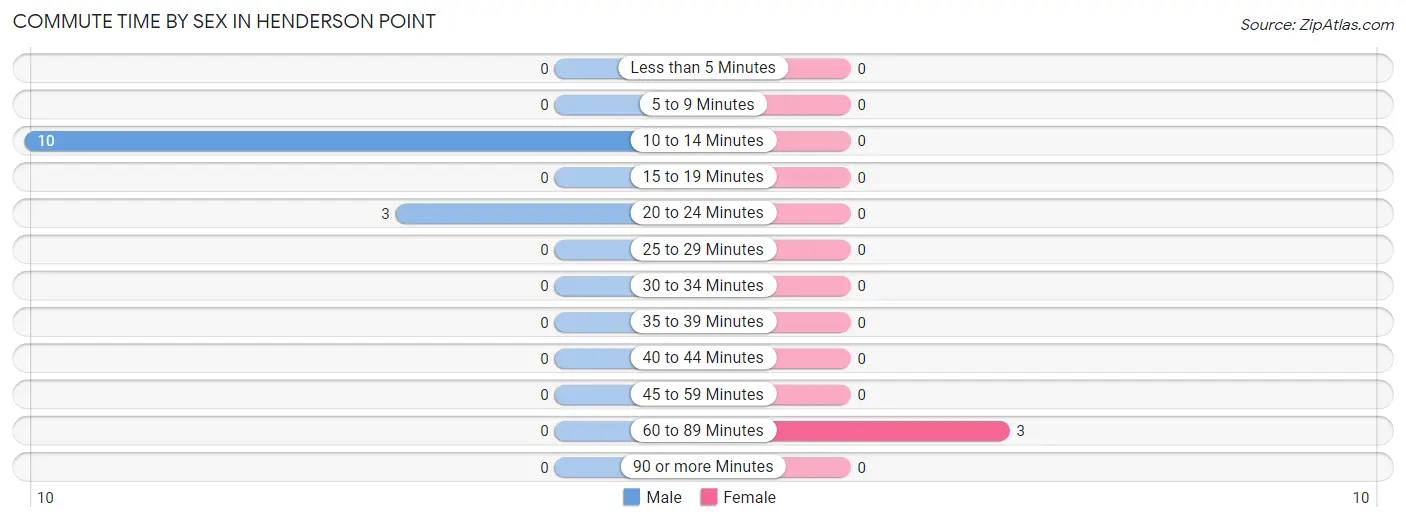
| Commute Time | Male | Female |
| Less than 5 Minutes | 0 (0.0%) | 0 (0.0%) |
| 5 to 9 Minutes | 0 (0.0%) | 0 (0.0%) |
| 10 to 14 Minutes | 10 (76.9%) | 0 (0.0%) |
| 15 to 19 Minutes | 0 (0.0%) | 0 (0.0%) |
| 20 to 24 Minutes | 3 (23.1%) | 0 (0.0%) |
| 25 to 29 Minutes | 0 (0.0%) | 0 (0.0%) |
| 30 to 34 Minutes | 0 (0.0%) | 0 (0.0%) |
| 35 to 39 Minutes | 0 (0.0%) | 0 (0.0%) |
| 40 to 44 Minutes | 0 (0.0%) | 0 (0.0%) |
| 45 to 59 Minutes | 0 (0.0%) | 0 (0.0%) |
| 60 to 89 Minutes | 0 (0.0%) | 3 (100.0%) |
| 90 or more Minutes | 0 (0.0%) | 0 (0.0%) |
Time of Departure to Work by Sex in Henderson Point
The most frequent times of departure to work in Henderson Point are 5:00 AM to 5:29 AM (10, 76.9%) for males and 9:00 AM to 9:59 AM (3, 100.0%) for females.
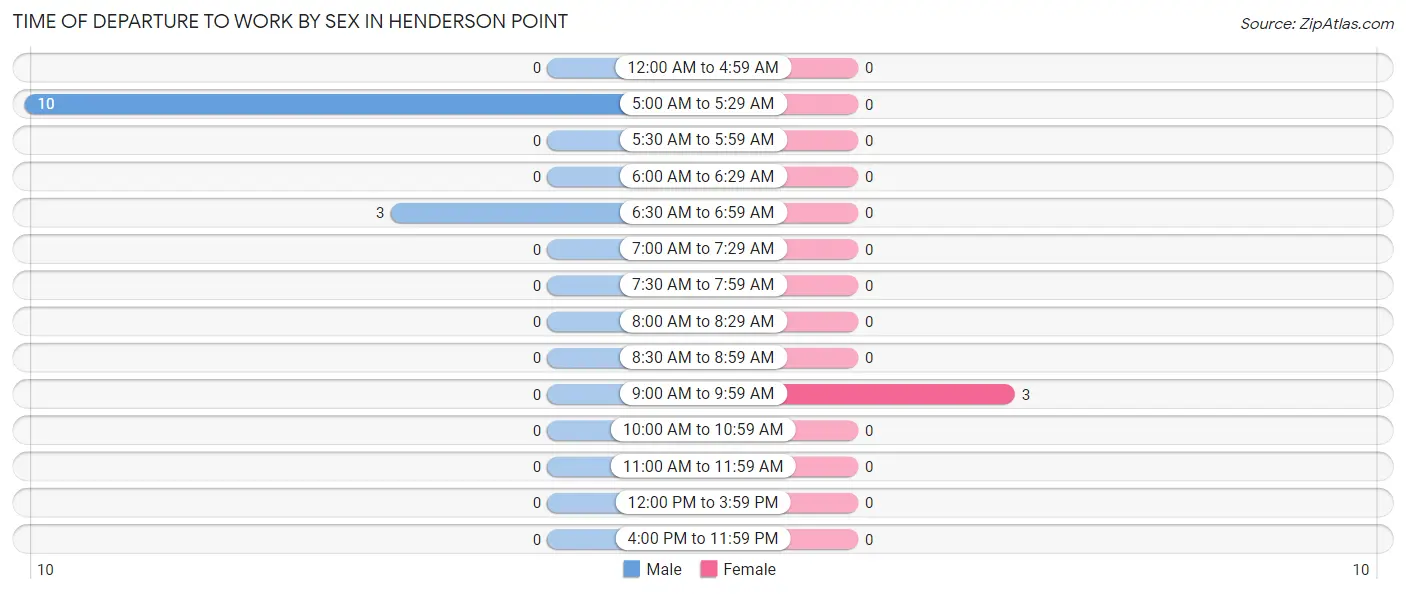
| Time of Departure | Male | Female |
| 12:00 AM to 4:59 AM | 0 (0.0%) | 0 (0.0%) |
| 5:00 AM to 5:29 AM | 10 (76.9%) | 0 (0.0%) |
| 5:30 AM to 5:59 AM | 0 (0.0%) | 0 (0.0%) |
| 6:00 AM to 6:29 AM | 0 (0.0%) | 0 (0.0%) |
| 6:30 AM to 6:59 AM | 3 (23.1%) | 0 (0.0%) |
| 7:00 AM to 7:29 AM | 0 (0.0%) | 0 (0.0%) |
| 7:30 AM to 7:59 AM | 0 (0.0%) | 0 (0.0%) |
| 8:00 AM to 8:29 AM | 0 (0.0%) | 0 (0.0%) |
| 8:30 AM to 8:59 AM | 0 (0.0%) | 0 (0.0%) |
| 9:00 AM to 9:59 AM | 0 (0.0%) | 3 (100.0%) |
| 10:00 AM to 10:59 AM | 0 (0.0%) | 0 (0.0%) |
| 11:00 AM to 11:59 AM | 0 (0.0%) | 0 (0.0%) |
| 12:00 PM to 3:59 PM | 0 (0.0%) | 0 (0.0%) |
| 4:00 PM to 11:59 PM | 0 (0.0%) | 0 (0.0%) |
| Total | 13 (100.0%) | 3 (100.0%) |
Housing Occupancy in Henderson Point
Occupancy by Ownership in Henderson Point
Of the total 122 dwellings in Henderson Point, owner-occupied units account for 122 (100.0%), while renter-occupied units make up 0 (0.0%).
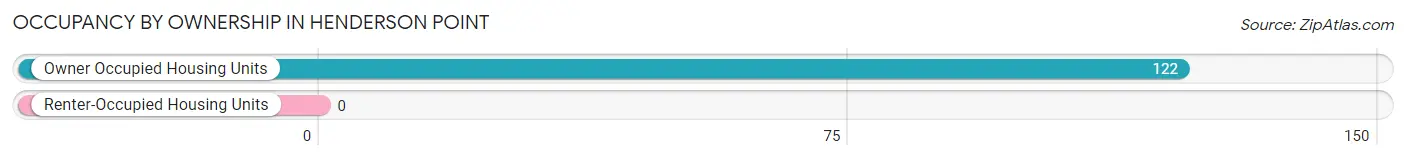
| Occupancy | # Housing Units | % Housing Units |
| Owner Occupied Housing Units | 122 | 100.0% |
| Renter-Occupied Housing Units | 0 | 0.0% |
| Total Occupied Housing Units | 122 | 100.0% |
Occupancy by Household Size in Henderson Point
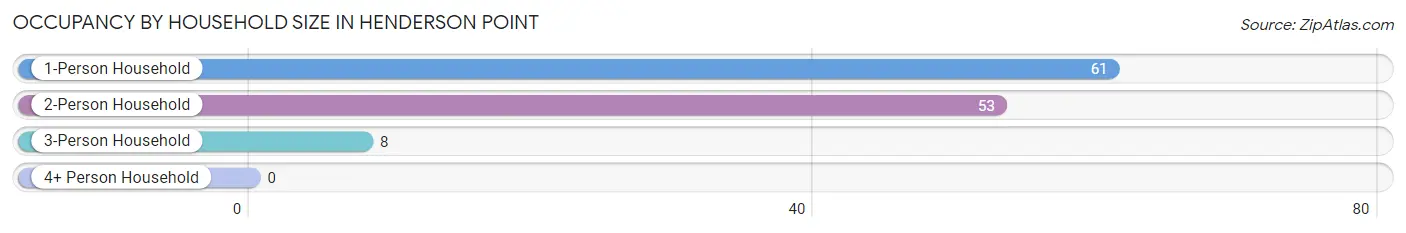
| Household Size | # Housing Units | % Housing Units |
| 1-Person Household | 61 | 50.0% |
| 2-Person Household | 53 | 43.4% |
| 3-Person Household | 8 | 6.6% |
| 4+ Person Household | 0 | 0.0% |
| Total Housing Units | 122 | 100.0% |
Occupancy by Ownership by Household Size in Henderson Point
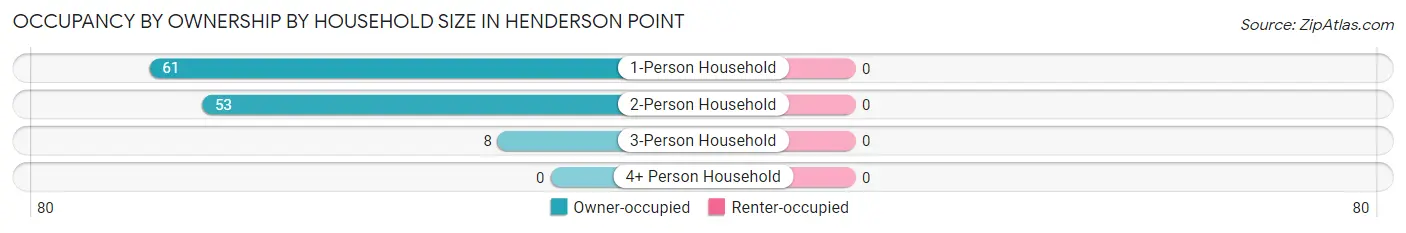
| Household Size | Owner-occupied | Renter-occupied |
| 1-Person Household | 61 (100.0%) | 0 (0.0%) |
| 2-Person Household | 53 (100.0%) | 0 (0.0%) |
| 3-Person Household | 8 (100.0%) | 0 (0.0%) |
| 4+ Person Household | 0 (0.0%) | 0 (0.0%) |
| Total Housing Units | 122 (100.0%) | 0 (0.0%) |
Occupancy by Educational Attainment in Henderson Point
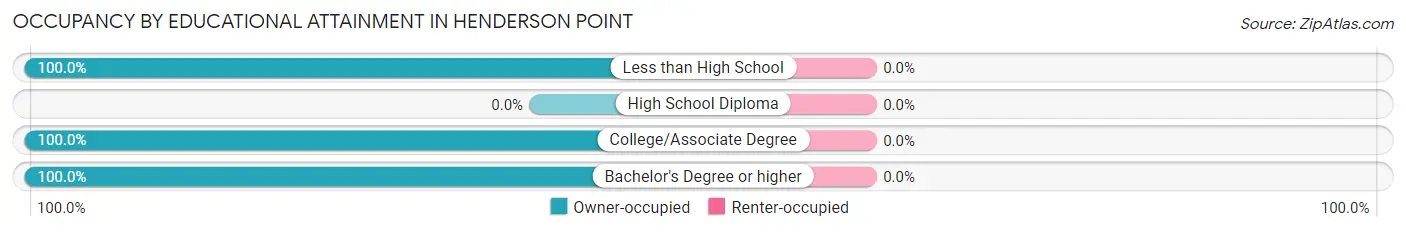
| Household Size | Owner-occupied | Renter-occupied |
| Less than High School | 8 (100.0%) | 0 (0.0%) |
| High School Diploma | 0 (0.0%) | 0 (0.0%) |
| College/Associate Degree | 64 (100.0%) | 0 (0.0%) |
| Bachelor's Degree or higher | 50 (100.0%) | 0 (0.0%) |
Occupancy by Age of Householder in Henderson Point
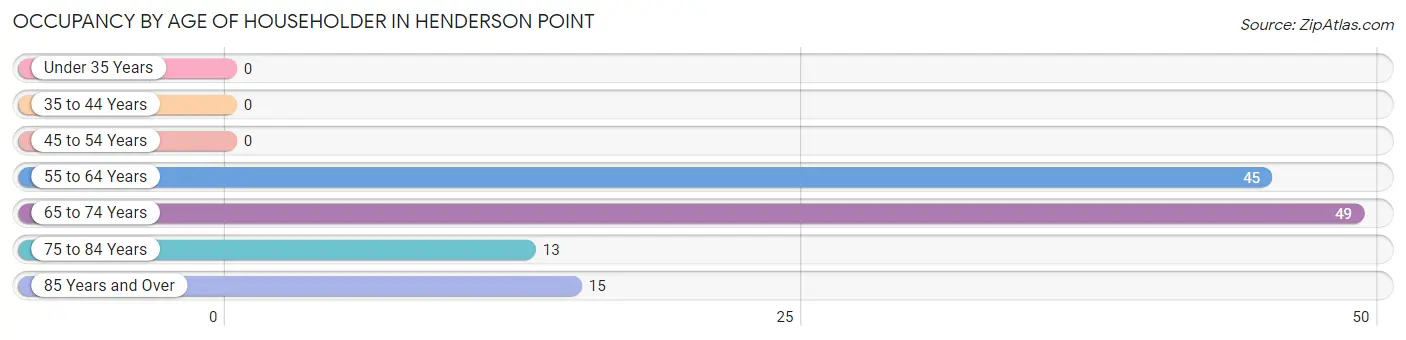
| Age Bracket | # Households | % Households |
| Under 35 Years | 0 | 0.0% |
| 35 to 44 Years | 0 | 0.0% |
| 45 to 54 Years | 0 | 0.0% |
| 55 to 64 Years | 45 | 36.9% |
| 65 to 74 Years | 49 | 40.2% |
| 75 to 84 Years | 13 | 10.7% |
| 85 Years and Over | 15 | 12.3% |
| Total | 122 | 100.0% |
Housing Finances in Henderson Point
Median Income by Occupancy in Henderson Point
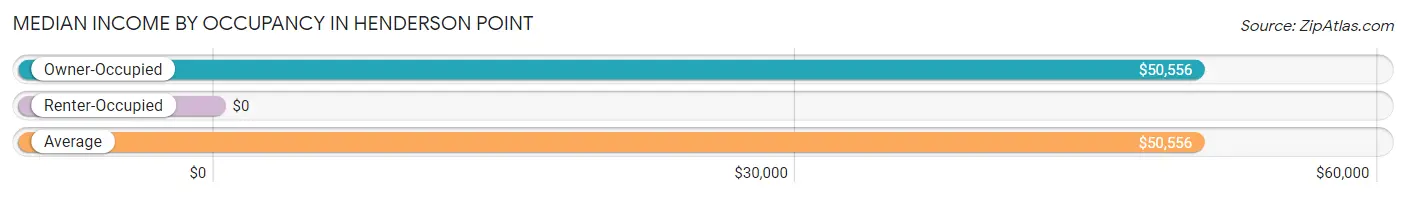
| Occupancy Type | # Households | Median Income |
| Owner-Occupied | 122 (100.0%) | $50,556 |
| Renter-Occupied | 0 (0.0%) | $0 |
| Average | 122 (100.0%) | $50,556 |
Occupancy by Householder Income Bracket in Henderson Point
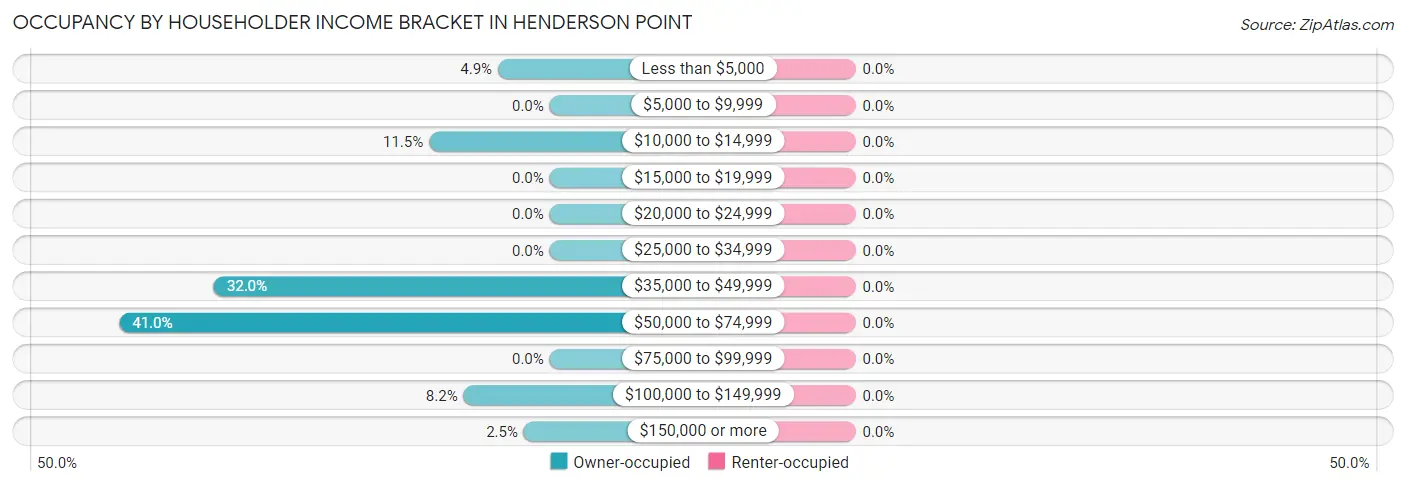
| Income Bracket | Owner-occupied | Renter-occupied |
| Less than $5,000 | 6 (4.9%) | 0 (0.0%) |
| $5,000 to $9,999 | 0 (0.0%) | 0 (0.0%) |
| $10,000 to $14,999 | 14 (11.5%) | 0 (0.0%) |
| $15,000 to $19,999 | 0 (0.0%) | 0 (0.0%) |
| $20,000 to $24,999 | 0 (0.0%) | 0 (0.0%) |
| $25,000 to $34,999 | 0 (0.0%) | 0 (0.0%) |
| $35,000 to $49,999 | 39 (32.0%) | 0 (0.0%) |
| $50,000 to $74,999 | 50 (41.0%) | 0 (0.0%) |
| $75,000 to $99,999 | 0 (0.0%) | 0 (0.0%) |
| $100,000 to $149,999 | 10 (8.2%) | 0 (0.0%) |
| $150,000 or more | 3 (2.5%) | 0 (0.0%) |
| Total | 122 (100.0%) | 0 (0.0%) |
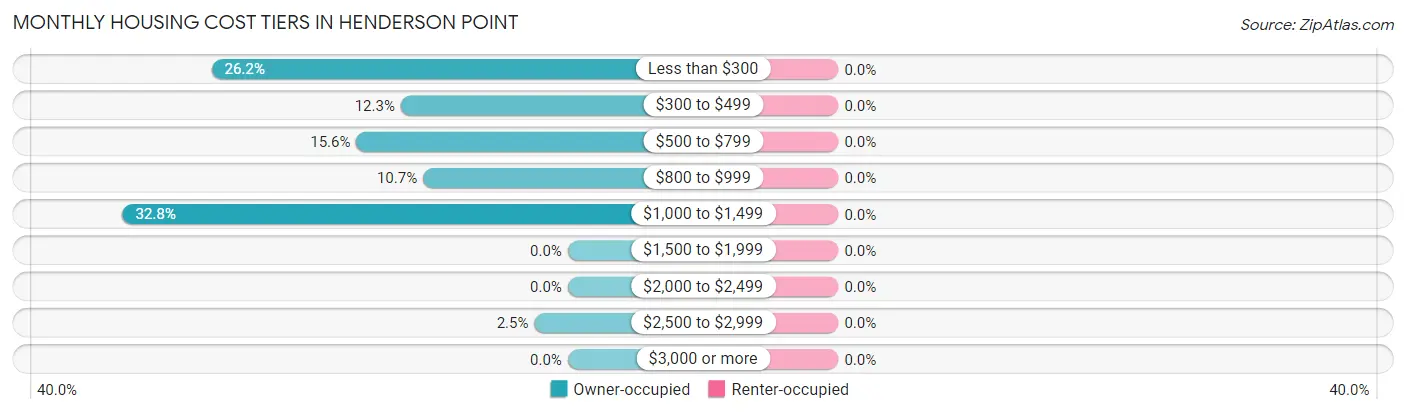
Monthly Housing Cost Tiers in Henderson Point
| Monthly Cost | Owner-occupied | Renter-occupied |
| Less than $300 | 32 (26.2%) | 0 (0.0%) |
| $300 to $499 | 15 (12.3%) | 0 (0.0%) |
| $500 to $799 | 19 (15.6%) | 0 (0.0%) |
| $800 to $999 | 13 (10.7%) | 0 (0.0%) |
| $1,000 to $1,499 | 40 (32.8%) | 0 (0.0%) |
| $1,500 to $1,999 | 0 (0.0%) | 0 (0.0%) |
| $2,000 to $2,499 | 0 (0.0%) | 0 (0.0%) |
| $2,500 to $2,999 | 3 (2.5%) | 0 (0.0%) |
| $3,000 or more | 0 (0.0%) | 0 (0.0%) |
| Total | 122 (100.0%) | 0 (0.0%) |
Physical Housing Characteristics in Henderson Point
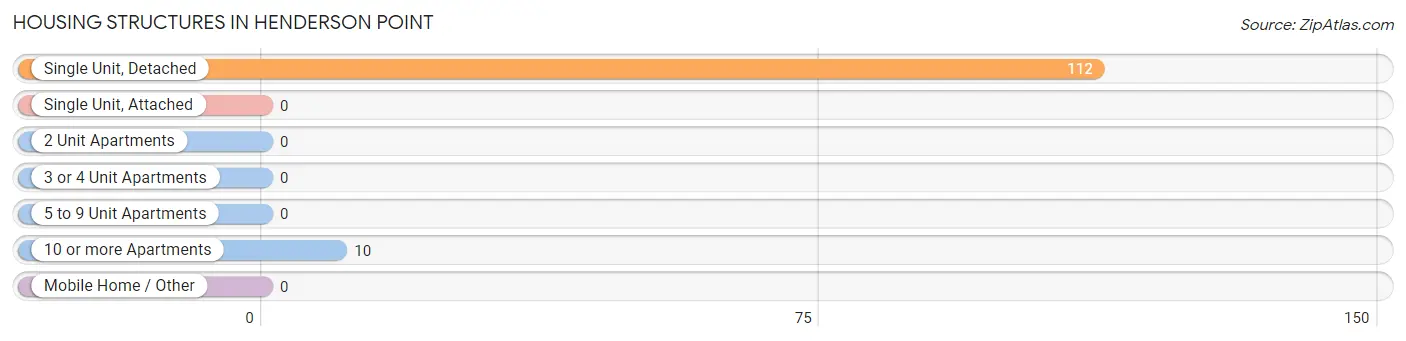
Housing Structures in Henderson Point
| Structure Type | # Housing Units | % Housing Units |
| Single Unit, Detached | 112 | 91.8% |
| Single Unit, Attached | 0 | 0.0% |
| 2 Unit Apartments | 0 | 0.0% |
| 3 or 4 Unit Apartments | 0 | 0.0% |
| 5 to 9 Unit Apartments | 0 | 0.0% |
| 10 or more Apartments | 10 | 8.2% |
| Mobile Home / Other | 0 | 0.0% |
| Total | 122 | 100.0% |
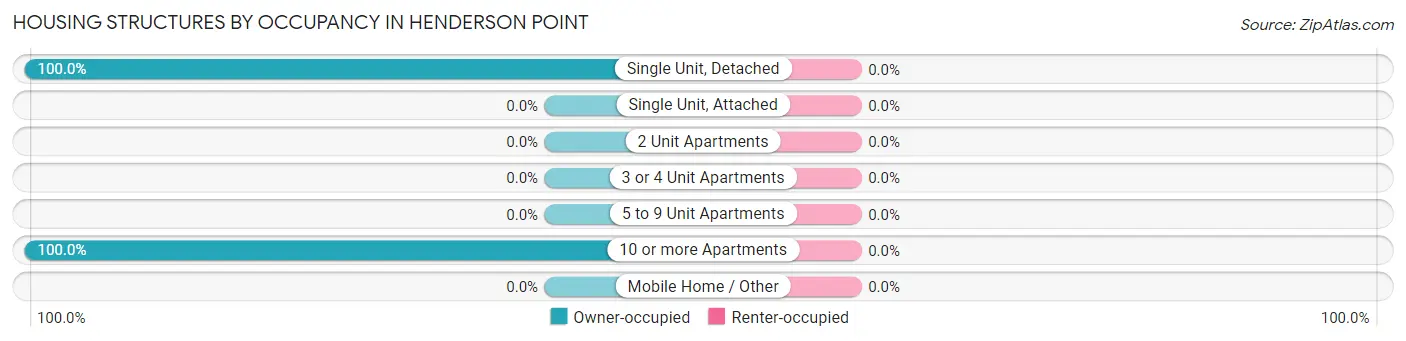
Housing Structures by Occupancy in Henderson Point
| Structure Type | Owner-occupied | Renter-occupied |
| Single Unit, Detached | 112 (100.0%) | 0 (0.0%) |
| Single Unit, Attached | 0 (0.0%) | 0 (0.0%) |
| 2 Unit Apartments | 0 (0.0%) | 0 (0.0%) |
| 3 or 4 Unit Apartments | 0 (0.0%) | 0 (0.0%) |
| 5 to 9 Unit Apartments | 0 (0.0%) | 0 (0.0%) |
| 10 or more Apartments | 10 (100.0%) | 0 (0.0%) |
| Mobile Home / Other | 0 (0.0%) | 0 (0.0%) |
| Total | 122 (100.0%) | 0 (0.0%) |
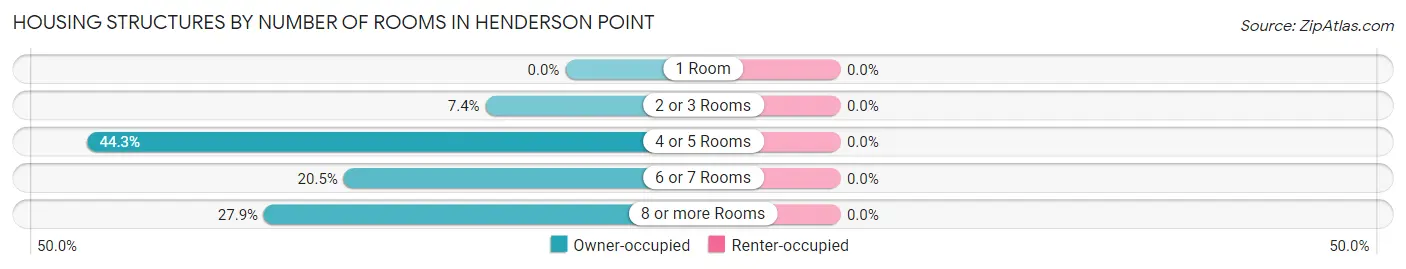
Housing Structures by Number of Rooms in Henderson Point
| Number of Rooms | Owner-occupied | Renter-occupied |
| 1 Room | 0 (0.0%) | 0 (0.0%) |
| 2 or 3 Rooms | 9 (7.4%) | 0 (0.0%) |
| 4 or 5 Rooms | 54 (44.3%) | 0 (0.0%) |
| 6 or 7 Rooms | 25 (20.5%) | 0 (0.0%) |
| 8 or more Rooms | 34 (27.9%) | 0 (0.0%) |
| Total | 122 (100.0%) | 0 (0.0%) |
Housing Structure by Heating Type in Henderson Point
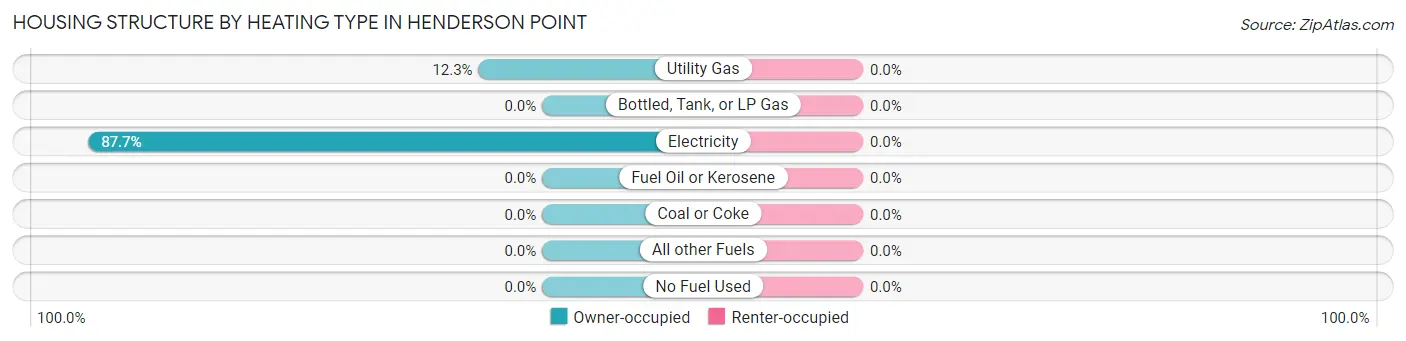
| Heating Type | Owner-occupied | Renter-occupied |
| Utility Gas | 15 (12.3%) | 0 (0.0%) |
| Bottled, Tank, or LP Gas | 0 (0.0%) | 0 (0.0%) |
| Electricity | 107 (87.7%) | 0 (0.0%) |
| Fuel Oil or Kerosene | 0 (0.0%) | 0 (0.0%) |
| Coal or Coke | 0 (0.0%) | 0 (0.0%) |
| All other Fuels | 0 (0.0%) | 0 (0.0%) |
| No Fuel Used | 0 (0.0%) | 0 (0.0%) |
| Total | 122 (100.0%) | 0 (0.0%) |
Household Vehicle Usage in Henderson Point
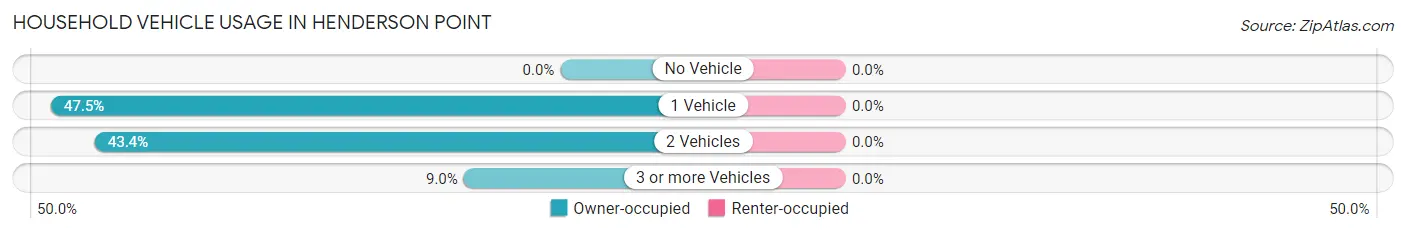
| Vehicles per Household | Owner-occupied | Renter-occupied |
| No Vehicle | 0 (0.0%) | 0 (0.0%) |
| 1 Vehicle | 58 (47.5%) | 0 (0.0%) |
| 2 Vehicles | 53 (43.4%) | 0 (0.0%) |
| 3 or more Vehicles | 11 (9.0%) | 0 (0.0%) |
| Total | 122 (100.0%) | 0 (0.0%) |
Real Estate & Mortgages in Henderson Point
Real Estate and Mortgage Overview in Henderson Point
| Characteristic | Without Mortgage | With Mortgage |
| Housing Units | 113 | 9 |
| Median Property Value | $245,400 | $0 |
| Median Household Income | $50,972 | $3 |
| Monthly Housing Costs | $650 | $0 |
| Real Estate Taxes | - | - |
Property Value by Mortgage Status in Henderson Point
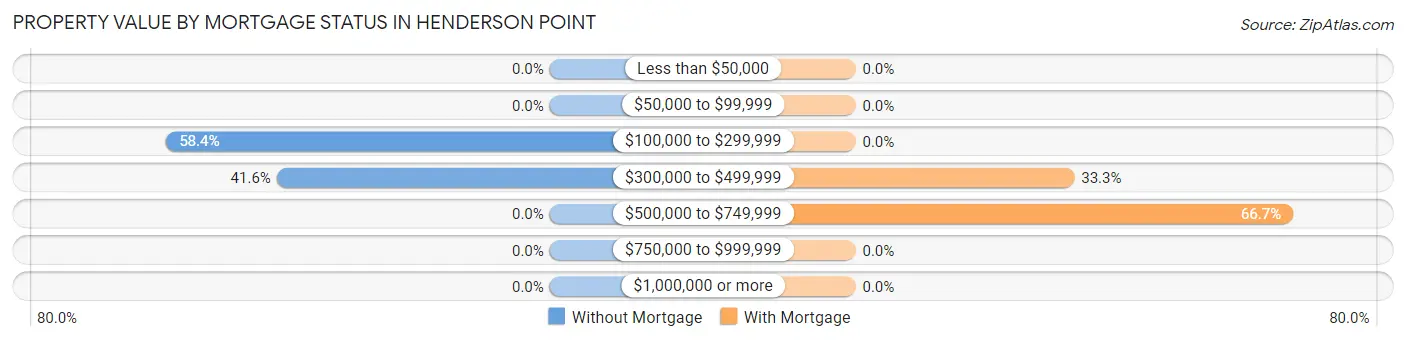
| Property Value | Without Mortgage | With Mortgage |
| Less than $50,000 | 0 (0.0%) | 0 (0.0%) |
| $50,000 to $99,999 | 0 (0.0%) | 0 (0.0%) |
| $100,000 to $299,999 | 66 (58.4%) | 0 (0.0%) |
| $300,000 to $499,999 | 47 (41.6%) | 3 (33.3%) |
| $500,000 to $749,999 | 0 (0.0%) | 6 (66.7%) |
| $750,000 to $999,999 | 0 (0.0%) | 0 (0.0%) |
| $1,000,000 or more | 0 (0.0%) | 0 (0.0%) |
| Total | 113 (100.0%) | 9 (100.0%) |
Household Income by Mortgage Status in Henderson Point
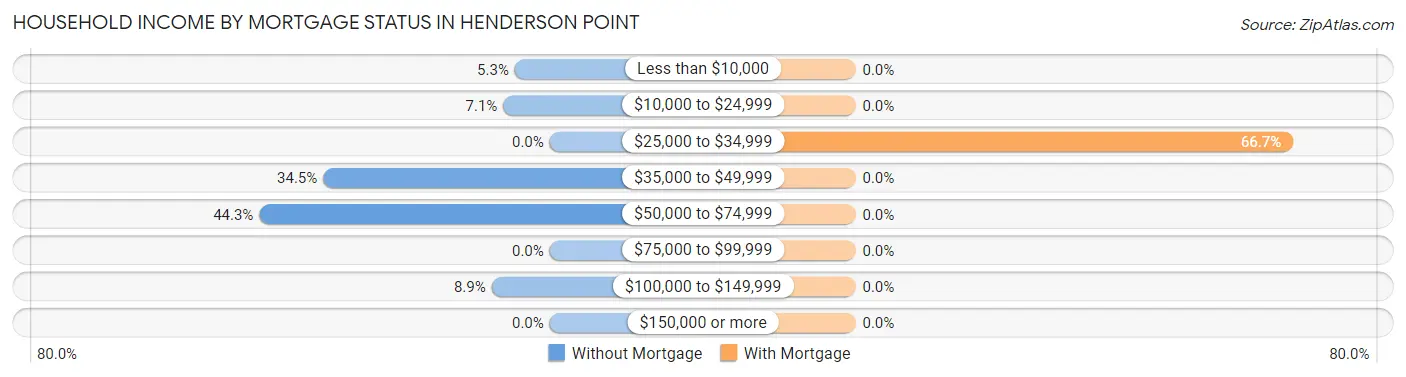
| Household Income | Without Mortgage | With Mortgage |
| Less than $10,000 | 6 (5.3%) | 0 (0.0%) |
| $10,000 to $24,999 | 8 (7.1%) | 0 (0.0%) |
| $25,000 to $34,999 | 0 (0.0%) | 6 (66.7%) |
| $35,000 to $49,999 | 39 (34.5%) | 0 (0.0%) |
| $50,000 to $74,999 | 50 (44.3%) | 0 (0.0%) |
| $75,000 to $99,999 | 0 (0.0%) | 0 (0.0%) |
| $100,000 to $149,999 | 10 (8.8%) | 0 (0.0%) |
| $150,000 or more | 0 (0.0%) | 0 (0.0%) |
| Total | 113 (100.0%) | 9 (100.0%) |
Property Value to Household Income Ratio in Henderson Point
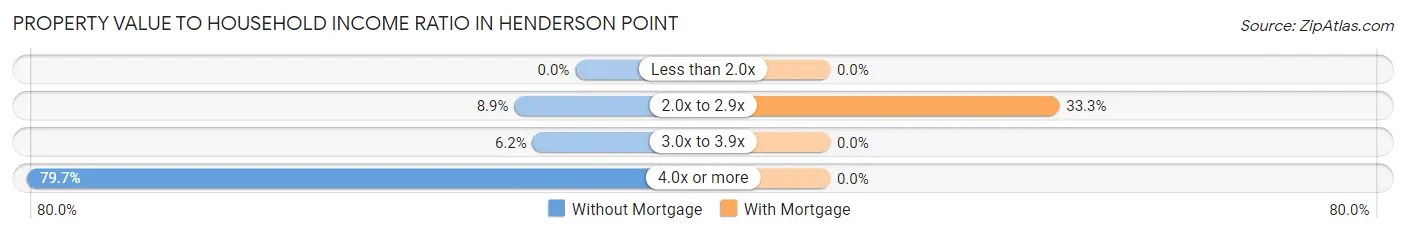
| Value-to-Income Ratio | Without Mortgage | With Mortgage |
| Less than 2.0x | 0 (0.0%) | 0 (0.0%) |
| 2.0x to 2.9x | 10 (8.8%) | 3 (33.3%) |
| 3.0x to 3.9x | 7 (6.2%) | 0 (0.0%) |
| 4.0x or more | 90 (79.6%) | 0 (0.0%) |
| Total | 113 (100.0%) | 9 (100.0%) |
Real Estate Taxes by Mortgage Status in Henderson Point
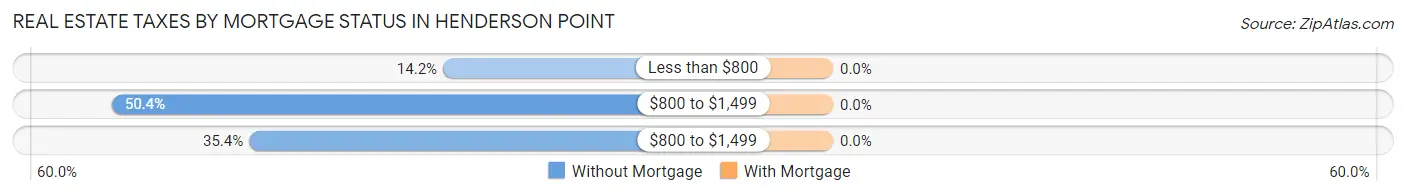
| Property Taxes | Without Mortgage | With Mortgage |
| Less than $800 | 16 (14.2%) | 0 (0.0%) |
| $800 to $1,499 | 57 (50.4%) | 0 (0.0%) |
| $800 to $1,499 | 40 (35.4%) | 0 (0.0%) |
| Total | 113 (100.0%) | 9 (100.0%) |
Health & Disability in Henderson Point
Health Insurance Coverage by Age in Henderson Point
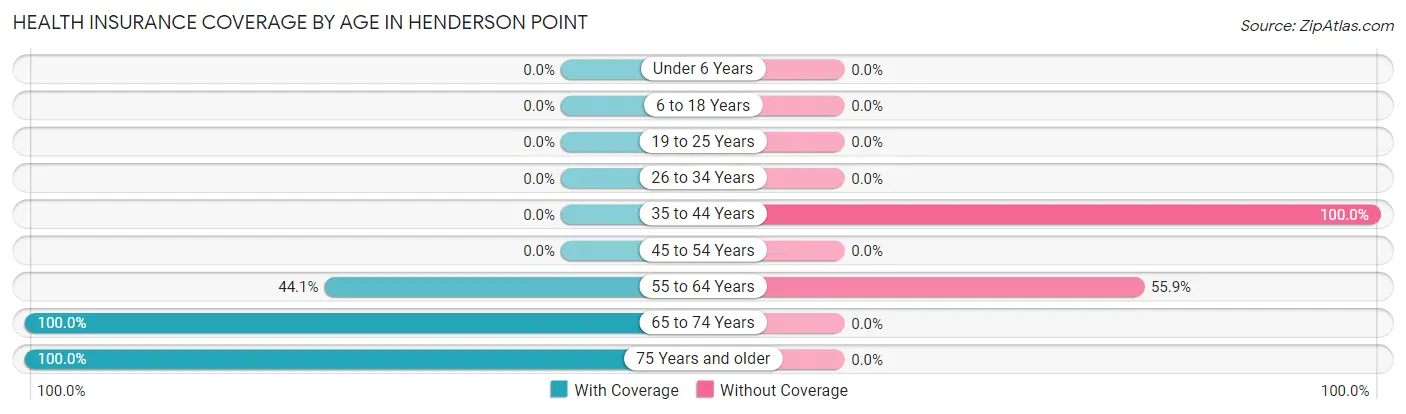
| Age Bracket | With Coverage | Without Coverage |
| Under 6 Years | 0 (0.0%) | 0 (0.0%) |
| 6 to 18 Years | 0 (0.0%) | 0 (0.0%) |
| 19 to 25 Years | 0 (0.0%) | 0 (0.0%) |
| 26 to 34 Years | 0 (0.0%) | 0 (0.0%) |
| 35 to 44 Years | 0 (0.0%) | 12 (100.0%) |
| 45 to 54 Years | 0 (0.0%) | 0 (0.0%) |
| 55 to 64 Years | 45 (44.1%) | 57 (55.9%) |
| 65 to 74 Years | 52 (100.0%) | 0 (0.0%) |
| 75 Years and older | 45 (100.0%) | 0 (0.0%) |
| Total | 142 (67.3%) | 69 (32.7%) |
Health Insurance Coverage by Citizenship Status in Henderson Point
| Citizenship Status | With Coverage | Without Coverage |
| Native Born | 0 (0.0%) | 0 (0.0%) |
| Foreign Born, Citizen | 0 (0.0%) | 0 (0.0%) |
| Foreign Born, not a Citizen | 0 (0.0%) | 0 (0.0%) |
Health Insurance Coverage by Household Income in Henderson Point
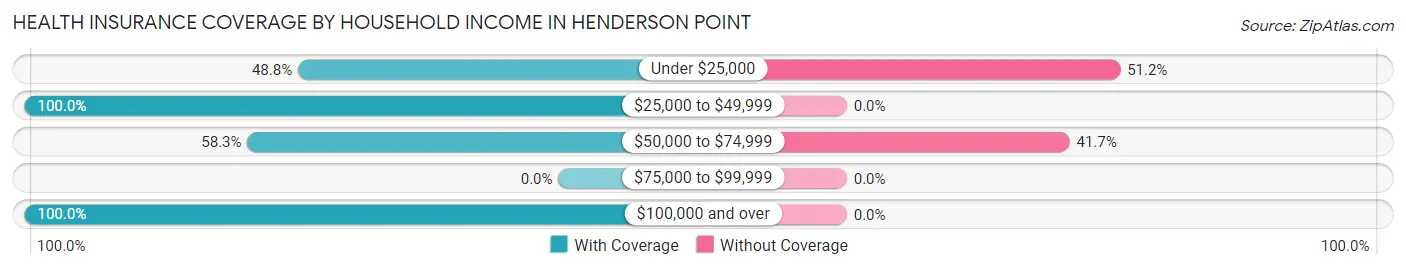
| Household Income | With Coverage | Without Coverage |
| Under $25,000 | 20 (48.8%) | 21 (51.2%) |
| $25,000 to $49,999 | 39 (100.0%) | 0 (0.0%) |
| $50,000 to $74,999 | 67 (58.3%) | 48 (41.7%) |
| $75,000 to $99,999 | 0 (0.0%) | 0 (0.0%) |
| $100,000 and over | 16 (100.0%) | 0 (0.0%) |
Public vs Private Health Insurance Coverage by Age in Henderson Point
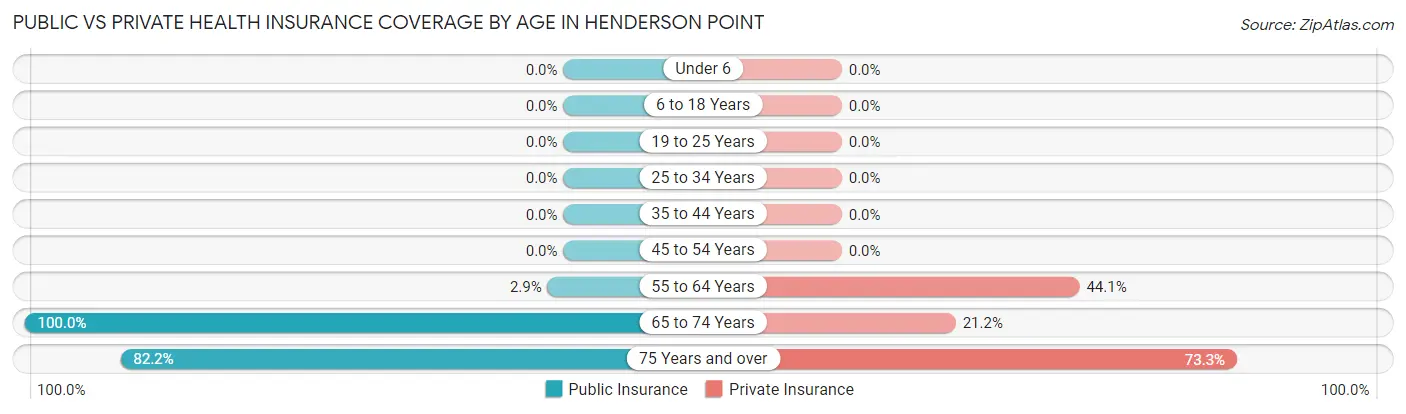
| Age Bracket | Public Insurance | Private Insurance |
| Under 6 | 0 (0.0%) | 0 (0.0%) |
| 6 to 18 Years | 0 (0.0%) | 0 (0.0%) |
| 19 to 25 Years | 0 (0.0%) | 0 (0.0%) |
| 25 to 34 Years | 0 (0.0%) | 0 (0.0%) |
| 35 to 44 Years | 0 (0.0%) | 0 (0.0%) |
| 45 to 54 Years | 0 (0.0%) | 0 (0.0%) |
| 55 to 64 Years | 3 (2.9%) | 45 (44.1%) |
| 65 to 74 Years | 52 (100.0%) | 11 (21.1%) |
| 75 Years and over | 37 (82.2%) | 33 (73.3%) |
| Total | 92 (43.6%) | 89 (42.2%) |
Disability Status by Sex by Age in Henderson Point
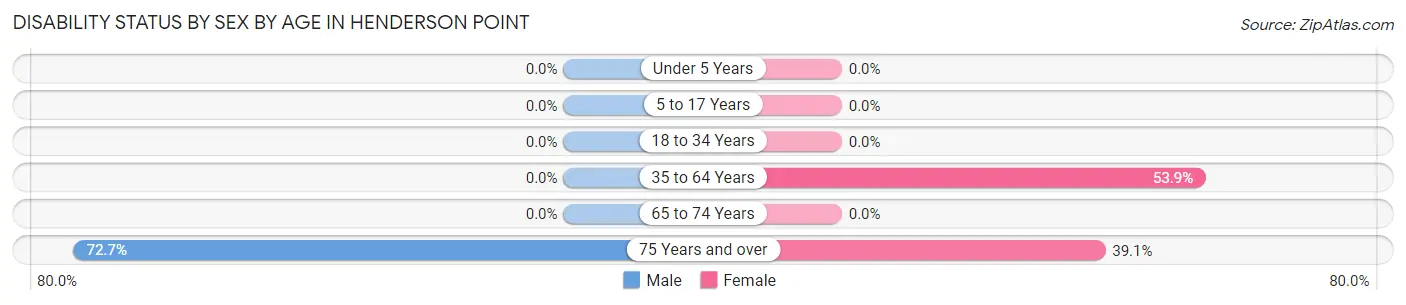
| Age Bracket | Male | Female |
| Under 5 Years | 0 (0.0%) | 0 (0.0%) |
| 5 to 17 Years | 0 (0.0%) | 0 (0.0%) |
| 18 to 34 Years | 0 (0.0%) | 0 (0.0%) |
| 35 to 64 Years | 0 (0.0%) | 48 (53.9%) |
| 65 to 74 Years | 0 (0.0%) | 0 (0.0%) |
| 75 Years and over | 16 (72.7%) | 9 (39.1%) |
Disability Class by Sex by Age in Henderson Point
Disability Class: Hearing Difficulty
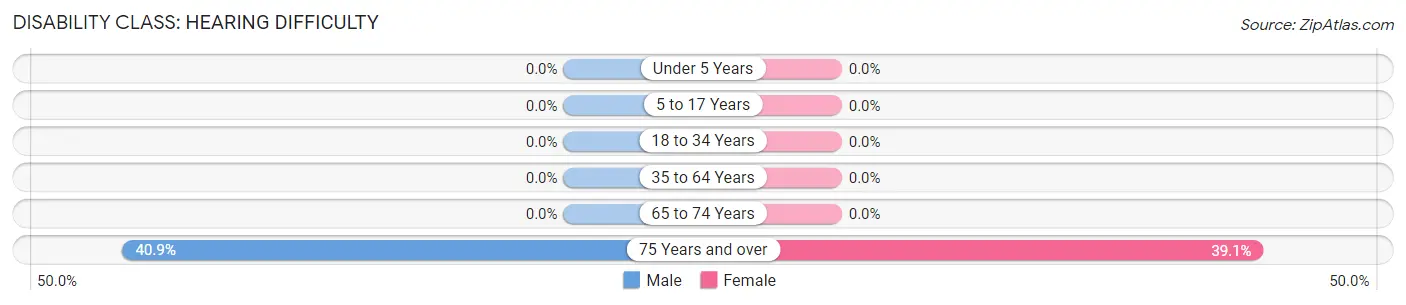
| Age Bracket | Male | Female |
| Under 5 Years | 0 (0.0%) | 0 (0.0%) |
| 5 to 17 Years | 0 (0.0%) | 0 (0.0%) |
| 18 to 34 Years | 0 (0.0%) | 0 (0.0%) |
| 35 to 64 Years | 0 (0.0%) | 0 (0.0%) |
| 65 to 74 Years | 0 (0.0%) | 0 (0.0%) |
| 75 Years and over | 9 (40.9%) | 9 (39.1%) |
Disability Class: Vision Difficulty
| Age Bracket | Male | Female |
| Under 5 Years | 0 (0.0%) | 0 (0.0%) |
| 5 to 17 Years | 0 (0.0%) | 0 (0.0%) |
| 18 to 34 Years | 0 (0.0%) | 0 (0.0%) |
| 35 to 64 Years | 0 (0.0%) | 0 (0.0%) |
| 65 to 74 Years | 0 (0.0%) | 0 (0.0%) |
| 75 Years and over | 0 (0.0%) | 0 (0.0%) |
Disability Class: Cognitive Difficulty
| Age Bracket | Male | Female |
| 5 to 17 Years | 0 (0.0%) | 0 (0.0%) |
| 18 to 34 Years | 0 (0.0%) | 0 (0.0%) |
| 35 to 64 Years | 0 (0.0%) | 0 (0.0%) |
| 65 to 74 Years | 0 (0.0%) | 0 (0.0%) |
| 75 Years and over | 0 (0.0%) | 0 (0.0%) |
Disability Class: Ambulatory Difficulty
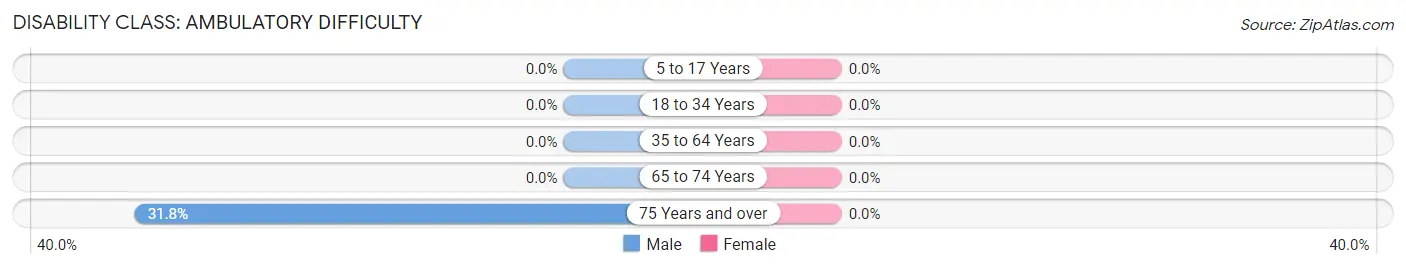
| Age Bracket | Male | Female |
| 5 to 17 Years | 0 (0.0%) | 0 (0.0%) |
| 18 to 34 Years | 0 (0.0%) | 0 (0.0%) |
| 35 to 64 Years | 0 (0.0%) | 0 (0.0%) |
| 65 to 74 Years | 0 (0.0%) | 0 (0.0%) |
| 75 Years and over | 7 (31.8%) | 0 (0.0%) |
Disability Class: Self-Care Difficulty
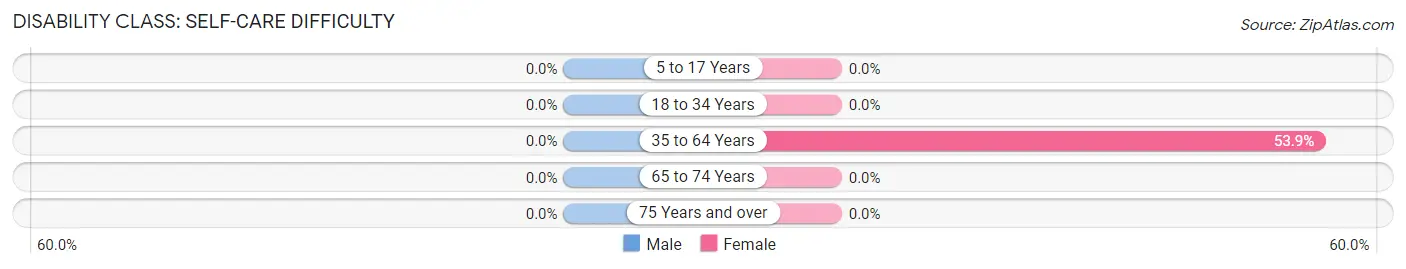
| Age Bracket | Male | Female |
| 5 to 17 Years | 0 (0.0%) | 0 (0.0%) |
| 18 to 34 Years | 0 (0.0%) | 0 (0.0%) |
| 35 to 64 Years | 0 (0.0%) | 48 (53.9%) |
| 65 to 74 Years | 0 (0.0%) | 0 (0.0%) |
| 75 Years and over | 0 (0.0%) | 0 (0.0%) |
Technology Access in Henderson Point
Computing Device Access in Henderson Point
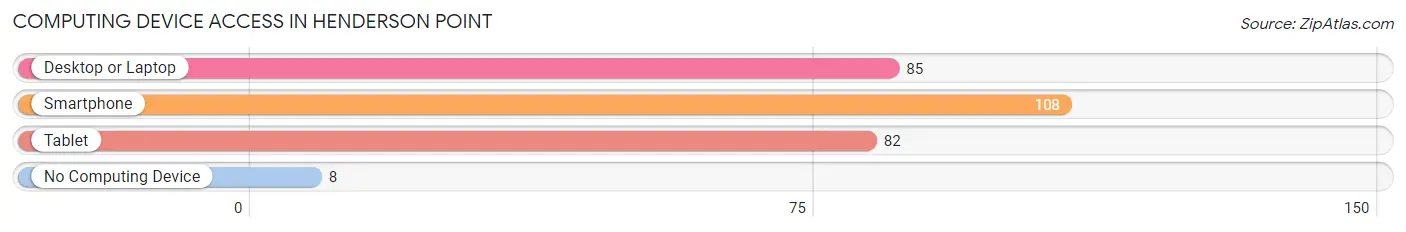
| Device Type | # Households | % Households |
| Desktop or Laptop | 85 | 69.7% |
| Smartphone | 108 | 88.5% |
| Tablet | 82 | 67.2% |
| No Computing Device | 8 | 6.6% |
| Total | 122 | 100.0% |
Internet Access in Henderson Point
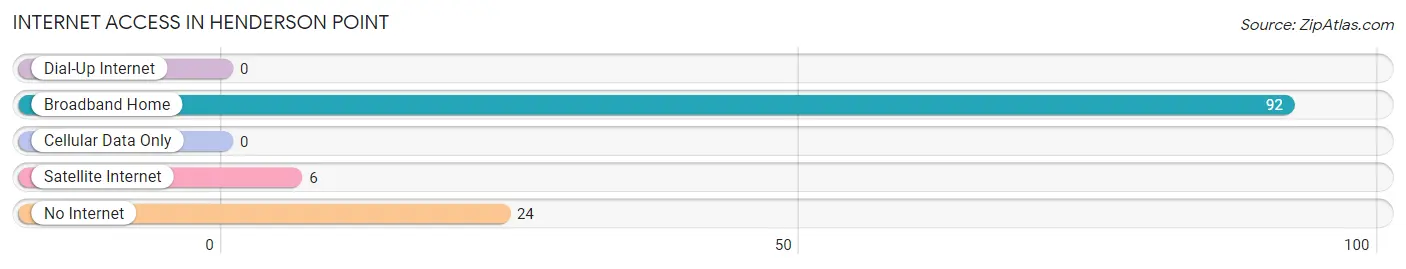
| Internet Type | # Households | % Households |
| Dial-Up Internet | 0 | 0.0% |
| Broadband Home | 92 | 75.4% |
| Cellular Data Only | 0 | 0.0% |
| Satellite Internet | 6 | 4.9% |
| No Internet | 24 | 19.7% |
| Total | 122 | 100.0% |
Henderson Point Summary
Henderson Point is a small unincorporated community located in Jackson County, Mississippi, United States. It is situated on the eastern shore of the Mississippi Sound, approximately 10 miles east of the city of Pascagoula. The community is part of the Pascagoula Metropolitan Statistical Area.
History
Henderson Point was first settled in the early 1800s by the Henderson family, who were among the first settlers in the area. The community was named after the family, and the point of land on which it is located was known as Henderson Point. The area was originally used for farming and fishing, and the community grew slowly over the years.
In the late 1800s, the area began to develop as a resort destination. The first hotel was built in 1891, and the area soon became a popular spot for fishing and other recreational activities. The community was incorporated in 1901, and the first post office was established in 1902.
In the early 1900s, the area began to develop as a commercial fishing center. The first cannery was built in 1906, and the area soon became a major producer of shrimp, oysters, and other seafood. The community also became a popular spot for recreational fishing, and the area was home to several fishing camps.
In the 1950s, the area began to develop as a residential community. The first subdivision was built in 1954, and the area soon became a popular spot for vacation homes. The community has continued to grow over the years, and today it is home to a variety of businesses and services.
Geography
Henderson Point is located on the eastern shore of the Mississippi Sound, approximately 10 miles east of the city of Pascagoula. The community is situated on a point of land that juts out into the sound, and the area is surrounded by marshland and wetlands. The area is part of the Gulf Coast region, and the climate is generally mild and humid.
Economy
The economy of Henderson Point is largely based on tourism and fishing. The area is home to several fishing camps, and the community is a popular spot for recreational fishing. The area is also home to several seafood processing plants, and the community is a major producer of shrimp, oysters, and other seafood.
The area is also home to a variety of businesses and services, including restaurants, retail stores, and other services. The community is also home to several marinas, and the area is a popular spot for boating and other water activities.
Demographics
As of the 2010 census, the population of Henderson Point was 1,845. The racial makeup of the community was 97.3% White, 0.7% African American, 0.3% Native American, 0.2% Asian, 0.1% Pacific Islander, and 1.4% from other races. The median household income was $45,938, and the median family income was $50,938.
Conclusion
Henderson Point is a small unincorporated community located in Jackson County, Mississippi. The community was first settled in the early 1800s, and it has since grown into a popular spot for fishing and other recreational activities. The economy of the area is largely based on tourism and fishing, and the community is home to a variety of businesses and services. As of the 2010 census, the population of Henderson Point was 1,845.
Common Questions
What is Per Capita Income in Henderson Point?
Per Capita income in Henderson Point is $31,409.
What is the Median Family Income in Henderson Point?
Median Family Income in Henderson Point is $60,993.
What is the Median Household income in Henderson Point?
Median Household Income in Henderson Point is $50,556.
What is Inequality or Gini Index in Henderson Point?
Inequality or Gini Index in Henderson Point is 0.34.
What is the Total Population of Henderson Point?
Total Population of Henderson Point is 211.
What is the Total Male Population of Henderson Point?
Total Male Population of Henderson Point is 55.
What is the Total Female Population of Henderson Point?
Total Female Population of Henderson Point is 156.
What is the Ratio of Males per 100 Females in Henderson Point?
There are 35.26 Males per 100 Females in Henderson Point.
What is the Ratio of Females per 100 Males in Henderson Point?
There are 283.64 Females per 100 Males in Henderson Point.
What is the Median Population Age in Henderson Point?
Median Population Age in Henderson Point is 63.1 Years.
What is the Average Family Size in Henderson Point
Average Family Size in Henderson Point is 2.5 People.
What is the Average Household Size in Henderson Point
Average Household Size in Henderson Point is 1.7 People.
How Large is the Labor Force in Henderson Point?
There are 16 People in the Labor Forcein in Henderson Point.
What is the Percentage of People in the Labor Force in Henderson Point?
7.6% of People are in the Labor Force in Henderson Point.