Meridian, MS Map & Demographics
Meridian Map
Meridian Overview
$25,172
PER CAPITA INCOME
$46,223
AVG FAMILY INCOME
$32,797
AVG HOUSEHOLD INCOME
23.3%
WAGE / INCOME GAP [ % ]
76.7¢/ $1
WAGE / INCOME GAP [ $ ]
$12,403
FAMILY INCOME DEFICIT
0.56
INEQUALITY / GINI INDEX
34,990
TOTAL POPULATION
16,295
MALE POPULATION
18,695
FEMALE POPULATION
87.16
MALES / 100 FEMALES
114.73
FEMALES / 100 MALES
37.9
MEDIAN AGE
3.1
AVG FAMILY SIZE
2.3
AVG HOUSEHOLD SIZE
14,790
LABOR FORCE [ PEOPLE ]
53.9%
PERCENT IN LABOR FORCE
8.6%
UNEMPLOYMENT RATE
Income in Meridian
Income Overview in Meridian
Per Capita Income in Meridian is $25,172, while median incomes of families and households are $46,223 and $32,797 respectively.
| Characteristic | Number | Measure |
| Per Capita Income | 34,990 | $25,172 |
| Median Family Income | 8,328 | $46,223 |
| Mean Family Income | 8,328 | $71,943 |
| Median Household Income | 14,774 | $32,797 |
| Mean Household Income | 14,774 | $56,680 |
| Income Deficit | 8,328 | $12,403 |
| Wage / Income Gap (%) | 34,990 | 23.32% |
| Wage / Income Gap ($) | 34,990 | 76.68¢ per $1 |
| Gini / Inequality Index | 34,990 | 0.56 |
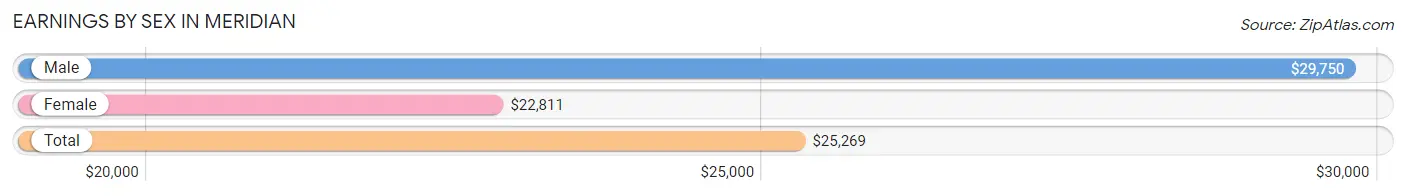
Earnings by Sex in Meridian
Average Earnings in Meridian are $25,269, $29,750 for men and $22,811 for women, a difference of 23.3%.
| Sex | Number | Average Earnings |
| Male | 7,370 (47.7%) | $29,750 |
| Female | 8,071 (52.3%) | $22,811 |
| Total | 15,441 (100.0%) | $25,269 |
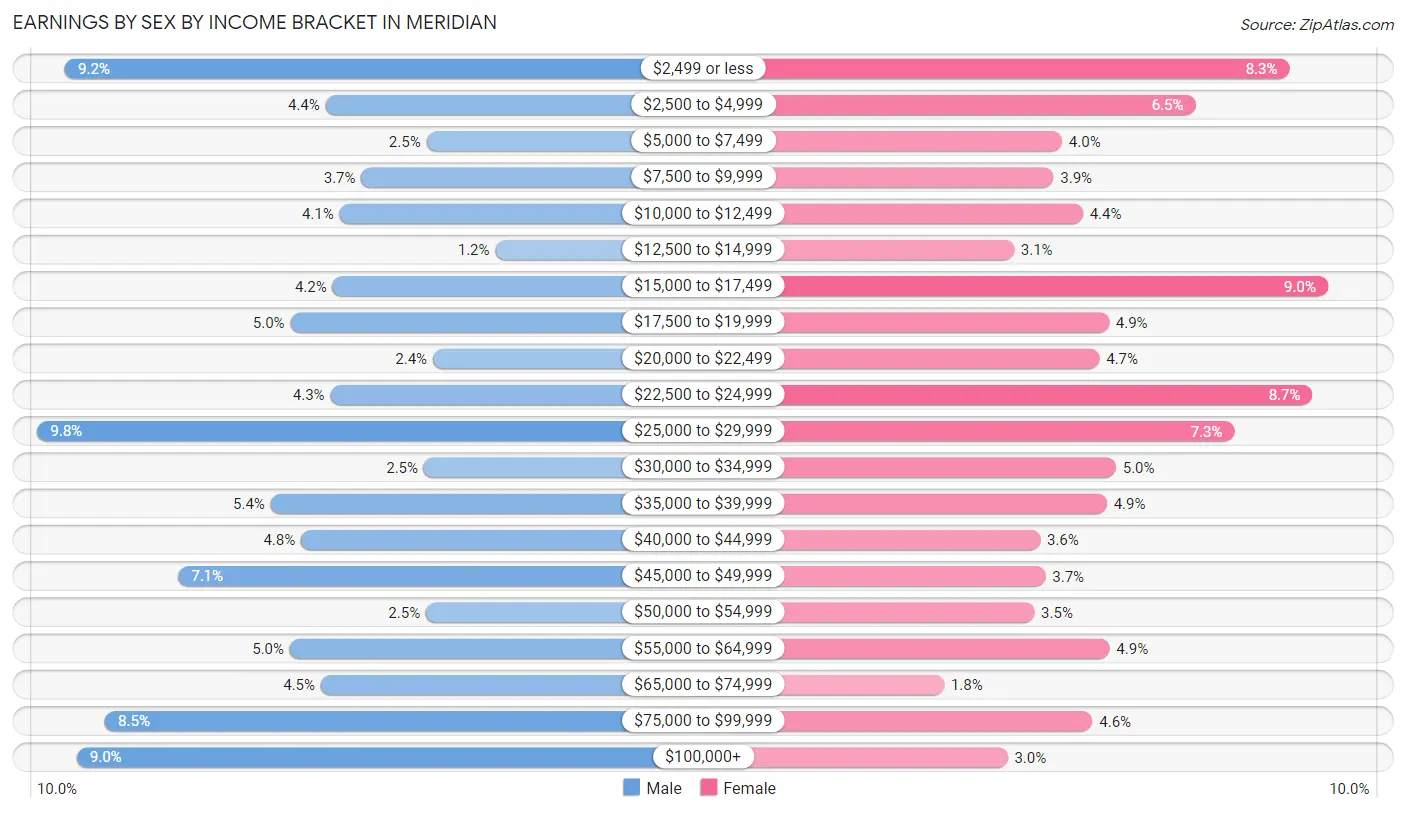
Earnings by Sex by Income Bracket in Meridian
The most common earnings brackets in Meridian are $25,000 to $29,999 for men (719 | 9.8%) and $15,000 to $17,499 for women (727 | 9.0%).
| Income | Male | Female |
| $2,499 or less | 681 (9.2%) | 669 (8.3%) |
| $2,500 to $4,999 | 321 (4.4%) | 527 (6.5%) |
| $5,000 to $7,499 | 182 (2.5%) | 325 (4.0%) |
| $7,500 to $9,999 | 272 (3.7%) | 312 (3.9%) |
| $10,000 to $12,499 | 302 (4.1%) | 357 (4.4%) |
| $12,500 to $14,999 | 87 (1.2%) | 253 (3.1%) |
| $15,000 to $17,499 | 312 (4.2%) | 727 (9.0%) |
| $17,500 to $19,999 | 370 (5.0%) | 396 (4.9%) |
| $20,000 to $22,499 | 173 (2.4%) | 382 (4.7%) |
| $22,500 to $24,999 | 315 (4.3%) | 704 (8.7%) |
| $25,000 to $29,999 | 719 (9.8%) | 586 (7.3%) |
| $30,000 to $34,999 | 186 (2.5%) | 407 (5.0%) |
| $35,000 to $39,999 | 397 (5.4%) | 393 (4.9%) |
| $40,000 to $44,999 | 355 (4.8%) | 292 (3.6%) |
| $45,000 to $49,999 | 525 (7.1%) | 300 (3.7%) |
| $50,000 to $54,999 | 183 (2.5%) | 283 (3.5%) |
| $55,000 to $64,999 | 371 (5.0%) | 397 (4.9%) |
| $65,000 to $74,999 | 328 (4.4%) | 147 (1.8%) |
| $75,000 to $99,999 | 626 (8.5%) | 371 (4.6%) |
| $100,000+ | 665 (9.0%) | 243 (3.0%) |
| Total | 7,370 (100.0%) | 8,071 (100.0%) |
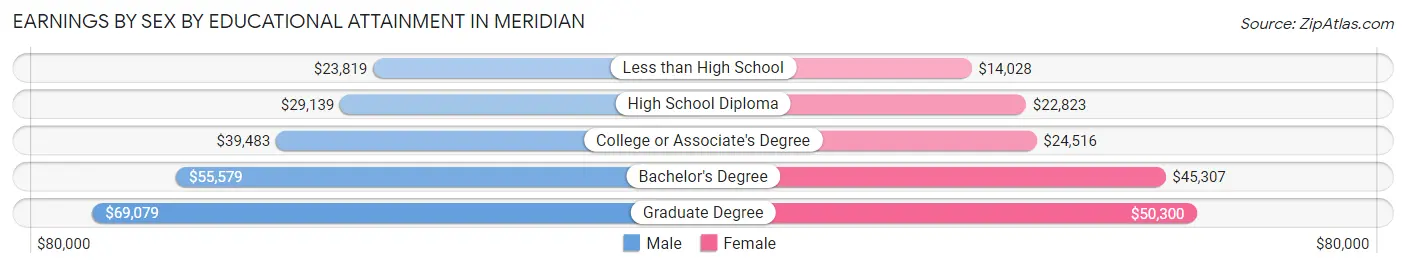
Earnings by Sex by Educational Attainment in Meridian
Average earnings in Meridian are $36,667 for men and $24,069 for women, a difference of 34.4%. Men with an educational attainment of graduate degree enjoy the highest average annual earnings of $69,079, while those with less than high school education earn the least with $23,819. Women with an educational attainment of graduate degree earn the most with the average annual earnings of $50,300, while those with less than high school education have the smallest earnings of $14,028.
| Educational Attainment | Male Income | Female Income |
| Less than High School | $23,819 | $14,028 |
| High School Diploma | $29,139 | $22,823 |
| College or Associate's Degree | $39,483 | $24,516 |
| Bachelor's Degree | $55,579 | $45,307 |
| Graduate Degree | $69,079 | $50,300 |
| Total | $36,667 | $24,069 |
Family Income in Meridian
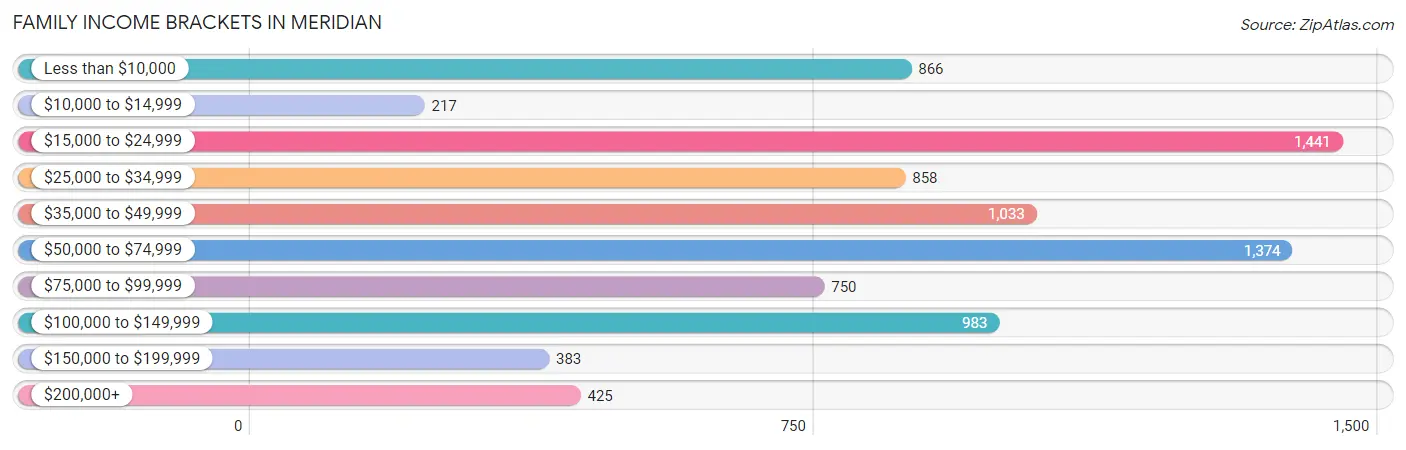
Family Income Brackets in Meridian
According to the Meridian family income data, there are 1,441 families falling into the $15,000 to $24,999 income range, which is the most common income bracket and makes up 17.3% of all families. Conversely, the $10,000 to $14,999 income bracket is the least frequent group with only 217 families (2.6%) belonging to this category.
| Income Bracket | # Families | % Families |
| Less than $10,000 | 866 | 10.4% |
| $10,000 to $14,999 | 217 | 2.6% |
| $15,000 to $24,999 | 1,441 | 17.3% |
| $25,000 to $34,999 | 858 | 10.3% |
| $35,000 to $49,999 | 1,033 | 12.4% |
| $50,000 to $74,999 | 1,374 | 16.5% |
| $75,000 to $99,999 | 750 | 9.0% |
| $100,000 to $149,999 | 983 | 11.8% |
| $150,000 to $199,999 | 383 | 4.6% |
| $200,000+ | 425 | 5.1% |
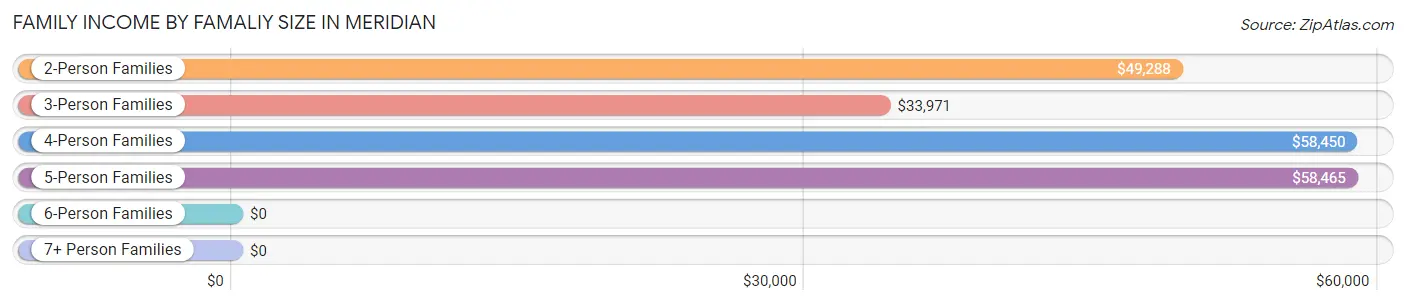
Family Income by Famaliy Size in Meridian
5-person families (768 | 9.2%) account for the highest median family income in Meridian with $58,465 per family, while 2-person families (4,069 | 48.9%) have the highest median income of $24,644 per family member.
| Income Bracket | # Families | Median Income |
| 2-Person Families | 4,069 (48.9%) | $49,288 |
| 3-Person Families | 2,182 (26.2%) | $33,971 |
| 4-Person Families | 927 (11.1%) | $58,450 |
| 5-Person Families | 768 (9.2%) | $58,465 |
| 6-Person Families | 306 (3.7%) | $0 |
| 7+ Person Families | 76 (0.9%) | $0 |
| Total | 8,328 (100.0%) | $46,223 |
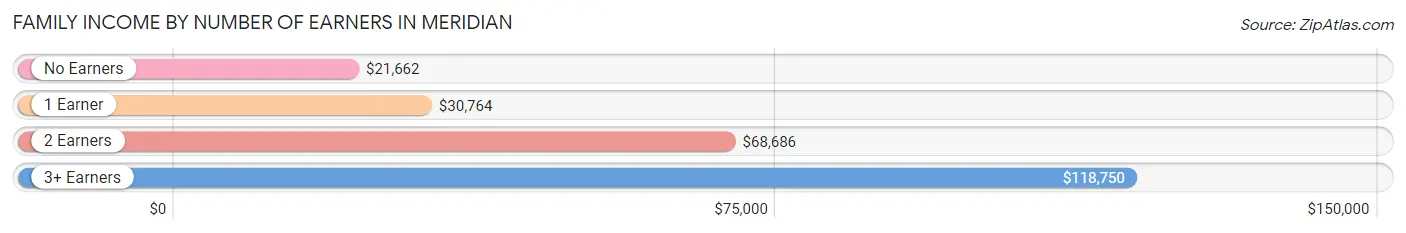
Family Income by Number of Earners in Meridian
The median family income in Meridian is $46,223, with families comprising 3+ earners (467) having the highest median family income of $118,750, while families with no earners (1,558) have the lowest median family income of $21,662, accounting for 5.6% and 18.7% of families, respectively.
| Number of Earners | # Families | Median Income |
| No Earners | 1,558 (18.7%) | $21,662 |
| 1 Earner | 3,455 (41.5%) | $30,764 |
| 2 Earners | 2,848 (34.2%) | $68,686 |
| 3+ Earners | 467 (5.6%) | $118,750 |
| Total | 8,328 (100.0%) | $46,223 |
Household Income in Meridian
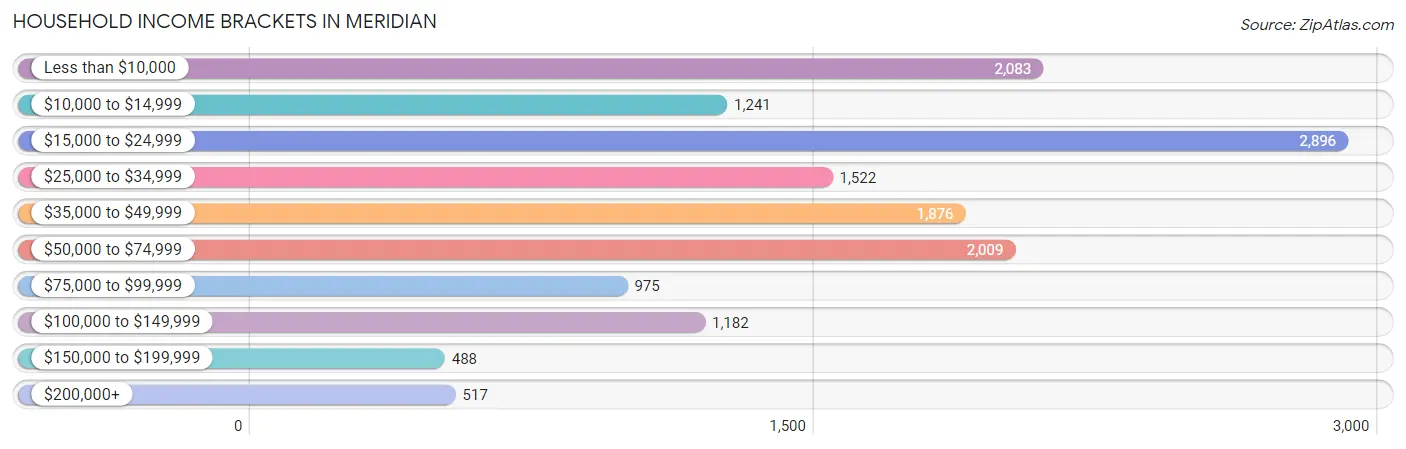
Household Income Brackets in Meridian
With 2,896 households falling in the category, the $15,000 to $24,999 income range is the most frequent in Meridian, accounting for 19.6% of all households. In contrast, only 488 households (3.3%) fall into the $150,000 to $199,999 income bracket, making it the least populous group.
| Income Bracket | # Households | % Households |
| Less than $10,000 | 2,083 | 14.1% |
| $10,000 to $14,999 | 1,241 | 8.4% |
| $15,000 to $24,999 | 2,896 | 19.6% |
| $25,000 to $34,999 | 1,522 | 10.3% |
| $35,000 to $49,999 | 1,876 | 12.7% |
| $50,000 to $74,999 | 2,009 | 13.6% |
| $75,000 to $99,999 | 975 | 6.6% |
| $100,000 to $149,999 | 1,182 | 8.0% |
| $150,000 to $199,999 | 488 | 3.3% |
| $200,000+ | 517 | 3.5% |
Household Income by Householder Age in Meridian
The median household income in Meridian is $32,797, with the highest median household income of $38,313 found in the 15 to 24 years age bracket for the primary householder. A total of 668 households (4.5%) fall into this category. Meanwhile, the 65+ years age bracket for the primary householder has the lowest median household income of $29,475, with 4,079 households (27.6%) in this group.
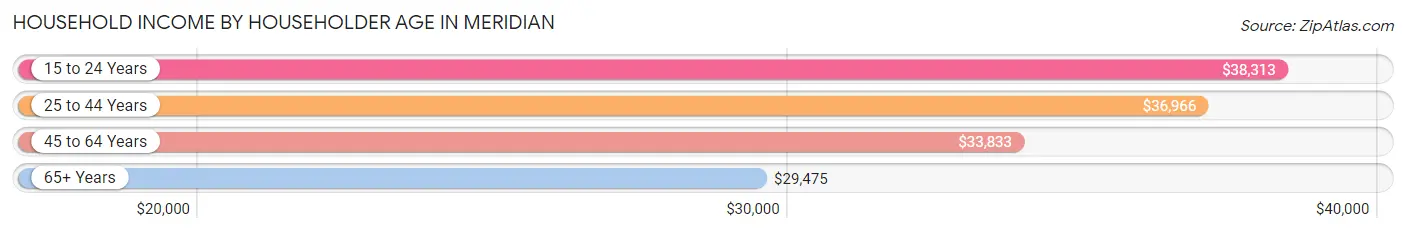
| Income Bracket | # Households | Median Income |
| 15 to 24 Years | 668 (4.5%) | $38,313 |
| 25 to 44 Years | 4,728 (32.0%) | $36,966 |
| 45 to 64 Years | 5,299 (35.9%) | $33,833 |
| 65+ Years | 4,079 (27.6%) | $29,475 |
| Total | 14,774 (100.0%) | $32,797 |
Poverty in Meridian
Income Below Poverty by Sex and Age in Meridian
With 28.7% poverty level for males and 35.6% for females among the residents of Meridian, 5 year old males and 5 year old females are the most vulnerable to poverty, with 113 males (77.9%) and 244 females (94.9%) in their respective age groups living below the poverty level.
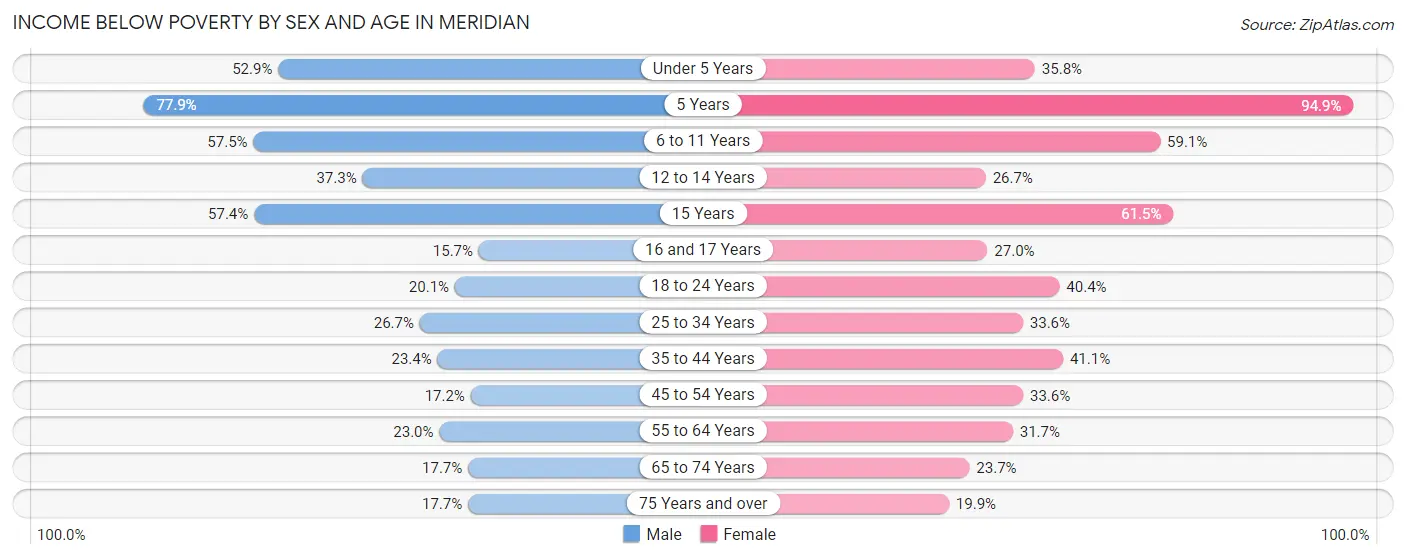
| Age Bracket | Male | Female |
| Under 5 Years | 589 (52.9%) | 457 (35.8%) |
| 5 Years | 113 (77.9%) | 244 (94.9%) |
| 6 to 11 Years | 840 (57.5%) | 826 (59.1%) |
| 12 to 14 Years | 312 (37.3%) | 152 (26.7%) |
| 15 Years | 128 (57.4%) | 136 (61.5%) |
| 16 and 17 Years | 58 (15.7%) | 113 (27.0%) |
| 18 to 24 Years | 276 (20.1%) | 576 (40.4%) |
| 25 to 34 Years | 575 (26.7%) | 816 (33.6%) |
| 35 to 44 Years | 390 (23.4%) | 980 (41.1%) |
| 45 to 54 Years | 313 (17.2%) | 614 (33.6%) |
| 55 to 64 Years | 456 (23.0%) | 808 (31.7%) |
| 65 to 74 Years | 282 (17.7%) | 455 (23.7%) |
| 75 Years and over | 153 (17.7%) | 300 (19.9%) |
| Total | 4,485 (28.7%) | 6,477 (35.6%) |
Income Above Poverty by Sex and Age in Meridian
According to the poverty statistics in Meridian, males aged 16 and 17 years and females aged 75 years and over are the age groups that are most secure financially, with 84.3% of males and 80.1% of females in these age groups living above the poverty line.
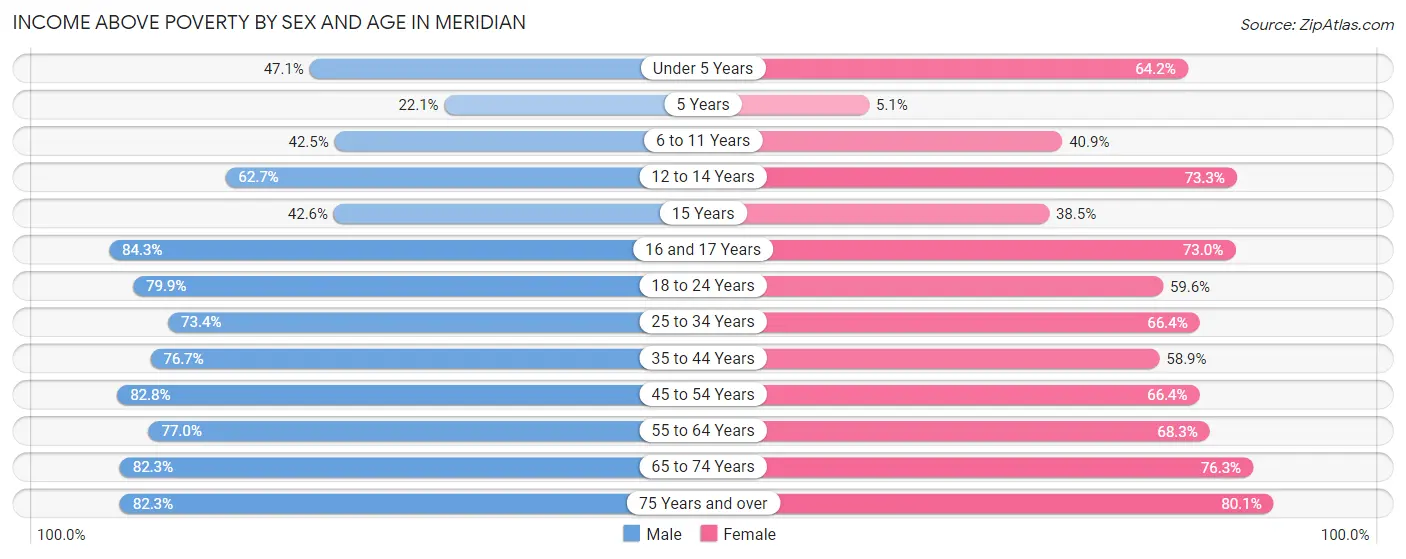
| Age Bracket | Male | Female |
| Under 5 Years | 524 (47.1%) | 818 (64.2%) |
| 5 Years | 32 (22.1%) | 13 (5.1%) |
| 6 to 11 Years | 620 (42.5%) | 572 (40.9%) |
| 12 to 14 Years | 525 (62.7%) | 417 (73.3%) |
| 15 Years | 95 (42.6%) | 85 (38.5%) |
| 16 and 17 Years | 312 (84.3%) | 305 (73.0%) |
| 18 to 24 Years | 1,095 (79.9%) | 850 (59.6%) |
| 25 to 34 Years | 1,583 (73.4%) | 1,612 (66.4%) |
| 35 to 44 Years | 1,280 (76.6%) | 1,407 (58.9%) |
| 45 to 54 Years | 1,507 (82.8%) | 1,211 (66.4%) |
| 55 to 64 Years | 1,526 (77.0%) | 1,738 (68.3%) |
| 65 to 74 Years | 1,313 (82.3%) | 1,466 (76.3%) |
| 75 Years and over | 712 (82.3%) | 1,209 (80.1%) |
| Total | 11,124 (71.3%) | 11,703 (64.4%) |
Income Below Poverty Among Married-Couple Families in Meridian
The poverty statistics for married-couple families in Meridian show that 7.5% or 340 of the total 4,503 families live below the poverty line. Families with 3 or 4 children have the highest poverty rate of 21.9%, comprising of 125 families. On the other hand, families with 5 or more children have the lowest poverty rate of 0.0%, which includes 0 families.
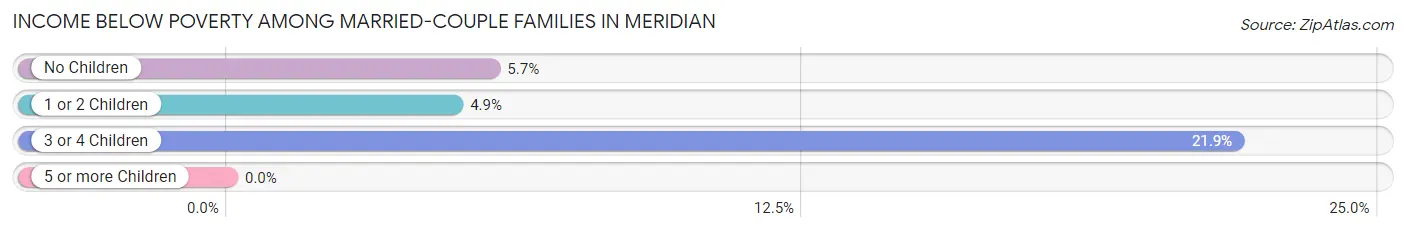
| Children | Above Poverty | Below Poverty |
| No Children | 2,625 (94.3%) | 159 (5.7%) |
| 1 or 2 Children | 1,087 (95.1%) | 56 (4.9%) |
| 3 or 4 Children | 446 (78.1%) | 125 (21.9%) |
| 5 or more Children | 5 (100.0%) | 0 (0.0%) |
| Total | 4,163 (92.4%) | 340 (7.5%) |
Income Below Poverty Among Single-Parent Households in Meridian
According to the poverty data in Meridian, 42.3% or 278 single-father households and 49.8% or 1,577 single-mother households are living below the poverty line. Among single-father households, those with 5 or more children have the highest poverty rate, with 24 households (100.0%) experiencing poverty. Likewise, among single-mother households, those with 5 or more children have the highest poverty rate, with 112 households (100.0%) falling below the poverty line.
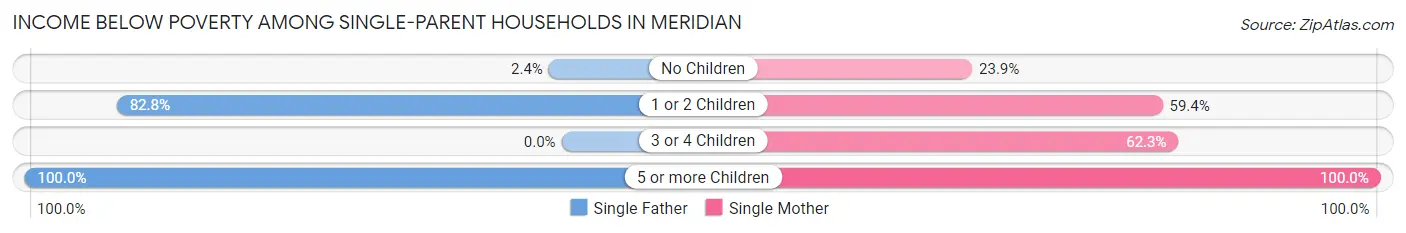
| Children | Single Father | Single Mother |
| No Children | 8 (2.4%) | 244 (23.9%) |
| 1 or 2 Children | 246 (82.8%) | 968 (59.4%) |
| 3 or 4 Children | 0 (0.0%) | 253 (62.3%) |
| 5 or more Children | 24 (100.0%) | 112 (100.0%) |
| Total | 278 (42.3%) | 1,577 (49.8%) |
Income Below Poverty Among Married-Couple vs Single-Parent Households in Meridian
The poverty data for Meridian shows that 340 of the married-couple family households (7.5%) and 1,855 of the single-parent households (48.5%) are living below the poverty level. Within the married-couple family households, those with 3 or 4 children have the highest poverty rate, with 125 households (21.9%) falling below the poverty line. Among the single-parent households, those with 5 or more children have the highest poverty rate, with 136 household (100.0%) living below poverty.
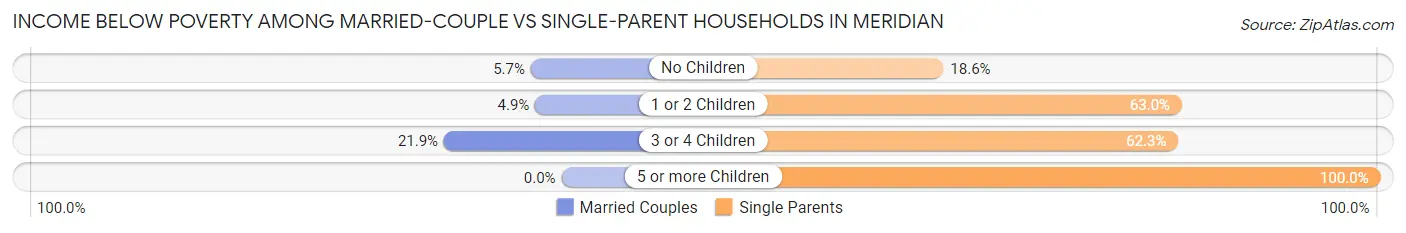
| Children | Married-Couple Families | Single-Parent Households |
| No Children | 159 (5.7%) | 252 (18.6%) |
| 1 or 2 Children | 56 (4.9%) | 1,214 (63.0%) |
| 3 or 4 Children | 125 (21.9%) | 253 (62.3%) |
| 5 or more Children | 0 (0.0%) | 136 (100.0%) |
| Total | 340 (7.5%) | 1,855 (48.5%) |
Race in Meridian
The most populous races in Meridian are Black / African American (22,770 | 65.1%), White / Caucasian (10,756 | 30.7%), and Two or more Races (684 | 1.9%).
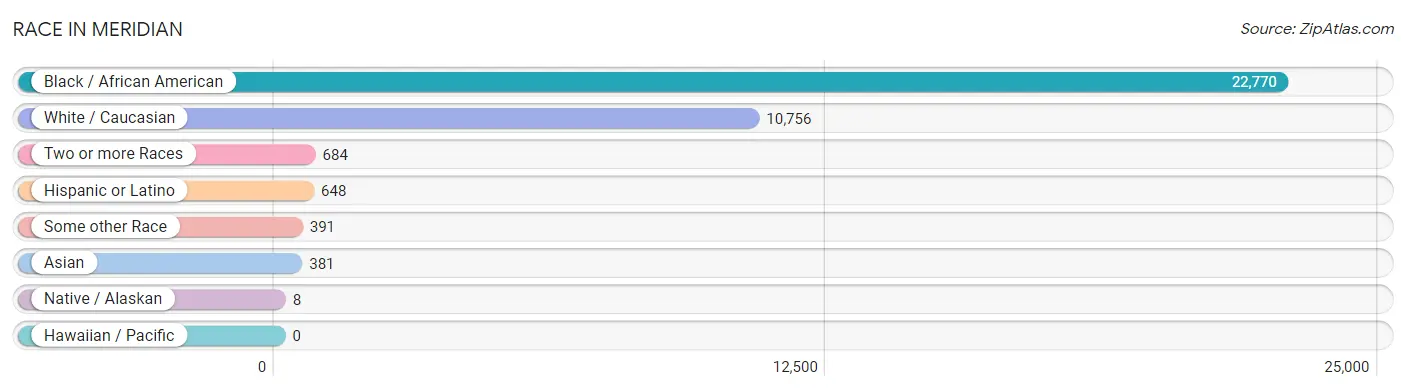
| Race | # Population | % Population |
| Asian | 381 | 1.1% |
| Black / African American | 22,770 | 65.1% |
| Hawaiian / Pacific | 0 | 0.0% |
| Hispanic or Latino | 648 | 1.8% |
| Native / Alaskan | 8 | 0.0% |
| White / Caucasian | 10,756 | 30.7% |
| Two or more Races | 684 | 1.9% |
| Some other Race | 391 | 1.1% |
| Total | 34,990 | 100.0% |
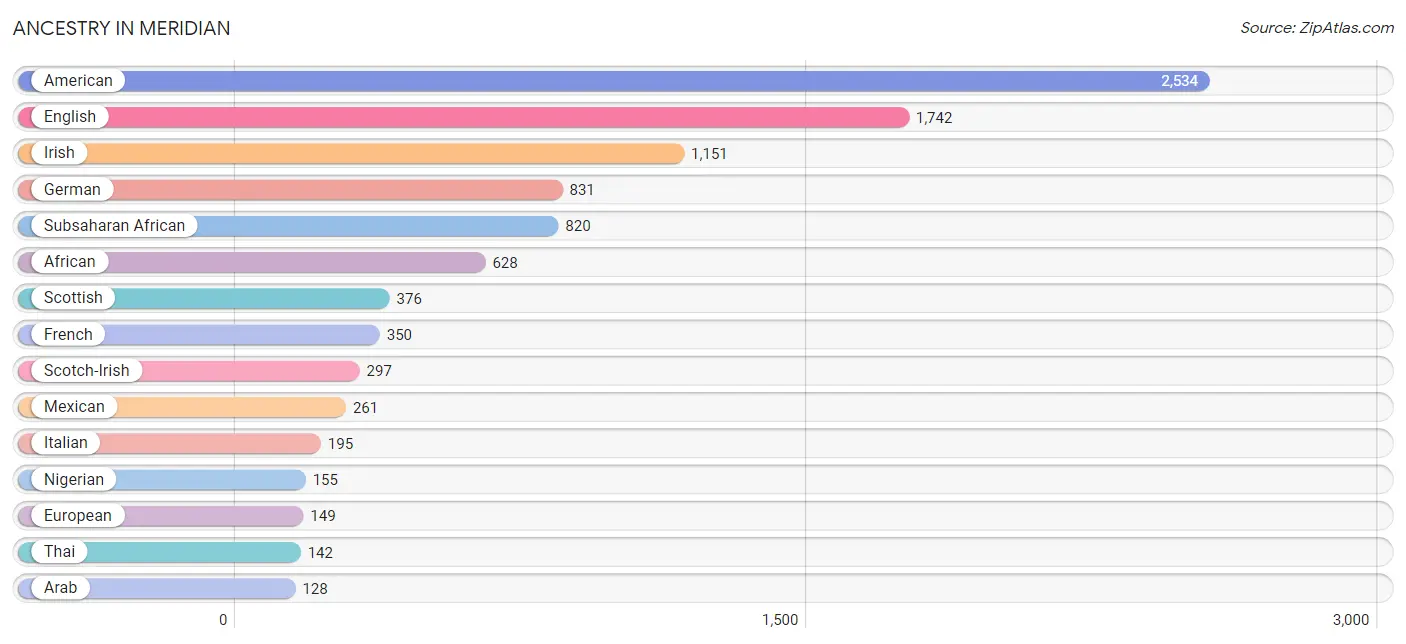
Ancestry in Meridian
The most populous ancestries reported in Meridian are American (2,534 | 7.2%), English (1,742 | 5.0%), Irish (1,151 | 3.3%), German (831 | 2.4%), and Subsaharan African (820 | 2.3%), together accounting for 20.2% of all Meridian residents.
| Ancestry | # Population | % Population |
| African | 628 | 1.8% |
| American | 2,534 | 7.2% |
| Arab | 128 | 0.4% |
| Austrian | 36 | 0.1% |
| Bhutanese | 36 | 0.1% |
| Blackfeet | 28 | 0.1% |
| British | 108 | 0.3% |
| Burmese | 11 | 0.0% |
| Celtic | 7 | 0.0% |
| Central American | 110 | 0.3% |
| Cherokee | 1 | 0.0% |
| Choctaw | 11 | 0.0% |
| Croatian | 34 | 0.1% |
| Cuban | 66 | 0.2% |
| Czech | 75 | 0.2% |
| Danish | 9 | 0.0% |
| Dominican | 20 | 0.1% |
| Dutch | 86 | 0.3% |
| English | 1,742 | 5.0% |
| European | 149 | 0.4% |
| French | 350 | 1.0% |
| French Canadian | 3 | 0.0% |
| German | 831 | 2.4% |
| Greek | 29 | 0.1% |
| Guatemalan | 8 | 0.0% |
| Honduran | 70 | 0.2% |
| Hungarian | 13 | 0.0% |
| Indian (Asian) | 94 | 0.3% |
| Irish | 1,151 | 3.3% |
| Italian | 195 | 0.6% |
| Japanese | 38 | 0.1% |
| Korean | 43 | 0.1% |
| Lebanese | 26 | 0.1% |
| Malaysian | 25 | 0.1% |
| Mexican | 261 | 0.7% |
| Native Hawaiian | 2 | 0.0% |
| Nicaraguan | 15 | 0.0% |
| Nigerian | 155 | 0.4% |
| Northern European | 11 | 0.0% |
| Norwegian | 53 | 0.2% |
| Palestinian | 78 | 0.2% |
| Peruvian | 6 | 0.0% |
| Polish | 90 | 0.3% |
| Puerto Rican | 81 | 0.2% |
| Romanian | 17 | 0.1% |
| Russian | 31 | 0.1% |
| Salvadoran | 17 | 0.1% |
| Scandinavian | 7 | 0.0% |
| Scotch-Irish | 297 | 0.9% |
| Scottish | 376 | 1.1% |
| Sierra Leonean | 13 | 0.0% |
| South African | 37 | 0.1% |
| South American | 54 | 0.2% |
| Spaniard | 20 | 0.1% |
| Sri Lankan | 31 | 0.1% |
| Subsaharan African | 820 | 2.3% |
| Swedish | 15 | 0.0% |
| Thai | 142 | 0.4% |
| Trinidadian and Tobagonian | 4 | 0.0% |
| Ukrainian | 7 | 0.0% |
| Venezuelan | 48 | 0.1% |
| Welsh | 68 | 0.2% | View All 62 Rows |
Immigrants in Meridian
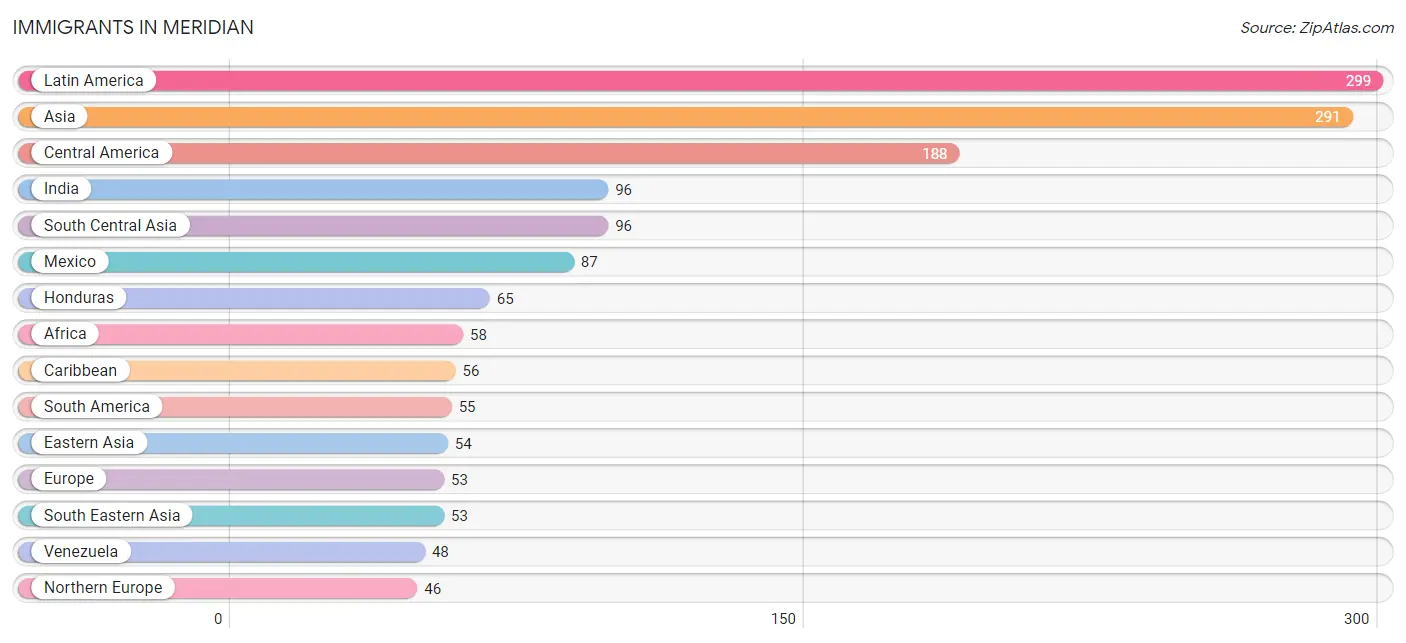
The most numerous immigrant groups reported in Meridian came from Latin America (299 | 0.9%), Asia (291 | 0.8%), Central America (188 | 0.5%), India (96 | 0.3%), and South Central Asia (96 | 0.3%), together accounting for 2.8% of all Meridian residents.
| Immigration Origin | # Population | % Population |
| Africa | 58 | 0.2% |
| Asia | 291 | 0.8% |
| Cambodia | 13 | 0.0% |
| Caribbean | 56 | 0.2% |
| Central America | 188 | 0.5% |
| China | 43 | 0.1% |
| Colombia | 1 | 0.0% |
| Dominican Republic | 20 | 0.1% |
| Eastern Africa | 14 | 0.0% |
| Eastern Asia | 54 | 0.2% |
| Eastern Europe | 7 | 0.0% |
| El Salvador | 13 | 0.0% |
| Ethiopia | 14 | 0.0% |
| Europe | 53 | 0.2% |
| Guatemala | 8 | 0.0% |
| Honduras | 65 | 0.2% |
| India | 96 | 0.3% |
| Jamaica | 32 | 0.1% |
| Korea | 11 | 0.0% |
| Latin America | 299 | 0.9% |
| Mexico | 87 | 0.3% |
| Nicaragua | 15 | 0.0% |
| Nigeria | 40 | 0.1% |
| Northern Europe | 46 | 0.1% |
| Peru | 6 | 0.0% |
| Philippines | 33 | 0.1% |
| Russia | 7 | 0.0% |
| Scotland | 46 | 0.1% |
| South America | 55 | 0.2% |
| South Central Asia | 96 | 0.3% |
| South Eastern Asia | 53 | 0.2% |
| Trinidad and Tobago | 4 | 0.0% |
| Venezuela | 48 | 0.1% |
| Vietnam | 7 | 0.0% |
| Western Africa | 40 | 0.1% |
| Western Asia | 46 | 0.1% |
| Yemen | 24 | 0.1% | View All 37 Rows |
Sex and Age in Meridian
Sex and Age in Meridian
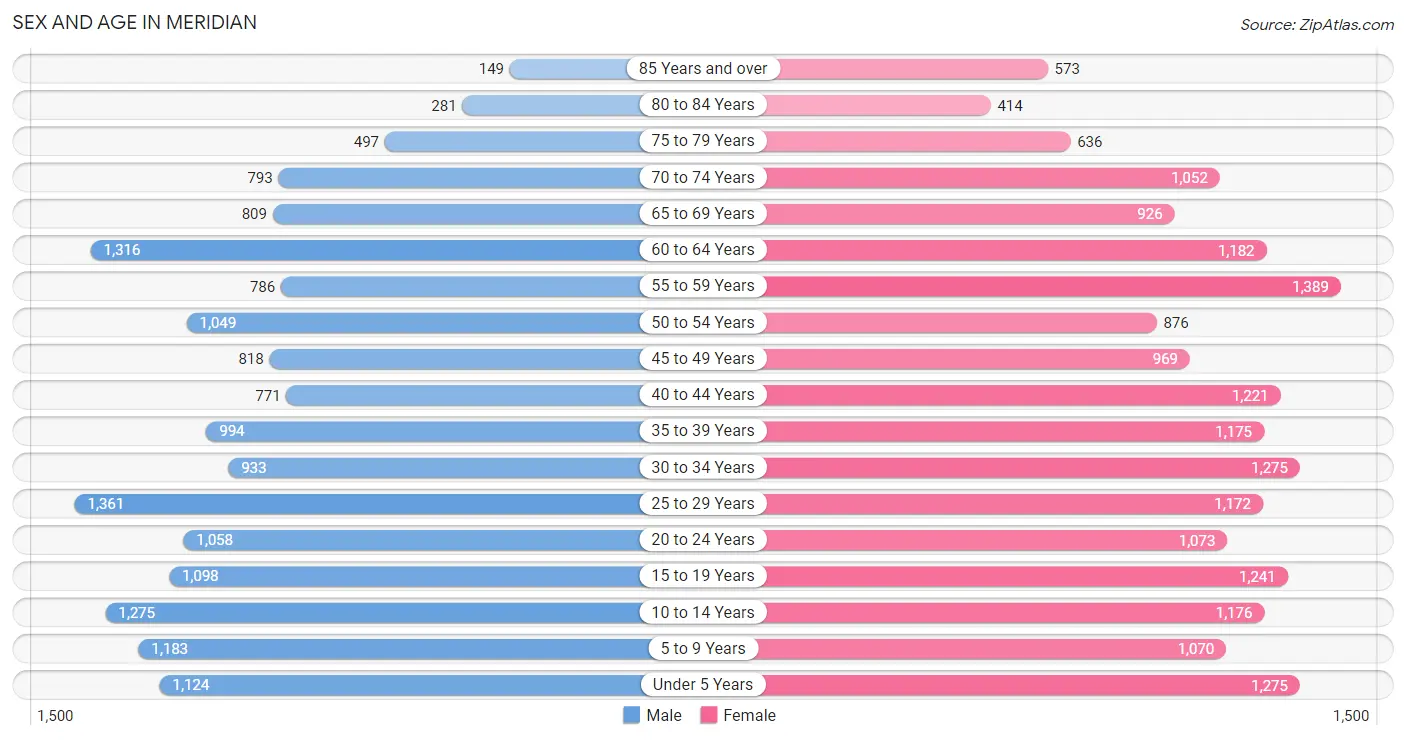
The most populous age groups in Meridian are 25 to 29 Years (1,361 | 8.4%) for men and 55 to 59 Years (1,389 | 7.4%) for women.
| Age Bracket | Male | Female |
| Under 5 Years | 1,124 (6.9%) | 1,275 (6.8%) |
| 5 to 9 Years | 1,183 (7.3%) | 1,070 (5.7%) |
| 10 to 14 Years | 1,275 (7.8%) | 1,176 (6.3%) |
| 15 to 19 Years | 1,098 (6.7%) | 1,241 (6.6%) |
| 20 to 24 Years | 1,058 (6.5%) | 1,073 (5.7%) |
| 25 to 29 Years | 1,361 (8.4%) | 1,172 (6.3%) |
| 30 to 34 Years | 933 (5.7%) | 1,275 (6.8%) |
| 35 to 39 Years | 994 (6.1%) | 1,175 (6.3%) |
| 40 to 44 Years | 771 (4.7%) | 1,221 (6.5%) |
| 45 to 49 Years | 818 (5.0%) | 969 (5.2%) |
| 50 to 54 Years | 1,049 (6.4%) | 876 (4.7%) |
| 55 to 59 Years | 786 (4.8%) | 1,389 (7.4%) |
| 60 to 64 Years | 1,316 (8.1%) | 1,182 (6.3%) |
| 65 to 69 Years | 809 (5.0%) | 926 (5.0%) |
| 70 to 74 Years | 793 (4.9%) | 1,052 (5.6%) |
| 75 to 79 Years | 497 (3.0%) | 636 (3.4%) |
| 80 to 84 Years | 281 (1.7%) | 414 (2.2%) |
| 85 Years and over | 149 (0.9%) | 573 (3.1%) |
| Total | 16,295 (100.0%) | 18,695 (100.0%) |
Families and Households in Meridian
Median Family Size in Meridian
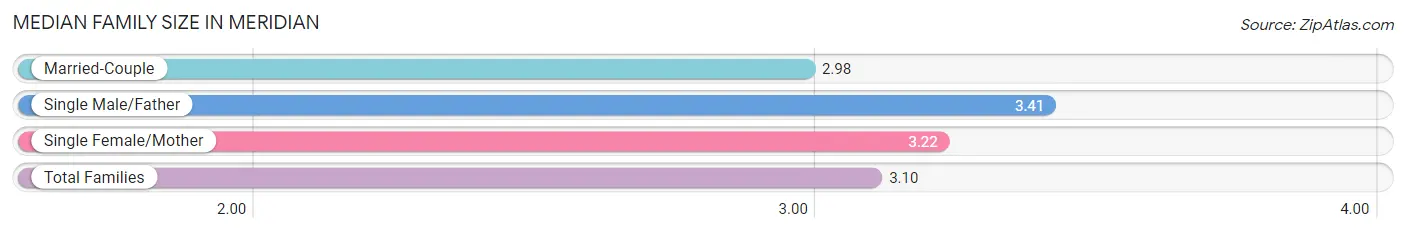
The median family size in Meridian is 3.10 persons per family, with single male/father families (657 | 7.9%) accounting for the largest median family size of 3.41 persons per family. On the other hand, married-couple families (4,503 | 54.1%) represent the smallest median family size with 2.98 persons per family.
| Family Type | # Families | Family Size |
| Married-Couple | 4,503 (54.1%) | 2.98 |
| Single Male/Father | 657 (7.9%) | 3.41 |
| Single Female/Mother | 3,168 (38.0%) | 3.22 |
| Total Families | 8,328 (100.0%) | 3.10 |
Median Household Size in Meridian
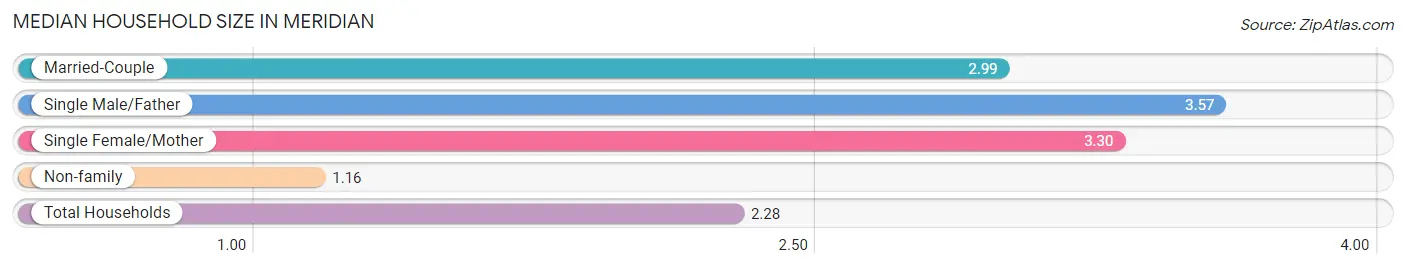
The median household size in Meridian is 2.28 persons per household, with single male/father households (657 | 4.4%) accounting for the largest median household size of 3.57 persons per household. non-family households (6,446 | 43.6%) represent the smallest median household size with 1.16 persons per household.
| Household Type | # Households | Household Size |
| Married-Couple | 4,503 (30.5%) | 2.99 |
| Single Male/Father | 657 (4.4%) | 3.57 |
| Single Female/Mother | 3,168 (21.4%) | 3.30 |
| Non-family | 6,446 (43.6%) | 1.16 |
| Total Households | 14,774 (100.0%) | 2.28 |
Household Size by Marriage Status in Meridian
Out of a total of 14,774 households in Meridian, 8,328 (56.4%) are family households, while 6,446 (43.6%) are nonfamily households. The most numerous type of family households are 2-person households, comprising 3,837, and the most common type of nonfamily households are 1-person households, comprising 5,649.
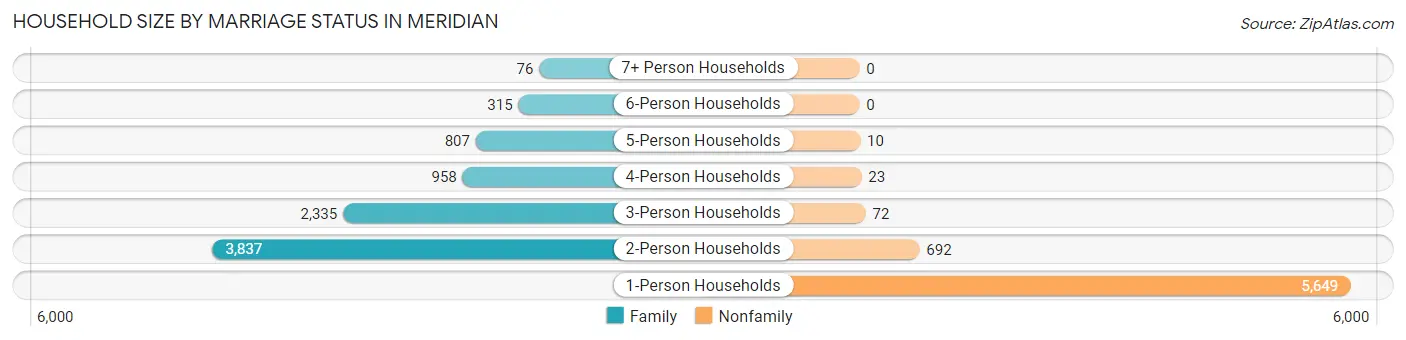
| Household Size | Family Households | Nonfamily Households |
| 1-Person Households | - | 5,649 (38.2%) |
| 2-Person Households | 3,837 (26.0%) | 692 (4.7%) |
| 3-Person Households | 2,335 (15.8%) | 72 (0.5%) |
| 4-Person Households | 958 (6.5%) | 23 (0.2%) |
| 5-Person Households | 807 (5.5%) | 10 (0.1%) |
| 6-Person Households | 315 (2.1%) | 0 (0.0%) |
| 7+ Person Households | 76 (0.5%) | 0 (0.0%) |
| Total | 8,328 (56.4%) | 6,446 (43.6%) |
Female Fertility in Meridian
Fertility by Age in Meridian
Average fertility rate in Meridian is 74.0 births per 1,000 women. Women in the age bracket of 20 to 34 years have the highest fertility rate with 138.0 births per 1,000 women. Women in the age bracket of 20 to 34 years acount for 77.2% of all women with births.
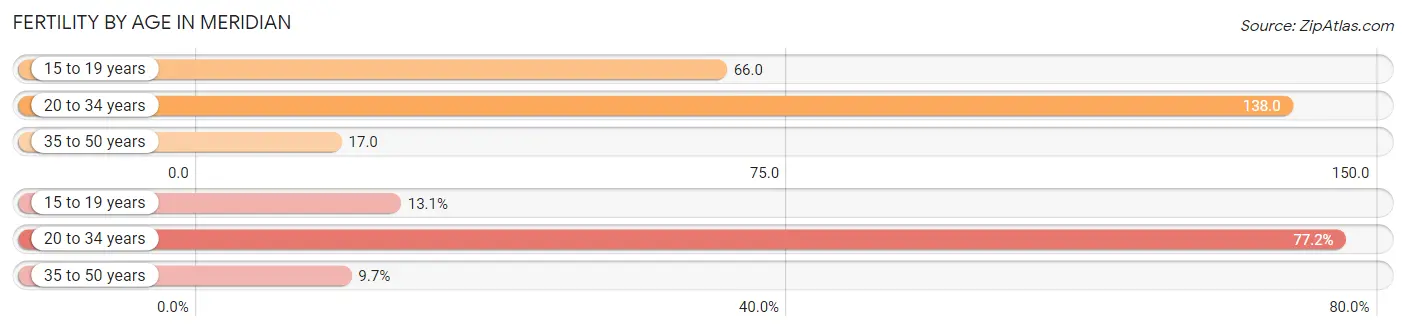
| Age Bracket | Women with Births | Births / 1,000 Women |
| 15 to 19 years | 82 (13.1%) | 66.0 |
| 20 to 34 years | 484 (77.2%) | 138.0 |
| 35 to 50 years | 61 (9.7%) | 17.0 |
| Total | 627 (100.0%) | 74.0 |
Fertility by Age by Marriage Status in Meridian
39.7% of women with births (627) in Meridian are married. The highest percentage of unmarried women with births falls into 15 to 19 years age bracket with 100.0% of them unmarried at the time of birth, while the lowest percentage of unmarried women with births belong to 35 to 50 years age bracket with 0.0% of them unmarried.
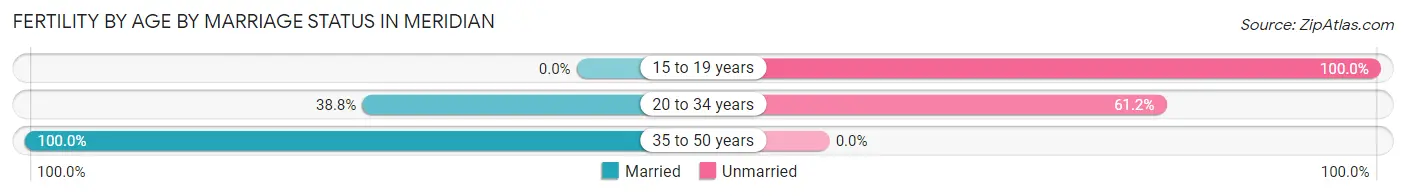
| Age Bracket | Married | Unmarried |
| 15 to 19 years | 0 (0.0%) | 82 (100.0%) |
| 20 to 34 years | 188 (38.8%) | 296 (61.2%) |
| 35 to 50 years | 61 (100.0%) | 0 (0.0%) |
| Total | 249 (39.7%) | 378 (60.3%) |
Fertility by Education in Meridian
Average fertility rate in Meridian is 74.0 births per 1,000 women. Women with the education attainment of graduate degree have the highest fertility rate of 131.0 births per 1,000 women, while women with the education attainment of college or associate's degree have the lowest fertility at 47.0 births per 1,000 women. Women with the education attainment of high school diploma represent 31.7% of all women with births.
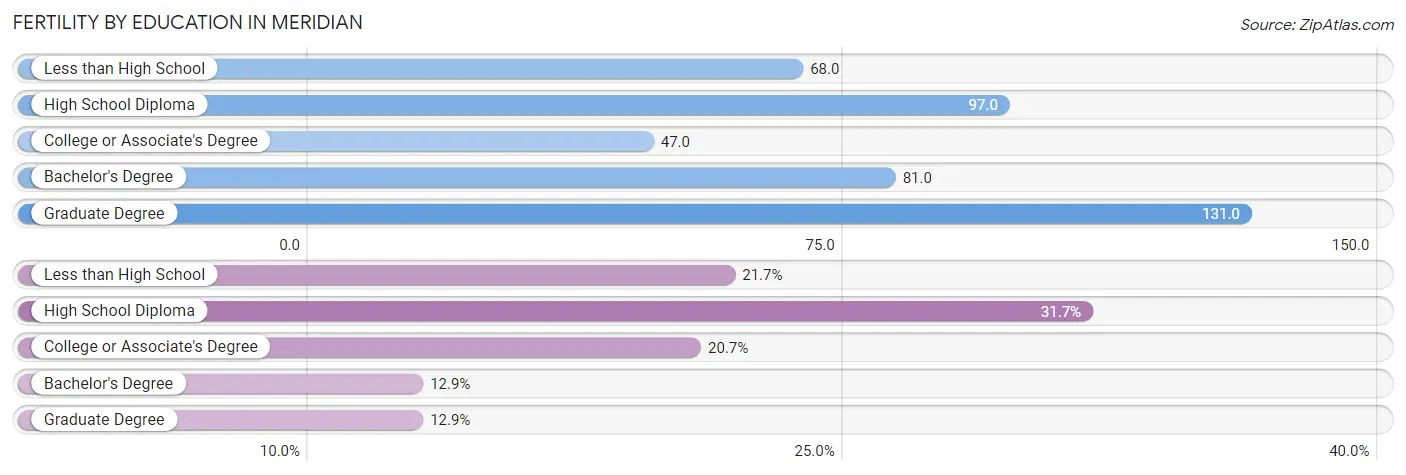
| Educational Attainment | Women with Births | Births / 1,000 Women |
| Less than High School | 136 (21.7%) | 68.0 |
| High School Diploma | 199 (31.7%) | 97.0 |
| College or Associate's Degree | 130 (20.7%) | 47.0 |
| Bachelor's Degree | 81 (12.9%) | 81.0 |
| Graduate Degree | 81 (12.9%) | 131.0 |
| Total | 627 (100.0%) | 74.0 |
Fertility by Education by Marriage Status in Meridian
60.3% of women with births in Meridian are unmarried. Women with the educational attainment of bachelor's degree are most likely to be married with 100.0% of them married at childbirth, while women with the educational attainment of less than high school are least likely to be married with 100.0% of them unmarried at childbirth.
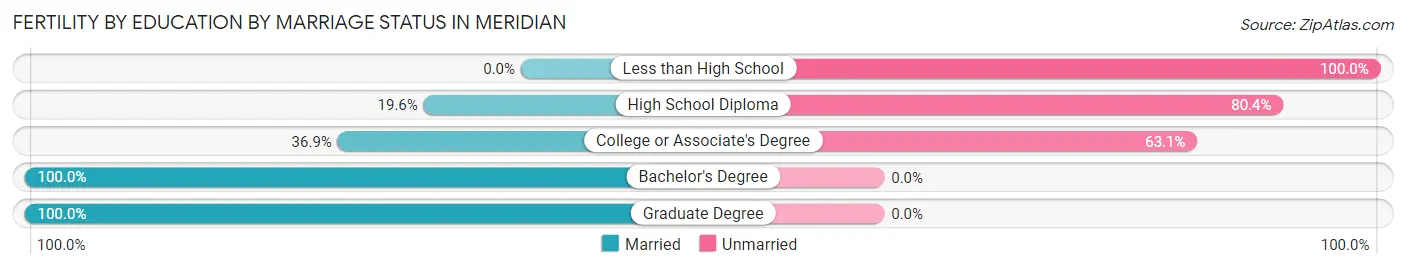
| Educational Attainment | Married | Unmarried |
| Less than High School | 0 (0.0%) | 136 (100.0%) |
| High School Diploma | 39 (19.6%) | 160 (80.4%) |
| College or Associate's Degree | 48 (36.9%) | 82 (63.1%) |
| Bachelor's Degree | 81 (100.0%) | 0 (0.0%) |
| Graduate Degree | 81 (100.0%) | 0 (0.0%) |
| Total | 249 (39.7%) | 378 (60.3%) |
Employment Characteristics in Meridian
Employment by Class of Employer in Meridian
Among the 13,370 employed individuals in Meridian, private company employees (8,897 | 66.5%), state government employees (1,124 | 8.4%), and local government employees (952 | 7.1%) make up the most common classes of employment.
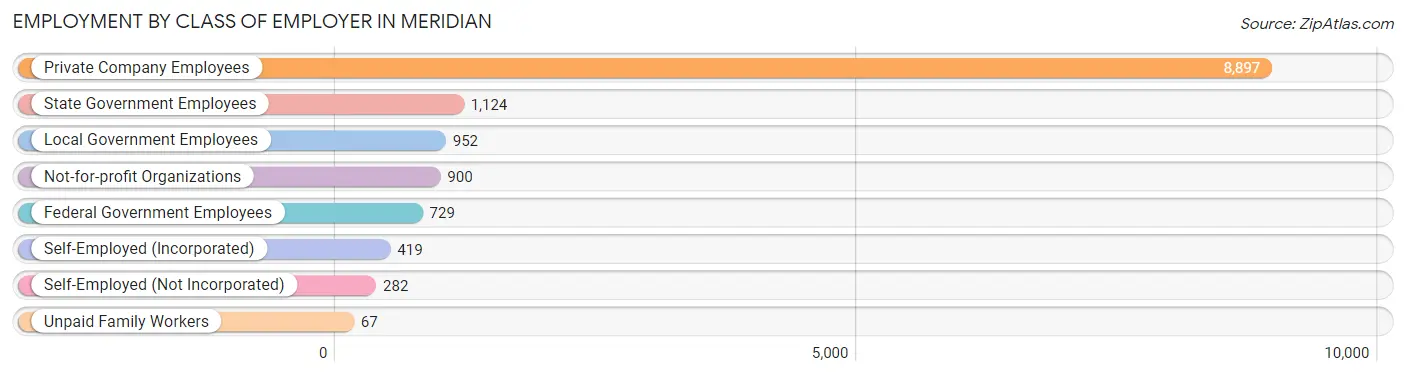
| Employer Class | # Employees | % Employees |
| Private Company Employees | 8,897 | 66.5% |
| Self-Employed (Incorporated) | 419 | 3.1% |
| Self-Employed (Not Incorporated) | 282 | 2.1% |
| Not-for-profit Organizations | 900 | 6.7% |
| Local Government Employees | 952 | 7.1% |
| State Government Employees | 1,124 | 8.4% |
| Federal Government Employees | 729 | 5.4% |
| Unpaid Family Workers | 67 | 0.5% |
| Total | 13,370 | 100.0% |
Employment Status by Age in Meridian
According to the labor force statistics for Meridian, out of the total population over 16 years of age (27,440), 53.9% or 14,790 individuals are in the labor force, with 8.6% or 1,272 of them unemployed. The age group with the highest labor force participation rate is 25 to 29 years, with 77.0% or 1,950 individuals in the labor force. Within the labor force, the 16 to 19 years age range has the highest percentage of unemployed individuals, with 25.4% or 166 of them being unemployed.
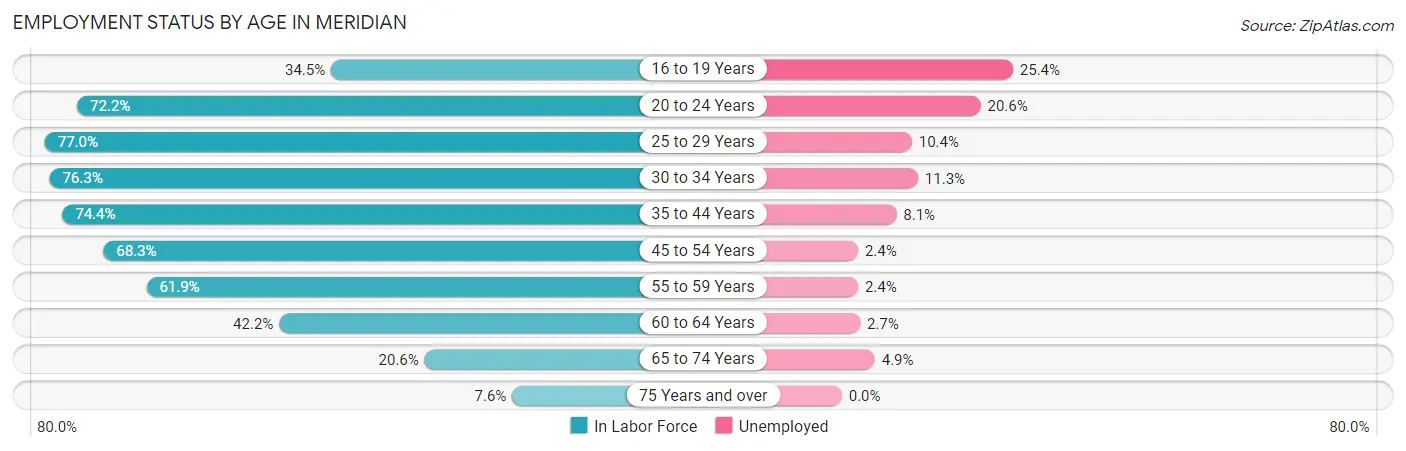
| Age Bracket | In Labor Force | Unemployed |
| 16 to 19 Years | 653 (34.5%) | 166 (25.4%) |
| 20 to 24 Years | 1,539 (72.2%) | 317 (20.6%) |
| 25 to 29 Years | 1,950 (77.0%) | 203 (10.4%) |
| 30 to 34 Years | 1,685 (76.3%) | 190 (11.3%) |
| 35 to 44 Years | 3,096 (74.4%) | 251 (8.1%) |
| 45 to 54 Years | 2,535 (68.3%) | 61 (2.4%) |
| 55 to 59 Years | 1,346 (61.9%) | 32 (2.4%) |
| 60 to 64 Years | 1,054 (42.2%) | 28 (2.7%) |
| 65 to 74 Years | 737 (20.6%) | 36 (4.9%) |
| 75 Years and over | 194 (7.6%) | 0 (0.0%) |
| Total | 14,790 (53.9%) | 1,272 (8.6%) |
Employment Status by Educational Attainment in Meridian
According to labor force statistics for Meridian, 67.5% of individuals (11,669) out of the total population between 25 and 64 years of age (17,287) are in the labor force, with 6.5% or 758 of them being unemployed. The group with the highest labor force participation rate are those with the educational attainment of bachelor's degree or higher, with 89.3% or 3,013 individuals in the labor force. Within the labor force, individuals with less than high school education have the highest percentage of unemployment, with 12.9% or 204 of them being unemployed.
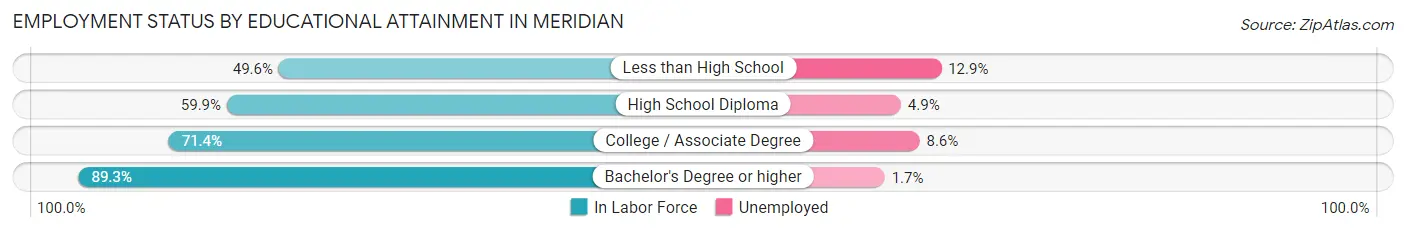
| Educational Attainment | In Labor Force | Unemployed |
| Less than High School | 1,579 (49.6%) | 411 (12.9%) |
| High School Diploma | 3,028 (59.9%) | 248 (4.9%) |
| College / Associate Degree | 4,051 (71.4%) | 488 (8.6%) |
| Bachelor's Degree or higher | 3,013 (89.3%) | 57 (1.7%) |
| Total | 11,669 (67.5%) | 1,124 (6.5%) |
Employment Occupations by Sex in Meridian
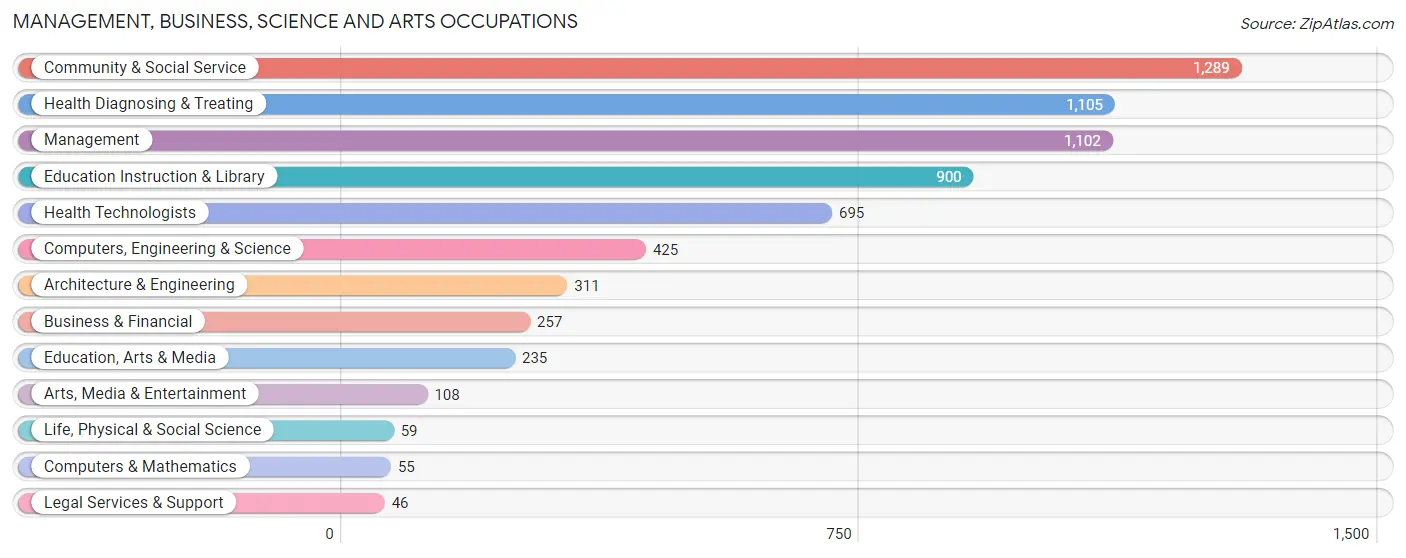
Management, Business, Science and Arts Occupations
The most common Management, Business, Science and Arts occupations in Meridian are Community & Social Service (1,289 | 9.8%), Health Diagnosing & Treating (1,105 | 8.4%), Management (1,102 | 8.3%), Education Instruction & Library (900 | 6.8%), and Health Technologists (695 | 5.2%).
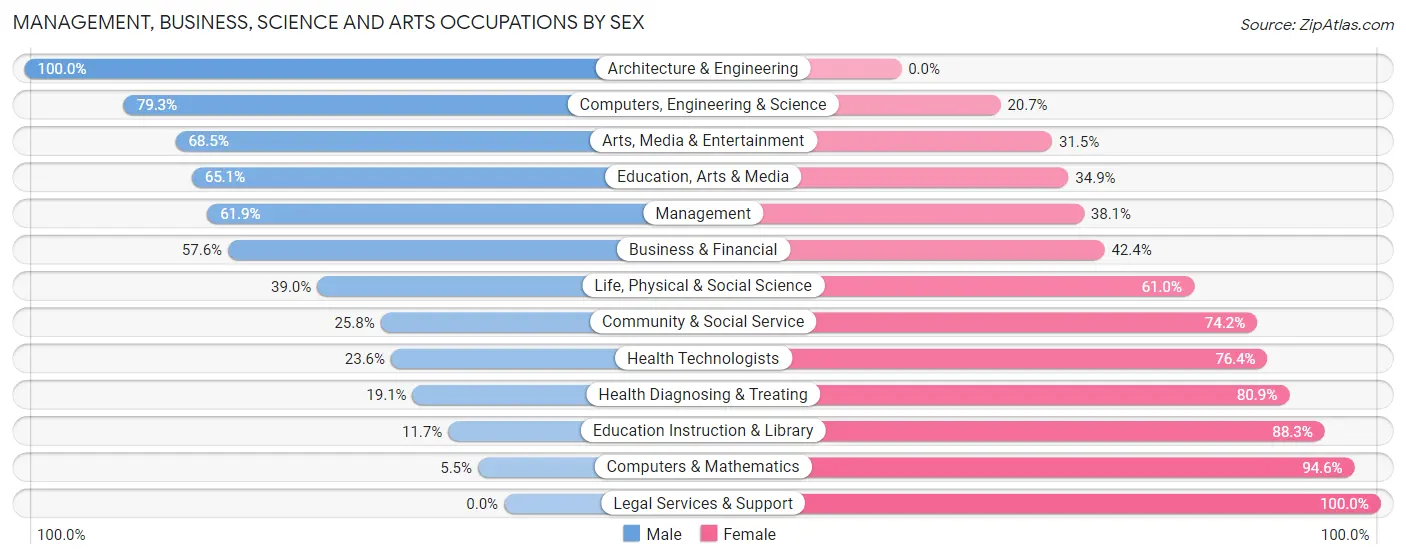
Management, Business, Science and Arts Occupations by Sex
Within the Management, Business, Science and Arts occupations in Meridian, the most male-oriented occupations are Architecture & Engineering (100.0%), Computers, Engineering & Science (79.3%), and Arts, Media & Entertainment (68.5%), while the most female-oriented occupations are Legal Services & Support (100.0%), Computers & Mathematics (94.6%), and Education Instruction & Library (88.3%).
| Occupation | Male | Female |
| Management | 682 (61.9%) | 420 (38.1%) |
| Business & Financial | 148 (57.6%) | 109 (42.4%) |
| Computers, Engineering & Science | 337 (79.3%) | 88 (20.7%) |
| Computers & Mathematics | 3 (5.4%) | 52 (94.6%) |
| Architecture & Engineering | 311 (100.0%) | 0 (0.0%) |
| Life, Physical & Social Science | 23 (39.0%) | 36 (61.0%) |
| Community & Social Service | 332 (25.8%) | 957 (74.2%) |
| Education, Arts & Media | 153 (65.1%) | 82 (34.9%) |
| Legal Services & Support | 0 (0.0%) | 46 (100.0%) |
| Education Instruction & Library | 105 (11.7%) | 795 (88.3%) |
| Arts, Media & Entertainment | 74 (68.5%) | 34 (31.5%) |
| Health Diagnosing & Treating | 211 (19.1%) | 894 (80.9%) |
| Health Technologists | 164 (23.6%) | 531 (76.4%) |
| Total (Category) | 1,710 (40.9%) | 2,468 (59.1%) |
| Total (Overall) | 6,324 (47.8%) | 6,902 (52.2%) |
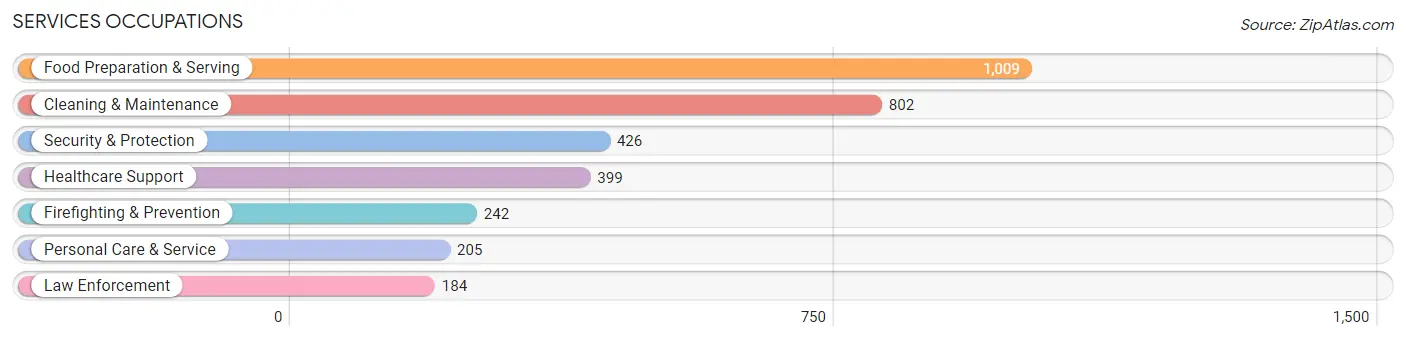
Services Occupations
The most common Services occupations in Meridian are Food Preparation & Serving (1,009 | 7.6%), Cleaning & Maintenance (802 | 6.1%), Security & Protection (426 | 3.2%), Healthcare Support (399 | 3.0%), and Firefighting & Prevention (242 | 1.8%).
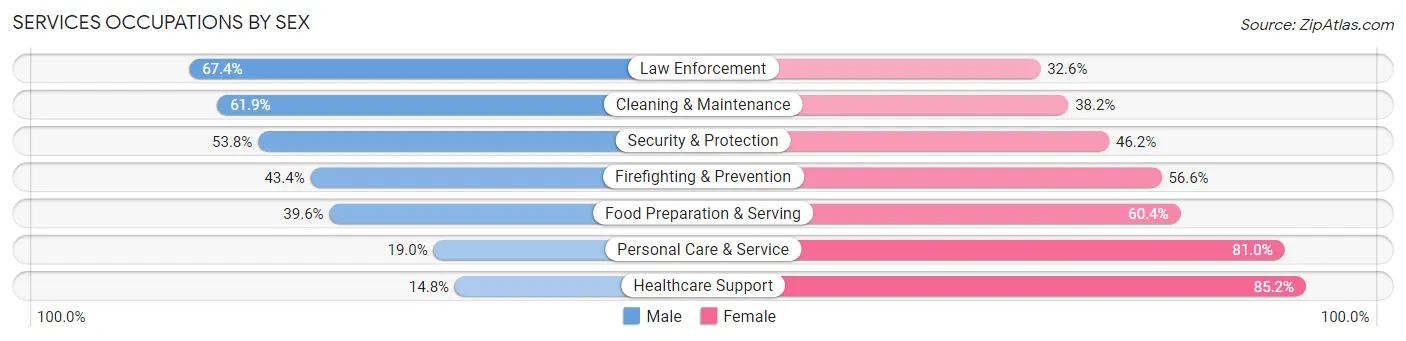
Services Occupations by Sex
Within the Services occupations in Meridian, the most male-oriented occupations are Law Enforcement (67.4%), Cleaning & Maintenance (61.9%), and Security & Protection (53.8%), while the most female-oriented occupations are Healthcare Support (85.2%), Personal Care & Service (81.0%), and Food Preparation & Serving (60.4%).
| Occupation | Male | Female |
| Healthcare Support | 59 (14.8%) | 340 (85.2%) |
| Security & Protection | 229 (53.8%) | 197 (46.2%) |
| Firefighting & Prevention | 105 (43.4%) | 137 (56.6%) |
| Law Enforcement | 124 (67.4%) | 60 (32.6%) |
| Food Preparation & Serving | 400 (39.6%) | 609 (60.4%) |
| Cleaning & Maintenance | 496 (61.9%) | 306 (38.2%) |
| Personal Care & Service | 39 (19.0%) | 166 (81.0%) |
| Total (Category) | 1,223 (43.0%) | 1,618 (57.0%) |
| Total (Overall) | 6,324 (47.8%) | 6,902 (52.2%) |
Sales and Office Occupations
The most common Sales and Office occupations in Meridian are Sales & Related (1,785 | 13.5%), and Office & Administration (1,486 | 11.2%).
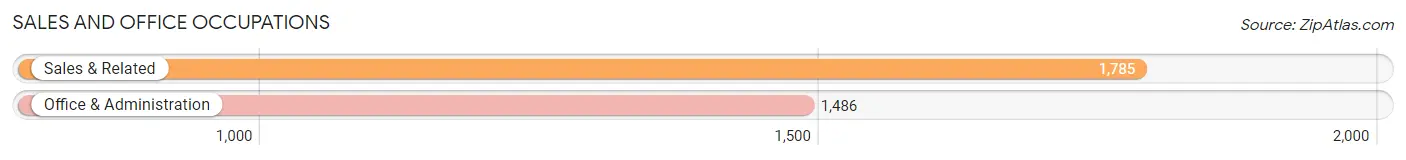
Sales and Office Occupations by Sex
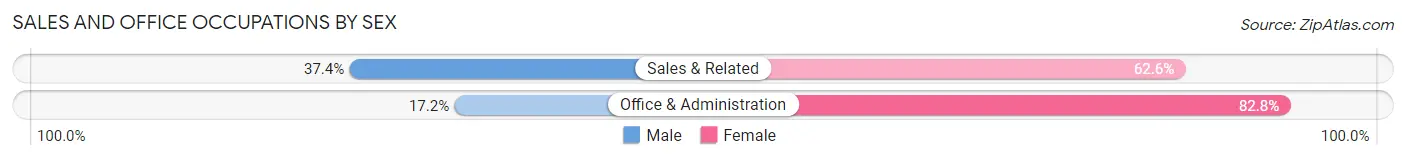
| Occupation | Male | Female |
| Sales & Related | 668 (37.4%) | 1,117 (62.6%) |
| Office & Administration | 256 (17.2%) | 1,230 (82.8%) |
| Total (Category) | 924 (28.2%) | 2,347 (71.8%) |
| Total (Overall) | 6,324 (47.8%) | 6,902 (52.2%) |
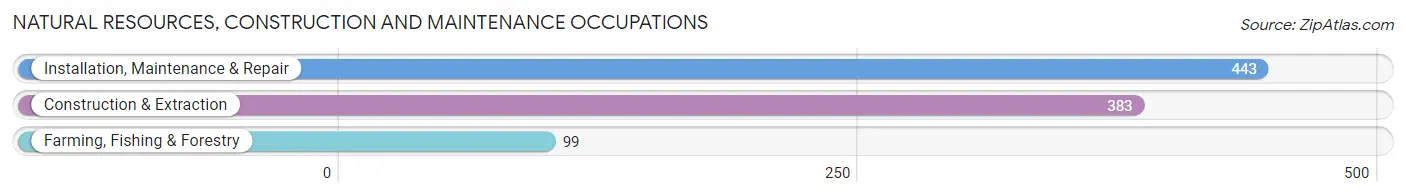
Natural Resources, Construction and Maintenance Occupations
The most common Natural Resources, Construction and Maintenance occupations in Meridian are Installation, Maintenance & Repair (443 | 3.4%), Construction & Extraction (383 | 2.9%), and Farming, Fishing & Forestry (99 | 0.7%).
Natural Resources, Construction and Maintenance Occupations by Sex
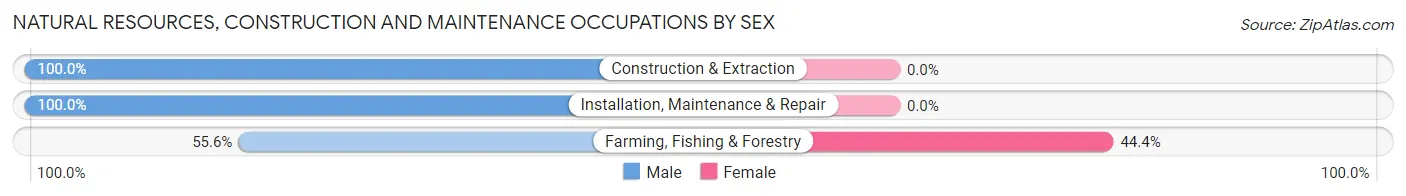
| Occupation | Male | Female |
| Farming, Fishing & Forestry | 55 (55.6%) | 44 (44.4%) |
| Construction & Extraction | 383 (100.0%) | 0 (0.0%) |
| Installation, Maintenance & Repair | 443 (100.0%) | 0 (0.0%) |
| Total (Category) | 881 (95.2%) | 44 (4.8%) |
| Total (Overall) | 6,324 (47.8%) | 6,902 (52.2%) |
Production, Transportation and Moving Occupations
The most common Production, Transportation and Moving occupations in Meridian are Production (947 | 7.2%), Transportation (538 | 4.1%), and Material Moving (526 | 4.0%).
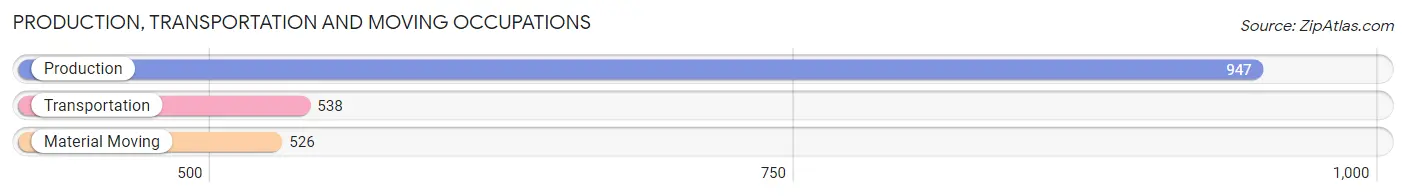
Production, Transportation and Moving Occupations by Sex
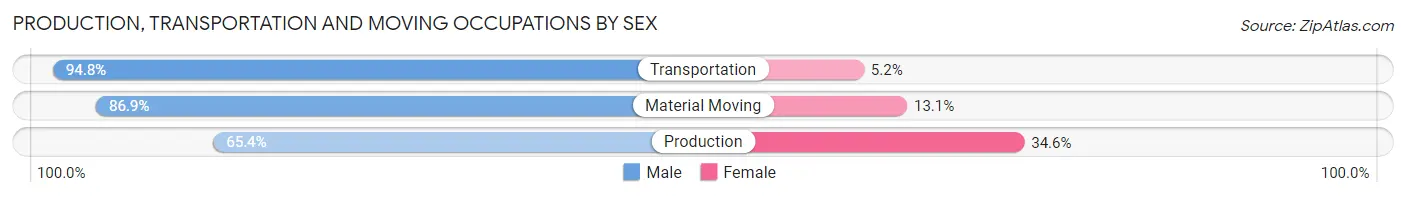
| Occupation | Male | Female |
| Production | 619 (65.4%) | 328 (34.6%) |
| Transportation | 510 (94.8%) | 28 (5.2%) |
| Material Moving | 457 (86.9%) | 69 (13.1%) |
| Total (Category) | 1,586 (78.9%) | 425 (21.1%) |
| Total (Overall) | 6,324 (47.8%) | 6,902 (52.2%) |
Employment Industries by Sex in Meridian
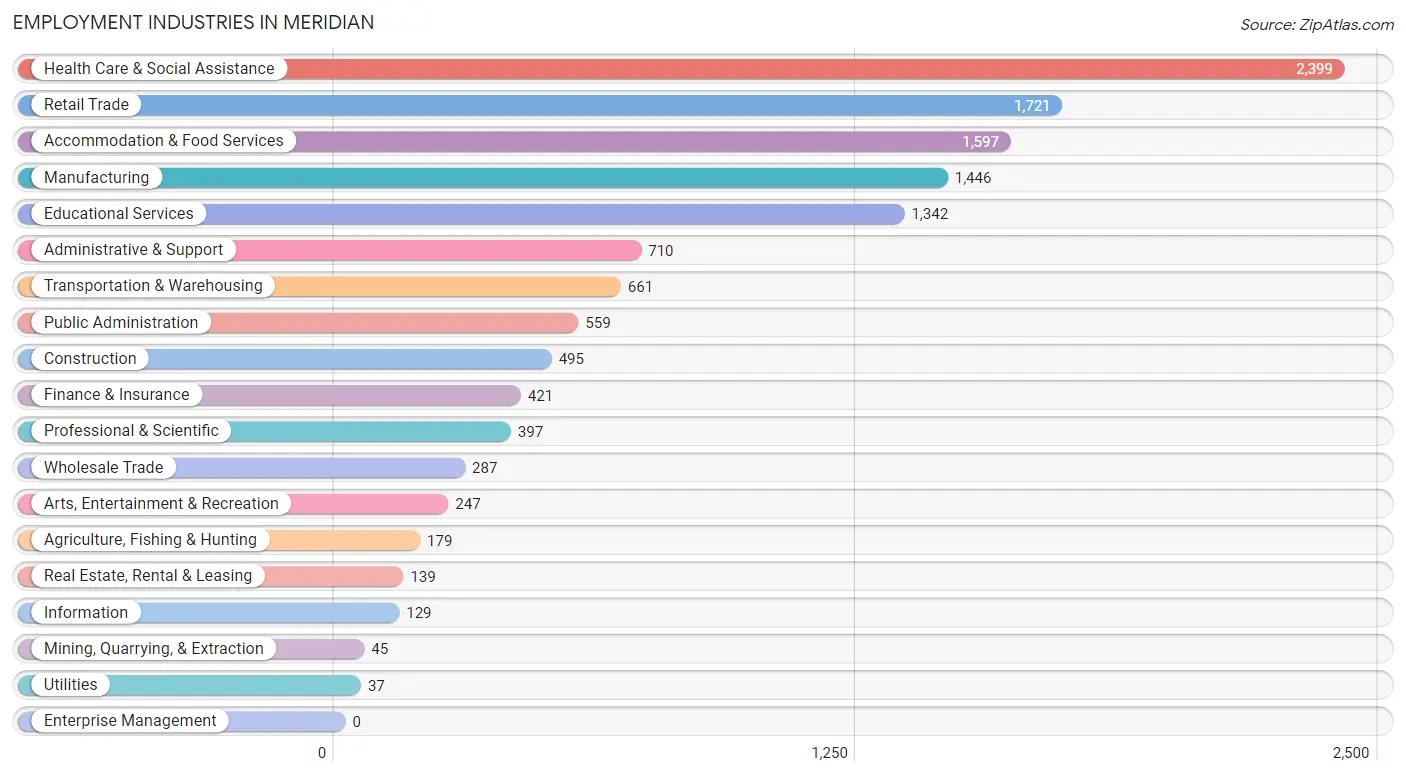
Employment Industries in Meridian
The major employment industries in Meridian include Health Care & Social Assistance (2,399 | 18.1%), Retail Trade (1,721 | 13.0%), Accommodation & Food Services (1,597 | 12.1%), Manufacturing (1,446 | 10.9%), and Educational Services (1,342 | 10.2%).
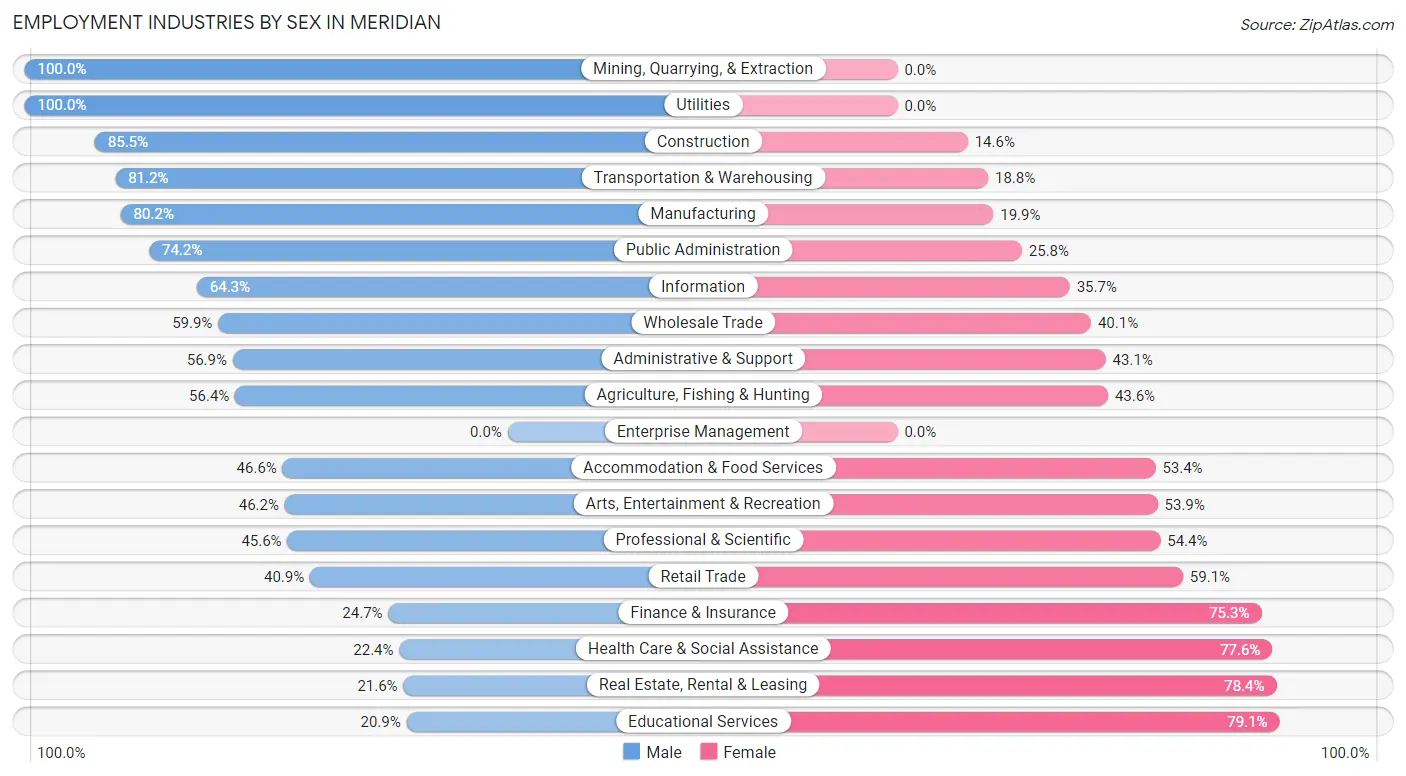
Employment Industries by Sex in Meridian
The Meridian industries that see more men than women are Mining, Quarrying, & Extraction (100.0%), Utilities (100.0%), and Construction (85.5%), whereas the industries that tend to have a higher number of women are Educational Services (79.1%), Real Estate, Rental & Leasing (78.4%), and Health Care & Social Assistance (77.6%).
| Industry | Male | Female |
| Agriculture, Fishing & Hunting | 101 (56.4%) | 78 (43.6%) |
| Mining, Quarrying, & Extraction | 45 (100.0%) | 0 (0.0%) |
| Construction | 423 (85.5%) | 72 (14.5%) |
| Manufacturing | 1,159 (80.1%) | 287 (19.9%) |
| Wholesale Trade | 172 (59.9%) | 115 (40.1%) |
| Retail Trade | 704 (40.9%) | 1,017 (59.1%) |
| Transportation & Warehousing | 537 (81.2%) | 124 (18.8%) |
| Utilities | 37 (100.0%) | 0 (0.0%) |
| Information | 83 (64.3%) | 46 (35.7%) |
| Finance & Insurance | 104 (24.7%) | 317 (75.3%) |
| Real Estate, Rental & Leasing | 30 (21.6%) | 109 (78.4%) |
| Professional & Scientific | 181 (45.6%) | 216 (54.4%) |
| Enterprise Management | 0 (0.0%) | 0 (0.0%) |
| Administrative & Support | 404 (56.9%) | 306 (43.1%) |
| Educational Services | 281 (20.9%) | 1,061 (79.1%) |
| Health Care & Social Assistance | 538 (22.4%) | 1,861 (77.6%) |
| Arts, Entertainment & Recreation | 114 (46.2%) | 133 (53.8%) |
| Accommodation & Food Services | 744 (46.6%) | 853 (53.4%) |
| Public Administration | 415 (74.2%) | 144 (25.8%) |
| Total | 6,324 (47.8%) | 6,902 (52.2%) |
Education in Meridian
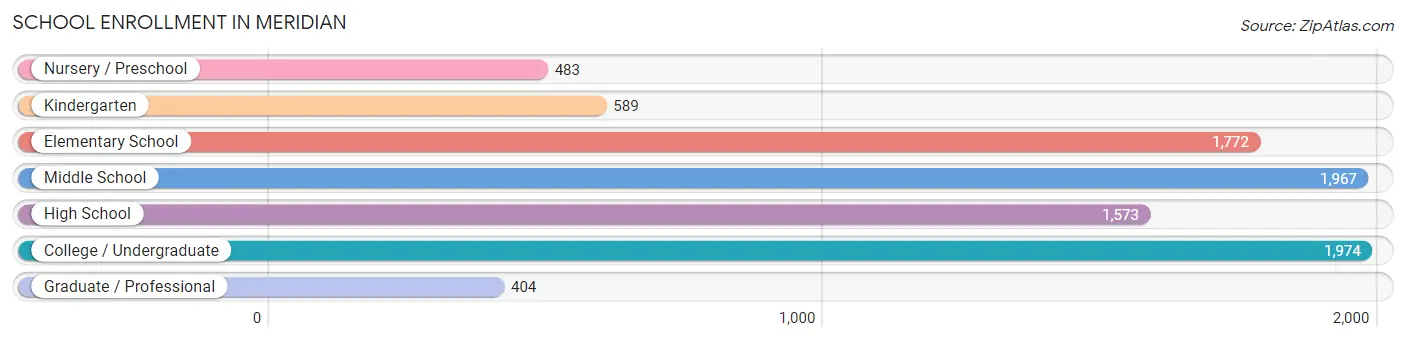
School Enrollment in Meridian
The most common levels of schooling among the 8,762 students in Meridian are college / undergraduate (1,974 | 22.5%), middle school (1,967 | 22.5%), and elementary school (1,772 | 20.2%).
| School Level | # Students | % Students |
| Nursery / Preschool | 483 | 5.5% |
| Kindergarten | 589 | 6.7% |
| Elementary School | 1,772 | 20.2% |
| Middle School | 1,967 | 22.5% |
| High School | 1,573 | 17.9% |
| College / Undergraduate | 1,974 | 22.5% |
| Graduate / Professional | 404 | 4.6% |
| Total | 8,762 | 100.0% |
School Enrollment by Age by Funding Source in Meridian
Out of a total of 8,762 students who are enrolled in schools in Meridian, 964 (11.0%) attend a private institution, while the remaining 7,798 (89.0%) are enrolled in public schools. The age group of 35 years and over has the highest likelihood of being enrolled in private schools, with 143 (24.9% in the age bracket) enrolled. Conversely, the age group of 15 to 17 year olds has the lowest likelihood of being enrolled in a private school, with 1,159 (95.5% in the age bracket) attending a public institution.

| Age Bracket | Public School | Private School |
| 3 to 4 Year Olds | 438 (75.5%) | 142 (24.5%) |
| 5 to 9 Year Old | 1,928 (93.0%) | 144 (7.0%) |
| 10 to 14 Year Olds | 2,026 (86.3%) | 323 (13.8%) |
| 15 to 17 Year Olds | 1,159 (95.5%) | 55 (4.5%) |
| 18 to 19 Year Olds | 688 (91.5%) | 64 (8.5%) |
| 20 to 24 Year Olds | 673 (94.7%) | 38 (5.3%) |
| 25 to 34 Year Olds | 458 (89.8%) | 52 (10.2%) |
| 35 Years and over | 431 (75.1%) | 143 (24.9%) |
| Total | 7,798 (89.0%) | 964 (11.0%) |
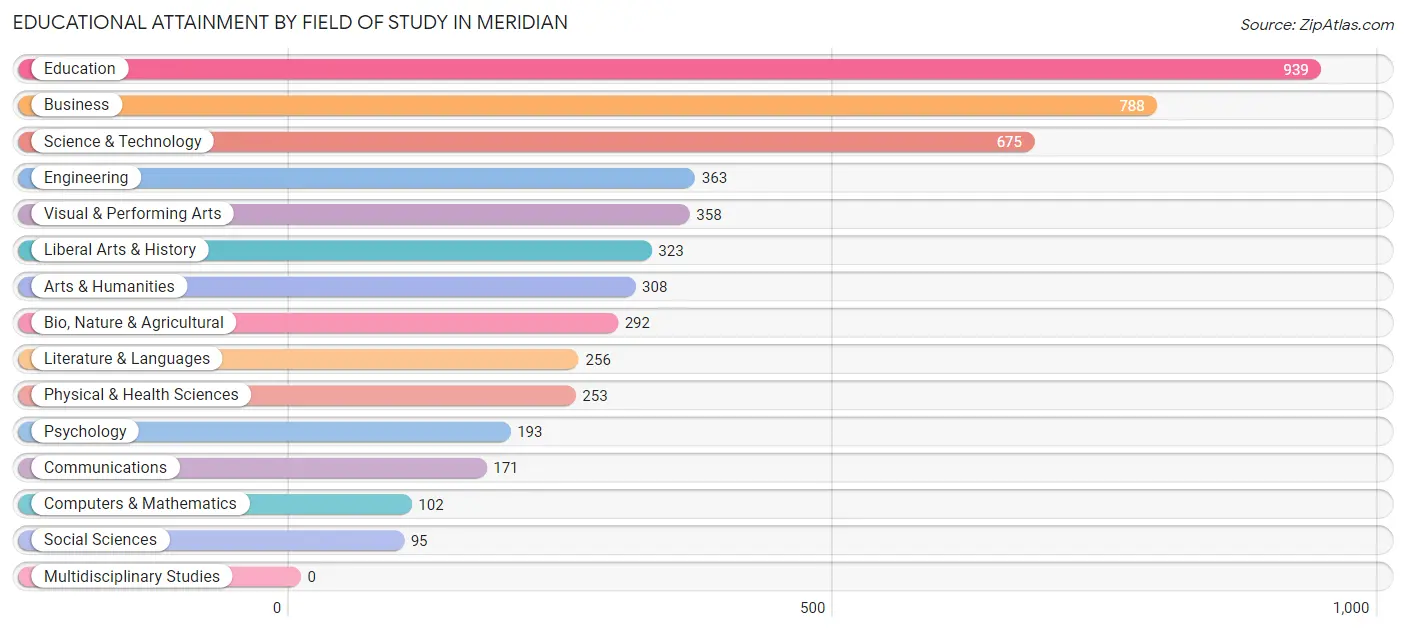
Educational Attainment by Field of Study in Meridian
Education (939 | 18.3%), business (788 | 15.4%), science & technology (675 | 13.2%), engineering (363 | 7.1%), and visual & performing arts (358 | 7.0%) are the most common fields of study among 5,116 individuals in Meridian who have obtained a bachelor's degree or higher.
| Field of Study | # Graduates | % Graduates |
| Computers & Mathematics | 102 | 2.0% |
| Bio, Nature & Agricultural | 292 | 5.7% |
| Physical & Health Sciences | 253 | 5.0% |
| Psychology | 193 | 3.8% |
| Social Sciences | 95 | 1.9% |
| Engineering | 363 | 7.1% |
| Multidisciplinary Studies | 0 | 0.0% |
| Science & Technology | 675 | 13.2% |
| Business | 788 | 15.4% |
| Education | 939 | 18.3% |
| Literature & Languages | 256 | 5.0% |
| Liberal Arts & History | 323 | 6.3% |
| Visual & Performing Arts | 358 | 7.0% |
| Communications | 171 | 3.3% |
| Arts & Humanities | 308 | 6.0% |
| Total | 5,116 | 100.0% |
Transportation & Commute in Meridian
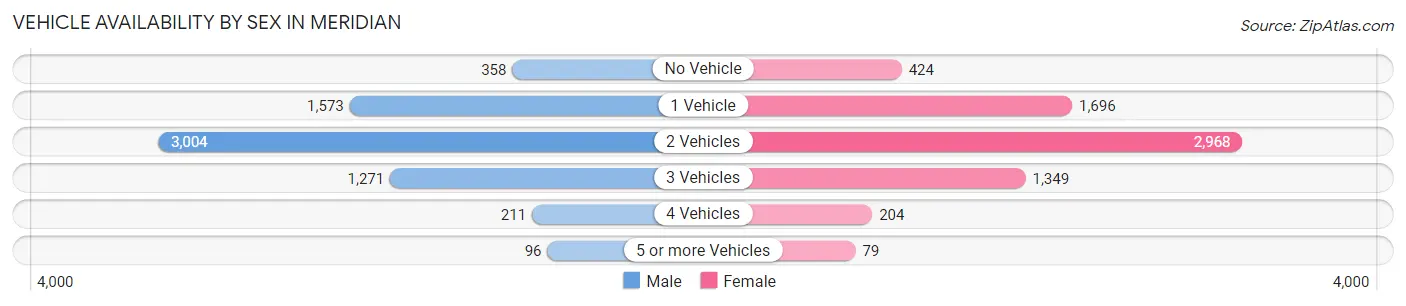
Vehicle Availability by Sex in Meridian
The most prevalent vehicle ownership categories in Meridian are males with 2 vehicles (3,004, accounting for 46.1%) and females with 2 vehicles (2,968, making up 44.7%).
| Vehicles Available | Male | Female |
| No Vehicle | 358 (5.5%) | 424 (6.3%) |
| 1 Vehicle | 1,573 (24.1%) | 1,696 (25.2%) |
| 2 Vehicles | 3,004 (46.1%) | 2,968 (44.2%) |
| 3 Vehicles | 1,271 (19.5%) | 1,349 (20.1%) |
| 4 Vehicles | 211 (3.2%) | 204 (3.0%) |
| 5 or more Vehicles | 96 (1.5%) | 79 (1.2%) |
| Total | 6,513 (100.0%) | 6,720 (100.0%) |
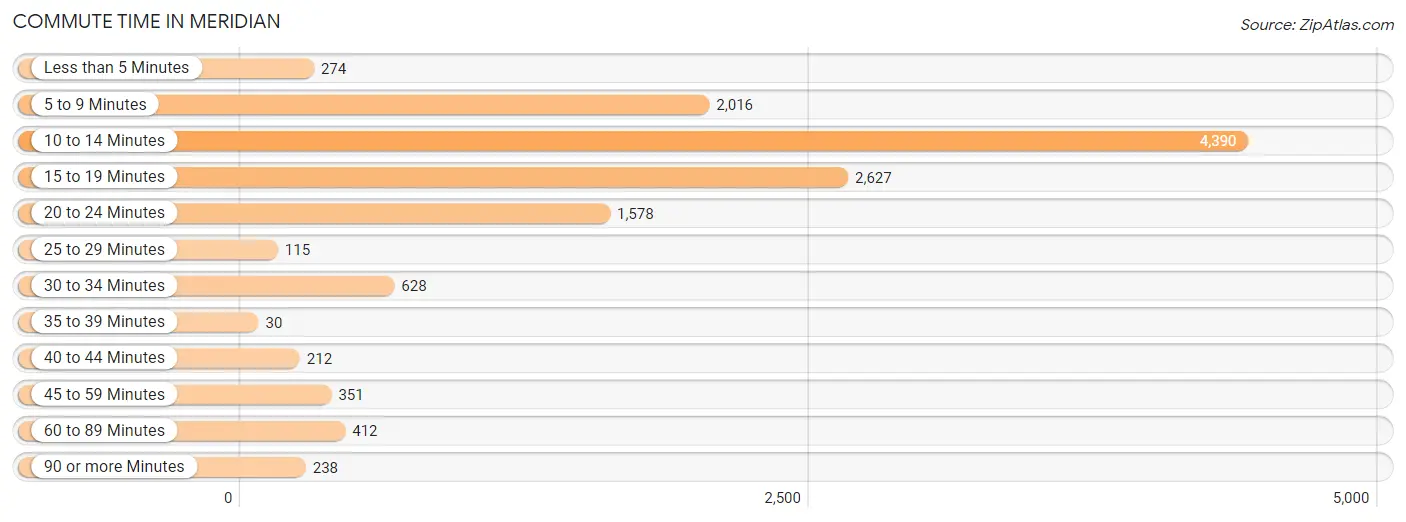
Commute Time in Meridian
The most frequently occuring commute durations in Meridian are 10 to 14 minutes (4,390 commuters, 34.1%), 15 to 19 minutes (2,627 commuters, 20.4%), and 5 to 9 minutes (2,016 commuters, 15.7%).
| Commute Time | # Commuters | % Commuters |
| Less than 5 Minutes | 274 | 2.1% |
| 5 to 9 Minutes | 2,016 | 15.7% |
| 10 to 14 Minutes | 4,390 | 34.1% |
| 15 to 19 Minutes | 2,627 | 20.4% |
| 20 to 24 Minutes | 1,578 | 12.3% |
| 25 to 29 Minutes | 115 | 0.9% |
| 30 to 34 Minutes | 628 | 4.9% |
| 35 to 39 Minutes | 30 | 0.2% |
| 40 to 44 Minutes | 212 | 1.7% |
| 45 to 59 Minutes | 351 | 2.7% |
| 60 to 89 Minutes | 412 | 3.2% |
| 90 or more Minutes | 238 | 1.8% |
Commute Time by Sex in Meridian
The most common commute times in Meridian are 10 to 14 minutes (2,292 commuters, 36.2%) for males and 10 to 14 minutes (2,098 commuters, 32.1%) for females.
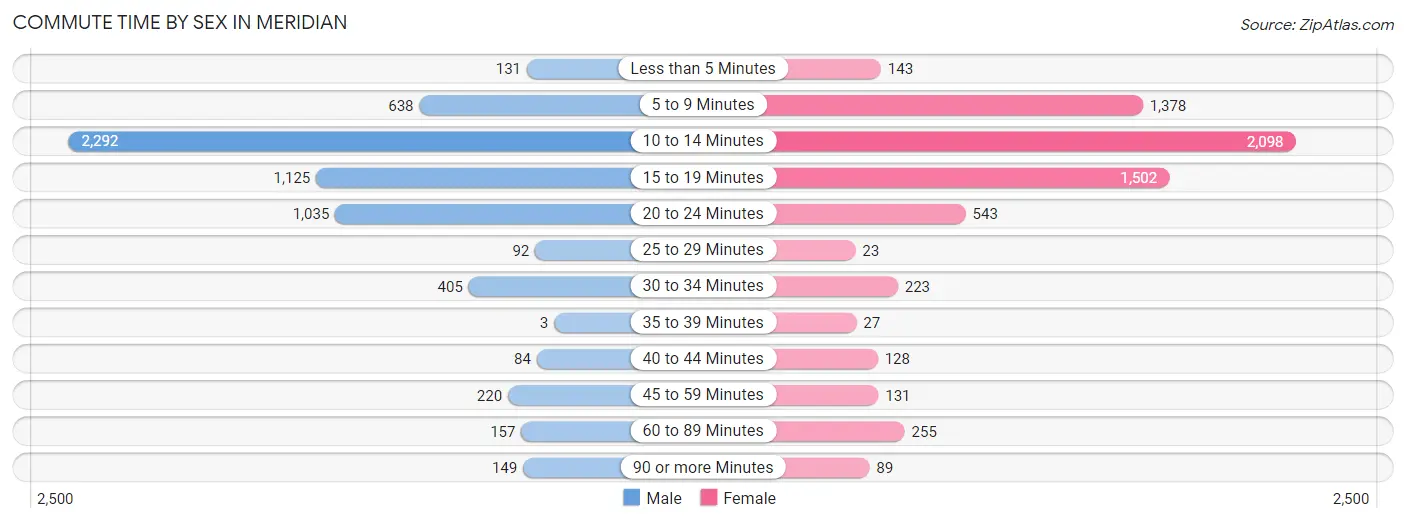
| Commute Time | Male | Female |
| Less than 5 Minutes | 131 (2.1%) | 143 (2.2%) |
| 5 to 9 Minutes | 638 (10.1%) | 1,378 (21.1%) |
| 10 to 14 Minutes | 2,292 (36.2%) | 2,098 (32.1%) |
| 15 to 19 Minutes | 1,125 (17.8%) | 1,502 (23.0%) |
| 20 to 24 Minutes | 1,035 (16.4%) | 543 (8.3%) |
| 25 to 29 Minutes | 92 (1.5%) | 23 (0.4%) |
| 30 to 34 Minutes | 405 (6.4%) | 223 (3.4%) |
| 35 to 39 Minutes | 3 (0.1%) | 27 (0.4%) |
| 40 to 44 Minutes | 84 (1.3%) | 128 (2.0%) |
| 45 to 59 Minutes | 220 (3.5%) | 131 (2.0%) |
| 60 to 89 Minutes | 157 (2.5%) | 255 (3.9%) |
| 90 or more Minutes | 149 (2.4%) | 89 (1.4%) |
Time of Departure to Work by Sex in Meridian
The most frequent times of departure to work in Meridian are 7:00 AM to 7:29 AM (1,093, 17.3%) for males and 7:30 AM to 7:59 AM (1,034, 15.8%) for females.
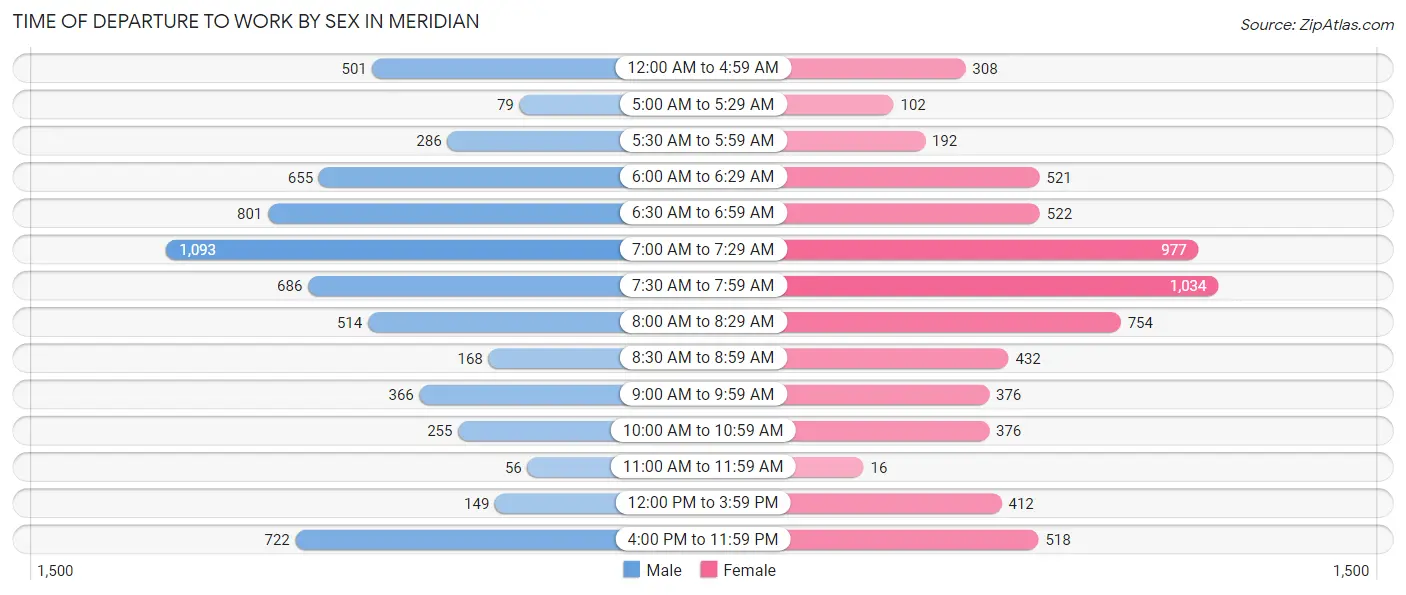
| Time of Departure | Male | Female |
| 12:00 AM to 4:59 AM | 501 (7.9%) | 308 (4.7%) |
| 5:00 AM to 5:29 AM | 79 (1.3%) | 102 (1.6%) |
| 5:30 AM to 5:59 AM | 286 (4.5%) | 192 (2.9%) |
| 6:00 AM to 6:29 AM | 655 (10.3%) | 521 (8.0%) |
| 6:30 AM to 6:59 AM | 801 (12.7%) | 522 (8.0%) |
| 7:00 AM to 7:29 AM | 1,093 (17.3%) | 977 (14.9%) |
| 7:30 AM to 7:59 AM | 686 (10.8%) | 1,034 (15.8%) |
| 8:00 AM to 8:29 AM | 514 (8.1%) | 754 (11.5%) |
| 8:30 AM to 8:59 AM | 168 (2.6%) | 432 (6.6%) |
| 9:00 AM to 9:59 AM | 366 (5.8%) | 376 (5.8%) |
| 10:00 AM to 10:59 AM | 255 (4.0%) | 376 (5.8%) |
| 11:00 AM to 11:59 AM | 56 (0.9%) | 16 (0.2%) |
| 12:00 PM to 3:59 PM | 149 (2.4%) | 412 (6.3%) |
| 4:00 PM to 11:59 PM | 722 (11.4%) | 518 (7.9%) |
| Total | 6,331 (100.0%) | 6,540 (100.0%) |
Housing Occupancy in Meridian
Occupancy by Ownership in Meridian
Of the total 14,774 dwellings in Meridian, owner-occupied units account for 6,787 (45.9%), while renter-occupied units make up 7,987 (54.1%).
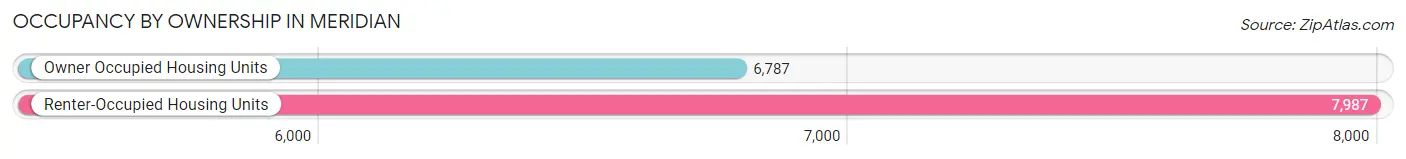
| Occupancy | # Housing Units | % Housing Units |
| Owner Occupied Housing Units | 6,787 | 45.9% |
| Renter-Occupied Housing Units | 7,987 | 54.1% |
| Total Occupied Housing Units | 14,774 | 100.0% |
Occupancy by Household Size in Meridian
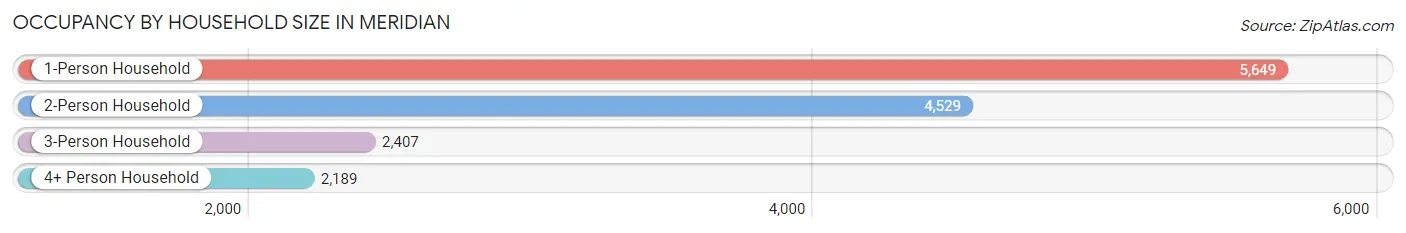
| Household Size | # Housing Units | % Housing Units |
| 1-Person Household | 5,649 | 38.2% |
| 2-Person Household | 4,529 | 30.7% |
| 3-Person Household | 2,407 | 16.3% |
| 4+ Person Household | 2,189 | 14.8% |
| Total Housing Units | 14,774 | 100.0% |
Occupancy by Ownership by Household Size in Meridian
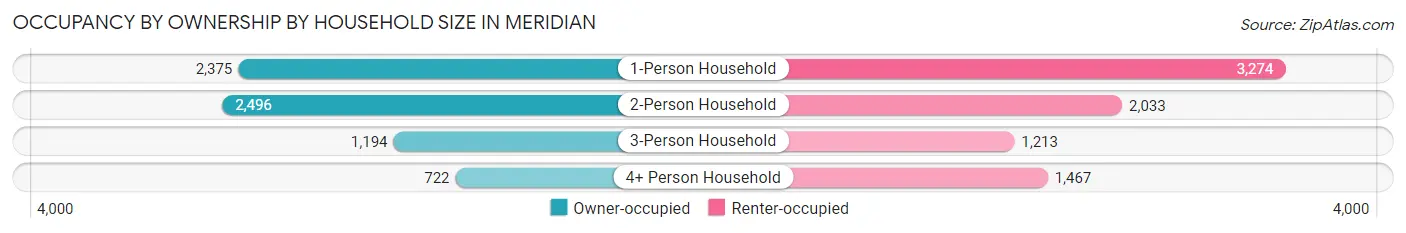
| Household Size | Owner-occupied | Renter-occupied |
| 1-Person Household | 2,375 (42.0%) | 3,274 (58.0%) |
| 2-Person Household | 2,496 (55.1%) | 2,033 (44.9%) |
| 3-Person Household | 1,194 (49.6%) | 1,213 (50.4%) |
| 4+ Person Household | 722 (33.0%) | 1,467 (67.0%) |
| Total Housing Units | 6,787 (45.9%) | 7,987 (54.1%) |
Occupancy by Educational Attainment in Meridian
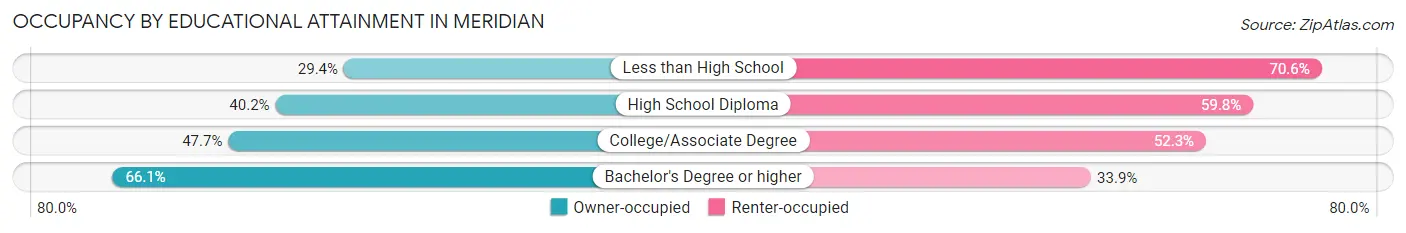
| Household Size | Owner-occupied | Renter-occupied |
| Less than High School | 735 (29.4%) | 1,768 (70.6%) |
| High School Diploma | 1,791 (40.2%) | 2,662 (59.8%) |
| College/Associate Degree | 2,348 (47.7%) | 2,574 (52.3%) |
| Bachelor's Degree or higher | 1,913 (66.1%) | 983 (33.9%) |
Occupancy by Age of Householder in Meridian
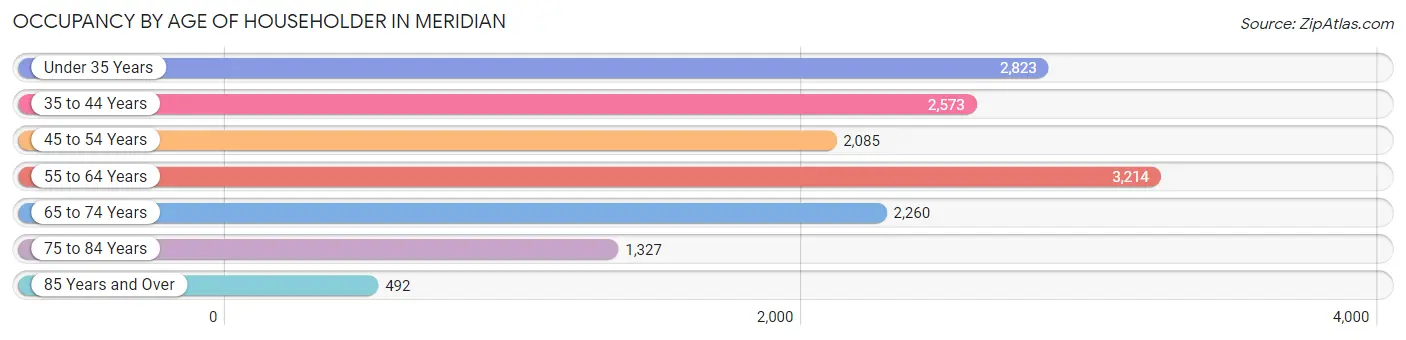
| Age Bracket | # Households | % Households |
| Under 35 Years | 2,823 | 19.1% |
| 35 to 44 Years | 2,573 | 17.4% |
| 45 to 54 Years | 2,085 | 14.1% |
| 55 to 64 Years | 3,214 | 21.7% |
| 65 to 74 Years | 2,260 | 15.3% |
| 75 to 84 Years | 1,327 | 9.0% |
| 85 Years and Over | 492 | 3.3% |
| Total | 14,774 | 100.0% |
Housing Finances in Meridian
Median Income by Occupancy in Meridian
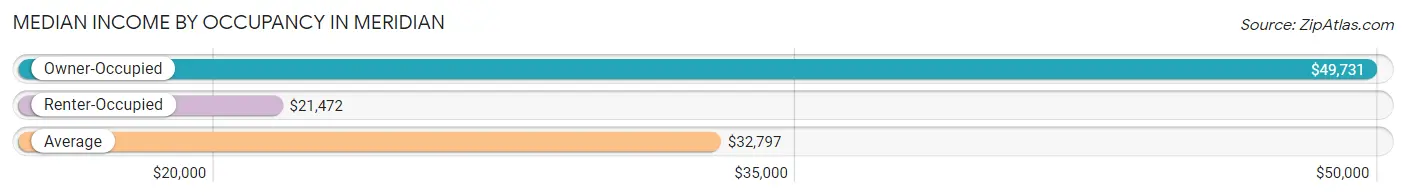
| Occupancy Type | # Households | Median Income |
| Owner-Occupied | 6,787 (45.9%) | $49,731 |
| Renter-Occupied | 7,987 (54.1%) | $21,472 |
| Average | 14,774 (100.0%) | $32,797 |
Occupancy by Householder Income Bracket in Meridian
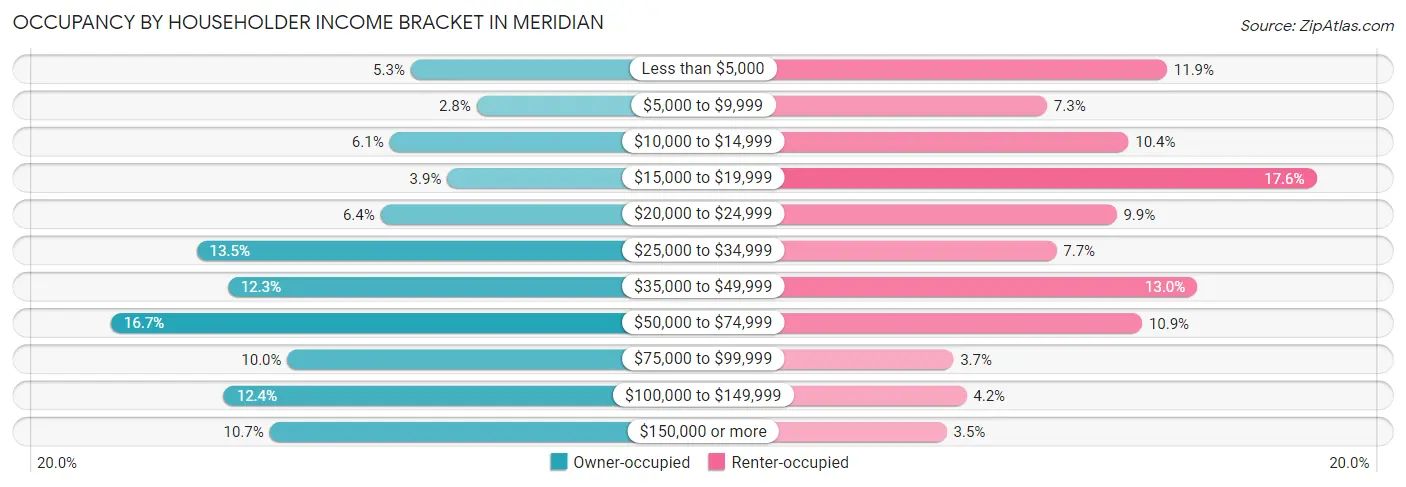
| Income Bracket | Owner-occupied | Renter-occupied |
| Less than $5,000 | 359 (5.3%) | 947 (11.9%) |
| $5,000 to $9,999 | 189 (2.8%) | 582 (7.3%) |
| $10,000 to $14,999 | 414 (6.1%) | 830 (10.4%) |
| $15,000 to $19,999 | 265 (3.9%) | 1,402 (17.5%) |
| $20,000 to $24,999 | 437 (6.4%) | 794 (9.9%) |
| $25,000 to $34,999 | 913 (13.5%) | 611 (7.6%) |
| $35,000 to $49,999 | 832 (12.3%) | 1,039 (13.0%) |
| $50,000 to $74,999 | 1,134 (16.7%) | 871 (10.9%) |
| $75,000 to $99,999 | 678 (10.0%) | 297 (3.7%) |
| $100,000 to $149,999 | 842 (12.4%) | 337 (4.2%) |
| $150,000 or more | 724 (10.7%) | 277 (3.5%) |
| Total | 6,787 (100.0%) | 7,987 (100.0%) |
Monthly Housing Cost Tiers in Meridian
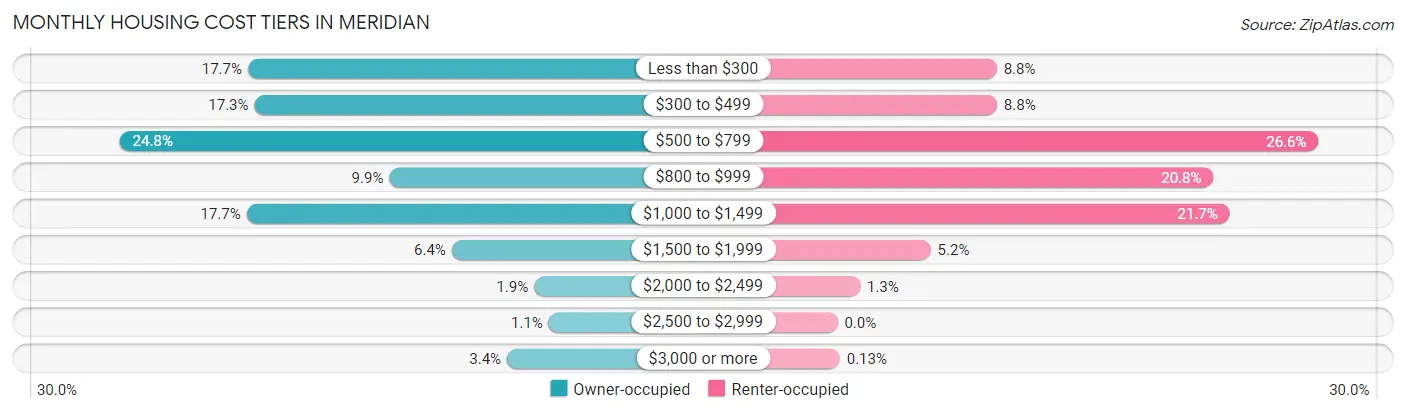
| Monthly Cost | Owner-occupied | Renter-occupied |
| Less than $300 | 1,199 (17.7%) | 703 (8.8%) |
| $300 to $499 | 1,175 (17.3%) | 704 (8.8%) |
| $500 to $799 | 1,680 (24.7%) | 2,121 (26.6%) |
| $800 to $999 | 669 (9.9%) | 1,658 (20.8%) |
| $1,000 to $1,499 | 1,204 (17.7%) | 1,730 (21.7%) |
| $1,500 to $1,999 | 435 (6.4%) | 411 (5.1%) |
| $2,000 to $2,499 | 126 (1.9%) | 100 (1.3%) |
| $2,500 to $2,999 | 71 (1.1%) | 0 (0.0%) |
| $3,000 or more | 228 (3.4%) | 10 (0.1%) |
| Total | 6,787 (100.0%) | 7,987 (100.0%) |
Physical Housing Characteristics in Meridian
Housing Structures in Meridian
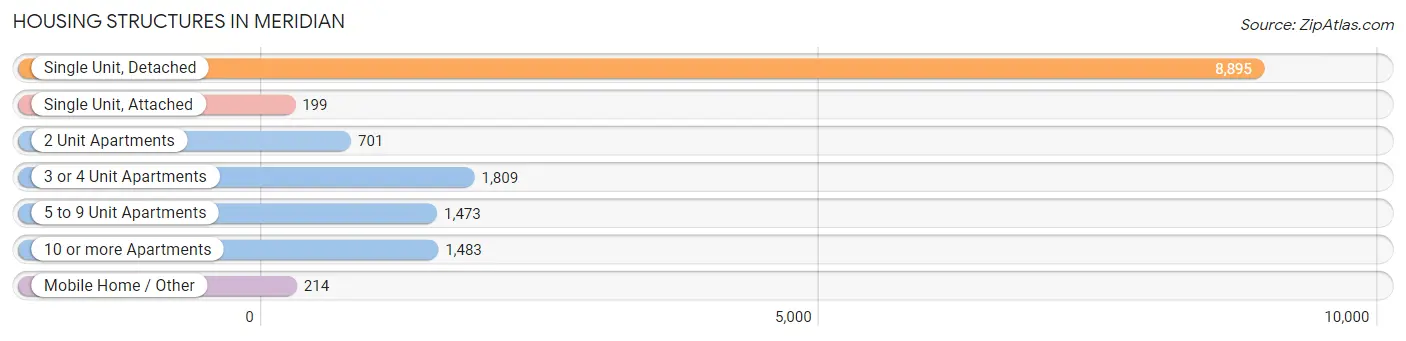
| Structure Type | # Housing Units | % Housing Units |
| Single Unit, Detached | 8,895 | 60.2% |
| Single Unit, Attached | 199 | 1.3% |
| 2 Unit Apartments | 701 | 4.7% |
| 3 or 4 Unit Apartments | 1,809 | 12.2% |
| 5 to 9 Unit Apartments | 1,473 | 10.0% |
| 10 or more Apartments | 1,483 | 10.0% |
| Mobile Home / Other | 214 | 1.5% |
| Total | 14,774 | 100.0% |
Housing Structures by Occupancy in Meridian
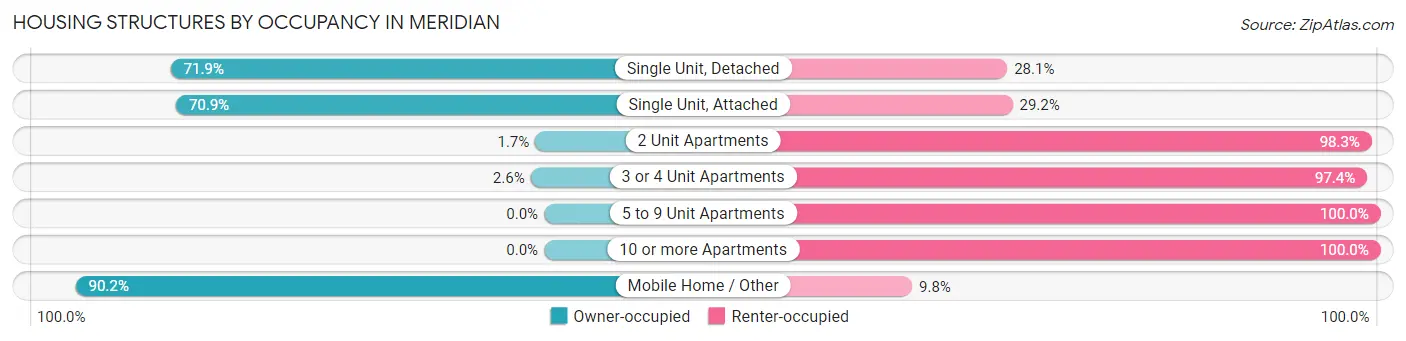
| Structure Type | Owner-occupied | Renter-occupied |
| Single Unit, Detached | 6,394 (71.9%) | 2,501 (28.1%) |
| Single Unit, Attached | 141 (70.9%) | 58 (29.1%) |
| 2 Unit Apartments | 12 (1.7%) | 689 (98.3%) |
| 3 or 4 Unit Apartments | 47 (2.6%) | 1,762 (97.4%) |
| 5 to 9 Unit Apartments | 0 (0.0%) | 1,473 (100.0%) |
| 10 or more Apartments | 0 (0.0%) | 1,483 (100.0%) |
| Mobile Home / Other | 193 (90.2%) | 21 (9.8%) |
| Total | 6,787 (45.9%) | 7,987 (54.1%) |
Housing Structures by Number of Rooms in Meridian
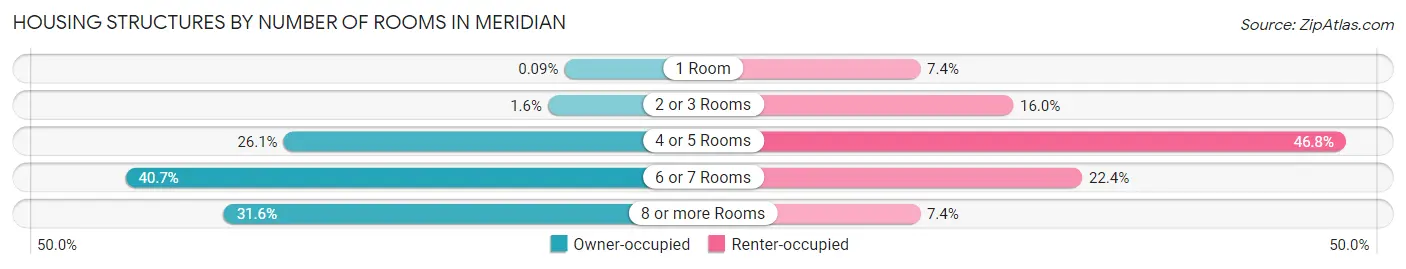
| Number of Rooms | Owner-occupied | Renter-occupied |
| 1 Room | 6 (0.1%) | 593 (7.4%) |
| 2 or 3 Rooms | 109 (1.6%) | 1,279 (16.0%) |
| 4 or 5 Rooms | 1,769 (26.1%) | 3,736 (46.8%) |
| 6 or 7 Rooms | 2,760 (40.7%) | 1,788 (22.4%) |
| 8 or more Rooms | 2,143 (31.6%) | 591 (7.4%) |
| Total | 6,787 (100.0%) | 7,987 (100.0%) |
Housing Structure by Heating Type in Meridian
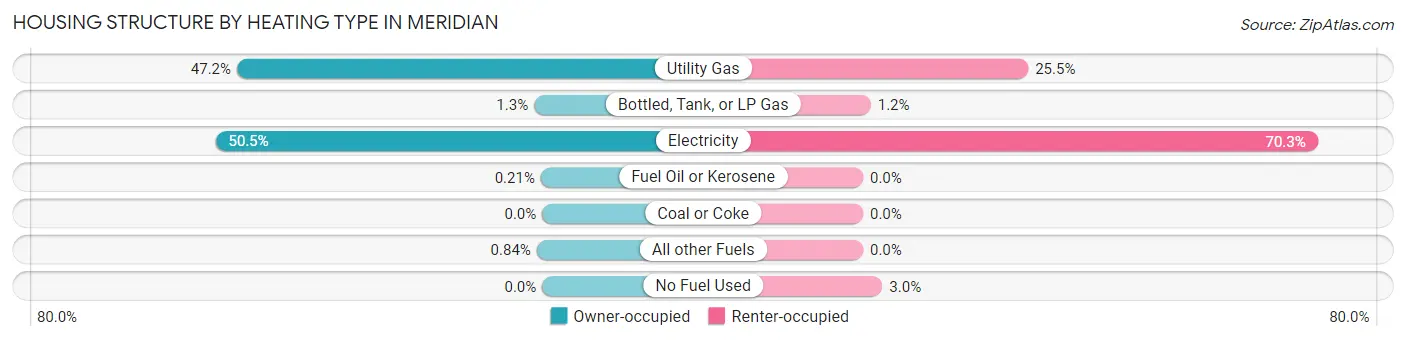
| Heating Type | Owner-occupied | Renter-occupied |
| Utility Gas | 3,203 (47.2%) | 2,040 (25.5%) |
| Bottled, Tank, or LP Gas | 85 (1.3%) | 96 (1.2%) |
| Electricity | 3,428 (50.5%) | 5,612 (70.3%) |
| Fuel Oil or Kerosene | 14 (0.2%) | 0 (0.0%) |
| Coal or Coke | 0 (0.0%) | 0 (0.0%) |
| All other Fuels | 57 (0.8%) | 0 (0.0%) |
| No Fuel Used | 0 (0.0%) | 239 (3.0%) |
| Total | 6,787 (100.0%) | 7,987 (100.0%) |
Household Vehicle Usage in Meridian
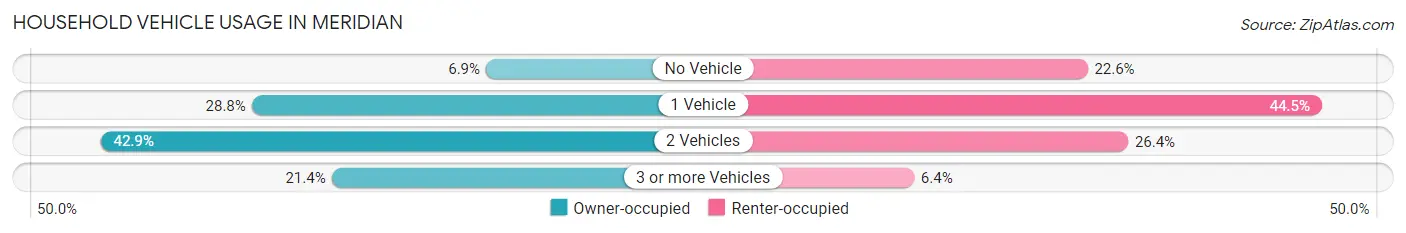
| Vehicles per Household | Owner-occupied | Renter-occupied |
| No Vehicle | 471 (6.9%) | 1,808 (22.6%) |
| 1 Vehicle | 1,955 (28.8%) | 3,555 (44.5%) |
| 2 Vehicles | 2,912 (42.9%) | 2,110 (26.4%) |
| 3 or more Vehicles | 1,449 (21.3%) | 514 (6.4%) |
| Total | 6,787 (100.0%) | 7,987 (100.0%) |
Real Estate & Mortgages in Meridian
Real Estate and Mortgage Overview in Meridian
| Characteristic | Without Mortgage | With Mortgage |
| Housing Units | 3,581 | 3,206 |
| Median Property Value | $87,600 | $118,400 |
| Median Household Income | $42,572 | $385 |
| Monthly Housing Costs | $380 | $181 |
| Real Estate Taxes | $940 | $503 |
Property Value by Mortgage Status in Meridian
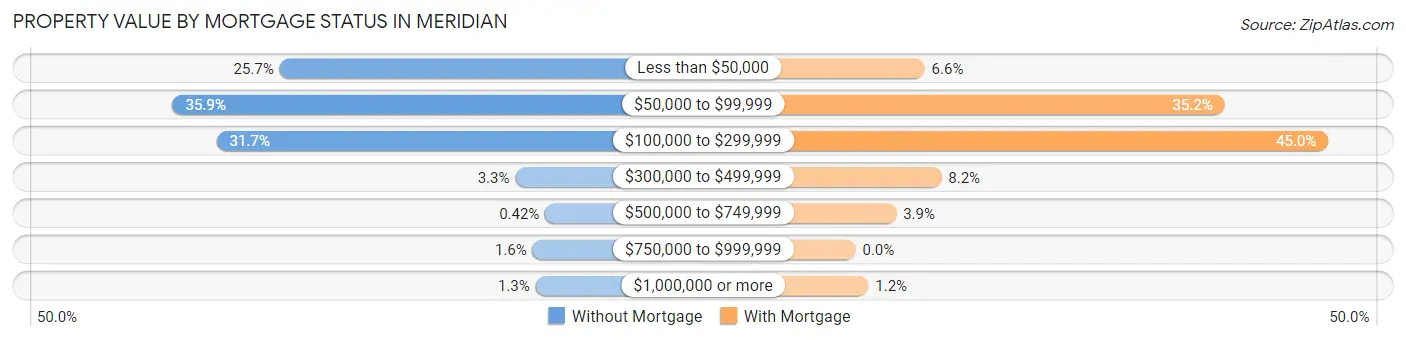
| Property Value | Without Mortgage | With Mortgage |
| Less than $50,000 | 921 (25.7%) | 211 (6.6%) |
| $50,000 to $99,999 | 1,286 (35.9%) | 1,127 (35.1%) |
| $100,000 to $299,999 | 1,136 (31.7%) | 1,443 (45.0%) |
| $300,000 to $499,999 | 117 (3.3%) | 262 (8.2%) |
| $500,000 to $749,999 | 15 (0.4%) | 124 (3.9%) |
| $750,000 to $999,999 | 58 (1.6%) | 0 (0.0%) |
| $1,000,000 or more | 48 (1.3%) | 39 (1.2%) |
| Total | 3,581 (100.0%) | 3,206 (100.0%) |
Household Income by Mortgage Status in Meridian
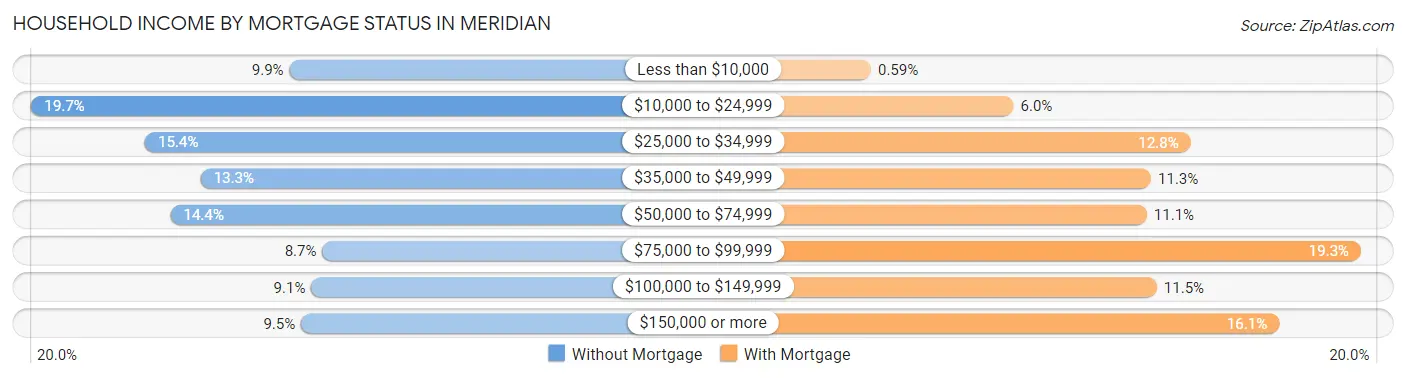
| Household Income | Without Mortgage | With Mortgage |
| Less than $10,000 | 355 (9.9%) | 19 (0.6%) |
| $10,000 to $24,999 | 707 (19.7%) | 193 (6.0%) |
| $25,000 to $34,999 | 552 (15.4%) | 409 (12.8%) |
| $35,000 to $49,999 | 476 (13.3%) | 361 (11.3%) |
| $50,000 to $74,999 | 517 (14.4%) | 356 (11.1%) |
| $75,000 to $99,999 | 310 (8.7%) | 617 (19.3%) |
| $100,000 to $149,999 | 325 (9.1%) | 368 (11.5%) |
| $150,000 or more | 339 (9.5%) | 517 (16.1%) |
| Total | 3,581 (100.0%) | 3,206 (100.0%) |
Property Value to Household Income Ratio in Meridian
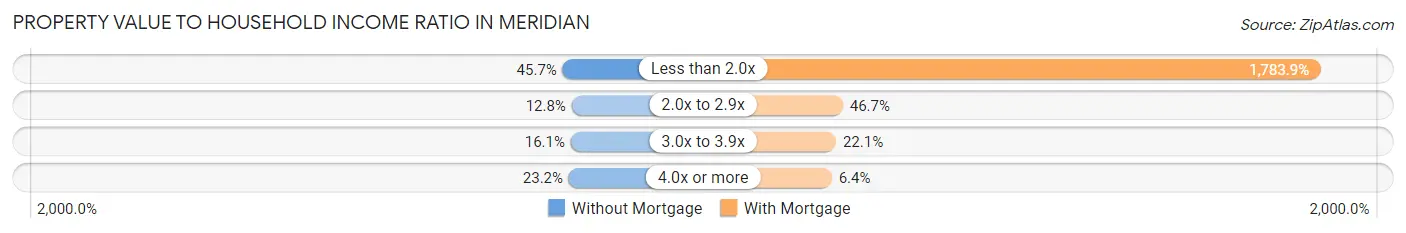
| Value-to-Income Ratio | Without Mortgage | With Mortgage |
| Less than 2.0x | 1,637 (45.7%) | 57,192 (1,783.9%) |
| 2.0x to 2.9x | 459 (12.8%) | 1,497 (46.7%) |
| 3.0x to 3.9x | 576 (16.1%) | 709 (22.1%) |
| 4.0x or more | 830 (23.2%) | 205 (6.4%) |
| Total | 3,581 (100.0%) | 3,206 (100.0%) |
Real Estate Taxes by Mortgage Status in Meridian
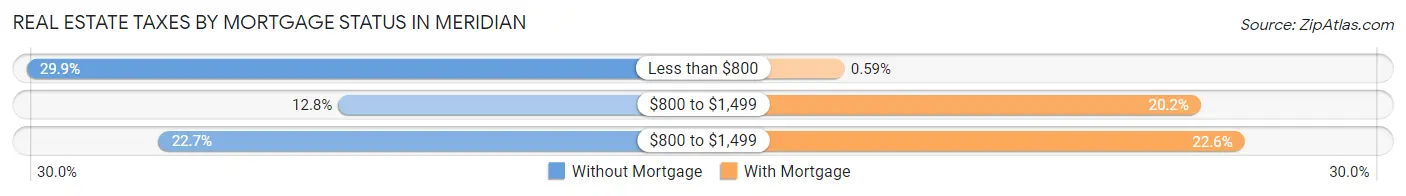
| Property Taxes | Without Mortgage | With Mortgage |
| Less than $800 | 1,070 (29.9%) | 19 (0.6%) |
| $800 to $1,499 | 459 (12.8%) | 646 (20.2%) |
| $800 to $1,499 | 811 (22.7%) | 723 (22.6%) |
| Total | 3,581 (100.0%) | 3,206 (100.0%) |
Health & Disability in Meridian
Health Insurance Coverage by Age in Meridian
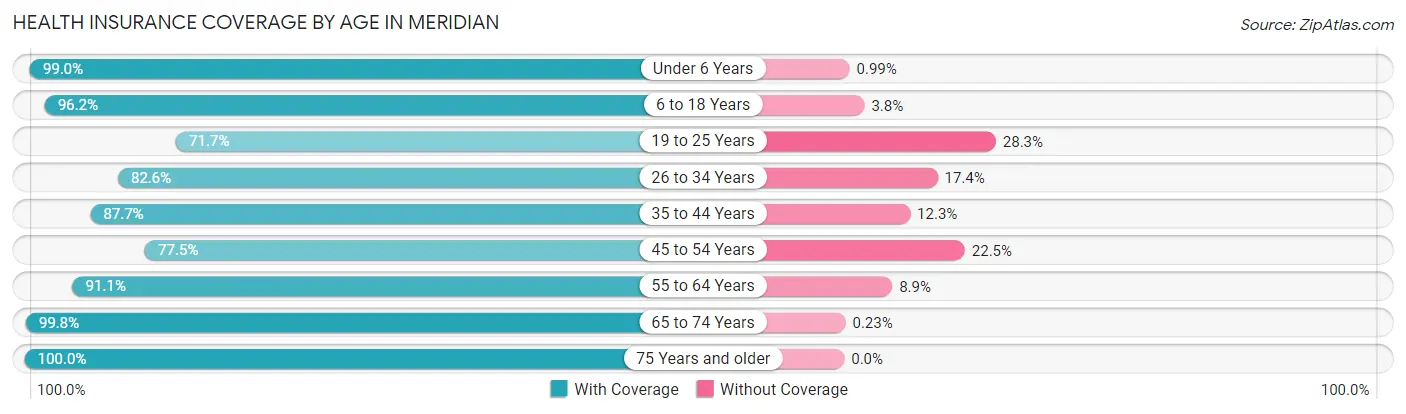
| Age Bracket | With Coverage | Without Coverage |
| Under 6 Years | 2,789 (99.0%) | 28 (1.0%) |
| 6 to 18 Years | 5,840 (96.2%) | 228 (3.8%) |
| 19 to 25 Years | 2,051 (71.7%) | 808 (28.3%) |
| 26 to 34 Years | 3,382 (82.6%) | 712 (17.4%) |
| 35 to 44 Years | 3,514 (87.7%) | 492 (12.3%) |
| 45 to 54 Years | 2,821 (77.5%) | 818 (22.5%) |
| 55 to 64 Years | 4,123 (91.1%) | 405 (8.9%) |
| 65 to 74 Years | 3,508 (99.8%) | 8 (0.2%) |
| 75 Years and older | 2,374 (100.0%) | 0 (0.0%) |
| Total | 30,402 (89.7%) | 3,499 (10.3%) |
Health Insurance Coverage by Citizenship Status in Meridian
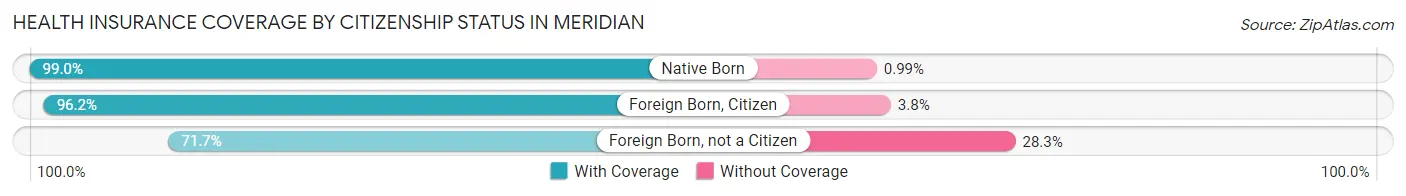
| Citizenship Status | With Coverage | Without Coverage |
| Native Born | 2,789 (99.0%) | 28 (1.0%) |
| Foreign Born, Citizen | 5,840 (96.2%) | 228 (3.8%) |
| Foreign Born, not a Citizen | 2,051 (71.7%) | 808 (28.3%) |
Health Insurance Coverage by Household Income in Meridian
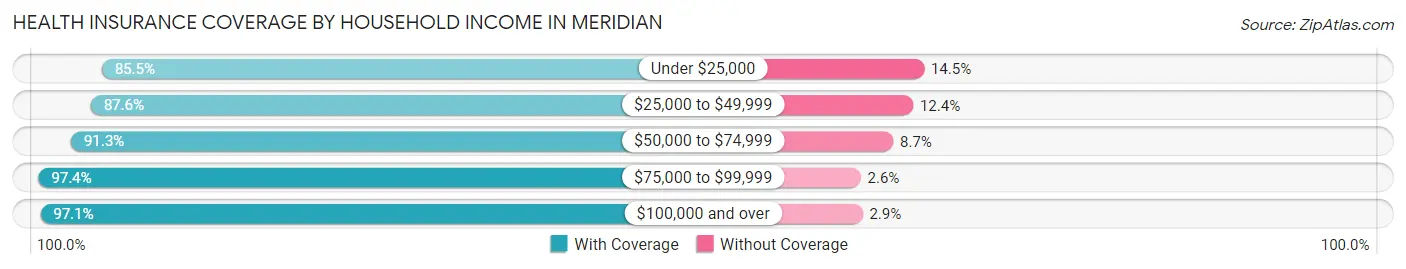
| Household Income | With Coverage | Without Coverage |
| Under $25,000 | 10,746 (85.5%) | 1,817 (14.5%) |
| $25,000 to $49,999 | 6,473 (87.6%) | 916 (12.4%) |
| $50,000 to $74,999 | 4,400 (91.3%) | 418 (8.7%) |
| $75,000 to $99,999 | 2,531 (97.4%) | 67 (2.6%) |
| $100,000 and over | 5,883 (97.1%) | 178 (2.9%) |
Public vs Private Health Insurance Coverage by Age in Meridian
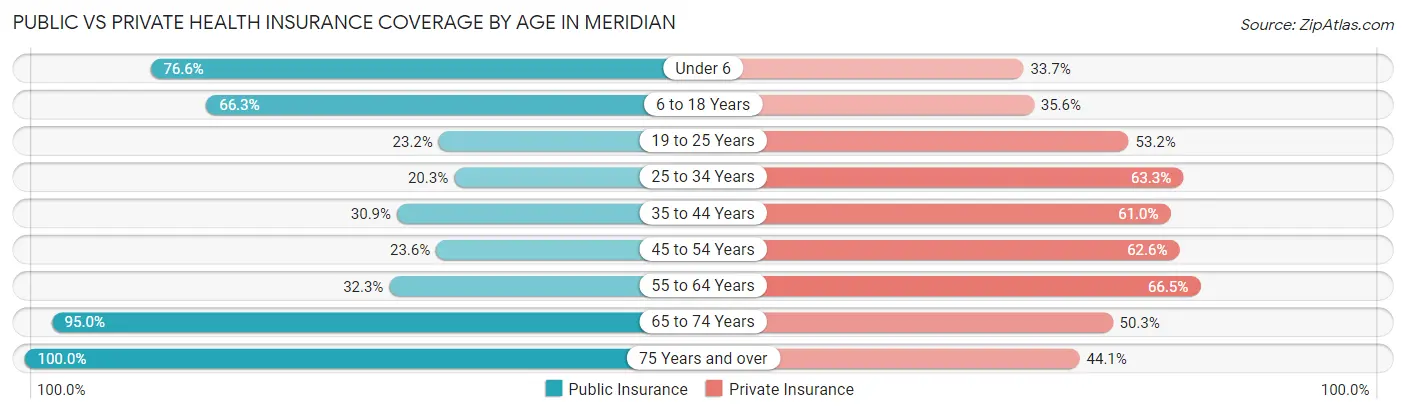
| Age Bracket | Public Insurance | Private Insurance |
| Under 6 | 2,159 (76.6%) | 950 (33.7%) |
| 6 to 18 Years | 4,021 (66.3%) | 2,162 (35.6%) |
| 19 to 25 Years | 662 (23.2%) | 1,522 (53.2%) |
| 25 to 34 Years | 831 (20.3%) | 2,593 (63.3%) |
| 35 to 44 Years | 1,238 (30.9%) | 2,442 (61.0%) |
| 45 to 54 Years | 860 (23.6%) | 2,279 (62.6%) |
| 55 to 64 Years | 1,464 (32.3%) | 3,011 (66.5%) |
| 65 to 74 Years | 3,339 (95.0%) | 1,767 (50.3%) |
| 75 Years and over | 2,374 (100.0%) | 1,048 (44.1%) |
| Total | 16,948 (50.0%) | 17,774 (52.4%) |
Disability Status by Sex by Age in Meridian
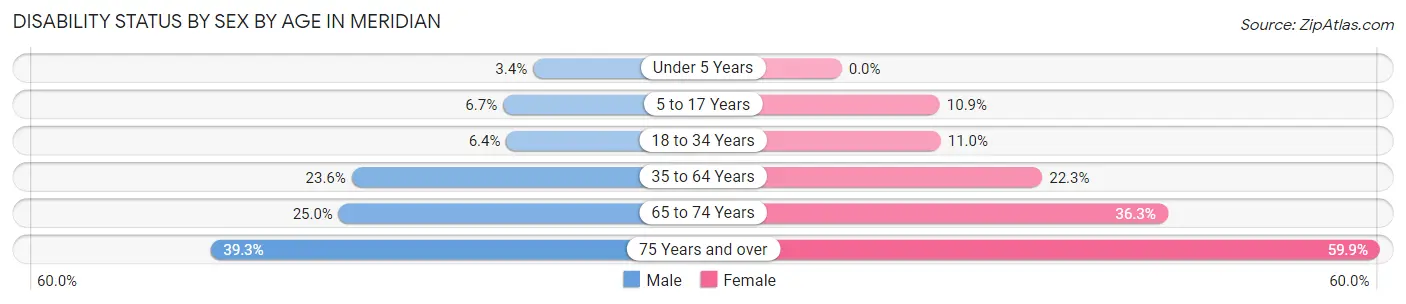
| Age Bracket | Male | Female |
| Under 5 Years | 38 (3.4%) | 0 (0.0%) |
| 5 to 17 Years | 205 (6.7%) | 315 (10.9%) |
| 18 to 34 Years | 219 (6.4%) | 447 (11.0%) |
| 35 to 64 Years | 1,277 (23.6%) | 1,509 (22.3%) |
| 65 to 74 Years | 399 (25.0%) | 697 (36.3%) |
| 75 Years and over | 340 (39.3%) | 904 (59.9%) |
Disability Class by Sex by Age in Meridian
Disability Class: Hearing Difficulty
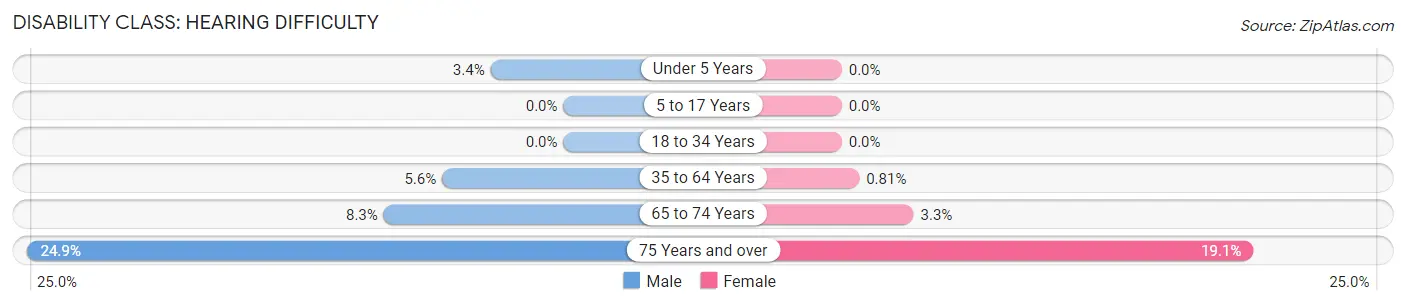
| Age Bracket | Male | Female |
| Under 5 Years | 38 (3.4%) | 0 (0.0%) |
| 5 to 17 Years | 0 (0.0%) | 0 (0.0%) |
| 18 to 34 Years | 0 (0.0%) | 0 (0.0%) |
| 35 to 64 Years | 305 (5.6%) | 55 (0.8%) |
| 65 to 74 Years | 133 (8.3%) | 64 (3.3%) |
| 75 Years and over | 215 (24.9%) | 288 (19.1%) |
Disability Class: Vision Difficulty
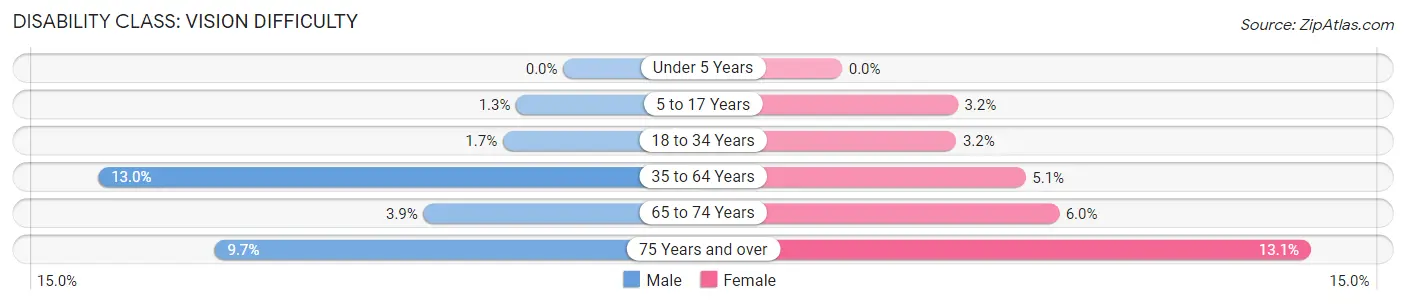
| Age Bracket | Male | Female |
| Under 5 Years | 0 (0.0%) | 0 (0.0%) |
| 5 to 17 Years | 40 (1.3%) | 93 (3.2%) |
| 18 to 34 Years | 58 (1.7%) | 129 (3.2%) |
| 35 to 64 Years | 701 (13.0%) | 345 (5.1%) |
| 65 to 74 Years | 62 (3.9%) | 116 (6.0%) |
| 75 Years and over | 84 (9.7%) | 197 (13.1%) |
Disability Class: Cognitive Difficulty
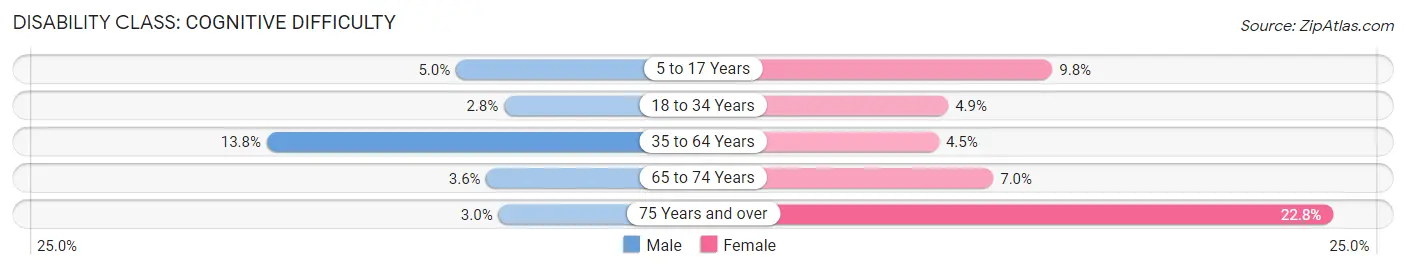
| Age Bracket | Male | Female |
| 5 to 17 Years | 152 (5.0%) | 282 (9.8%) |
| 18 to 34 Years | 95 (2.8%) | 200 (4.9%) |
| 35 to 64 Years | 745 (13.8%) | 305 (4.5%) |
| 65 to 74 Years | 57 (3.6%) | 135 (7.0%) |
| 75 Years and over | 26 (3.0%) | 344 (22.8%) |
Disability Class: Ambulatory Difficulty
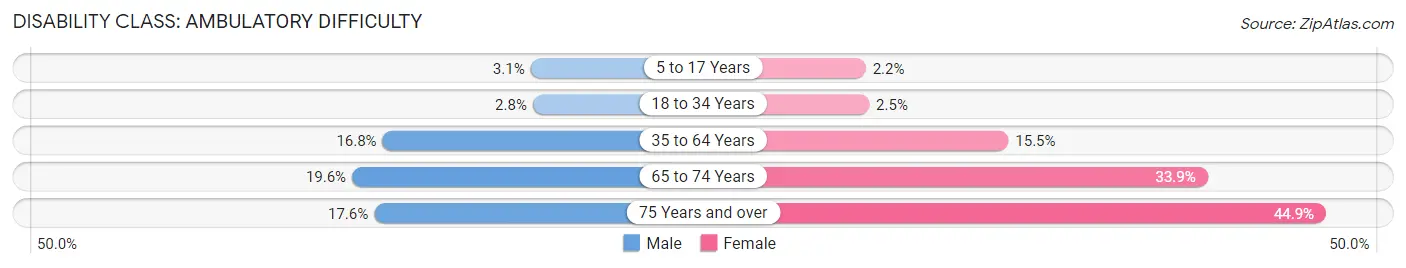
| Age Bracket | Male | Female |
| 5 to 17 Years | 93 (3.0%) | 64 (2.2%) |
| 18 to 34 Years | 98 (2.8%) | 103 (2.5%) |
| 35 to 64 Years | 909 (16.8%) | 1,045 (15.5%) |
| 65 to 74 Years | 313 (19.6%) | 652 (33.9%) |
| 75 Years and over | 152 (17.6%) | 678 (44.9%) |
Disability Class: Self-Care Difficulty
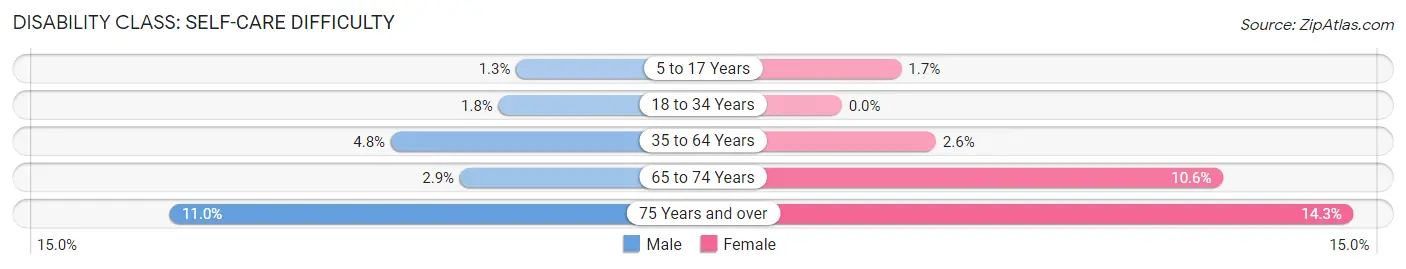
| Age Bracket | Male | Female |
| 5 to 17 Years | 40 (1.3%) | 48 (1.7%) |
| 18 to 34 Years | 62 (1.8%) | 0 (0.0%) |
| 35 to 64 Years | 260 (4.8%) | 177 (2.6%) |
| 65 to 74 Years | 46 (2.9%) | 204 (10.6%) |
| 75 Years and over | 95 (11.0%) | 215 (14.2%) |
Technology Access in Meridian
Computing Device Access in Meridian
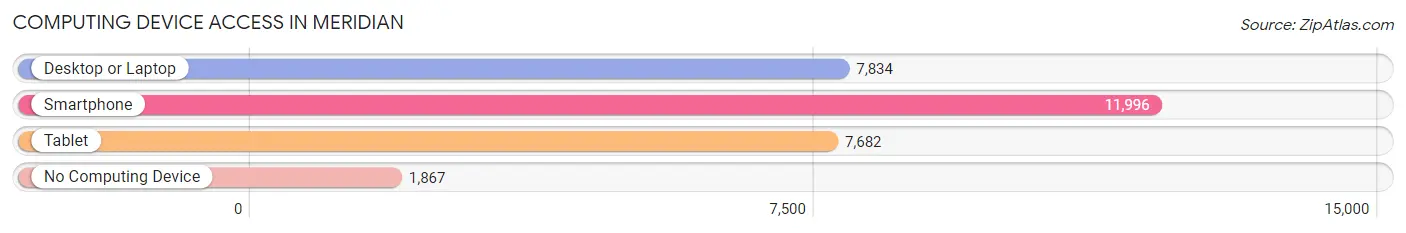
| Device Type | # Households | % Households |
| Desktop or Laptop | 7,834 | 53.0% |
| Smartphone | 11,996 | 81.2% |
| Tablet | 7,682 | 52.0% |
| No Computing Device | 1,867 | 12.6% |
| Total | 14,774 | 100.0% |
Internet Access in Meridian
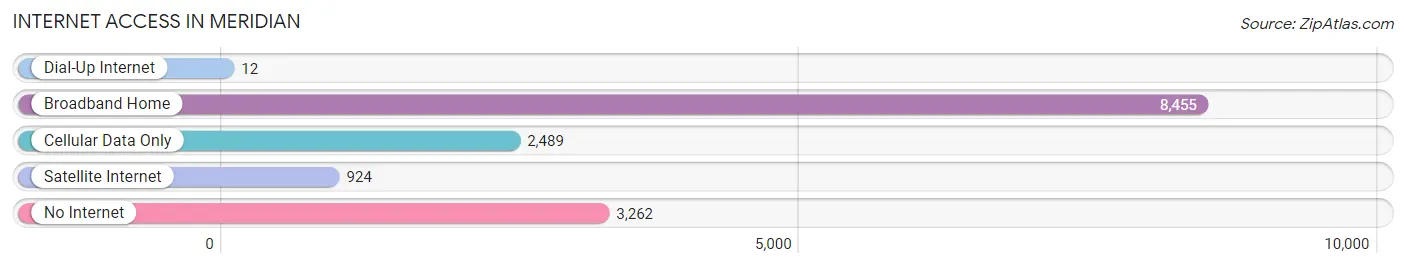
| Internet Type | # Households | % Households |
| Dial-Up Internet | 12 | 0.1% |
| Broadband Home | 8,455 | 57.2% |
| Cellular Data Only | 2,489 | 16.9% |
| Satellite Internet | 924 | 6.2% |
| No Internet | 3,262 | 22.1% |
| Total | 14,774 | 100.0% |
Meridian Summary
Meridian, Mississippi is a city located in Lauderdale County, Mississippi. It is the county seat of Lauderdale County and the sixth largest city in the state. The city is located in the East Central region of Mississippi, approximately 90 miles east of Jackson, the state capital. The city is situated along the banks of the Chunky River and is home to a population of approximately 41,000 people.
History
The area that is now Meridian was first inhabited by the Choctaw Indians. The Choctaw were a Native American tribe that lived in the area for centuries before the arrival of European settlers. The first European settlers arrived in the area in the early 1800s and established a trading post. The trading post was located near the Chunky River and was the first permanent settlement in the area.
In 1844, the city of Meridian was founded by the Mississippi Legislature. The city was named after the nearby Chunky River, which was named after the Choctaw word for “meridian”. The city quickly grew and became an important trading center for the region.
During the Civil War, Meridian was an important supply center for the Confederate Army. The city was also the site of several battles during the war, including the Battle of Meridian in 1864. After the war, the city continued to grow and by the late 1800s, it was the largest city in Mississippi.
Geography
Meridian is located in the East Central region of Mississippi, approximately 90 miles east of Jackson, the state capital. The city is situated along the banks of the Chunky River and is surrounded by rolling hills and forests. The city has a total area of 33.3 square miles, of which 33.2 square miles is land and 0.1 square miles is water.
The climate in Meridian is classified as humid subtropical, with hot, humid summers and mild winters. The average annual temperature is 64°F, with an average high of 87°F in the summer and an average low of 41°F in the winter. The average annual precipitation is 51.2 inches, with an average of 4.7 inches of snow per year.
Economy
Meridian’s economy is largely based on manufacturing, healthcare, and retail. The city is home to several large manufacturing companies, including International Paper, Georgia-Pacific, and Lockheed Martin. The city is also home to several healthcare facilities, including Anderson Regional Medical Center and Rush Foundation Hospital.
Retail is also an important part of the city’s economy. The city is home to several large shopping centers, including Bonita Lakes Mall and The Marketplace at Bonita Lakes. The city is also home to several large retail stores, including Walmart, Target, and Best Buy.
Demographics
As of the 2010 census, the population of Meridian was 41,148. The racial makeup of the city was 57.3% African American, 37.7% White, 0.3% Native American, 0.7% Asian, 0.1% Pacific Islander, and 3.9% from other races. The median household income was $30,945, and the median family income was $37,945. The per capita income was $17,845.
Meridian is home to several educational institutions, including Meridian Community College, Mississippi State University-Meridian, and Meridian High School. The city is also home to several cultural attractions, including the Meridian Museum of Art and the Mississippi Arts and Entertainment Center.
Common Questions
What is Per Capita Income in Meridian?
Per Capita income in Meridian is $25,172.
What is the Median Family Income in Meridian?
Median Family Income in Meridian is $46,223.
What is the Median Household income in Meridian?
Median Household Income in Meridian is $32,797.
What is Income or Wage Gap in Meridian?
Income or Wage Gap in Meridian is 23.3%.
Women in Meridian earn 76.7 cents for every dollar earned by a man.
What is Family Income Deficit in Meridian?
Family Income Deficit in Meridian is $12,403.
Families that are below poverty line in Meridian earn $12,403 less on average than the poverty threshold level.
What is Inequality or Gini Index in Meridian?
Inequality or Gini Index in Meridian is 0.56.
What is the Total Population of Meridian?
Total Population of Meridian is 34,990.
What is the Total Male Population of Meridian?
Total Male Population of Meridian is 16,295.
What is the Total Female Population of Meridian?
Total Female Population of Meridian is 18,695.
What is the Ratio of Males per 100 Females in Meridian?
There are 87.16 Males per 100 Females in Meridian.
What is the Ratio of Females per 100 Males in Meridian?
There are 114.73 Females per 100 Males in Meridian.
What is the Median Population Age in Meridian?
Median Population Age in Meridian is 37.9 Years.
What is the Average Family Size in Meridian
Average Family Size in Meridian is 3.1 People.
What is the Average Household Size in Meridian
Average Household Size in Meridian is 2.3 People.
How Large is the Labor Force in Meridian?
There are 14,790 People in the Labor Forcein in Meridian.
What is the Percentage of People in the Labor Force in Meridian?
53.9% of People are in the Labor Force in Meridian.
What is the Unemployment Rate in Meridian?
Unemployment Rate in Meridian is 8.6%.