North Carrollton, MS Map & Demographics
North Carrollton Map
North Carrollton Overview
$19,619
PER CAPITA INCOME
$30,652
AVG FAMILY INCOME
$19,000
AVG HOUSEHOLD INCOME
74.5%
WAGE / INCOME GAP [ % ]
25.5¢/ $1
WAGE / INCOME GAP [ $ ]
0.47
INEQUALITY / GINI INDEX
398
TOTAL POPULATION
182
MALE POPULATION
216
FEMALE POPULATION
84.26
MALES / 100 FEMALES
118.68
FEMALES / 100 MALES
44.1
MEDIAN AGE
2.9
AVG FAMILY SIZE
1.9
AVG HOUSEHOLD SIZE
134
LABOR FORCE [ PEOPLE ]
40.5%
PERCENT IN LABOR FORCE
2.2%
UNEMPLOYMENT RATE
North Carrollton Zip Codes
North Carrollton Area Codes
Income in North Carrollton
Income Overview in North Carrollton
Per Capita Income in North Carrollton is $19,619, while median incomes of families and households are $30,652 and $19,000 respectively.
| Characteristic | Number | Measure |
| Per Capita Income | 398 | $19,619 |
| Median Family Income | 94 | $30,652 |
| Mean Family Income | 94 | $37,504 |
| Median Household Income | 210 | $19,000 |
| Mean Household Income | 210 | $31,949 |
| Income Deficit | 94 | $0 |
| Wage / Income Gap (%) | 398 | 74.45% |
| Wage / Income Gap ($) | 398 | 25.55¢ per $1 |
| Gini / Inequality Index | 398 | 0.47 |
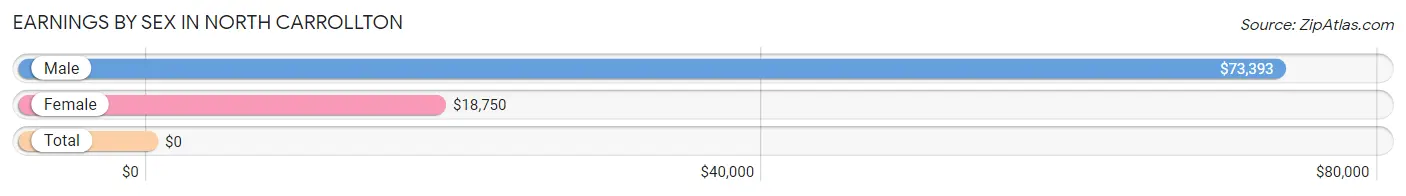
Earnings by Sex in North Carrollton
| Sex | Number | Average Earnings |
| Male | 69 (52.3%) | $73,393 |
| Female | 63 (47.7%) | $18,750 |
| Total | 132 (100.0%) | $0 |
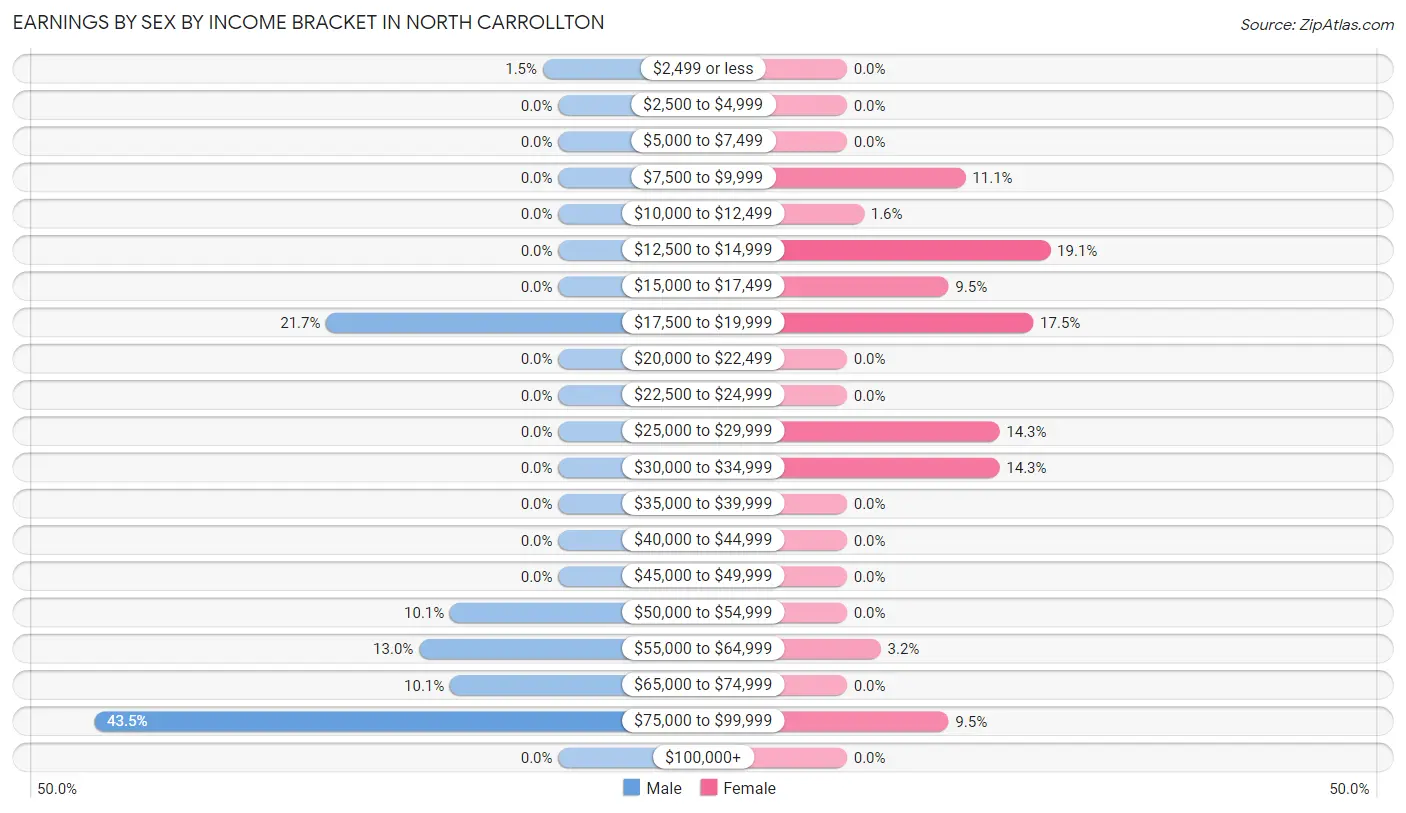
Earnings by Sex by Income Bracket in North Carrollton
The most common earnings brackets in North Carrollton are $75,000 to $99,999 for men (30 | 43.5%) and $12,500 to $14,999 for women (12 | 19.1%).
| Income | Male | Female |
| $2,499 or less | 1 (1.5%) | 0 (0.0%) |
| $2,500 to $4,999 | 0 (0.0%) | 0 (0.0%) |
| $5,000 to $7,499 | 0 (0.0%) | 0 (0.0%) |
| $7,500 to $9,999 | 0 (0.0%) | 7 (11.1%) |
| $10,000 to $12,499 | 0 (0.0%) | 1 (1.6%) |
| $12,500 to $14,999 | 0 (0.0%) | 12 (19.1%) |
| $15,000 to $17,499 | 0 (0.0%) | 6 (9.5%) |
| $17,500 to $19,999 | 15 (21.7%) | 11 (17.5%) |
| $20,000 to $22,499 | 0 (0.0%) | 0 (0.0%) |
| $22,500 to $24,999 | 0 (0.0%) | 0 (0.0%) |
| $25,000 to $29,999 | 0 (0.0%) | 9 (14.3%) |
| $30,000 to $34,999 | 0 (0.0%) | 9 (14.3%) |
| $35,000 to $39,999 | 0 (0.0%) | 0 (0.0%) |
| $40,000 to $44,999 | 0 (0.0%) | 0 (0.0%) |
| $45,000 to $49,999 | 0 (0.0%) | 0 (0.0%) |
| $50,000 to $54,999 | 7 (10.1%) | 0 (0.0%) |
| $55,000 to $64,999 | 9 (13.0%) | 2 (3.2%) |
| $65,000 to $74,999 | 7 (10.1%) | 0 (0.0%) |
| $75,000 to $99,999 | 30 (43.5%) | 6 (9.5%) |
| $100,000+ | 0 (0.0%) | 0 (0.0%) |
| Total | 69 (100.0%) | 63 (100.0%) |
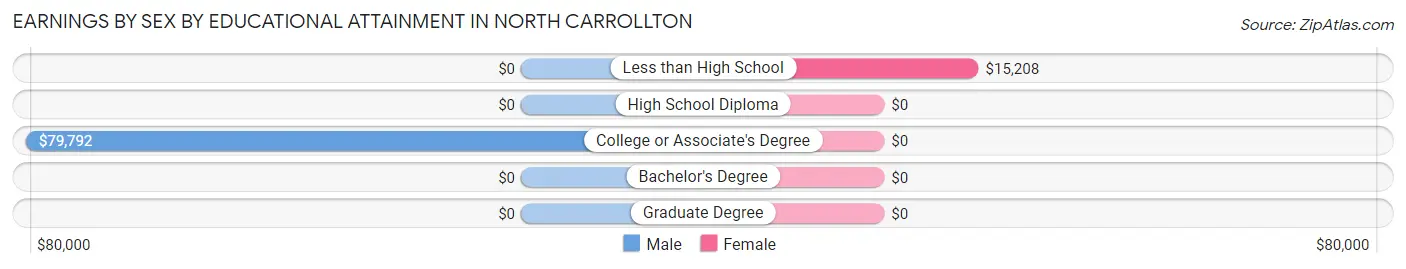
Earnings by Sex by Educational Attainment in North Carrollton
Average earnings in North Carrollton are $76,250 for men and $18,068 for women, a difference of 76.3%. Men with an educational attainment of college or associate's degree enjoy the highest average annual earnings of $79,792, while those with college or associate's degree education earn the least with $79,792. Women with an educational attainment of less than high school earn the most with the average annual earnings of $15,208, while those with less than high school education have the smallest earnings of $15,208.
| Educational Attainment | Male Income | Female Income |
| Less than High School | - | - |
| High School Diploma | - | - |
| College or Associate's Degree | $79,792 | $0 |
| Bachelor's Degree | - | - |
| Graduate Degree | - | - |
| Total | $76,250 | $18,068 |
Family Income in North Carrollton
Family Income Brackets in North Carrollton
According to the North Carrollton family income data, there are 23 families falling into the $10,000 to $14,999 income range, which is the most common income bracket and makes up 24.5% of all families.
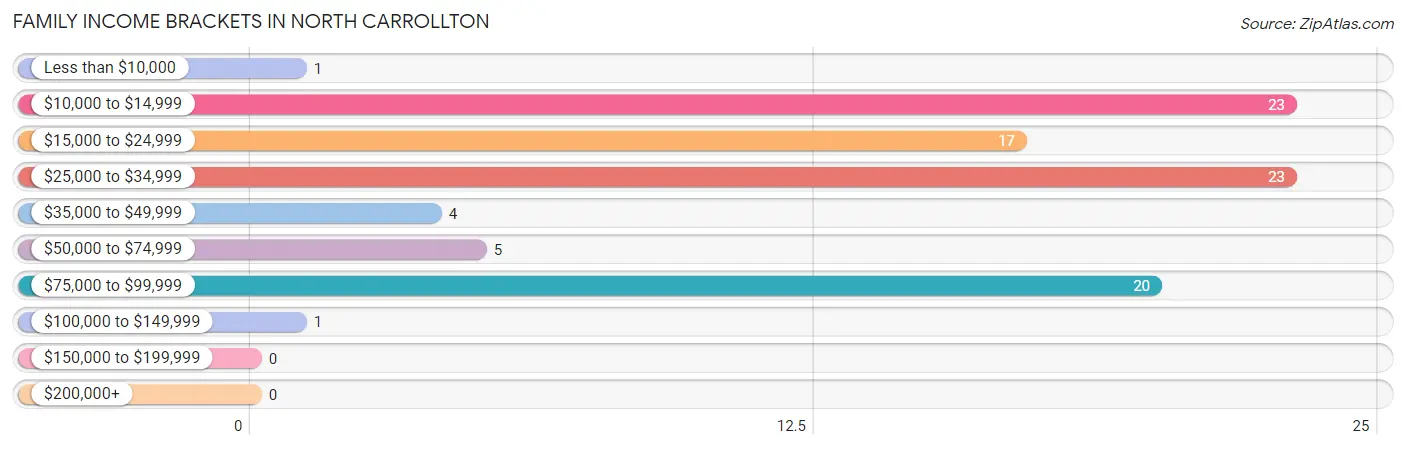
| Income Bracket | # Families | % Families |
| Less than $10,000 | 1 | 1.1% |
| $10,000 to $14,999 | 23 | 24.5% |
| $15,000 to $24,999 | 17 | 18.1% |
| $25,000 to $34,999 | 23 | 24.5% |
| $35,000 to $49,999 | 4 | 4.3% |
| $50,000 to $74,999 | 5 | 5.3% |
| $75,000 to $99,999 | 20 | 21.3% |
| $100,000 to $149,999 | 1 | 1.1% |
| $150,000 to $199,999 | 0 | 0.0% |
| $200,000+ | 0 | 0.0% |
Family Income by Famaliy Size in North Carrollton
3-person families (27 | 28.7%) account for the highest median family income in North Carrollton with $31,467 per family, while 3-person families (27 | 28.7%) have the highest median income of $10,489 per family member.
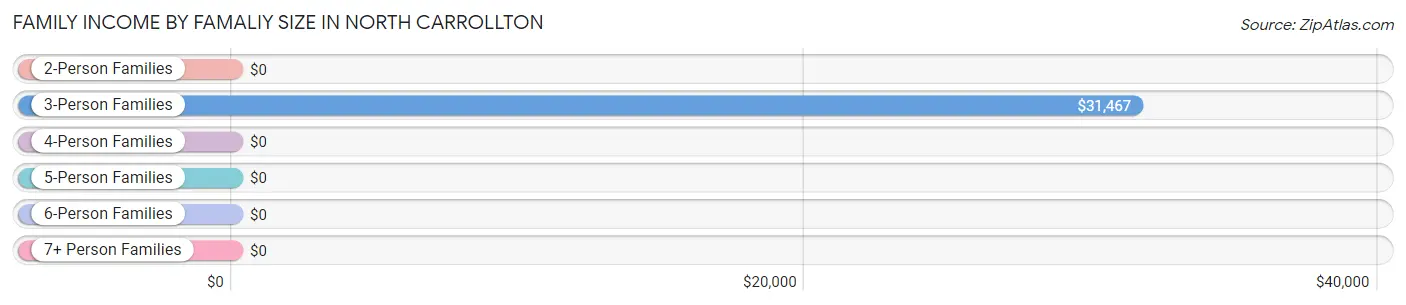
| Income Bracket | # Families | Median Income |
| 2-Person Families | 54 (57.5%) | $0 |
| 3-Person Families | 27 (28.7%) | $31,467 |
| 4-Person Families | 0 (0.0%) | $0 |
| 5-Person Families | 13 (13.8%) | $0 |
| 6-Person Families | 0 (0.0%) | $0 |
| 7+ Person Families | 0 (0.0%) | $0 |
| Total | 94 (100.0%) | $30,652 |
Family Income by Number of Earners in North Carrollton
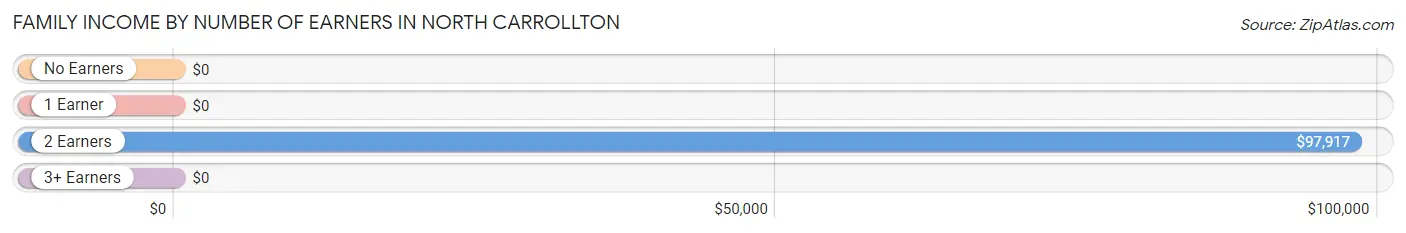
| Number of Earners | # Families | Median Income |
| No Earners | 46 (48.9%) | $0 |
| 1 Earner | 38 (40.4%) | $0 |
| 2 Earners | 10 (10.6%) | $97,917 |
| 3+ Earners | 0 (0.0%) | $0 |
| Total | 94 (100.0%) | $30,652 |
Household Income in North Carrollton
Household Income Brackets in North Carrollton
With 46 households falling in the category, the $10,000 to $14,999 income range is the most frequent in North Carrollton, accounting for 21.9% of all households.
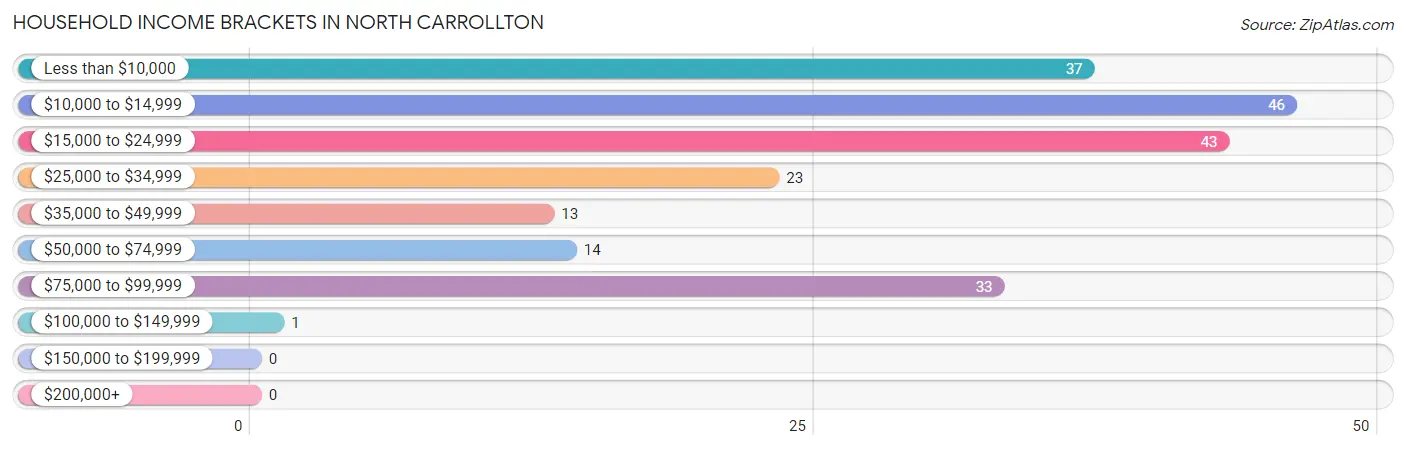
| Income Bracket | # Households | % Households |
| Less than $10,000 | 37 | 17.6% |
| $10,000 to $14,999 | 46 | 21.9% |
| $15,000 to $24,999 | 43 | 20.5% |
| $25,000 to $34,999 | 23 | 11.0% |
| $35,000 to $49,999 | 13 | 6.2% |
| $50,000 to $74,999 | 14 | 6.7% |
| $75,000 to $99,999 | 33 | 15.7% |
| $100,000 to $149,999 | 1 | 0.5% |
| $150,000 to $199,999 | 0 | 0.0% |
| $200,000+ | 0 | 0.0% |
Household Income by Householder Age in North Carrollton
The median household income in North Carrollton is $19,000, with the highest median household income of $30,761 found in the 45 to 64 years age bracket for the primary householder. A total of 78 households (37.1%) fall into this category. Meanwhile, the 15 to 24 years age bracket for the primary householder has the lowest median household income of $0, with 9 households (4.3%) in this group.
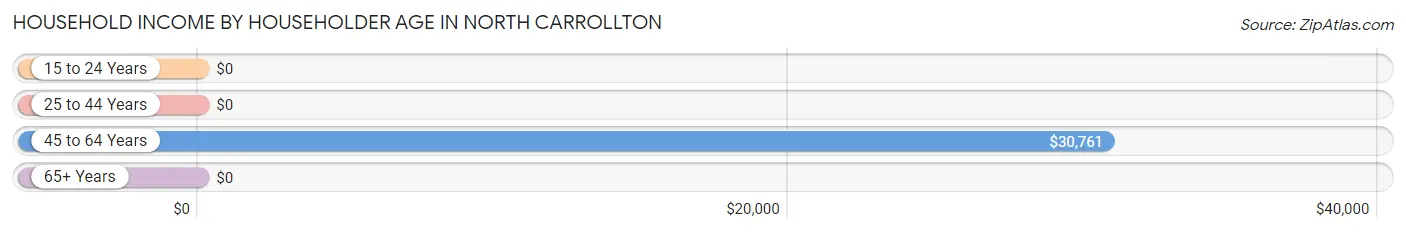
| Income Bracket | # Households | Median Income |
| 15 to 24 Years | 9 (4.3%) | $0 |
| 25 to 44 Years | 64 (30.5%) | $0 |
| 45 to 64 Years | 78 (37.1%) | $30,761 |
| 65+ Years | 59 (28.1%) | $0 |
| Total | 210 (100.0%) | $19,000 |
Poverty in North Carrollton
Income Below Poverty by Sex and Age in North Carrollton
With 25.0% poverty level for males and 52.3% for females among the residents of North Carrollton, under 5 year old males and under 5 year old females are the most vulnerable to poverty, with 29 males (100.0%) and 9 females (100.0%) in their respective age groups living below the poverty level.
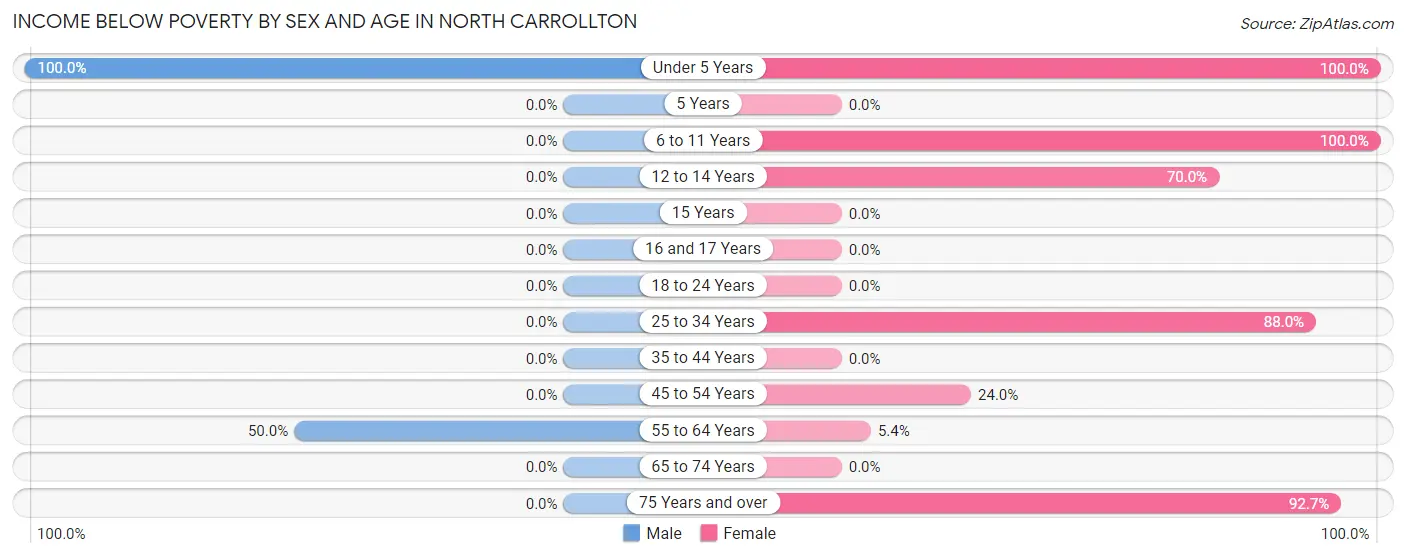
| Age Bracket | Male | Female |
| Under 5 Years | 29 (100.0%) | 9 (100.0%) |
| 5 Years | 0 (0.0%) | 0 (0.0%) |
| 6 to 11 Years | 0 (0.0%) | 7 (100.0%) |
| 12 to 14 Years | 0 (0.0%) | 7 (70.0%) |
| 15 Years | 0 (0.0%) | 0 (0.0%) |
| 16 and 17 Years | 0 (0.0%) | 0 (0.0%) |
| 18 to 24 Years | 0 (0.0%) | 0 (0.0%) |
| 25 to 34 Years | 0 (0.0%) | 44 (88.0%) |
| 35 to 44 Years | 0 (0.0%) | 0 (0.0%) |
| 45 to 54 Years | 0 (0.0%) | 6 (24.0%) |
| 55 to 64 Years | 16 (50.0%) | 2 (5.4%) |
| 65 to 74 Years | 0 (0.0%) | 0 (0.0%) |
| 75 Years and over | 0 (0.0%) | 38 (92.7%) |
| Total | 45 (25.0%) | 113 (52.3%) |
Income Above Poverty by Sex and Age in North Carrollton
According to the poverty statistics in North Carrollton, males aged 6 to 11 years and females aged 18 to 24 years are the age groups that are most secure financially, with 100.0% of males and 100.0% of females in these age groups living above the poverty line.
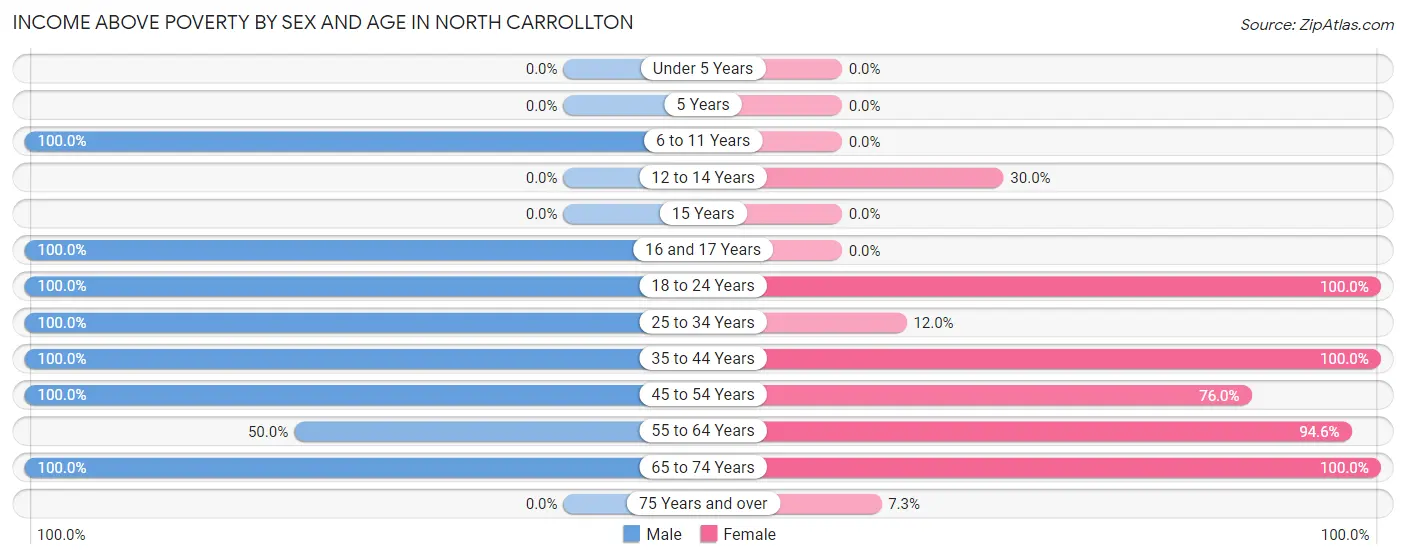
| Age Bracket | Male | Female |
| Under 5 Years | 0 (0.0%) | 0 (0.0%) |
| 5 Years | 0 (0.0%) | 0 (0.0%) |
| 6 to 11 Years | 10 (100.0%) | 0 (0.0%) |
| 12 to 14 Years | 0 (0.0%) | 3 (30.0%) |
| 15 Years | 0 (0.0%) | 0 (0.0%) |
| 16 and 17 Years | 24 (100.0%) | 0 (0.0%) |
| 18 to 24 Years | 9 (100.0%) | 26 (100.0%) |
| 25 to 34 Years | 8 (100.0%) | 6 (12.0%) |
| 35 to 44 Years | 37 (100.0%) | 6 (100.0%) |
| 45 to 54 Years | 7 (100.0%) | 19 (76.0%) |
| 55 to 64 Years | 16 (50.0%) | 35 (94.6%) |
| 65 to 74 Years | 24 (100.0%) | 5 (100.0%) |
| 75 Years and over | 0 (0.0%) | 3 (7.3%) |
| Total | 135 (75.0%) | 103 (47.7%) |
Income Below Poverty Among Married-Couple Families in North Carrollton
The poverty statistics for married-couple families in North Carrollton show that 2.1% or 1 of the total 47 families live below the poverty line. Families with no children have the highest poverty rate of 2.4%, comprising of 1 families. On the other hand, families with 3 or 4 children have the lowest poverty rate of 0.0%, which includes 0 families.
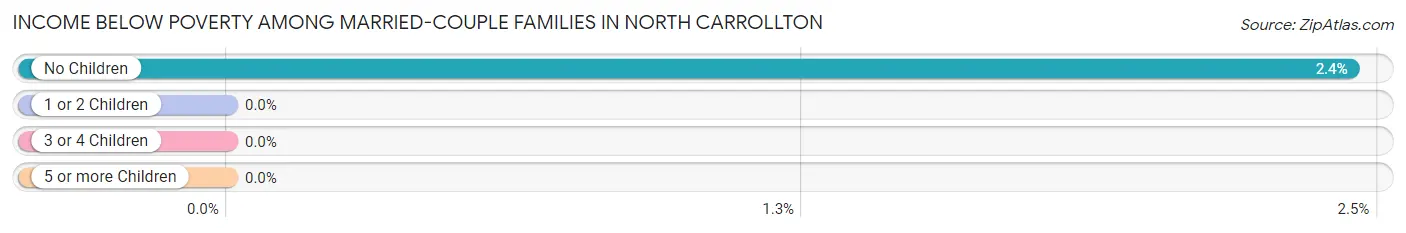
| Children | Above Poverty | Below Poverty |
| No Children | 40 (97.6%) | 1 (2.4%) |
| 1 or 2 Children | 0 (0.0%) | 0 (0.0%) |
| 3 or 4 Children | 6 (100.0%) | 0 (0.0%) |
| 5 or more Children | 0 (0.0%) | 0 (0.0%) |
| Total | 46 (97.9%) | 1 (2.1%) |
Income Below Poverty Among Single-Parent Households in North Carrollton
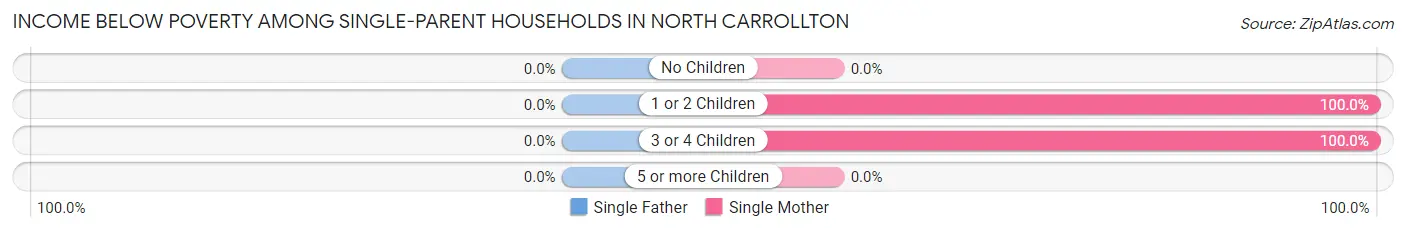
| Children | Single Father | Single Mother |
| No Children | 0 (0.0%) | 0 (0.0%) |
| 1 or 2 Children | 0 (0.0%) | 33 (100.0%) |
| 3 or 4 Children | 0 (0.0%) | 7 (100.0%) |
| 5 or more Children | 0 (0.0%) | 0 (0.0%) |
| Total | 0 (0.0%) | 40 (87.0%) |
Income Below Poverty Among Married-Couple vs Single-Parent Households in North Carrollton
The poverty data for North Carrollton shows that 1 of the married-couple family households (2.1%) and 40 of the single-parent households (85.1%) are living below the poverty level. Within the married-couple family households, those with no children have the highest poverty rate, with 1 households (2.4%) falling below the poverty line. Among the single-parent households, those with 3 or 4 children have the highest poverty rate, with 7 household (100.0%) living below poverty.
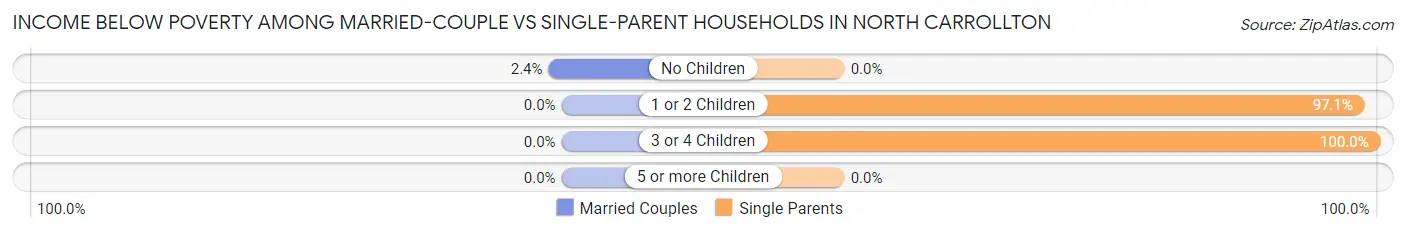
| Children | Married-Couple Families | Single-Parent Households |
| No Children | 1 (2.4%) | 0 (0.0%) |
| 1 or 2 Children | 0 (0.0%) | 33 (97.1%) |
| 3 or 4 Children | 0 (0.0%) | 7 (100.0%) |
| 5 or more Children | 0 (0.0%) | 0 (0.0%) |
| Total | 1 (2.1%) | 40 (85.1%) |
Race in North Carrollton
The most populous races in North Carrollton are White / Caucasian (262 | 65.8%), and Black / African American (136 | 34.2%).
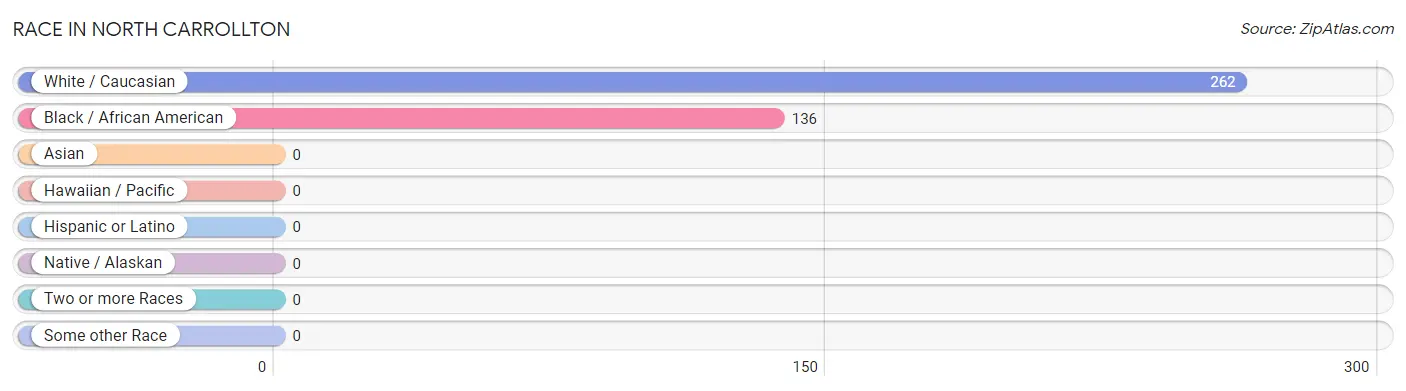
| Race | # Population | % Population |
| Asian | 0 | 0.0% |
| Black / African American | 136 | 34.2% |
| Hawaiian / Pacific | 0 | 0.0% |
| Hispanic or Latino | 0 | 0.0% |
| Native / Alaskan | 0 | 0.0% |
| White / Caucasian | 262 | 65.8% |
| Two or more Races | 0 | 0.0% |
| Some other Race | 0 | 0.0% |
| Total | 398 | 100.0% |
Ancestry in North Carrollton
The most populous ancestries reported in North Carrollton are American (44 | 11.1%), and English (1 | 0.3%), together accounting for 11.3% of all North Carrollton residents.
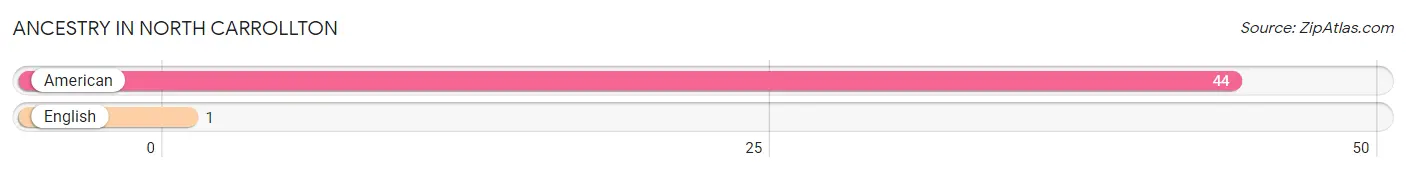
| Ancestry | # Population | % Population |
| American | 44 | 11.1% |
| English | 1 | 0.3% | View All 2 Rows |
Immigrants in North Carrollton

| Immigration Origin | # Population | % Population | View All 0 Rows |
Sex and Age in North Carrollton
Sex and Age in North Carrollton
The most populous age groups in North Carrollton are Under 5 Years (29 | 15.9%) for men and 25 to 29 Years (33 | 15.3%) for women.
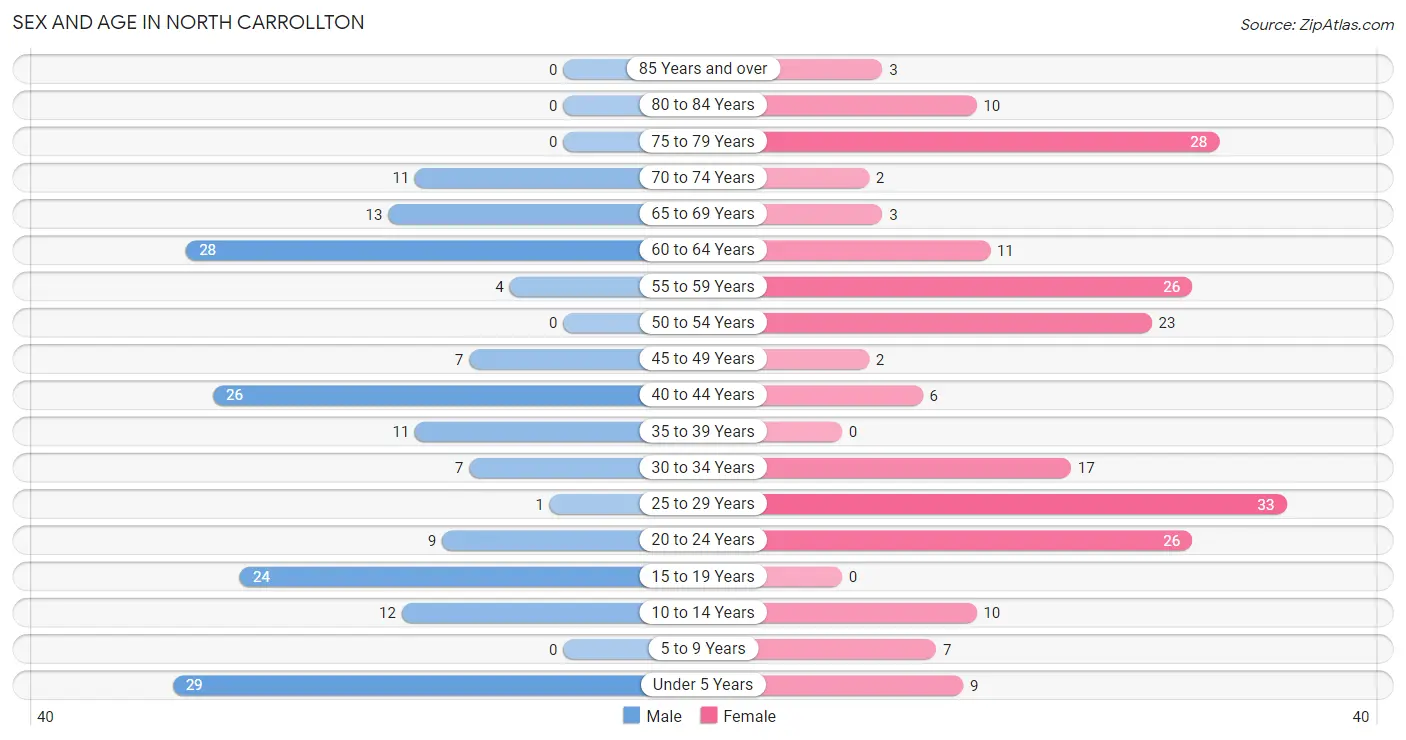
| Age Bracket | Male | Female |
| Under 5 Years | 29 (15.9%) | 9 (4.2%) |
| 5 to 9 Years | 0 (0.0%) | 7 (3.2%) |
| 10 to 14 Years | 12 (6.6%) | 10 (4.6%) |
| 15 to 19 Years | 24 (13.2%) | 0 (0.0%) |
| 20 to 24 Years | 9 (5.0%) | 26 (12.0%) |
| 25 to 29 Years | 1 (0.5%) | 33 (15.3%) |
| 30 to 34 Years | 7 (3.8%) | 17 (7.9%) |
| 35 to 39 Years | 11 (6.0%) | 0 (0.0%) |
| 40 to 44 Years | 26 (14.3%) | 6 (2.8%) |
| 45 to 49 Years | 7 (3.8%) | 2 (0.9%) |
| 50 to 54 Years | 0 (0.0%) | 23 (10.6%) |
| 55 to 59 Years | 4 (2.2%) | 26 (12.0%) |
| 60 to 64 Years | 28 (15.4%) | 11 (5.1%) |
| 65 to 69 Years | 13 (7.1%) | 3 (1.4%) |
| 70 to 74 Years | 11 (6.0%) | 2 (0.9%) |
| 75 to 79 Years | 0 (0.0%) | 28 (13.0%) |
| 80 to 84 Years | 0 (0.0%) | 10 (4.6%) |
| 85 Years and over | 0 (0.0%) | 3 (1.4%) |
| Total | 182 (100.0%) | 216 (100.0%) |
Families and Households in North Carrollton
Median Family Size in North Carrollton
The median family size in North Carrollton is 2.94 persons per family, with single male/father families (1 | 1.1%) accounting for the largest median family size of 11 persons per family. On the other hand, single female/mother families (46 | 48.9%) represent the smallest median family size with 2.50 persons per family.
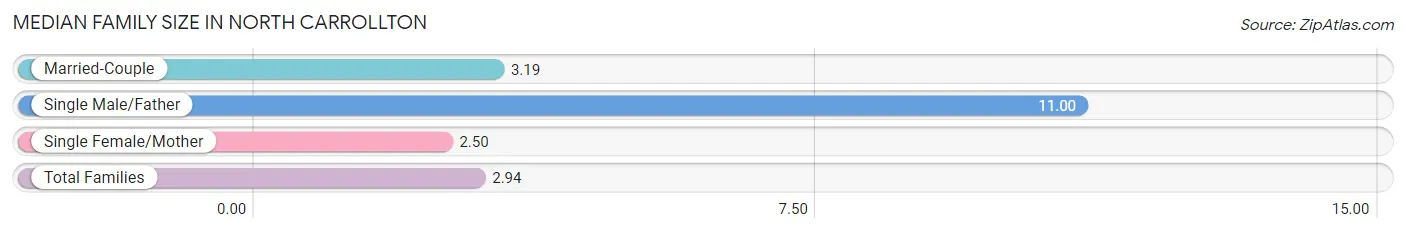
| Family Type | # Families | Family Size |
| Married-Couple | 47 (50.0%) | 3.19 |
| Single Male/Father | 1 (1.1%) | 11.00 |
| Single Female/Mother | 46 (48.9%) | 2.50 |
| Total Families | 94 (100.0%) | 2.94 |
Median Household Size in North Carrollton
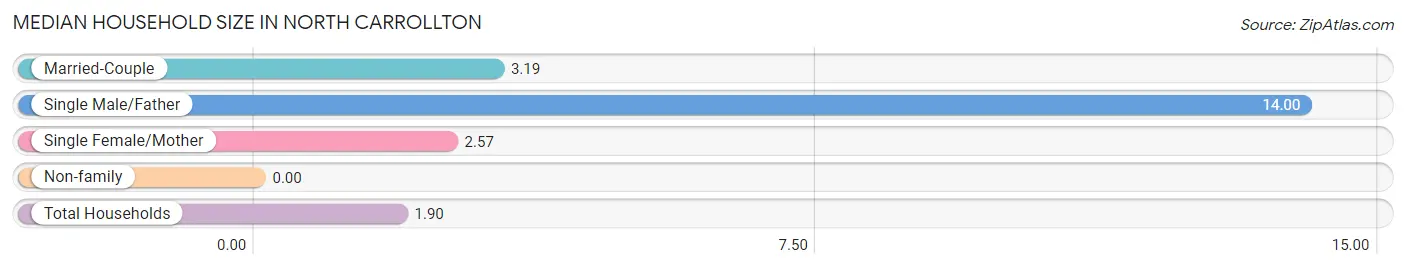
| Household Type | # Households | Household Size |
| Married-Couple | 47 (22.4%) | 3.19 |
| Single Male/Father | 1 (0.5%) | 14.00 |
| Single Female/Mother | 46 (21.9%) | 2.57 |
| Non-family | 116 (55.2%) | - |
| Total Households | 210 (100.0%) | 1.90 |
Household Size by Marriage Status in North Carrollton
Out of a total of 210 households in North Carrollton, 94 (44.8%) are family households, while 116 (55.2%) are nonfamily households. The most numerous type of family households are 2-person households, comprising 53, and the most common type of nonfamily households are 1-person households, comprising 116.
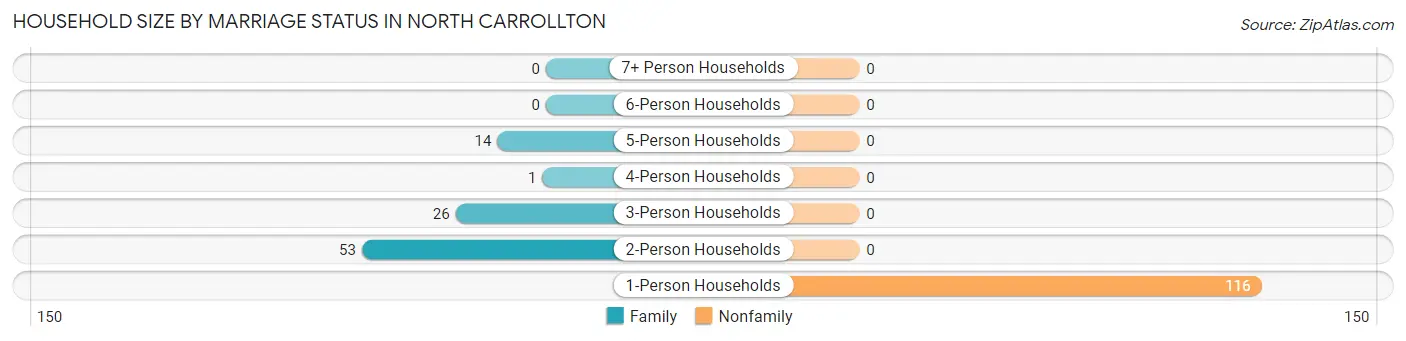
| Household Size | Family Households | Nonfamily Households |
| 1-Person Households | - | 116 (55.2%) |
| 2-Person Households | 53 (25.2%) | 0 (0.0%) |
| 3-Person Households | 26 (12.4%) | 0 (0.0%) |
| 4-Person Households | 1 (0.5%) | 0 (0.0%) |
| 5-Person Households | 14 (6.7%) | 0 (0.0%) |
| 6-Person Households | 0 (0.0%) | 0 (0.0%) |
| 7+ Person Households | 0 (0.0%) | 0 (0.0%) |
| Total | 94 (44.8%) | 116 (55.2%) |
Female Fertility in North Carrollton
Fertility by Age in North Carrollton
| Age Bracket | Women with Births | Births / 1,000 Women |
| 15 to 19 years | 0 (0.0%) | 0.0 |
| 20 to 34 years | 0 (0.0%) | 0.0 |
| 35 to 50 years | 0 (0.0%) | 0.0 |
| Total | 0 (0.0%) | 0.0 |
Fertility by Age by Marriage Status in North Carrollton
| Age Bracket | Married | Unmarried |
| 15 to 19 years | 0 (0.0%) | 0 (0.0%) |
| 20 to 34 years | 0 (0.0%) | 0 (0.0%) |
| 35 to 50 years | 0 (0.0%) | 0 (0.0%) |
| Total | 0 (0.0%) | 0 (0.0%) |
Fertility by Education in North Carrollton
| Educational Attainment | Women with Births | Births / 1,000 Women |
| Less than High School | 0 (0.0%) | 0.0 |
| High School Diploma | 0 (0.0%) | 0.0 |
| College or Associate's Degree | 0 (0.0%) | 0.0 |
| Bachelor's Degree | 0 (0.0%) | 0.0 |
| Graduate Degree | 0 (0.0%) | 0.0 |
| Total | 0 (0.0%) | 0.0 |
Fertility by Education by Marriage Status in North Carrollton
| Educational Attainment | Married | Unmarried |
| Less than High School | 0 (0.0%) | 0 (0.0%) |
| High School Diploma | 0 (0.0%) | 0 (0.0%) |
| College or Associate's Degree | 0 (0.0%) | 0 (0.0%) |
| Bachelor's Degree | 0 (0.0%) | 0 (0.0%) |
| Graduate Degree | 0 (0.0%) | 0 (0.0%) |
| Total | 0 (0.0%) | 0 (0.0%) |
Employment Characteristics in North Carrollton
Employment by Class of Employer in North Carrollton
Among the 131 employed individuals in North Carrollton, private company employees (71 | 54.2%), state government employees (25 | 19.1%), and local government employees (10 | 7.6%) make up the most common classes of employment.
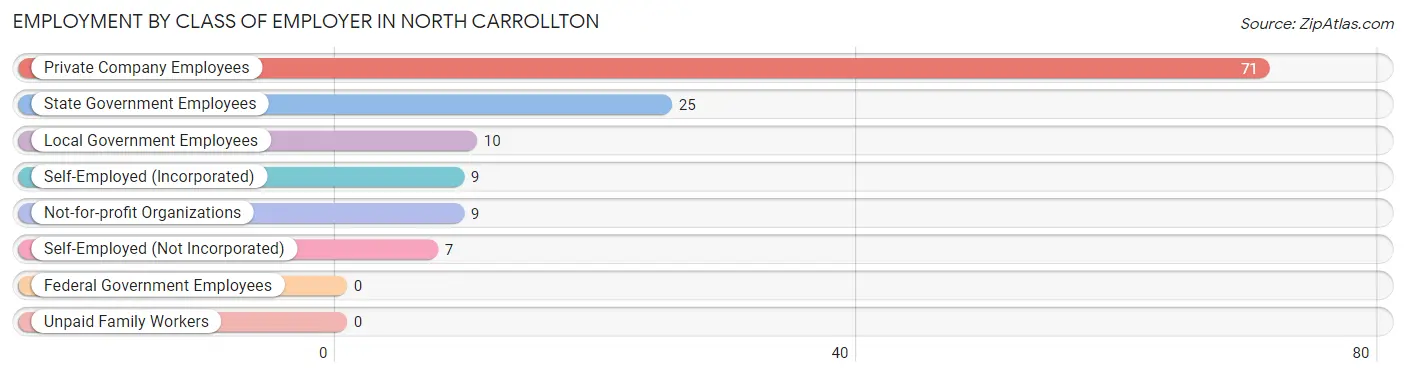
| Employer Class | # Employees | % Employees |
| Private Company Employees | 71 | 54.2% |
| Self-Employed (Incorporated) | 9 | 6.9% |
| Self-Employed (Not Incorporated) | 7 | 5.3% |
| Not-for-profit Organizations | 9 | 6.9% |
| Local Government Employees | 10 | 7.6% |
| State Government Employees | 25 | 19.1% |
| Federal Government Employees | 0 | 0.0% |
| Unpaid Family Workers | 0 | 0.0% |
| Total | 131 | 100.0% |
Employment Status by Age in North Carrollton
According to the labor force statistics for North Carrollton, out of the total population over 16 years of age (331), 40.5% or 134 individuals are in the labor force, with 2.2% or 3 of them unemployed. The age group with the highest labor force participation rate is 30 to 34 years, with 100.0% or 24 individuals in the labor force. Within the labor force, the 30 to 34 years age range has the highest percentage of unemployed individuals, with 12.5% or 3 of them being unemployed.
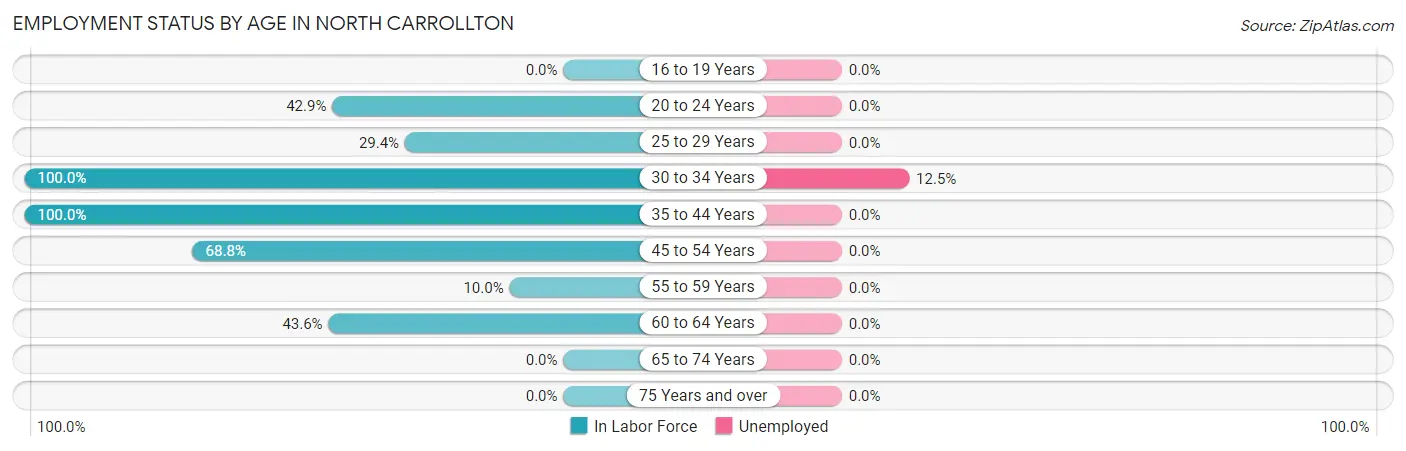
| Age Bracket | In Labor Force | Unemployed |
| 16 to 19 Years | 0 (0.0%) | 0 (0.0%) |
| 20 to 24 Years | 15 (42.9%) | 0 (0.0%) |
| 25 to 29 Years | 10 (29.4%) | 0 (0.0%) |
| 30 to 34 Years | 24 (100.0%) | 3 (12.5%) |
| 35 to 44 Years | 43 (100.0%) | 0 (0.0%) |
| 45 to 54 Years | 22 (68.8%) | 0 (0.0%) |
| 55 to 59 Years | 3 (10.0%) | 0 (0.0%) |
| 60 to 64 Years | 17 (43.6%) | 0 (0.0%) |
| 65 to 74 Years | 0 (0.0%) | 0 (0.0%) |
| 75 Years and over | 0 (0.0%) | 0 (0.0%) |
| Total | 134 (40.5%) | 3 (2.2%) |
Employment Status by Educational Attainment in North Carrollton
According to labor force statistics for North Carrollton, 58.9% of individuals (119) out of the total population between 25 and 64 years of age (202) are in the labor force, with 2.5% or 3 of them being unemployed. The group with the highest labor force participation rate are those with the educational attainment of college / associate degree, with 100.0% or 46 individuals in the labor force. Within the labor force, individuals with less than high school education have the highest percentage of unemployment, with 13.0% or 3 of them being unemployed.
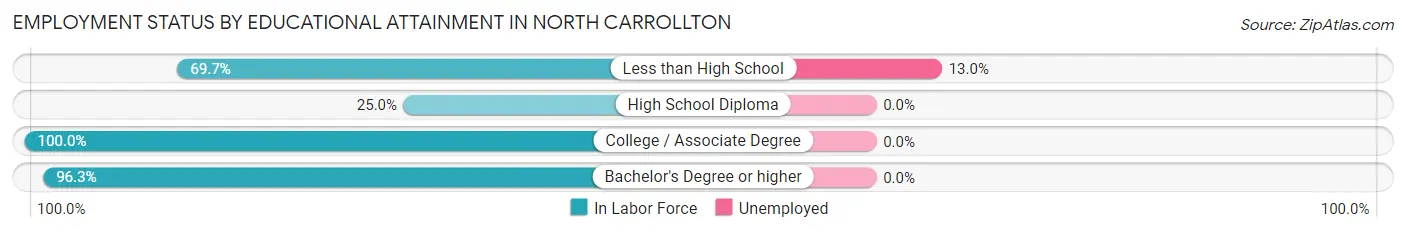
| Educational Attainment | In Labor Force | Unemployed |
| Less than High School | 23 (69.7%) | 4 (13.0%) |
| High School Diploma | 24 (25.0%) | 0 (0.0%) |
| College / Associate Degree | 46 (100.0%) | 0 (0.0%) |
| Bachelor's Degree or higher | 26 (96.3%) | 0 (0.0%) |
| Total | 119 (58.9%) | 5 (2.5%) |
Employment Occupations by Sex in North Carrollton
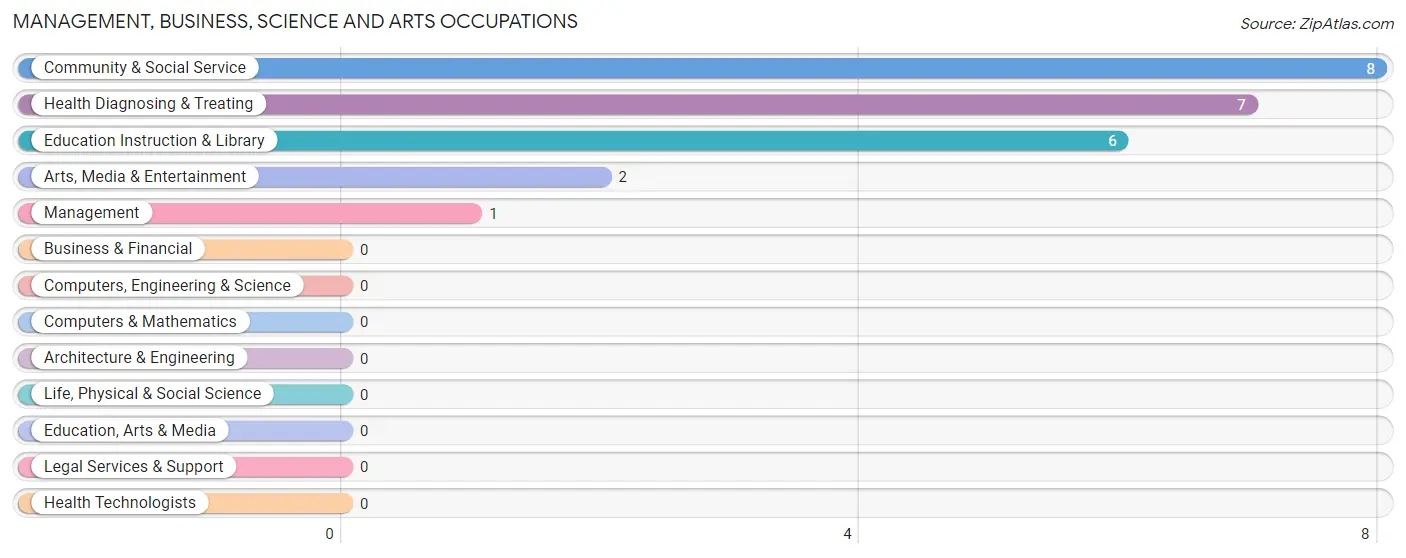
Management, Business, Science and Arts Occupations
The most common Management, Business, Science and Arts occupations in North Carrollton are Community & Social Service (8 | 6.1%), Health Diagnosing & Treating (7 | 5.3%), Education Instruction & Library (6 | 4.6%), Arts, Media & Entertainment (2 | 1.5%), and Management (1 | 0.8%).
Management, Business, Science and Arts Occupations by Sex
Within the Management, Business, Science and Arts occupations in North Carrollton, the most male-oriented occupations are Management (100.0%), and Health Diagnosing & Treating (100.0%), while the most female-oriented occupations are Community & Social Service (100.0%), Education Instruction & Library (100.0%), and Arts, Media & Entertainment (100.0%).
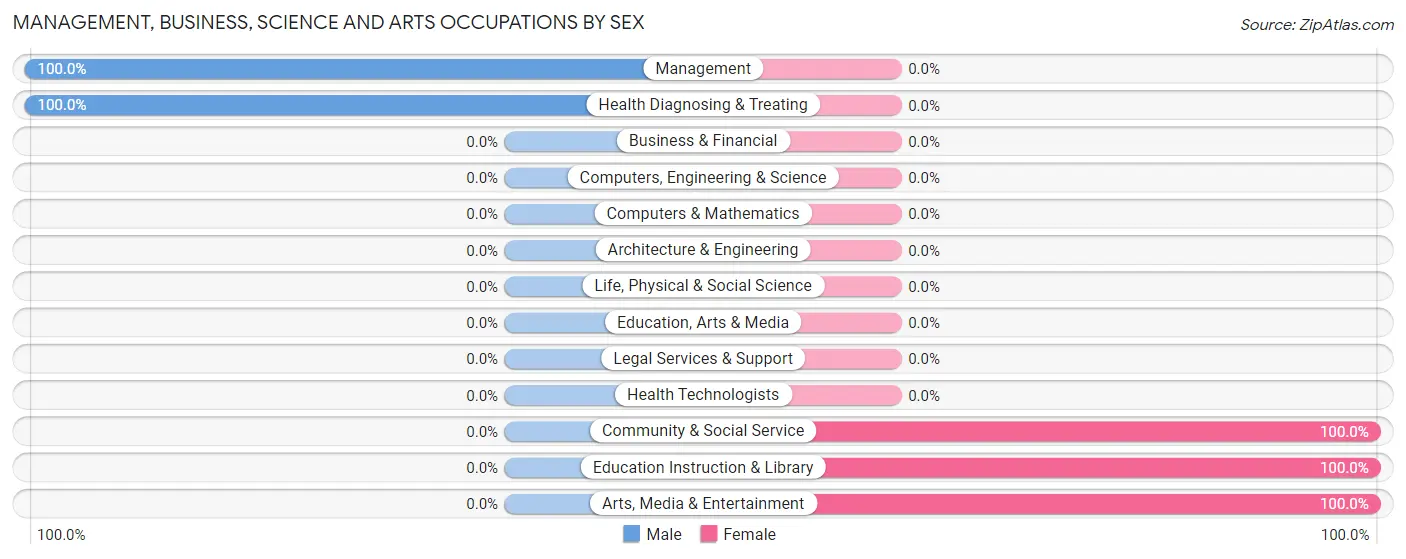
| Occupation | Male | Female |
| Management | 1 (100.0%) | 0 (0.0%) |
| Business & Financial | 0 (0.0%) | 0 (0.0%) |
| Computers, Engineering & Science | 0 (0.0%) | 0 (0.0%) |
| Computers & Mathematics | 0 (0.0%) | 0 (0.0%) |
| Architecture & Engineering | 0 (0.0%) | 0 (0.0%) |
| Life, Physical & Social Science | 0 (0.0%) | 0 (0.0%) |
| Community & Social Service | 0 (0.0%) | 8 (100.0%) |
| Education, Arts & Media | 0 (0.0%) | 0 (0.0%) |
| Legal Services & Support | 0 (0.0%) | 0 (0.0%) |
| Education Instruction & Library | 0 (0.0%) | 6 (100.0%) |
| Arts, Media & Entertainment | 0 (0.0%) | 2 (100.0%) |
| Health Diagnosing & Treating | 7 (100.0%) | 0 (0.0%) |
| Health Technologists | 0 (0.0%) | 0 (0.0%) |
| Total (Category) | 8 (50.0%) | 8 (50.0%) |
| Total (Overall) | 68 (51.9%) | 63 (48.1%) |
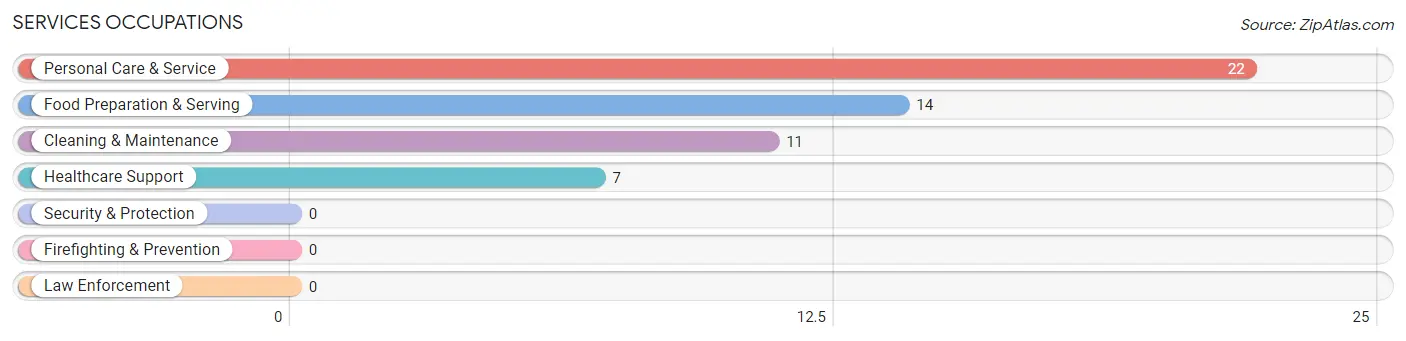
Services Occupations
The most common Services occupations in North Carrollton are Personal Care & Service (22 | 16.8%), Food Preparation & Serving (14 | 10.7%), Cleaning & Maintenance (11 | 8.4%), and Healthcare Support (7 | 5.3%).
Services Occupations by Sex
Within the Services occupations in North Carrollton, the most male-oriented occupations are Cleaning & Maintenance (100.0%), and Personal Care & Service (54.5%), while the most female-oriented occupations are Healthcare Support (100.0%), Food Preparation & Serving (100.0%), and Personal Care & Service (45.5%).
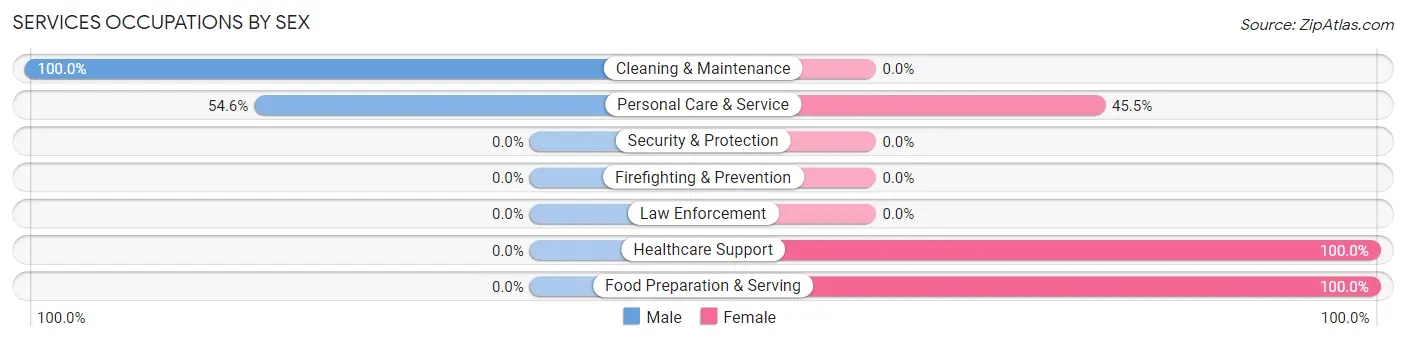
| Occupation | Male | Female |
| Healthcare Support | 0 (0.0%) | 7 (100.0%) |
| Security & Protection | 0 (0.0%) | 0 (0.0%) |
| Firefighting & Prevention | 0 (0.0%) | 0 (0.0%) |
| Law Enforcement | 0 (0.0%) | 0 (0.0%) |
| Food Preparation & Serving | 0 (0.0%) | 14 (100.0%) |
| Cleaning & Maintenance | 11 (100.0%) | 0 (0.0%) |
| Personal Care & Service | 12 (54.5%) | 10 (45.5%) |
| Total (Category) | 23 (42.6%) | 31 (57.4%) |
| Total (Overall) | 68 (51.9%) | 63 (48.1%) |
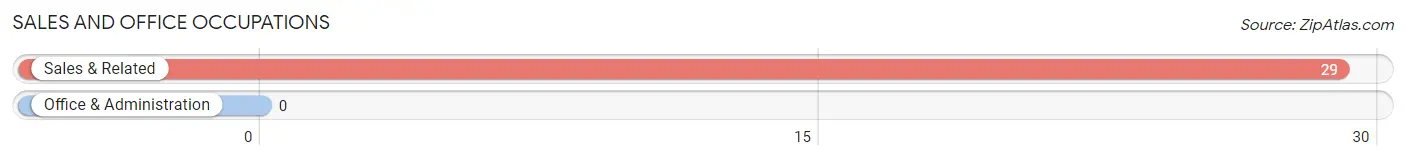
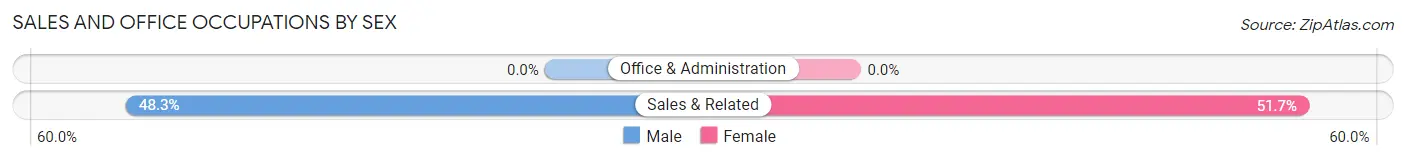
Sales and Office Occupations
The most common Sales and Office occupations in North Carrollton are , and Sales & Related (29 | 22.1%).
Sales and Office Occupations by Sex
| Occupation | Male | Female |
| Sales & Related | 14 (48.3%) | 15 (51.7%) |
| Office & Administration | 0 (0.0%) | 0 (0.0%) |
| Total (Category) | 14 (48.3%) | 15 (51.7%) |
| Total (Overall) | 68 (51.9%) | 63 (48.1%) |
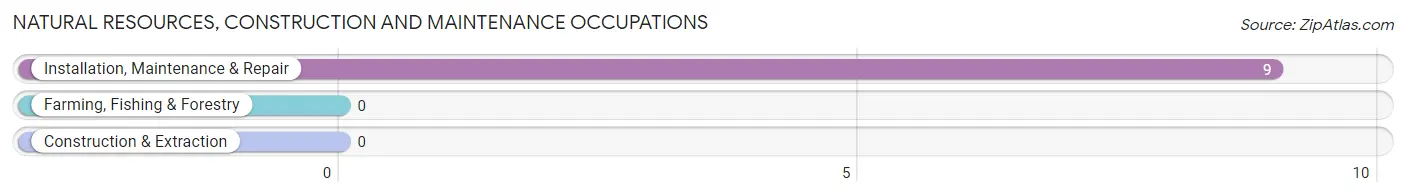
Natural Resources, Construction and Maintenance Occupations
The most common Natural Resources, Construction and Maintenance occupations in North Carrollton are , and Installation, Maintenance & Repair (9 | 6.9%).
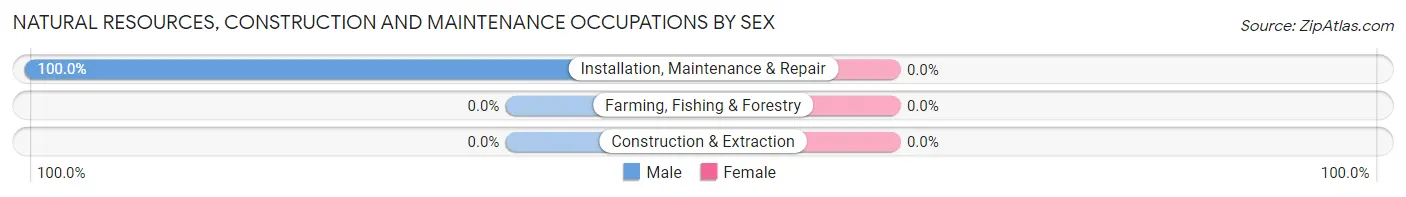
Natural Resources, Construction and Maintenance Occupations by Sex
| Occupation | Male | Female |
| Farming, Fishing & Forestry | 0 (0.0%) | 0 (0.0%) |
| Construction & Extraction | 0 (0.0%) | 0 (0.0%) |
| Installation, Maintenance & Repair | 9 (100.0%) | 0 (0.0%) |
| Total (Category) | 9 (100.0%) | 0 (0.0%) |
| Total (Overall) | 68 (51.9%) | 63 (48.1%) |
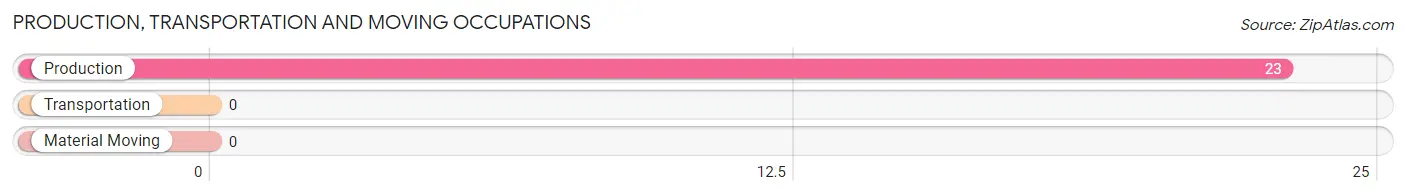
Production, Transportation and Moving Occupations
The most common Production, Transportation and Moving occupations in North Carrollton are , and Production (23 | 17.6%).
Production, Transportation and Moving Occupations by Sex
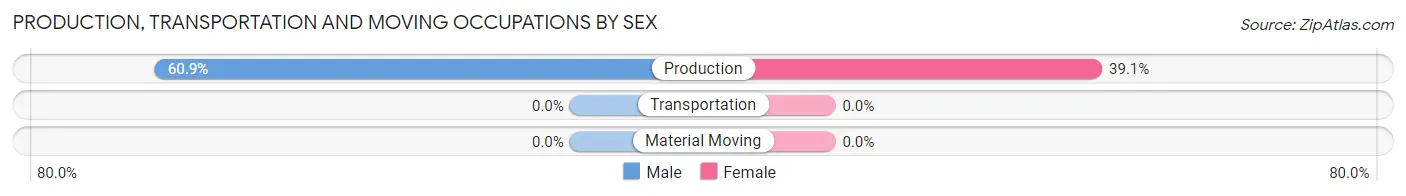
| Occupation | Male | Female |
| Production | 14 (60.9%) | 9 (39.1%) |
| Transportation | 0 (0.0%) | 0 (0.0%) |
| Material Moving | 0 (0.0%) | 0 (0.0%) |
| Total (Category) | 14 (60.9%) | 9 (39.1%) |
| Total (Overall) | 68 (51.9%) | 63 (48.1%) |
Employment Industries by Sex in North Carrollton
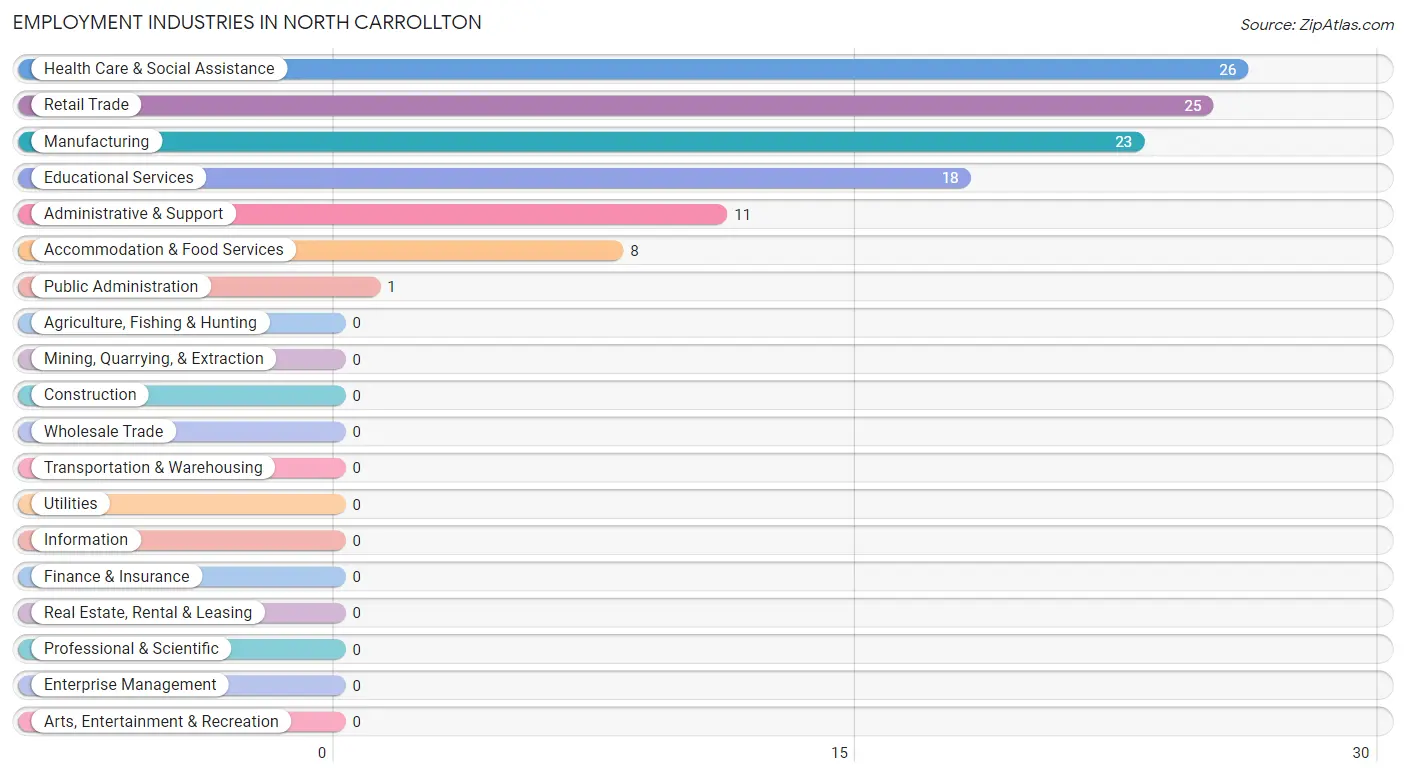
Employment Industries in North Carrollton
The major employment industries in North Carrollton include Health Care & Social Assistance (26 | 19.9%), Retail Trade (25 | 19.1%), Manufacturing (23 | 17.6%), Educational Services (18 | 13.7%), and Administrative & Support (11 | 8.4%).
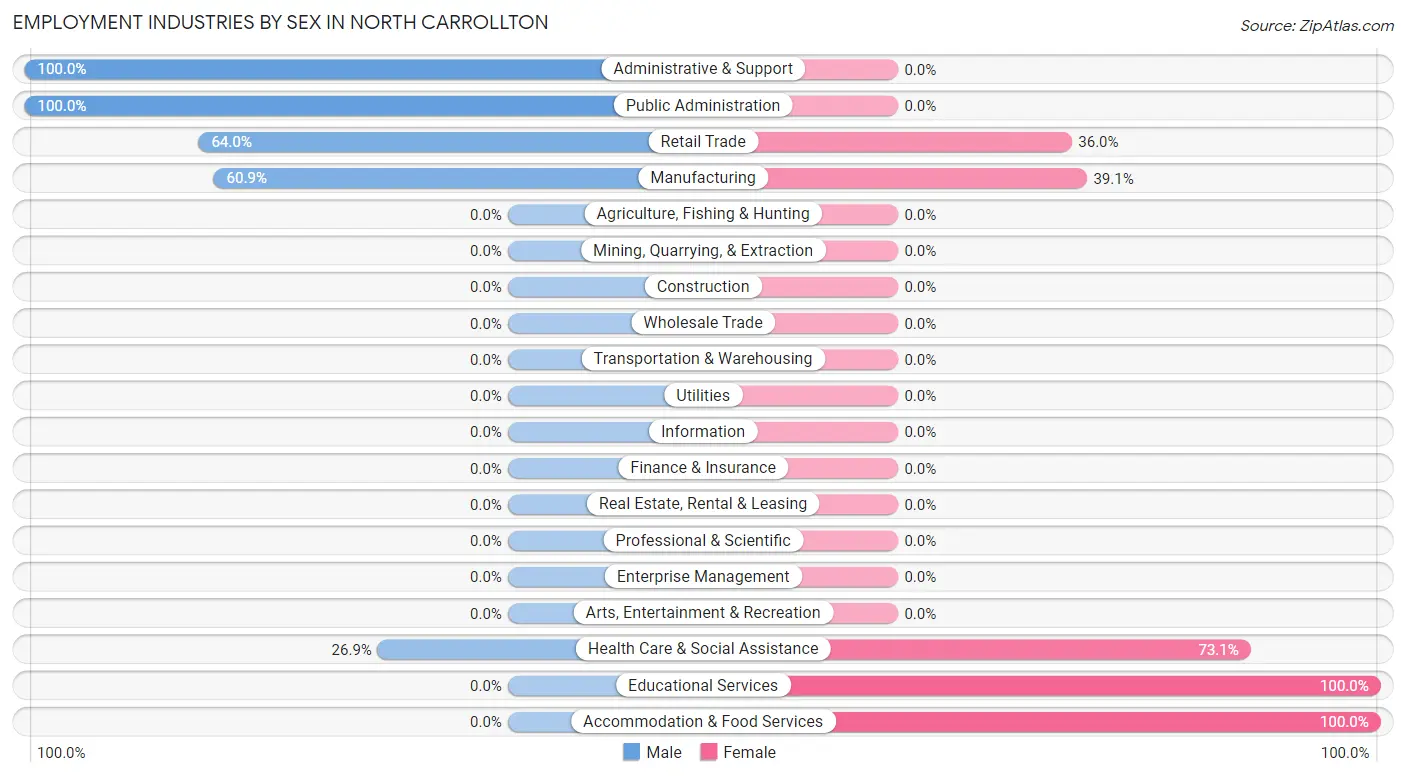
Employment Industries by Sex in North Carrollton
The North Carrollton industries that see more men than women are Administrative & Support (100.0%), Public Administration (100.0%), and Retail Trade (64.0%), whereas the industries that tend to have a higher number of women are Educational Services (100.0%), Accommodation & Food Services (100.0%), and Health Care & Social Assistance (73.1%).
| Industry | Male | Female |
| Agriculture, Fishing & Hunting | 0 (0.0%) | 0 (0.0%) |
| Mining, Quarrying, & Extraction | 0 (0.0%) | 0 (0.0%) |
| Construction | 0 (0.0%) | 0 (0.0%) |
| Manufacturing | 14 (60.9%) | 9 (39.1%) |
| Wholesale Trade | 0 (0.0%) | 0 (0.0%) |
| Retail Trade | 16 (64.0%) | 9 (36.0%) |
| Transportation & Warehousing | 0 (0.0%) | 0 (0.0%) |
| Utilities | 0 (0.0%) | 0 (0.0%) |
| Information | 0 (0.0%) | 0 (0.0%) |
| Finance & Insurance | 0 (0.0%) | 0 (0.0%) |
| Real Estate, Rental & Leasing | 0 (0.0%) | 0 (0.0%) |
| Professional & Scientific | 0 (0.0%) | 0 (0.0%) |
| Enterprise Management | 0 (0.0%) | 0 (0.0%) |
| Administrative & Support | 11 (100.0%) | 0 (0.0%) |
| Educational Services | 0 (0.0%) | 18 (100.0%) |
| Health Care & Social Assistance | 7 (26.9%) | 19 (73.1%) |
| Arts, Entertainment & Recreation | 0 (0.0%) | 0 (0.0%) |
| Accommodation & Food Services | 0 (0.0%) | 8 (100.0%) |
| Public Administration | 1 (100.0%) | 0 (0.0%) |
| Total | 68 (51.9%) | 63 (48.1%) |
Education in North Carrollton
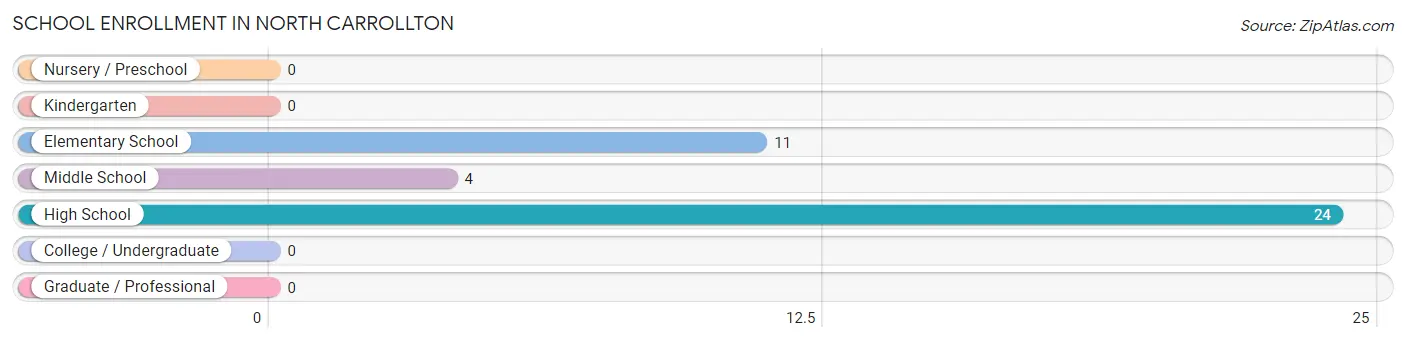
School Enrollment in North Carrollton
The most common levels of schooling among the 39 students in North Carrollton are high school (24 | 61.5%), elementary school (11 | 28.2%), and middle school (4 | 10.3%).
| School Level | # Students | % Students |
| Nursery / Preschool | 0 | 0.0% |
| Kindergarten | 0 | 0.0% |
| Elementary School | 11 | 28.2% |
| Middle School | 4 | 10.3% |
| High School | 24 | 61.5% |
| College / Undergraduate | 0 | 0.0% |
| Graduate / Professional | 0 | 0.0% |
| Total | 39 | 100.0% |
School Enrollment by Age by Funding Source in North Carrollton
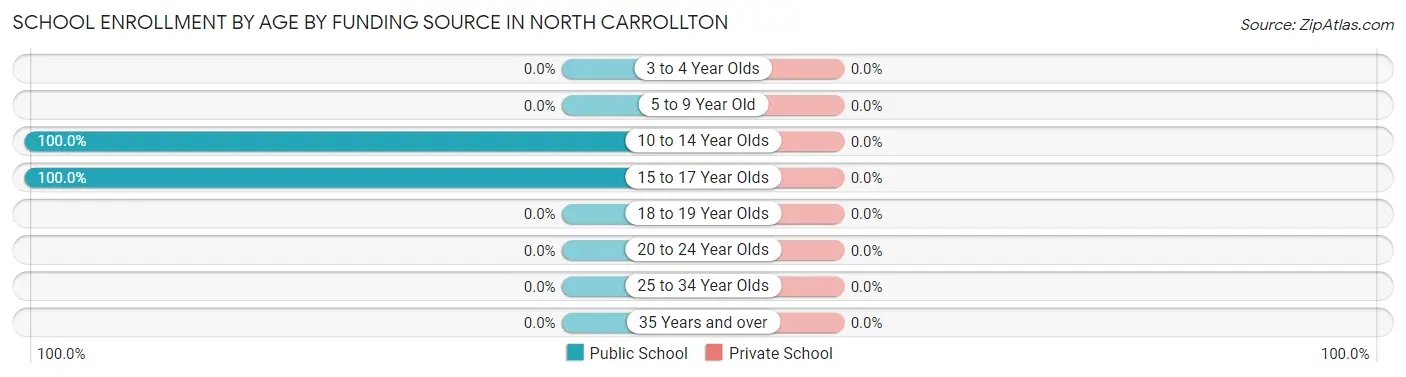
| Age Bracket | Public School | Private School |
| 3 to 4 Year Olds | 0 (0.0%) | 0 (0.0%) |
| 5 to 9 Year Old | 0 (0.0%) | 0 (0.0%) |
| 10 to 14 Year Olds | 15 (100.0%) | 0 (0.0%) |
| 15 to 17 Year Olds | 24 (100.0%) | 0 (0.0%) |
| 18 to 19 Year Olds | 0 (0.0%) | 0 (0.0%) |
| 20 to 24 Year Olds | 0 (0.0%) | 0 (0.0%) |
| 25 to 34 Year Olds | 0 (0.0%) | 0 (0.0%) |
| 35 Years and over | 0 (0.0%) | 0 (0.0%) |
| Total | 39 (100.0%) | 0 (0.0%) |
Educational Attainment by Field of Study in North Carrollton
Liberal arts & history (17 | 63.0%), business (9 | 33.3%), and bio, nature & agricultural (1 | 3.7%) are the most common fields of study among 27 individuals in North Carrollton who have obtained a bachelor's degree or higher.
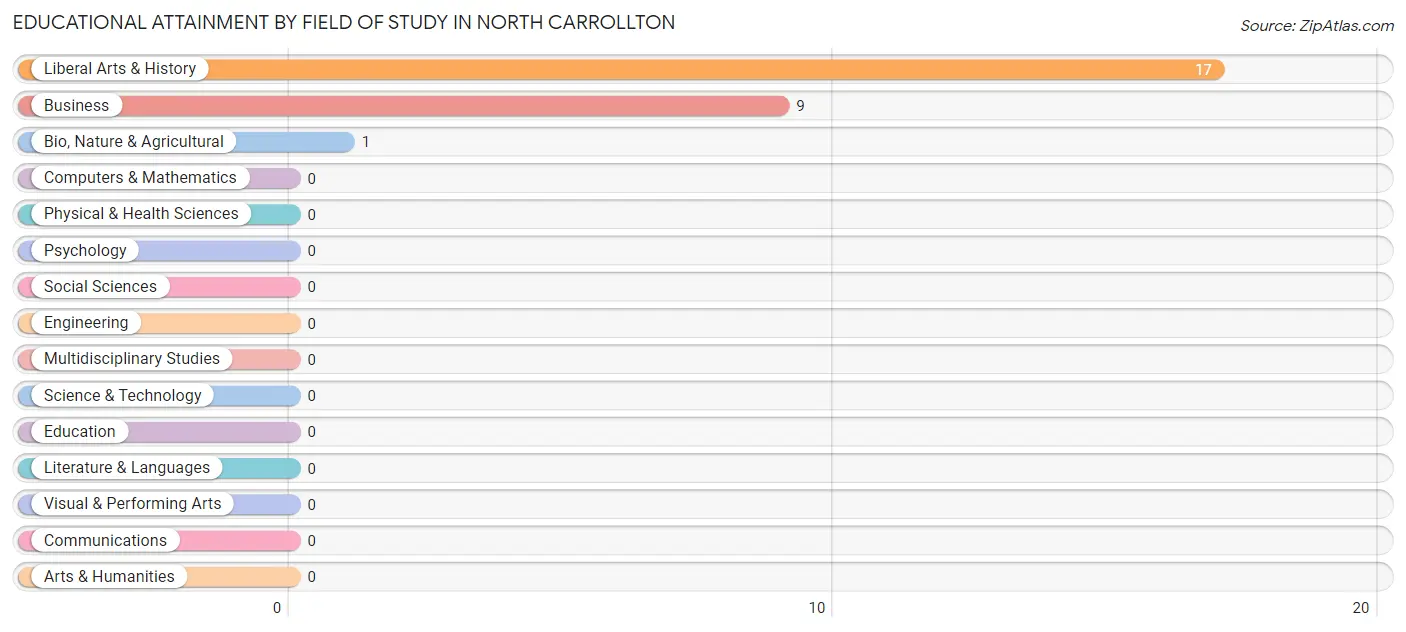
| Field of Study | # Graduates | % Graduates |
| Computers & Mathematics | 0 | 0.0% |
| Bio, Nature & Agricultural | 1 | 3.7% |
| Physical & Health Sciences | 0 | 0.0% |
| Psychology | 0 | 0.0% |
| Social Sciences | 0 | 0.0% |
| Engineering | 0 | 0.0% |
| Multidisciplinary Studies | 0 | 0.0% |
| Science & Technology | 0 | 0.0% |
| Business | 9 | 33.3% |
| Education | 0 | 0.0% |
| Literature & Languages | 0 | 0.0% |
| Liberal Arts & History | 17 | 63.0% |
| Visual & Performing Arts | 0 | 0.0% |
| Communications | 0 | 0.0% |
| Arts & Humanities | 0 | 0.0% |
| Total | 27 | 100.0% |
Transportation & Commute in North Carrollton
Vehicle Availability by Sex in North Carrollton
The most prevalent vehicle ownership categories in North Carrollton are males with 3 vehicles (26, accounting for 38.2%) and females with 3 vehicles (0, making up 41.3%).
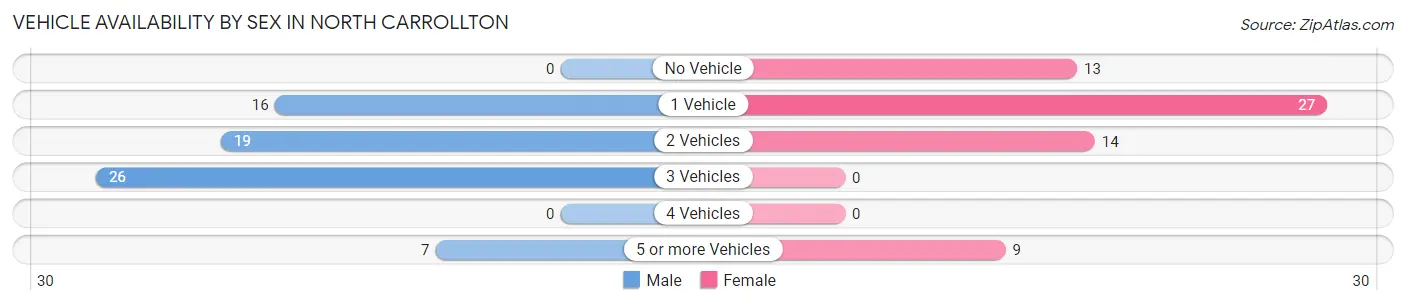
| Vehicles Available | Male | Female |
| No Vehicle | 0 (0.0%) | 13 (20.6%) |
| 1 Vehicle | 16 (23.5%) | 27 (42.9%) |
| 2 Vehicles | 19 (27.9%) | 14 (22.2%) |
| 3 Vehicles | 26 (38.2%) | 0 (0.0%) |
| 4 Vehicles | 0 (0.0%) | 0 (0.0%) |
| 5 or more Vehicles | 7 (10.3%) | 9 (14.3%) |
| Total | 68 (100.0%) | 63 (100.0%) |
Commute Time in North Carrollton
The most frequently occuring commute durations in North Carrollton are 10 to 14 minutes (26 commuters, 20.2%), 20 to 24 minutes (22 commuters, 17.1%), and 30 to 34 minutes (22 commuters, 17.1%).
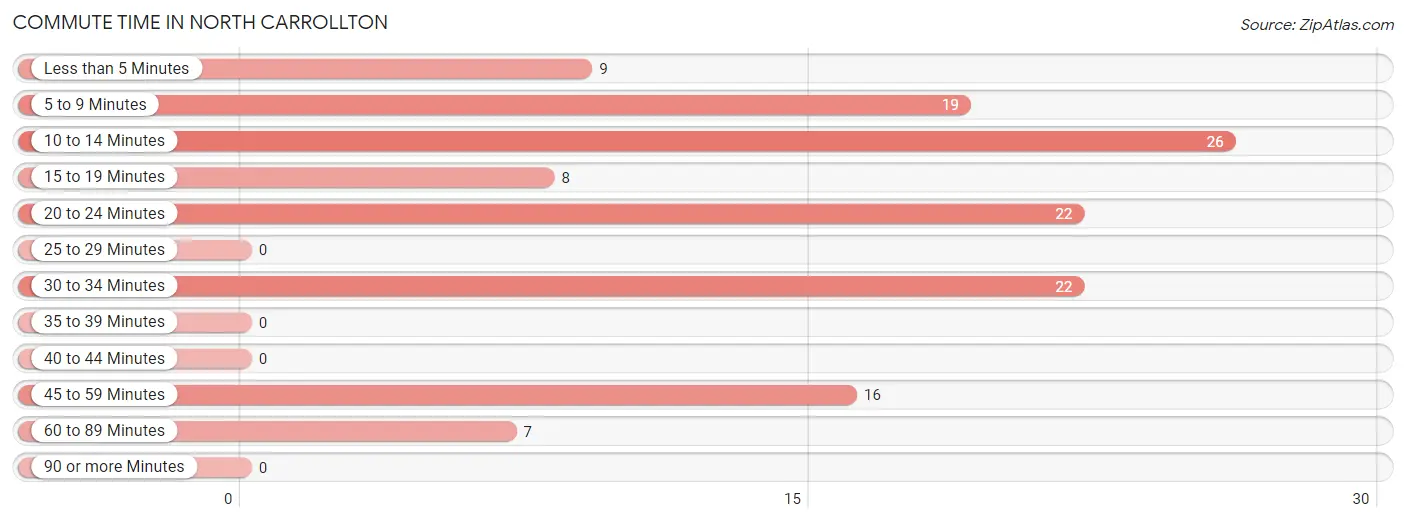
| Commute Time | # Commuters | % Commuters |
| Less than 5 Minutes | 9 | 7.0% |
| 5 to 9 Minutes | 19 | 14.7% |
| 10 to 14 Minutes | 26 | 20.2% |
| 15 to 19 Minutes | 8 | 6.2% |
| 20 to 24 Minutes | 22 | 17.1% |
| 25 to 29 Minutes | 0 | 0.0% |
| 30 to 34 Minutes | 22 | 17.1% |
| 35 to 39 Minutes | 0 | 0.0% |
| 40 to 44 Minutes | 0 | 0.0% |
| 45 to 59 Minutes | 16 | 12.4% |
| 60 to 89 Minutes | 7 | 5.4% |
| 90 or more Minutes | 0 | 0.0% |
Commute Time by Sex in North Carrollton
The most common commute times in North Carrollton are 10 to 14 minutes (20 commuters, 29.4%) for males and 5 to 9 minutes (12 commuters, 19.7%) for females.
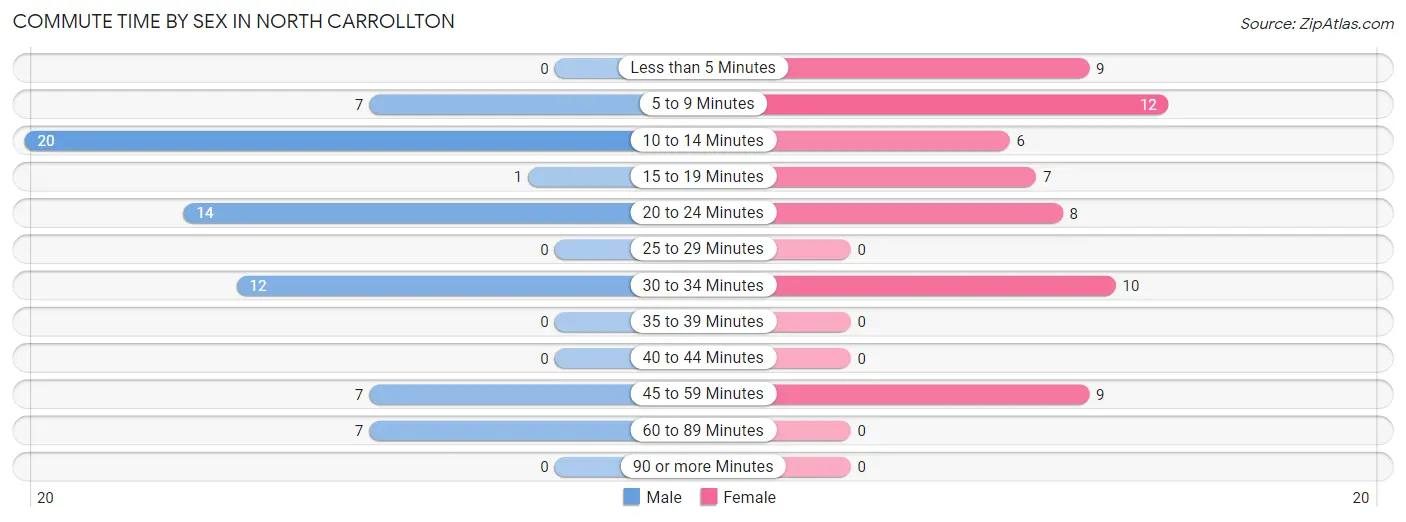
| Commute Time | Male | Female |
| Less than 5 Minutes | 0 (0.0%) | 9 (14.7%) |
| 5 to 9 Minutes | 7 (10.3%) | 12 (19.7%) |
| 10 to 14 Minutes | 20 (29.4%) | 6 (9.8%) |
| 15 to 19 Minutes | 1 (1.5%) | 7 (11.5%) |
| 20 to 24 Minutes | 14 (20.6%) | 8 (13.1%) |
| 25 to 29 Minutes | 0 (0.0%) | 0 (0.0%) |
| 30 to 34 Minutes | 12 (17.6%) | 10 (16.4%) |
| 35 to 39 Minutes | 0 (0.0%) | 0 (0.0%) |
| 40 to 44 Minutes | 0 (0.0%) | 0 (0.0%) |
| 45 to 59 Minutes | 7 (10.3%) | 9 (14.7%) |
| 60 to 89 Minutes | 7 (10.3%) | 0 (0.0%) |
| 90 or more Minutes | 0 (0.0%) | 0 (0.0%) |
Time of Departure to Work by Sex in North Carrollton
The most frequent times of departure to work in North Carrollton are 7:30 AM to 7:59 AM (39, 57.4%) for males and 9:00 AM to 9:59 AM (15, 24.6%) for females.
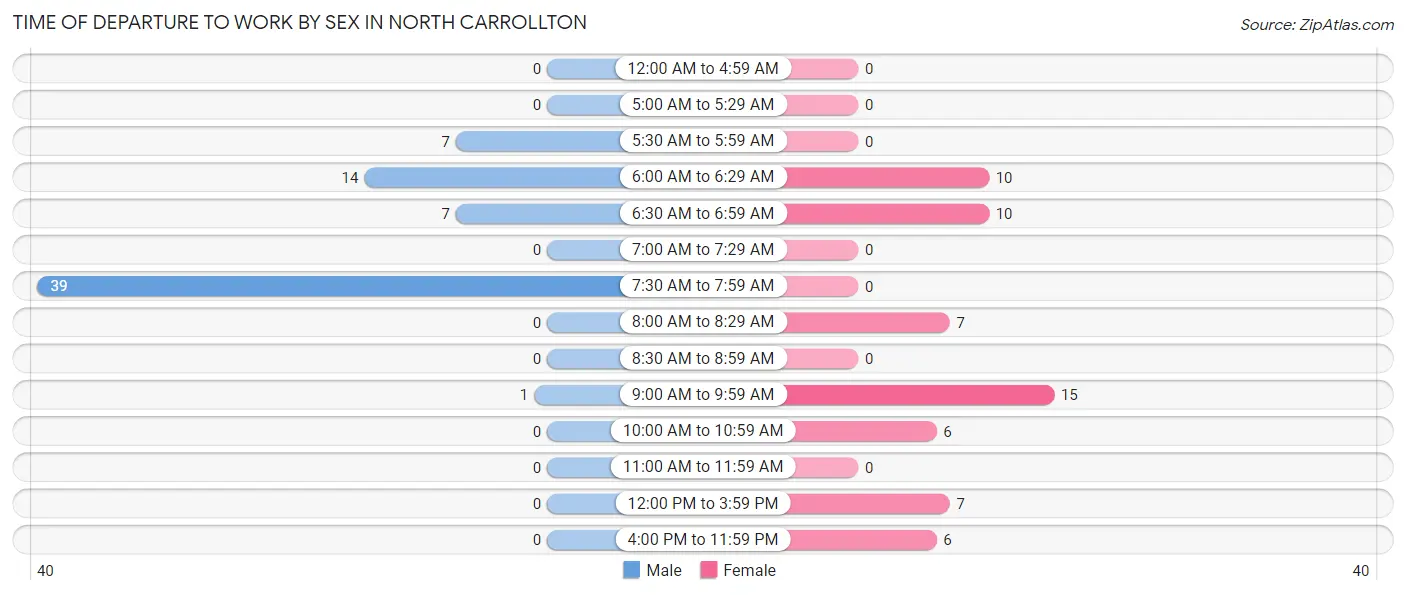
| Time of Departure | Male | Female |
| 12:00 AM to 4:59 AM | 0 (0.0%) | 0 (0.0%) |
| 5:00 AM to 5:29 AM | 0 (0.0%) | 0 (0.0%) |
| 5:30 AM to 5:59 AM | 7 (10.3%) | 0 (0.0%) |
| 6:00 AM to 6:29 AM | 14 (20.6%) | 10 (16.4%) |
| 6:30 AM to 6:59 AM | 7 (10.3%) | 10 (16.4%) |
| 7:00 AM to 7:29 AM | 0 (0.0%) | 0 (0.0%) |
| 7:30 AM to 7:59 AM | 39 (57.4%) | 0 (0.0%) |
| 8:00 AM to 8:29 AM | 0 (0.0%) | 7 (11.5%) |
| 8:30 AM to 8:59 AM | 0 (0.0%) | 0 (0.0%) |
| 9:00 AM to 9:59 AM | 1 (1.5%) | 15 (24.6%) |
| 10:00 AM to 10:59 AM | 0 (0.0%) | 6 (9.8%) |
| 11:00 AM to 11:59 AM | 0 (0.0%) | 0 (0.0%) |
| 12:00 PM to 3:59 PM | 0 (0.0%) | 7 (11.5%) |
| 4:00 PM to 11:59 PM | 0 (0.0%) | 6 (9.8%) |
| Total | 68 (100.0%) | 61 (100.0%) |
Housing Occupancy in North Carrollton
Occupancy by Ownership in North Carrollton
Of the total 210 dwellings in North Carrollton, owner-occupied units account for 132 (62.9%), while renter-occupied units make up 78 (37.1%).
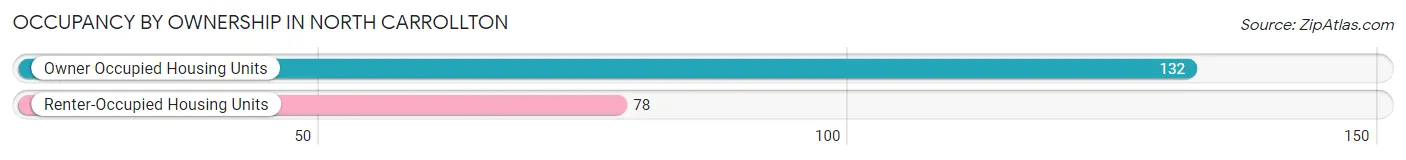
| Occupancy | # Housing Units | % Housing Units |
| Owner Occupied Housing Units | 132 | 62.9% |
| Renter-Occupied Housing Units | 78 | 37.1% |
| Total Occupied Housing Units | 210 | 100.0% |
Occupancy by Household Size in North Carrollton
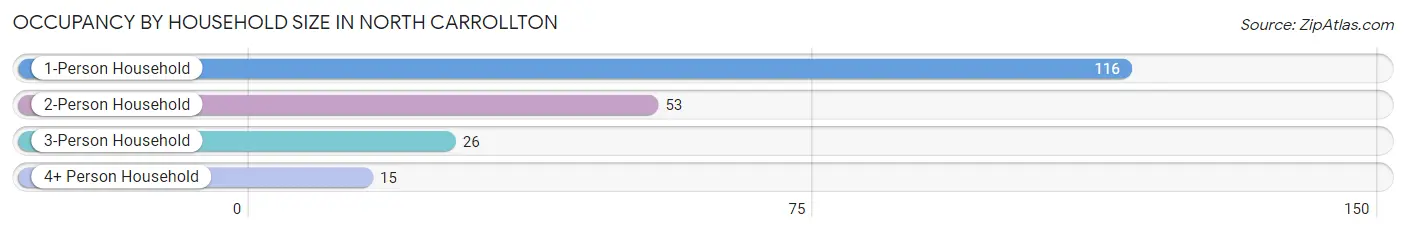
| Household Size | # Housing Units | % Housing Units |
| 1-Person Household | 116 | 55.2% |
| 2-Person Household | 53 | 25.2% |
| 3-Person Household | 26 | 12.4% |
| 4+ Person Household | 15 | 7.1% |
| Total Housing Units | 210 | 100.0% |
Occupancy by Ownership by Household Size in North Carrollton
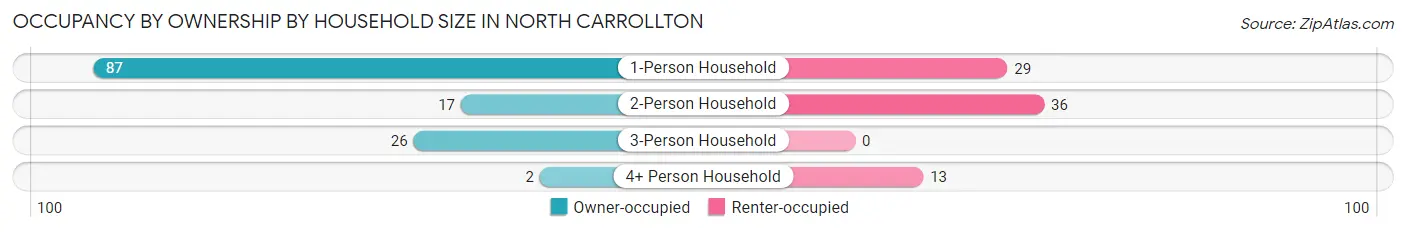
| Household Size | Owner-occupied | Renter-occupied |
| 1-Person Household | 87 (75.0%) | 29 (25.0%) |
| 2-Person Household | 17 (32.1%) | 36 (67.9%) |
| 3-Person Household | 26 (100.0%) | 0 (0.0%) |
| 4+ Person Household | 2 (13.3%) | 13 (86.7%) |
| Total Housing Units | 132 (62.9%) | 78 (37.1%) |
Occupancy by Educational Attainment in North Carrollton
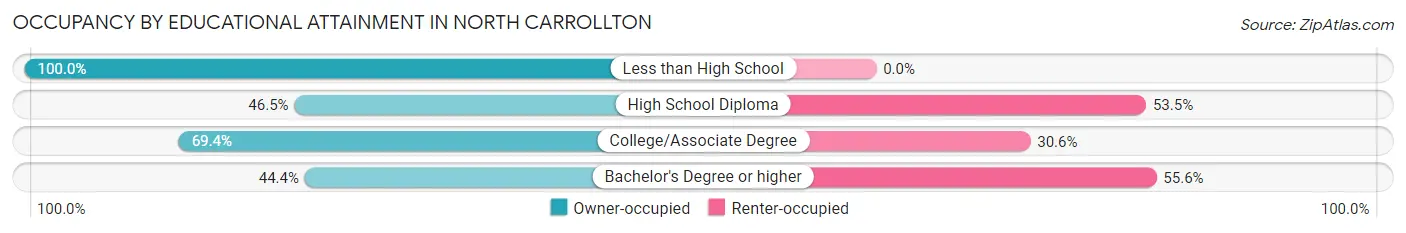
| Household Size | Owner-occupied | Renter-occupied |
| Less than High School | 34 (100.0%) | 0 (0.0%) |
| High School Diploma | 40 (46.5%) | 46 (53.5%) |
| College/Associate Degree | 50 (69.4%) | 22 (30.6%) |
| Bachelor's Degree or higher | 8 (44.4%) | 10 (55.6%) |
Occupancy by Age of Householder in North Carrollton
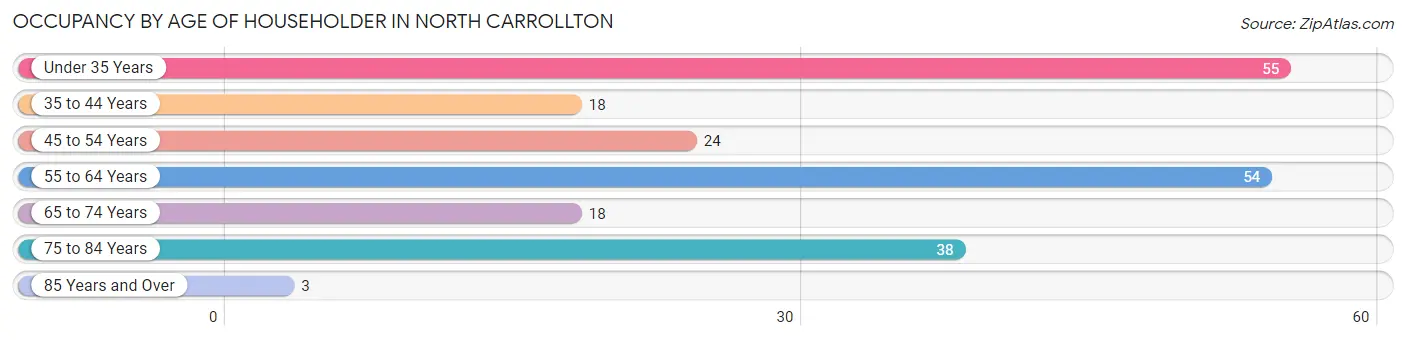
| Age Bracket | # Households | % Households |
| Under 35 Years | 55 | 26.2% |
| 35 to 44 Years | 18 | 8.6% |
| 45 to 54 Years | 24 | 11.4% |
| 55 to 64 Years | 54 | 25.7% |
| 65 to 74 Years | 18 | 8.6% |
| 75 to 84 Years | 38 | 18.1% |
| 85 Years and Over | 3 | 1.4% |
| Total | 210 | 100.0% |
Housing Finances in North Carrollton
Median Income by Occupancy in North Carrollton
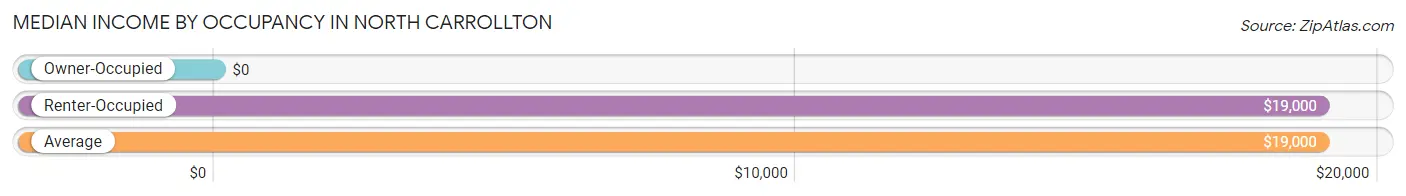
| Occupancy Type | # Households | Median Income |
| Owner-Occupied | 132 (62.9%) | $0 |
| Renter-Occupied | 78 (37.1%) | $19,000 |
| Average | 210 (100.0%) | $19,000 |
Occupancy by Householder Income Bracket in North Carrollton
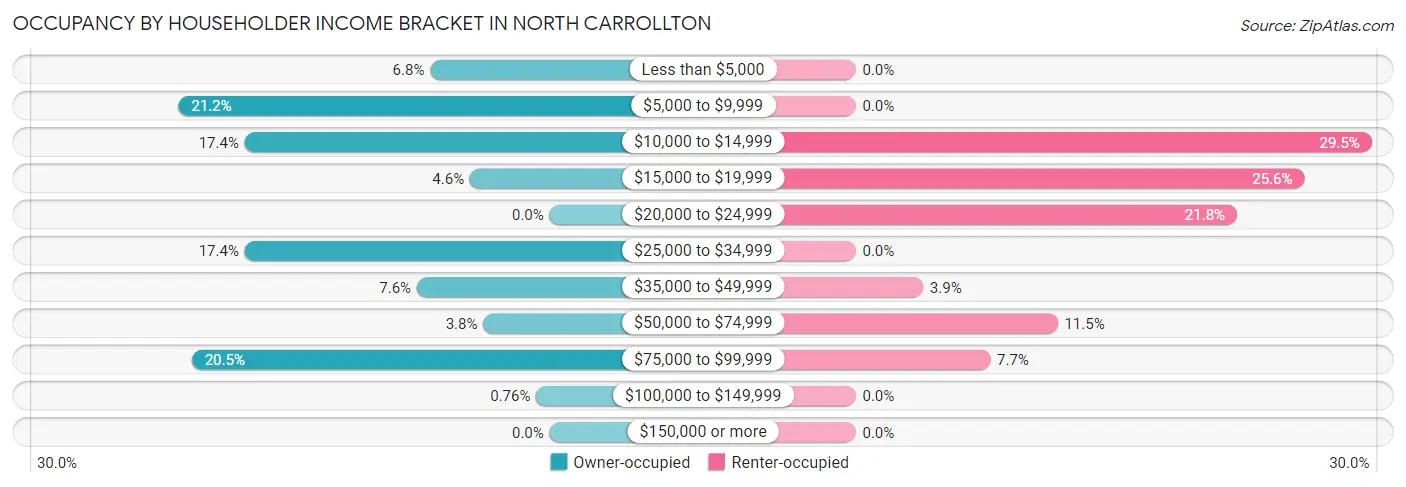
| Income Bracket | Owner-occupied | Renter-occupied |
| Less than $5,000 | 9 (6.8%) | 0 (0.0%) |
| $5,000 to $9,999 | 28 (21.2%) | 0 (0.0%) |
| $10,000 to $14,999 | 23 (17.4%) | 23 (29.5%) |
| $15,000 to $19,999 | 6 (4.5%) | 20 (25.6%) |
| $20,000 to $24,999 | 0 (0.0%) | 17 (21.8%) |
| $25,000 to $34,999 | 23 (17.4%) | 0 (0.0%) |
| $35,000 to $49,999 | 10 (7.6%) | 3 (3.8%) |
| $50,000 to $74,999 | 5 (3.8%) | 9 (11.5%) |
| $75,000 to $99,999 | 27 (20.4%) | 6 (7.7%) |
| $100,000 to $149,999 | 1 (0.8%) | 0 (0.0%) |
| $150,000 or more | 0 (0.0%) | 0 (0.0%) |
| Total | 132 (100.0%) | 78 (100.0%) |
Monthly Housing Cost Tiers in North Carrollton
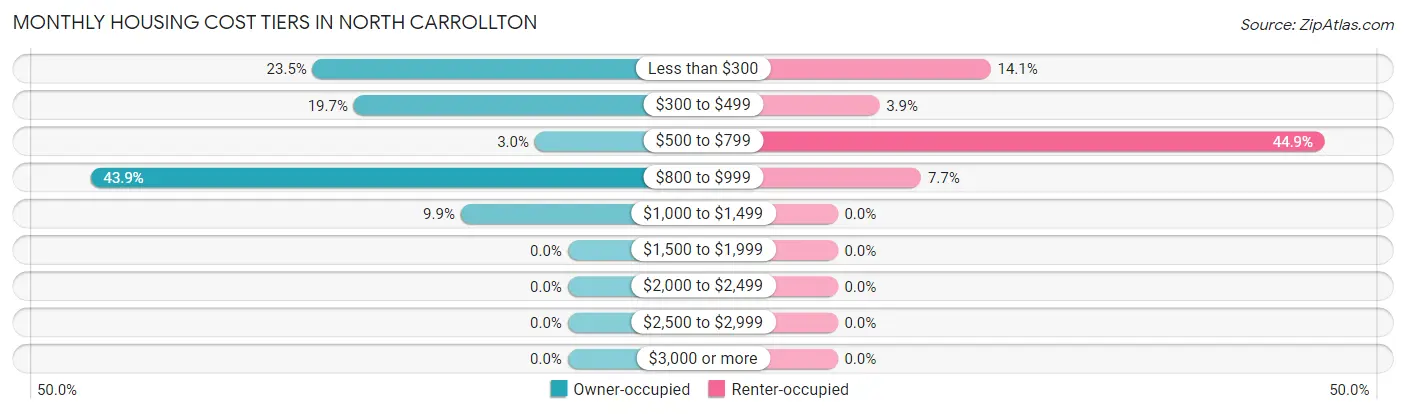
| Monthly Cost | Owner-occupied | Renter-occupied |
| Less than $300 | 31 (23.5%) | 11 (14.1%) |
| $300 to $499 | 26 (19.7%) | 3 (3.8%) |
| $500 to $799 | 4 (3.0%) | 35 (44.9%) |
| $800 to $999 | 58 (43.9%) | 6 (7.7%) |
| $1,000 to $1,499 | 13 (9.9%) | 0 (0.0%) |
| $1,500 to $1,999 | 0 (0.0%) | 0 (0.0%) |
| $2,000 to $2,499 | 0 (0.0%) | 0 (0.0%) |
| $2,500 to $2,999 | 0 (0.0%) | 0 (0.0%) |
| $3,000 or more | 0 (0.0%) | 0 (0.0%) |
| Total | 132 (100.0%) | 78 (100.0%) |
Physical Housing Characteristics in North Carrollton
Housing Structures in North Carrollton
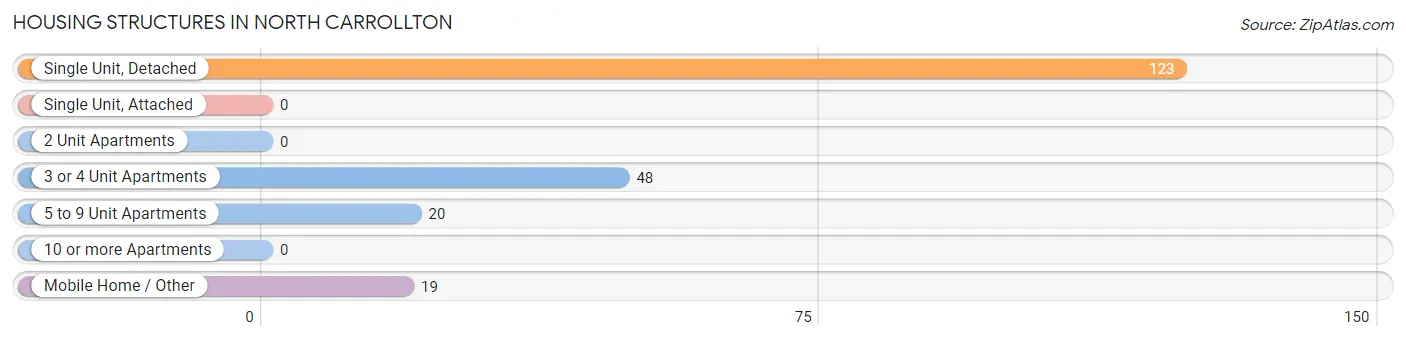
| Structure Type | # Housing Units | % Housing Units |
| Single Unit, Detached | 123 | 58.6% |
| Single Unit, Attached | 0 | 0.0% |
| 2 Unit Apartments | 0 | 0.0% |
| 3 or 4 Unit Apartments | 48 | 22.9% |
| 5 to 9 Unit Apartments | 20 | 9.5% |
| 10 or more Apartments | 0 | 0.0% |
| Mobile Home / Other | 19 | 9.0% |
| Total | 210 | 100.0% |
Housing Structures by Occupancy in North Carrollton
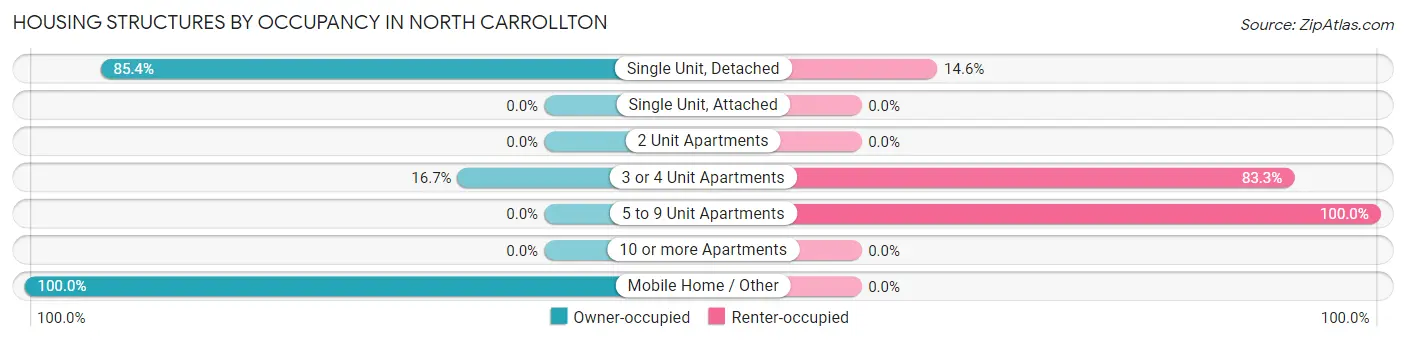
| Structure Type | Owner-occupied | Renter-occupied |
| Single Unit, Detached | 105 (85.4%) | 18 (14.6%) |
| Single Unit, Attached | 0 (0.0%) | 0 (0.0%) |
| 2 Unit Apartments | 0 (0.0%) | 0 (0.0%) |
| 3 or 4 Unit Apartments | 8 (16.7%) | 40 (83.3%) |
| 5 to 9 Unit Apartments | 0 (0.0%) | 20 (100.0%) |
| 10 or more Apartments | 0 (0.0%) | 0 (0.0%) |
| Mobile Home / Other | 19 (100.0%) | 0 (0.0%) |
| Total | 132 (62.9%) | 78 (37.1%) |
Housing Structures by Number of Rooms in North Carrollton
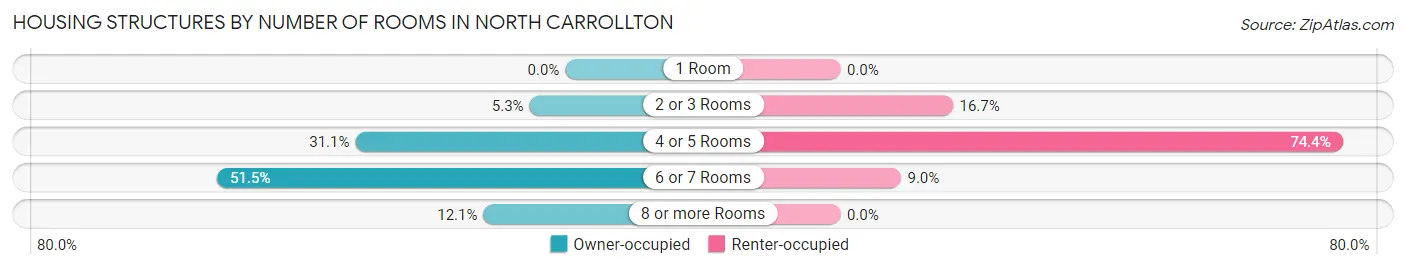
| Number of Rooms | Owner-occupied | Renter-occupied |
| 1 Room | 0 (0.0%) | 0 (0.0%) |
| 2 or 3 Rooms | 7 (5.3%) | 13 (16.7%) |
| 4 or 5 Rooms | 41 (31.1%) | 58 (74.4%) |
| 6 or 7 Rooms | 68 (51.5%) | 7 (9.0%) |
| 8 or more Rooms | 16 (12.1%) | 0 (0.0%) |
| Total | 132 (100.0%) | 78 (100.0%) |
Housing Structure by Heating Type in North Carrollton
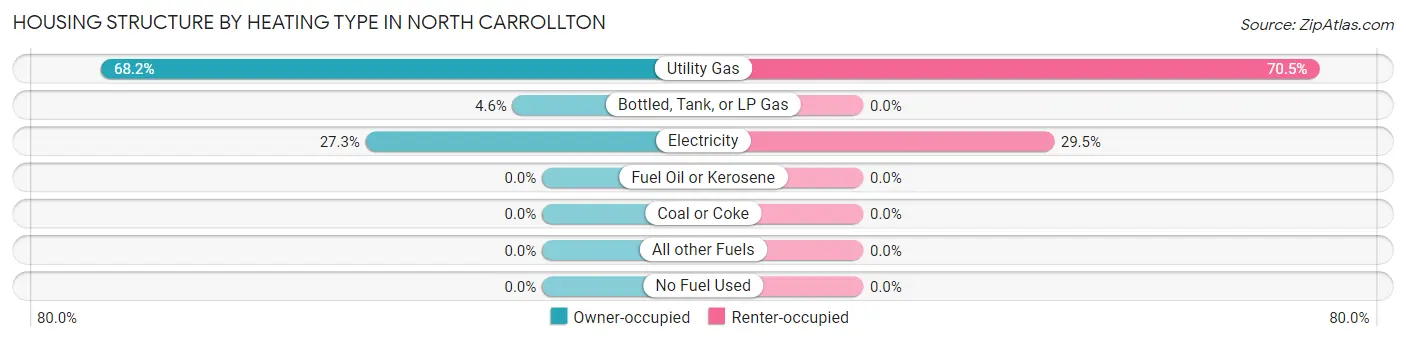
| Heating Type | Owner-occupied | Renter-occupied |
| Utility Gas | 90 (68.2%) | 55 (70.5%) |
| Bottled, Tank, or LP Gas | 6 (4.5%) | 0 (0.0%) |
| Electricity | 36 (27.3%) | 23 (29.5%) |
| Fuel Oil or Kerosene | 0 (0.0%) | 0 (0.0%) |
| Coal or Coke | 0 (0.0%) | 0 (0.0%) |
| All other Fuels | 0 (0.0%) | 0 (0.0%) |
| No Fuel Used | 0 (0.0%) | 0 (0.0%) |
| Total | 132 (100.0%) | 78 (100.0%) |
Household Vehicle Usage in North Carrollton
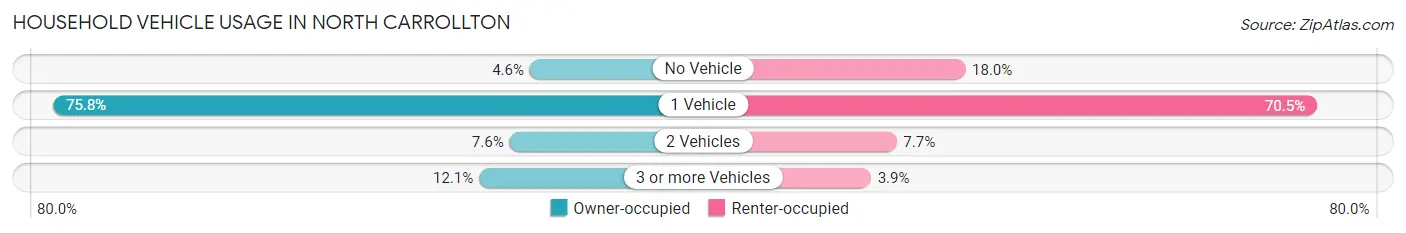
| Vehicles per Household | Owner-occupied | Renter-occupied |
| No Vehicle | 6 (4.5%) | 14 (17.9%) |
| 1 Vehicle | 100 (75.8%) | 55 (70.5%) |
| 2 Vehicles | 10 (7.6%) | 6 (7.7%) |
| 3 or more Vehicles | 16 (12.1%) | 3 (3.8%) |
| Total | 132 (100.0%) | 78 (100.0%) |
Real Estate & Mortgages in North Carrollton
Real Estate and Mortgage Overview in North Carrollton
| Characteristic | Without Mortgage | With Mortgage |
| Housing Units | 58 | 74 |
| Median Property Value | $87,500 | $127,700 |
| Median Household Income | - | - |
| Monthly Housing Costs | $292 | $0 |
| Real Estate Taxes | - | - |
Property Value by Mortgage Status in North Carrollton
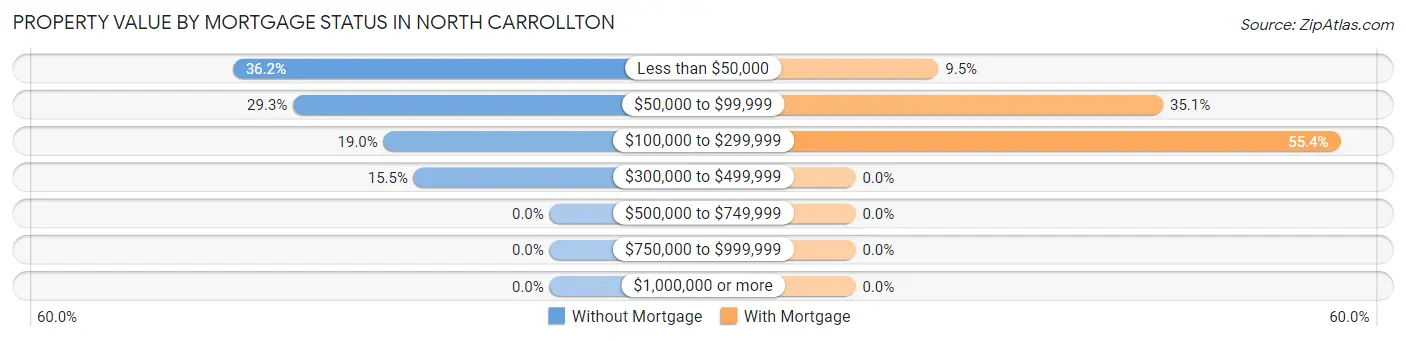
| Property Value | Without Mortgage | With Mortgage |
| Less than $50,000 | 21 (36.2%) | 7 (9.5%) |
| $50,000 to $99,999 | 17 (29.3%) | 26 (35.1%) |
| $100,000 to $299,999 | 11 (19.0%) | 41 (55.4%) |
| $300,000 to $499,999 | 9 (15.5%) | 0 (0.0%) |
| $500,000 to $749,999 | 0 (0.0%) | 0 (0.0%) |
| $750,000 to $999,999 | 0 (0.0%) | 0 (0.0%) |
| $1,000,000 or more | 0 (0.0%) | 0 (0.0%) |
| Total | 58 (100.0%) | 74 (100.0%) |
Household Income by Mortgage Status in North Carrollton
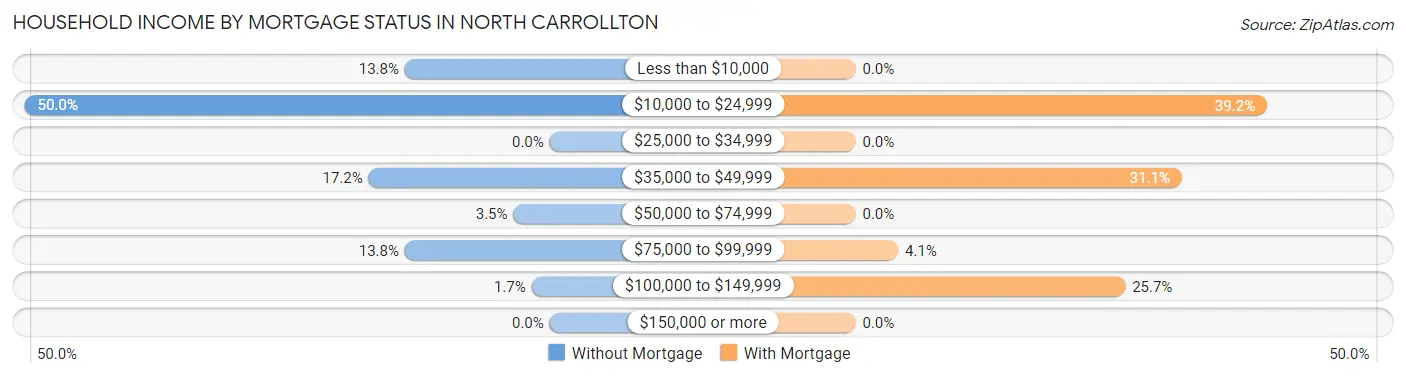
| Household Income | Without Mortgage | With Mortgage |
| Less than $10,000 | 8 (13.8%) | 0 (0.0%) |
| $10,000 to $24,999 | 29 (50.0%) | 29 (39.2%) |
| $25,000 to $34,999 | 0 (0.0%) | 0 (0.0%) |
| $35,000 to $49,999 | 10 (17.2%) | 23 (31.1%) |
| $50,000 to $74,999 | 2 (3.5%) | 0 (0.0%) |
| $75,000 to $99,999 | 8 (13.8%) | 3 (4.1%) |
| $100,000 to $149,999 | 1 (1.7%) | 19 (25.7%) |
| $150,000 or more | 0 (0.0%) | 0 (0.0%) |
| Total | 58 (100.0%) | 74 (100.0%) |
Property Value to Household Income Ratio in North Carrollton
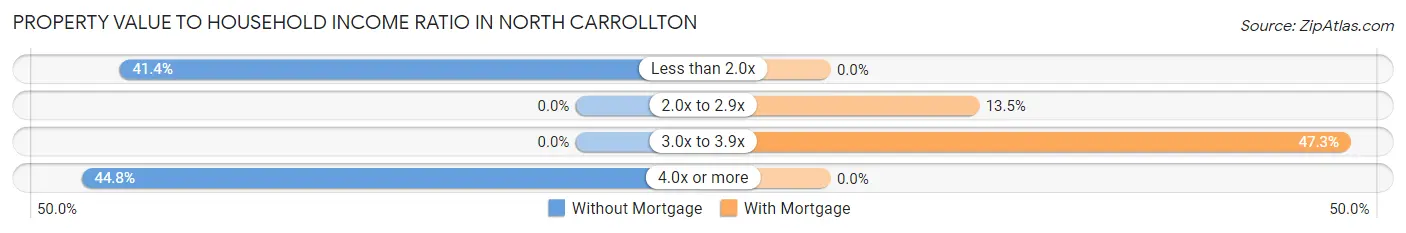
| Value-to-Income Ratio | Without Mortgage | With Mortgage |
| Less than 2.0x | 24 (41.4%) | 0 (0.0%) |
| 2.0x to 2.9x | 0 (0.0%) | 10 (13.5%) |
| 3.0x to 3.9x | 0 (0.0%) | 35 (47.3%) |
| 4.0x or more | 26 (44.8%) | 0 (0.0%) |
| Total | 58 (100.0%) | 74 (100.0%) |
Real Estate Taxes by Mortgage Status in North Carrollton
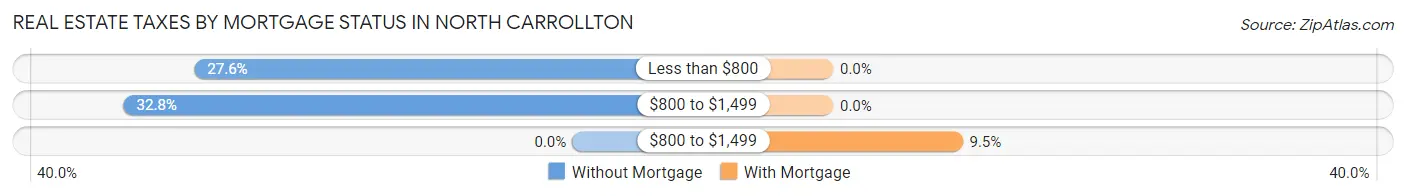
| Property Taxes | Without Mortgage | With Mortgage |
| Less than $800 | 16 (27.6%) | 0 (0.0%) |
| $800 to $1,499 | 19 (32.8%) | 0 (0.0%) |
| $800 to $1,499 | 0 (0.0%) | 7 (9.5%) |
| Total | 58 (100.0%) | 74 (100.0%) |
Health & Disability in North Carrollton
Health Insurance Coverage by Age in North Carrollton
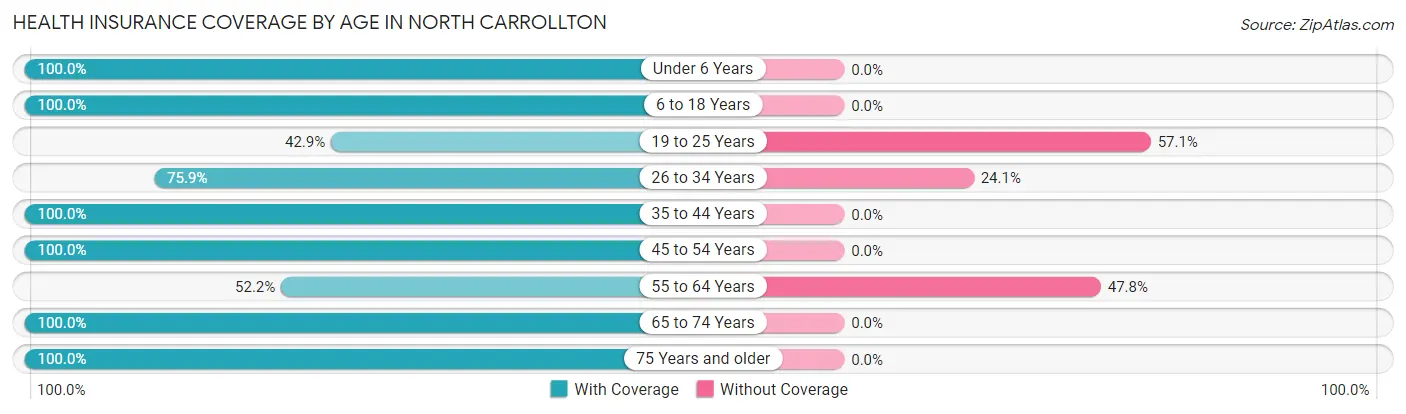
| Age Bracket | With Coverage | Without Coverage |
| Under 6 Years | 38 (100.0%) | 0 (0.0%) |
| 6 to 18 Years | 53 (100.0%) | 0 (0.0%) |
| 19 to 25 Years | 15 (42.9%) | 20 (57.1%) |
| 26 to 34 Years | 44 (75.9%) | 14 (24.1%) |
| 35 to 44 Years | 43 (100.0%) | 0 (0.0%) |
| 45 to 54 Years | 32 (100.0%) | 0 (0.0%) |
| 55 to 64 Years | 36 (52.2%) | 33 (47.8%) |
| 65 to 74 Years | 29 (100.0%) | 0 (0.0%) |
| 75 Years and older | 41 (100.0%) | 0 (0.0%) |
| Total | 331 (83.2%) | 67 (16.8%) |
Health Insurance Coverage by Citizenship Status in North Carrollton
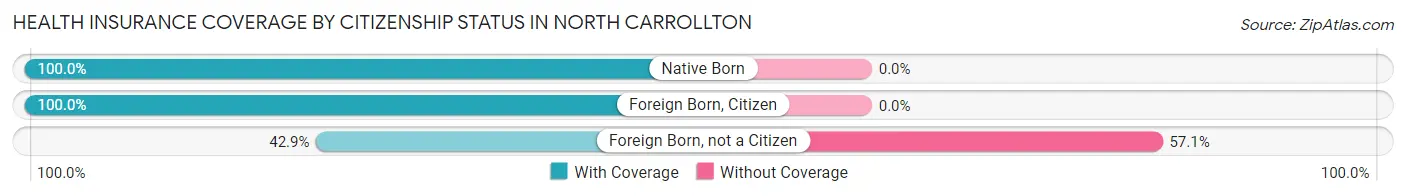
| Citizenship Status | With Coverage | Without Coverage |
| Native Born | 38 (100.0%) | 0 (0.0%) |
| Foreign Born, Citizen | 53 (100.0%) | 0 (0.0%) |
| Foreign Born, not a Citizen | 15 (42.9%) | 20 (57.1%) |
Health Insurance Coverage by Household Income in North Carrollton
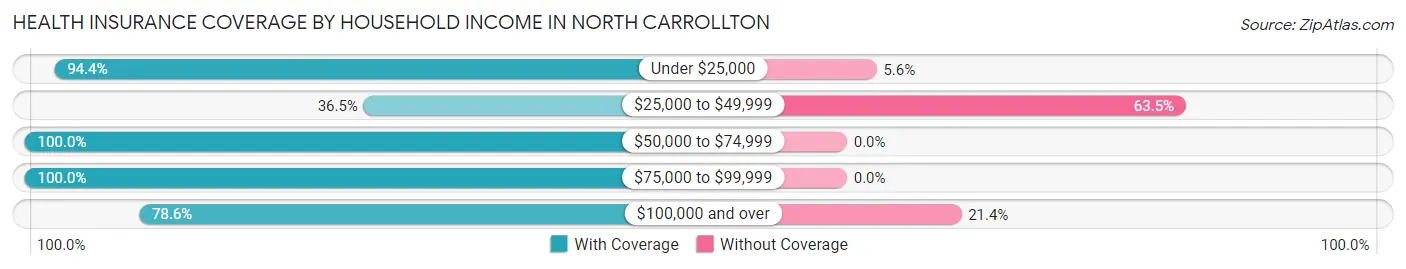
| Household Income | With Coverage | Without Coverage |
| Under $25,000 | 170 (94.4%) | 10 (5.6%) |
| $25,000 to $49,999 | 31 (36.5%) | 54 (63.5%) |
| $50,000 to $74,999 | 31 (100.0%) | 0 (0.0%) |
| $75,000 to $99,999 | 88 (100.0%) | 0 (0.0%) |
| $100,000 and over | 11 (78.6%) | 3 (21.4%) |
Public vs Private Health Insurance Coverage by Age in North Carrollton
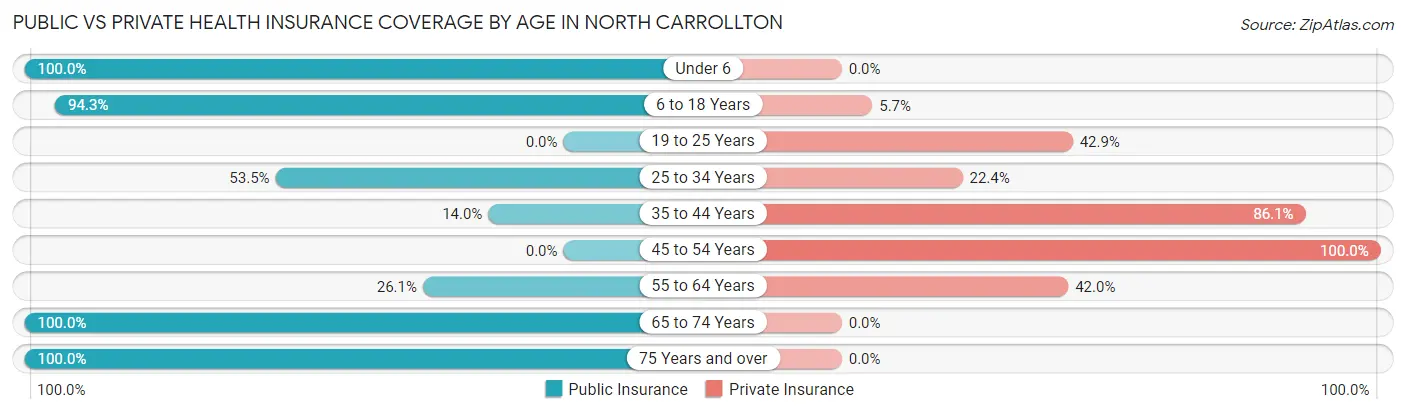
| Age Bracket | Public Insurance | Private Insurance |
| Under 6 | 38 (100.0%) | 0 (0.0%) |
| 6 to 18 Years | 50 (94.3%) | 3 (5.7%) |
| 19 to 25 Years | 0 (0.0%) | 15 (42.9%) |
| 25 to 34 Years | 31 (53.4%) | 13 (22.4%) |
| 35 to 44 Years | 6 (14.0%) | 37 (86.1%) |
| 45 to 54 Years | 0 (0.0%) | 32 (100.0%) |
| 55 to 64 Years | 18 (26.1%) | 29 (42.0%) |
| 65 to 74 Years | 29 (100.0%) | 0 (0.0%) |
| 75 Years and over | 41 (100.0%) | 0 (0.0%) |
| Total | 213 (53.5%) | 129 (32.4%) |
Disability Status by Sex by Age in North Carrollton
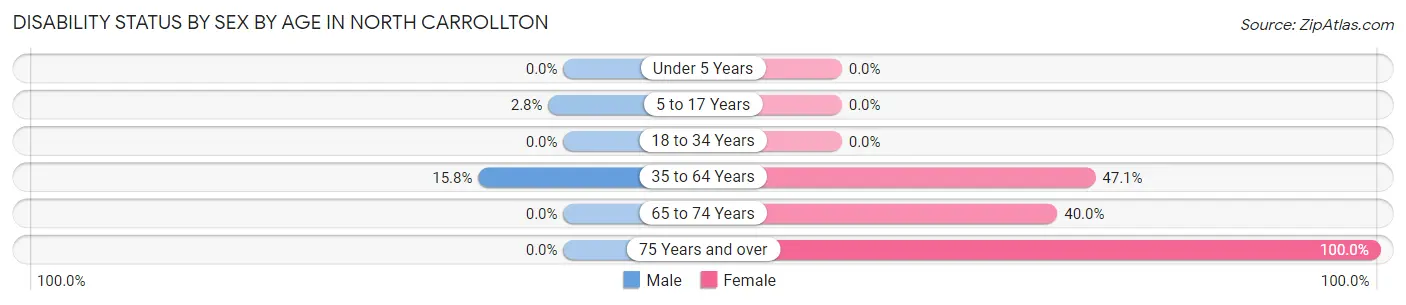
| Age Bracket | Male | Female |
| Under 5 Years | 0 (0.0%) | 0 (0.0%) |
| 5 to 17 Years | 1 (2.8%) | 0 (0.0%) |
| 18 to 34 Years | 0 (0.0%) | 0 (0.0%) |
| 35 to 64 Years | 12 (15.8%) | 32 (47.1%) |
| 65 to 74 Years | 0 (0.0%) | 2 (40.0%) |
| 75 Years and over | 0 (0.0%) | 41 (100.0%) |
Disability Class by Sex by Age in North Carrollton
Disability Class: Hearing Difficulty
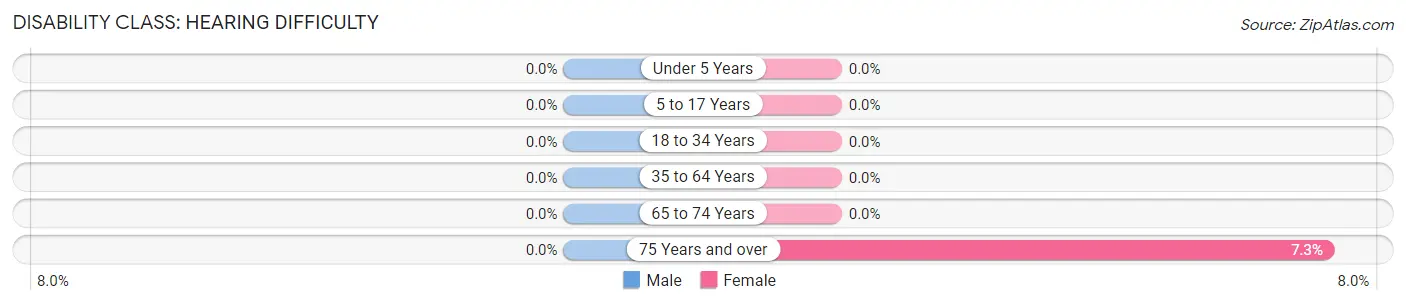
| Age Bracket | Male | Female |
| Under 5 Years | 0 (0.0%) | 0 (0.0%) |
| 5 to 17 Years | 0 (0.0%) | 0 (0.0%) |
| 18 to 34 Years | 0 (0.0%) | 0 (0.0%) |
| 35 to 64 Years | 0 (0.0%) | 0 (0.0%) |
| 65 to 74 Years | 0 (0.0%) | 0 (0.0%) |
| 75 Years and over | 0 (0.0%) | 3 (7.3%) |
Disability Class: Vision Difficulty
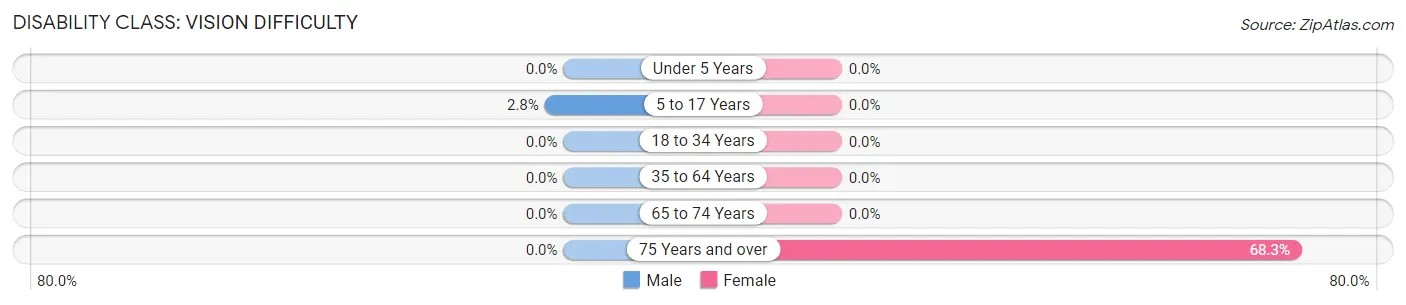
| Age Bracket | Male | Female |
| Under 5 Years | 0 (0.0%) | 0 (0.0%) |
| 5 to 17 Years | 1 (2.8%) | 0 (0.0%) |
| 18 to 34 Years | 0 (0.0%) | 0 (0.0%) |
| 35 to 64 Years | 0 (0.0%) | 0 (0.0%) |
| 65 to 74 Years | 0 (0.0%) | 0 (0.0%) |
| 75 Years and over | 0 (0.0%) | 28 (68.3%) |
Disability Class: Cognitive Difficulty
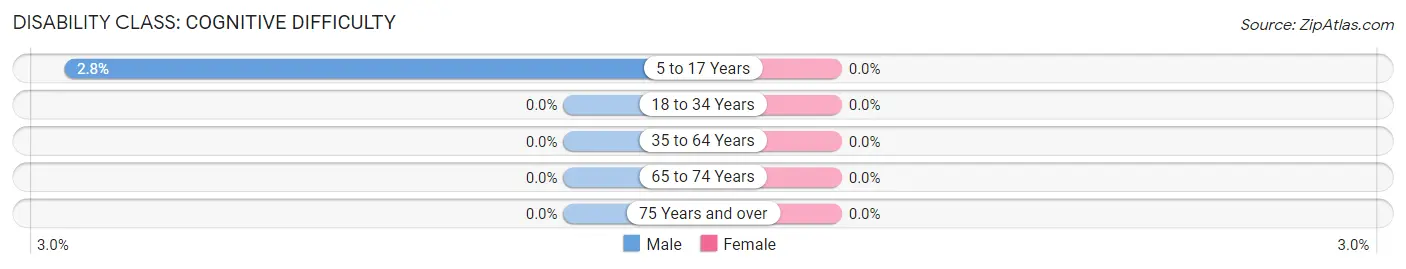
| Age Bracket | Male | Female |
| 5 to 17 Years | 1 (2.8%) | 0 (0.0%) |
| 18 to 34 Years | 0 (0.0%) | 0 (0.0%) |
| 35 to 64 Years | 0 (0.0%) | 0 (0.0%) |
| 65 to 74 Years | 0 (0.0%) | 0 (0.0%) |
| 75 Years and over | 0 (0.0%) | 0 (0.0%) |
Disability Class: Ambulatory Difficulty
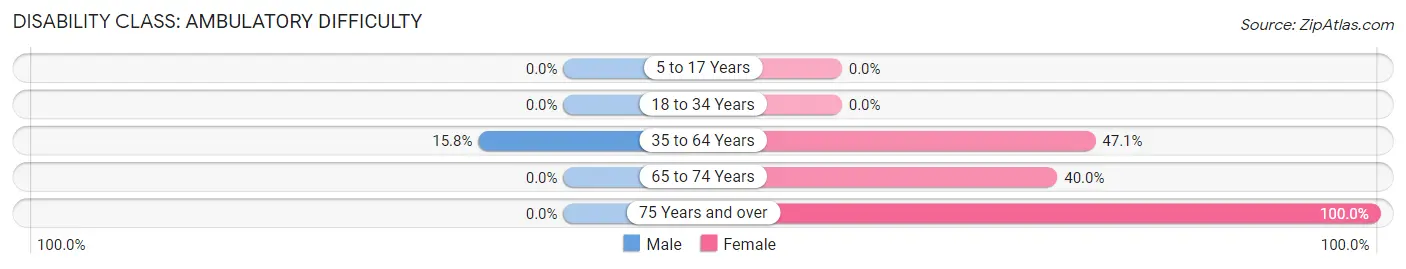
| Age Bracket | Male | Female |
| 5 to 17 Years | 0 (0.0%) | 0 (0.0%) |
| 18 to 34 Years | 0 (0.0%) | 0 (0.0%) |
| 35 to 64 Years | 12 (15.8%) | 32 (47.1%) |
| 65 to 74 Years | 0 (0.0%) | 2 (40.0%) |
| 75 Years and over | 0 (0.0%) | 41 (100.0%) |
Disability Class: Self-Care Difficulty
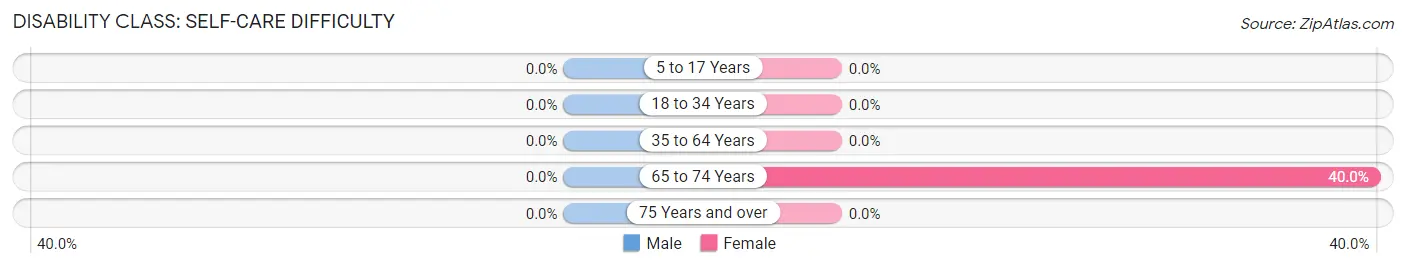
| Age Bracket | Male | Female |
| 5 to 17 Years | 0 (0.0%) | 0 (0.0%) |
| 18 to 34 Years | 0 (0.0%) | 0 (0.0%) |
| 35 to 64 Years | 0 (0.0%) | 0 (0.0%) |
| 65 to 74 Years | 0 (0.0%) | 2 (40.0%) |
| 75 Years and over | 0 (0.0%) | 0 (0.0%) |
Technology Access in North Carrollton
Computing Device Access in North Carrollton
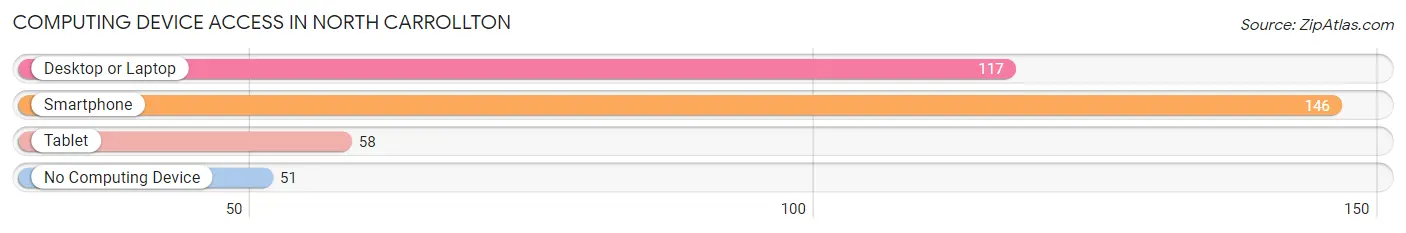
| Device Type | # Households | % Households |
| Desktop or Laptop | 117 | 55.7% |
| Smartphone | 146 | 69.5% |
| Tablet | 58 | 27.6% |
| No Computing Device | 51 | 24.3% |
| Total | 210 | 100.0% |
Internet Access in North Carrollton
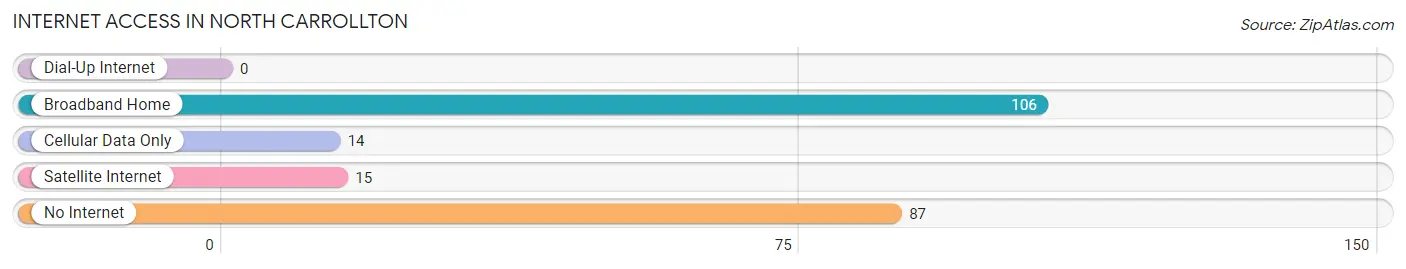
| Internet Type | # Households | % Households |
| Dial-Up Internet | 0 | 0.0% |
| Broadband Home | 106 | 50.5% |
| Cellular Data Only | 14 | 6.7% |
| Satellite Internet | 15 | 7.1% |
| No Internet | 87 | 41.4% |
| Total | 210 | 100.0% |
North Carrollton Summary
Carrollton, Mississippi is a small town located in the northern part of the state, about an hour and a half from the state capital of Jackson. It is situated in the heart of the Mississippi Delta, a region known for its rich agricultural heritage and its unique culture. The town has a population of just over 1,000 people, and is the county seat of Carroll County.
History
Carrollton was founded in 1837, and was named after Charles Carroll, a signer of the Declaration of Independence. The town was originally a trading post, and was the site of a major battle during the Civil War. After the war, the town was rebuilt and became a center of commerce and industry. The town was also home to a number of prominent African-American businesses, including a bank, a newspaper, and a hotel.
Geography
Carrollton is located in the northern part of the state, about an hour and a half from the state capital of Jackson. It is situated in the heart of the Mississippi Delta, a region known for its rich agricultural heritage and its unique culture. The town is located on the banks of the Yazoo River, and is surrounded by rolling hills and lush farmland.
Economy
The economy of Carrollton is largely based on agriculture. The town is home to a number of farms, and the surrounding area is known for its production of cotton, soybeans, corn, and other crops. The town is also home to a number of small businesses, including restaurants, retail stores, and service providers.
Demographics
As of the 2010 census, the population of Carrollton was 1,072. The racial makeup of the town was 79.3% White, 19.2% African American, 0.3% Native American, 0.2% Asian, and 0.9% from other races. The median household income was $30,938, and the median family income was $37,813. The town has a poverty rate of 28.3%.
Conclusion
Carrollton, Mississippi is a small town located in the northern part of the state, about an hour and a half from the state capital of Jackson. It is situated in the heart of the Mississippi Delta, a region known for its rich agricultural heritage and its unique culture. The town has a population of just over 1,000 people, and is the county seat of Carroll County. The economy of Carrollton is largely based on agriculture, and the town is home to a number of small businesses. The racial makeup of the town is 79.3% White, 19.2% African American, 0.3% Native American, 0.2% Asian, and 0.9% from other races. The median household income was $30,938, and the median family income was $37,813. The town has a poverty rate of 28.3%.
Common Questions
What is Per Capita Income in North Carrollton?
Per Capita income in North Carrollton is $19,619.
What is the Median Family Income in North Carrollton?
Median Family Income in North Carrollton is $30,652.
What is the Median Household income in North Carrollton?
Median Household Income in North Carrollton is $19,000.
What is Income or Wage Gap in North Carrollton?
Income or Wage Gap in North Carrollton is 74.5%.
Women in North Carrollton earn 25.5 cents for every dollar earned by a man.
What is Inequality or Gini Index in North Carrollton?
Inequality or Gini Index in North Carrollton is 0.47.
What is the Total Population of North Carrollton?
Total Population of North Carrollton is 398.
What is the Total Male Population of North Carrollton?
Total Male Population of North Carrollton is 182.
What is the Total Female Population of North Carrollton?
Total Female Population of North Carrollton is 216.
What is the Ratio of Males per 100 Females in North Carrollton?
There are 84.26 Males per 100 Females in North Carrollton.
What is the Ratio of Females per 100 Males in North Carrollton?
There are 118.68 Females per 100 Males in North Carrollton.
What is the Median Population Age in North Carrollton?
Median Population Age in North Carrollton is 44.1 Years.
What is the Average Family Size in North Carrollton
Average Family Size in North Carrollton is 2.9 People.
What is the Average Household Size in North Carrollton
Average Household Size in North Carrollton is 1.9 People.
How Large is the Labor Force in North Carrollton?
There are 134 People in the Labor Forcein in North Carrollton.
What is the Percentage of People in the Labor Force in North Carrollton?
40.5% of People are in the Labor Force in North Carrollton.
What is the Unemployment Rate in North Carrollton?
Unemployment Rate in North Carrollton is 2.2%.