Gunnison, MS Map & Demographics
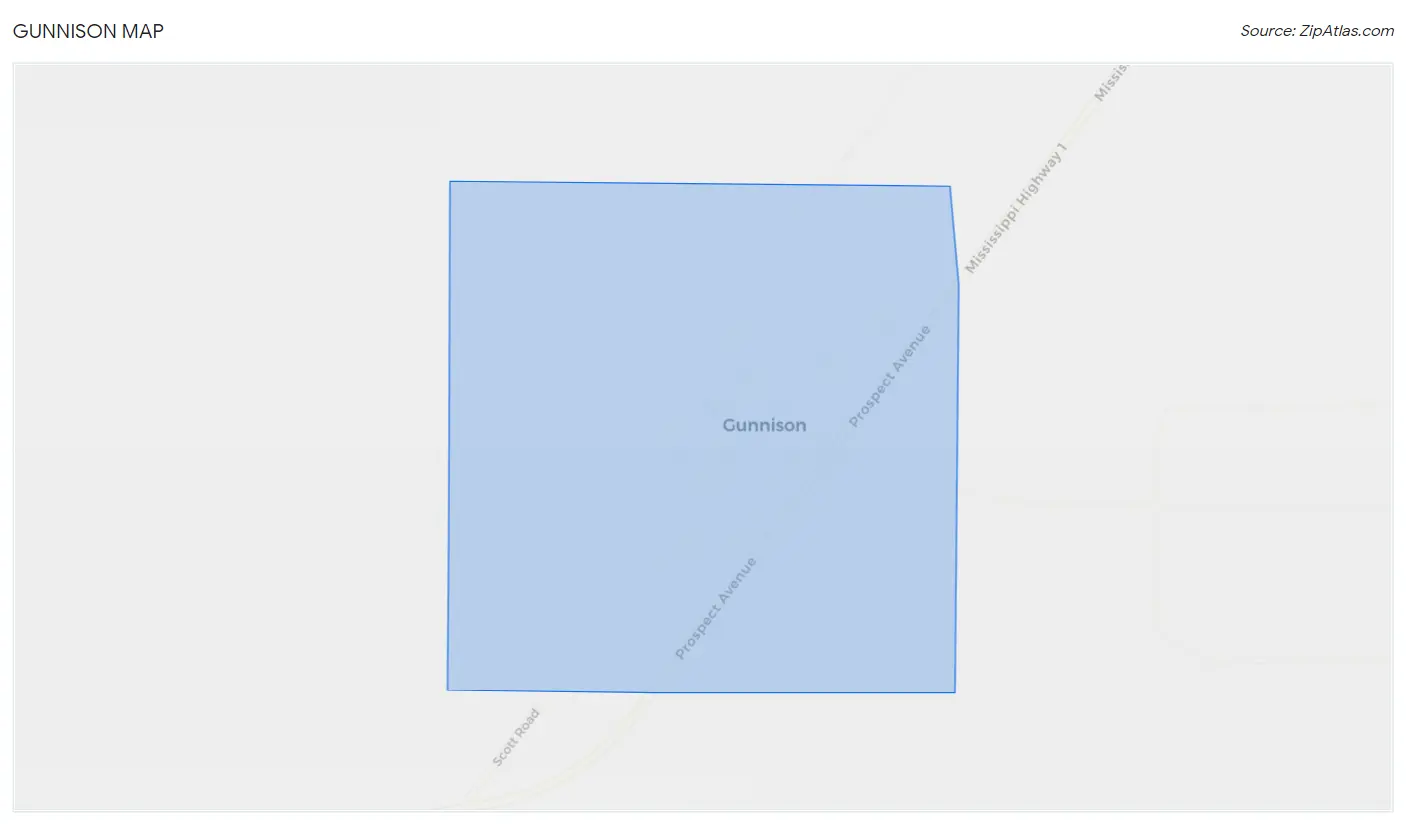
Gunnison Map
Gunnison Overview
$28,215
PER CAPITA INCOME
$21,161
AVG FAMILY INCOME
$21,382
AVG HOUSEHOLD INCOME
$9,640
FAMILY INCOME DEFICIT
0.63
INEQUALITY / GINI INDEX
376
TOTAL POPULATION
151
MALE POPULATION
225
FEMALE POPULATION
67.11
MALES / 100 FEMALES
149.01
FEMALES / 100 MALES
37.8
MEDIAN AGE
3.1
AVG FAMILY SIZE
2.3
AVG HOUSEHOLD SIZE
111
LABOR FORCE [ PEOPLE ]
39.2%
PERCENT IN LABOR FORCE
22.5%
UNEMPLOYMENT RATE
Gunnison Zip Codes
Gunnison Area Codes
Income in Gunnison
Income Overview in Gunnison
Per Capita Income in Gunnison is $28,215, while median incomes of families and households are $21,161 and $21,382 respectively.
| Characteristic | Number | Measure |
| Per Capita Income | 376 | $28,215 |
| Median Family Income | 101 | $21,161 |
| Mean Family Income | 101 | $44,434 |
| Median Household Income | 163 | $21,382 |
| Mean Household Income | 163 | $61,075 |
| Income Deficit | 101 | $9,640 |
| Wage / Income Gap (%) | 376 | 0.00% |
| Wage / Income Gap ($) | 376 | 100.00¢ per $1 |
| Gini / Inequality Index | 376 | 0.63 |
Earnings by Sex in Gunnison
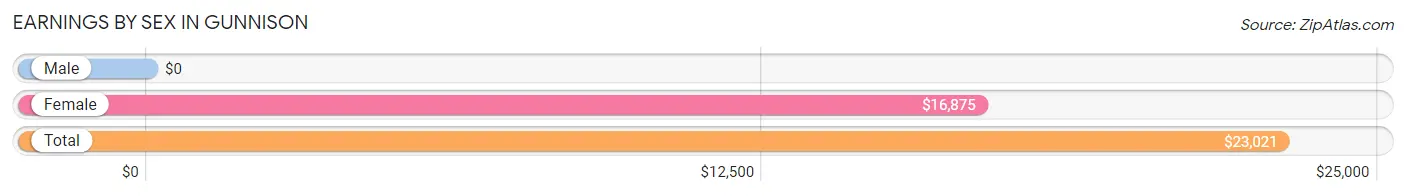
| Sex | Number | Average Earnings |
| Male | 69 (57.5%) | $0 |
| Female | 51 (42.5%) | $16,875 |
| Total | 120 (100.0%) | $23,021 |
Earnings by Sex by Income Bracket in Gunnison
The most common earnings brackets in Gunnison are $22,500 to $24,999 for men (20 | 29.0%) and $15,000 to $17,499 for women (14 | 27.5%).
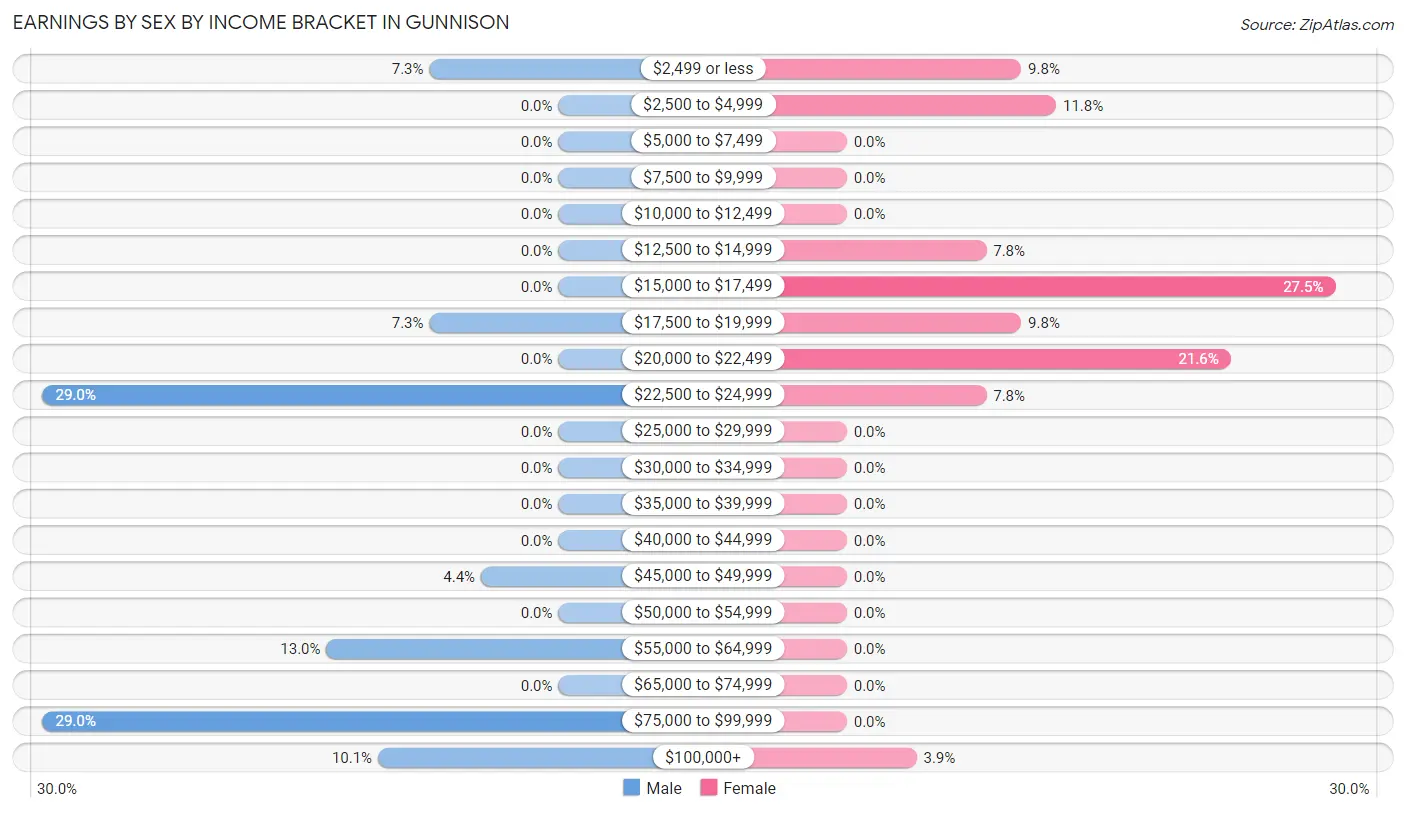
| Income | Male | Female |
| $2,499 or less | 5 (7.2%) | 5 (9.8%) |
| $2,500 to $4,999 | 0 (0.0%) | 6 (11.8%) |
| $5,000 to $7,499 | 0 (0.0%) | 0 (0.0%) |
| $7,500 to $9,999 | 0 (0.0%) | 0 (0.0%) |
| $10,000 to $12,499 | 0 (0.0%) | 0 (0.0%) |
| $12,500 to $14,999 | 0 (0.0%) | 4 (7.8%) |
| $15,000 to $17,499 | 0 (0.0%) | 14 (27.5%) |
| $17,500 to $19,999 | 5 (7.2%) | 5 (9.8%) |
| $20,000 to $22,499 | 0 (0.0%) | 11 (21.6%) |
| $22,500 to $24,999 | 20 (29.0%) | 4 (7.8%) |
| $25,000 to $29,999 | 0 (0.0%) | 0 (0.0%) |
| $30,000 to $34,999 | 0 (0.0%) | 0 (0.0%) |
| $35,000 to $39,999 | 0 (0.0%) | 0 (0.0%) |
| $40,000 to $44,999 | 0 (0.0%) | 0 (0.0%) |
| $45,000 to $49,999 | 3 (4.3%) | 0 (0.0%) |
| $50,000 to $54,999 | 0 (0.0%) | 0 (0.0%) |
| $55,000 to $64,999 | 9 (13.0%) | 0 (0.0%) |
| $65,000 to $74,999 | 0 (0.0%) | 0 (0.0%) |
| $75,000 to $99,999 | 20 (29.0%) | 0 (0.0%) |
| $100,000+ | 7 (10.1%) | 2 (3.9%) |
| Total | 69 (100.0%) | 51 (100.0%) |
Earnings by Sex by Educational Attainment in Gunnison
| Educational Attainment | Male Income | Female Income |
| Less than High School | - | - |
| High School Diploma | - | - |
| College or Associate's Degree | - | - |
| Bachelor's Degree | - | - |
| Graduate Degree | - | - |
| Total | - | - |
Family Income in Gunnison
Family Income Brackets in Gunnison
According to the Gunnison family income data, there are 38 families falling into the $10,000 to $14,999 income range, which is the most common income bracket and makes up 37.6% of all families.
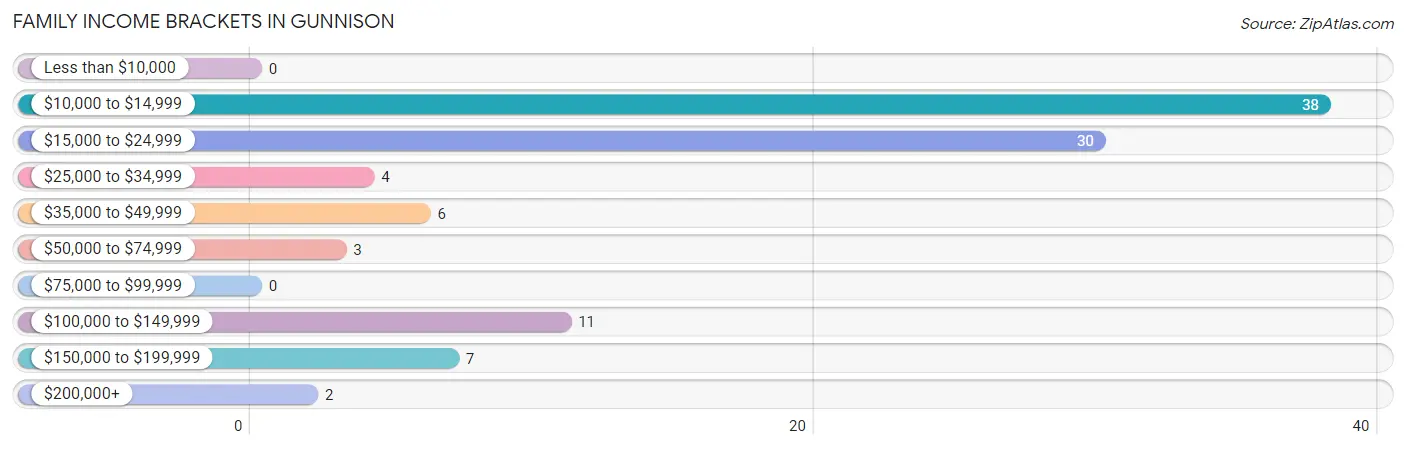
| Income Bracket | # Families | % Families |
| Less than $10,000 | 0 | 0.0% |
| $10,000 to $14,999 | 38 | 37.6% |
| $15,000 to $24,999 | 30 | 29.7% |
| $25,000 to $34,999 | 4 | 4.0% |
| $35,000 to $49,999 | 6 | 5.9% |
| $50,000 to $74,999 | 3 | 3.0% |
| $75,000 to $99,999 | 0 | 0.0% |
| $100,000 to $149,999 | 11 | 10.9% |
| $150,000 to $199,999 | 7 | 6.9% |
| $200,000+ | 2 | 2.0% |
Family Income by Famaliy Size in Gunnison
3-person families (25 | 24.7%) account for the highest median family income in Gunnison with $11,838 per family, while 3-person families (25 | 24.7%) have the highest median income of $3,946 per family member.
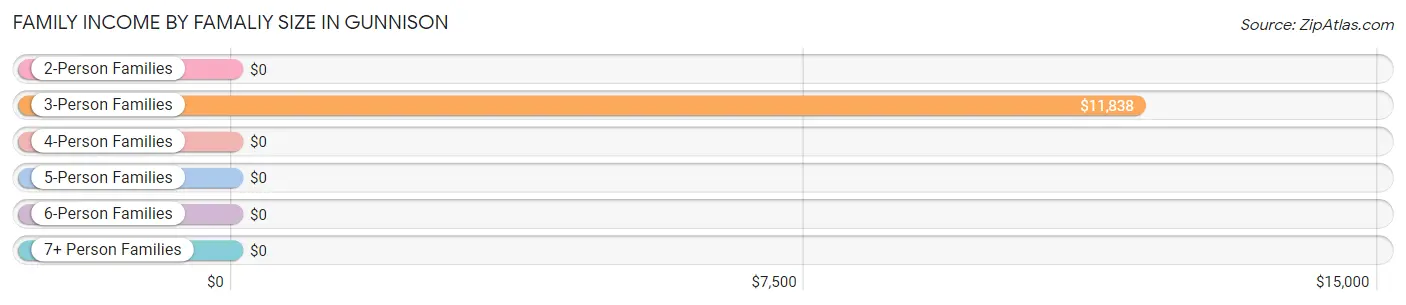
| Income Bracket | # Families | Median Income |
| 2-Person Families | 45 (44.6%) | $0 |
| 3-Person Families | 25 (24.7%) | $11,838 |
| 4-Person Families | 31 (30.7%) | $0 |
| 5-Person Families | 0 (0.0%) | $0 |
| 6-Person Families | 0 (0.0%) | $0 |
| 7+ Person Families | 0 (0.0%) | $0 |
| Total | 101 (100.0%) | $21,161 |
Family Income by Number of Earners in Gunnison
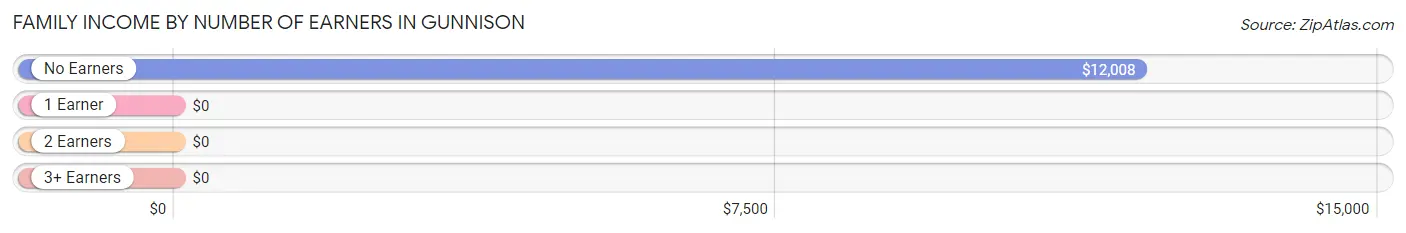
| Number of Earners | # Families | Median Income |
| No Earners | 53 (52.5%) | $12,008 |
| 1 Earner | 35 (34.6%) | $0 |
| 2 Earners | 11 (10.9%) | $0 |
| 3+ Earners | 2 (2.0%) | $0 |
| Total | 101 (100.0%) | $21,161 |
Household Income in Gunnison
Household Income Brackets in Gunnison
With 61 households falling in the category, the $10,000 to $14,999 income range is the most frequent in Gunnison, accounting for 37.4% of all households.
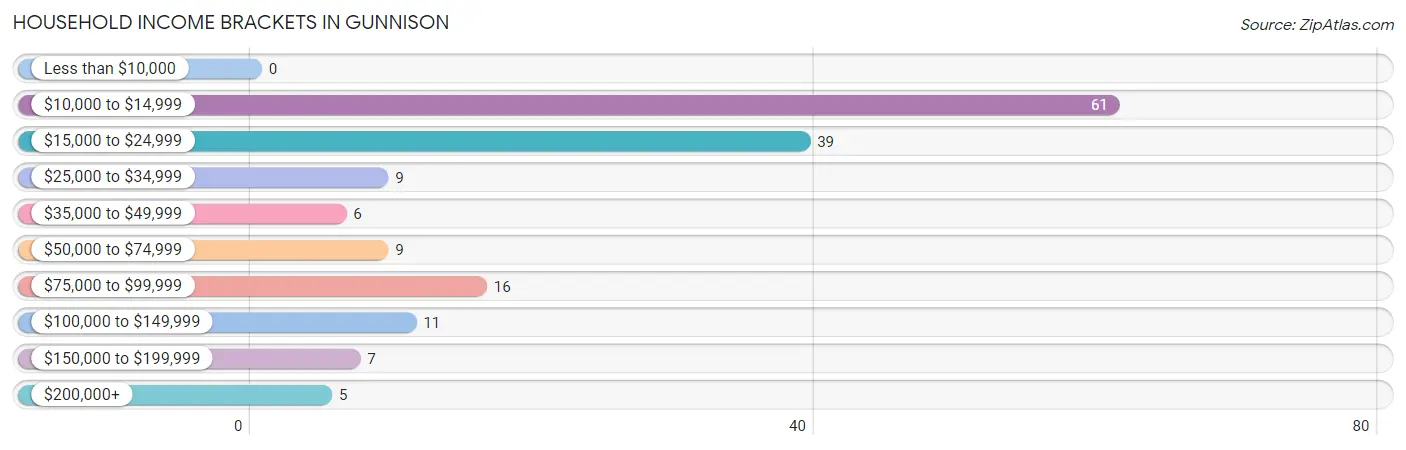
| Income Bracket | # Households | % Households |
| Less than $10,000 | 0 | 0.0% |
| $10,000 to $14,999 | 61 | 37.4% |
| $15,000 to $24,999 | 39 | 23.9% |
| $25,000 to $34,999 | 9 | 5.5% |
| $35,000 to $49,999 | 6 | 3.7% |
| $50,000 to $74,999 | 9 | 5.5% |
| $75,000 to $99,999 | 16 | 9.8% |
| $100,000 to $149,999 | 11 | 6.7% |
| $150,000 to $199,999 | 7 | 4.3% |
| $200,000+ | 5 | 3.1% |
Household Income by Householder Age in Gunnison
The median household income in Gunnison is $21,382, with the highest median household income of $23,333 found in the 65+ years age bracket for the primary householder. A total of 58 households (35.6%) fall into this category.
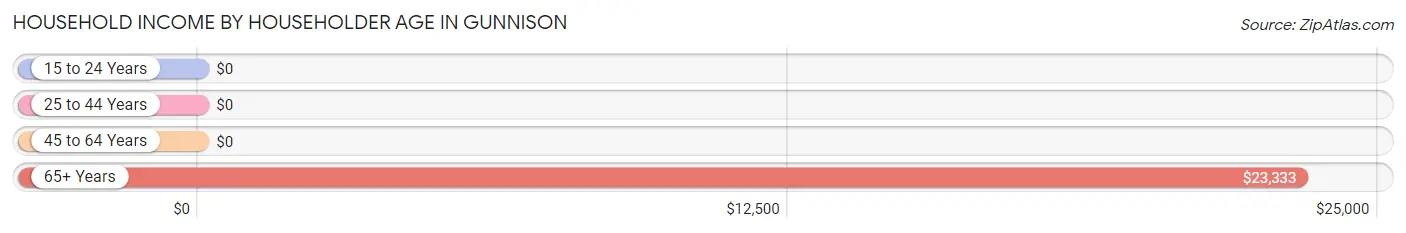
| Income Bracket | # Households | Median Income |
| 15 to 24 Years | 0 (0.0%) | $0 |
| 25 to 44 Years | 49 (30.1%) | $0 |
| 45 to 64 Years | 56 (34.4%) | $0 |
| 65+ Years | 58 (35.6%) | $23,333 |
| Total | 163 (100.0%) | $21,382 |
Poverty in Gunnison
Income Below Poverty by Sex and Age in Gunnison
With 35.8% poverty level for males and 64.9% for females among the residents of Gunnison, 12 to 14 year old males and under 5 year old females are the most vulnerable to poverty, with 9 males (100.0%) and 22 females (100.0%) in their respective age groups living below the poverty level.
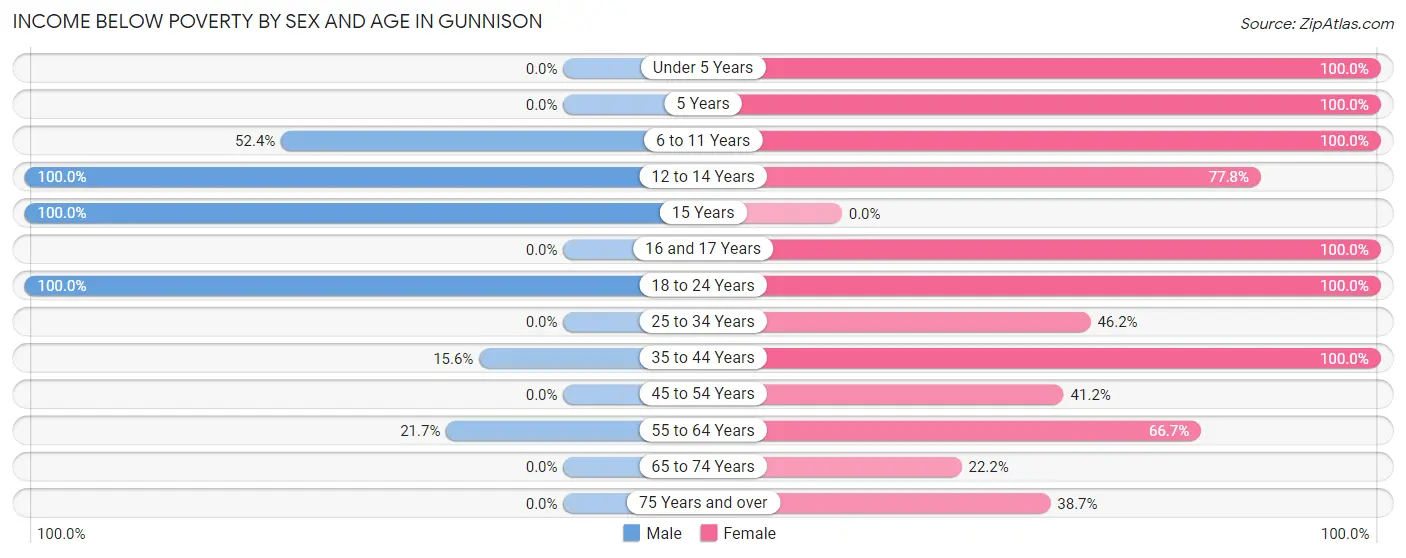
| Age Bracket | Male | Female |
| Under 5 Years | 0 (0.0%) | 22 (100.0%) |
| 5 Years | 0 (0.0%) | 17 (100.0%) |
| 6 to 11 Years | 11 (52.4%) | 6 (100.0%) |
| 12 to 14 Years | 9 (100.0%) | 7 (77.8%) |
| 15 Years | 9 (100.0%) | 0 (0.0%) |
| 16 and 17 Years | 0 (0.0%) | 7 (100.0%) |
| 18 to 24 Years | 15 (100.0%) | 5 (100.0%) |
| 25 to 34 Years | 0 (0.0%) | 12 (46.2%) |
| 35 to 44 Years | 5 (15.6%) | 32 (100.0%) |
| 45 to 54 Years | 0 (0.0%) | 14 (41.2%) |
| 55 to 64 Years | 5 (21.7%) | 6 (66.7%) |
| 65 to 74 Years | 0 (0.0%) | 6 (22.2%) |
| 75 Years and over | 0 (0.0%) | 12 (38.7%) |
| Total | 54 (35.8%) | 146 (64.9%) |
Income Above Poverty by Sex and Age in Gunnison
According to the poverty statistics in Gunnison, males aged 16 and 17 years and females aged 65 to 74 years are the age groups that are most secure financially, with 100.0% of males and 77.8% of females in these age groups living above the poverty line.
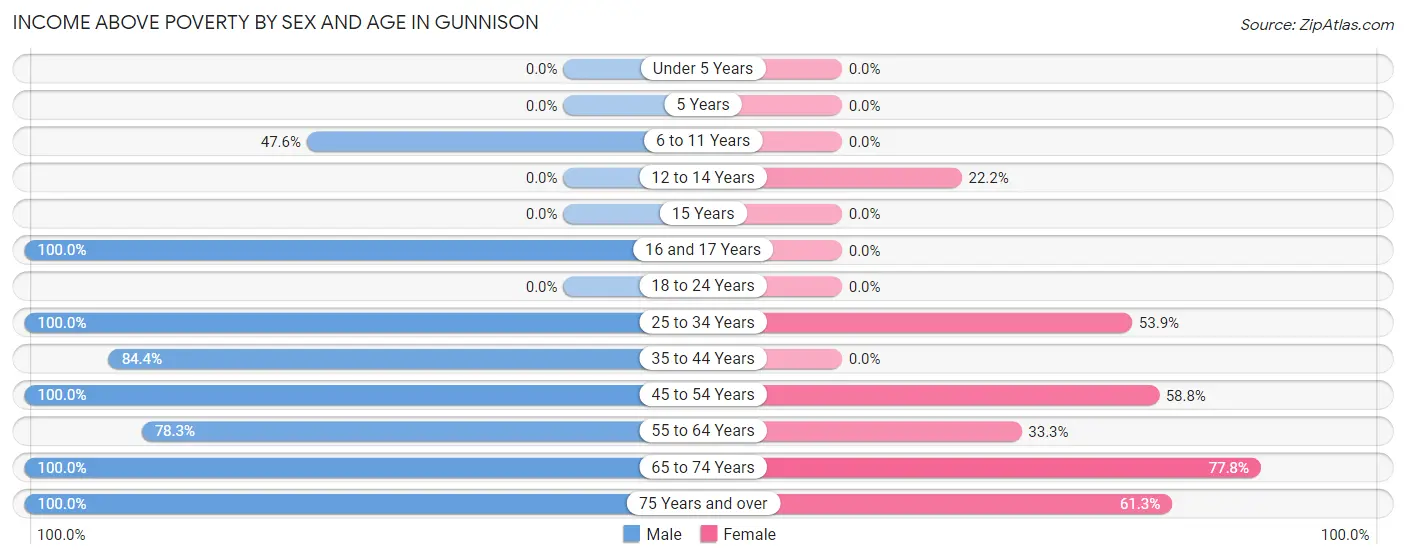
| Age Bracket | Male | Female |
| Under 5 Years | 0 (0.0%) | 0 (0.0%) |
| 5 Years | 0 (0.0%) | 0 (0.0%) |
| 6 to 11 Years | 10 (47.6%) | 0 (0.0%) |
| 12 to 14 Years | 0 (0.0%) | 2 (22.2%) |
| 15 Years | 0 (0.0%) | 0 (0.0%) |
| 16 and 17 Years | 8 (100.0%) | 0 (0.0%) |
| 18 to 24 Years | 0 (0.0%) | 0 (0.0%) |
| 25 to 34 Years | 19 (100.0%) | 14 (53.8%) |
| 35 to 44 Years | 27 (84.4%) | 0 (0.0%) |
| 45 to 54 Years | 6 (100.0%) | 20 (58.8%) |
| 55 to 64 Years | 18 (78.3%) | 3 (33.3%) |
| 65 to 74 Years | 5 (100.0%) | 21 (77.8%) |
| 75 Years and over | 4 (100.0%) | 19 (61.3%) |
| Total | 97 (64.2%) | 79 (35.1%) |
Income Below Poverty Among Married-Couple Families in Gunnison
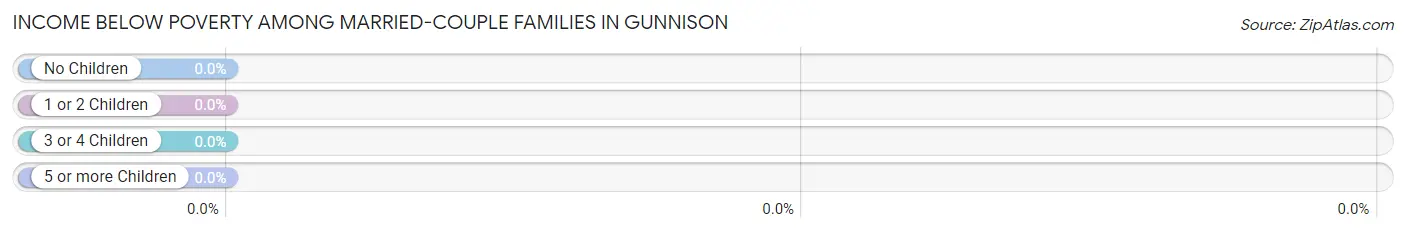
| Children | Above Poverty | Below Poverty |
| No Children | 15 (100.0%) | 0 (0.0%) |
| 1 or 2 Children | 7 (100.0%) | 0 (0.0%) |
| 3 or 4 Children | 0 (0.0%) | 0 (0.0%) |
| 5 or more Children | 0 (0.0%) | 0 (0.0%) |
| Total | 22 (100.0%) | 0 (0.0%) |
Income Below Poverty Among Single-Parent Households in Gunnison
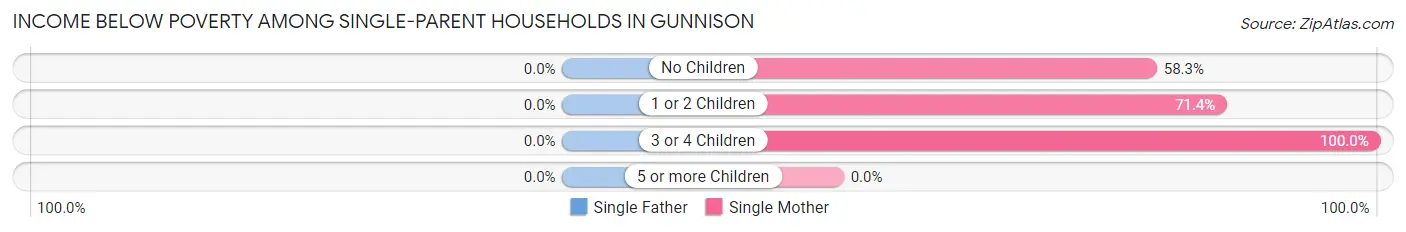
| Children | Single Father | Single Mother |
| No Children | 0 (0.0%) | 21 (58.3%) |
| 1 or 2 Children | 0 (0.0%) | 15 (71.4%) |
| 3 or 4 Children | 0 (0.0%) | 22 (100.0%) |
| 5 or more Children | 0 (0.0%) | 0 (0.0%) |
| Total | 0 (0.0%) | 58 (73.4%) |
Income Below Poverty Among Married-Couple vs Single-Parent Households in Gunnison
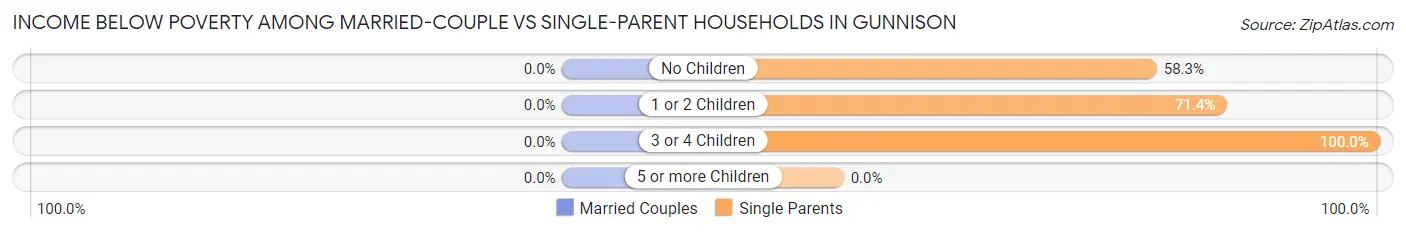
| Children | Married-Couple Families | Single-Parent Households |
| No Children | 0 (0.0%) | 21 (58.3%) |
| 1 or 2 Children | 0 (0.0%) | 15 (71.4%) |
| 3 or 4 Children | 0 (0.0%) | 22 (100.0%) |
| 5 or more Children | 0 (0.0%) | 0 (0.0%) |
| Total | 0 (0.0%) | 58 (73.4%) |
Race in Gunnison
The most populous races in Gunnison are Black / African American (300 | 79.8%), Two or more Races (49 | 13.0%), and White / Caucasian (27 | 7.2%).
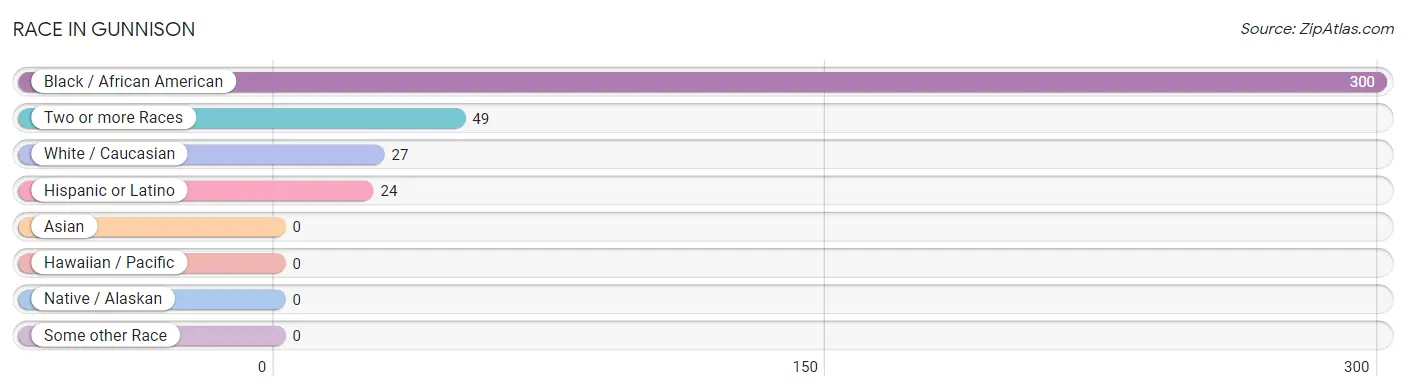
| Race | # Population | % Population |
| Asian | 0 | 0.0% |
| Black / African American | 300 | 79.8% |
| Hawaiian / Pacific | 0 | 0.0% |
| Hispanic or Latino | 24 | 6.4% |
| Native / Alaskan | 0 | 0.0% |
| White / Caucasian | 27 | 7.2% |
| Two or more Races | 49 | 13.0% |
| Some other Race | 0 | 0.0% |
| Total | 376 | 100.0% |
Ancestry in Gunnison
The most populous ancestries reported in Gunnison are Mexican (24 | 6.4%), and American (22 | 5.9%), together accounting for 12.2% of all Gunnison residents.
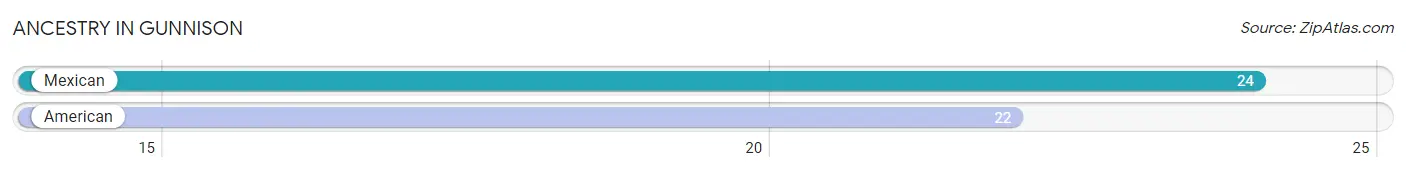
| Ancestry | # Population | % Population |
| American | 22 | 5.9% |
| Mexican | 24 | 6.4% | View All 2 Rows |
Immigrants in Gunnison

| Immigration Origin | # Population | % Population | View All 0 Rows |
Sex and Age in Gunnison
Sex and Age in Gunnison
The most populous age groups in Gunnison are 40 to 44 Years (27 | 17.9%) for men and 35 to 39 Years (24 | 10.7%) for women.

| Age Bracket | Male | Female |
| Under 5 Years | 0 (0.0%) | 22 (9.8%) |
| 5 to 9 Years | 15 (9.9%) | 23 (10.2%) |
| 10 to 14 Years | 15 (9.9%) | 9 (4.0%) |
| 15 to 19 Years | 23 (15.2%) | 12 (5.3%) |
| 20 to 24 Years | 9 (6.0%) | 0 (0.0%) |
| 25 to 29 Years | 19 (12.6%) | 20 (8.9%) |
| 30 to 34 Years | 0 (0.0%) | 6 (2.7%) |
| 35 to 39 Years | 5 (3.3%) | 24 (10.7%) |
| 40 to 44 Years | 27 (17.9%) | 8 (3.6%) |
| 45 to 49 Years | 0 (0.0%) | 18 (8.0%) |
| 50 to 54 Years | 6 (4.0%) | 16 (7.1%) |
| 55 to 59 Years | 13 (8.6%) | 0 (0.0%) |
| 60 to 64 Years | 10 (6.6%) | 9 (4.0%) |
| 65 to 69 Years | 5 (3.3%) | 22 (9.8%) |
| 70 to 74 Years | 0 (0.0%) | 5 (2.2%) |
| 75 to 79 Years | 0 (0.0%) | 0 (0.0%) |
| 80 to 84 Years | 4 (2.6%) | 11 (4.9%) |
| 85 Years and over | 0 (0.0%) | 20 (8.9%) |
| Total | 151 (100.0%) | 225 (100.0%) |
Families and Households in Gunnison
Median Family Size in Gunnison
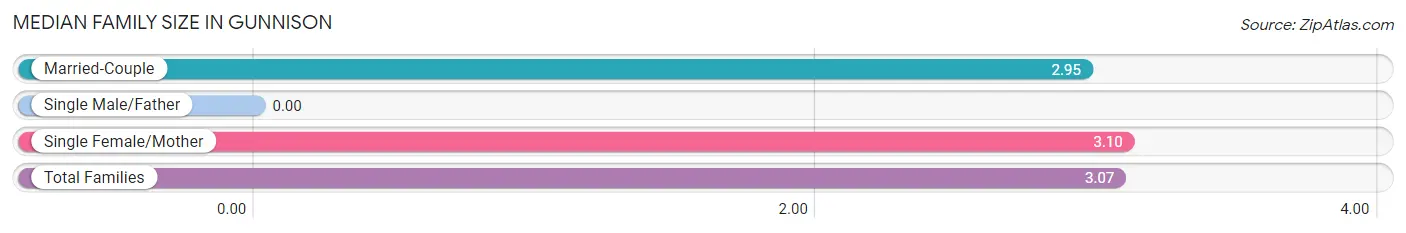
| Family Type | # Families | Family Size |
| Married-Couple | 22 (21.8%) | 2.95 |
| Single Male/Father | 0 (0.0%) | - |
| Single Female/Mother | 79 (78.2%) | 3.10 |
| Total Families | 101 (100.0%) | 3.07 |
Median Household Size in Gunnison
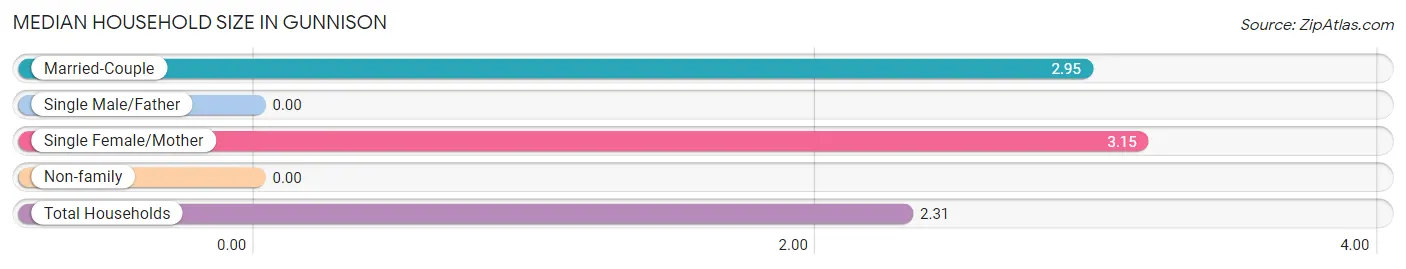
| Household Type | # Households | Household Size |
| Married-Couple | 22 (13.5%) | 2.95 |
| Single Male/Father | 0 (0.0%) | - |
| Single Female/Mother | 79 (48.5%) | 3.15 |
| Non-family | 62 (38.0%) | - |
| Total Households | 163 (100.0%) | 2.31 |
Household Size by Marriage Status in Gunnison
Out of a total of 163 households in Gunnison, 101 (62.0%) are family households, while 62 (38.0%) are nonfamily households. The most numerous type of family households are 2-person households, comprising 45, and the most common type of nonfamily households are 1-person households, comprising 62.
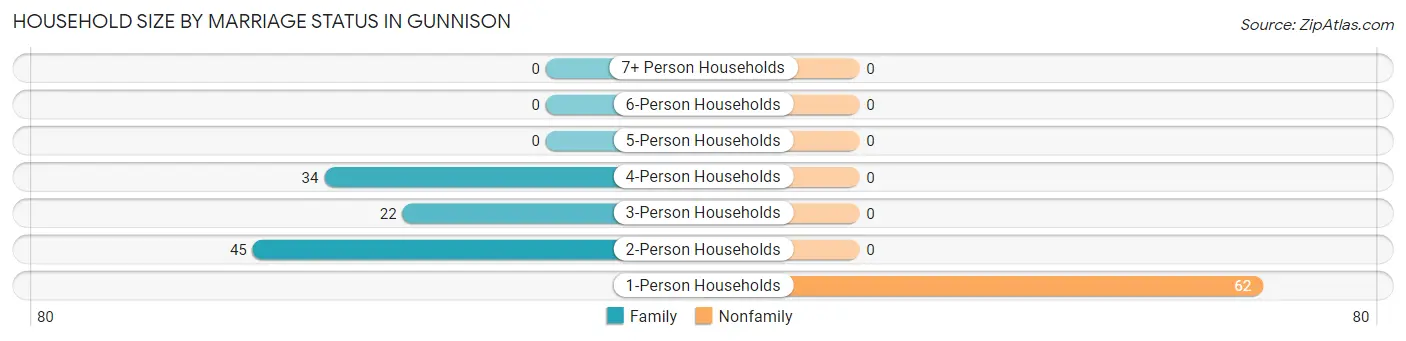
| Household Size | Family Households | Nonfamily Households |
| 1-Person Households | - | 62 (38.0%) |
| 2-Person Households | 45 (27.6%) | 0 (0.0%) |
| 3-Person Households | 22 (13.5%) | 0 (0.0%) |
| 4-Person Households | 34 (20.9%) | 0 (0.0%) |
| 5-Person Households | 0 (0.0%) | 0 (0.0%) |
| 6-Person Households | 0 (0.0%) | 0 (0.0%) |
| 7+ Person Households | 0 (0.0%) | 0 (0.0%) |
| Total | 101 (62.0%) | 62 (38.0%) |
Female Fertility in Gunnison
Fertility by Age in Gunnison
| Age Bracket | Women with Births | Births / 1,000 Women |
| 15 to 19 years | 0 (0.0%) | 0.0 |
| 20 to 34 years | 0 (0.0%) | 0.0 |
| 35 to 50 years | 0 (0.0%) | 0.0 |
| Total | 0 (0.0%) | 0.0 |
Fertility by Age by Marriage Status in Gunnison
| Age Bracket | Married | Unmarried |
| 15 to 19 years | 0 (0.0%) | 0 (0.0%) |
| 20 to 34 years | 0 (0.0%) | 0 (0.0%) |
| 35 to 50 years | 0 (0.0%) | 0 (0.0%) |
| Total | 0 (0.0%) | 0 (0.0%) |
Fertility by Education in Gunnison
| Educational Attainment | Women with Births | Births / 1,000 Women |
| Less than High School | 0 (0.0%) | 0.0 |
| High School Diploma | 0 (0.0%) | 0.0 |
| College or Associate's Degree | 0 (0.0%) | 0.0 |
| Bachelor's Degree | 0 (0.0%) | 0.0 |
| Graduate Degree | 0 (0.0%) | 0.0 |
| Total | 0 (0.0%) | 0.0 |
Fertility by Education by Marriage Status in Gunnison
| Educational Attainment | Married | Unmarried |
| Less than High School | 0 (0.0%) | 0 (0.0%) |
| High School Diploma | 0 (0.0%) | 0 (0.0%) |
| College or Associate's Degree | 0 (0.0%) | 0 (0.0%) |
| Bachelor's Degree | 0 (0.0%) | 0 (0.0%) |
| Graduate Degree | 0 (0.0%) | 0 (0.0%) |
| Total | 0 (0.0%) | 0 (0.0%) |
Employment Characteristics in Gunnison
Employment by Class of Employer in Gunnison
Among the 86 employed individuals in Gunnison, private company employees (64 | 74.4%), local government employees (17 | 19.8%), and state government employees (5 | 5.8%) make up the most common classes of employment.
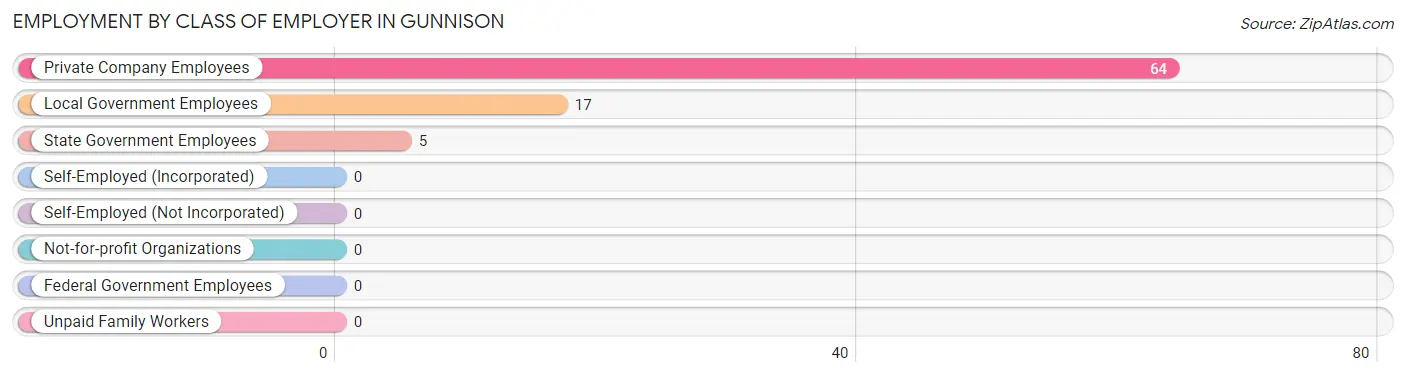
| Employer Class | # Employees | % Employees |
| Private Company Employees | 64 | 74.4% |
| Self-Employed (Incorporated) | 0 | 0.0% |
| Self-Employed (Not Incorporated) | 0 | 0.0% |
| Not-for-profit Organizations | 0 | 0.0% |
| Local Government Employees | 17 | 19.8% |
| State Government Employees | 5 | 5.8% |
| Federal Government Employees | 0 | 0.0% |
| Unpaid Family Workers | 0 | 0.0% |
| Total | 86 | 100.0% |
Employment Status by Age in Gunnison
According to the labor force statistics for Gunnison, out of the total population over 16 years of age (283), 39.2% or 111 individuals are in the labor force, with 22.5% or 25 of them unemployed. The age group with the highest labor force participation rate is 25 to 29 years, with 100.0% or 39 individuals in the labor force. Within the labor force, the 35 to 44 years age range has the highest percentage of unemployed individuals, with 89.3% or 25 of them being unemployed.
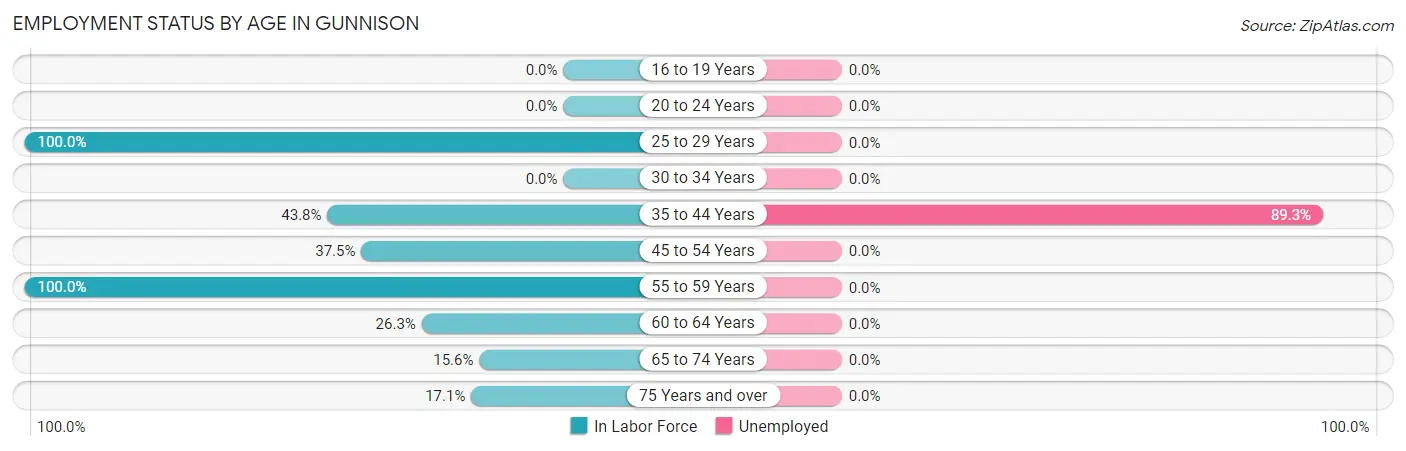
| Age Bracket | In Labor Force | Unemployed |
| 16 to 19 Years | 0 (0.0%) | 0 (0.0%) |
| 20 to 24 Years | 0 (0.0%) | 0 (0.0%) |
| 25 to 29 Years | 39 (100.0%) | 0 (0.0%) |
| 30 to 34 Years | 0 (0.0%) | 0 (0.0%) |
| 35 to 44 Years | 28 (43.8%) | 25 (89.3%) |
| 45 to 54 Years | 15 (37.5%) | 0 (0.0%) |
| 55 to 59 Years | 13 (100.0%) | 0 (0.0%) |
| 60 to 64 Years | 5 (26.3%) | 0 (0.0%) |
| 65 to 74 Years | 5 (15.6%) | 0 (0.0%) |
| 75 Years and over | 6 (17.1%) | 0 (0.0%) |
| Total | 111 (39.2%) | 25 (22.5%) |
Employment Status by Educational Attainment in Gunnison
According to labor force statistics for Gunnison, 55.2% of individuals (100) out of the total population between 25 and 64 years of age (181) are in the labor force, with 25.0% or 25 of them being unemployed. The group with the highest labor force participation rate are those with the educational attainment of bachelor's degree or higher, with 92.9% or 13 individuals in the labor force. Within the labor force, individuals with college / associate degree education have the highest percentage of unemployment, with 49.0% or 25 of them being unemployed.
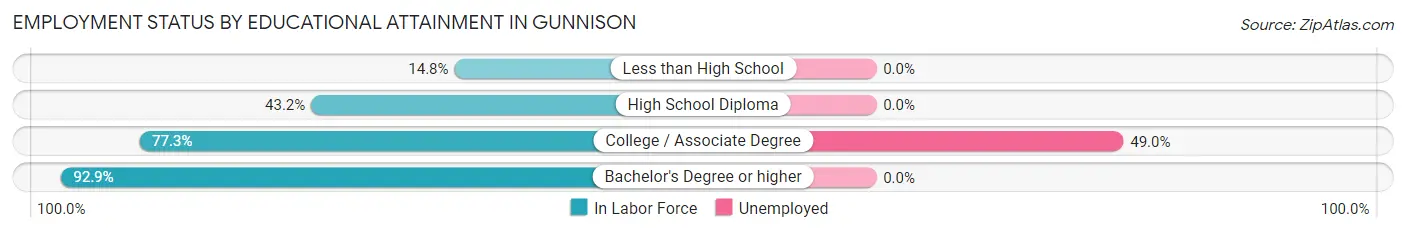
| Educational Attainment | In Labor Force | Unemployed |
| Less than High School | 4 (14.8%) | 0 (0.0%) |
| High School Diploma | 32 (43.2%) | 0 (0.0%) |
| College / Associate Degree | 51 (77.3%) | 32 (49.0%) |
| Bachelor's Degree or higher | 13 (92.9%) | 0 (0.0%) |
| Total | 100 (55.2%) | 45 (25.0%) |
Employment Occupations by Sex in Gunnison
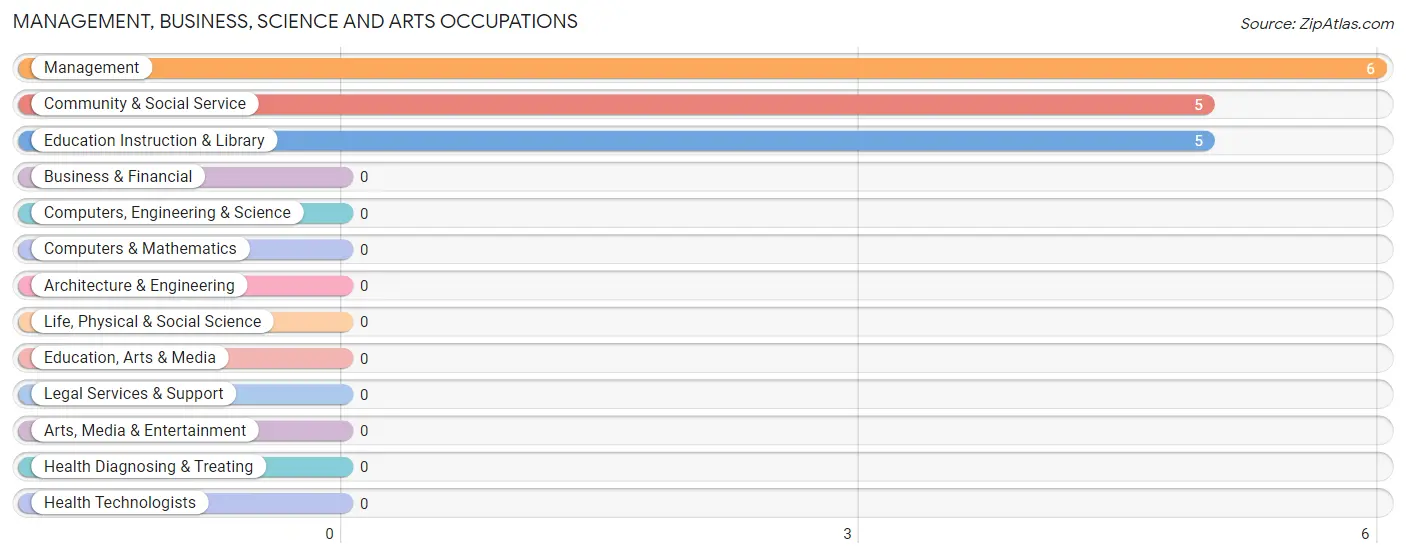
Management, Business, Science and Arts Occupations
The most common Management, Business, Science and Arts occupations in Gunnison are Management (6 | 7.0%), Community & Social Service (5 | 5.8%), and Education Instruction & Library (5 | 5.8%).
Management, Business, Science and Arts Occupations by Sex
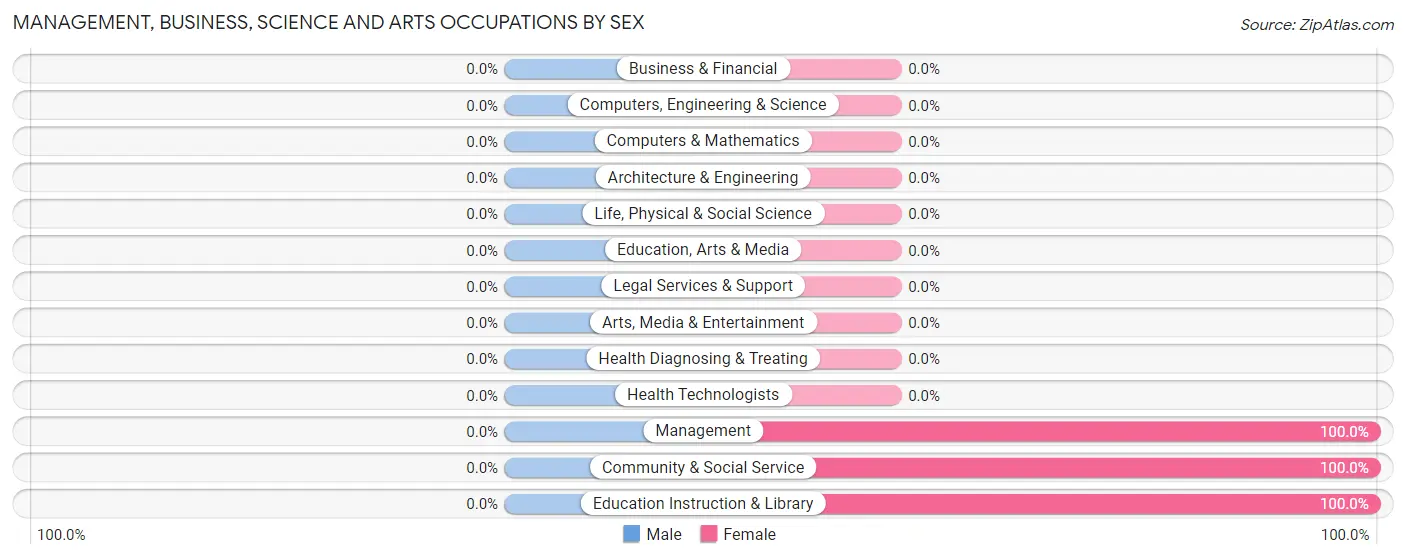
| Occupation | Male | Female |
| Management | 0 (0.0%) | 6 (100.0%) |
| Business & Financial | 0 (0.0%) | 0 (0.0%) |
| Computers, Engineering & Science | 0 (0.0%) | 0 (0.0%) |
| Computers & Mathematics | 0 (0.0%) | 0 (0.0%) |
| Architecture & Engineering | 0 (0.0%) | 0 (0.0%) |
| Life, Physical & Social Science | 0 (0.0%) | 0 (0.0%) |
| Community & Social Service | 0 (0.0%) | 5 (100.0%) |
| Education, Arts & Media | 0 (0.0%) | 0 (0.0%) |
| Legal Services & Support | 0 (0.0%) | 0 (0.0%) |
| Education Instruction & Library | 0 (0.0%) | 5 (100.0%) |
| Arts, Media & Entertainment | 0 (0.0%) | 0 (0.0%) |
| Health Diagnosing & Treating | 0 (0.0%) | 0 (0.0%) |
| Health Technologists | 0 (0.0%) | 0 (0.0%) |
| Total (Category) | 0 (0.0%) | 11 (100.0%) |
| Total (Overall) | 40 (46.5%) | 46 (53.5%) |
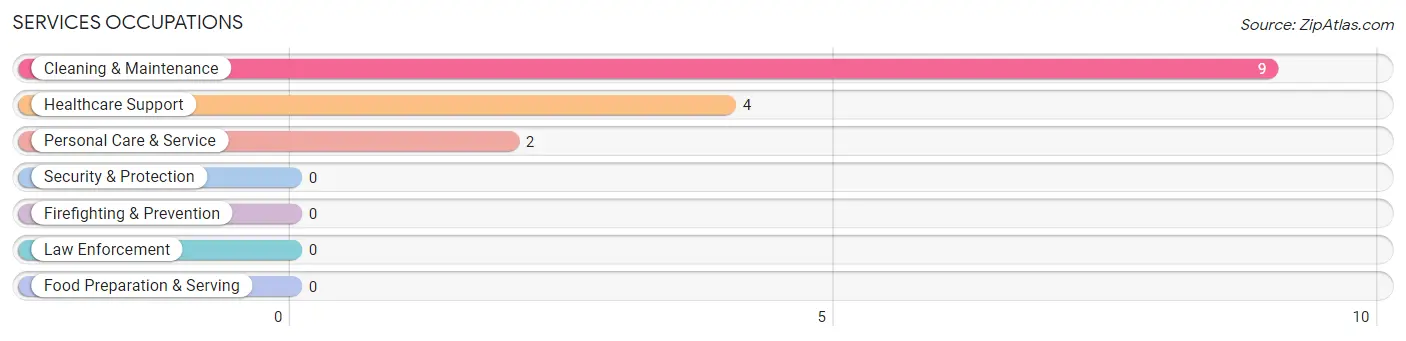
Services Occupations
The most common Services occupations in Gunnison are Cleaning & Maintenance (9 | 10.5%), Healthcare Support (4 | 4.6%), and Personal Care & Service (2 | 2.3%).
Services Occupations by Sex
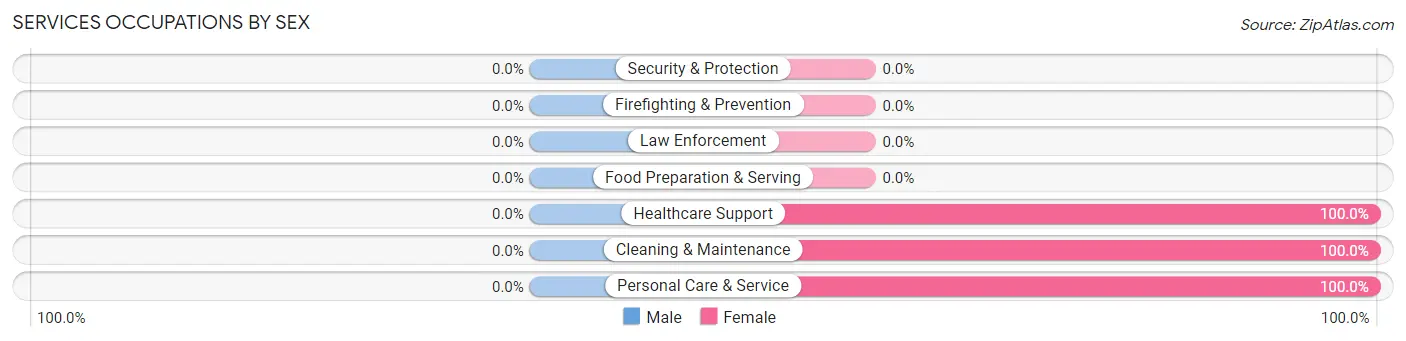
| Occupation | Male | Female |
| Healthcare Support | 0 (0.0%) | 4 (100.0%) |
| Security & Protection | 0 (0.0%) | 0 (0.0%) |
| Firefighting & Prevention | 0 (0.0%) | 0 (0.0%) |
| Law Enforcement | 0 (0.0%) | 0 (0.0%) |
| Food Preparation & Serving | 0 (0.0%) | 0 (0.0%) |
| Cleaning & Maintenance | 0 (0.0%) | 9 (100.0%) |
| Personal Care & Service | 0 (0.0%) | 2 (100.0%) |
| Total (Category) | 0 (0.0%) | 15 (100.0%) |
| Total (Overall) | 40 (46.5%) | 46 (53.5%) |
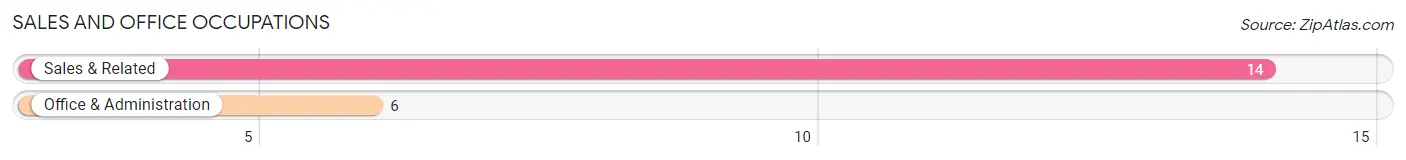
Sales and Office Occupations
The most common Sales and Office occupations in Gunnison are Sales & Related (14 | 16.3%), and Office & Administration (6 | 7.0%).
Sales and Office Occupations by Sex
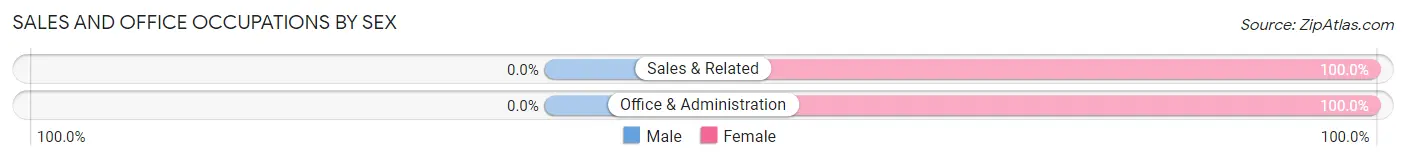
| Occupation | Male | Female |
| Sales & Related | 0 (0.0%) | 14 (100.0%) |
| Office & Administration | 0 (0.0%) | 6 (100.0%) |
| Total (Category) | 0 (0.0%) | 20 (100.0%) |
| Total (Overall) | 40 (46.5%) | 46 (53.5%) |
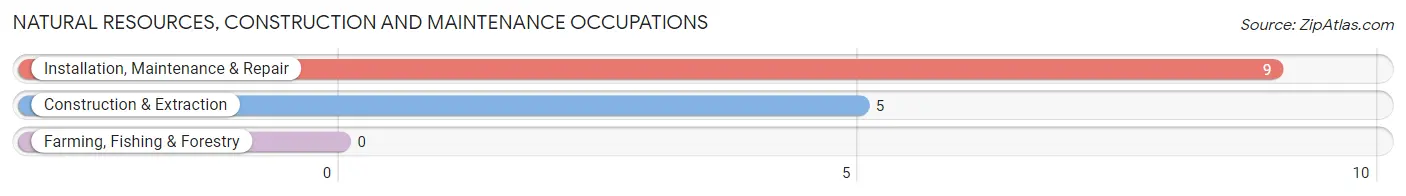
Natural Resources, Construction and Maintenance Occupations
The most common Natural Resources, Construction and Maintenance occupations in Gunnison are Installation, Maintenance & Repair (9 | 10.5%), and Construction & Extraction (5 | 5.8%).
Natural Resources, Construction and Maintenance Occupations by Sex
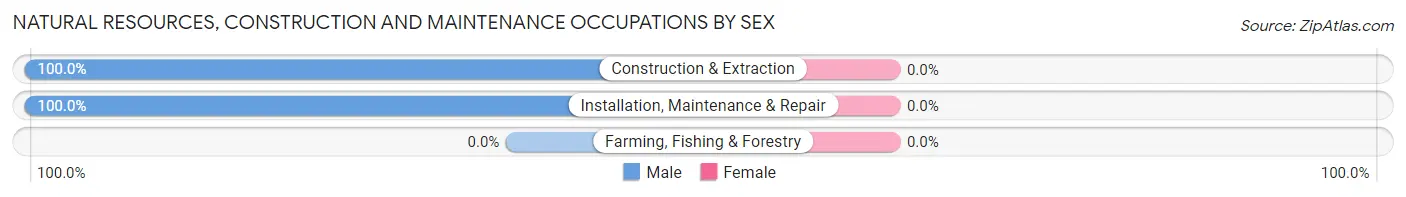
| Occupation | Male | Female |
| Farming, Fishing & Forestry | 0 (0.0%) | 0 (0.0%) |
| Construction & Extraction | 5 (100.0%) | 0 (0.0%) |
| Installation, Maintenance & Repair | 9 (100.0%) | 0 (0.0%) |
| Total (Category) | 14 (100.0%) | 0 (0.0%) |
| Total (Overall) | 40 (46.5%) | 46 (53.5%) |
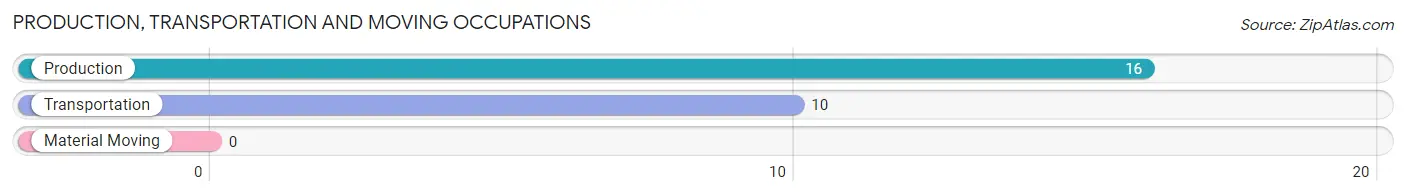
Production, Transportation and Moving Occupations
The most common Production, Transportation and Moving occupations in Gunnison are Production (16 | 18.6%), and Transportation (10 | 11.6%).
Production, Transportation and Moving Occupations by Sex
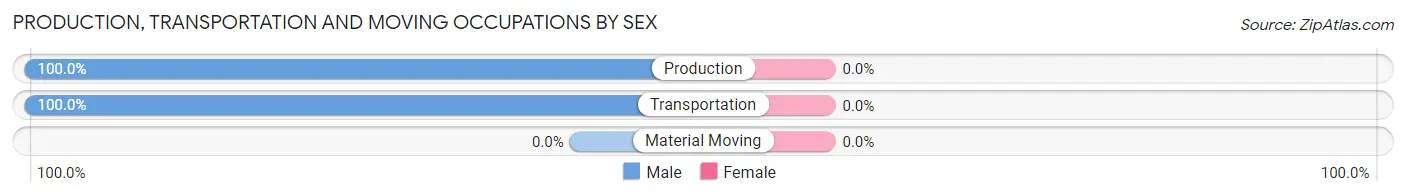
| Occupation | Male | Female |
| Production | 16 (100.0%) | 0 (0.0%) |
| Transportation | 10 (100.0%) | 0 (0.0%) |
| Material Moving | 0 (0.0%) | 0 (0.0%) |
| Total (Category) | 26 (100.0%) | 0 (0.0%) |
| Total (Overall) | 40 (46.5%) | 46 (53.5%) |
Employment Industries by Sex in Gunnison
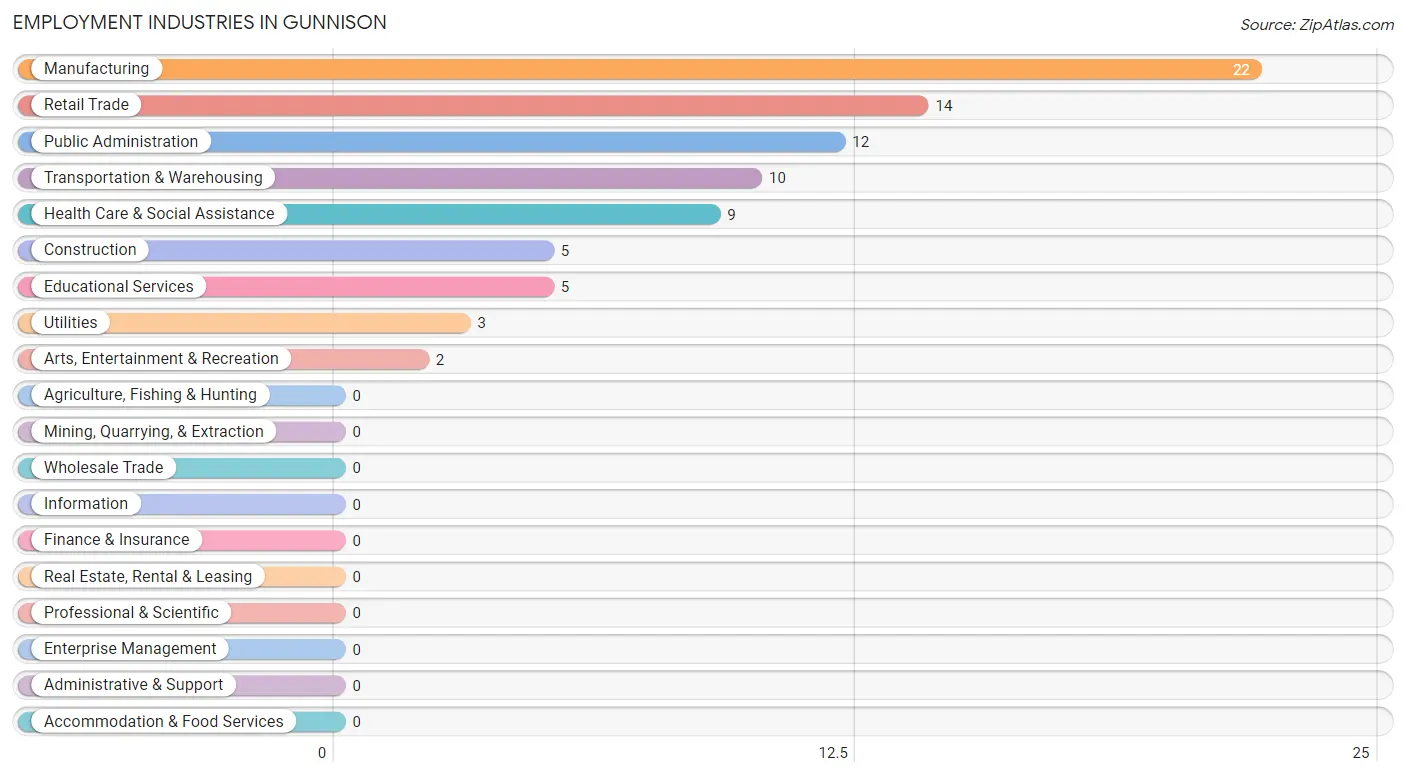
Employment Industries in Gunnison
The major employment industries in Gunnison include Manufacturing (22 | 25.6%), Retail Trade (14 | 16.3%), Public Administration (12 | 14.0%), Transportation & Warehousing (10 | 11.6%), and Health Care & Social Assistance (9 | 10.5%).
Employment Industries by Sex in Gunnison
The Gunnison industries that see more men than women are Construction (100.0%), Manufacturing (100.0%), and Transportation & Warehousing (100.0%), whereas the industries that tend to have a higher number of women are Retail Trade (100.0%), Educational Services (100.0%), and Health Care & Social Assistance (100.0%).
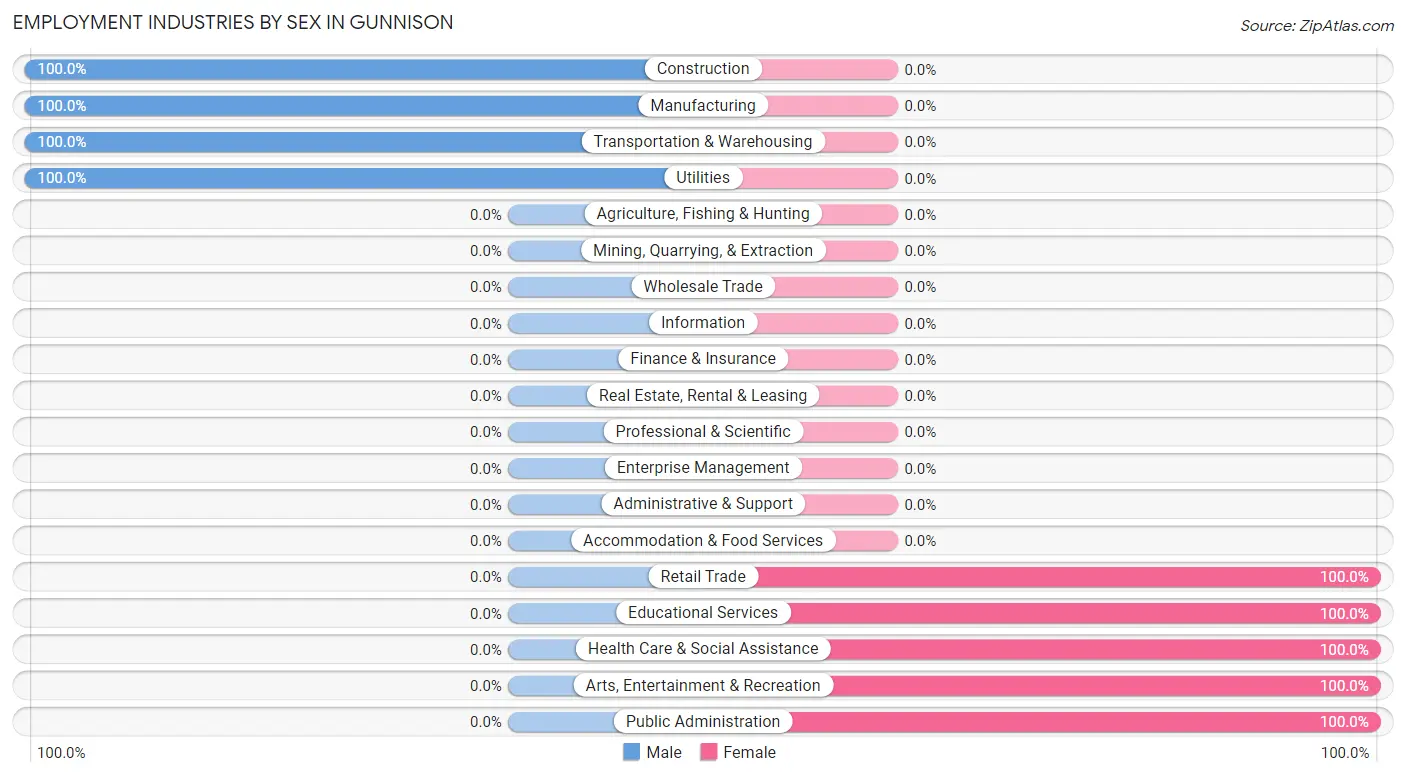
| Industry | Male | Female |
| Agriculture, Fishing & Hunting | 0 (0.0%) | 0 (0.0%) |
| Mining, Quarrying, & Extraction | 0 (0.0%) | 0 (0.0%) |
| Construction | 5 (100.0%) | 0 (0.0%) |
| Manufacturing | 22 (100.0%) | 0 (0.0%) |
| Wholesale Trade | 0 (0.0%) | 0 (0.0%) |
| Retail Trade | 0 (0.0%) | 14 (100.0%) |
| Transportation & Warehousing | 10 (100.0%) | 0 (0.0%) |
| Utilities | 3 (100.0%) | 0 (0.0%) |
| Information | 0 (0.0%) | 0 (0.0%) |
| Finance & Insurance | 0 (0.0%) | 0 (0.0%) |
| Real Estate, Rental & Leasing | 0 (0.0%) | 0 (0.0%) |
| Professional & Scientific | 0 (0.0%) | 0 (0.0%) |
| Enterprise Management | 0 (0.0%) | 0 (0.0%) |
| Administrative & Support | 0 (0.0%) | 0 (0.0%) |
| Educational Services | 0 (0.0%) | 5 (100.0%) |
| Health Care & Social Assistance | 0 (0.0%) | 9 (100.0%) |
| Arts, Entertainment & Recreation | 0 (0.0%) | 2 (100.0%) |
| Accommodation & Food Services | 0 (0.0%) | 0 (0.0%) |
| Public Administration | 0 (0.0%) | 12 (100.0%) |
| Total | 40 (46.5%) | 46 (53.5%) |
Education in Gunnison
School Enrollment in Gunnison
The most common levels of schooling among the 90 students in Gunnison are kindergarten (27 | 30.0%), high school (18 | 20.0%), and elementary school (17 | 18.9%).
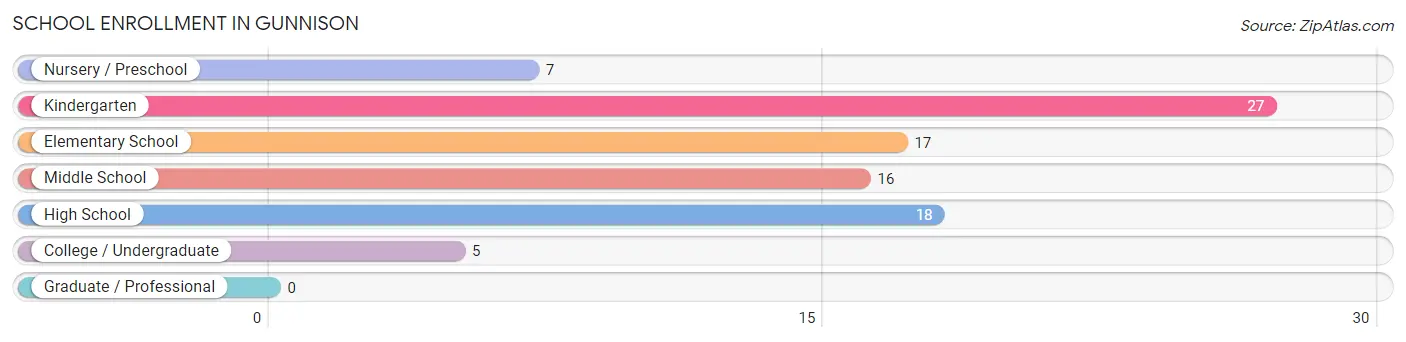
| School Level | # Students | % Students |
| Nursery / Preschool | 7 | 7.8% |
| Kindergarten | 27 | 30.0% |
| Elementary School | 17 | 18.9% |
| Middle School | 16 | 17.8% |
| High School | 18 | 20.0% |
| College / Undergraduate | 5 | 5.6% |
| Graduate / Professional | 0 | 0.0% |
| Total | 90 | 100.0% |
School Enrollment by Age by Funding Source in Gunnison
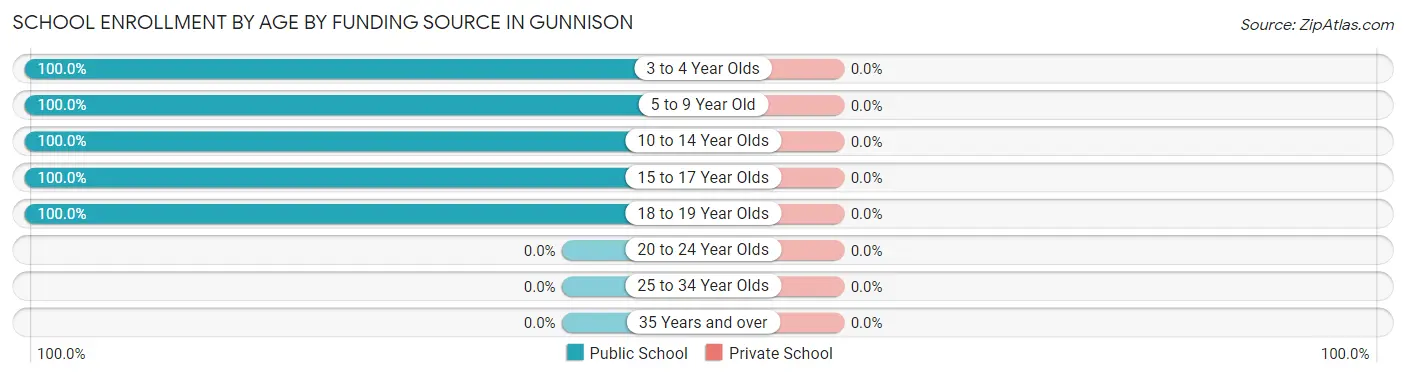
| Age Bracket | Public School | Private School |
| 3 to 4 Year Olds | 7 (100.0%) | 0 (0.0%) |
| 5 to 9 Year Old | 38 (100.0%) | 0 (0.0%) |
| 10 to 14 Year Olds | 24 (100.0%) | 0 (0.0%) |
| 15 to 17 Year Olds | 16 (100.0%) | 0 (0.0%) |
| 18 to 19 Year Olds | 5 (100.0%) | 0 (0.0%) |
| 20 to 24 Year Olds | 0 (0.0%) | 0 (0.0%) |
| 25 to 34 Year Olds | 0 (0.0%) | 0 (0.0%) |
| 35 Years and over | 0 (0.0%) | 0 (0.0%) |
| Total | 90 (100.0%) | 0 (0.0%) |
Educational Attainment by Field of Study in Gunnison
Education (11 | 44.0%), arts & humanities (7 | 28.0%), literature & languages (5 | 20.0%), and business (2 | 8.0%) are the most common fields of study among 25 individuals in Gunnison who have obtained a bachelor's degree or higher.
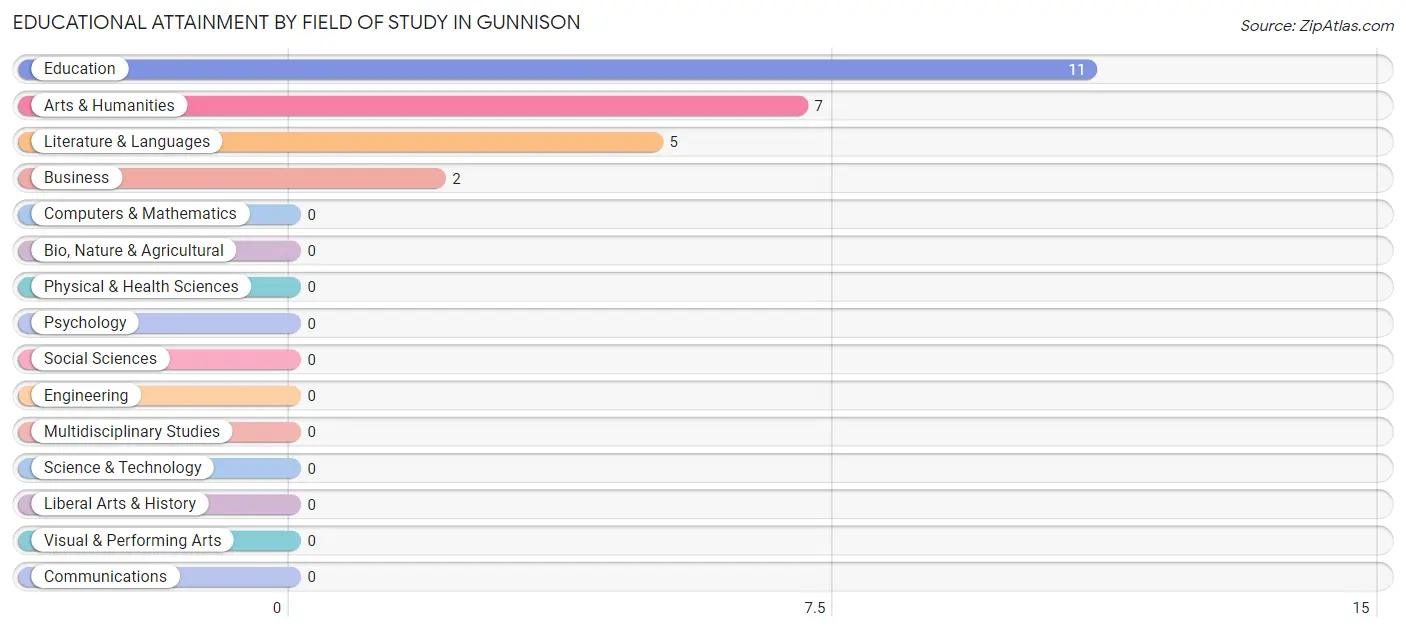
| Field of Study | # Graduates | % Graduates |
| Computers & Mathematics | 0 | 0.0% |
| Bio, Nature & Agricultural | 0 | 0.0% |
| Physical & Health Sciences | 0 | 0.0% |
| Psychology | 0 | 0.0% |
| Social Sciences | 0 | 0.0% |
| Engineering | 0 | 0.0% |
| Multidisciplinary Studies | 0 | 0.0% |
| Science & Technology | 0 | 0.0% |
| Business | 2 | 8.0% |
| Education | 11 | 44.0% |
| Literature & Languages | 5 | 20.0% |
| Liberal Arts & History | 0 | 0.0% |
| Visual & Performing Arts | 0 | 0.0% |
| Communications | 0 | 0.0% |
| Arts & Humanities | 7 | 28.0% |
| Total | 25 | 100.0% |
Transportation & Commute in Gunnison
Vehicle Availability by Sex in Gunnison
The most prevalent vehicle ownership categories in Gunnison are males with 2 vehicles (35, accounting for 87.5%) and females with 2 vehicles (25, making up 76.1%).
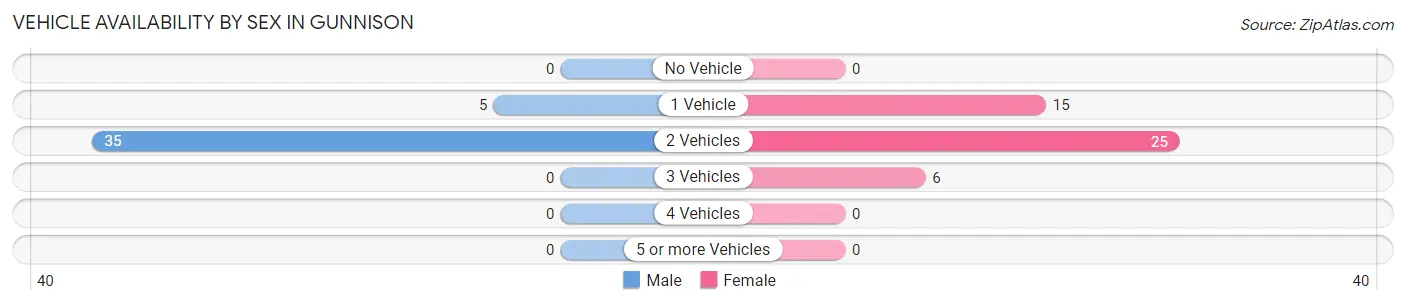
| Vehicles Available | Male | Female |
| No Vehicle | 0 (0.0%) | 0 (0.0%) |
| 1 Vehicle | 5 (12.5%) | 15 (32.6%) |
| 2 Vehicles | 35 (87.5%) | 25 (54.3%) |
| 3 Vehicles | 0 (0.0%) | 6 (13.0%) |
| 4 Vehicles | 0 (0.0%) | 0 (0.0%) |
| 5 or more Vehicles | 0 (0.0%) | 0 (0.0%) |
| Total | 40 (100.0%) | 46 (100.0%) |
Commute Time in Gunnison
The most frequently occuring commute durations in Gunnison are 30 to 34 minutes (37 commuters, 43.0%), 15 to 19 minutes (12 commuters, 14.0%), and 5 to 9 minutes (9 commuters, 10.5%).
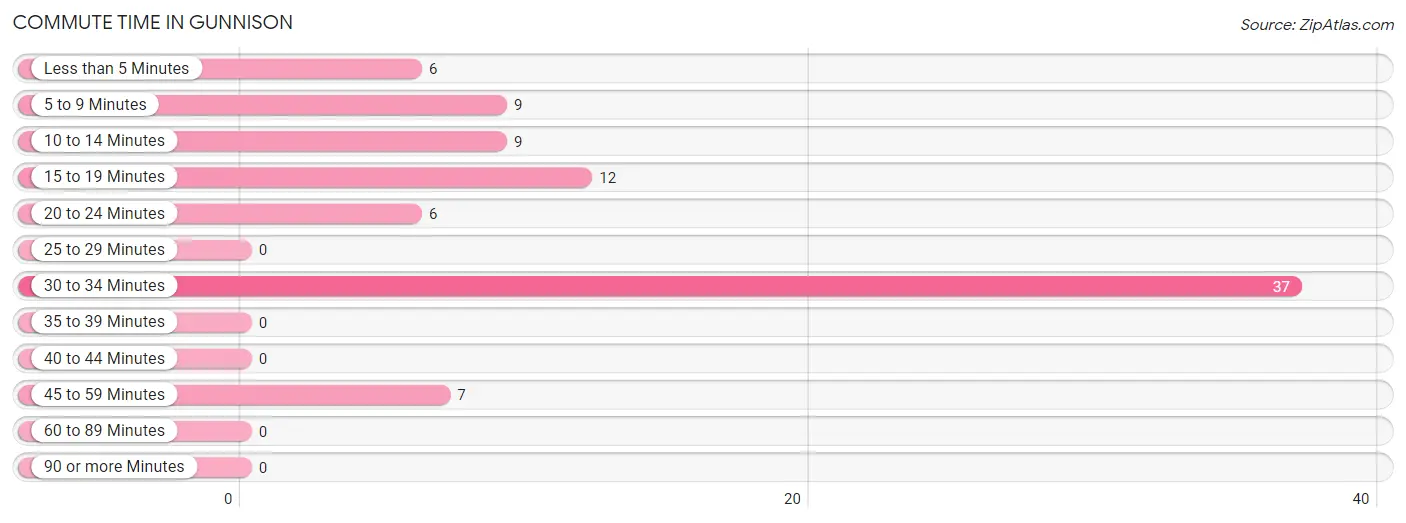
| Commute Time | # Commuters | % Commuters |
| Less than 5 Minutes | 6 | 7.0% |
| 5 to 9 Minutes | 9 | 10.5% |
| 10 to 14 Minutes | 9 | 10.5% |
| 15 to 19 Minutes | 12 | 14.0% |
| 20 to 24 Minutes | 6 | 7.0% |
| 25 to 29 Minutes | 0 | 0.0% |
| 30 to 34 Minutes | 37 | 43.0% |
| 35 to 39 Minutes | 0 | 0.0% |
| 40 to 44 Minutes | 0 | 0.0% |
| 45 to 59 Minutes | 7 | 8.1% |
| 60 to 89 Minutes | 0 | 0.0% |
| 90 or more Minutes | 0 | 0.0% |
Commute Time by Sex in Gunnison
The most common commute times in Gunnison are 30 to 34 minutes (19 commuters, 47.5%) for males and 30 to 34 minutes (18 commuters, 39.1%) for females.
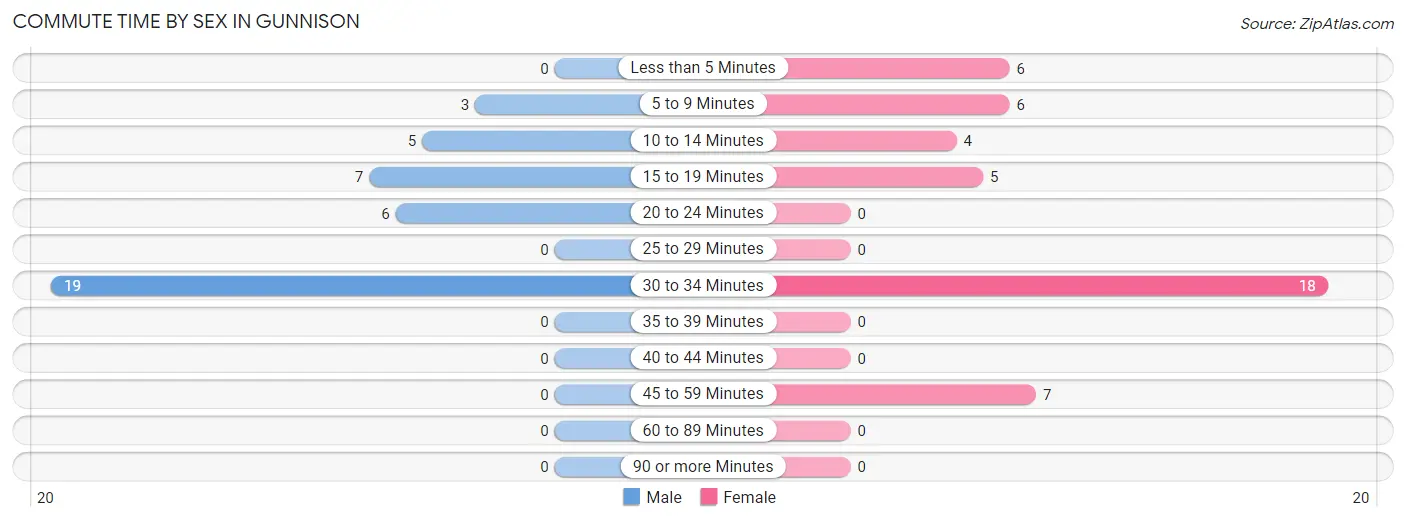
| Commute Time | Male | Female |
| Less than 5 Minutes | 0 (0.0%) | 6 (13.0%) |
| 5 to 9 Minutes | 3 (7.5%) | 6 (13.0%) |
| 10 to 14 Minutes | 5 (12.5%) | 4 (8.7%) |
| 15 to 19 Minutes | 7 (17.5%) | 5 (10.9%) |
| 20 to 24 Minutes | 6 (15.0%) | 0 (0.0%) |
| 25 to 29 Minutes | 0 (0.0%) | 0 (0.0%) |
| 30 to 34 Minutes | 19 (47.5%) | 18 (39.1%) |
| 35 to 39 Minutes | 0 (0.0%) | 0 (0.0%) |
| 40 to 44 Minutes | 0 (0.0%) | 0 (0.0%) |
| 45 to 59 Minutes | 0 (0.0%) | 7 (15.2%) |
| 60 to 89 Minutes | 0 (0.0%) | 0 (0.0%) |
| 90 or more Minutes | 0 (0.0%) | 0 (0.0%) |
Time of Departure to Work by Sex in Gunnison
The most frequent times of departure to work in Gunnison are 6:30 AM to 6:59 AM (18, 45.0%) for males and 7:00 AM to 7:29 AM (14, 30.4%) for females.
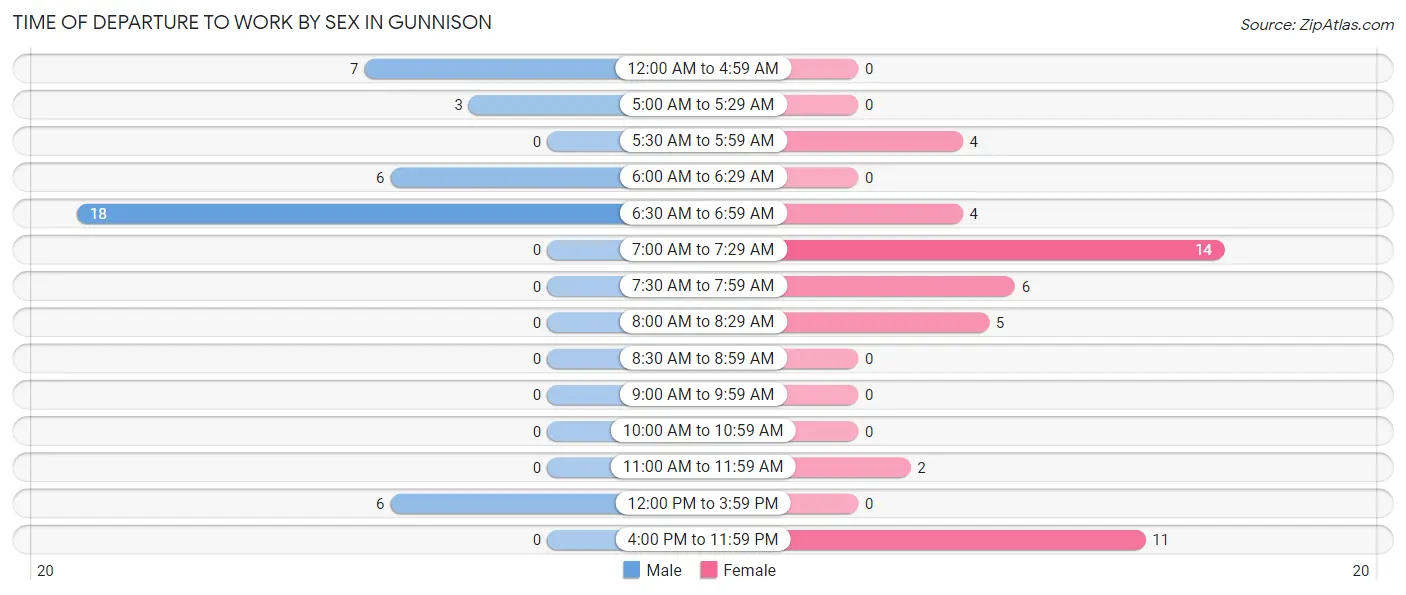
| Time of Departure | Male | Female |
| 12:00 AM to 4:59 AM | 7 (17.5%) | 0 (0.0%) |
| 5:00 AM to 5:29 AM | 3 (7.5%) | 0 (0.0%) |
| 5:30 AM to 5:59 AM | 0 (0.0%) | 4 (8.7%) |
| 6:00 AM to 6:29 AM | 6 (15.0%) | 0 (0.0%) |
| 6:30 AM to 6:59 AM | 18 (45.0%) | 4 (8.7%) |
| 7:00 AM to 7:29 AM | 0 (0.0%) | 14 (30.4%) |
| 7:30 AM to 7:59 AM | 0 (0.0%) | 6 (13.0%) |
| 8:00 AM to 8:29 AM | 0 (0.0%) | 5 (10.9%) |
| 8:30 AM to 8:59 AM | 0 (0.0%) | 0 (0.0%) |
| 9:00 AM to 9:59 AM | 0 (0.0%) | 0 (0.0%) |
| 10:00 AM to 10:59 AM | 0 (0.0%) | 0 (0.0%) |
| 11:00 AM to 11:59 AM | 0 (0.0%) | 2 (4.3%) |
| 12:00 PM to 3:59 PM | 6 (15.0%) | 0 (0.0%) |
| 4:00 PM to 11:59 PM | 0 (0.0%) | 11 (23.9%) |
| Total | 40 (100.0%) | 46 (100.0%) |
Housing Occupancy in Gunnison
Occupancy by Ownership in Gunnison
Of the total 163 dwellings in Gunnison, owner-occupied units account for 107 (65.6%), while renter-occupied units make up 56 (34.4%).
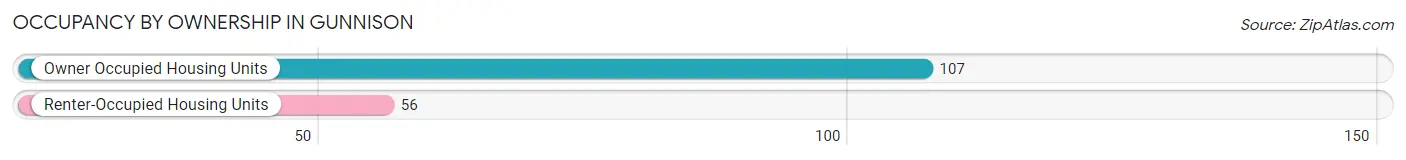
| Occupancy | # Housing Units | % Housing Units |
| Owner Occupied Housing Units | 107 | 65.6% |
| Renter-Occupied Housing Units | 56 | 34.4% |
| Total Occupied Housing Units | 163 | 100.0% |
Occupancy by Household Size in Gunnison
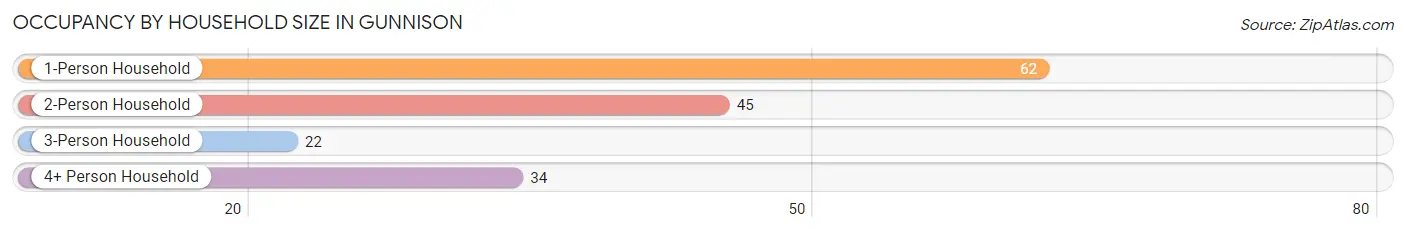
| Household Size | # Housing Units | % Housing Units |
| 1-Person Household | 62 | 38.0% |
| 2-Person Household | 45 | 27.6% |
| 3-Person Household | 22 | 13.5% |
| 4+ Person Household | 34 | 20.9% |
| Total Housing Units | 163 | 100.0% |
Occupancy by Ownership by Household Size in Gunnison
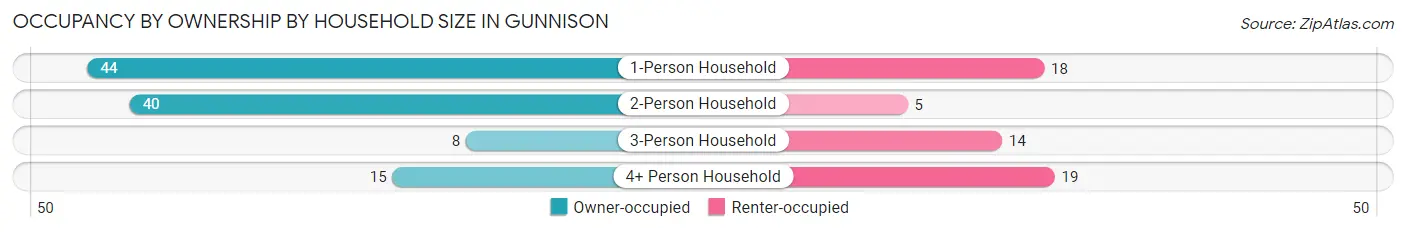
| Household Size | Owner-occupied | Renter-occupied |
| 1-Person Household | 44 (71.0%) | 18 (29.0%) |
| 2-Person Household | 40 (88.9%) | 5 (11.1%) |
| 3-Person Household | 8 (36.4%) | 14 (63.6%) |
| 4+ Person Household | 15 (44.1%) | 19 (55.9%) |
| Total Housing Units | 107 (65.6%) | 56 (34.4%) |
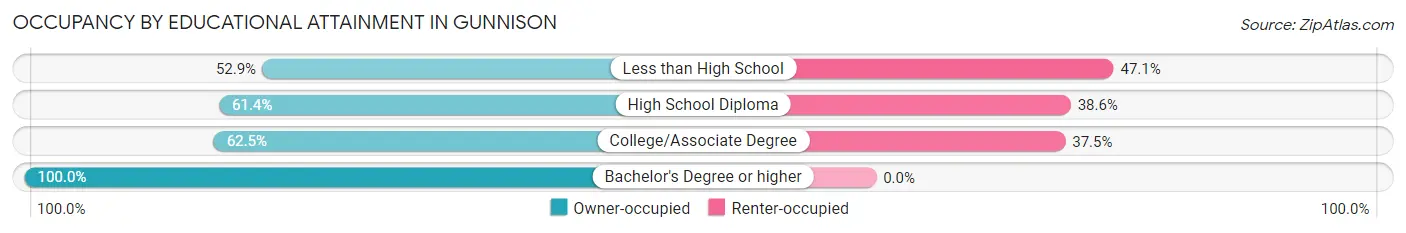
Occupancy by Educational Attainment in Gunnison
| Household Size | Owner-occupied | Renter-occupied |
| Less than High School | 9 (52.9%) | 8 (47.1%) |
| High School Diploma | 43 (61.4%) | 27 (38.6%) |
| College/Associate Degree | 35 (62.5%) | 21 (37.5%) |
| Bachelor's Degree or higher | 20 (100.0%) | 0 (0.0%) |
Occupancy by Age of Householder in Gunnison
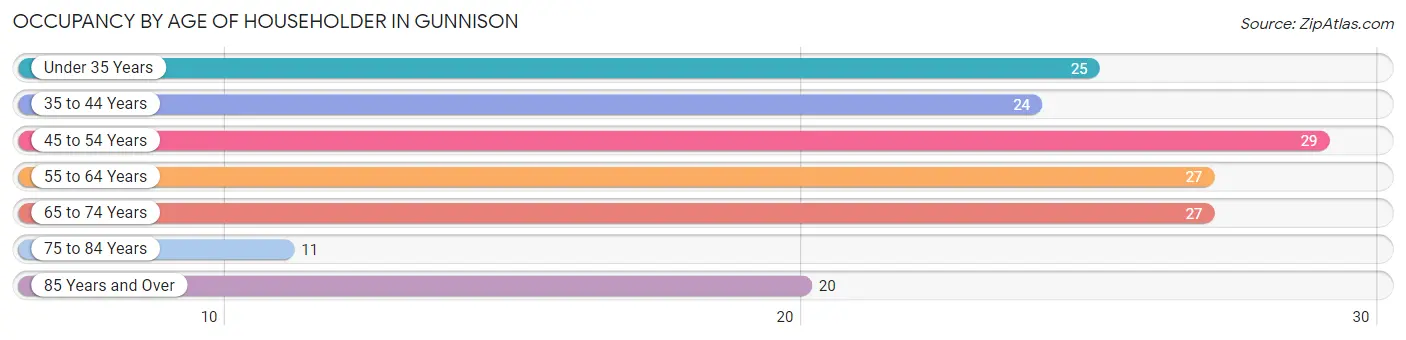
| Age Bracket | # Households | % Households |
| Under 35 Years | 25 | 15.3% |
| 35 to 44 Years | 24 | 14.7% |
| 45 to 54 Years | 29 | 17.8% |
| 55 to 64 Years | 27 | 16.6% |
| 65 to 74 Years | 27 | 16.6% |
| 75 to 84 Years | 11 | 6.8% |
| 85 Years and Over | 20 | 12.3% |
| Total | 163 | 100.0% |
Housing Finances in Gunnison
Median Income by Occupancy in Gunnison
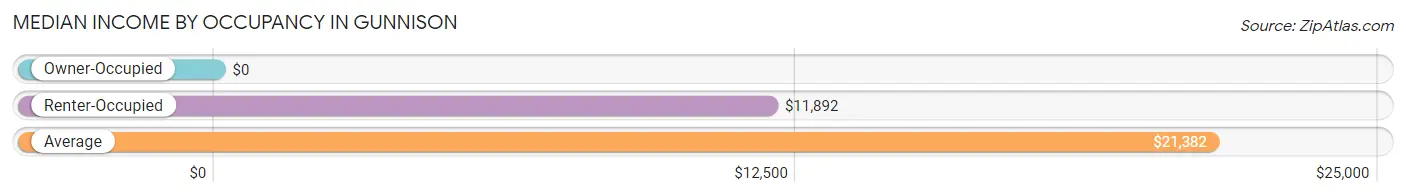
| Occupancy Type | # Households | Median Income |
| Owner-Occupied | 107 (65.6%) | $0 |
| Renter-Occupied | 56 (34.4%) | $11,892 |
| Average | 163 (100.0%) | $21,382 |
Occupancy by Householder Income Bracket in Gunnison
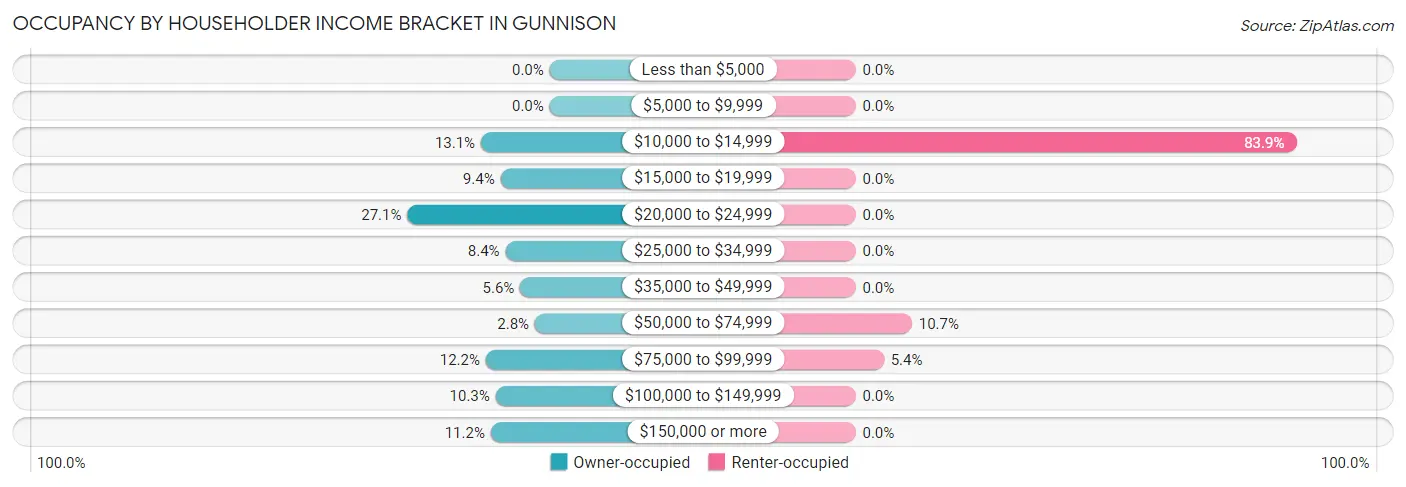
| Income Bracket | Owner-occupied | Renter-occupied |
| Less than $5,000 | 0 (0.0%) | 0 (0.0%) |
| $5,000 to $9,999 | 0 (0.0%) | 0 (0.0%) |
| $10,000 to $14,999 | 14 (13.1%) | 47 (83.9%) |
| $15,000 to $19,999 | 10 (9.3%) | 0 (0.0%) |
| $20,000 to $24,999 | 29 (27.1%) | 0 (0.0%) |
| $25,000 to $34,999 | 9 (8.4%) | 0 (0.0%) |
| $35,000 to $49,999 | 6 (5.6%) | 0 (0.0%) |
| $50,000 to $74,999 | 3 (2.8%) | 6 (10.7%) |
| $75,000 to $99,999 | 13 (12.1%) | 3 (5.4%) |
| $100,000 to $149,999 | 11 (10.3%) | 0 (0.0%) |
| $150,000 or more | 12 (11.2%) | 0 (0.0%) |
| Total | 107 (100.0%) | 56 (100.0%) |
Monthly Housing Cost Tiers in Gunnison
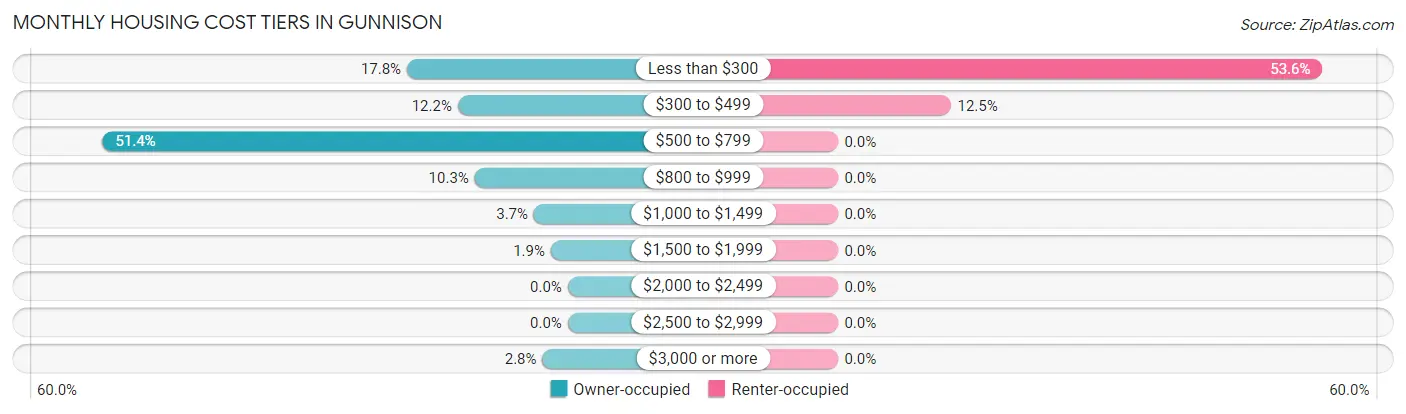
| Monthly Cost | Owner-occupied | Renter-occupied |
| Less than $300 | 19 (17.8%) | 30 (53.6%) |
| $300 to $499 | 13 (12.1%) | 7 (12.5%) |
| $500 to $799 | 55 (51.4%) | 0 (0.0%) |
| $800 to $999 | 11 (10.3%) | 0 (0.0%) |
| $1,000 to $1,499 | 4 (3.7%) | 0 (0.0%) |
| $1,500 to $1,999 | 2 (1.9%) | 0 (0.0%) |
| $2,000 to $2,499 | 0 (0.0%) | 0 (0.0%) |
| $2,500 to $2,999 | 0 (0.0%) | 0 (0.0%) |
| $3,000 or more | 3 (2.8%) | 0 (0.0%) |
| Total | 107 (100.0%) | 56 (100.0%) |
Physical Housing Characteristics in Gunnison
Housing Structures in Gunnison
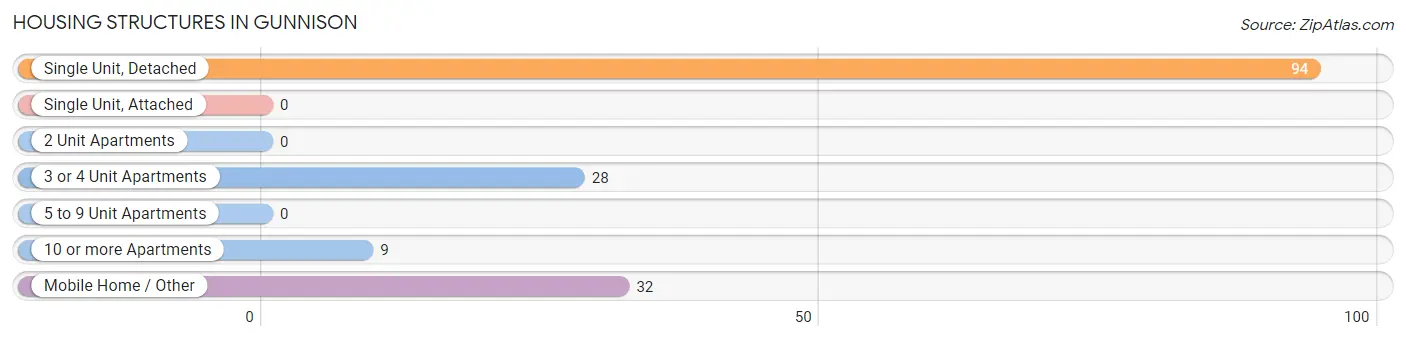
| Structure Type | # Housing Units | % Housing Units |
| Single Unit, Detached | 94 | 57.7% |
| Single Unit, Attached | 0 | 0.0% |
| 2 Unit Apartments | 0 | 0.0% |
| 3 or 4 Unit Apartments | 28 | 17.2% |
| 5 to 9 Unit Apartments | 0 | 0.0% |
| 10 or more Apartments | 9 | 5.5% |
| Mobile Home / Other | 32 | 19.6% |
| Total | 163 | 100.0% |
Housing Structures by Occupancy in Gunnison
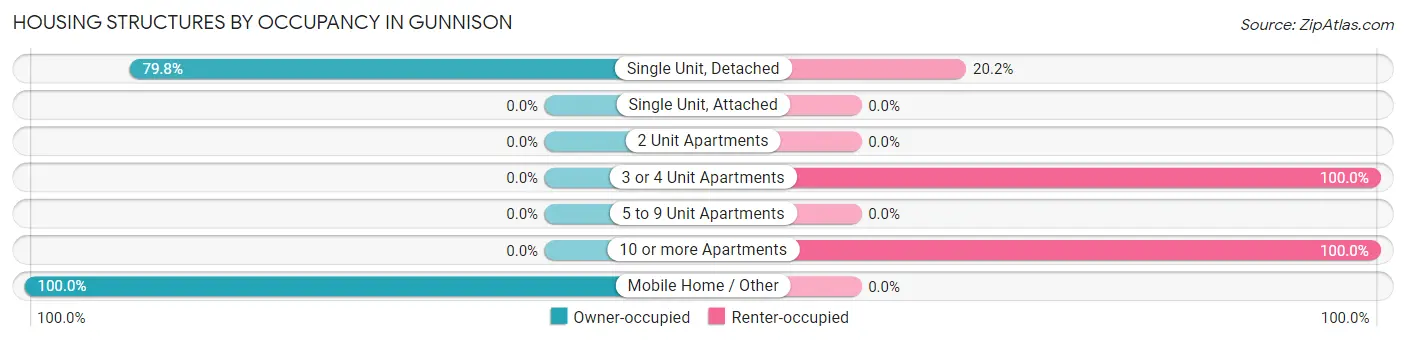
| Structure Type | Owner-occupied | Renter-occupied |
| Single Unit, Detached | 75 (79.8%) | 19 (20.2%) |
| Single Unit, Attached | 0 (0.0%) | 0 (0.0%) |
| 2 Unit Apartments | 0 (0.0%) | 0 (0.0%) |
| 3 or 4 Unit Apartments | 0 (0.0%) | 28 (100.0%) |
| 5 to 9 Unit Apartments | 0 (0.0%) | 0 (0.0%) |
| 10 or more Apartments | 0 (0.0%) | 9 (100.0%) |
| Mobile Home / Other | 32 (100.0%) | 0 (0.0%) |
| Total | 107 (65.6%) | 56 (34.4%) |
Housing Structures by Number of Rooms in Gunnison
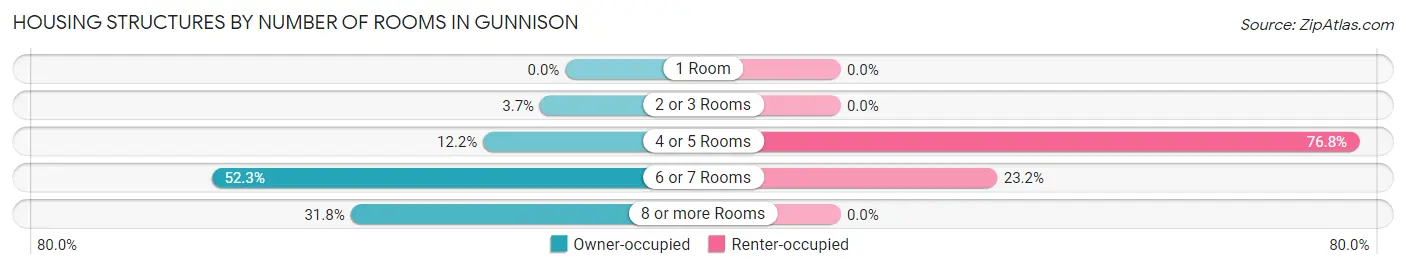
| Number of Rooms | Owner-occupied | Renter-occupied |
| 1 Room | 0 (0.0%) | 0 (0.0%) |
| 2 or 3 Rooms | 4 (3.7%) | 0 (0.0%) |
| 4 or 5 Rooms | 13 (12.1%) | 43 (76.8%) |
| 6 or 7 Rooms | 56 (52.3%) | 13 (23.2%) |
| 8 or more Rooms | 34 (31.8%) | 0 (0.0%) |
| Total | 107 (100.0%) | 56 (100.0%) |
Housing Structure by Heating Type in Gunnison
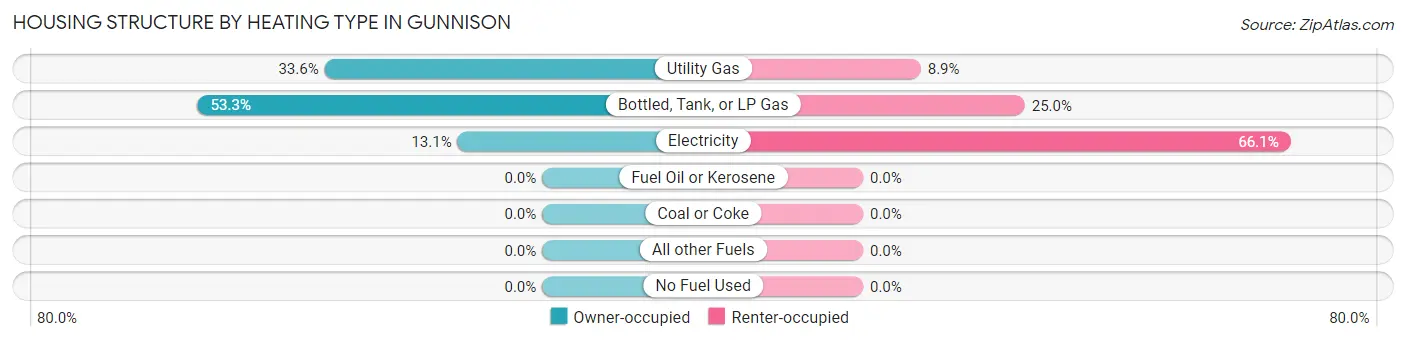
| Heating Type | Owner-occupied | Renter-occupied |
| Utility Gas | 36 (33.6%) | 5 (8.9%) |
| Bottled, Tank, or LP Gas | 57 (53.3%) | 14 (25.0%) |
| Electricity | 14 (13.1%) | 37 (66.1%) |
| Fuel Oil or Kerosene | 0 (0.0%) | 0 (0.0%) |
| Coal or Coke | 0 (0.0%) | 0 (0.0%) |
| All other Fuels | 0 (0.0%) | 0 (0.0%) |
| No Fuel Used | 0 (0.0%) | 0 (0.0%) |
| Total | 107 (100.0%) | 56 (100.0%) |
Household Vehicle Usage in Gunnison
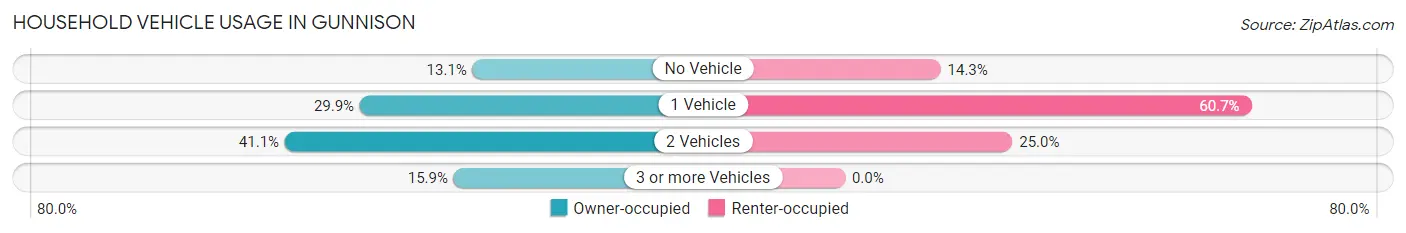
| Vehicles per Household | Owner-occupied | Renter-occupied |
| No Vehicle | 14 (13.1%) | 8 (14.3%) |
| 1 Vehicle | 32 (29.9%) | 34 (60.7%) |
| 2 Vehicles | 44 (41.1%) | 14 (25.0%) |
| 3 or more Vehicles | 17 (15.9%) | 0 (0.0%) |
| Total | 107 (100.0%) | 56 (100.0%) |
Real Estate & Mortgages in Gunnison
Real Estate and Mortgage Overview in Gunnison
| Characteristic | Without Mortgage | With Mortgage |
| Housing Units | 78 | 29 |
| Median Property Value | $67,500 | $106,900 |
| Median Household Income | - | - |
| Monthly Housing Costs | $529 | $3 |
| Real Estate Taxes | $405 | $7 |
Property Value by Mortgage Status in Gunnison
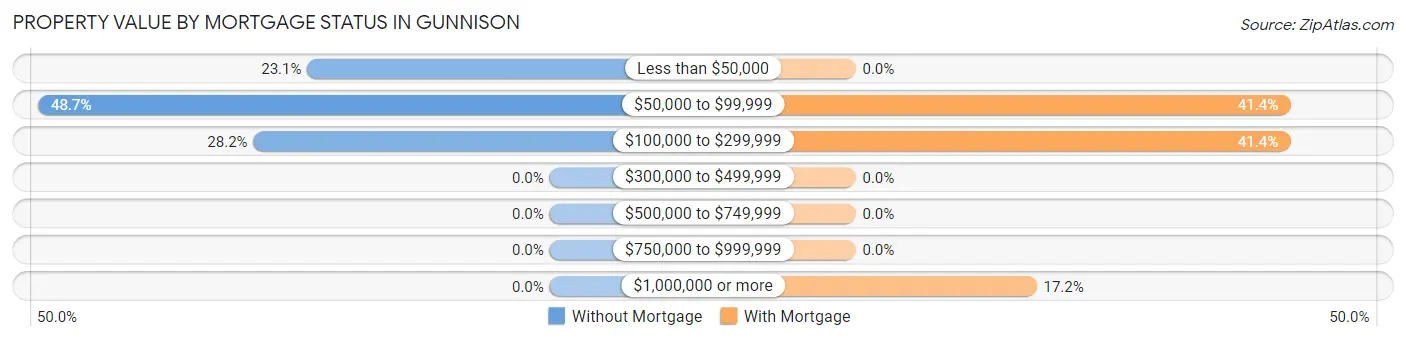
| Property Value | Without Mortgage | With Mortgage |
| Less than $50,000 | 18 (23.1%) | 0 (0.0%) |
| $50,000 to $99,999 | 38 (48.7%) | 12 (41.4%) |
| $100,000 to $299,999 | 22 (28.2%) | 12 (41.4%) |
| $300,000 to $499,999 | 0 (0.0%) | 0 (0.0%) |
| $500,000 to $749,999 | 0 (0.0%) | 0 (0.0%) |
| $750,000 to $999,999 | 0 (0.0%) | 0 (0.0%) |
| $1,000,000 or more | 0 (0.0%) | 5 (17.2%) |
| Total | 78 (100.0%) | 29 (100.0%) |
Household Income by Mortgage Status in Gunnison
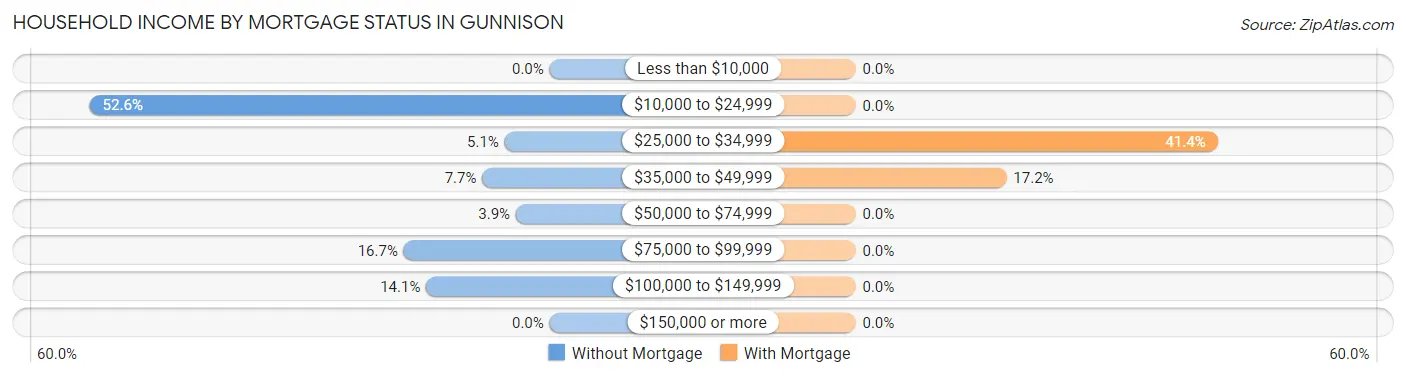
| Household Income | Without Mortgage | With Mortgage |
| Less than $10,000 | 0 (0.0%) | 0 (0.0%) |
| $10,000 to $24,999 | 41 (52.6%) | 0 (0.0%) |
| $25,000 to $34,999 | 4 (5.1%) | 12 (41.4%) |
| $35,000 to $49,999 | 6 (7.7%) | 5 (17.2%) |
| $50,000 to $74,999 | 3 (3.8%) | 0 (0.0%) |
| $75,000 to $99,999 | 13 (16.7%) | 0 (0.0%) |
| $100,000 to $149,999 | 11 (14.1%) | 0 (0.0%) |
| $150,000 or more | 0 (0.0%) | 0 (0.0%) |
| Total | 78 (100.0%) | 29 (100.0%) |
Property Value to Household Income Ratio in Gunnison
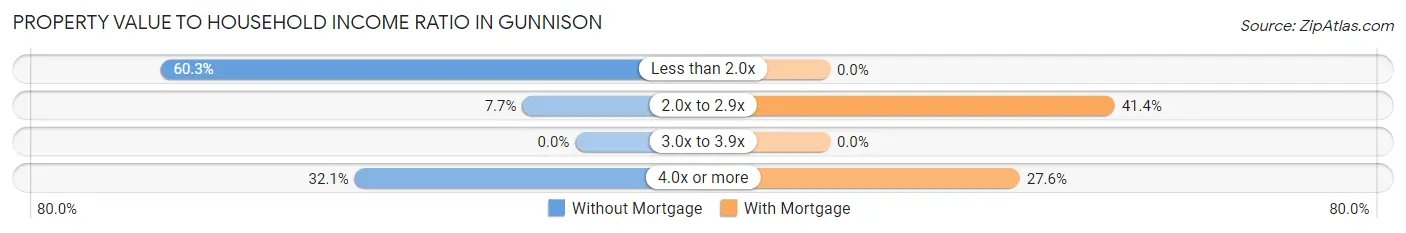
| Value-to-Income Ratio | Without Mortgage | With Mortgage |
| Less than 2.0x | 47 (60.3%) | 0 (0.0%) |
| 2.0x to 2.9x | 6 (7.7%) | 12 (41.4%) |
| 3.0x to 3.9x | 0 (0.0%) | 0 (0.0%) |
| 4.0x or more | 25 (32.1%) | 8 (27.6%) |
| Total | 78 (100.0%) | 29 (100.0%) |
Real Estate Taxes by Mortgage Status in Gunnison
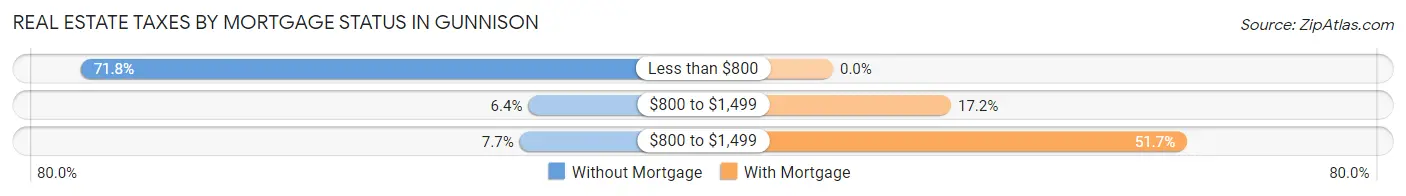
| Property Taxes | Without Mortgage | With Mortgage |
| Less than $800 | 56 (71.8%) | 0 (0.0%) |
| $800 to $1,499 | 5 (6.4%) | 5 (17.2%) |
| $800 to $1,499 | 6 (7.7%) | 15 (51.7%) |
| Total | 78 (100.0%) | 29 (100.0%) |
Health & Disability in Gunnison
Health Insurance Coverage by Age in Gunnison
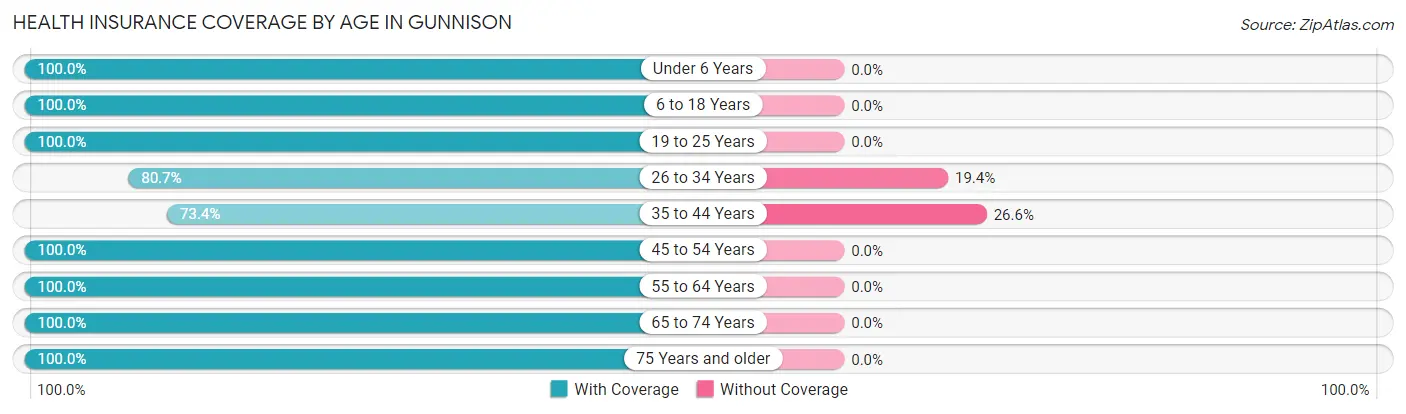
| Age Bracket | With Coverage | Without Coverage |
| Under 6 Years | 39 (100.0%) | 0 (0.0%) |
| 6 to 18 Years | 69 (100.0%) | 0 (0.0%) |
| 19 to 25 Years | 34 (100.0%) | 0 (0.0%) |
| 26 to 34 Years | 25 (80.6%) | 6 (19.4%) |
| 35 to 44 Years | 47 (73.4%) | 17 (26.6%) |
| 45 to 54 Years | 40 (100.0%) | 0 (0.0%) |
| 55 to 64 Years | 32 (100.0%) | 0 (0.0%) |
| 65 to 74 Years | 32 (100.0%) | 0 (0.0%) |
| 75 Years and older | 35 (100.0%) | 0 (0.0%) |
| Total | 353 (93.9%) | 23 (6.1%) |
Health Insurance Coverage by Citizenship Status in Gunnison
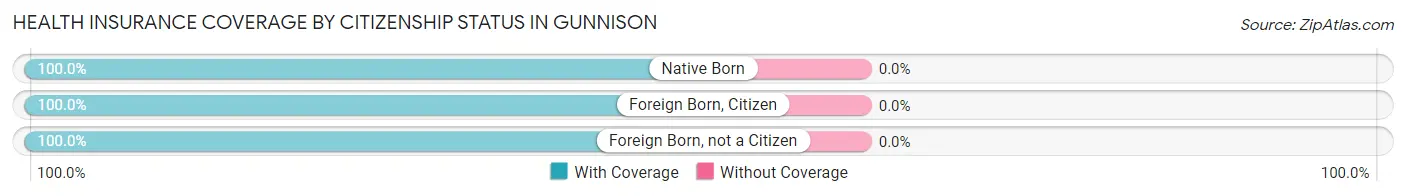
| Citizenship Status | With Coverage | Without Coverage |
| Native Born | 39 (100.0%) | 0 (0.0%) |
| Foreign Born, Citizen | 69 (100.0%) | 0 (0.0%) |
| Foreign Born, not a Citizen | 34 (100.0%) | 0 (0.0%) |
Health Insurance Coverage by Household Income in Gunnison
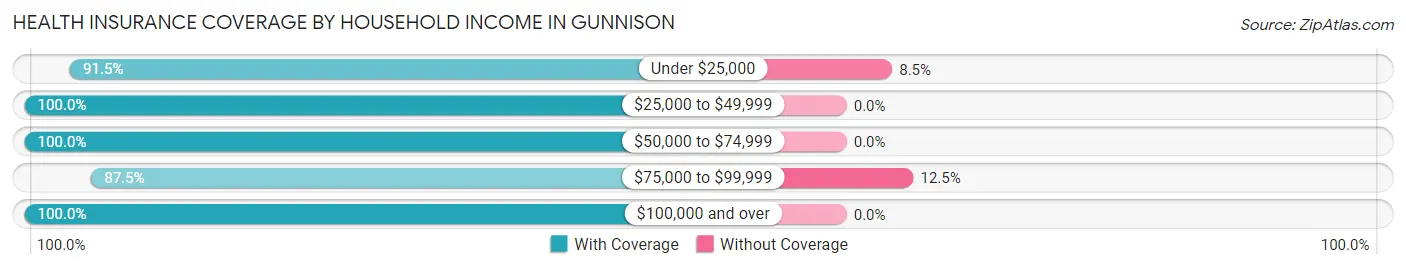
| Household Income | With Coverage | Without Coverage |
| Under $25,000 | 204 (91.5%) | 19 (8.5%) |
| $25,000 to $49,999 | 24 (100.0%) | 0 (0.0%) |
| $50,000 to $74,999 | 12 (100.0%) | 0 (0.0%) |
| $75,000 to $99,999 | 28 (87.5%) | 4 (12.5%) |
| $100,000 and over | 85 (100.0%) | 0 (0.0%) |
Public vs Private Health Insurance Coverage by Age in Gunnison
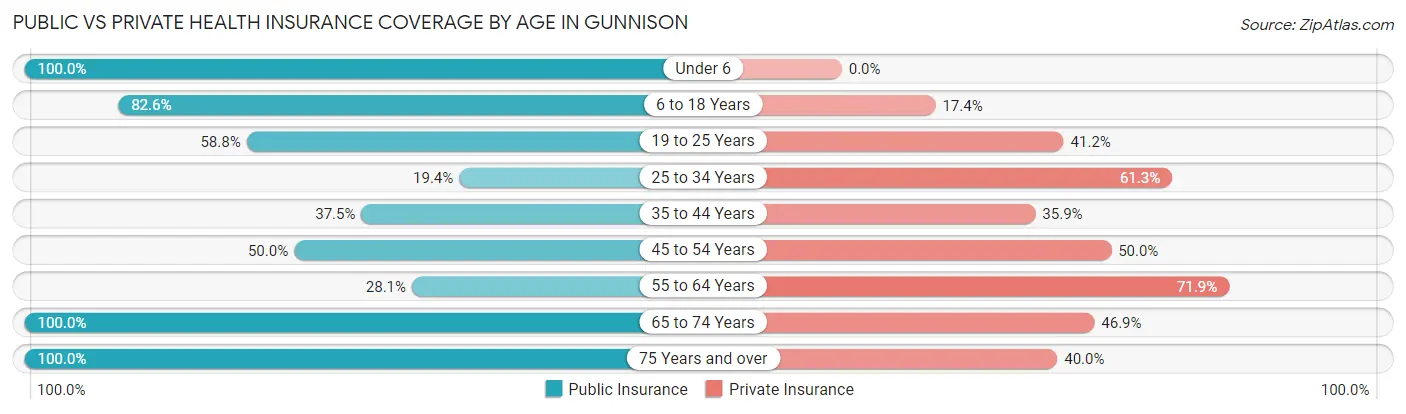
| Age Bracket | Public Insurance | Private Insurance |
| Under 6 | 39 (100.0%) | 0 (0.0%) |
| 6 to 18 Years | 57 (82.6%) | 12 (17.4%) |
| 19 to 25 Years | 20 (58.8%) | 14 (41.2%) |
| 25 to 34 Years | 6 (19.4%) | 19 (61.3%) |
| 35 to 44 Years | 24 (37.5%) | 23 (35.9%) |
| 45 to 54 Years | 20 (50.0%) | 20 (50.0%) |
| 55 to 64 Years | 9 (28.1%) | 23 (71.9%) |
| 65 to 74 Years | 32 (100.0%) | 15 (46.9%) |
| 75 Years and over | 35 (100.0%) | 14 (40.0%) |
| Total | 242 (64.4%) | 140 (37.2%) |
Disability Status by Sex by Age in Gunnison
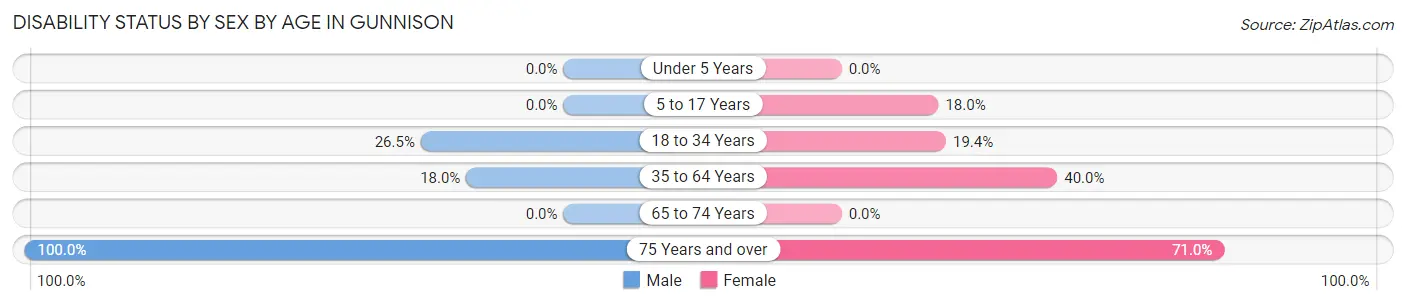
| Age Bracket | Male | Female |
| Under 5 Years | 0 (0.0%) | 0 (0.0%) |
| 5 to 17 Years | 0 (0.0%) | 7 (17.9%) |
| 18 to 34 Years | 9 (26.5%) | 6 (19.4%) |
| 35 to 64 Years | 11 (18.0%) | 30 (40.0%) |
| 65 to 74 Years | 0 (0.0%) | 0 (0.0%) |
| 75 Years and over | 4 (100.0%) | 22 (71.0%) |
Disability Class by Sex by Age in Gunnison
Disability Class: Hearing Difficulty
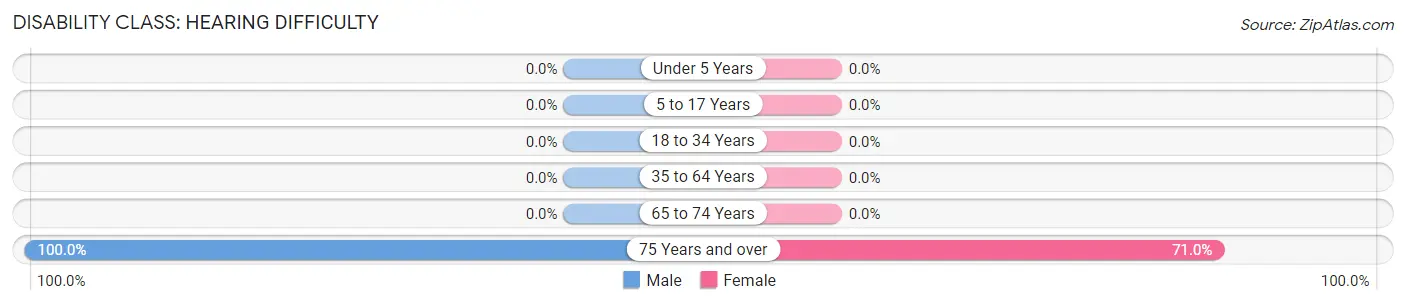
| Age Bracket | Male | Female |
| Under 5 Years | 0 (0.0%) | 0 (0.0%) |
| 5 to 17 Years | 0 (0.0%) | 0 (0.0%) |
| 18 to 34 Years | 0 (0.0%) | 0 (0.0%) |
| 35 to 64 Years | 0 (0.0%) | 0 (0.0%) |
| 65 to 74 Years | 0 (0.0%) | 0 (0.0%) |
| 75 Years and over | 4 (100.0%) | 22 (71.0%) |
Disability Class: Vision Difficulty
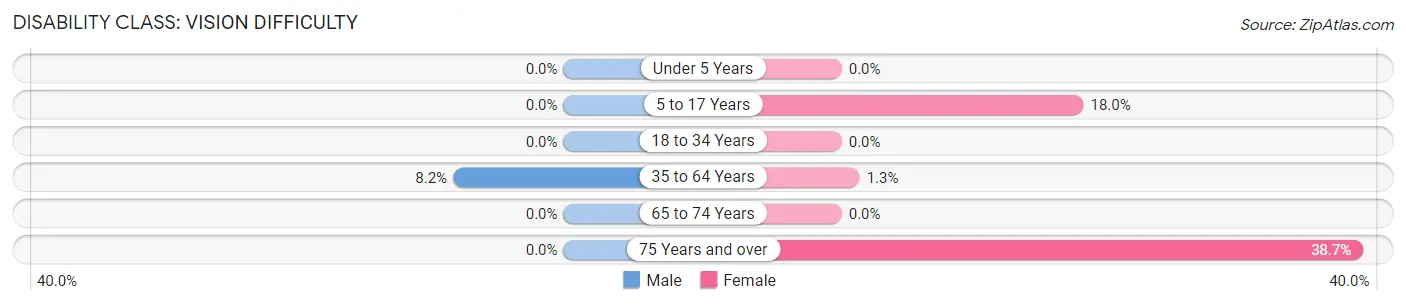
| Age Bracket | Male | Female |
| Under 5 Years | 0 (0.0%) | 0 (0.0%) |
| 5 to 17 Years | 0 (0.0%) | 7 (17.9%) |
| 18 to 34 Years | 0 (0.0%) | 0 (0.0%) |
| 35 to 64 Years | 5 (8.2%) | 1 (1.3%) |
| 65 to 74 Years | 0 (0.0%) | 0 (0.0%) |
| 75 Years and over | 0 (0.0%) | 12 (38.7%) |
Disability Class: Cognitive Difficulty
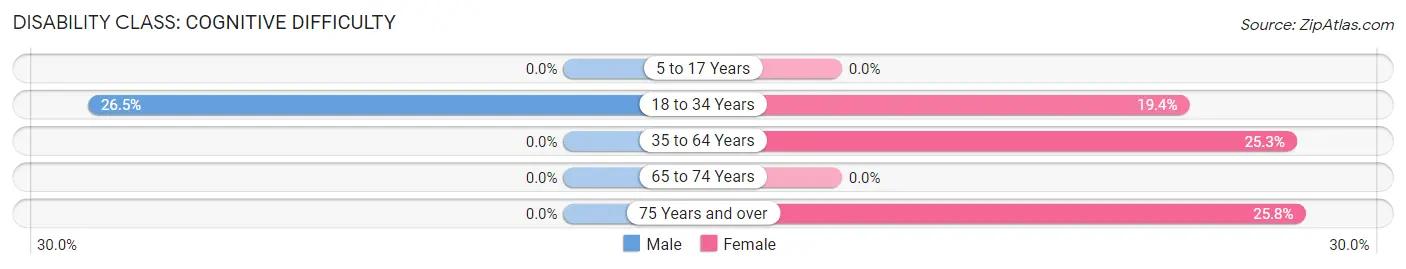
| Age Bracket | Male | Female |
| 5 to 17 Years | 0 (0.0%) | 0 (0.0%) |
| 18 to 34 Years | 9 (26.5%) | 6 (19.4%) |
| 35 to 64 Years | 0 (0.0%) | 19 (25.3%) |
| 65 to 74 Years | 0 (0.0%) | 0 (0.0%) |
| 75 Years and over | 0 (0.0%) | 8 (25.8%) |
Disability Class: Ambulatory Difficulty
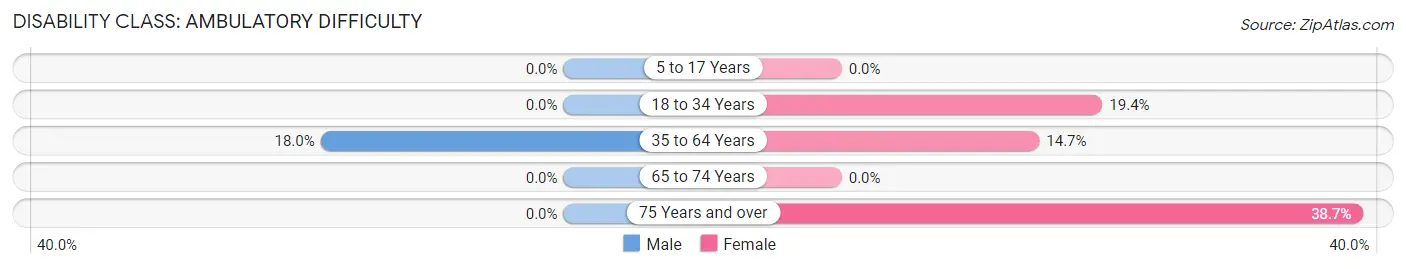
| Age Bracket | Male | Female |
| 5 to 17 Years | 0 (0.0%) | 0 (0.0%) |
| 18 to 34 Years | 0 (0.0%) | 6 (19.4%) |
| 35 to 64 Years | 11 (18.0%) | 11 (14.7%) |
| 65 to 74 Years | 0 (0.0%) | 0 (0.0%) |
| 75 Years and over | 0 (0.0%) | 12 (38.7%) |
Disability Class: Self-Care Difficulty
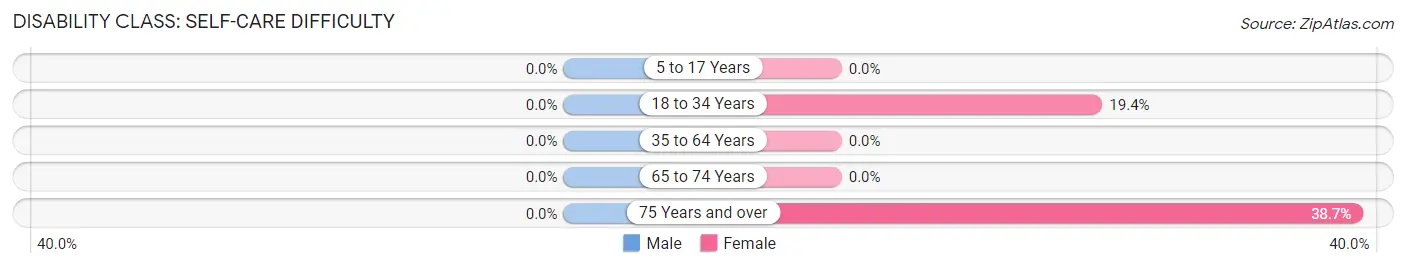
| Age Bracket | Male | Female |
| 5 to 17 Years | 0 (0.0%) | 0 (0.0%) |
| 18 to 34 Years | 0 (0.0%) | 6 (19.4%) |
| 35 to 64 Years | 0 (0.0%) | 0 (0.0%) |
| 65 to 74 Years | 0 (0.0%) | 0 (0.0%) |
| 75 Years and over | 0 (0.0%) | 12 (38.7%) |
Technology Access in Gunnison
Computing Device Access in Gunnison
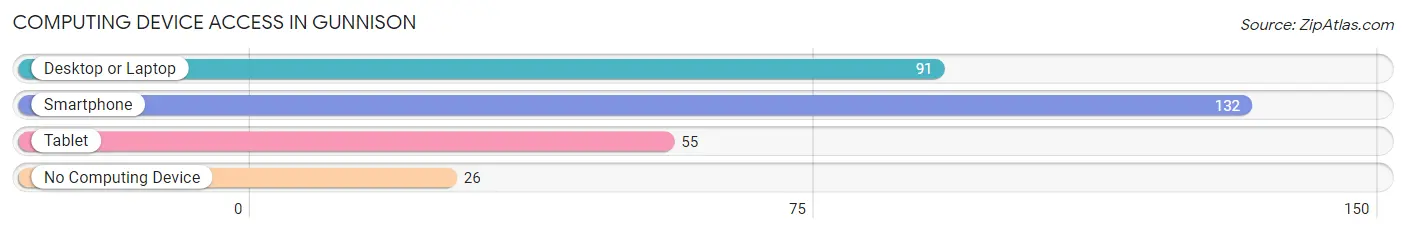
| Device Type | # Households | % Households |
| Desktop or Laptop | 91 | 55.8% |
| Smartphone | 132 | 81.0% |
| Tablet | 55 | 33.7% |
| No Computing Device | 26 | 16.0% |
| Total | 163 | 100.0% |
Internet Access in Gunnison
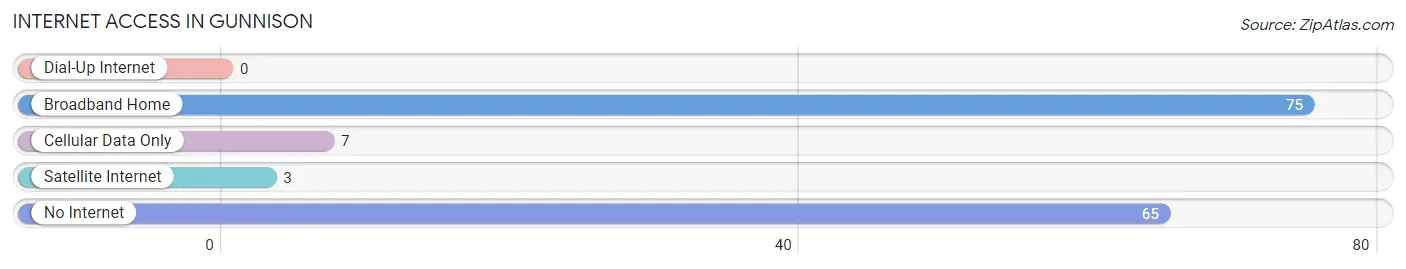
| Internet Type | # Households | % Households |
| Dial-Up Internet | 0 | 0.0% |
| Broadband Home | 75 | 46.0% |
| Cellular Data Only | 7 | 4.3% |
| Satellite Internet | 3 | 1.8% |
| No Internet | 65 | 39.9% |
| Total | 163 | 100.0% |
Gunnison Summary
Gunnison is a small town located in the state of Mississippi, in the United States. It is situated in the northern part of the state, in the county of Holmes. The town has a population of approximately 1,000 people, and is located about 40 miles south of Jackson, the state capital.
Gunnison was founded in 1837, and was named after the town of Gunnison, Colorado. The town was originally a trading post, and was the site of a major battle during the Civil War. The town was also the site of a major railroad junction, and was an important stop on the Mississippi Central Railroad.
Geographically, Gunnison is located in the northern part of the state, in the county of Holmes. The town is situated on the banks of the Yocona River, and is surrounded by rolling hills and forests. The town is located about 40 miles south of Jackson, the state capital.
The economy of Gunnison is largely based on agriculture. The town is home to several farms, and the surrounding area is known for its production of cotton, corn, soybeans, and other crops. The town also has a few small businesses, including a grocery store, a hardware store, and a few restaurants.
Demographically, the population of Gunnison is predominantly African American. According to the 2010 census, the town had a population of 1,000 people, of which 95.7% were African American, 2.7% were White, 0.3% were Asian, and 0.3% were of other races. The median household income in the town was $25,000, and the median age was 37.
Gunnison is a small town with a rich history and a unique culture. The town is home to a variety of attractions, including the historic Yocona River, the historic Gunnison Cemetery, and the historic Gunnison Depot. The town is also home to a variety of festivals and events, including the annual Yocona River Festival and the annual Gunnison County Fair. The town is also home to a variety of recreational activities, including fishing, hunting, and camping.
Gunnison is a small town with a rich history and a unique culture. The town is home to a variety of attractions, and is a great place to visit for those looking to explore the history and culture of the area. The town is also home to a variety of recreational activities, and is a great place to spend time outdoors.
Common Questions
What is Per Capita Income in Gunnison?
Per Capita income in Gunnison is $28,215.
What is the Median Family Income in Gunnison?
Median Family Income in Gunnison is $21,161.
What is the Median Household income in Gunnison?
Median Household Income in Gunnison is $21,382.
What is Family Income Deficit in Gunnison?
Family Income Deficit in Gunnison is $9,640.
Families that are below poverty line in Gunnison earn $9,640 less on average than the poverty threshold level.
What is Inequality or Gini Index in Gunnison?
Inequality or Gini Index in Gunnison is 0.63.
What is the Total Population of Gunnison?
Total Population of Gunnison is 376.
What is the Total Male Population of Gunnison?
Total Male Population of Gunnison is 151.
What is the Total Female Population of Gunnison?
Total Female Population of Gunnison is 225.
What is the Ratio of Males per 100 Females in Gunnison?
There are 67.11 Males per 100 Females in Gunnison.
What is the Ratio of Females per 100 Males in Gunnison?
There are 149.01 Females per 100 Males in Gunnison.
What is the Median Population Age in Gunnison?
Median Population Age in Gunnison is 37.8 Years.
What is the Average Family Size in Gunnison
Average Family Size in Gunnison is 3.1 People.
What is the Average Household Size in Gunnison
Average Household Size in Gunnison is 2.3 People.
How Large is the Labor Force in Gunnison?
There are 111 People in the Labor Forcein in Gunnison.
What is the Percentage of People in the Labor Force in Gunnison?
39.2% of People are in the Labor Force in Gunnison.
What is the Unemployment Rate in Gunnison?
Unemployment Rate in Gunnison is 22.5%.