Arcola, MS Map & Demographics
Arcola Map
Arcola Overview
$11,080
PER CAPITA INCOME
$23,750
AVG FAMILY INCOME
$25,694
AVG HOUSEHOLD INCOME
0.33
INEQUALITY / GINI INDEX
208
TOTAL POPULATION
81
MALE POPULATION
127
FEMALE POPULATION
63.78
MALES / 100 FEMALES
156.79
FEMALES / 100 MALES
37.8
MEDIAN AGE
4.2
AVG FAMILY SIZE
2.9
AVG HOUSEHOLD SIZE
50
LABOR FORCE [ PEOPLE ]
37.0%
PERCENT IN LABOR FORCE
18.0%
UNEMPLOYMENT RATE
Arcola Zip Codes
Arcola Area Codes
Income in Arcola
Income Overview in Arcola
Per Capita Income in Arcola is $11,080, while median incomes of families and households are $23,750 and $25,694 respectively.
| Characteristic | Number | Measure |
| Per Capita Income | 208 | $11,080 |
| Median Family Income | 40 | $23,750 |
| Mean Family Income | 40 | $35,193 |
| Median Household Income | 71 | $25,694 |
| Mean Household Income | 71 | $31,117 |
| Income Deficit | 40 | $0 |
| Wage / Income Gap (%) | 208 | 0.00% |
| Wage / Income Gap ($) | 208 | 100.00¢ per $1 |
| Gini / Inequality Index | 208 | 0.33 |
Earnings by Sex in Arcola
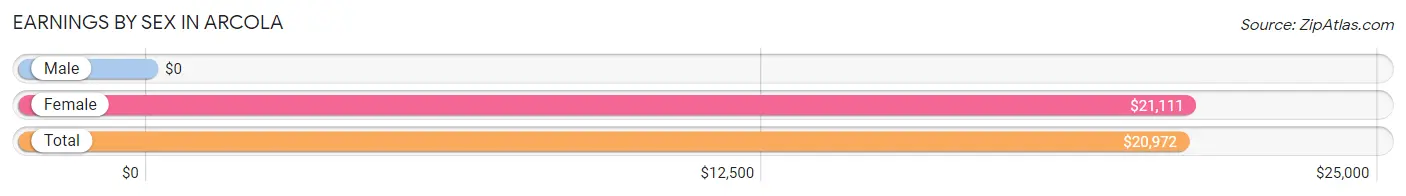
| Sex | Number | Average Earnings |
| Male | 13 (27.7%) | $0 |
| Female | 34 (72.3%) | $21,111 |
| Total | 47 (100.0%) | $20,972 |
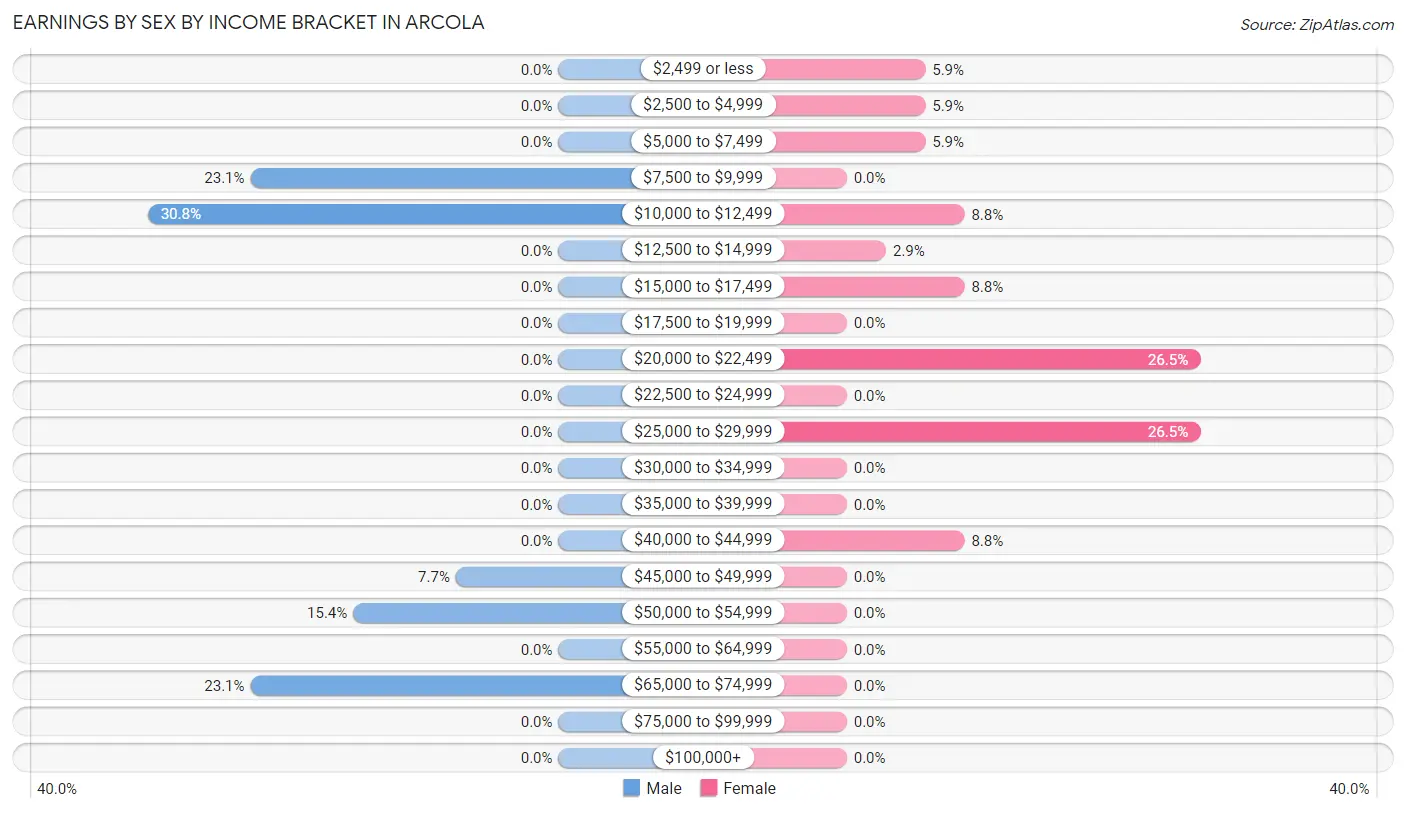
Earnings by Sex by Income Bracket in Arcola
The most common earnings brackets in Arcola are $10,000 to $12,499 for men (4 | 30.8%) and $20,000 to $22,499 for women (9 | 26.5%).
| Income | Male | Female |
| $2,499 or less | 0 (0.0%) | 2 (5.9%) |
| $2,500 to $4,999 | 0 (0.0%) | 2 (5.9%) |
| $5,000 to $7,499 | 0 (0.0%) | 2 (5.9%) |
| $7,500 to $9,999 | 3 (23.1%) | 0 (0.0%) |
| $10,000 to $12,499 | 4 (30.8%) | 3 (8.8%) |
| $12,500 to $14,999 | 0 (0.0%) | 1 (2.9%) |
| $15,000 to $17,499 | 0 (0.0%) | 3 (8.8%) |
| $17,500 to $19,999 | 0 (0.0%) | 0 (0.0%) |
| $20,000 to $22,499 | 0 (0.0%) | 9 (26.5%) |
| $22,500 to $24,999 | 0 (0.0%) | 0 (0.0%) |
| $25,000 to $29,999 | 0 (0.0%) | 9 (26.5%) |
| $30,000 to $34,999 | 0 (0.0%) | 0 (0.0%) |
| $35,000 to $39,999 | 0 (0.0%) | 0 (0.0%) |
| $40,000 to $44,999 | 0 (0.0%) | 3 (8.8%) |
| $45,000 to $49,999 | 1 (7.7%) | 0 (0.0%) |
| $50,000 to $54,999 | 2 (15.4%) | 0 (0.0%) |
| $55,000 to $64,999 | 0 (0.0%) | 0 (0.0%) |
| $65,000 to $74,999 | 3 (23.1%) | 0 (0.0%) |
| $75,000 to $99,999 | 0 (0.0%) | 0 (0.0%) |
| $100,000+ | 0 (0.0%) | 0 (0.0%) |
| Total | 13 (100.0%) | 34 (100.0%) |
Earnings by Sex by Educational Attainment in Arcola
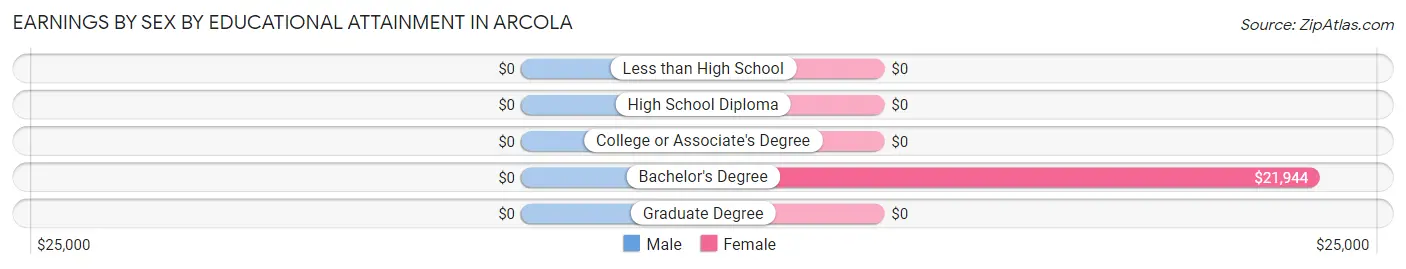
| Educational Attainment | Male Income | Female Income |
| Less than High School | - | - |
| High School Diploma | - | - |
| College or Associate's Degree | - | - |
| Bachelor's Degree | - | - |
| Graduate Degree | - | - |
| Total | $50,000 | $21,111 |
Family Income in Arcola
Family Income Brackets in Arcola
According to the Arcola family income data, there are 18 families falling into the $15,000 to $24,999 income range, which is the most common income bracket and makes up 45.0% of all families.
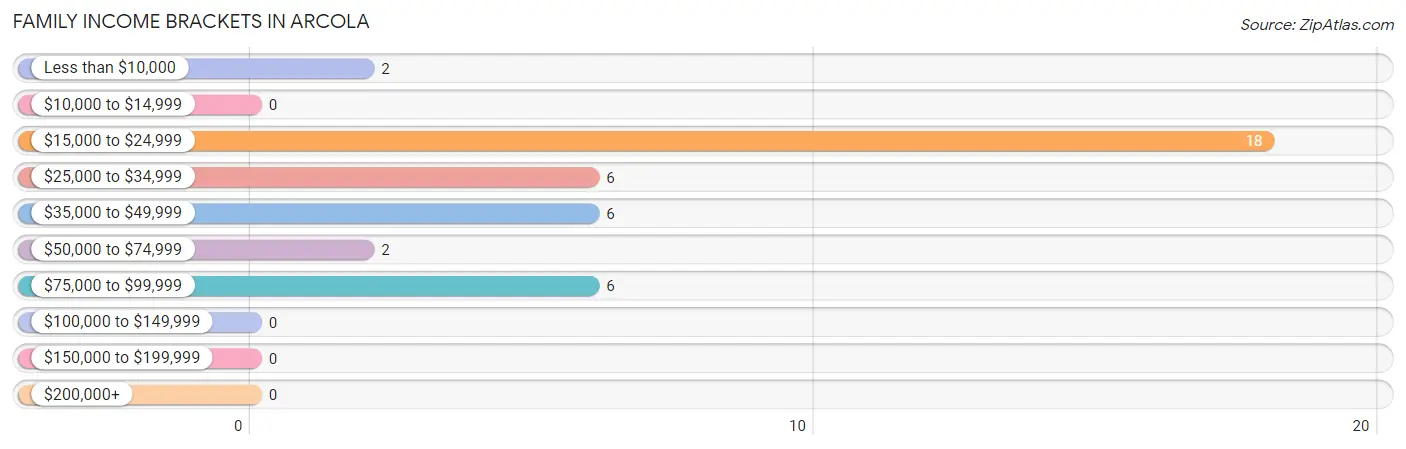
| Income Bracket | # Families | % Families |
| Less than $10,000 | 2 | 5.0% |
| $10,000 to $14,999 | 0 | 0.0% |
| $15,000 to $24,999 | 18 | 45.0% |
| $25,000 to $34,999 | 6 | 15.0% |
| $35,000 to $49,999 | 6 | 15.0% |
| $50,000 to $74,999 | 2 | 5.0% |
| $75,000 to $99,999 | 6 | 15.0% |
| $100,000 to $149,999 | 0 | 0.0% |
| $150,000 to $199,999 | 0 | 0.0% |
| $200,000+ | 0 | 0.0% |
Family Income by Famaliy Size in Arcola
2-person families (17 | 42.5%) account for the highest median family income in Arcola with $25,625 per family, while 2-person families (17 | 42.5%) have the highest median income of $12,812 per family member.
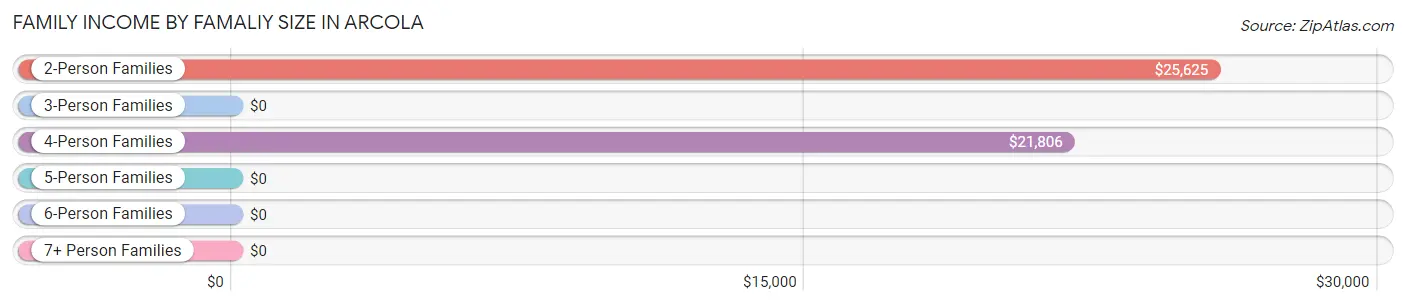
| Income Bracket | # Families | Median Income |
| 2-Person Families | 17 (42.5%) | $25,625 |
| 3-Person Families | 4 (10.0%) | $0 |
| 4-Person Families | 13 (32.5%) | $21,806 |
| 5-Person Families | 0 (0.0%) | $0 |
| 6-Person Families | 3 (7.5%) | $0 |
| 7+ Person Families | 3 (7.5%) | $0 |
| Total | 40 (100.0%) | $23,750 |
Family Income by Number of Earners in Arcola
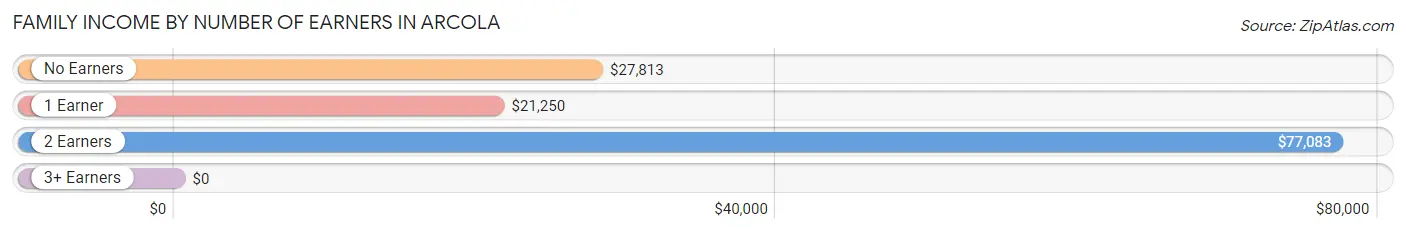
| Number of Earners | # Families | Median Income |
| No Earners | 13 (32.5%) | $27,813 |
| 1 Earner | 20 (50.0%) | $21,250 |
| 2 Earners | 7 (17.5%) | $77,083 |
| 3+ Earners | 0 (0.0%) | $0 |
| Total | 40 (100.0%) | $23,750 |
Household Income in Arcola
Household Income Brackets in Arcola
With 23 households falling in the category, the $15,000 to $24,999 income range is the most frequent in Arcola, accounting for 32.4% of all households.
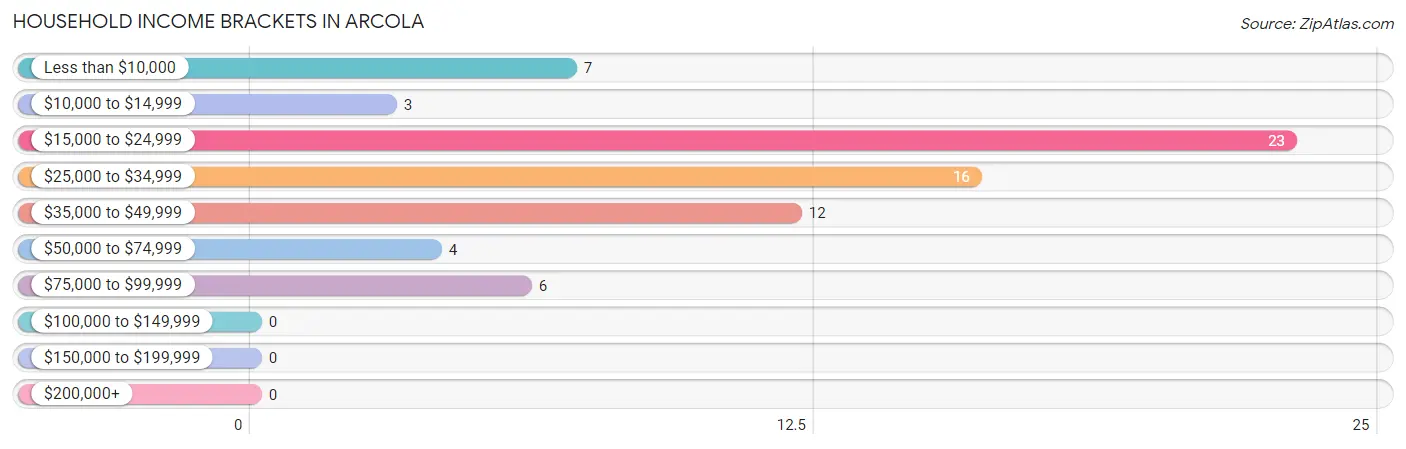
| Income Bracket | # Households | % Households |
| Less than $10,000 | 7 | 9.9% |
| $10,000 to $14,999 | 3 | 4.2% |
| $15,000 to $24,999 | 23 | 32.4% |
| $25,000 to $34,999 | 16 | 22.5% |
| $35,000 to $49,999 | 12 | 16.9% |
| $50,000 to $74,999 | 4 | 5.6% |
| $75,000 to $99,999 | 6 | 8.5% |
| $100,000 to $149,999 | 0 | 0.0% |
| $150,000 to $199,999 | 0 | 0.0% |
| $200,000+ | 0 | 0.0% |
Household Income by Householder Age in Arcola
The median household income in Arcola is $25,694, with the highest median household income of $26,806 found in the 65+ years age bracket for the primary householder. A total of 31 households (43.7%) fall into this category.
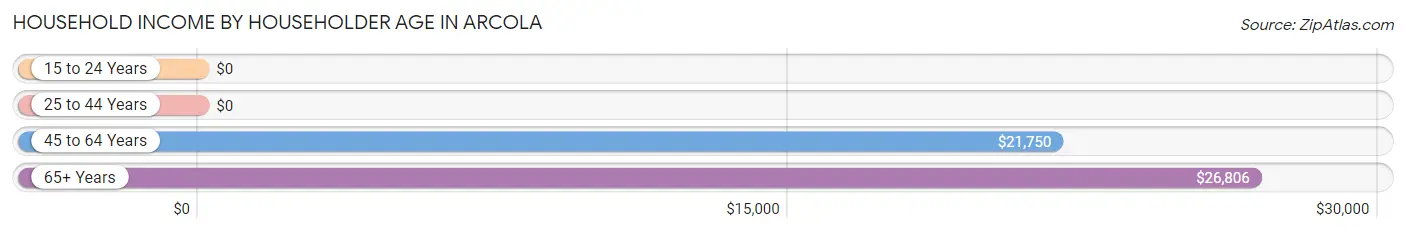
| Income Bracket | # Households | Median Income |
| 15 to 24 Years | 0 (0.0%) | $0 |
| 25 to 44 Years | 13 (18.3%) | $0 |
| 45 to 64 Years | 27 (38.0%) | $21,750 |
| 65+ Years | 31 (43.7%) | $26,806 |
| Total | 71 (100.0%) | $25,694 |
Poverty in Arcola
Income Below Poverty by Sex and Age in Arcola
With 48.1% poverty level for males and 57.5% for females among the residents of Arcola, 45 to 54 year old males and 6 to 11 year old females are the most vulnerable to poverty, with 8 males (100.0%) and 13 females (100.0%) in their respective age groups living below the poverty level.
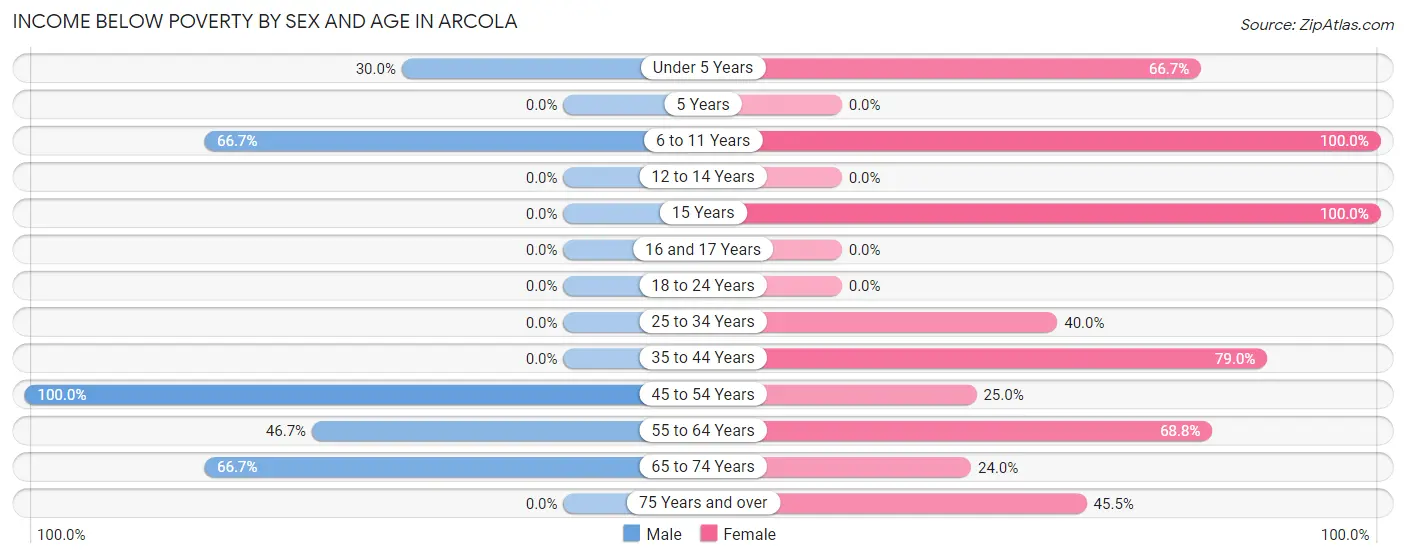
| Age Bracket | Male | Female |
| Under 5 Years | 6 (30.0%) | 6 (66.7%) |
| 5 Years | 0 (0.0%) | 0 (0.0%) |
| 6 to 11 Years | 12 (66.7%) | 13 (100.0%) |
| 12 to 14 Years | 0 (0.0%) | 0 (0.0%) |
| 15 Years | 0 (0.0%) | 11 (100.0%) |
| 16 and 17 Years | 0 (0.0%) | 0 (0.0%) |
| 18 to 24 Years | 0 (0.0%) | 0 (0.0%) |
| 25 to 34 Years | 0 (0.0%) | 4 (40.0%) |
| 35 to 44 Years | 0 (0.0%) | 15 (78.9%) |
| 45 to 54 Years | 8 (100.0%) | 2 (25.0%) |
| 55 to 64 Years | 7 (46.7%) | 11 (68.8%) |
| 65 to 74 Years | 6 (66.7%) | 6 (24.0%) |
| 75 Years and over | 0 (0.0%) | 5 (45.5%) |
| Total | 39 (48.1%) | 73 (57.5%) |
Income Above Poverty by Sex and Age in Arcola
According to the poverty statistics in Arcola, males aged 12 to 14 years and females aged 18 to 24 years are the age groups that are most secure financially, with 100.0% of males and 100.0% of females in these age groups living above the poverty line.
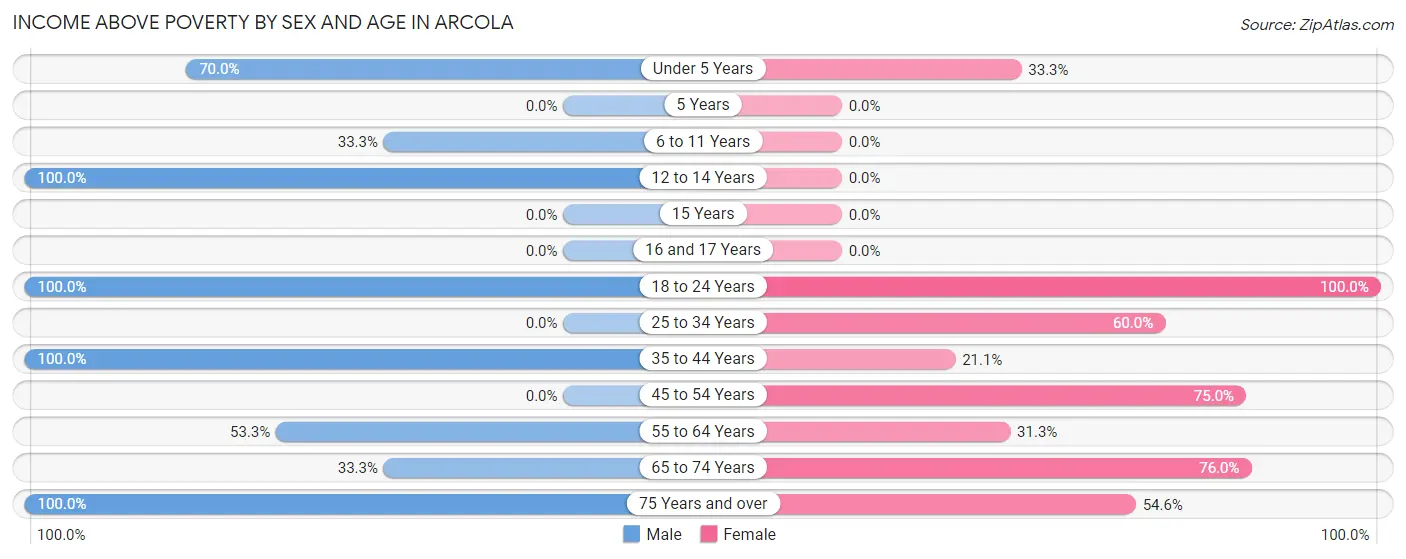
| Age Bracket | Male | Female |
| Under 5 Years | 14 (70.0%) | 3 (33.3%) |
| 5 Years | 0 (0.0%) | 0 (0.0%) |
| 6 to 11 Years | 6 (33.3%) | 0 (0.0%) |
| 12 to 14 Years | 2 (100.0%) | 0 (0.0%) |
| 15 Years | 0 (0.0%) | 0 (0.0%) |
| 16 and 17 Years | 0 (0.0%) | 0 (0.0%) |
| 18 to 24 Years | 3 (100.0%) | 5 (100.0%) |
| 25 to 34 Years | 0 (0.0%) | 6 (60.0%) |
| 35 to 44 Years | 4 (100.0%) | 4 (21.0%) |
| 45 to 54 Years | 0 (0.0%) | 6 (75.0%) |
| 55 to 64 Years | 8 (53.3%) | 5 (31.2%) |
| 65 to 74 Years | 3 (33.3%) | 19 (76.0%) |
| 75 Years and over | 2 (100.0%) | 6 (54.5%) |
| Total | 42 (51.8%) | 54 (42.5%) |
Income Below Poverty Among Married-Couple Families in Arcola
The poverty statistics for married-couple families in Arcola show that 26.3% or 5 of the total 19 families live below the poverty line. Families with 3 or 4 children have the highest poverty rate of 100.0%, comprising of 3 families. On the other hand, families with 1 or 2 children have the lowest poverty rate of 0.0%, which includes 0 families.
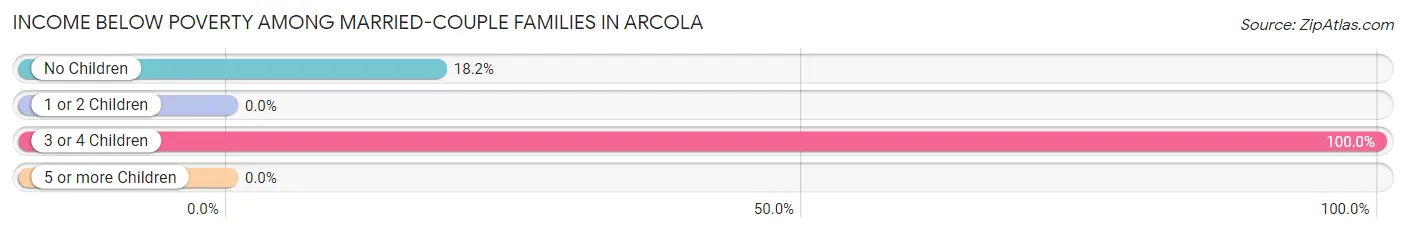
| Children | Above Poverty | Below Poverty |
| No Children | 9 (81.8%) | 2 (18.2%) |
| 1 or 2 Children | 5 (100.0%) | 0 (0.0%) |
| 3 or 4 Children | 0 (0.0%) | 3 (100.0%) |
| 5 or more Children | 0 (0.0%) | 0 (0.0%) |
| Total | 14 (73.7%) | 5 (26.3%) |
Income Below Poverty Among Single-Parent Households in Arcola
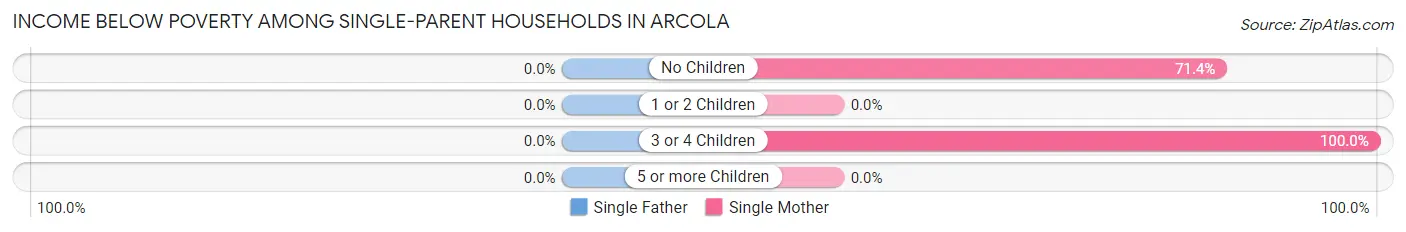
| Children | Single Father | Single Mother |
| No Children | 0 (0.0%) | 5 (71.4%) |
| 1 or 2 Children | 0 (0.0%) | 0 (0.0%) |
| 3 or 4 Children | 0 (0.0%) | 9 (100.0%) |
| 5 or more Children | 0 (0.0%) | 0 (0.0%) |
| Total | 0 (0.0%) | 14 (73.7%) |
Income Below Poverty Among Married-Couple vs Single-Parent Households in Arcola
The poverty data for Arcola shows that 5 of the married-couple family households (26.3%) and 14 of the single-parent households (66.7%) are living below the poverty level. Within the married-couple family households, those with 3 or 4 children have the highest poverty rate, with 3 households (100.0%) falling below the poverty line. Among the single-parent households, those with 3 or 4 children have the highest poverty rate, with 9 household (100.0%) living below poverty.
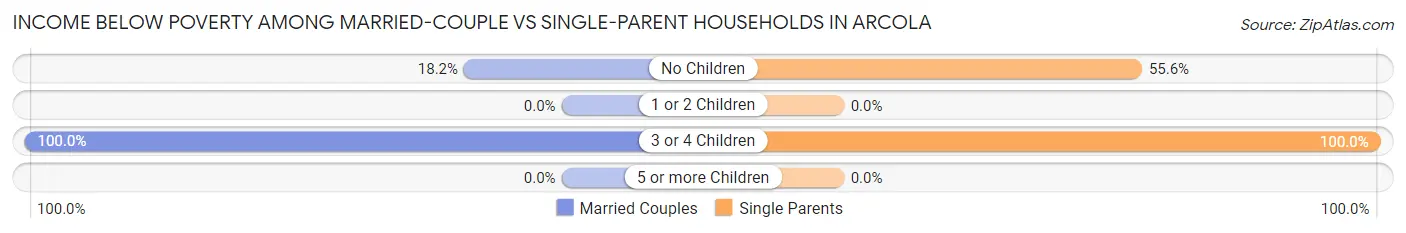
| Children | Married-Couple Families | Single-Parent Households |
| No Children | 2 (18.2%) | 5 (55.6%) |
| 1 or 2 Children | 0 (0.0%) | 0 (0.0%) |
| 3 or 4 Children | 3 (100.0%) | 9 (100.0%) |
| 5 or more Children | 0 (0.0%) | 0 (0.0%) |
| Total | 5 (26.3%) | 14 (66.7%) |
Race in Arcola
The most populous races in Arcola are Black / African American (198 | 95.2%), and White / Caucasian (10 | 4.8%).
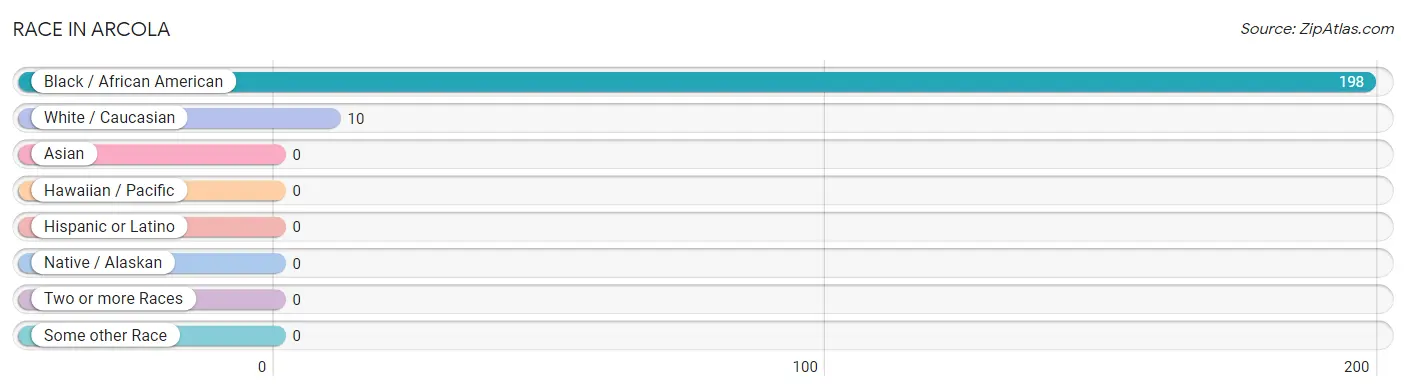
| Race | # Population | % Population |
| Asian | 0 | 0.0% |
| Black / African American | 198 | 95.2% |
| Hawaiian / Pacific | 0 | 0.0% |
| Hispanic or Latino | 0 | 0.0% |
| Native / Alaskan | 0 | 0.0% |
| White / Caucasian | 10 | 4.8% |
| Two or more Races | 0 | 0.0% |
| Some other Race | 0 | 0.0% |
| Total | 208 | 100.0% |
Ancestry in Arcola
The most populous ancestries reported in Arcola are American (27 | 13.0%), European (5 | 2.4%), and Italian (5 | 2.4%), together accounting for 17.8% of all Arcola residents.
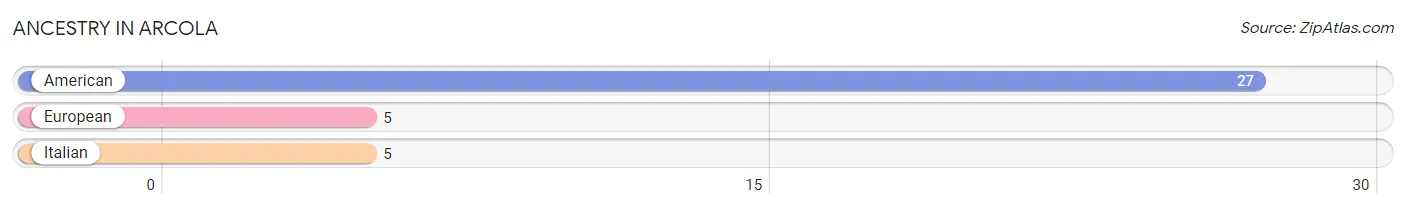
| Ancestry | # Population | % Population |
| American | 27 | 13.0% |
| European | 5 | 2.4% |
| Italian | 5 | 2.4% | View All 3 Rows |
Immigrants in Arcola

| Immigration Origin | # Population | % Population | View All 0 Rows |
Sex and Age in Arcola
Sex and Age in Arcola
The most populous age groups in Arcola are Under 5 Years (20 | 24.7%) for men and 70 to 74 Years (24 | 18.9%) for women.
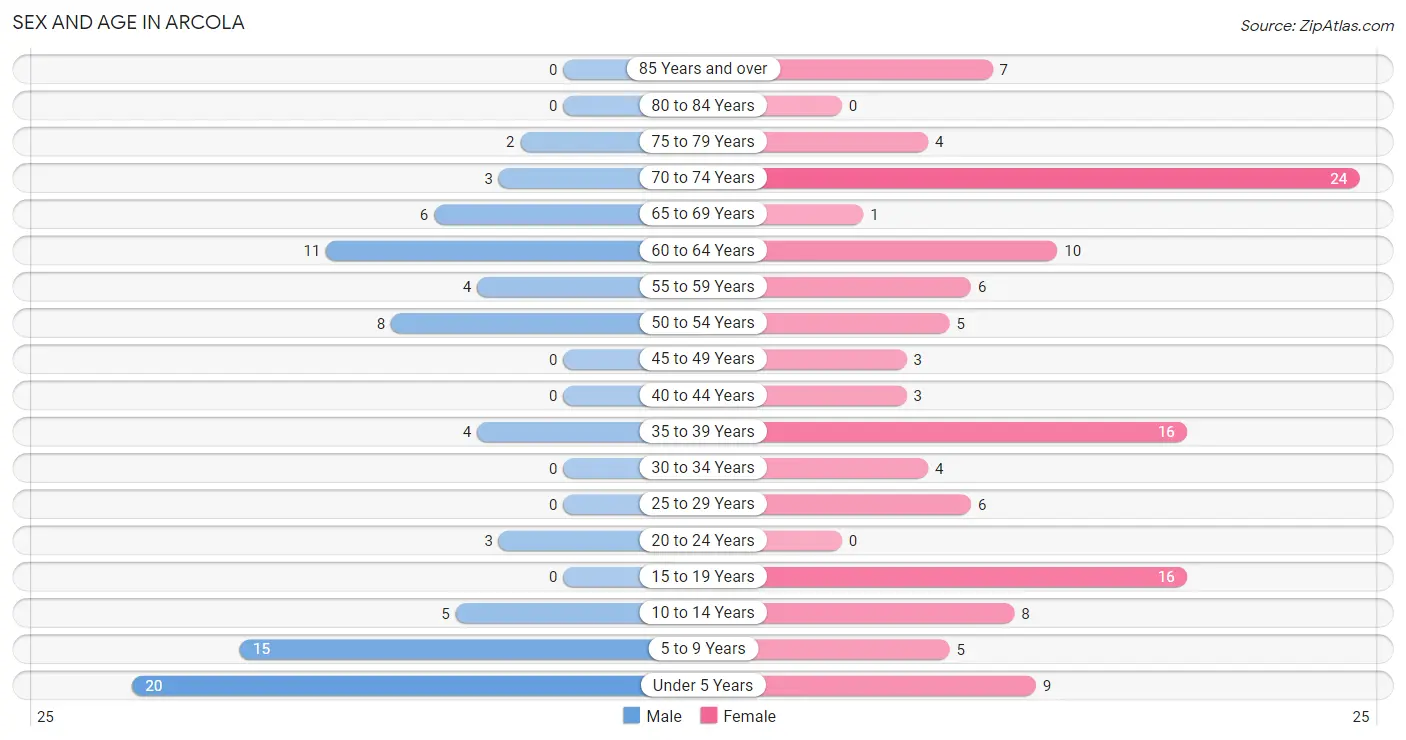
| Age Bracket | Male | Female |
| Under 5 Years | 20 (24.7%) | 9 (7.1%) |
| 5 to 9 Years | 15 (18.5%) | 5 (3.9%) |
| 10 to 14 Years | 5 (6.2%) | 8 (6.3%) |
| 15 to 19 Years | 0 (0.0%) | 16 (12.6%) |
| 20 to 24 Years | 3 (3.7%) | 0 (0.0%) |
| 25 to 29 Years | 0 (0.0%) | 6 (4.7%) |
| 30 to 34 Years | 0 (0.0%) | 4 (3.2%) |
| 35 to 39 Years | 4 (4.9%) | 16 (12.6%) |
| 40 to 44 Years | 0 (0.0%) | 3 (2.4%) |
| 45 to 49 Years | 0 (0.0%) | 3 (2.4%) |
| 50 to 54 Years | 8 (9.9%) | 5 (3.9%) |
| 55 to 59 Years | 4 (4.9%) | 6 (4.7%) |
| 60 to 64 Years | 11 (13.6%) | 10 (7.9%) |
| 65 to 69 Years | 6 (7.4%) | 1 (0.8%) |
| 70 to 74 Years | 3 (3.7%) | 24 (18.9%) |
| 75 to 79 Years | 2 (2.5%) | 4 (3.2%) |
| 80 to 84 Years | 0 (0.0%) | 0 (0.0%) |
| 85 Years and over | 0 (0.0%) | 7 (5.5%) |
| Total | 81 (100.0%) | 127 (100.0%) |
Families and Households in Arcola
Median Family Size in Arcola
The median family size in Arcola is 4.25 persons per family, with married-couple families (19 | 47.5%) accounting for the largest median family size of 4.53 persons per family. On the other hand, single male/father families (2 | 5.0%) represent the smallest median family size with 2.00 persons per family.
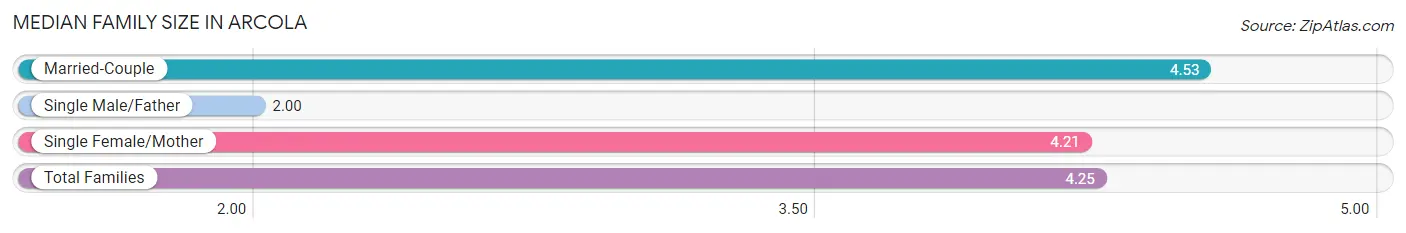
| Family Type | # Families | Family Size |
| Married-Couple | 19 (47.5%) | 4.53 |
| Single Male/Father | 2 (5.0%) | 2.00 |
| Single Female/Mother | 19 (47.5%) | 4.21 |
| Total Families | 40 (100.0%) | 4.25 |
Median Household Size in Arcola
The median household size in Arcola is 2.90 persons per household, with married-couple households (19 | 26.8%) accounting for the largest median household size of 4.53 persons per household. non-family households (31 | 43.7%) represent the smallest median household size with 1.16 persons per household.
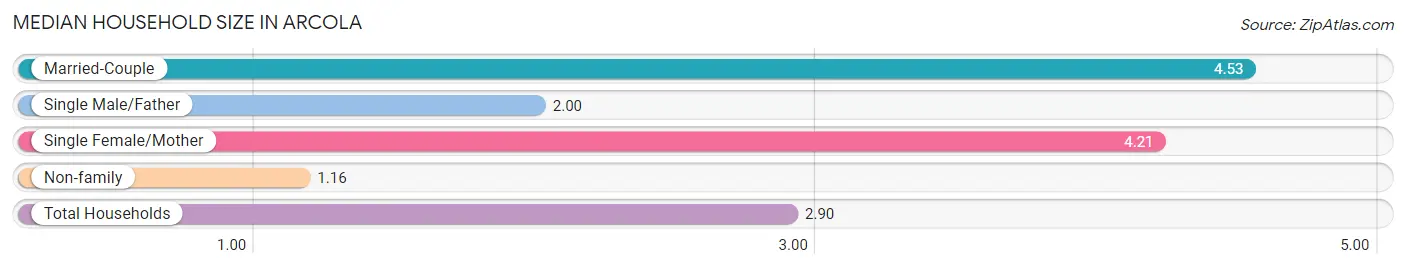
| Household Type | # Households | Household Size |
| Married-Couple | 19 (26.8%) | 4.53 |
| Single Male/Father | 2 (2.8%) | 2.00 |
| Single Female/Mother | 19 (26.8%) | 4.21 |
| Non-family | 31 (43.7%) | 1.16 |
| Total Households | 71 (100.0%) | 2.90 |
Household Size by Marriage Status in Arcola
Out of a total of 71 households in Arcola, 40 (56.3%) are family households, while 31 (43.7%) are nonfamily households. The most numerous type of family households are 2-person households, comprising 17, and the most common type of nonfamily households are 1-person households, comprising 26.
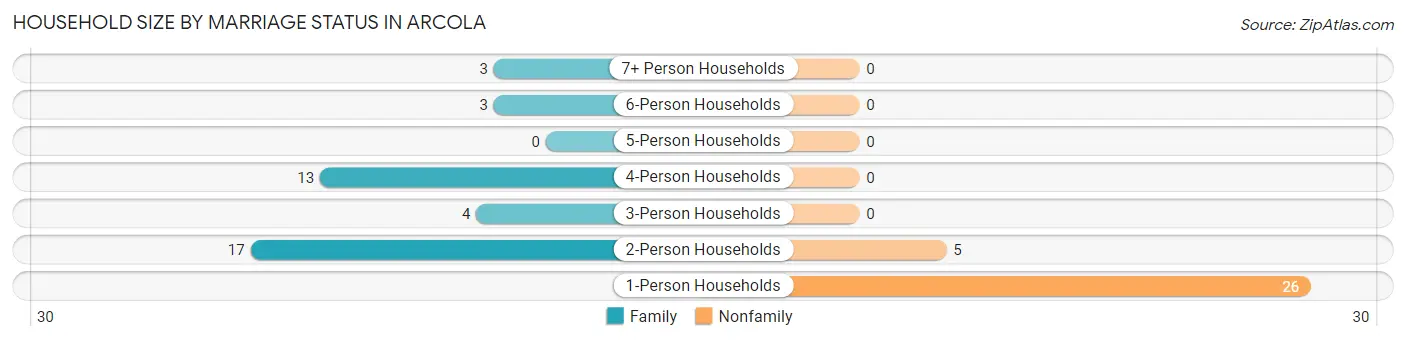
| Household Size | Family Households | Nonfamily Households |
| 1-Person Households | - | 26 (36.6%) |
| 2-Person Households | 17 (23.9%) | 5 (7.0%) |
| 3-Person Households | 4 (5.6%) | 0 (0.0%) |
| 4-Person Households | 13 (18.3%) | 0 (0.0%) |
| 5-Person Households | 0 (0.0%) | 0 (0.0%) |
| 6-Person Households | 3 (4.2%) | 0 (0.0%) |
| 7+ Person Households | 3 (4.2%) | 0 (0.0%) |
| Total | 40 (56.3%) | 31 (43.7%) |
Female Fertility in Arcola
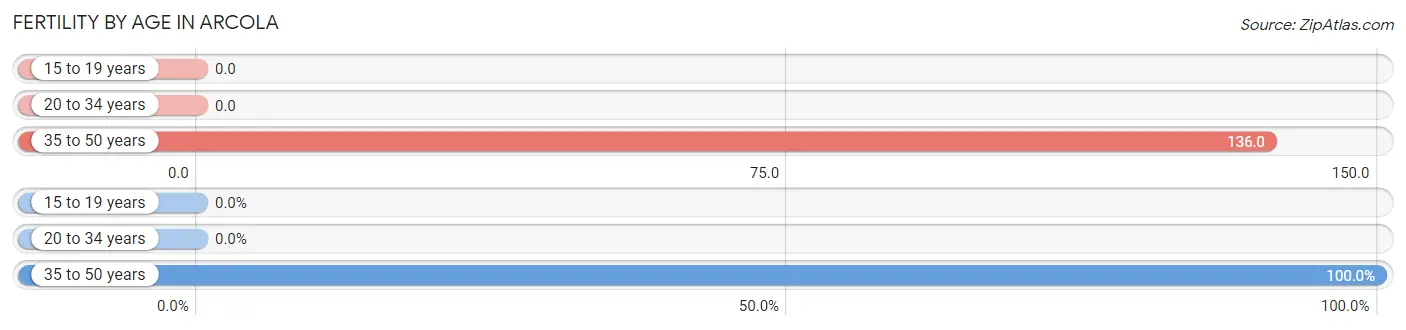
Fertility by Age in Arcola
Average fertility rate in Arcola is 63.0 births per 1,000 women. Women in the age bracket of 35 to 50 years have the highest fertility rate with 136.0 births per 1,000 women. Women in the age bracket of 35 to 50 years acount for 100.0% of all women with births.
| Age Bracket | Women with Births | Births / 1,000 Women |
| 15 to 19 years | 0 (0.0%) | 0.0 |
| 20 to 34 years | 0 (0.0%) | 0.0 |
| 35 to 50 years | 3 (100.0%) | 136.0 |
| Total | 3 (100.0%) | 63.0 |
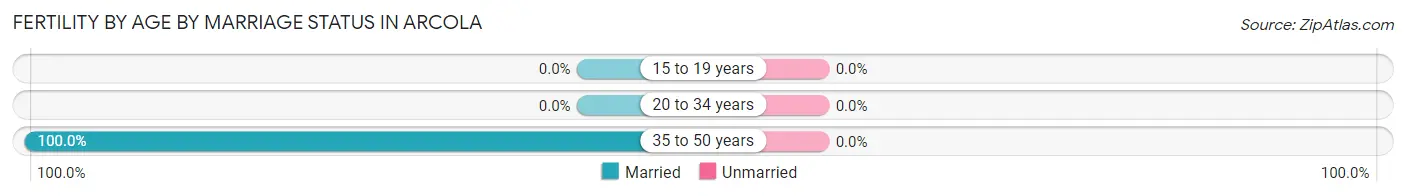
Fertility by Age by Marriage Status in Arcola
| Age Bracket | Married | Unmarried |
| 15 to 19 years | 0 (0.0%) | 0 (0.0%) |
| 20 to 34 years | 0 (0.0%) | 0 (0.0%) |
| 35 to 50 years | 3 (100.0%) | 0 (0.0%) |
| Total | 3 (100.0%) | 0 (0.0%) |
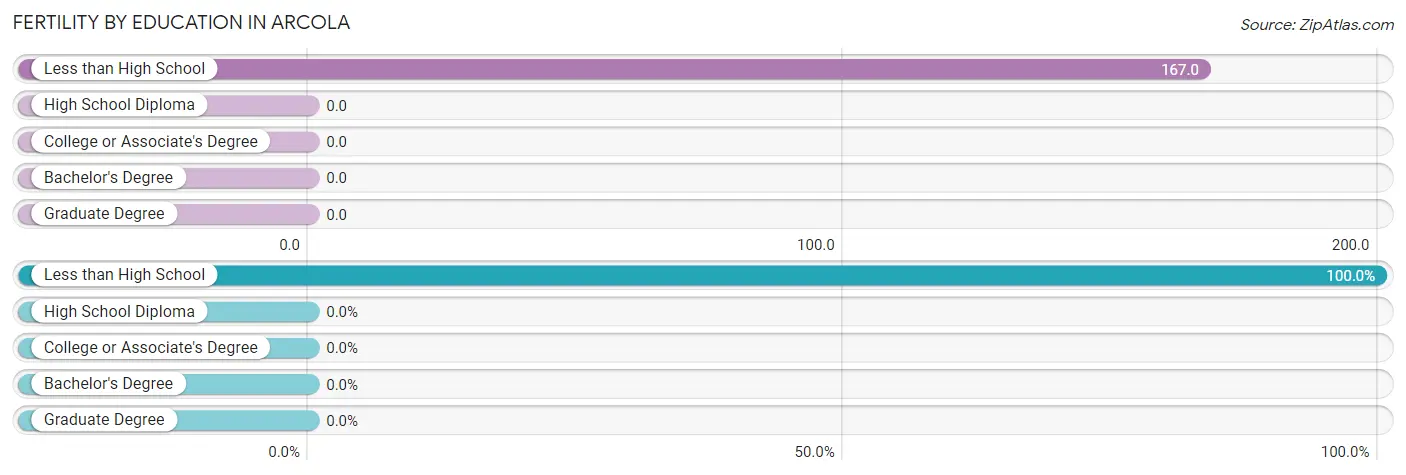
Fertility by Education in Arcola
| Educational Attainment | Women with Births | Births / 1,000 Women |
| Less than High School | 3 (100.0%) | 167.0 |
| High School Diploma | 0 (0.0%) | 0.0 |
| College or Associate's Degree | 0 (0.0%) | 0.0 |
| Bachelor's Degree | 0 (0.0%) | 0.0 |
| Graduate Degree | 0 (0.0%) | 0.0 |
| Total | 3 (100.0%) | 63.0 |
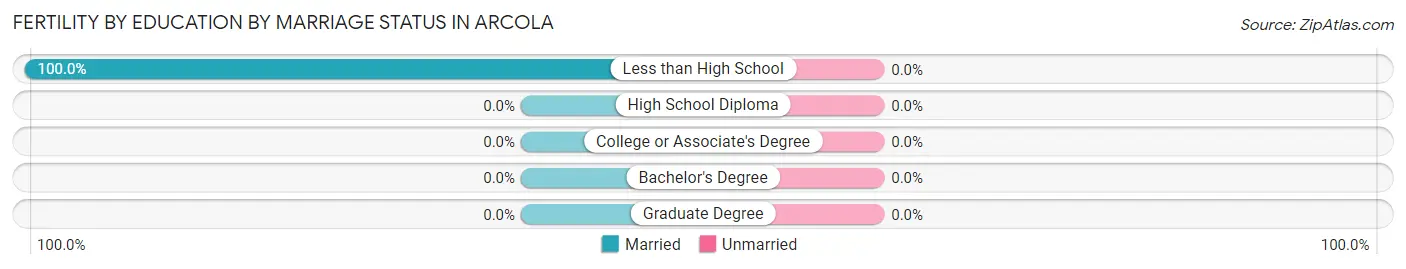
Fertility by Education by Marriage Status in Arcola
| Educational Attainment | Married | Unmarried |
| Less than High School | 3 (100.0%) | 0 (0.0%) |
| High School Diploma | 0 (0.0%) | 0 (0.0%) |
| College or Associate's Degree | 0 (0.0%) | 0 (0.0%) |
| Bachelor's Degree | 0 (0.0%) | 0 (0.0%) |
| Graduate Degree | 0 (0.0%) | 0 (0.0%) |
| Total | 3 (100.0%) | 0 (0.0%) |
Employment Characteristics in Arcola
Employment by Class of Employer in Arcola
Among the 38 employed individuals in Arcola, private company employees (14 | 36.8%), state government employees (12 | 31.6%), and not-for-profit organizations (9 | 23.7%) make up the most common classes of employment.
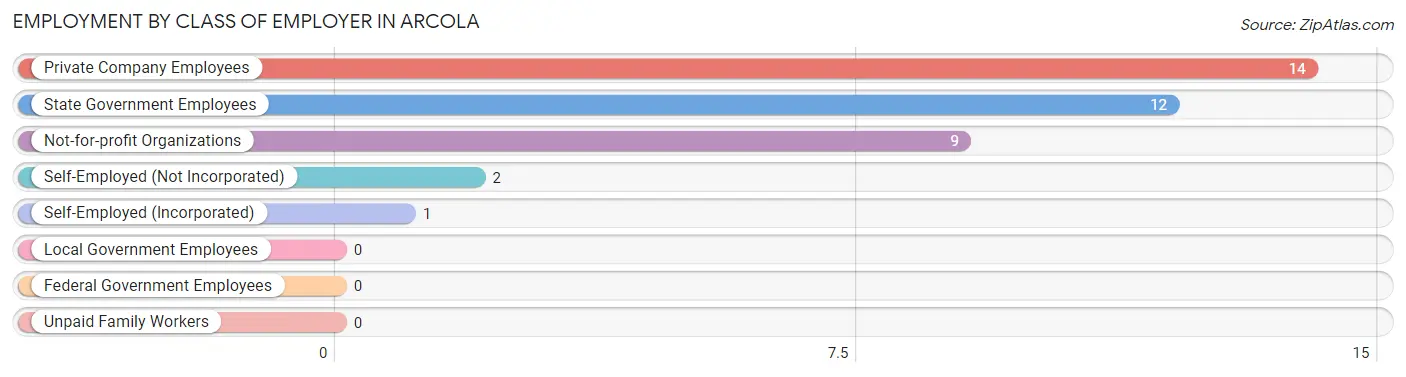
| Employer Class | # Employees | % Employees |
| Private Company Employees | 14 | 36.8% |
| Self-Employed (Incorporated) | 1 | 2.6% |
| Self-Employed (Not Incorporated) | 2 | 5.3% |
| Not-for-profit Organizations | 9 | 23.7% |
| Local Government Employees | 0 | 0.0% |
| State Government Employees | 12 | 31.6% |
| Federal Government Employees | 0 | 0.0% |
| Unpaid Family Workers | 0 | 0.0% |
| Total | 38 | 100.0% |
Employment Status by Age in Arcola
According to the labor force statistics for Arcola, out of the total population over 16 years of age (135), 37.0% or 50 individuals are in the labor force, with 18.0% or 9 of them unemployed. The age group with the highest labor force participation rate is 20 to 24 years, with 100.0% or 3 individuals in the labor force. Within the labor force, the 45 to 54 years age range has the highest percentage of unemployed individuals, with 69.2% or 9 of them being unemployed.
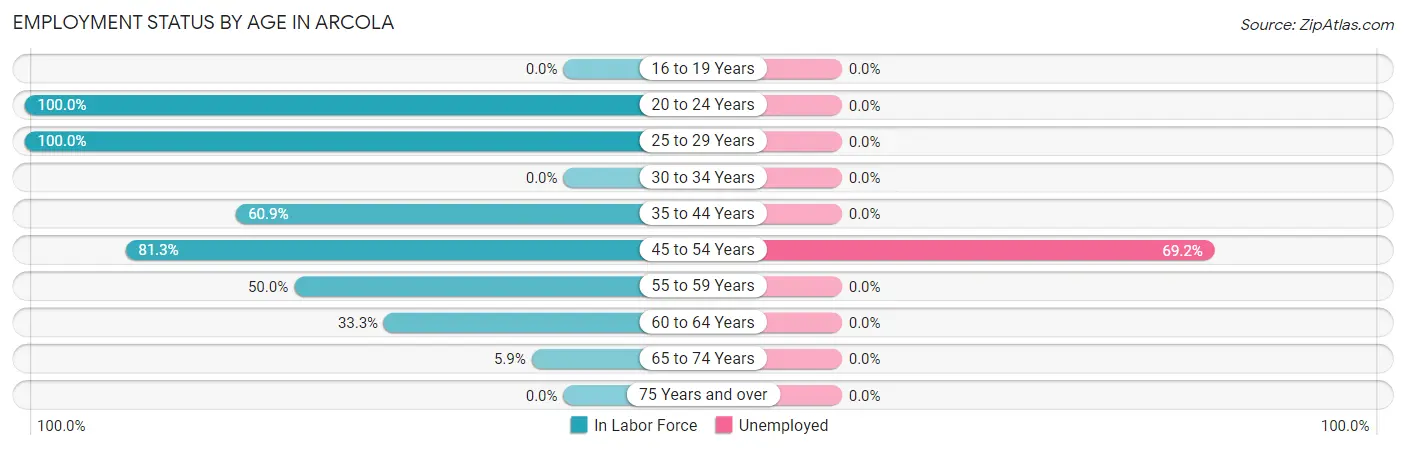
| Age Bracket | In Labor Force | Unemployed |
| 16 to 19 Years | 0 (0.0%) | 0 (0.0%) |
| 20 to 24 Years | 3 (100.0%) | 0 (0.0%) |
| 25 to 29 Years | 6 (100.0%) | 0 (0.0%) |
| 30 to 34 Years | 0 (0.0%) | 0 (0.0%) |
| 35 to 44 Years | 14 (60.9%) | 0 (0.0%) |
| 45 to 54 Years | 13 (81.3%) | 9 (69.2%) |
| 55 to 59 Years | 5 (50.0%) | 0 (0.0%) |
| 60 to 64 Years | 7 (33.3%) | 0 (0.0%) |
| 65 to 74 Years | 2 (5.9%) | 0 (0.0%) |
| 75 Years and over | 0 (0.0%) | 0 (0.0%) |
| Total | 50 (37.0%) | 9 (18.0%) |
Employment Status by Educational Attainment in Arcola
According to labor force statistics for Arcola, 56.3% of individuals (45) out of the total population between 25 and 64 years of age (80) are in the labor force, with 20.0% or 9 of them being unemployed. The group with the highest labor force participation rate are those with the educational attainment of college / associate degree, with 100.0% or 15 individuals in the labor force. Within the labor force, individuals with college / associate degree education have the highest percentage of unemployment, with 40.0% or 6 of them being unemployed.
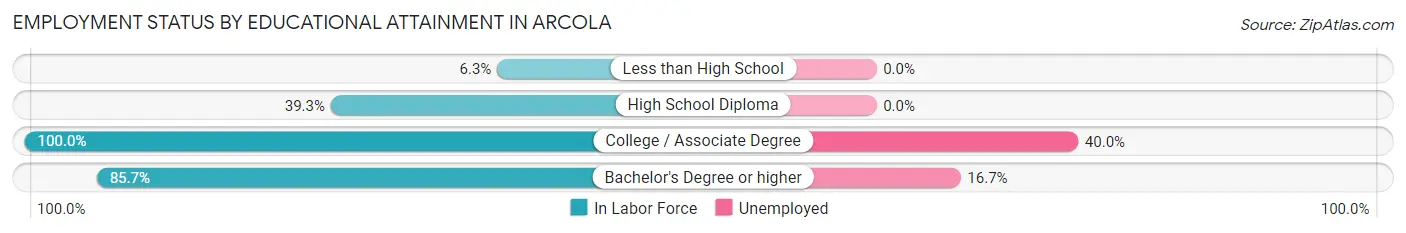
| Educational Attainment | In Labor Force | Unemployed |
| Less than High School | 1 (6.3%) | 0 (0.0%) |
| High School Diploma | 11 (39.3%) | 0 (0.0%) |
| College / Associate Degree | 15 (100.0%) | 6 (40.0%) |
| Bachelor's Degree or higher | 18 (85.7%) | 4 (16.7%) |
| Total | 45 (56.3%) | 16 (20.0%) |
Employment Occupations by Sex in Arcola
Management, Business, Science and Arts Occupations
The most common Management, Business, Science and Arts occupations in Arcola are Community & Social Service (3 | 7.3%), Arts, Media & Entertainment (3 | 7.3%), and Business & Financial (2 | 4.9%).
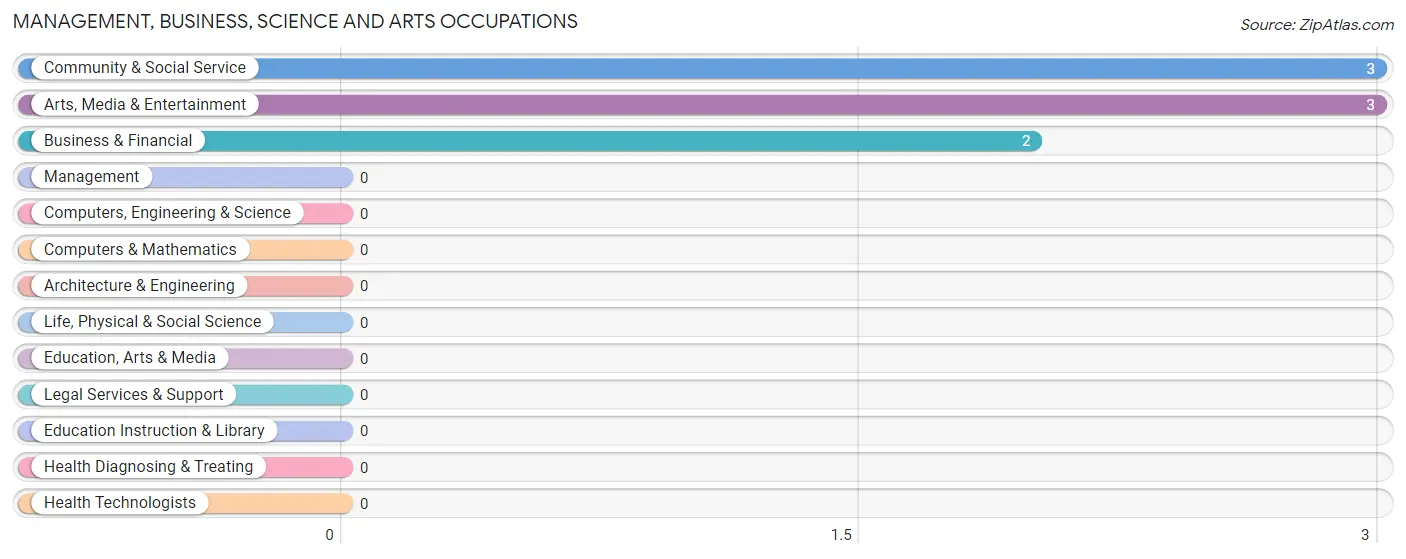
Management, Business, Science and Arts Occupations by Sex
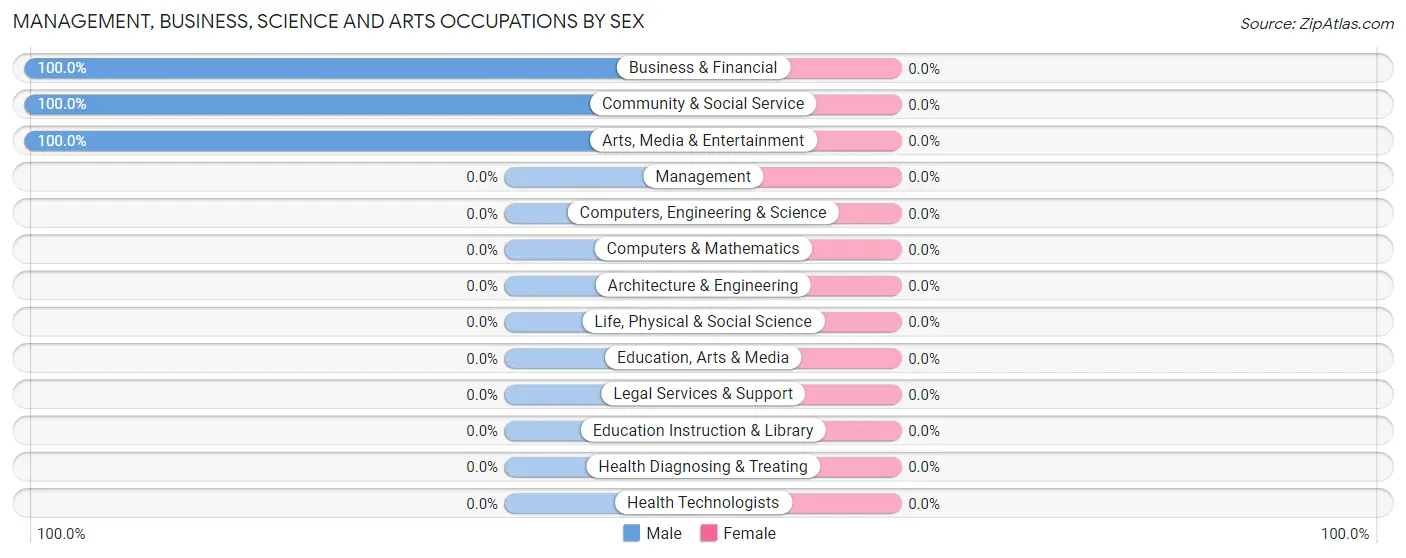
| Occupation | Male | Female |
| Management | 0 (0.0%) | 0 (0.0%) |
| Business & Financial | 2 (100.0%) | 0 (0.0%) |
| Computers, Engineering & Science | 0 (0.0%) | 0 (0.0%) |
| Computers & Mathematics | 0 (0.0%) | 0 (0.0%) |
| Architecture & Engineering | 0 (0.0%) | 0 (0.0%) |
| Life, Physical & Social Science | 0 (0.0%) | 0 (0.0%) |
| Community & Social Service | 3 (100.0%) | 0 (0.0%) |
| Education, Arts & Media | 0 (0.0%) | 0 (0.0%) |
| Legal Services & Support | 0 (0.0%) | 0 (0.0%) |
| Education Instruction & Library | 0 (0.0%) | 0 (0.0%) |
| Arts, Media & Entertainment | 3 (100.0%) | 0 (0.0%) |
| Health Diagnosing & Treating | 0 (0.0%) | 0 (0.0%) |
| Health Technologists | 0 (0.0%) | 0 (0.0%) |
| Total (Category) | 5 (100.0%) | 0 (0.0%) |
| Total (Overall) | 13 (31.7%) | 28 (68.3%) |
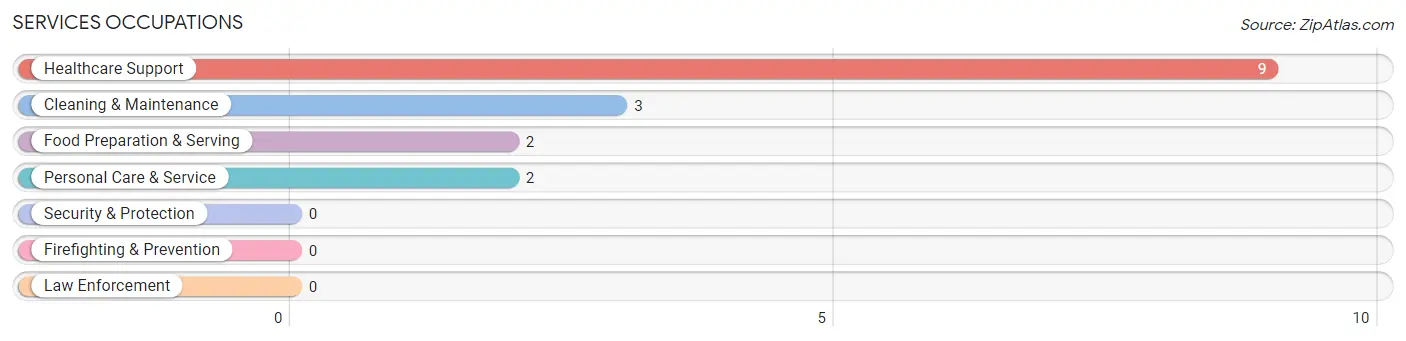
Services Occupations
The most common Services occupations in Arcola are Healthcare Support (9 | 22.0%), Cleaning & Maintenance (3 | 7.3%), Food Preparation & Serving (2 | 4.9%), and Personal Care & Service (2 | 4.9%).
Services Occupations by Sex
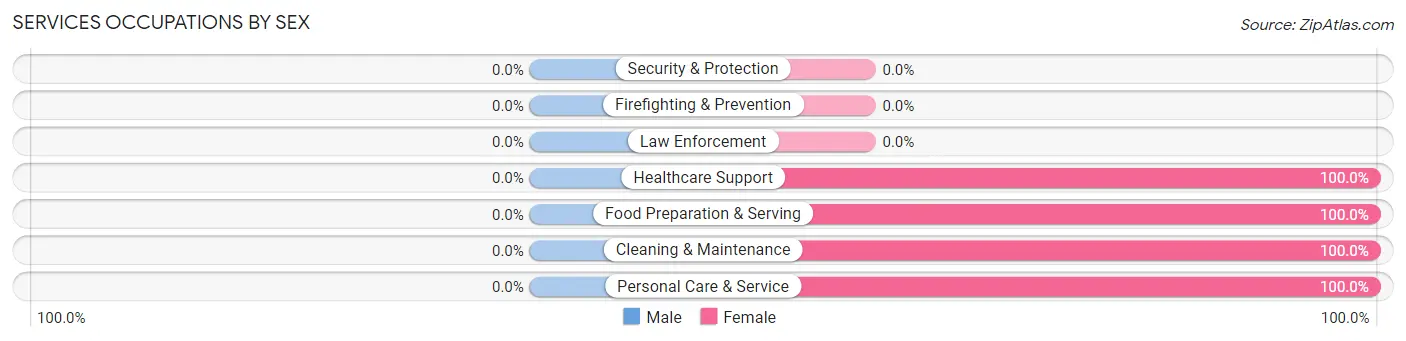
| Occupation | Male | Female |
| Healthcare Support | 0 (0.0%) | 9 (100.0%) |
| Security & Protection | 0 (0.0%) | 0 (0.0%) |
| Firefighting & Prevention | 0 (0.0%) | 0 (0.0%) |
| Law Enforcement | 0 (0.0%) | 0 (0.0%) |
| Food Preparation & Serving | 0 (0.0%) | 2 (100.0%) |
| Cleaning & Maintenance | 0 (0.0%) | 3 (100.0%) |
| Personal Care & Service | 0 (0.0%) | 2 (100.0%) |
| Total (Category) | 0 (0.0%) | 16 (100.0%) |
| Total (Overall) | 13 (31.7%) | 28 (68.3%) |
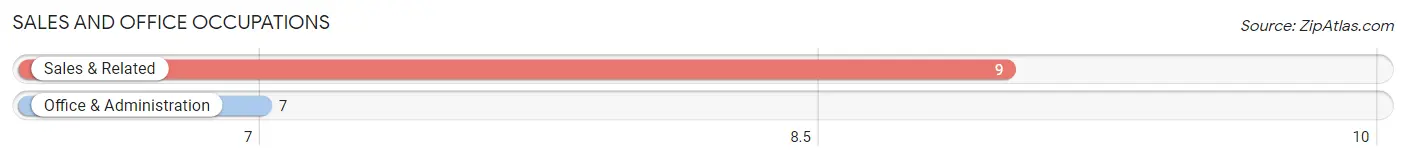
Sales and Office Occupations
The most common Sales and Office occupations in Arcola are Sales & Related (9 | 22.0%), and Office & Administration (7 | 17.1%).
Sales and Office Occupations by Sex

| Occupation | Male | Female |
| Sales & Related | 1 (11.1%) | 8 (88.9%) |
| Office & Administration | 3 (42.9%) | 4 (57.1%) |
| Total (Category) | 4 (25.0%) | 12 (75.0%) |
| Total (Overall) | 13 (31.7%) | 28 (68.3%) |
Natural Resources, Construction and Maintenance Occupations

Natural Resources, Construction and Maintenance Occupations by Sex
| Occupation | Male | Female |
| Farming, Fishing & Forestry | 0 (0.0%) | 0 (0.0%) |
| Construction & Extraction | 0 (0.0%) | 0 (0.0%) |
| Installation, Maintenance & Repair | 0 (0.0%) | 0 (0.0%) |
| Total (Category) | 0 (0.0%) | 0 (0.0%) |
| Total (Overall) | 13 (31.7%) | 28 (68.3%) |
Production, Transportation and Moving Occupations
The most common Production, Transportation and Moving occupations in Arcola are , and Production (4 | 9.8%).
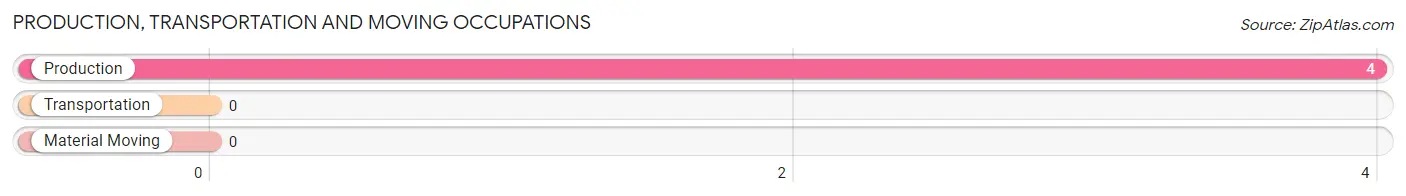
Production, Transportation and Moving Occupations by Sex
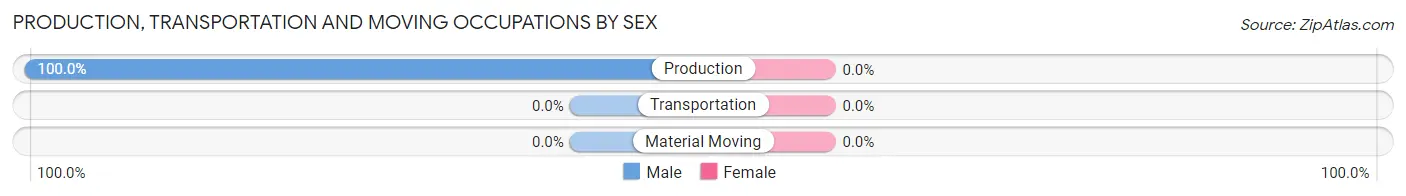
| Occupation | Male | Female |
| Production | 4 (100.0%) | 0 (0.0%) |
| Transportation | 0 (0.0%) | 0 (0.0%) |
| Material Moving | 0 (0.0%) | 0 (0.0%) |
| Total (Category) | 4 (100.0%) | 0 (0.0%) |
| Total (Overall) | 13 (31.7%) | 28 (68.3%) |
Employment Industries by Sex in Arcola
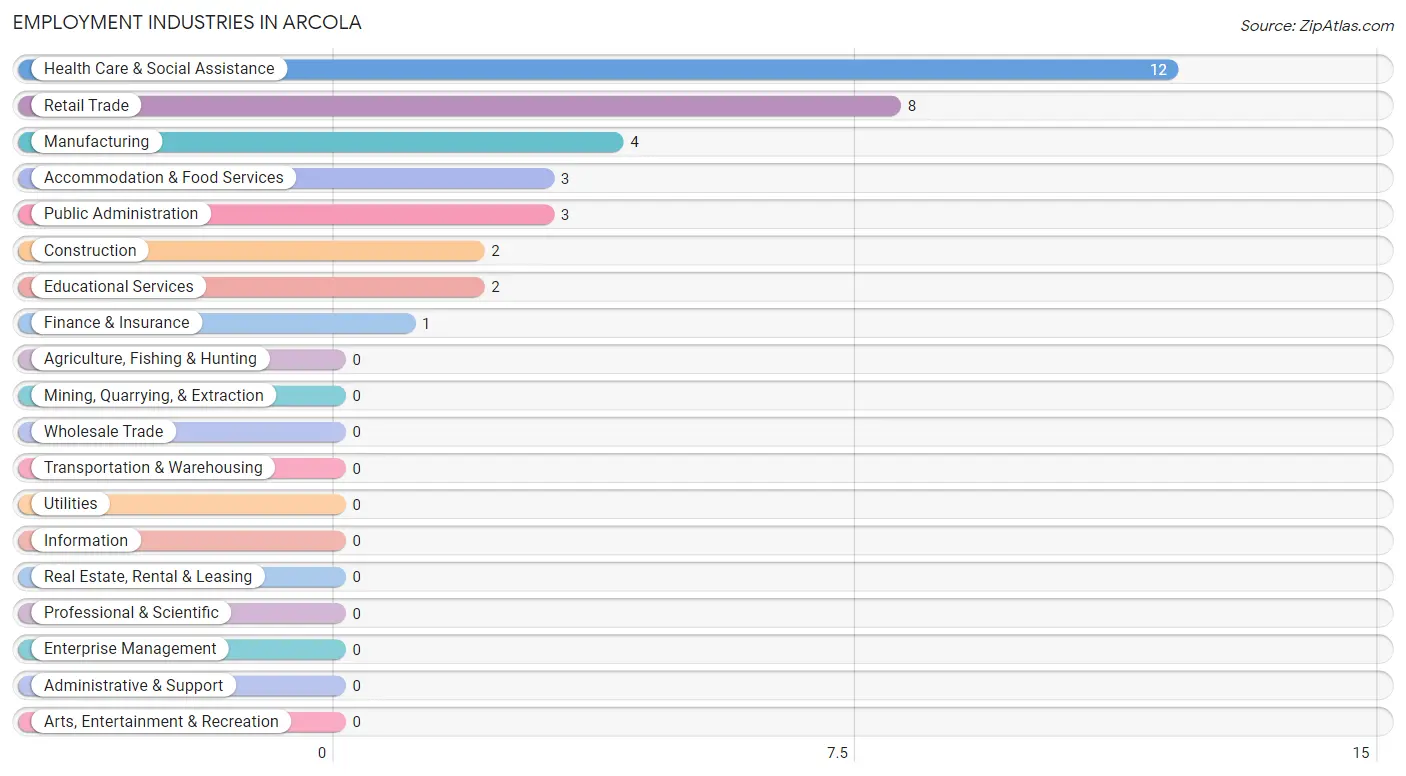
Employment Industries in Arcola
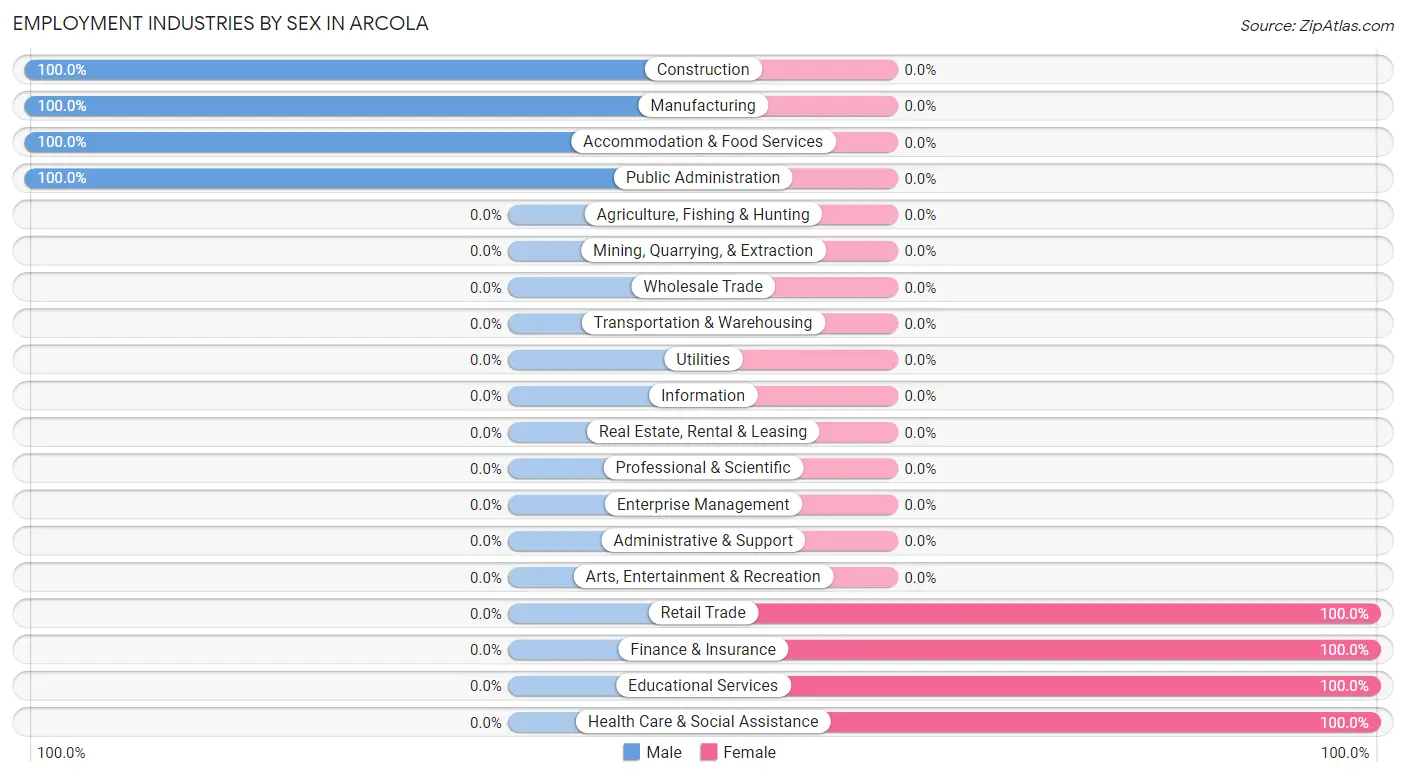
The major employment industries in Arcola include Health Care & Social Assistance (12 | 29.3%), Retail Trade (8 | 19.5%), Manufacturing (4 | 9.8%), Accommodation & Food Services (3 | 7.3%), and Public Administration (3 | 7.3%).
Employment Industries by Sex in Arcola
The Arcola industries that see more men than women are Construction (100.0%), Manufacturing (100.0%), and Accommodation & Food Services (100.0%), whereas the industries that tend to have a higher number of women are Retail Trade (100.0%), Finance & Insurance (100.0%), and Educational Services (100.0%).
| Industry | Male | Female |
| Agriculture, Fishing & Hunting | 0 (0.0%) | 0 (0.0%) |
| Mining, Quarrying, & Extraction | 0 (0.0%) | 0 (0.0%) |
| Construction | 2 (100.0%) | 0 (0.0%) |
| Manufacturing | 4 (100.0%) | 0 (0.0%) |
| Wholesale Trade | 0 (0.0%) | 0 (0.0%) |
| Retail Trade | 0 (0.0%) | 8 (100.0%) |
| Transportation & Warehousing | 0 (0.0%) | 0 (0.0%) |
| Utilities | 0 (0.0%) | 0 (0.0%) |
| Information | 0 (0.0%) | 0 (0.0%) |
| Finance & Insurance | 0 (0.0%) | 1 (100.0%) |
| Real Estate, Rental & Leasing | 0 (0.0%) | 0 (0.0%) |
| Professional & Scientific | 0 (0.0%) | 0 (0.0%) |
| Enterprise Management | 0 (0.0%) | 0 (0.0%) |
| Administrative & Support | 0 (0.0%) | 0 (0.0%) |
| Educational Services | 0 (0.0%) | 2 (100.0%) |
| Health Care & Social Assistance | 0 (0.0%) | 12 (100.0%) |
| Arts, Entertainment & Recreation | 0 (0.0%) | 0 (0.0%) |
| Accommodation & Food Services | 3 (100.0%) | 0 (0.0%) |
| Public Administration | 3 (100.0%) | 0 (0.0%) |
| Total | 13 (31.7%) | 28 (68.3%) |
Education in Arcola
School Enrollment in Arcola
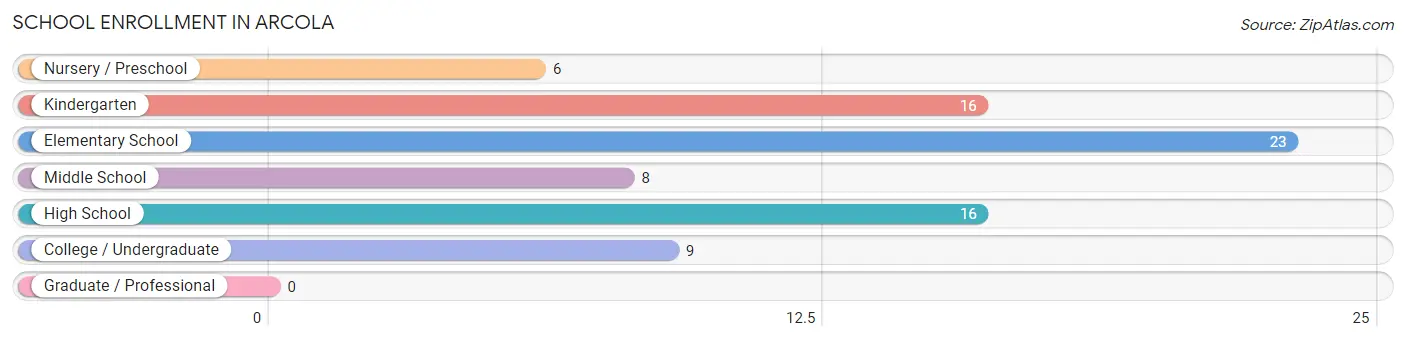
The most common levels of schooling among the 78 students in Arcola are elementary school (23 | 29.5%), kindergarten (16 | 20.5%), and high school (16 | 20.5%).
| School Level | # Students | % Students |
| Nursery / Preschool | 6 | 7.7% |
| Kindergarten | 16 | 20.5% |
| Elementary School | 23 | 29.5% |
| Middle School | 8 | 10.3% |
| High School | 16 | 20.5% |
| College / Undergraduate | 9 | 11.5% |
| Graduate / Professional | 0 | 0.0% |
| Total | 78 | 100.0% |
School Enrollment by Age by Funding Source in Arcola
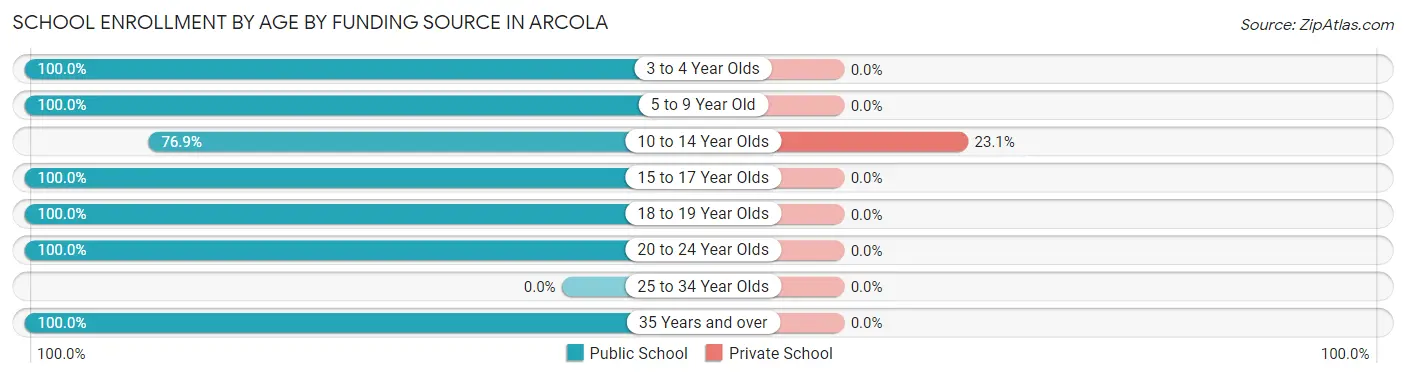
Out of a total of 78 students who are enrolled in schools in Arcola, 3 (3.8%) attend a private institution, while the remaining 75 (96.2%) are enrolled in public schools. The age group of 10 to 14 year olds has the highest likelihood of being enrolled in private schools, with 3 (23.1% in the age bracket) enrolled. Conversely, the age group of 3 to 4 year olds has the lowest likelihood of being enrolled in a private school, with 22 (100.0% in the age bracket) attending a public institution.
| Age Bracket | Public School | Private School |
| 3 to 4 Year Olds | 22 (100.0%) | 0 (0.0%) |
| 5 to 9 Year Old | 20 (100.0%) | 0 (0.0%) |
| 10 to 14 Year Olds | 10 (76.9%) | 3 (23.1%) |
| 15 to 17 Year Olds | 11 (100.0%) | 0 (0.0%) |
| 18 to 19 Year Olds | 5 (100.0%) | 0 (0.0%) |
| 20 to 24 Year Olds | 3 (100.0%) | 0 (0.0%) |
| 25 to 34 Year Olds | 0 (0.0%) | 0 (0.0%) |
| 35 Years and over | 4 (100.0%) | 0 (0.0%) |
| Total | 75 (96.2%) | 3 (3.8%) |
Educational Attainment by Field of Study in Arcola
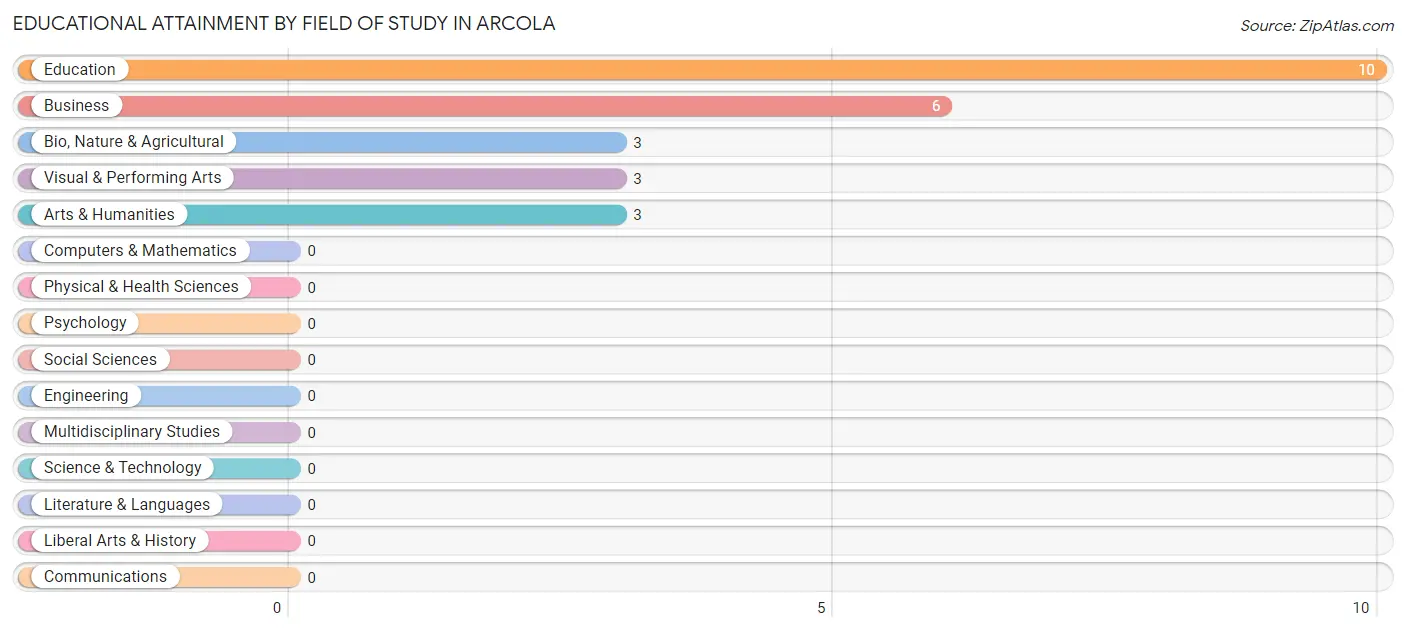
Education (10 | 40.0%), business (6 | 24.0%), bio, nature & agricultural (3 | 12.0%), visual & performing arts (3 | 12.0%), and arts & humanities (3 | 12.0%) are the most common fields of study among 25 individuals in Arcola who have obtained a bachelor's degree or higher.
| Field of Study | # Graduates | % Graduates |
| Computers & Mathematics | 0 | 0.0% |
| Bio, Nature & Agricultural | 3 | 12.0% |
| Physical & Health Sciences | 0 | 0.0% |
| Psychology | 0 | 0.0% |
| Social Sciences | 0 | 0.0% |
| Engineering | 0 | 0.0% |
| Multidisciplinary Studies | 0 | 0.0% |
| Science & Technology | 0 | 0.0% |
| Business | 6 | 24.0% |
| Education | 10 | 40.0% |
| Literature & Languages | 0 | 0.0% |
| Liberal Arts & History | 0 | 0.0% |
| Visual & Performing Arts | 3 | 12.0% |
| Communications | 0 | 0.0% |
| Arts & Humanities | 3 | 12.0% |
| Total | 25 | 100.0% |
Transportation & Commute in Arcola
Vehicle Availability by Sex in Arcola
The most prevalent vehicle ownership categories in Arcola are males with 3 vehicles (6, accounting for 46.2%) and females with 3 vehicles (2, making up 24.0%).
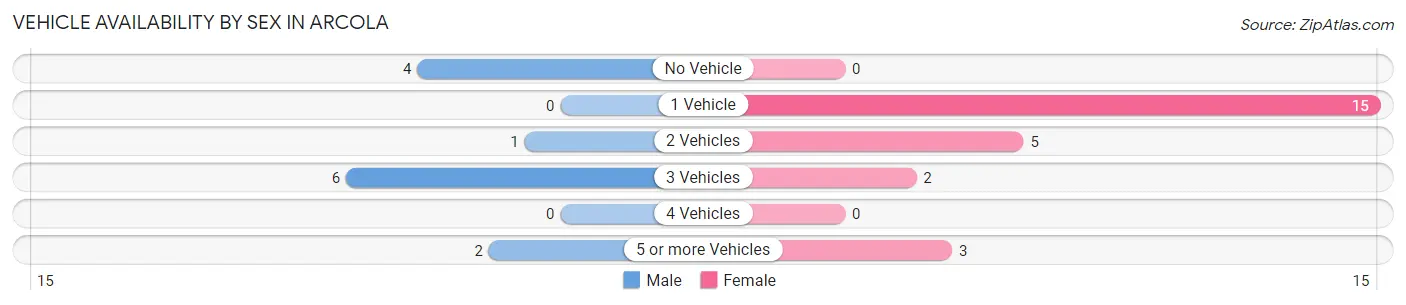
| Vehicles Available | Male | Female |
| No Vehicle | 4 (30.8%) | 0 (0.0%) |
| 1 Vehicle | 0 (0.0%) | 15 (60.0%) |
| 2 Vehicles | 1 (7.7%) | 5 (20.0%) |
| 3 Vehicles | 6 (46.2%) | 2 (8.0%) |
| 4 Vehicles | 0 (0.0%) | 0 (0.0%) |
| 5 or more Vehicles | 2 (15.4%) | 3 (12.0%) |
| Total | 13 (100.0%) | 25 (100.0%) |
Commute Time in Arcola
The most frequently occuring commute durations in Arcola are 10 to 14 minutes (9 commuters, 25.7%), 45 to 59 minutes (9 commuters, 25.7%), and 30 to 34 minutes (7 commuters, 20.0%).
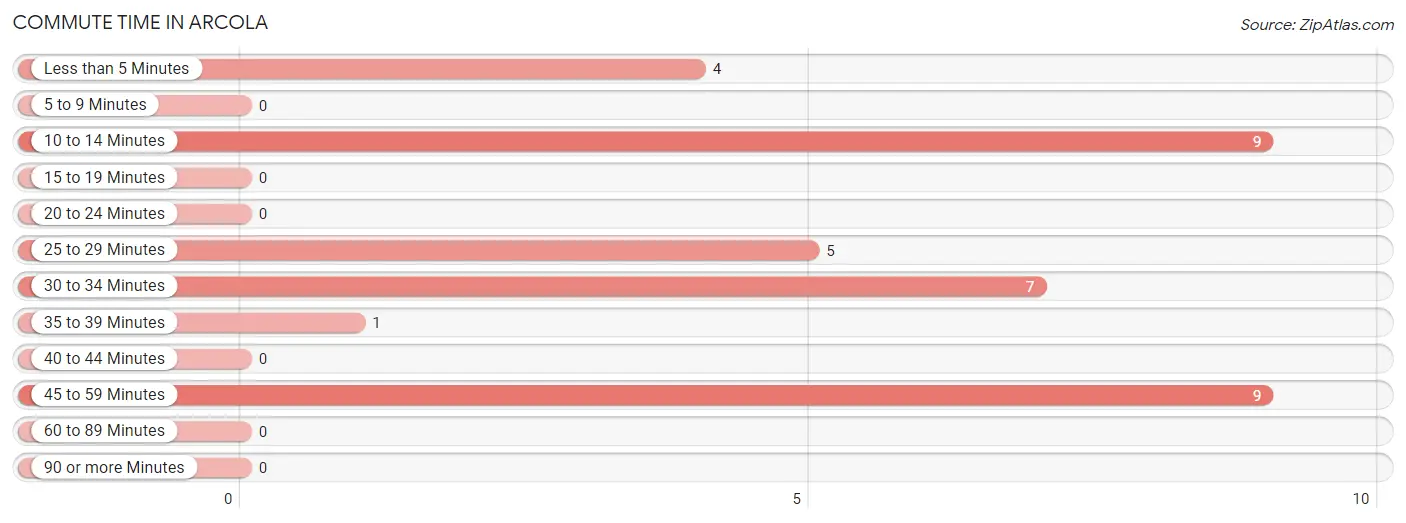
| Commute Time | # Commuters | % Commuters |
| Less than 5 Minutes | 4 | 11.4% |
| 5 to 9 Minutes | 0 | 0.0% |
| 10 to 14 Minutes | 9 | 25.7% |
| 15 to 19 Minutes | 0 | 0.0% |
| 20 to 24 Minutes | 0 | 0.0% |
| 25 to 29 Minutes | 5 | 14.3% |
| 30 to 34 Minutes | 7 | 20.0% |
| 35 to 39 Minutes | 1 | 2.9% |
| 40 to 44 Minutes | 0 | 0.0% |
| 45 to 59 Minutes | 9 | 25.7% |
| 60 to 89 Minutes | 0 | 0.0% |
| 90 or more Minutes | 0 | 0.0% |
Commute Time by Sex in Arcola
The most common commute times in Arcola are 30 to 34 minutes (5 commuters, 41.7%) for males and 45 to 59 minutes (9 commuters, 39.1%) for females.
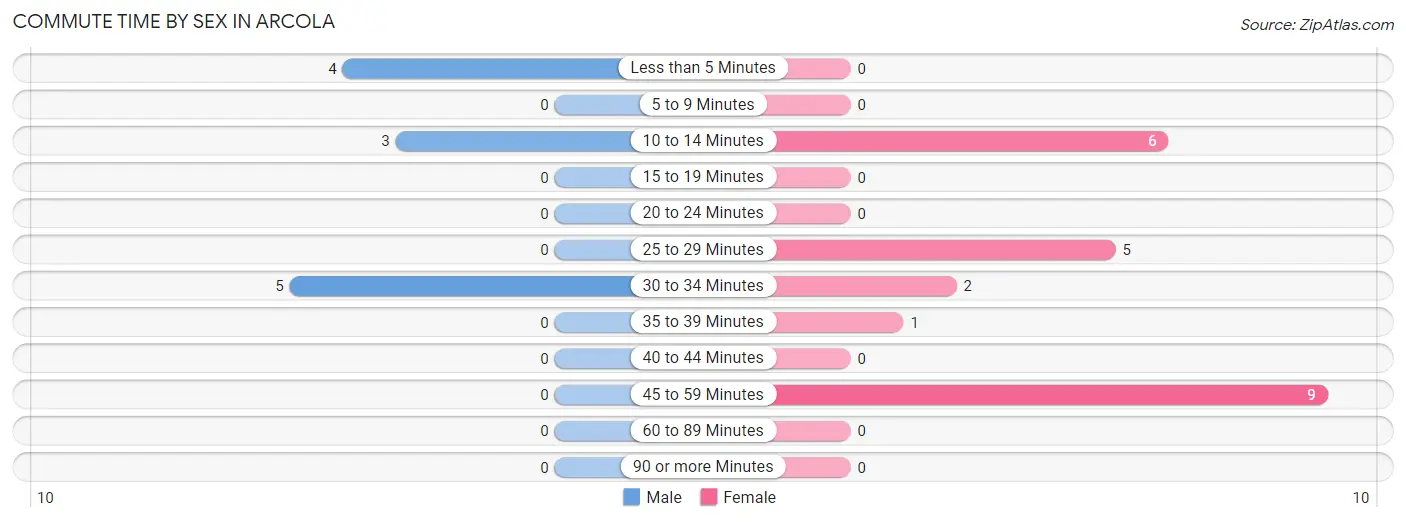
| Commute Time | Male | Female |
| Less than 5 Minutes | 4 (33.3%) | 0 (0.0%) |
| 5 to 9 Minutes | 0 (0.0%) | 0 (0.0%) |
| 10 to 14 Minutes | 3 (25.0%) | 6 (26.1%) |
| 15 to 19 Minutes | 0 (0.0%) | 0 (0.0%) |
| 20 to 24 Minutes | 0 (0.0%) | 0 (0.0%) |
| 25 to 29 Minutes | 0 (0.0%) | 5 (21.7%) |
| 30 to 34 Minutes | 5 (41.7%) | 2 (8.7%) |
| 35 to 39 Minutes | 0 (0.0%) | 1 (4.3%) |
| 40 to 44 Minutes | 0 (0.0%) | 0 (0.0%) |
| 45 to 59 Minutes | 0 (0.0%) | 9 (39.1%) |
| 60 to 89 Minutes | 0 (0.0%) | 0 (0.0%) |
| 90 or more Minutes | 0 (0.0%) | 0 (0.0%) |
Time of Departure to Work by Sex in Arcola
The most frequent times of departure to work in Arcola are 7:30 AM to 7:59 AM (5, 41.7%) for males and 9:00 AM to 9:59 AM (9, 39.1%) for females.
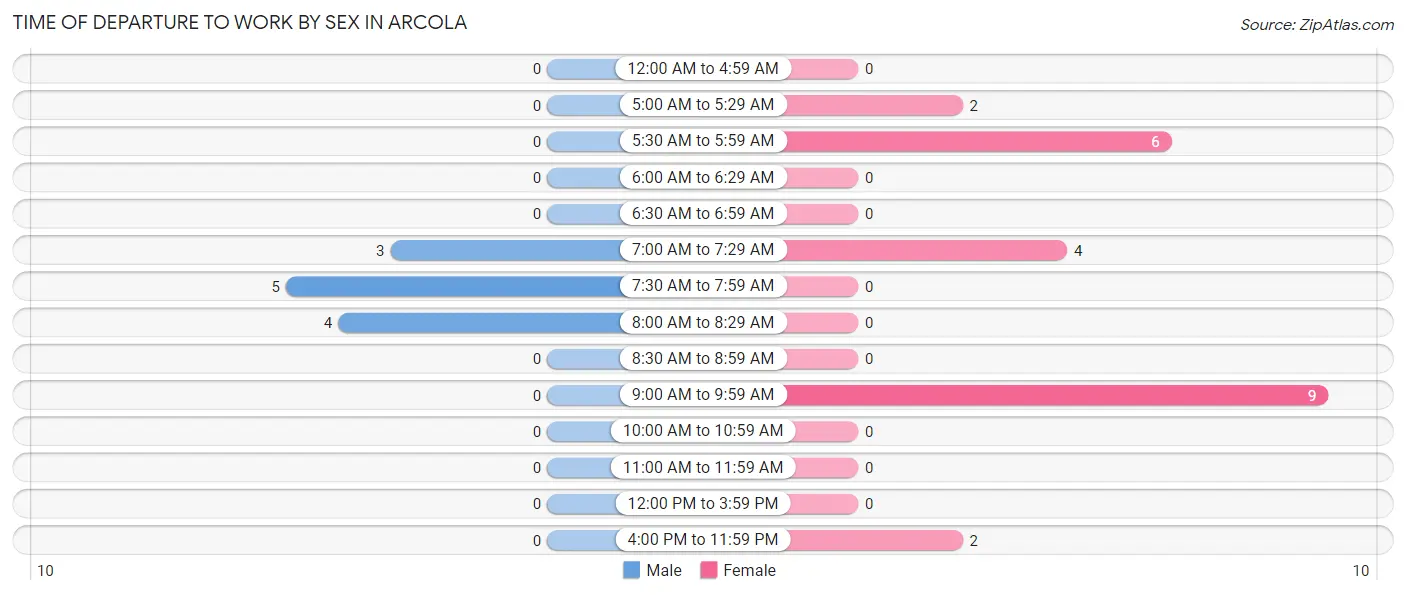
| Time of Departure | Male | Female |
| 12:00 AM to 4:59 AM | 0 (0.0%) | 0 (0.0%) |
| 5:00 AM to 5:29 AM | 0 (0.0%) | 2 (8.7%) |
| 5:30 AM to 5:59 AM | 0 (0.0%) | 6 (26.1%) |
| 6:00 AM to 6:29 AM | 0 (0.0%) | 0 (0.0%) |
| 6:30 AM to 6:59 AM | 0 (0.0%) | 0 (0.0%) |
| 7:00 AM to 7:29 AM | 3 (25.0%) | 4 (17.4%) |
| 7:30 AM to 7:59 AM | 5 (41.7%) | 0 (0.0%) |
| 8:00 AM to 8:29 AM | 4 (33.3%) | 0 (0.0%) |
| 8:30 AM to 8:59 AM | 0 (0.0%) | 0 (0.0%) |
| 9:00 AM to 9:59 AM | 0 (0.0%) | 9 (39.1%) |
| 10:00 AM to 10:59 AM | 0 (0.0%) | 0 (0.0%) |
| 11:00 AM to 11:59 AM | 0 (0.0%) | 0 (0.0%) |
| 12:00 PM to 3:59 PM | 0 (0.0%) | 0 (0.0%) |
| 4:00 PM to 11:59 PM | 0 (0.0%) | 2 (8.7%) |
| Total | 12 (100.0%) | 23 (100.0%) |
Housing Occupancy in Arcola
Occupancy by Ownership in Arcola
Of the total 71 dwellings in Arcola, owner-occupied units account for 45 (63.4%), while renter-occupied units make up 26 (36.6%).
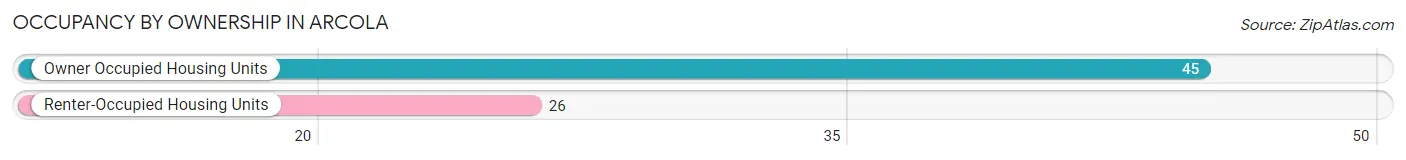
| Occupancy | # Housing Units | % Housing Units |
| Owner Occupied Housing Units | 45 | 63.4% |
| Renter-Occupied Housing Units | 26 | 36.6% |
| Total Occupied Housing Units | 71 | 100.0% |
Occupancy by Household Size in Arcola
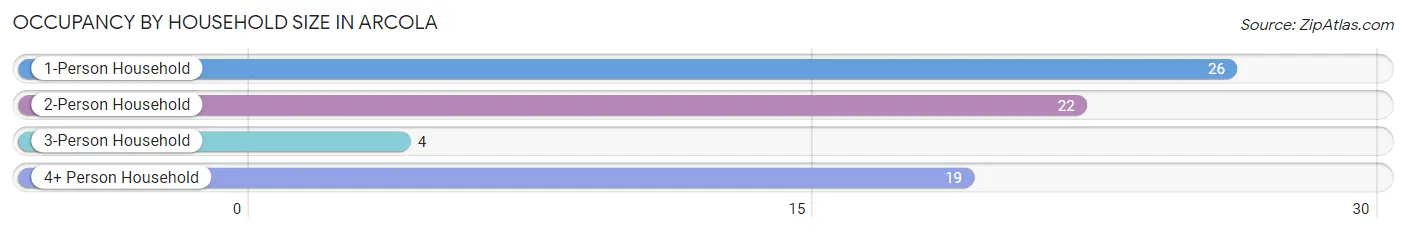
| Household Size | # Housing Units | % Housing Units |
| 1-Person Household | 26 | 36.6% |
| 2-Person Household | 22 | 31.0% |
| 3-Person Household | 4 | 5.6% |
| 4+ Person Household | 19 | 26.8% |
| Total Housing Units | 71 | 100.0% |
Occupancy by Ownership by Household Size in Arcola
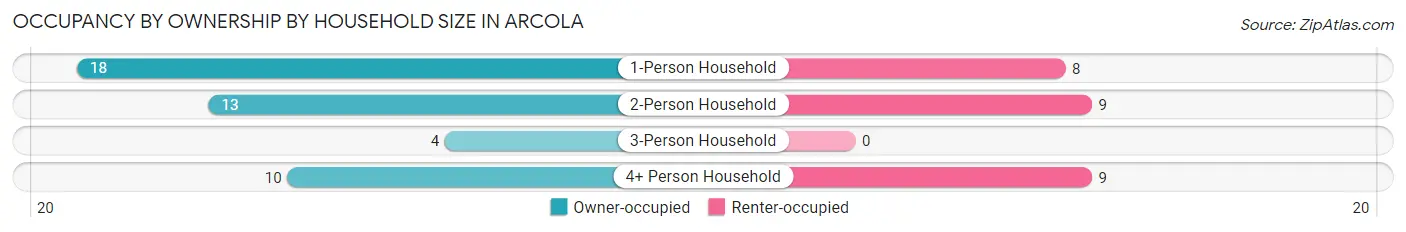
| Household Size | Owner-occupied | Renter-occupied |
| 1-Person Household | 18 (69.2%) | 8 (30.8%) |
| 2-Person Household | 13 (59.1%) | 9 (40.9%) |
| 3-Person Household | 4 (100.0%) | 0 (0.0%) |
| 4+ Person Household | 10 (52.6%) | 9 (47.4%) |
| Total Housing Units | 45 (63.4%) | 26 (36.6%) |
Occupancy by Educational Attainment in Arcola
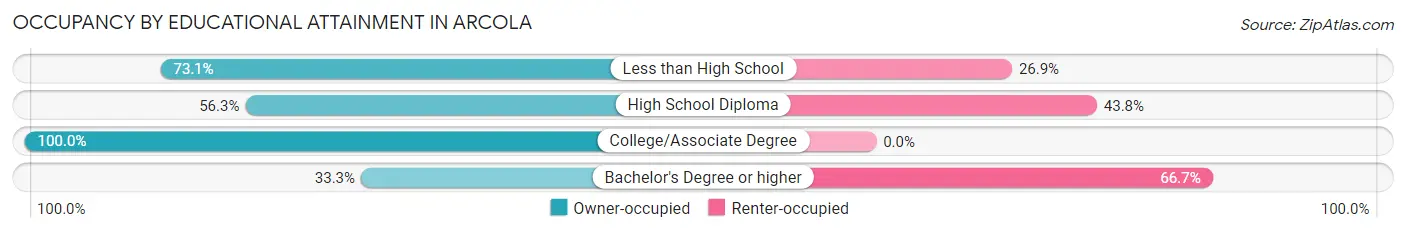
| Household Size | Owner-occupied | Renter-occupied |
| Less than High School | 19 (73.1%) | 7 (26.9%) |
| High School Diploma | 9 (56.2%) | 7 (43.8%) |
| College/Associate Degree | 11 (100.0%) | 0 (0.0%) |
| Bachelor's Degree or higher | 6 (33.3%) | 12 (66.7%) |
Occupancy by Age of Householder in Arcola
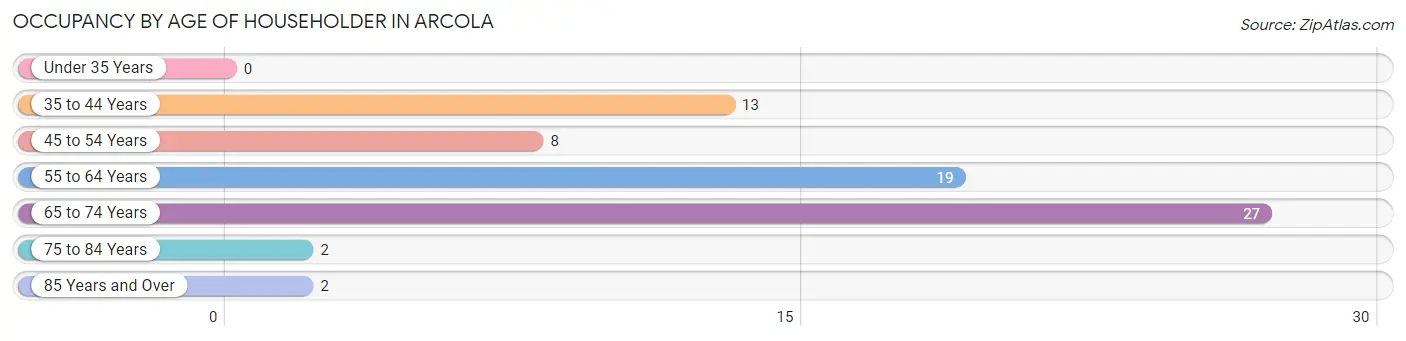
| Age Bracket | # Households | % Households |
| Under 35 Years | 0 | 0.0% |
| 35 to 44 Years | 13 | 18.3% |
| 45 to 54 Years | 8 | 11.3% |
| 55 to 64 Years | 19 | 26.8% |
| 65 to 74 Years | 27 | 38.0% |
| 75 to 84 Years | 2 | 2.8% |
| 85 Years and Over | 2 | 2.8% |
| Total | 71 | 100.0% |
Housing Finances in Arcola
Median Income by Occupancy in Arcola
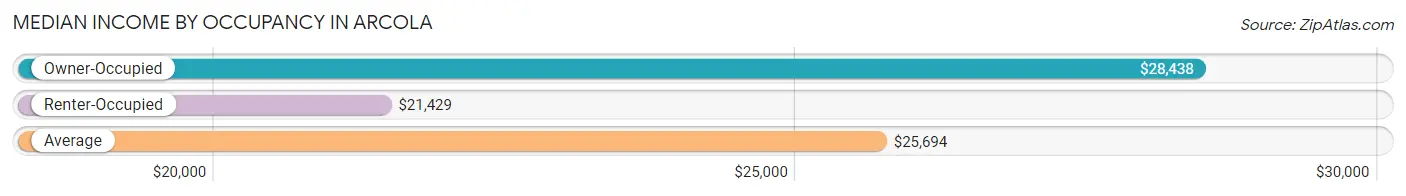
| Occupancy Type | # Households | Median Income |
| Owner-Occupied | 45 (63.4%) | $28,438 |
| Renter-Occupied | 26 (36.6%) | $21,429 |
| Average | 71 (100.0%) | $25,694 |
Occupancy by Householder Income Bracket in Arcola
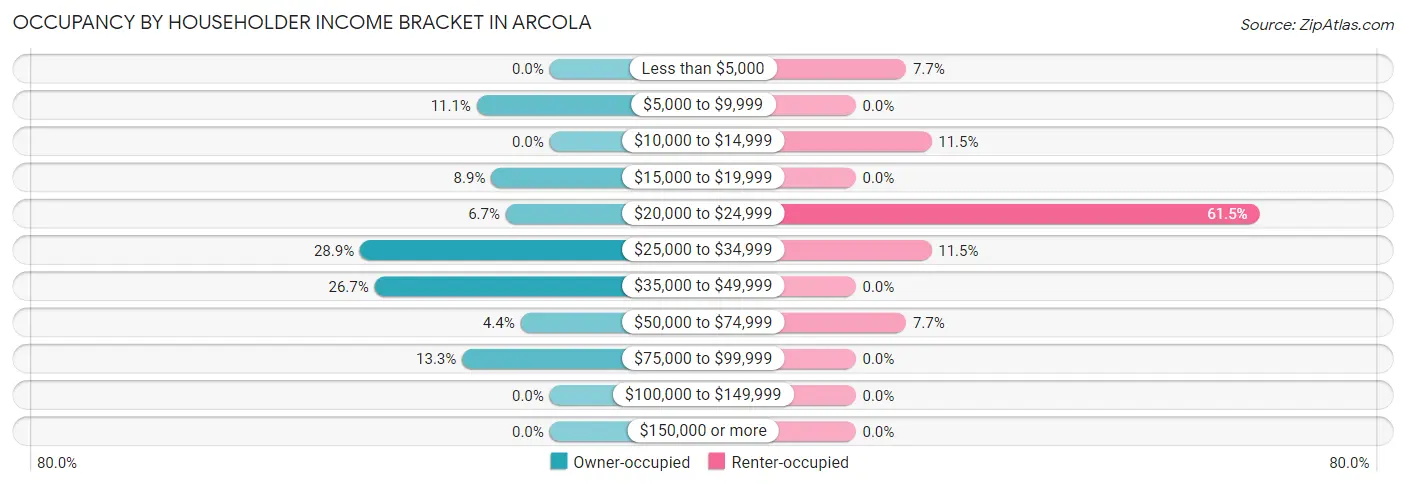
| Income Bracket | Owner-occupied | Renter-occupied |
| Less than $5,000 | 0 (0.0%) | 2 (7.7%) |
| $5,000 to $9,999 | 5 (11.1%) | 0 (0.0%) |
| $10,000 to $14,999 | 0 (0.0%) | 3 (11.5%) |
| $15,000 to $19,999 | 4 (8.9%) | 0 (0.0%) |
| $20,000 to $24,999 | 3 (6.7%) | 16 (61.5%) |
| $25,000 to $34,999 | 13 (28.9%) | 3 (11.5%) |
| $35,000 to $49,999 | 12 (26.7%) | 0 (0.0%) |
| $50,000 to $74,999 | 2 (4.4%) | 2 (7.7%) |
| $75,000 to $99,999 | 6 (13.3%) | 0 (0.0%) |
| $100,000 to $149,999 | 0 (0.0%) | 0 (0.0%) |
| $150,000 or more | 0 (0.0%) | 0 (0.0%) |
| Total | 45 (100.0%) | 26 (100.0%) |
Monthly Housing Cost Tiers in Arcola
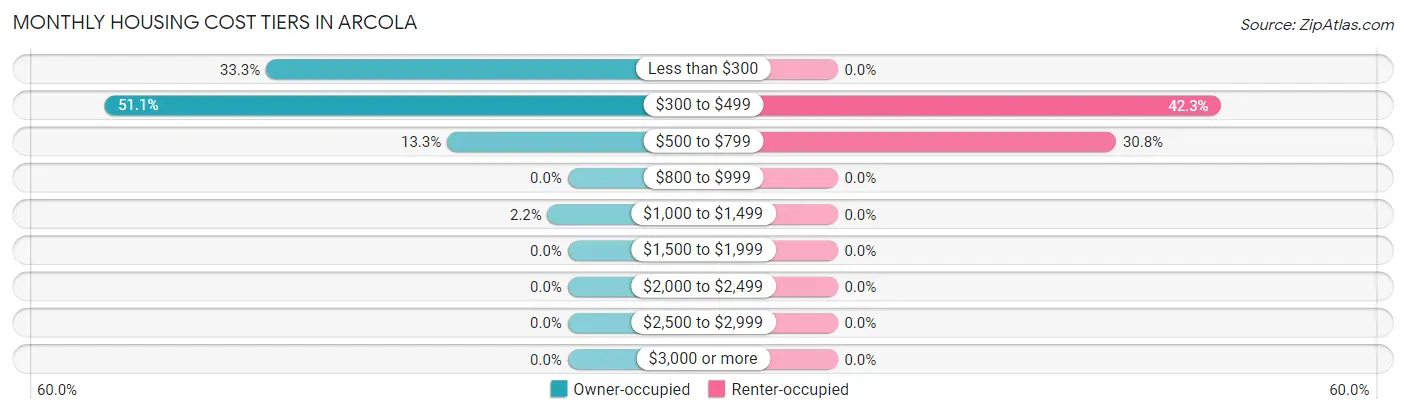
| Monthly Cost | Owner-occupied | Renter-occupied |
| Less than $300 | 15 (33.3%) | 0 (0.0%) |
| $300 to $499 | 23 (51.1%) | 11 (42.3%) |
| $500 to $799 | 6 (13.3%) | 8 (30.8%) |
| $800 to $999 | 0 (0.0%) | 0 (0.0%) |
| $1,000 to $1,499 | 1 (2.2%) | 0 (0.0%) |
| $1,500 to $1,999 | 0 (0.0%) | 0 (0.0%) |
| $2,000 to $2,499 | 0 (0.0%) | 0 (0.0%) |
| $2,500 to $2,999 | 0 (0.0%) | 0 (0.0%) |
| $3,000 or more | 0 (0.0%) | 0 (0.0%) |
| Total | 45 (100.0%) | 26 (100.0%) |
Physical Housing Characteristics in Arcola
Housing Structures in Arcola
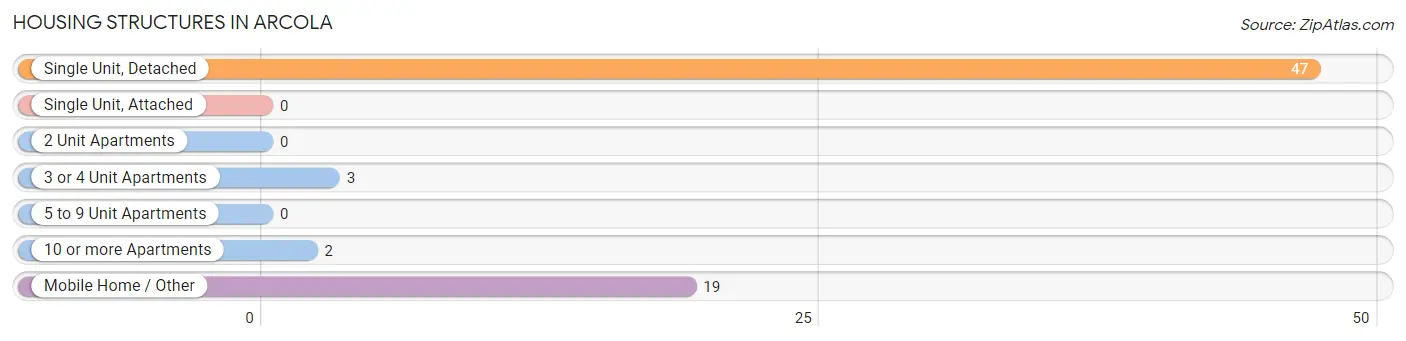
| Structure Type | # Housing Units | % Housing Units |
| Single Unit, Detached | 47 | 66.2% |
| Single Unit, Attached | 0 | 0.0% |
| 2 Unit Apartments | 0 | 0.0% |
| 3 or 4 Unit Apartments | 3 | 4.2% |
| 5 to 9 Unit Apartments | 0 | 0.0% |
| 10 or more Apartments | 2 | 2.8% |
| Mobile Home / Other | 19 | 26.8% |
| Total | 71 | 100.0% |
Housing Structures by Occupancy in Arcola
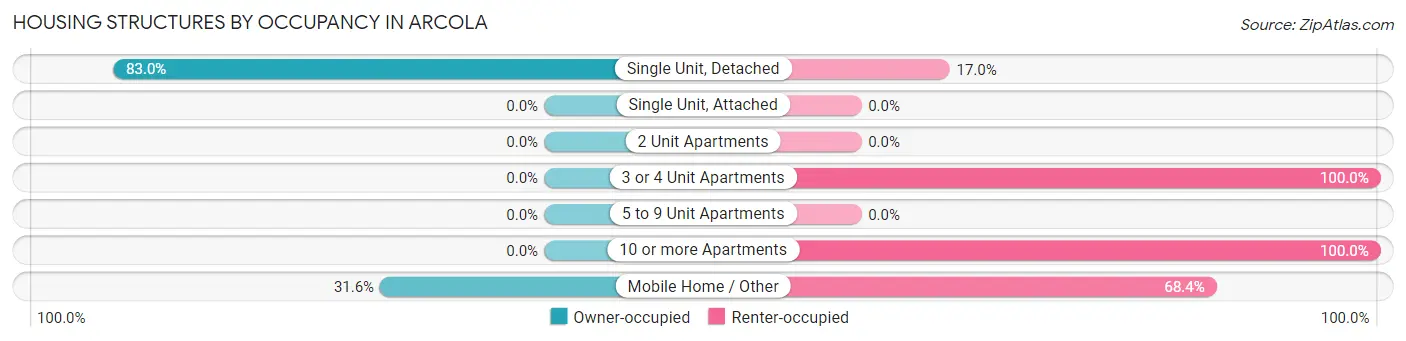
| Structure Type | Owner-occupied | Renter-occupied |
| Single Unit, Detached | 39 (83.0%) | 8 (17.0%) |
| Single Unit, Attached | 0 (0.0%) | 0 (0.0%) |
| 2 Unit Apartments | 0 (0.0%) | 0 (0.0%) |
| 3 or 4 Unit Apartments | 0 (0.0%) | 3 (100.0%) |
| 5 to 9 Unit Apartments | 0 (0.0%) | 0 (0.0%) |
| 10 or more Apartments | 0 (0.0%) | 2 (100.0%) |
| Mobile Home / Other | 6 (31.6%) | 13 (68.4%) |
| Total | 45 (63.4%) | 26 (36.6%) |
Housing Structures by Number of Rooms in Arcola
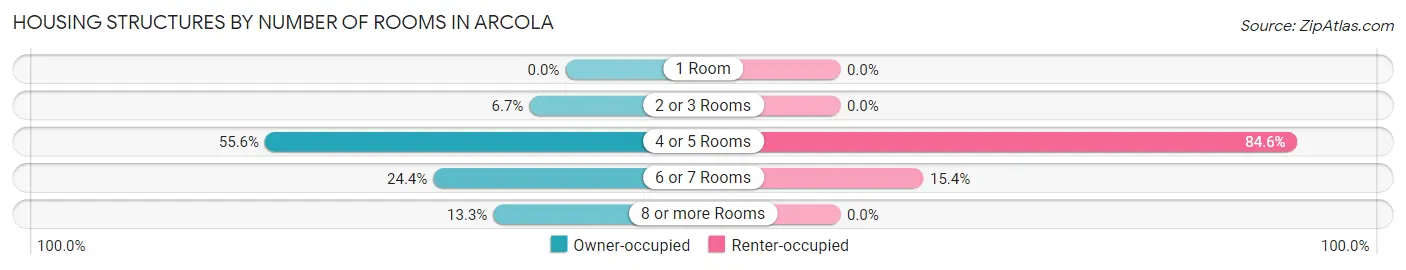
| Number of Rooms | Owner-occupied | Renter-occupied |
| 1 Room | 0 (0.0%) | 0 (0.0%) |
| 2 or 3 Rooms | 3 (6.7%) | 0 (0.0%) |
| 4 or 5 Rooms | 25 (55.6%) | 22 (84.6%) |
| 6 or 7 Rooms | 11 (24.4%) | 4 (15.4%) |
| 8 or more Rooms | 6 (13.3%) | 0 (0.0%) |
| Total | 45 (100.0%) | 26 (100.0%) |
Housing Structure by Heating Type in Arcola
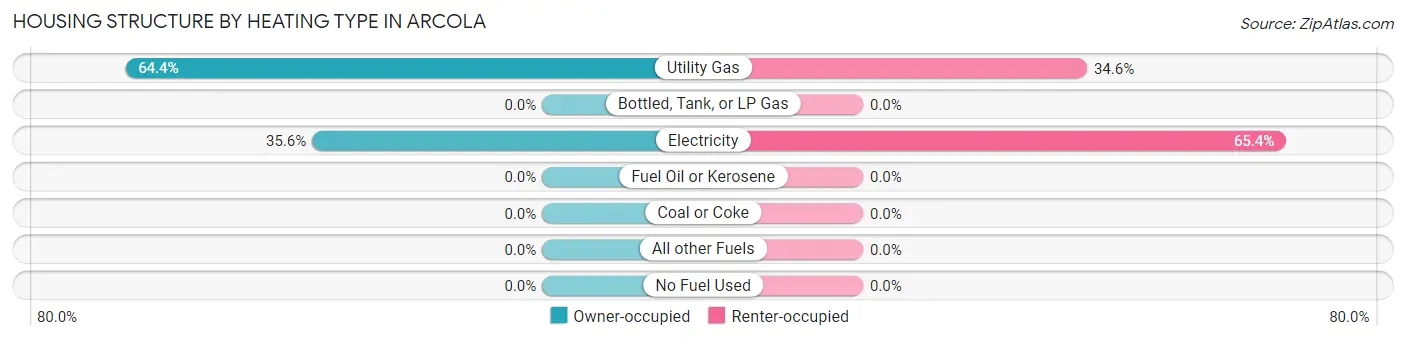
| Heating Type | Owner-occupied | Renter-occupied |
| Utility Gas | 29 (64.4%) | 9 (34.6%) |
| Bottled, Tank, or LP Gas | 0 (0.0%) | 0 (0.0%) |
| Electricity | 16 (35.6%) | 17 (65.4%) |
| Fuel Oil or Kerosene | 0 (0.0%) | 0 (0.0%) |
| Coal or Coke | 0 (0.0%) | 0 (0.0%) |
| All other Fuels | 0 (0.0%) | 0 (0.0%) |
| No Fuel Used | 0 (0.0%) | 0 (0.0%) |
| Total | 45 (100.0%) | 26 (100.0%) |
Household Vehicle Usage in Arcola
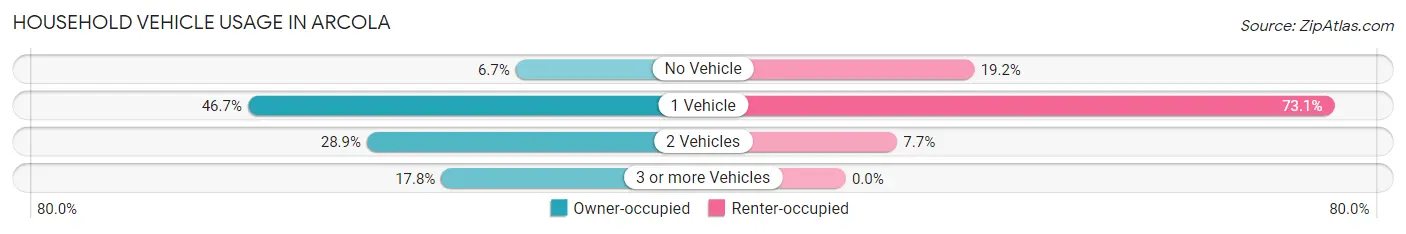
| Vehicles per Household | Owner-occupied | Renter-occupied |
| No Vehicle | 3 (6.7%) | 5 (19.2%) |
| 1 Vehicle | 21 (46.7%) | 19 (73.1%) |
| 2 Vehicles | 13 (28.9%) | 2 (7.7%) |
| 3 or more Vehicles | 8 (17.8%) | 0 (0.0%) |
| Total | 45 (100.0%) | 26 (100.0%) |
Real Estate & Mortgages in Arcola
Real Estate and Mortgage Overview in Arcola
| Characteristic | Without Mortgage | With Mortgage |
| Housing Units | 44 | 1 |
| Median Property Value | $54,000 | $0 |
| Median Household Income | $28,125 | $0 |
| Monthly Housing Costs | $339 | $0 |
| Real Estate Taxes | $199 | $0 |
Property Value by Mortgage Status in Arcola
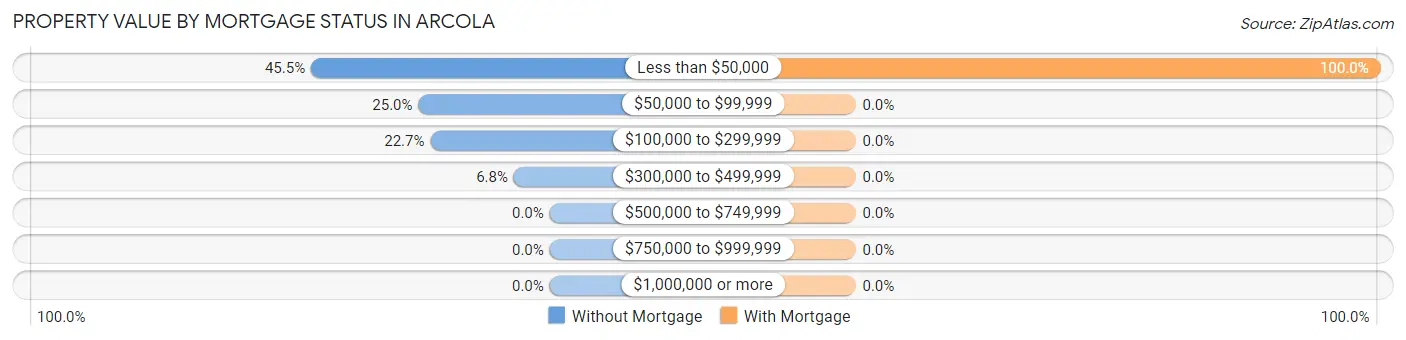
| Property Value | Without Mortgage | With Mortgage |
| Less than $50,000 | 20 (45.5%) | 1 (100.0%) |
| $50,000 to $99,999 | 11 (25.0%) | 0 (0.0%) |
| $100,000 to $299,999 | 10 (22.7%) | 0 (0.0%) |
| $300,000 to $499,999 | 3 (6.8%) | 0 (0.0%) |
| $500,000 to $749,999 | 0 (0.0%) | 0 (0.0%) |
| $750,000 to $999,999 | 0 (0.0%) | 0 (0.0%) |
| $1,000,000 or more | 0 (0.0%) | 0 (0.0%) |
| Total | 44 (100.0%) | 1 (100.0%) |
Household Income by Mortgage Status in Arcola
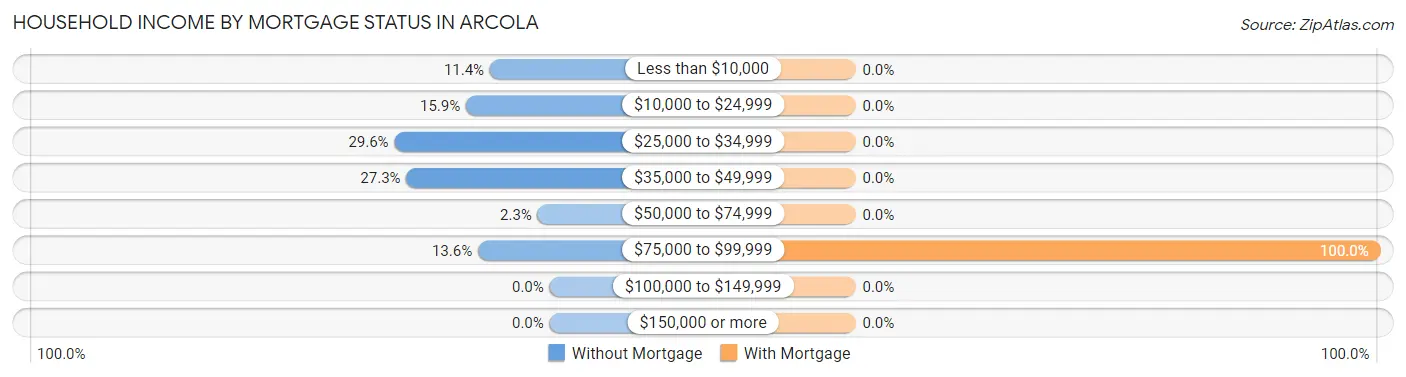
| Household Income | Without Mortgage | With Mortgage |
| Less than $10,000 | 5 (11.4%) | 0 (0.0%) |
| $10,000 to $24,999 | 7 (15.9%) | 0 (0.0%) |
| $25,000 to $34,999 | 13 (29.5%) | 0 (0.0%) |
| $35,000 to $49,999 | 12 (27.3%) | 0 (0.0%) |
| $50,000 to $74,999 | 1 (2.3%) | 0 (0.0%) |
| $75,000 to $99,999 | 6 (13.6%) | 1 (100.0%) |
| $100,000 to $149,999 | 0 (0.0%) | 0 (0.0%) |
| $150,000 or more | 0 (0.0%) | 0 (0.0%) |
| Total | 44 (100.0%) | 1 (100.0%) |
Property Value to Household Income Ratio in Arcola
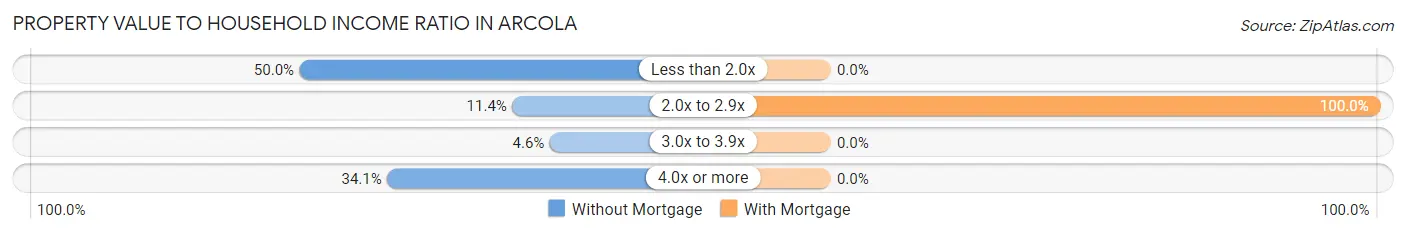
| Value-to-Income Ratio | Without Mortgage | With Mortgage |
| Less than 2.0x | 22 (50.0%) | 0 (0.0%) |
| 2.0x to 2.9x | 5 (11.4%) | 1 (100.0%) |
| 3.0x to 3.9x | 2 (4.5%) | 0 (0.0%) |
| 4.0x or more | 15 (34.1%) | 0 (0.0%) |
| Total | 44 (100.0%) | 1 (100.0%) |
Real Estate Taxes by Mortgage Status in Arcola
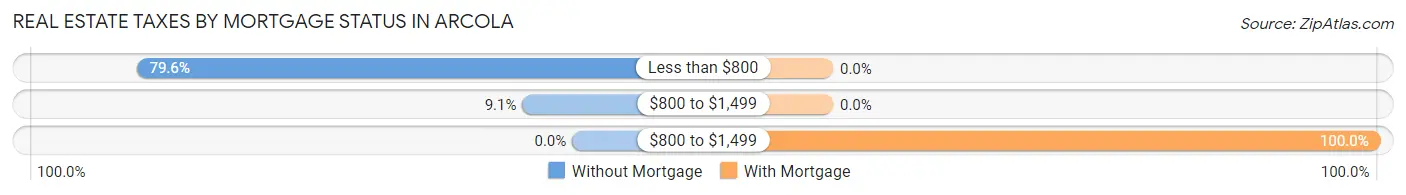
| Property Taxes | Without Mortgage | With Mortgage |
| Less than $800 | 35 (79.5%) | 0 (0.0%) |
| $800 to $1,499 | 4 (9.1%) | 0 (0.0%) |
| $800 to $1,499 | 0 (0.0%) | 1 (100.0%) |
| Total | 44 (100.0%) | 1 (100.0%) |
Health & Disability in Arcola
Health Insurance Coverage by Age in Arcola
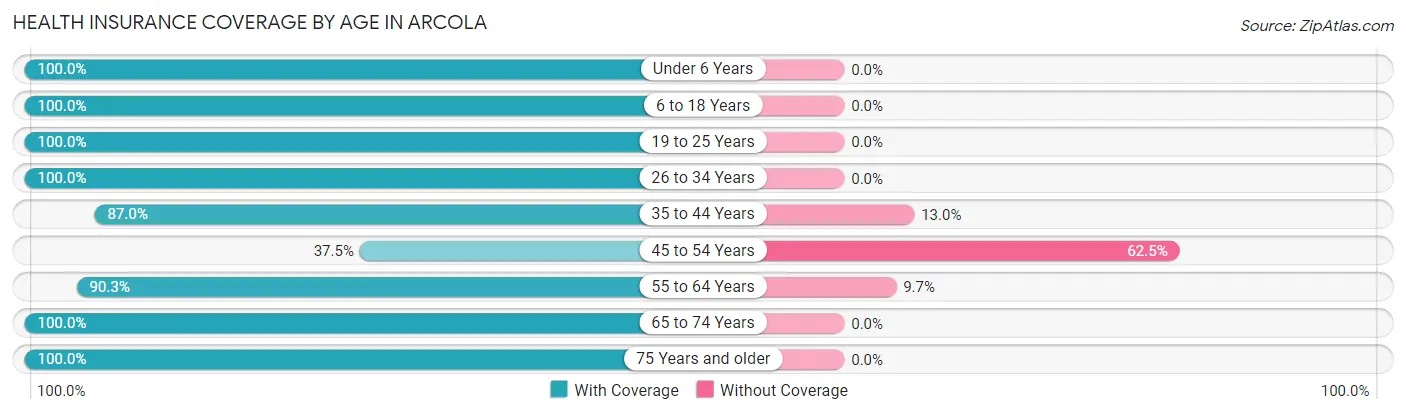
| Age Bracket | With Coverage | Without Coverage |
| Under 6 Years | 29 (100.0%) | 0 (0.0%) |
| 6 to 18 Years | 44 (100.0%) | 0 (0.0%) |
| 19 to 25 Years | 8 (100.0%) | 0 (0.0%) |
| 26 to 34 Years | 10 (100.0%) | 0 (0.0%) |
| 35 to 44 Years | 20 (87.0%) | 3 (13.0%) |
| 45 to 54 Years | 6 (37.5%) | 10 (62.5%) |
| 55 to 64 Years | 28 (90.3%) | 3 (9.7%) |
| 65 to 74 Years | 34 (100.0%) | 0 (0.0%) |
| 75 Years and older | 13 (100.0%) | 0 (0.0%) |
| Total | 192 (92.3%) | 16 (7.7%) |
Health Insurance Coverage by Citizenship Status in Arcola
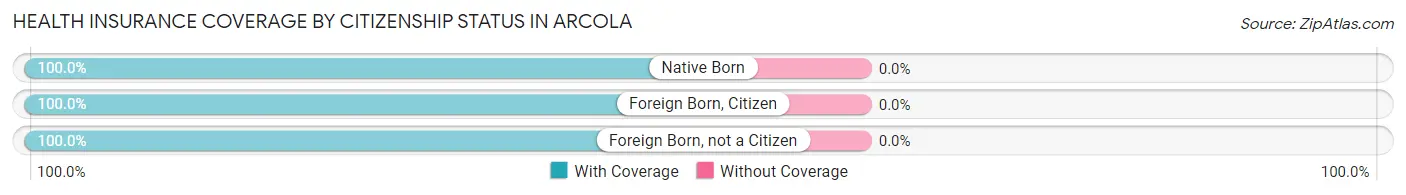
| Citizenship Status | With Coverage | Without Coverage |
| Native Born | 29 (100.0%) | 0 (0.0%) |
| Foreign Born, Citizen | 44 (100.0%) | 0 (0.0%) |
| Foreign Born, not a Citizen | 8 (100.0%) | 0 (0.0%) |
Health Insurance Coverage by Household Income in Arcola
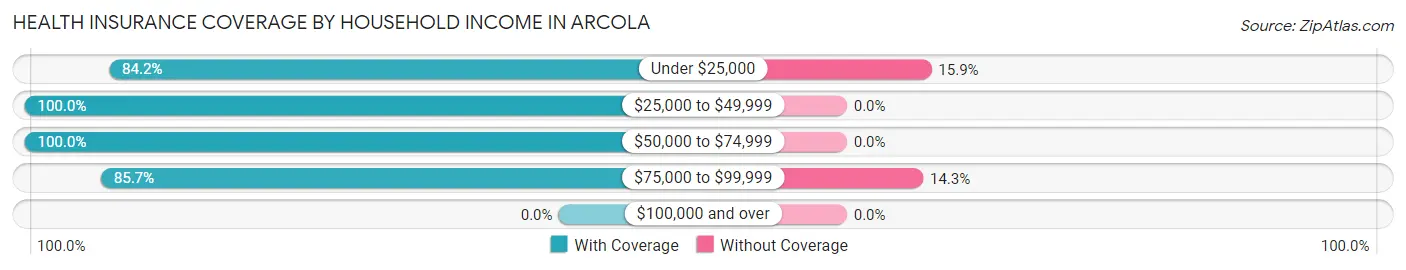
| Household Income | With Coverage | Without Coverage |
| Under $25,000 | 69 (84.2%) | 13 (15.9%) |
| $25,000 to $49,999 | 89 (100.0%) | 0 (0.0%) |
| $50,000 to $74,999 | 14 (100.0%) | 0 (0.0%) |
| $75,000 to $99,999 | 18 (85.7%) | 3 (14.3%) |
| $100,000 and over | 0 (0.0%) | 0 (0.0%) |
Public vs Private Health Insurance Coverage by Age in Arcola
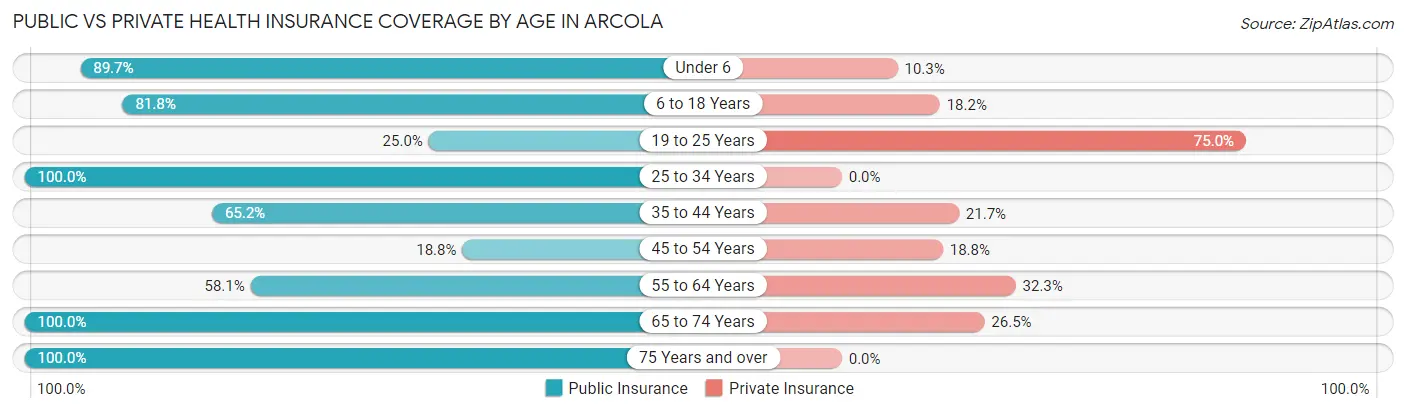
| Age Bracket | Public Insurance | Private Insurance |
| Under 6 | 26 (89.7%) | 3 (10.3%) |
| 6 to 18 Years | 36 (81.8%) | 8 (18.2%) |
| 19 to 25 Years | 2 (25.0%) | 6 (75.0%) |
| 25 to 34 Years | 10 (100.0%) | 0 (0.0%) |
| 35 to 44 Years | 15 (65.2%) | 5 (21.7%) |
| 45 to 54 Years | 3 (18.8%) | 3 (18.8%) |
| 55 to 64 Years | 18 (58.1%) | 10 (32.3%) |
| 65 to 74 Years | 34 (100.0%) | 9 (26.5%) |
| 75 Years and over | 13 (100.0%) | 0 (0.0%) |
| Total | 157 (75.5%) | 44 (21.1%) |
Disability Status by Sex by Age in Arcola
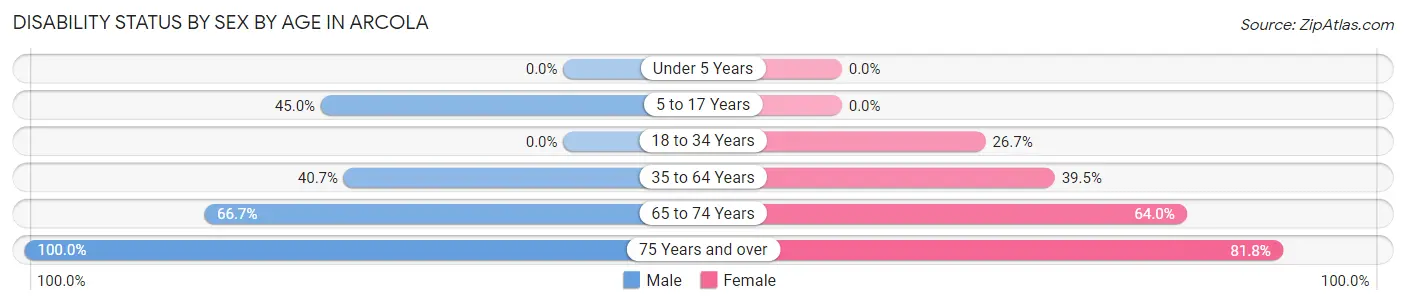
| Age Bracket | Male | Female |
| Under 5 Years | 0 (0.0%) | 0 (0.0%) |
| 5 to 17 Years | 9 (45.0%) | 0 (0.0%) |
| 18 to 34 Years | 0 (0.0%) | 4 (26.7%) |
| 35 to 64 Years | 11 (40.7%) | 17 (39.5%) |
| 65 to 74 Years | 6 (66.7%) | 16 (64.0%) |
| 75 Years and over | 2 (100.0%) | 9 (81.8%) |
Disability Class by Sex by Age in Arcola
Disability Class: Hearing Difficulty
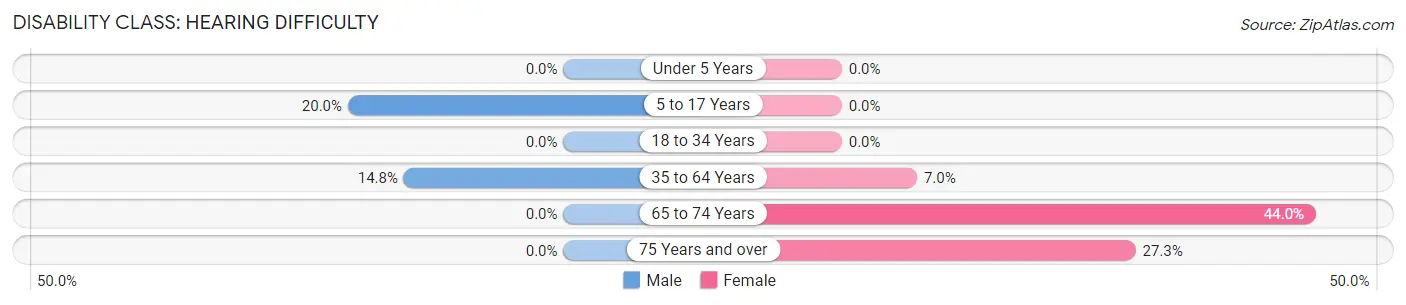
| Age Bracket | Male | Female |
| Under 5 Years | 0 (0.0%) | 0 (0.0%) |
| 5 to 17 Years | 4 (20.0%) | 0 (0.0%) |
| 18 to 34 Years | 0 (0.0%) | 0 (0.0%) |
| 35 to 64 Years | 4 (14.8%) | 3 (7.0%) |
| 65 to 74 Years | 0 (0.0%) | 11 (44.0%) |
| 75 Years and over | 0 (0.0%) | 3 (27.3%) |
Disability Class: Vision Difficulty
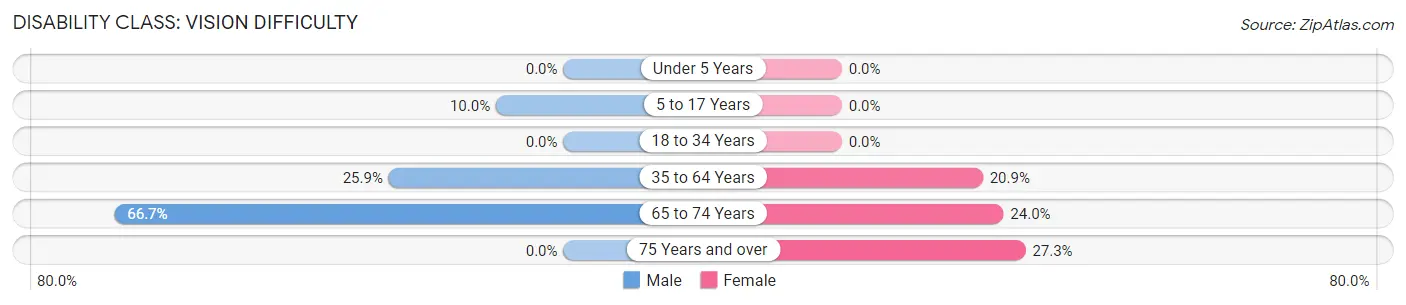
| Age Bracket | Male | Female |
| Under 5 Years | 0 (0.0%) | 0 (0.0%) |
| 5 to 17 Years | 2 (10.0%) | 0 (0.0%) |
| 18 to 34 Years | 0 (0.0%) | 0 (0.0%) |
| 35 to 64 Years | 7 (25.9%) | 9 (20.9%) |
| 65 to 74 Years | 6 (66.7%) | 6 (24.0%) |
| 75 Years and over | 0 (0.0%) | 3 (27.3%) |
Disability Class: Cognitive Difficulty
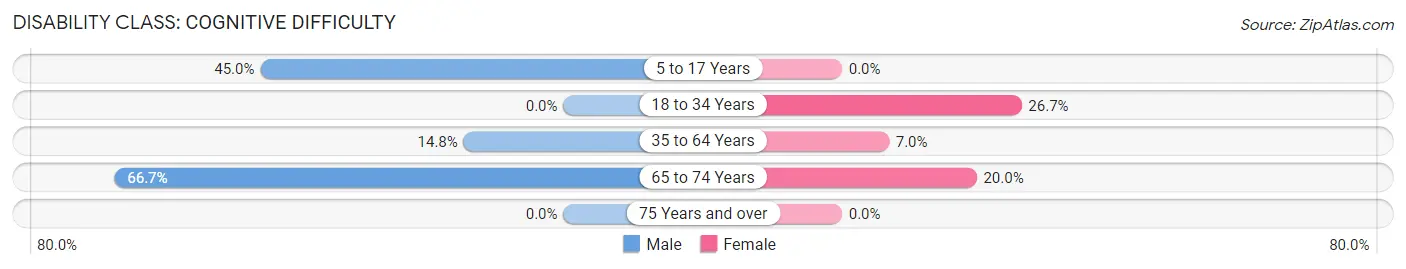
| Age Bracket | Male | Female |
| 5 to 17 Years | 9 (45.0%) | 0 (0.0%) |
| 18 to 34 Years | 0 (0.0%) | 4 (26.7%) |
| 35 to 64 Years | 4 (14.8%) | 3 (7.0%) |
| 65 to 74 Years | 6 (66.7%) | 5 (20.0%) |
| 75 Years and over | 0 (0.0%) | 0 (0.0%) |
Disability Class: Ambulatory Difficulty
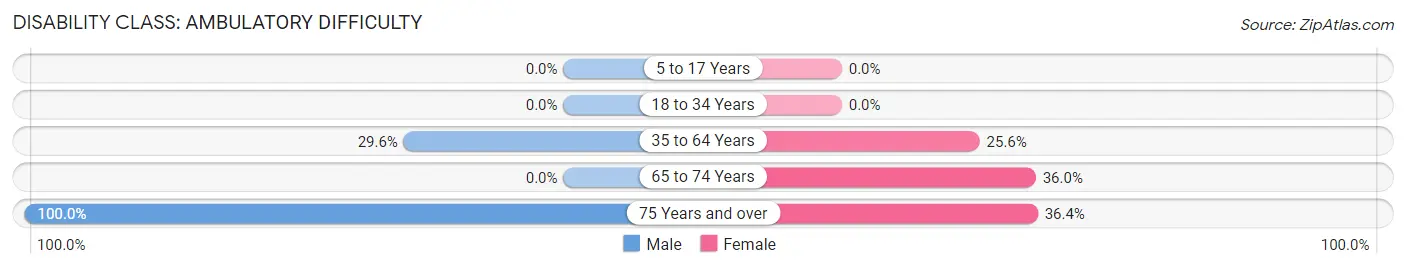
| Age Bracket | Male | Female |
| 5 to 17 Years | 0 (0.0%) | 0 (0.0%) |
| 18 to 34 Years | 0 (0.0%) | 0 (0.0%) |
| 35 to 64 Years | 8 (29.6%) | 11 (25.6%) |
| 65 to 74 Years | 0 (0.0%) | 9 (36.0%) |
| 75 Years and over | 2 (100.0%) | 4 (36.4%) |
Disability Class: Self-Care Difficulty
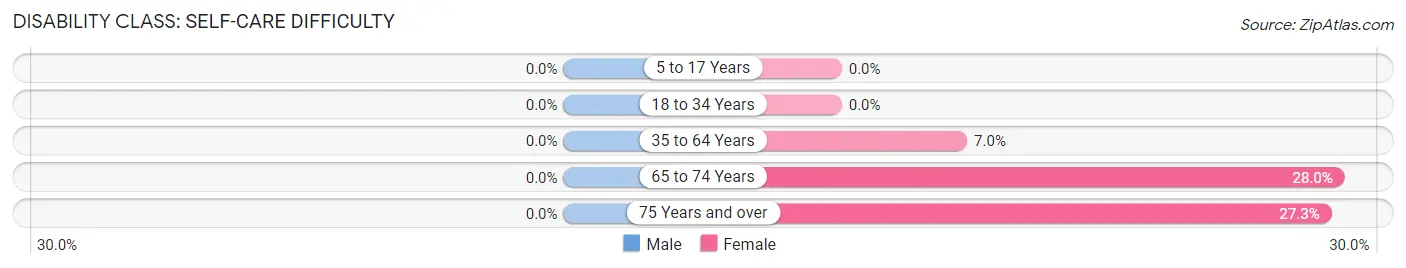
| Age Bracket | Male | Female |
| 5 to 17 Years | 0 (0.0%) | 0 (0.0%) |
| 18 to 34 Years | 0 (0.0%) | 0 (0.0%) |
| 35 to 64 Years | 0 (0.0%) | 3 (7.0%) |
| 65 to 74 Years | 0 (0.0%) | 7 (28.0%) |
| 75 Years and over | 0 (0.0%) | 3 (27.3%) |
Technology Access in Arcola
Computing Device Access in Arcola
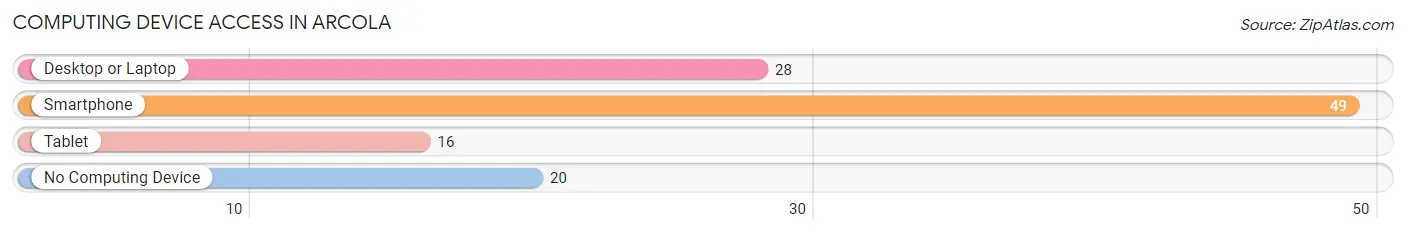
| Device Type | # Households | % Households |
| Desktop or Laptop | 28 | 39.4% |
| Smartphone | 49 | 69.0% |
| Tablet | 16 | 22.5% |
| No Computing Device | 20 | 28.2% |
| Total | 71 | 100.0% |
Internet Access in Arcola
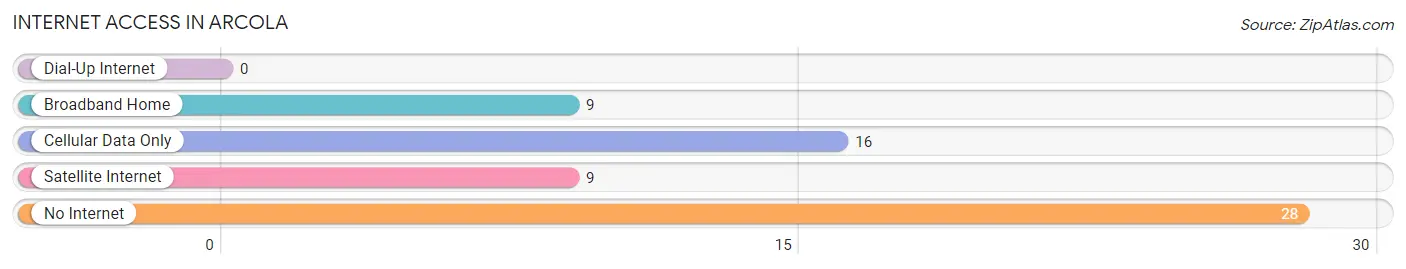
| Internet Type | # Households | % Households |
| Dial-Up Internet | 0 | 0.0% |
| Broadband Home | 9 | 12.7% |
| Cellular Data Only | 16 | 22.5% |
| Satellite Internet | 9 | 12.7% |
| No Internet | 28 | 39.4% |
| Total | 71 | 100.0% |
Arcola Summary
Arcola, Mississippi is a small town located in the southeastern corner of the state, in Jones County. It is situated on the banks of the Leaf River, and is part of the Hattiesburg, Mississippi Metropolitan Statistical Area. The town has a population of approximately 1,000 people, and is known for its rural charm and friendly atmosphere.
History
Arcola was founded in 1883 by the Reverend J.W. Arcola, a Methodist minister from Georgia. He purchased the land from the Choctaw Indians and established a small church and school. The town was originally called Arcola Station, and was a stop on the Gulf and Ship Island Railroad. The town was officially incorporated in 1891, and the name was changed to Arcola.
In the early 1900s, Arcola was a thriving agricultural community, with cotton, corn, and soybeans being the main crops. The town also had a sawmill, a grist mill, and a cotton gin. In the 1920s, the town began to decline as the railroad stopped running and the economy shifted away from agriculture.
Geography
Arcola is located in the southeastern corner of Jones County, Mississippi. It is situated on the banks of the Leaf River, and is part of the Hattiesburg, Mississippi Metropolitan Statistical Area. The town is located approximately 25 miles south of Hattiesburg, and is accessible via US Highway 11.
The town is located in a rural area, and is surrounded by rolling hills and forests. The climate is humid subtropical, with hot, humid summers and mild winters. The average annual temperature is around 70 degrees Fahrenheit.
Economy
Arcola’s economy is largely based on agriculture. The town is home to several farms, which produce cotton, corn, soybeans, and other crops. The town also has a sawmill, a grist mill, and a cotton gin.
In recent years, the town has seen an increase in tourism, as visitors come to explore the town’s rural charm and friendly atmosphere. The town is also home to several small businesses, including restaurants, shops, and a gas station.
Demographics
As of the 2010 census, Arcola had a population of 1,000 people. The racial makeup of the town was 97.2% White, 0.7% African American, 0.2% Native American, 0.2% Asian, and 1.7% from other races. The median household income was $30,000, and the median age was 38.
Arcola is a small, rural town with a friendly atmosphere and a strong sense of community. The town is home to a diverse population, and is a great place to live and work.
Common Questions
What is Per Capita Income in Arcola?
Per Capita income in Arcola is $11,080.
What is the Median Family Income in Arcola?
Median Family Income in Arcola is $23,750.
What is the Median Household income in Arcola?
Median Household Income in Arcola is $25,694.
What is Inequality or Gini Index in Arcola?
Inequality or Gini Index in Arcola is 0.33.
What is the Total Population of Arcola?
Total Population of Arcola is 208.
What is the Total Male Population of Arcola?
Total Male Population of Arcola is 81.
What is the Total Female Population of Arcola?
Total Female Population of Arcola is 127.
What is the Ratio of Males per 100 Females in Arcola?
There are 63.78 Males per 100 Females in Arcola.
What is the Ratio of Females per 100 Males in Arcola?
There are 156.79 Females per 100 Males in Arcola.
What is the Median Population Age in Arcola?
Median Population Age in Arcola is 37.8 Years.
What is the Average Family Size in Arcola
Average Family Size in Arcola is 4.2 People.
What is the Average Household Size in Arcola
Average Household Size in Arcola is 2.9 People.
How Large is the Labor Force in Arcola?
There are 50 People in the Labor Forcein in Arcola.
What is the Percentage of People in the Labor Force in Arcola?
37.0% of People are in the Labor Force in Arcola.
What is the Unemployment Rate in Arcola?
Unemployment Rate in Arcola is 18.0%.