Glendale, MS Map & Demographics
Glendale Map
Glendale Overview
$38,415
PER CAPITA INCOME
$61,083
AVG FAMILY INCOME
$53,091
AVG HOUSEHOLD INCOME
27.2%
WAGE / INCOME GAP [ % ]
72.8¢/ $1
WAGE / INCOME GAP [ $ ]
0.59
INEQUALITY / GINI INDEX
1,514
TOTAL POPULATION
720
MALE POPULATION
794
FEMALE POPULATION
90.68
MALES / 100 FEMALES
110.28
FEMALES / 100 MALES
48.8
MEDIAN AGE
2.9
AVG FAMILY SIZE
2.3
AVG HOUSEHOLD SIZE
682
LABOR FORCE [ PEOPLE ]
55.7%
PERCENT IN LABOR FORCE
5.3%
UNEMPLOYMENT RATE
Income in Glendale
Income Overview in Glendale
Per Capita Income in Glendale is $38,415, while median incomes of families and households are $61,083 and $53,091 respectively.
| Characteristic | Number | Measure |
| Per Capita Income | 1,514 | $38,415 |
| Median Family Income | 417 | $61,083 |
| Mean Family Income | 417 | $61,079 |
| Median Household Income | 656 | $53,091 |
| Mean Household Income | 656 | $86,146 |
| Income Deficit | 417 | $0 |
| Wage / Income Gap (%) | 1,514 | 27.18% |
| Wage / Income Gap ($) | 1,514 | 72.82¢ per $1 |
| Gini / Inequality Index | 1,514 | 0.59 |
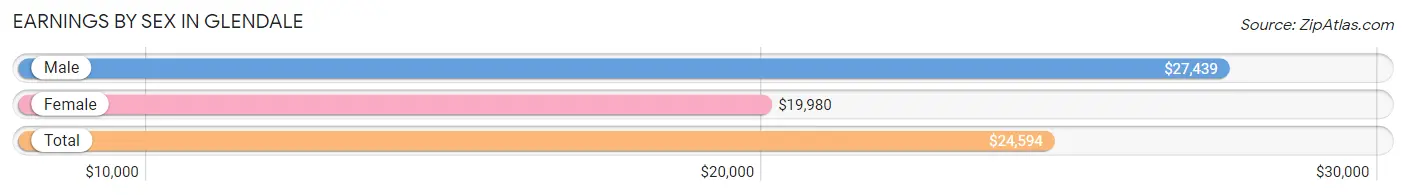
Earnings by Sex in Glendale
Average Earnings in Glendale are $24,594, $27,439 for men and $19,980 for women, a difference of 27.2%.
| Sex | Number | Average Earnings |
| Male | 404 (55.7%) | $27,439 |
| Female | 321 (44.3%) | $19,980 |
| Total | 725 (100.0%) | $24,594 |
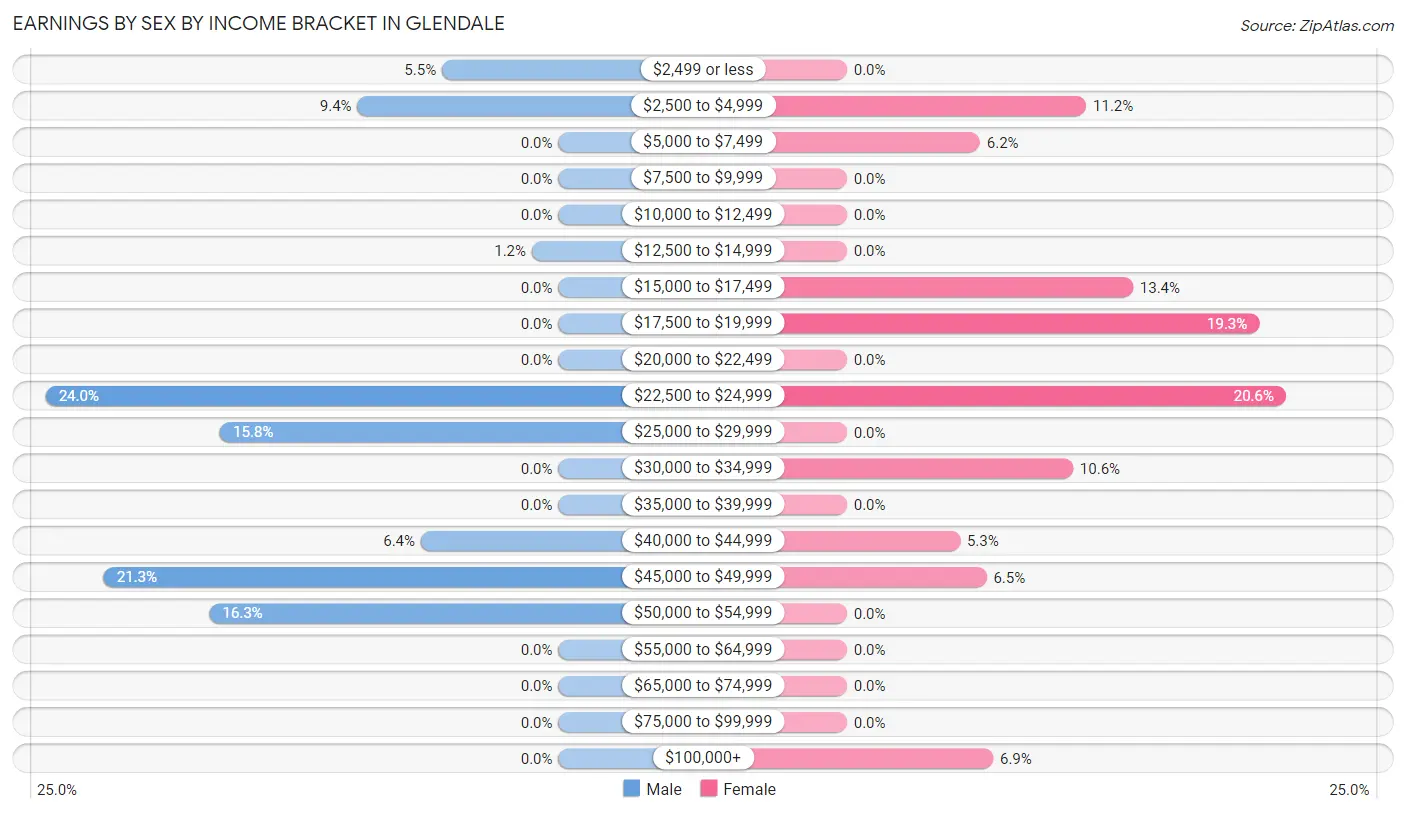
Earnings by Sex by Income Bracket in Glendale
The most common earnings brackets in Glendale are $22,500 to $24,999 for men (97 | 24.0%) and $22,500 to $24,999 for women (66 | 20.6%).
| Income | Male | Female |
| $2,499 or less | 22 (5.4%) | 0 (0.0%) |
| $2,500 to $4,999 | 38 (9.4%) | 36 (11.2%) |
| $5,000 to $7,499 | 0 (0.0%) | 20 (6.2%) |
| $7,500 to $9,999 | 0 (0.0%) | 0 (0.0%) |
| $10,000 to $12,499 | 0 (0.0%) | 0 (0.0%) |
| $12,500 to $14,999 | 5 (1.2%) | 0 (0.0%) |
| $15,000 to $17,499 | 0 (0.0%) | 43 (13.4%) |
| $17,500 to $19,999 | 0 (0.0%) | 62 (19.3%) |
| $20,000 to $22,499 | 0 (0.0%) | 0 (0.0%) |
| $22,500 to $24,999 | 97 (24.0%) | 66 (20.6%) |
| $25,000 to $29,999 | 64 (15.8%) | 0 (0.0%) |
| $30,000 to $34,999 | 0 (0.0%) | 34 (10.6%) |
| $35,000 to $39,999 | 0 (0.0%) | 0 (0.0%) |
| $40,000 to $44,999 | 26 (6.4%) | 17 (5.3%) |
| $45,000 to $49,999 | 86 (21.3%) | 21 (6.5%) |
| $50,000 to $54,999 | 66 (16.3%) | 0 (0.0%) |
| $55,000 to $64,999 | 0 (0.0%) | 0 (0.0%) |
| $65,000 to $74,999 | 0 (0.0%) | 0 (0.0%) |
| $75,000 to $99,999 | 0 (0.0%) | 0 (0.0%) |
| $100,000+ | 0 (0.0%) | 22 (6.9%) |
| Total | 404 (100.0%) | 321 (100.0%) |
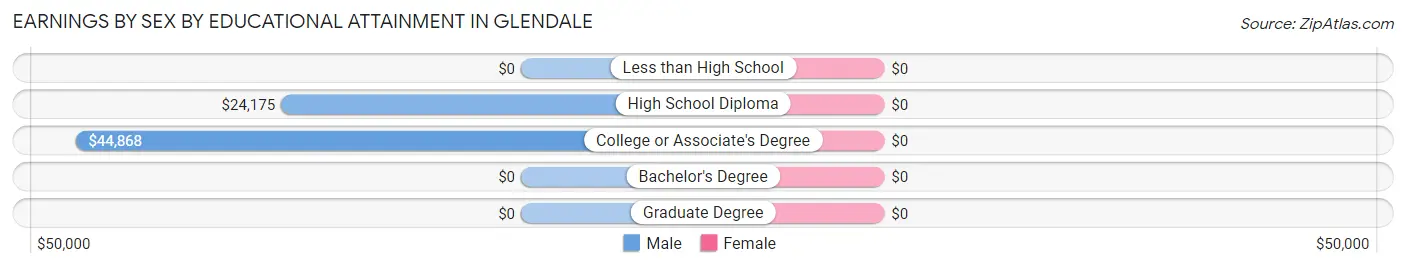
Earnings by Sex by Educational Attainment in Glendale
| Educational Attainment | Male Income | Female Income |
| Less than High School | - | - |
| High School Diploma | $24,175 | $0 |
| College or Associate's Degree | $44,868 | $0 |
| Bachelor's Degree | - | - |
| Graduate Degree | - | - |
| Total | - | - |
Family Income in Glendale
Family Income Brackets in Glendale
According to the Glendale family income data, there are 169 families falling into the $75,000 to $99,999 income range, which is the most common income bracket and makes up 40.5% of all families.
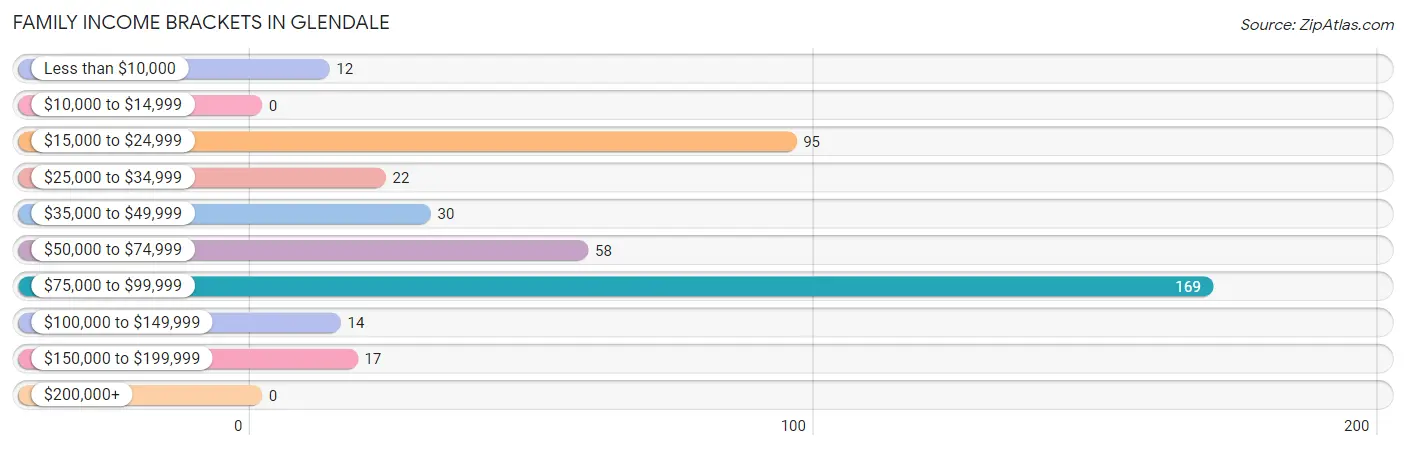
| Income Bracket | # Families | % Families |
| Less than $10,000 | 12 | 2.9% |
| $10,000 to $14,999 | 0 | 0.0% |
| $15,000 to $24,999 | 95 | 22.8% |
| $25,000 to $34,999 | 22 | 5.3% |
| $35,000 to $49,999 | 30 | 7.2% |
| $50,000 to $74,999 | 58 | 13.9% |
| $75,000 to $99,999 | 169 | 40.5% |
| $100,000 to $149,999 | 14 | 3.4% |
| $150,000 to $199,999 | 17 | 4.1% |
| $200,000+ | 0 | 0.0% |
Family Income by Famaliy Size in Glendale
2-person families (300 | 71.9%) account for the highest median family income in Glendale with $80,155 per family, while 2-person families (300 | 71.9%) have the highest median income of $40,078 per family member.
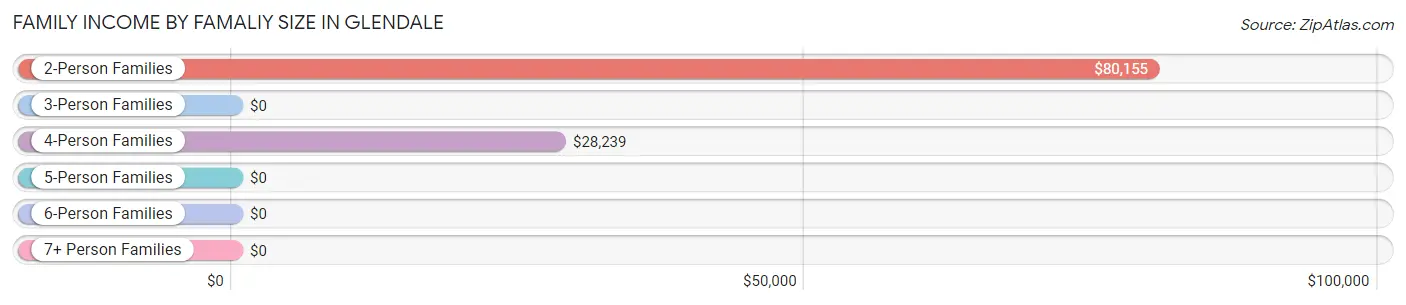
| Income Bracket | # Families | Median Income |
| 2-Person Families | 300 (71.9%) | $80,155 |
| 3-Person Families | 10 (2.4%) | $0 |
| 4-Person Families | 73 (17.5%) | $28,239 |
| 5-Person Families | 0 (0.0%) | $0 |
| 6-Person Families | 34 (8.2%) | $0 |
| 7+ Person Families | 0 (0.0%) | $0 |
| Total | 417 (100.0%) | $61,083 |
Family Income by Number of Earners in Glendale
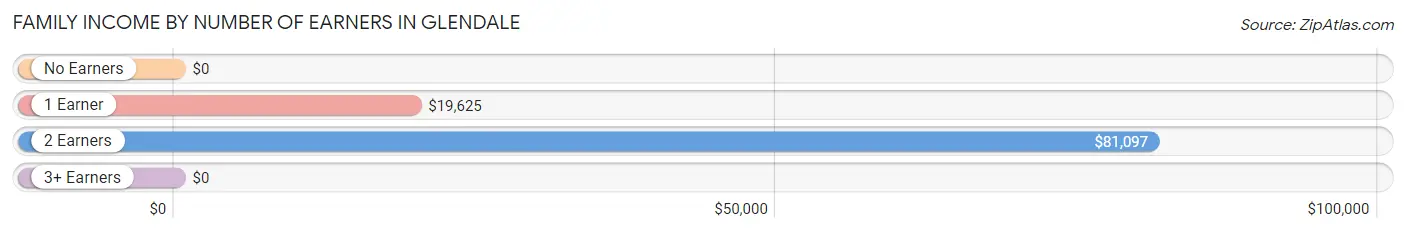
| Number of Earners | # Families | Median Income |
| No Earners | 88 (21.1%) | $0 |
| 1 Earner | 128 (30.7%) | $19,625 |
| 2 Earners | 201 (48.2%) | $81,097 |
| 3+ Earners | 0 (0.0%) | $0 |
| Total | 417 (100.0%) | $61,083 |
Household Income in Glendale
Household Income Brackets in Glendale
With 169 households falling in the category, the $75,000 to $99,999 income range is the most frequent in Glendale, accounting for 25.8% of all households. In contrast, only 14 households (2.1%) fall into the $100,000 to $149,999 income bracket, making it the least populous group.
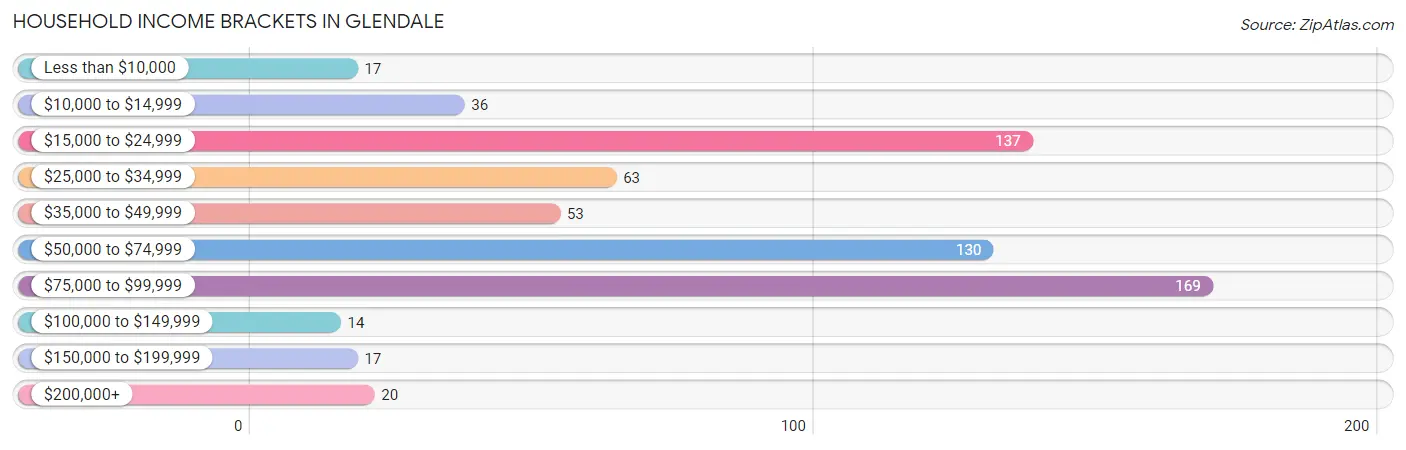
| Income Bracket | # Households | % Households |
| Less than $10,000 | 17 | 2.6% |
| $10,000 to $14,999 | 36 | 5.5% |
| $15,000 to $24,999 | 137 | 20.9% |
| $25,000 to $34,999 | 63 | 9.6% |
| $35,000 to $49,999 | 53 | 8.1% |
| $50,000 to $74,999 | 130 | 19.8% |
| $75,000 to $99,999 | 169 | 25.8% |
| $100,000 to $149,999 | 14 | 2.1% |
| $150,000 to $199,999 | 17 | 2.6% |
| $200,000+ | 20 | 3.0% |
Household Income by Householder Age in Glendale
The median household income in Glendale is $53,091, with the highest median household income of $52,716 found in the 45 to 64 years age bracket for the primary householder. A total of 397 households (60.5%) fall into this category. Meanwhile, the 15 to 24 years age bracket for the primary householder has the lowest median household income of $0, with 35 households (5.3%) in this group.
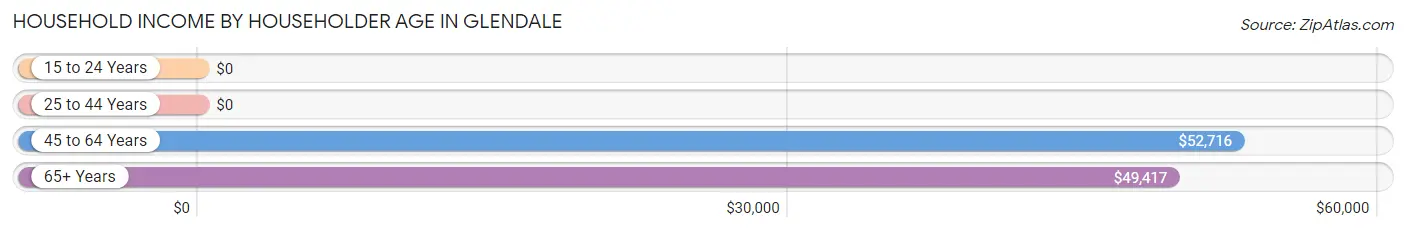
| Income Bracket | # Households | Median Income |
| 15 to 24 Years | 35 (5.3%) | $0 |
| 25 to 44 Years | 44 (6.7%) | $0 |
| 45 to 64 Years | 397 (60.5%) | $52,716 |
| 65+ Years | 180 (27.4%) | $49,417 |
| Total | 656 (100.0%) | $53,091 |
Poverty in Glendale
Income Below Poverty by Sex and Age in Glendale
With 13.6% poverty level for males and 46.0% for females among the residents of Glendale, under 5 year old males and 6 to 11 year old females are the most vulnerable to poverty, with 26 males (100.0%) and 14 females (100.0%) in their respective age groups living below the poverty level.
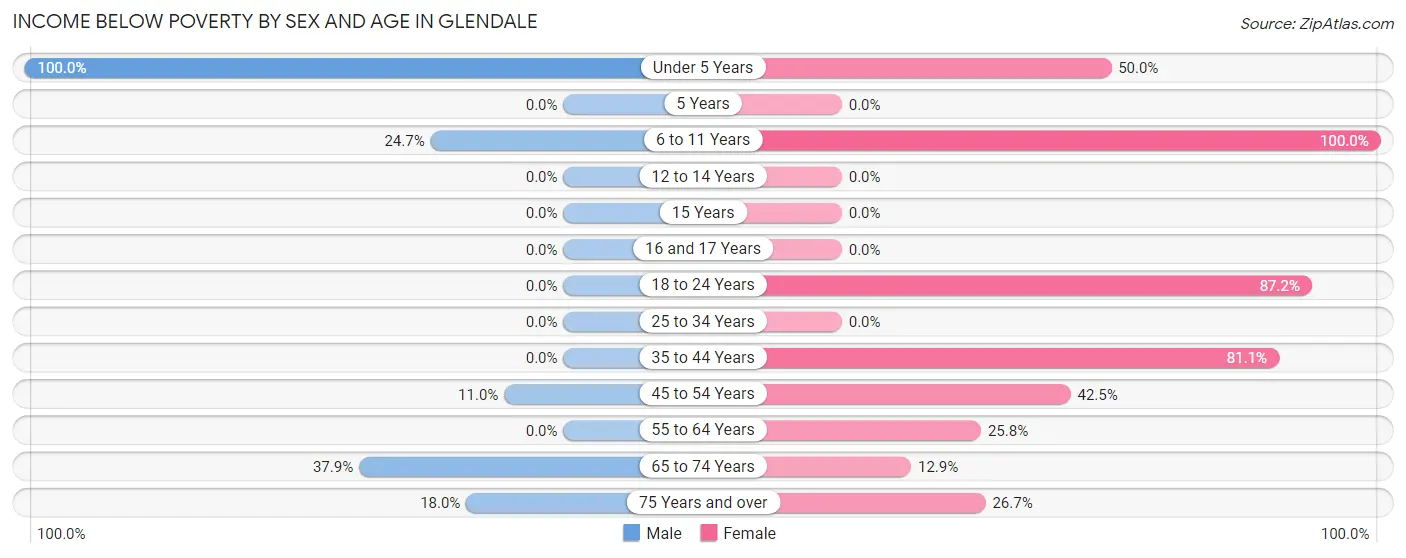
| Age Bracket | Male | Female |
| Under 5 Years | 26 (100.0%) | 72 (50.0%) |
| 5 Years | 0 (0.0%) | 0 (0.0%) |
| 6 to 11 Years | 18 (24.7%) | 14 (100.0%) |
| 12 to 14 Years | 0 (0.0%) | 0 (0.0%) |
| 15 Years | 0 (0.0%) | 0 (0.0%) |
| 16 and 17 Years | 0 (0.0%) | 0 (0.0%) |
| 18 to 24 Years | 0 (0.0%) | 116 (87.2%) |
| 25 to 34 Years | 0 (0.0%) | 0 (0.0%) |
| 35 to 44 Years | 0 (0.0%) | 43 (81.1%) |
| 45 to 54 Years | 21 (11.0%) | 76 (42.5%) |
| 55 to 64 Years | 0 (0.0%) | 23 (25.8%) |
| 65 to 74 Years | 22 (37.9%) | 9 (12.9%) |
| 75 Years and over | 11 (18.0%) | 12 (26.7%) |
| Total | 98 (13.6%) | 365 (46.0%) |
Income Above Poverty by Sex and Age in Glendale
According to the poverty statistics in Glendale, males aged 16 and 17 years and females aged 5 years are the age groups that are most secure financially, with 100.0% of males and 100.0% of females in these age groups living above the poverty line.
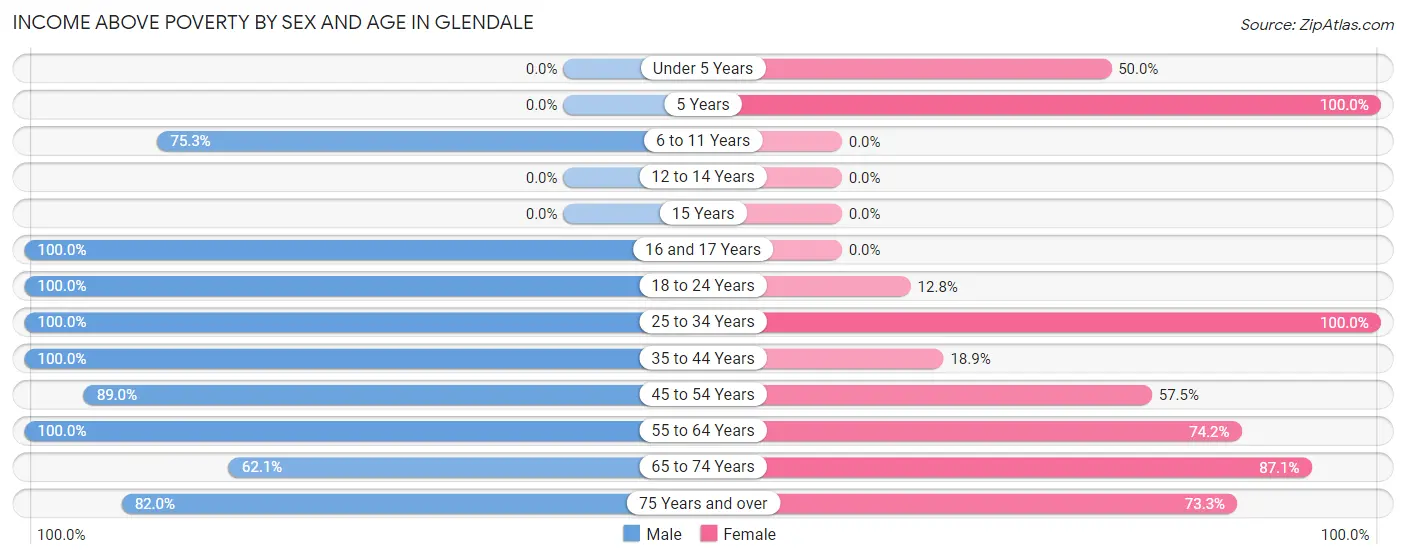
| Age Bracket | Male | Female |
| Under 5 Years | 0 (0.0%) | 72 (50.0%) |
| 5 Years | 0 (0.0%) | 33 (100.0%) |
| 6 to 11 Years | 55 (75.3%) | 0 (0.0%) |
| 12 to 14 Years | 0 (0.0%) | 0 (0.0%) |
| 15 Years | 0 (0.0%) | 0 (0.0%) |
| 16 and 17 Years | 28 (100.0%) | 0 (0.0%) |
| 18 to 24 Years | 62 (100.0%) | 17 (12.8%) |
| 25 to 34 Years | 67 (100.0%) | 34 (100.0%) |
| 35 to 44 Years | 7 (100.0%) | 10 (18.9%) |
| 45 to 54 Years | 170 (89.0%) | 103 (57.5%) |
| 55 to 64 Years | 147 (100.0%) | 66 (74.2%) |
| 65 to 74 Years | 36 (62.1%) | 61 (87.1%) |
| 75 Years and over | 50 (82.0%) | 33 (73.3%) |
| Total | 622 (86.4%) | 429 (54.0%) |
Income Below Poverty Among Married-Couple Families in Glendale
The poverty statistics for married-couple families in Glendale show that 7.1% or 22 of the total 311 families live below the poverty line. Families with 1 or 2 children have the highest poverty rate of 41.5%, comprising of 22 families. On the other hand, families with no children have the lowest poverty rate of 0.0%, which includes 0 families.
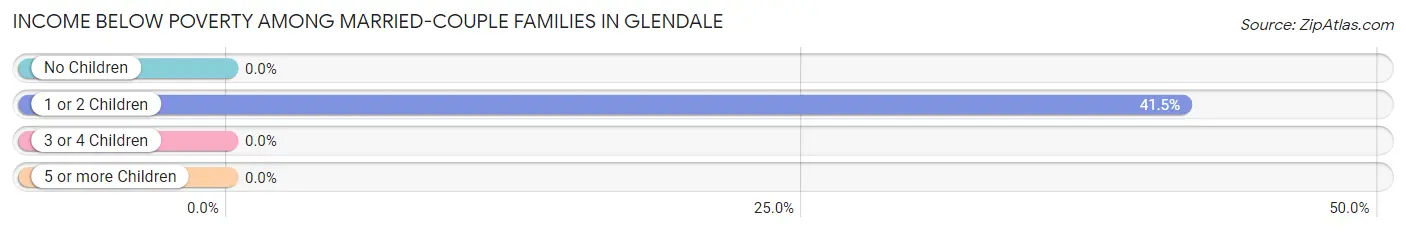
| Children | Above Poverty | Below Poverty |
| No Children | 224 (100.0%) | 0 (0.0%) |
| 1 or 2 Children | 31 (58.5%) | 22 (41.5%) |
| 3 or 4 Children | 34 (100.0%) | 0 (0.0%) |
| 5 or more Children | 0 (0.0%) | 0 (0.0%) |
| Total | 289 (92.9%) | 22 (7.1%) |
Income Below Poverty Among Single-Parent Households in Glendale
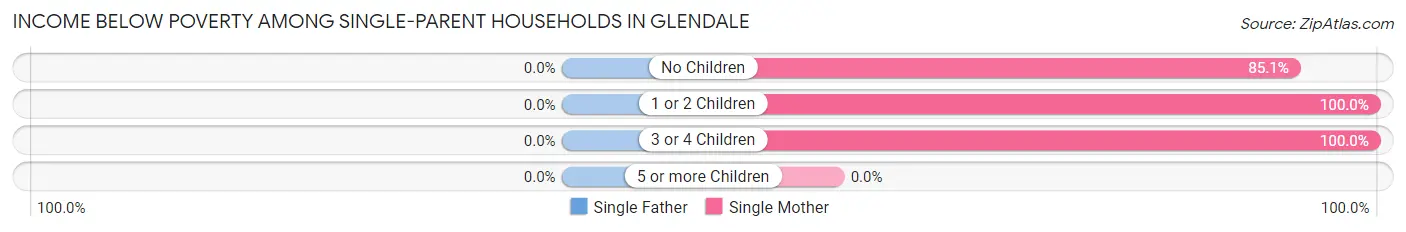
| Children | Single Father | Single Mother |
| No Children | 0 (0.0%) | 40 (85.1%) |
| 1 or 2 Children | 0 (0.0%) | 12 (100.0%) |
| 3 or 4 Children | 0 (0.0%) | 18 (100.0%) |
| 5 or more Children | 0 (0.0%) | 0 (0.0%) |
| Total | 0 (0.0%) | 70 (90.9%) |
Income Below Poverty Among Married-Couple vs Single-Parent Households in Glendale
The poverty data for Glendale shows that 22 of the married-couple family households (7.1%) and 70 of the single-parent households (66.0%) are living below the poverty level. Within the married-couple family households, those with 1 or 2 children have the highest poverty rate, with 22 households (41.5%) falling below the poverty line. Among the single-parent households, those with 3 or 4 children have the highest poverty rate, with 18 household (100.0%) living below poverty.
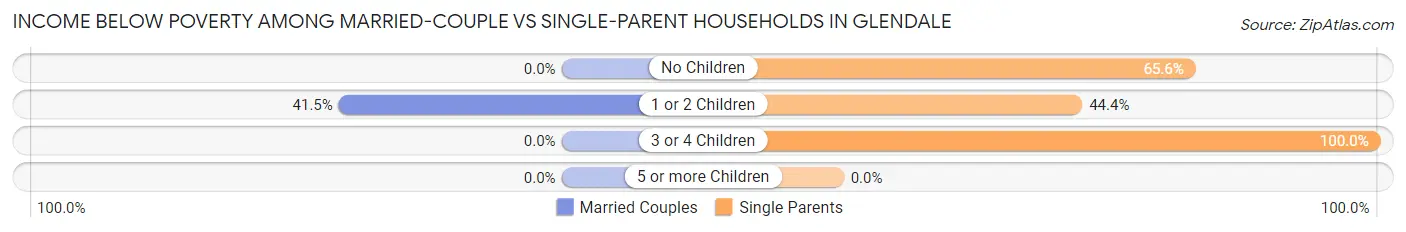
| Children | Married-Couple Families | Single-Parent Households |
| No Children | 0 (0.0%) | 40 (65.6%) |
| 1 or 2 Children | 22 (41.5%) | 12 (44.4%) |
| 3 or 4 Children | 0 (0.0%) | 18 (100.0%) |
| 5 or more Children | 0 (0.0%) | 0 (0.0%) |
| Total | 22 (7.1%) | 70 (66.0%) |
Race in Glendale
The most populous races in Glendale are White / Caucasian (849 | 56.1%), Black / African American (578 | 38.2%), and Hispanic or Latino (44 | 2.9%).
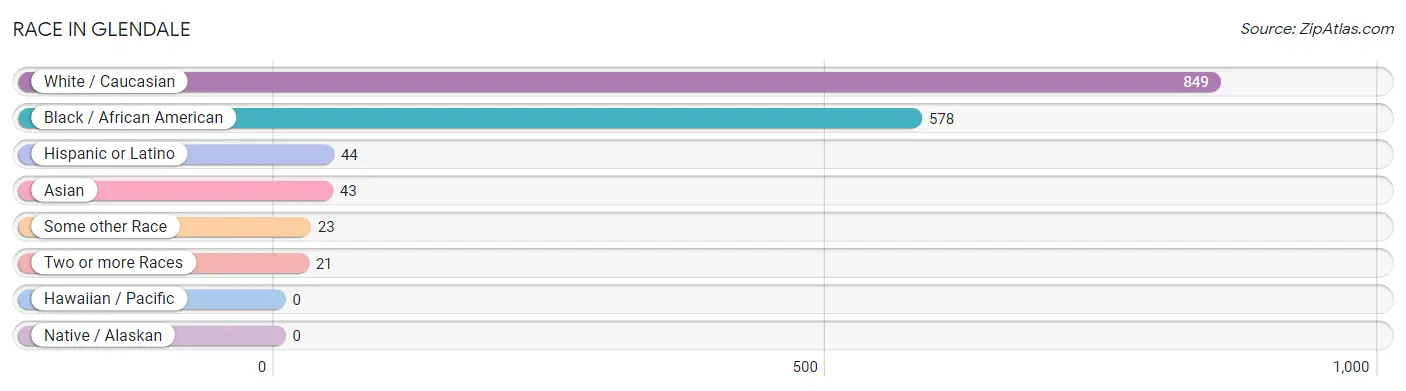
| Race | # Population | % Population |
| Asian | 43 | 2.8% |
| Black / African American | 578 | 38.2% |
| Hawaiian / Pacific | 0 | 0.0% |
| Hispanic or Latino | 44 | 2.9% |
| Native / Alaskan | 0 | 0.0% |
| White / Caucasian | 849 | 56.1% |
| Two or more Races | 21 | 1.4% |
| Some other Race | 23 | 1.5% |
| Total | 1,514 | 100.0% |
Ancestry in Glendale
The most populous ancestries reported in Glendale are American (337 | 22.3%), German (163 | 10.8%), English (74 | 4.9%), Irish (57 | 3.8%), and European (56 | 3.7%), together accounting for 45.4% of all Glendale residents.
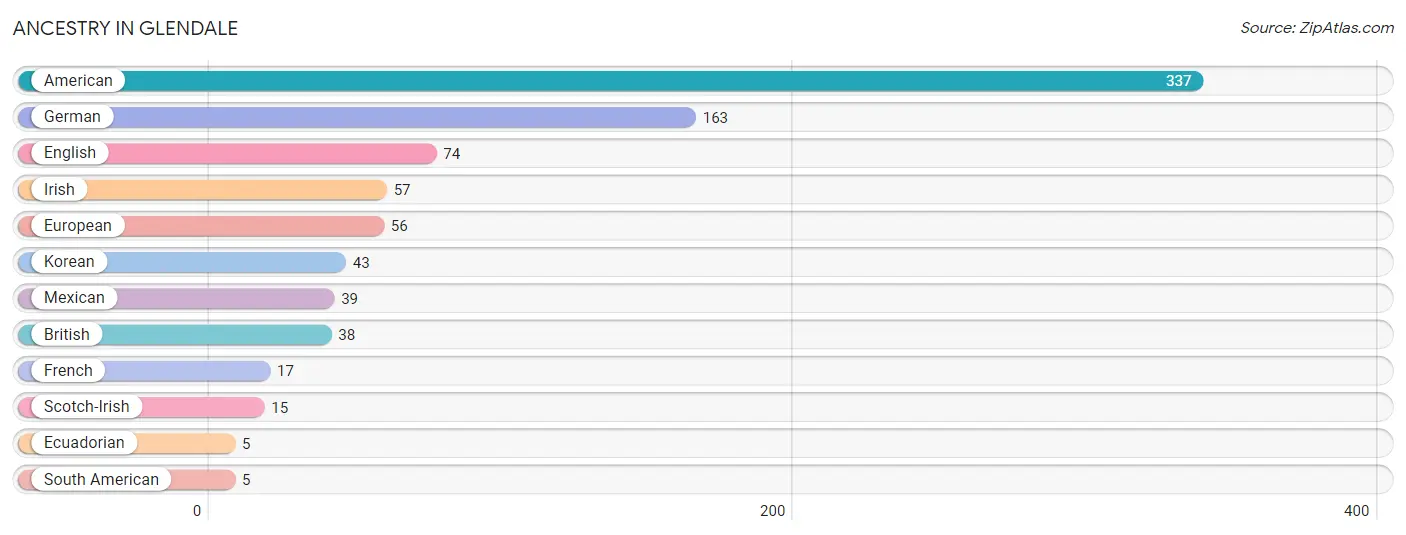
| Ancestry | # Population | % Population |
| American | 337 | 22.3% |
| British | 38 | 2.5% |
| Ecuadorian | 5 | 0.3% |
| English | 74 | 4.9% |
| European | 56 | 3.7% |
| French | 17 | 1.1% |
| German | 163 | 10.8% |
| Irish | 57 | 3.8% |
| Korean | 43 | 2.8% |
| Mexican | 39 | 2.6% |
| Scotch-Irish | 15 | 1.0% |
| South American | 5 | 0.3% | View All 12 Rows |
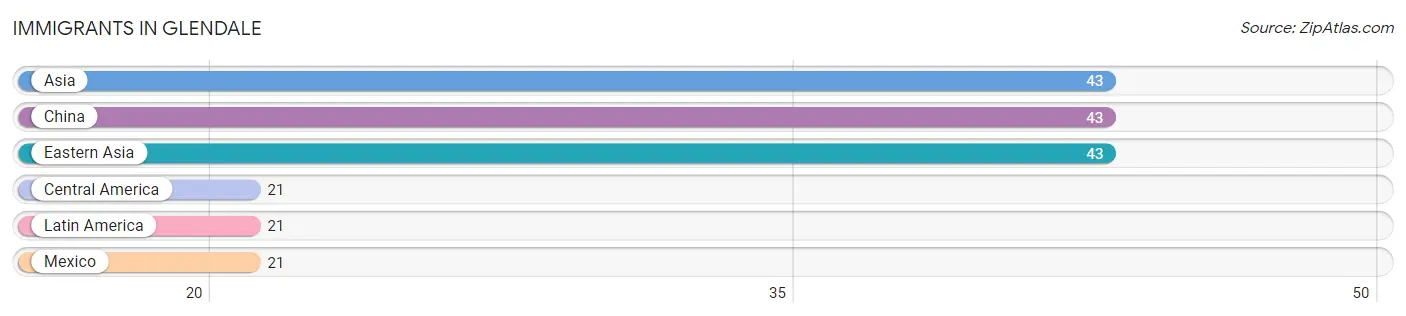
Immigrants in Glendale
The most numerous immigrant groups reported in Glendale came from Asia (43 | 2.8%), China (43 | 2.8%), Eastern Asia (43 | 2.8%), Central America (21 | 1.4%), and Latin America (21 | 1.4%), together accounting for 11.3% of all Glendale residents.
| Immigration Origin | # Population | % Population |
| Asia | 43 | 2.8% |
| Central America | 21 | 1.4% |
| China | 43 | 2.8% |
| Eastern Asia | 43 | 2.8% |
| Latin America | 21 | 1.4% |
| Mexico | 21 | 1.4% | View All 6 Rows |
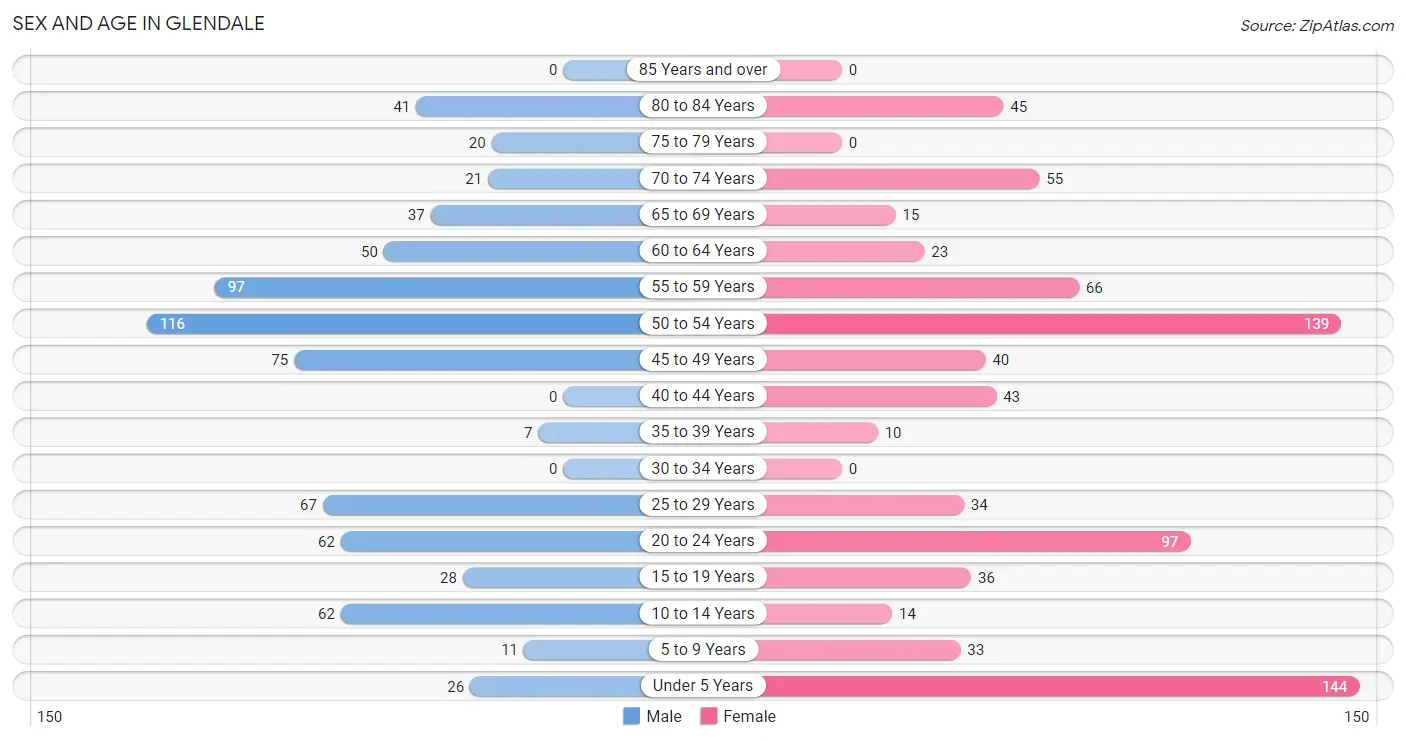
Sex and Age in Glendale
Sex and Age in Glendale
The most populous age groups in Glendale are 50 to 54 Years (116 | 16.1%) for men and Under 5 Years (144 | 18.1%) for women.
| Age Bracket | Male | Female |
| Under 5 Years | 26 (3.6%) | 144 (18.1%) |
| 5 to 9 Years | 11 (1.5%) | 33 (4.2%) |
| 10 to 14 Years | 62 (8.6%) | 14 (1.8%) |
| 15 to 19 Years | 28 (3.9%) | 36 (4.5%) |
| 20 to 24 Years | 62 (8.6%) | 97 (12.2%) |
| 25 to 29 Years | 67 (9.3%) | 34 (4.3%) |
| 30 to 34 Years | 0 (0.0%) | 0 (0.0%) |
| 35 to 39 Years | 7 (1.0%) | 10 (1.3%) |
| 40 to 44 Years | 0 (0.0%) | 43 (5.4%) |
| 45 to 49 Years | 75 (10.4%) | 40 (5.0%) |
| 50 to 54 Years | 116 (16.1%) | 139 (17.5%) |
| 55 to 59 Years | 97 (13.5%) | 66 (8.3%) |
| 60 to 64 Years | 50 (6.9%) | 23 (2.9%) |
| 65 to 69 Years | 37 (5.1%) | 15 (1.9%) |
| 70 to 74 Years | 21 (2.9%) | 55 (6.9%) |
| 75 to 79 Years | 20 (2.8%) | 0 (0.0%) |
| 80 to 84 Years | 41 (5.7%) | 45 (5.7%) |
| 85 Years and over | 0 (0.0%) | 0 (0.0%) |
| Total | 720 (100.0%) | 794 (100.0%) |
Families and Households in Glendale
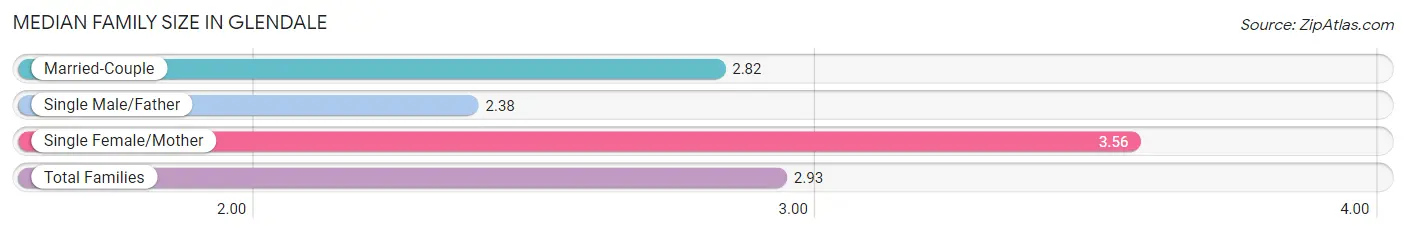
Median Family Size in Glendale
The median family size in Glendale is 2.93 persons per family, with single female/mother families (77 | 18.5%) accounting for the largest median family size of 3.56 persons per family. On the other hand, single male/father families (29 | 7.0%) represent the smallest median family size with 2.38 persons per family.
| Family Type | # Families | Family Size |
| Married-Couple | 311 (74.6%) | 2.82 |
| Single Male/Father | 29 (7.0%) | 2.38 |
| Single Female/Mother | 77 (18.5%) | 3.56 |
| Total Families | 417 (100.0%) | 2.93 |
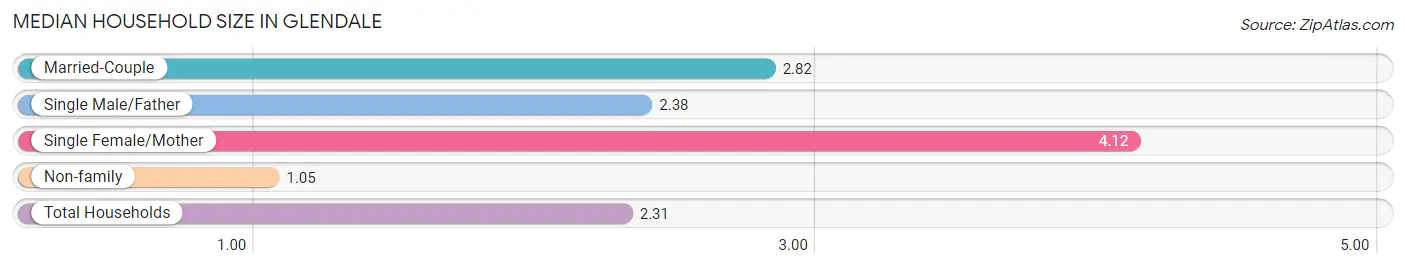
Median Household Size in Glendale
The median household size in Glendale is 2.31 persons per household, with single female/mother households (77 | 11.7%) accounting for the largest median household size of 4.12 persons per household. non-family households (239 | 36.4%) represent the smallest median household size with 1.05 persons per household.
| Household Type | # Households | Household Size |
| Married-Couple | 311 (47.4%) | 2.82 |
| Single Male/Father | 29 (4.4%) | 2.38 |
| Single Female/Mother | 77 (11.7%) | 4.12 |
| Non-family | 239 (36.4%) | 1.05 |
| Total Households | 656 (100.0%) | 2.31 |
Household Size by Marriage Status in Glendale
Out of a total of 656 households in Glendale, 417 (63.6%) are family households, while 239 (36.4%) are nonfamily households. The most numerous type of family households are 2-person households, comprising 300, and the most common type of nonfamily households are 1-person households, comprising 230.
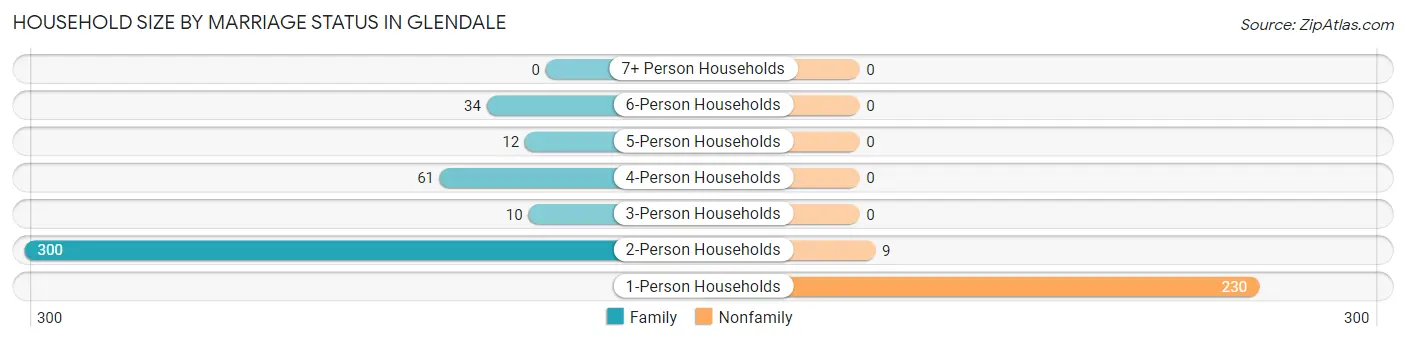
| Household Size | Family Households | Nonfamily Households |
| 1-Person Households | - | 230 (35.1%) |
| 2-Person Households | 300 (45.7%) | 9 (1.4%) |
| 3-Person Households | 10 (1.5%) | 0 (0.0%) |
| 4-Person Households | 61 (9.3%) | 0 (0.0%) |
| 5-Person Households | 12 (1.8%) | 0 (0.0%) |
| 6-Person Households | 34 (5.2%) | 0 (0.0%) |
| 7+ Person Households | 0 (0.0%) | 0 (0.0%) |
| Total | 417 (63.6%) | 239 (36.4%) |
Female Fertility in Glendale
Fertility by Age in Glendale
| Age Bracket | Women with Births | Births / 1,000 Women |
| 15 to 19 years | 0 (0.0%) | 0.0 |
| 20 to 34 years | 0 (0.0%) | 0.0 |
| 35 to 50 years | 0 (0.0%) | 0.0 |
| Total | 0 (0.0%) | 0.0 |
Fertility by Age by Marriage Status in Glendale
| Age Bracket | Married | Unmarried |
| 15 to 19 years | 0 (0.0%) | 0 (0.0%) |
| 20 to 34 years | 0 (0.0%) | 0 (0.0%) |
| 35 to 50 years | 0 (0.0%) | 0 (0.0%) |
| Total | 0 (0.0%) | 0 (0.0%) |
Fertility by Education in Glendale
| Educational Attainment | Women with Births | Births / 1,000 Women |
| Less than High School | 0 (0.0%) | 0.0 |
| High School Diploma | 0 (0.0%) | 0.0 |
| College or Associate's Degree | 0 (0.0%) | 0.0 |
| Bachelor's Degree | 0 (0.0%) | 0.0 |
| Graduate Degree | 0 (0.0%) | 0.0 |
| Total | 0 (0.0%) | 0.0 |
Fertility by Education by Marriage Status in Glendale
| Educational Attainment | Married | Unmarried |
| Less than High School | 0 (0.0%) | 0 (0.0%) |
| High School Diploma | 0 (0.0%) | 0 (0.0%) |
| College or Associate's Degree | 0 (0.0%) | 0 (0.0%) |
| Bachelor's Degree | 0 (0.0%) | 0 (0.0%) |
| Graduate Degree | 0 (0.0%) | 0 (0.0%) |
| Total | 0 (0.0%) | 0 (0.0%) |
Employment Characteristics in Glendale
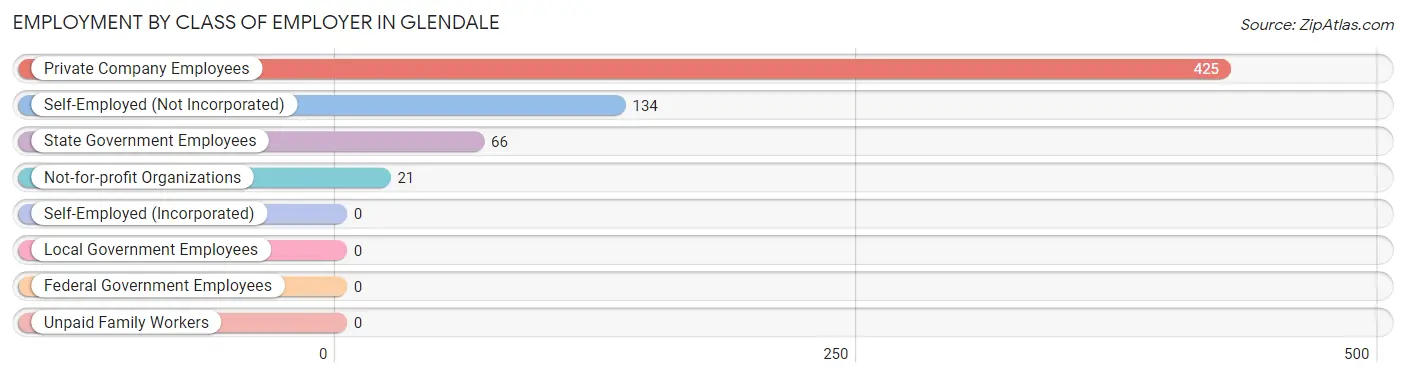
Employment by Class of Employer in Glendale
Among the 646 employed individuals in Glendale, private company employees (425 | 65.8%), self-employed (not incorporated) (134 | 20.7%), and state government employees (66 | 10.2%) make up the most common classes of employment.
| Employer Class | # Employees | % Employees |
| Private Company Employees | 425 | 65.8% |
| Self-Employed (Incorporated) | 0 | 0.0% |
| Self-Employed (Not Incorporated) | 134 | 20.7% |
| Not-for-profit Organizations | 21 | 3.3% |
| Local Government Employees | 0 | 0.0% |
| State Government Employees | 66 | 10.2% |
| Federal Government Employees | 0 | 0.0% |
| Unpaid Family Workers | 0 | 0.0% |
| Total | 646 | 100.0% |
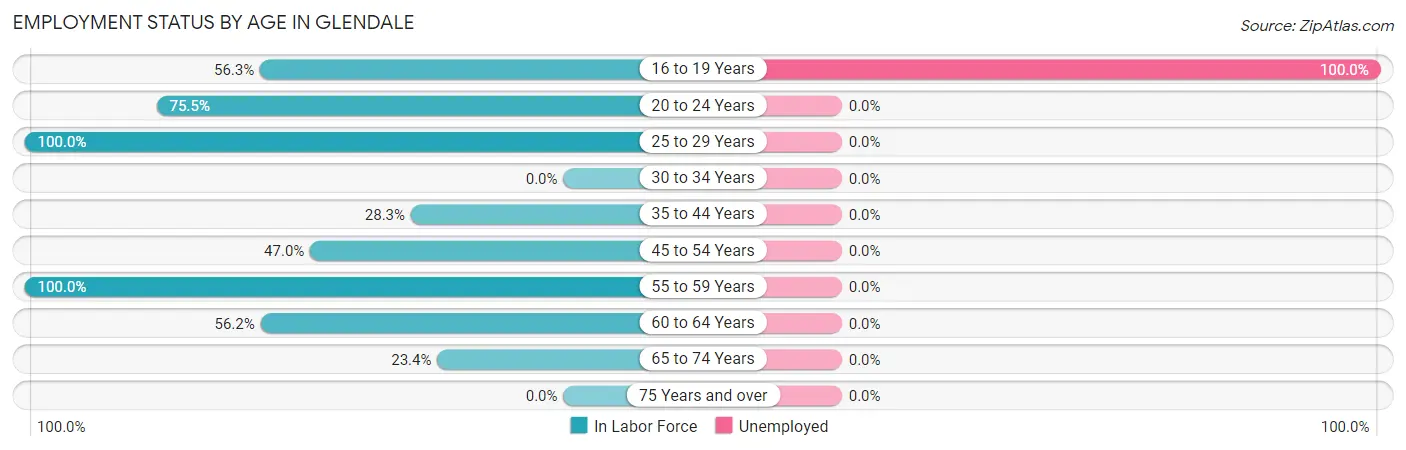
Employment Status by Age in Glendale
According to the labor force statistics for Glendale, out of the total population over 16 years of age (1,224), 55.7% or 682 individuals are in the labor force, with 5.3% or 36 of them unemployed. The age group with the highest labor force participation rate is 25 to 29 years, with 100.0% or 101 individuals in the labor force. Within the labor force, the 16 to 19 years age range has the highest percentage of unemployed individuals, with 100.0% or 36 of them being unemployed.
| Age Bracket | In Labor Force | Unemployed |
| 16 to 19 Years | 36 (56.3%) | 36 (100.0%) |
| 20 to 24 Years | 120 (75.5%) | 0 (0.0%) |
| 25 to 29 Years | 101 (100.0%) | 0 (0.0%) |
| 30 to 34 Years | 0 (0.0%) | 0 (0.0%) |
| 35 to 44 Years | 17 (28.3%) | 0 (0.0%) |
| 45 to 54 Years | 174 (47.0%) | 0 (0.0%) |
| 55 to 59 Years | 163 (100.0%) | 0 (0.0%) |
| 60 to 64 Years | 41 (56.2%) | 0 (0.0%) |
| 65 to 74 Years | 30 (23.4%) | 0 (0.0%) |
| 75 Years and over | 0 (0.0%) | 0 (0.0%) |
| Total | 682 (55.7%) | 36 (5.3%) |
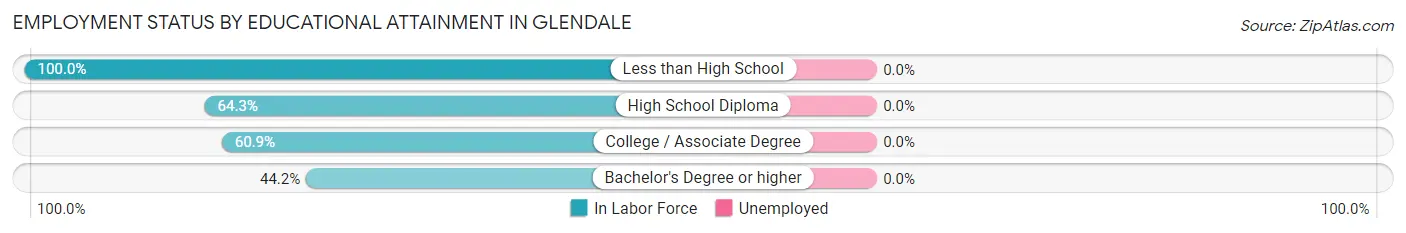
Employment Status by Educational Attainment in Glendale
| Educational Attainment | In Labor Force | Unemployed |
| Less than High School | 107 (100.0%) | 0 (0.0%) |
| High School Diploma | 218 (64.3%) | 0 (0.0%) |
| College / Associate Degree | 106 (60.9%) | 0 (0.0%) |
| Bachelor's Degree or higher | 65 (44.2%) | 0 (0.0%) |
| Total | 496 (64.7%) | 0 (0.0%) |
Employment Occupations by Sex in Glendale
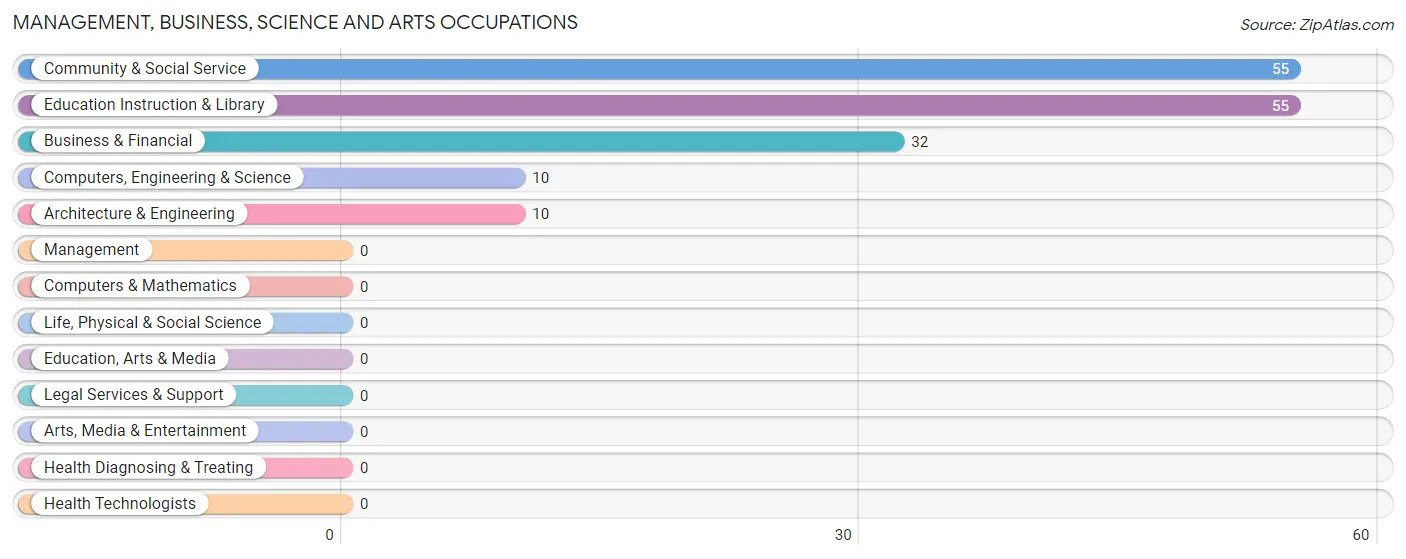
Management, Business, Science and Arts Occupations
The most common Management, Business, Science and Arts occupations in Glendale are Community & Social Service (55 | 8.5%), Education Instruction & Library (55 | 8.5%), Business & Financial (32 | 5.0%), Computers, Engineering & Science (10 | 1.5%), and Architecture & Engineering (10 | 1.5%).
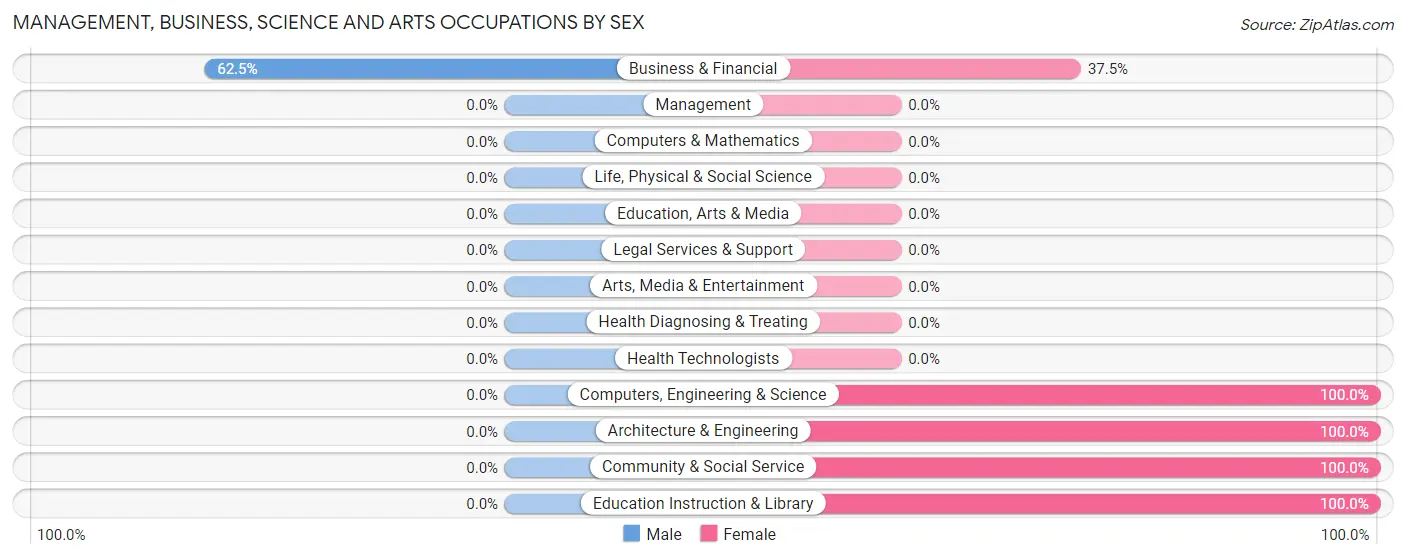
Management, Business, Science and Arts Occupations by Sex
| Occupation | Male | Female |
| Management | 0 (0.0%) | 0 (0.0%) |
| Business & Financial | 20 (62.5%) | 12 (37.5%) |
| Computers, Engineering & Science | 0 (0.0%) | 10 (100.0%) |
| Computers & Mathematics | 0 (0.0%) | 0 (0.0%) |
| Architecture & Engineering | 0 (0.0%) | 10 (100.0%) |
| Life, Physical & Social Science | 0 (0.0%) | 0 (0.0%) |
| Community & Social Service | 0 (0.0%) | 55 (100.0%) |
| Education, Arts & Media | 0 (0.0%) | 0 (0.0%) |
| Legal Services & Support | 0 (0.0%) | 0 (0.0%) |
| Education Instruction & Library | 0 (0.0%) | 55 (100.0%) |
| Arts, Media & Entertainment | 0 (0.0%) | 0 (0.0%) |
| Health Diagnosing & Treating | 0 (0.0%) | 0 (0.0%) |
| Health Technologists | 0 (0.0%) | 0 (0.0%) |
| Total (Category) | 20 (20.6%) | 77 (79.4%) |
| Total (Overall) | 366 (56.7%) | 280 (43.3%) |
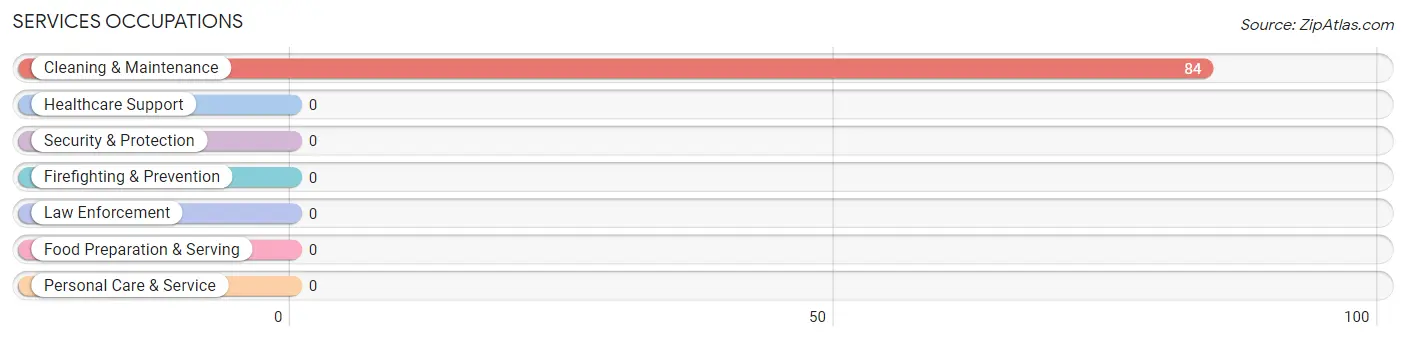
Services Occupations
The most common Services occupations in Glendale are , and Cleaning & Maintenance (84 | 13.0%).
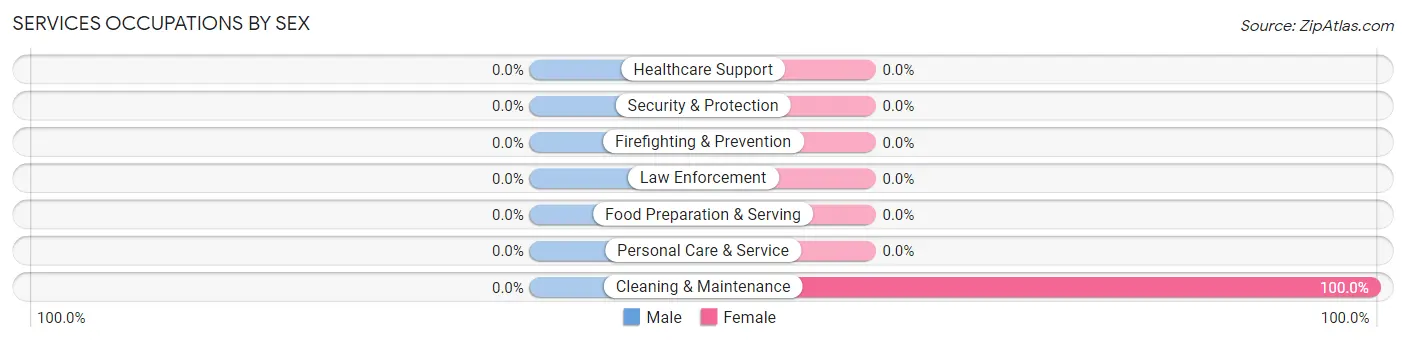
Services Occupations by Sex
| Occupation | Male | Female |
| Healthcare Support | 0 (0.0%) | 0 (0.0%) |
| Security & Protection | 0 (0.0%) | 0 (0.0%) |
| Firefighting & Prevention | 0 (0.0%) | 0 (0.0%) |
| Law Enforcement | 0 (0.0%) | 0 (0.0%) |
| Food Preparation & Serving | 0 (0.0%) | 0 (0.0%) |
| Cleaning & Maintenance | 0 (0.0%) | 84 (100.0%) |
| Personal Care & Service | 0 (0.0%) | 0 (0.0%) |
| Total (Category) | 0 (0.0%) | 84 (100.0%) |
| Total (Overall) | 366 (56.7%) | 280 (43.3%) |
Sales and Office Occupations
The most common Sales and Office occupations in Glendale are Sales & Related (94 | 14.5%), and Office & Administration (32 | 5.0%).
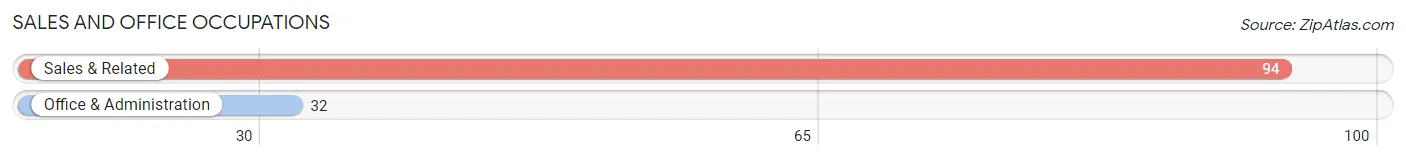
Sales and Office Occupations by Sex
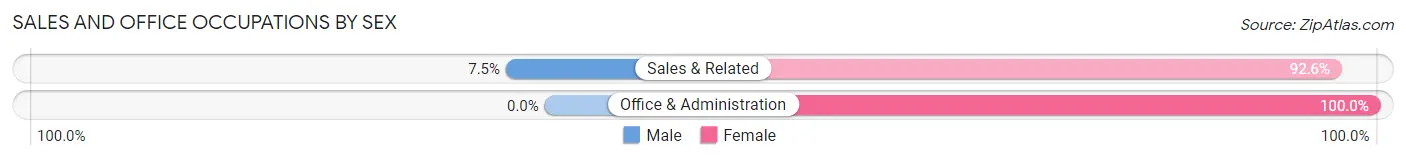
| Occupation | Male | Female |
| Sales & Related | 7 (7.4%) | 87 (92.5%) |
| Office & Administration | 0 (0.0%) | 32 (100.0%) |
| Total (Category) | 7 (5.6%) | 119 (94.4%) |
| Total (Overall) | 366 (56.7%) | 280 (43.3%) |
Natural Resources, Construction and Maintenance Occupations
The most common Natural Resources, Construction and Maintenance occupations in Glendale are Construction & Extraction (116 | 18.0%), and Installation, Maintenance & Repair (93 | 14.4%).
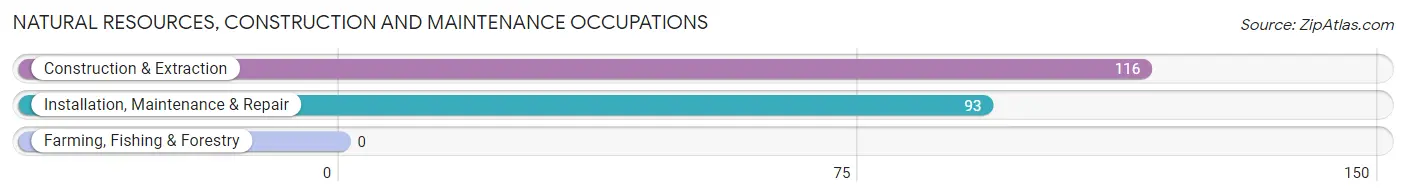
Natural Resources, Construction and Maintenance Occupations by Sex
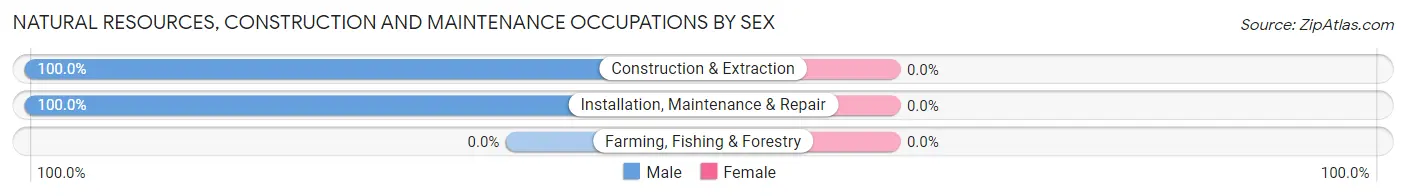
| Occupation | Male | Female |
| Farming, Fishing & Forestry | 0 (0.0%) | 0 (0.0%) |
| Construction & Extraction | 116 (100.0%) | 0 (0.0%) |
| Installation, Maintenance & Repair | 93 (100.0%) | 0 (0.0%) |
| Total (Category) | 209 (100.0%) | 0 (0.0%) |
| Total (Overall) | 366 (56.7%) | 280 (43.3%) |
Production, Transportation and Moving Occupations
The most common Production, Transportation and Moving occupations in Glendale are Production (107 | 16.6%), and Transportation (23 | 3.6%).
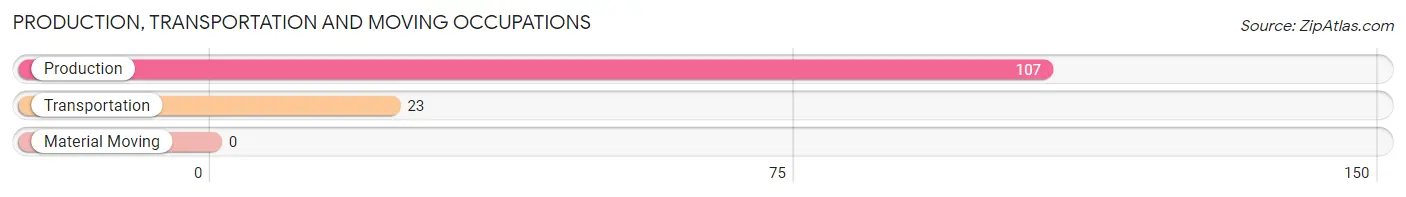
Production, Transportation and Moving Occupations by Sex
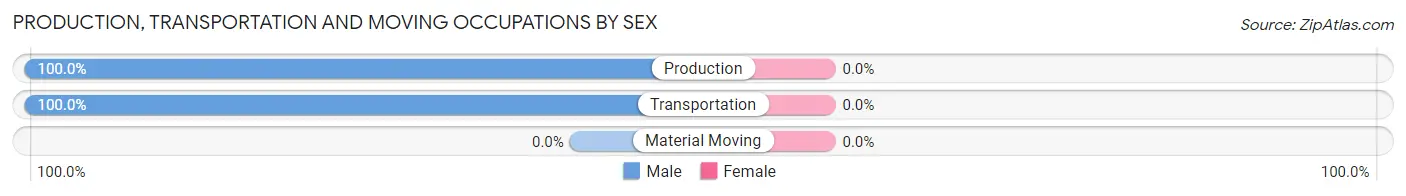
| Occupation | Male | Female |
| Production | 107 (100.0%) | 0 (0.0%) |
| Transportation | 23 (100.0%) | 0 (0.0%) |
| Material Moving | 0 (0.0%) | 0 (0.0%) |
| Total (Category) | 130 (100.0%) | 0 (0.0%) |
| Total (Overall) | 366 (56.7%) | 280 (43.3%) |
Employment Industries by Sex in Glendale
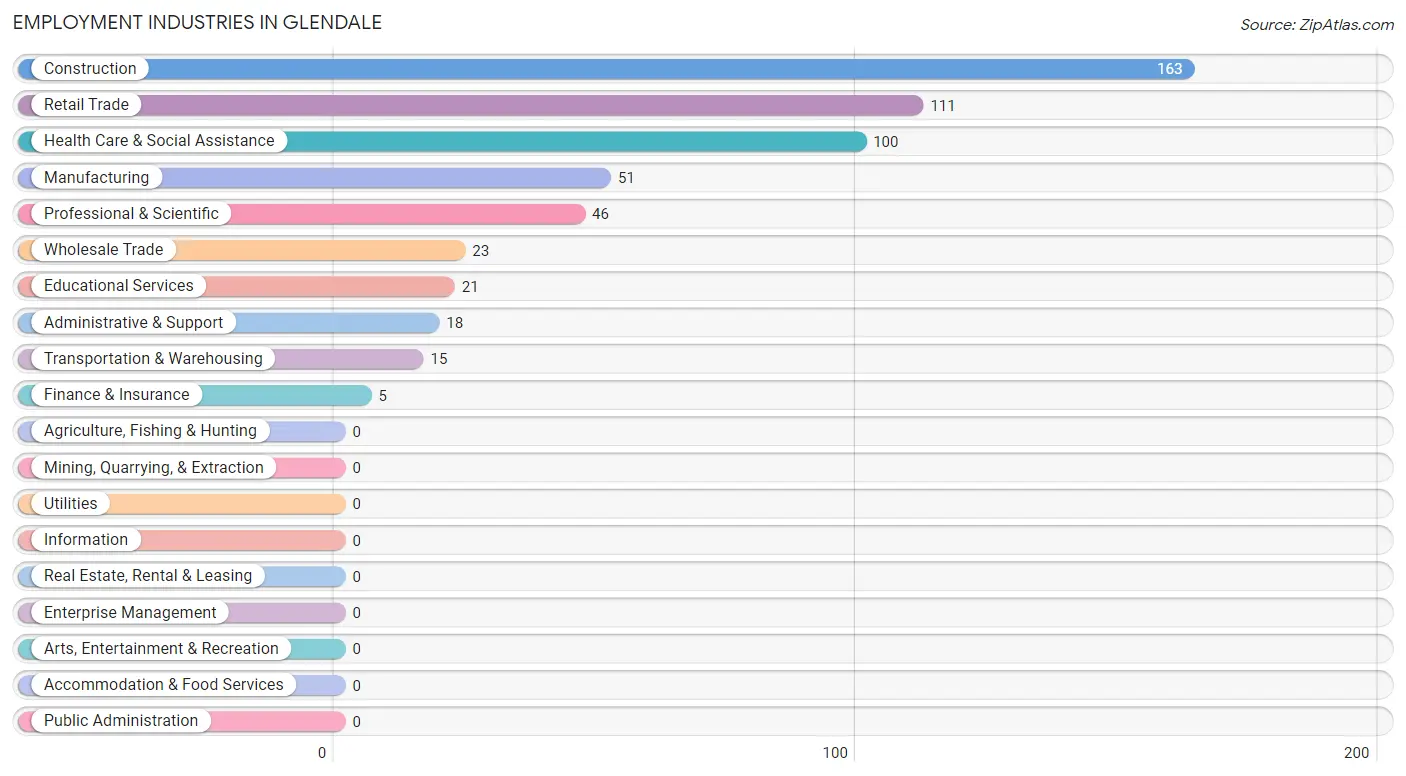
Employment Industries in Glendale
The major employment industries in Glendale include Construction (163 | 25.2%), Retail Trade (111 | 17.2%), Health Care & Social Assistance (100 | 15.5%), Manufacturing (51 | 7.9%), and Professional & Scientific (46 | 7.1%).
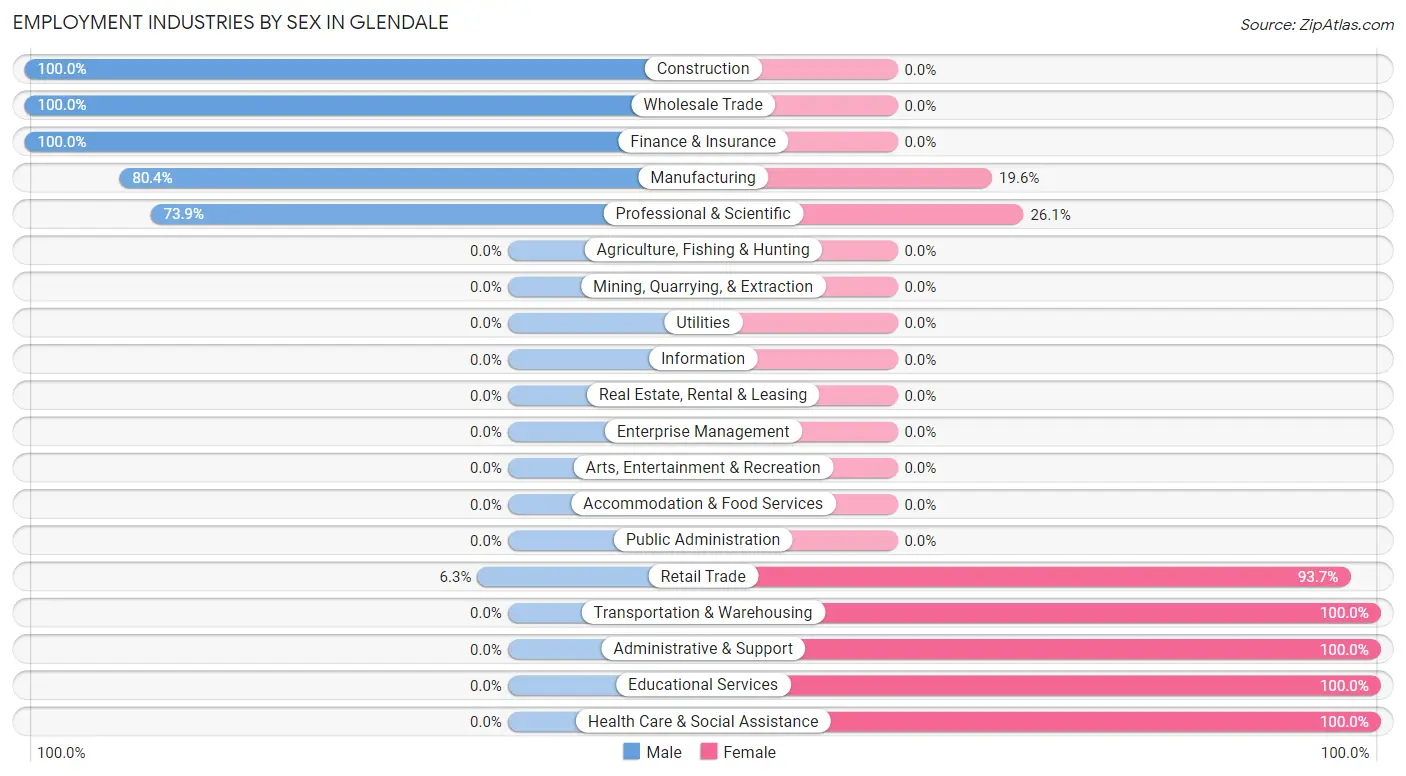
Employment Industries by Sex in Glendale
The Glendale industries that see more men than women are Construction (100.0%), Wholesale Trade (100.0%), and Finance & Insurance (100.0%), whereas the industries that tend to have a higher number of women are Transportation & Warehousing (100.0%), Administrative & Support (100.0%), and Educational Services (100.0%).
| Industry | Male | Female |
| Agriculture, Fishing & Hunting | 0 (0.0%) | 0 (0.0%) |
| Mining, Quarrying, & Extraction | 0 (0.0%) | 0 (0.0%) |
| Construction | 163 (100.0%) | 0 (0.0%) |
| Manufacturing | 41 (80.4%) | 10 (19.6%) |
| Wholesale Trade | 23 (100.0%) | 0 (0.0%) |
| Retail Trade | 7 (6.3%) | 104 (93.7%) |
| Transportation & Warehousing | 0 (0.0%) | 15 (100.0%) |
| Utilities | 0 (0.0%) | 0 (0.0%) |
| Information | 0 (0.0%) | 0 (0.0%) |
| Finance & Insurance | 5 (100.0%) | 0 (0.0%) |
| Real Estate, Rental & Leasing | 0 (0.0%) | 0 (0.0%) |
| Professional & Scientific | 34 (73.9%) | 12 (26.1%) |
| Enterprise Management | 0 (0.0%) | 0 (0.0%) |
| Administrative & Support | 0 (0.0%) | 18 (100.0%) |
| Educational Services | 0 (0.0%) | 21 (100.0%) |
| Health Care & Social Assistance | 0 (0.0%) | 100 (100.0%) |
| Arts, Entertainment & Recreation | 0 (0.0%) | 0 (0.0%) |
| Accommodation & Food Services | 0 (0.0%) | 0 (0.0%) |
| Public Administration | 0 (0.0%) | 0 (0.0%) |
| Total | 366 (56.7%) | 280 (43.3%) |
Education in Glendale
School Enrollment in Glendale
The most common levels of schooling among the 242 students in Glendale are elementary school (102 | 42.1%), kindergarten (55 | 22.7%), and college / undergraduate (39 | 16.1%).
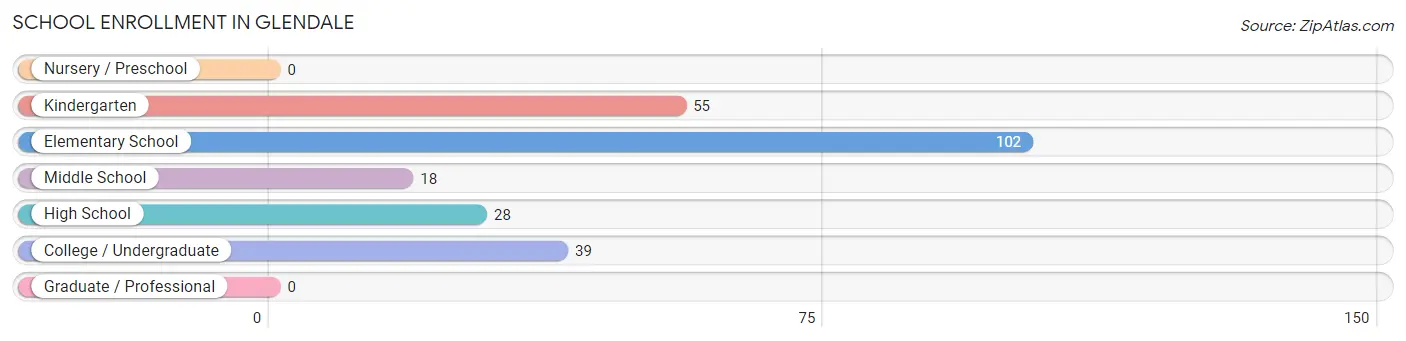
| School Level | # Students | % Students |
| Nursery / Preschool | 0 | 0.0% |
| Kindergarten | 55 | 22.7% |
| Elementary School | 102 | 42.1% |
| Middle School | 18 | 7.4% |
| High School | 28 | 11.6% |
| College / Undergraduate | 39 | 16.1% |
| Graduate / Professional | 0 | 0.0% |
| Total | 242 | 100.0% |
School Enrollment by Age by Funding Source in Glendale
Out of a total of 242 students who are enrolled in schools in Glendale, 28 (11.6%) attend a private institution, while the remaining 214 (88.4%) are enrolled in public schools. The age group of 15 to 17 year olds has the highest likelihood of being enrolled in private schools, with 28 (100.0% in the age bracket) enrolled. Conversely, the age group of 3 to 4 year olds has the lowest likelihood of being enrolled in a private school, with 55 (100.0% in the age bracket) attending a public institution.
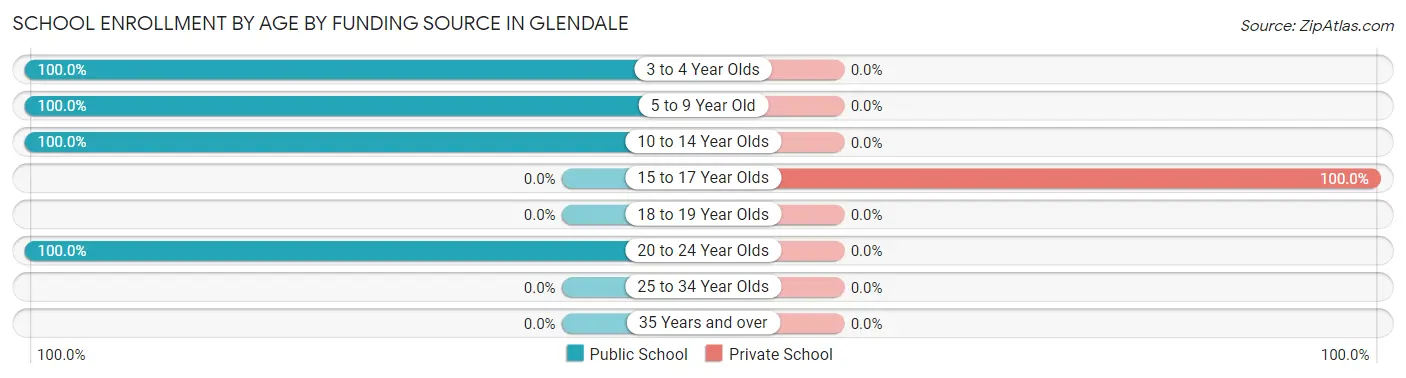
| Age Bracket | Public School | Private School |
| 3 to 4 Year Olds | 55 (100.0%) | 0 (0.0%) |
| 5 to 9 Year Old | 44 (100.0%) | 0 (0.0%) |
| 10 to 14 Year Olds | 76 (100.0%) | 0 (0.0%) |
| 15 to 17 Year Olds | 0 (0.0%) | 28 (100.0%) |
| 18 to 19 Year Olds | 0 (0.0%) | 0 (0.0%) |
| 20 to 24 Year Olds | 39 (100.0%) | 0 (0.0%) |
| 25 to 34 Year Olds | 0 (0.0%) | 0 (0.0%) |
| 35 Years and over | 0 (0.0%) | 0 (0.0%) |
| Total | 214 (88.4%) | 28 (11.6%) |
Educational Attainment by Field of Study in Glendale
Education (76 | 33.5%), literature & languages (45 | 19.8%), engineering (37 | 16.3%), arts & humanities (26 | 11.5%), and bio, nature & agricultural (21 | 9.2%) are the most common fields of study among 227 individuals in Glendale who have obtained a bachelor's degree or higher.
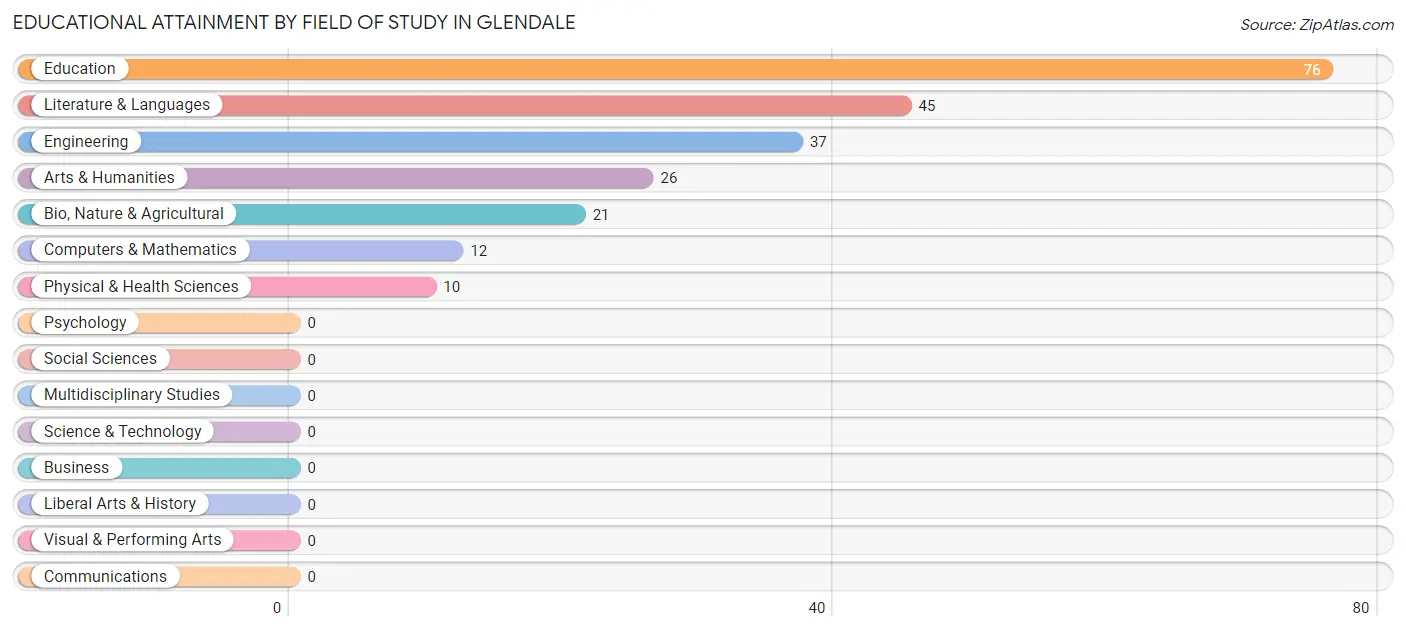
| Field of Study | # Graduates | % Graduates |
| Computers & Mathematics | 12 | 5.3% |
| Bio, Nature & Agricultural | 21 | 9.2% |
| Physical & Health Sciences | 10 | 4.4% |
| Psychology | 0 | 0.0% |
| Social Sciences | 0 | 0.0% |
| Engineering | 37 | 16.3% |
| Multidisciplinary Studies | 0 | 0.0% |
| Science & Technology | 0 | 0.0% |
| Business | 0 | 0.0% |
| Education | 76 | 33.5% |
| Literature & Languages | 45 | 19.8% |
| Liberal Arts & History | 0 | 0.0% |
| Visual & Performing Arts | 0 | 0.0% |
| Communications | 0 | 0.0% |
| Arts & Humanities | 26 | 11.5% |
| Total | 227 | 100.0% |
Transportation & Commute in Glendale
Vehicle Availability by Sex in Glendale
The most prevalent vehicle ownership categories in Glendale are males with 1 vehicle (142, accounting for 38.8%) and females with 1 vehicle (34, making up 50.7%).
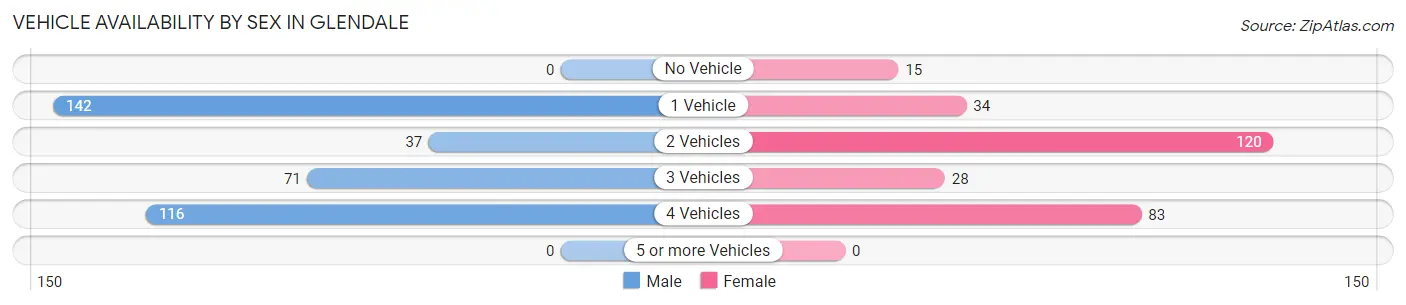
| Vehicles Available | Male | Female |
| No Vehicle | 0 (0.0%) | 15 (5.4%) |
| 1 Vehicle | 142 (38.8%) | 34 (12.1%) |
| 2 Vehicles | 37 (10.1%) | 120 (42.9%) |
| 3 Vehicles | 71 (19.4%) | 28 (10.0%) |
| 4 Vehicles | 116 (31.7%) | 83 (29.6%) |
| 5 or more Vehicles | 0 (0.0%) | 0 (0.0%) |
| Total | 366 (100.0%) | 280 (100.0%) |
Commute Time in Glendale
The most frequently occuring commute durations in Glendale are 15 to 19 minutes (237 commuters, 40.7%), 10 to 14 minutes (213 commuters, 36.6%), and 20 to 24 minutes (66 commuters, 11.3%).
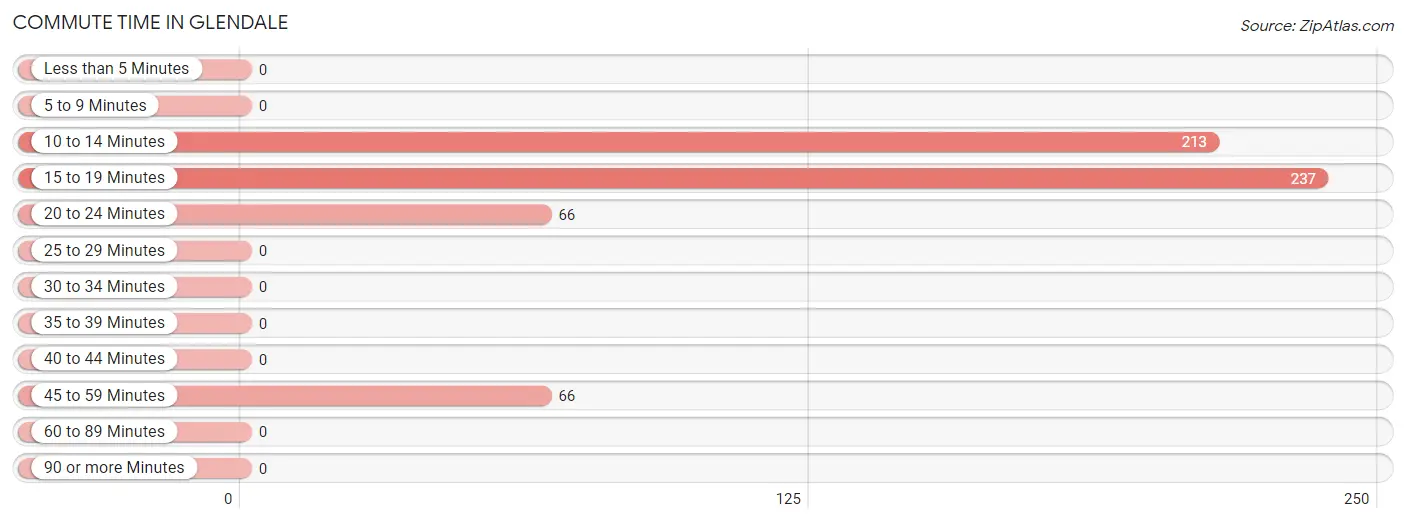
| Commute Time | # Commuters | % Commuters |
| Less than 5 Minutes | 0 | 0.0% |
| 5 to 9 Minutes | 0 | 0.0% |
| 10 to 14 Minutes | 213 | 36.6% |
| 15 to 19 Minutes | 237 | 40.7% |
| 20 to 24 Minutes | 66 | 11.3% |
| 25 to 29 Minutes | 0 | 0.0% |
| 30 to 34 Minutes | 0 | 0.0% |
| 35 to 39 Minutes | 0 | 0.0% |
| 40 to 44 Minutes | 0 | 0.0% |
| 45 to 59 Minutes | 66 | 11.3% |
| 60 to 89 Minutes | 0 | 0.0% |
| 90 or more Minutes | 0 | 0.0% |
Commute Time by Sex in Glendale
The most common commute times in Glendale are 10 to 14 minutes (185 commuters, 56.2%) for males and 15 to 19 minutes (166 commuters, 65.6%) for females.
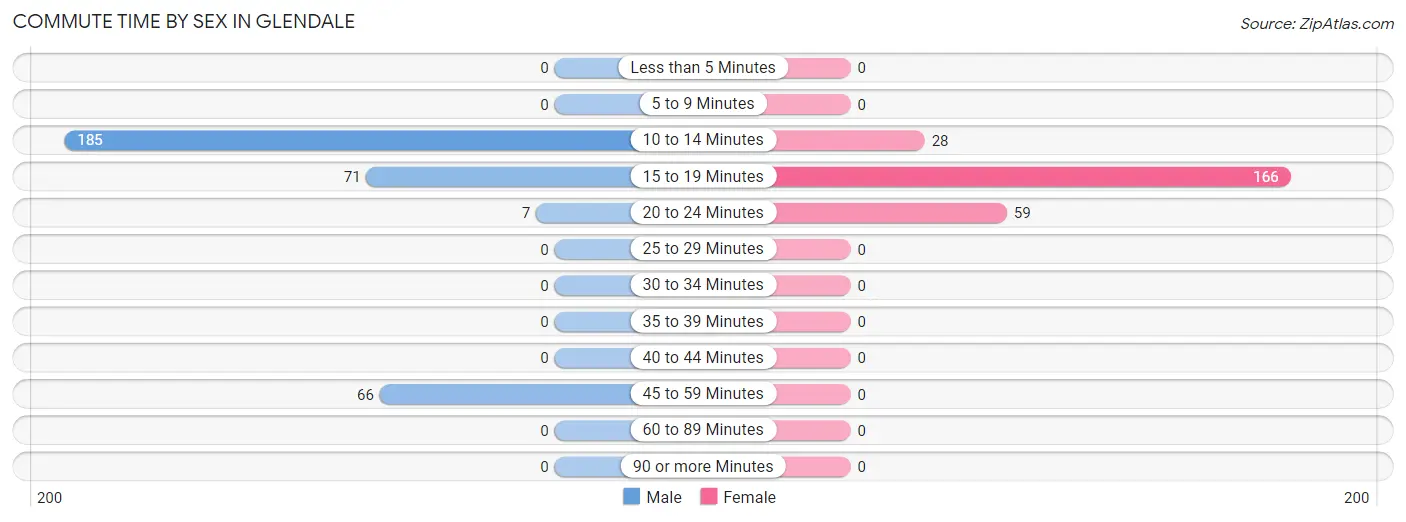
| Commute Time | Male | Female |
| Less than 5 Minutes | 0 (0.0%) | 0 (0.0%) |
| 5 to 9 Minutes | 0 (0.0%) | 0 (0.0%) |
| 10 to 14 Minutes | 185 (56.2%) | 28 (11.1%) |
| 15 to 19 Minutes | 71 (21.6%) | 166 (65.6%) |
| 20 to 24 Minutes | 7 (2.1%) | 59 (23.3%) |
| 25 to 29 Minutes | 0 (0.0%) | 0 (0.0%) |
| 30 to 34 Minutes | 0 (0.0%) | 0 (0.0%) |
| 35 to 39 Minutes | 0 (0.0%) | 0 (0.0%) |
| 40 to 44 Minutes | 0 (0.0%) | 0 (0.0%) |
| 45 to 59 Minutes | 66 (20.1%) | 0 (0.0%) |
| 60 to 89 Minutes | 0 (0.0%) | 0 (0.0%) |
| 90 or more Minutes | 0 (0.0%) | 0 (0.0%) |
Time of Departure to Work by Sex in Glendale
The most frequent times of departure to work in Glendale are 6:00 AM to 6:29 AM (119, 36.2%) for males and 6:30 AM to 6:59 AM (66, 26.1%) for females.
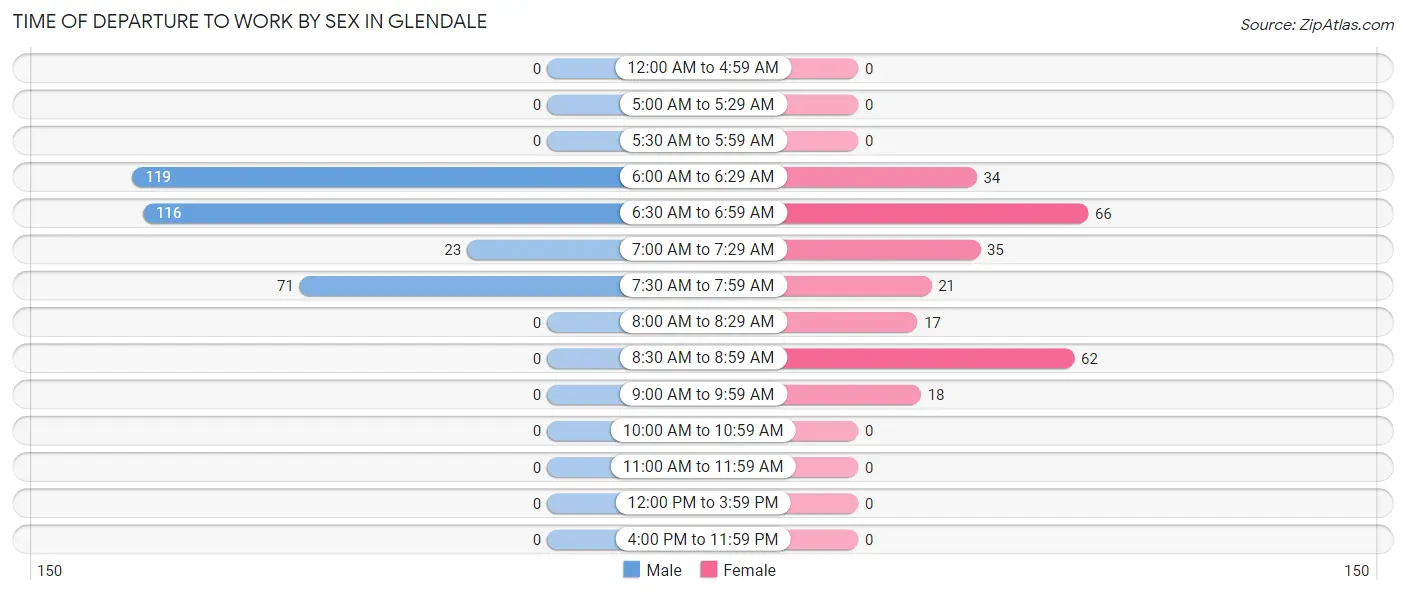
| Time of Departure | Male | Female |
| 12:00 AM to 4:59 AM | 0 (0.0%) | 0 (0.0%) |
| 5:00 AM to 5:29 AM | 0 (0.0%) | 0 (0.0%) |
| 5:30 AM to 5:59 AM | 0 (0.0%) | 0 (0.0%) |
| 6:00 AM to 6:29 AM | 119 (36.2%) | 34 (13.4%) |
| 6:30 AM to 6:59 AM | 116 (35.3%) | 66 (26.1%) |
| 7:00 AM to 7:29 AM | 23 (7.0%) | 35 (13.8%) |
| 7:30 AM to 7:59 AM | 71 (21.6%) | 21 (8.3%) |
| 8:00 AM to 8:29 AM | 0 (0.0%) | 17 (6.7%) |
| 8:30 AM to 8:59 AM | 0 (0.0%) | 62 (24.5%) |
| 9:00 AM to 9:59 AM | 0 (0.0%) | 18 (7.1%) |
| 10:00 AM to 10:59 AM | 0 (0.0%) | 0 (0.0%) |
| 11:00 AM to 11:59 AM | 0 (0.0%) | 0 (0.0%) |
| 12:00 PM to 3:59 PM | 0 (0.0%) | 0 (0.0%) |
| 4:00 PM to 11:59 PM | 0 (0.0%) | 0 (0.0%) |
| Total | 329 (100.0%) | 253 (100.0%) |
Housing Occupancy in Glendale
Occupancy by Ownership in Glendale
Of the total 656 dwellings in Glendale, owner-occupied units account for 415 (63.3%), while renter-occupied units make up 241 (36.7%).
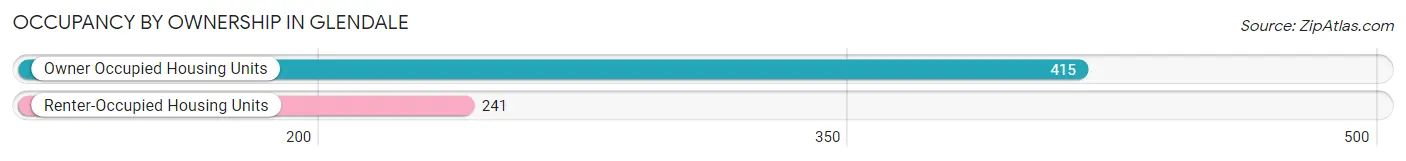
| Occupancy | # Housing Units | % Housing Units |
| Owner Occupied Housing Units | 415 | 63.3% |
| Renter-Occupied Housing Units | 241 | 36.7% |
| Total Occupied Housing Units | 656 | 100.0% |
Occupancy by Household Size in Glendale
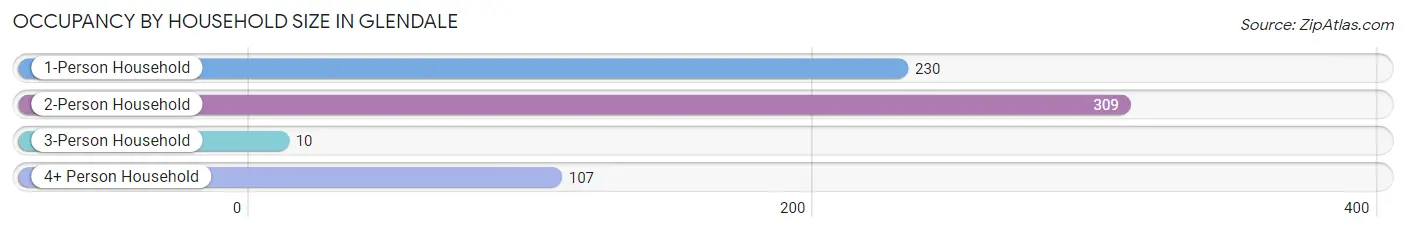
| Household Size | # Housing Units | % Housing Units |
| 1-Person Household | 230 | 35.1% |
| 2-Person Household | 309 | 47.1% |
| 3-Person Household | 10 | 1.5% |
| 4+ Person Household | 107 | 16.3% |
| Total Housing Units | 656 | 100.0% |
Occupancy by Ownership by Household Size in Glendale
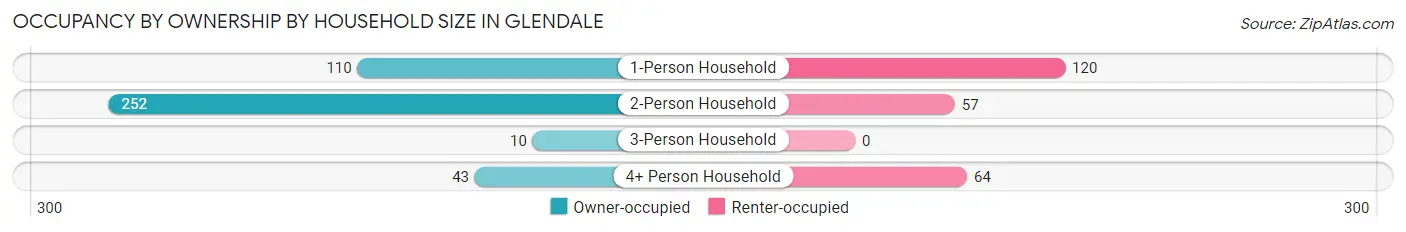
| Household Size | Owner-occupied | Renter-occupied |
| 1-Person Household | 110 (47.8%) | 120 (52.2%) |
| 2-Person Household | 252 (81.6%) | 57 (18.4%) |
| 3-Person Household | 10 (100.0%) | 0 (0.0%) |
| 4+ Person Household | 43 (40.2%) | 64 (59.8%) |
| Total Housing Units | 415 (63.3%) | 241 (36.7%) |
Occupancy by Educational Attainment in Glendale
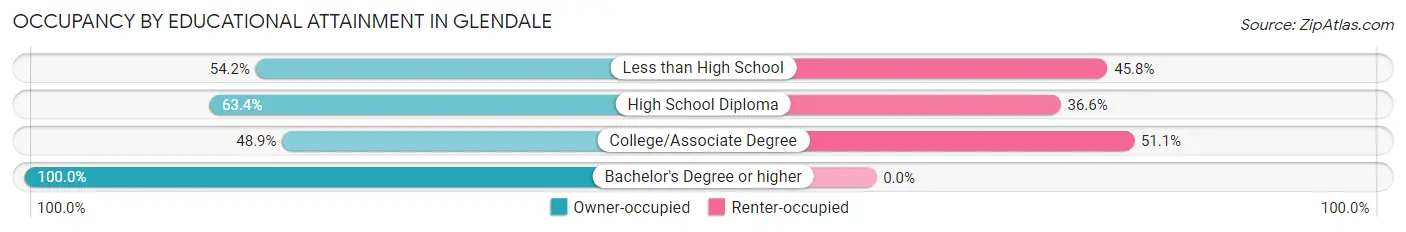
| Household Size | Owner-occupied | Renter-occupied |
| Less than High School | 78 (54.2%) | 66 (45.8%) |
| High School Diploma | 144 (63.4%) | 83 (36.6%) |
| College/Associate Degree | 88 (48.9%) | 92 (51.1%) |
| Bachelor's Degree or higher | 105 (100.0%) | 0 (0.0%) |
Occupancy by Age of Householder in Glendale
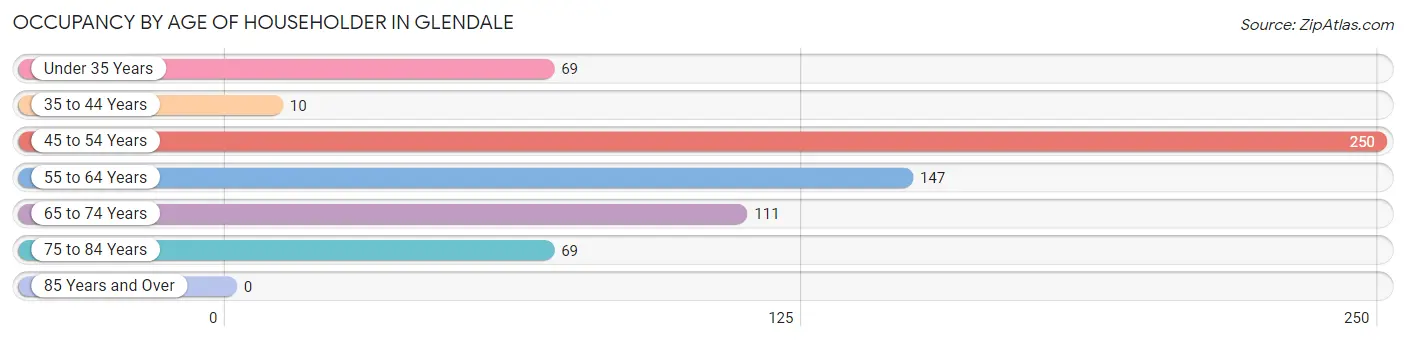
| Age Bracket | # Households | % Households |
| Under 35 Years | 69 | 10.5% |
| 35 to 44 Years | 10 | 1.5% |
| 45 to 54 Years | 250 | 38.1% |
| 55 to 64 Years | 147 | 22.4% |
| 65 to 74 Years | 111 | 16.9% |
| 75 to 84 Years | 69 | 10.5% |
| 85 Years and Over | 0 | 0.0% |
| Total | 656 | 100.0% |
Housing Finances in Glendale
Median Income by Occupancy in Glendale
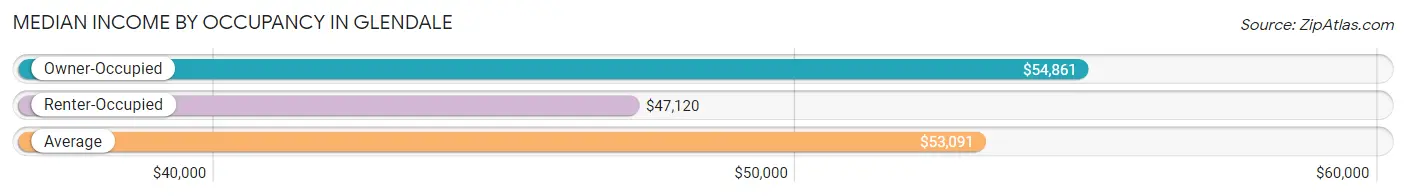
| Occupancy Type | # Households | Median Income |
| Owner-Occupied | 415 (63.3%) | $54,861 |
| Renter-Occupied | 241 (36.7%) | $47,120 |
| Average | 656 (100.0%) | $53,091 |
Occupancy by Householder Income Bracket in Glendale
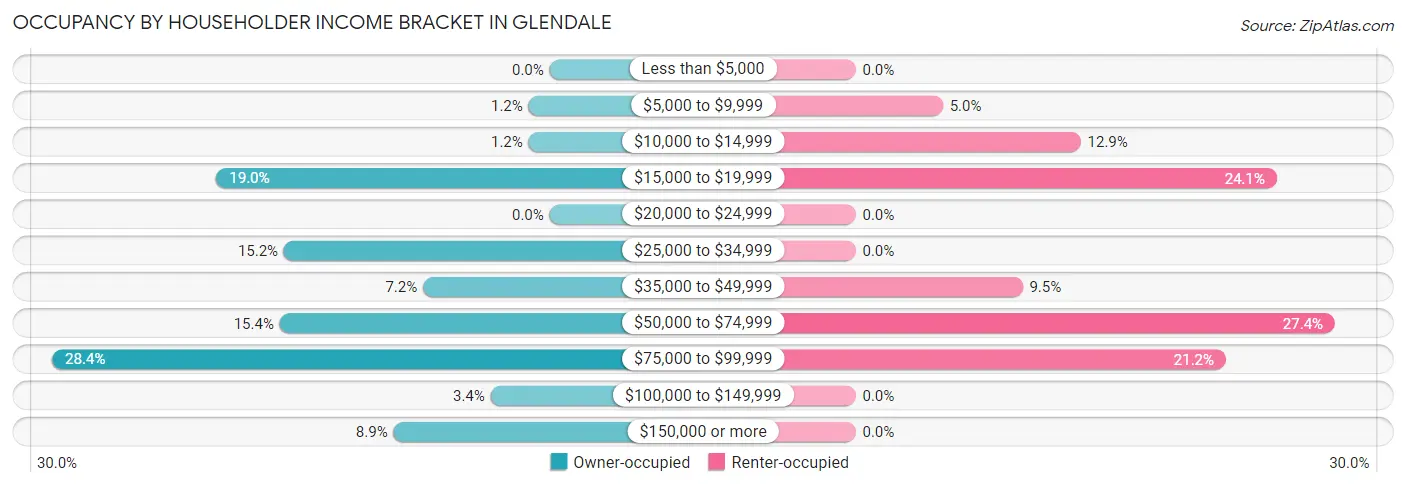
| Income Bracket | Owner-occupied | Renter-occupied |
| Less than $5,000 | 0 (0.0%) | 0 (0.0%) |
| $5,000 to $9,999 | 5 (1.2%) | 12 (5.0%) |
| $10,000 to $14,999 | 5 (1.2%) | 31 (12.9%) |
| $15,000 to $19,999 | 79 (19.0%) | 58 (24.1%) |
| $20,000 to $24,999 | 0 (0.0%) | 0 (0.0%) |
| $25,000 to $34,999 | 63 (15.2%) | 0 (0.0%) |
| $35,000 to $49,999 | 30 (7.2%) | 23 (9.5%) |
| $50,000 to $74,999 | 64 (15.4%) | 66 (27.4%) |
| $75,000 to $99,999 | 118 (28.4%) | 51 (21.2%) |
| $100,000 to $149,999 | 14 (3.4%) | 0 (0.0%) |
| $150,000 or more | 37 (8.9%) | 0 (0.0%) |
| Total | 415 (100.0%) | 241 (100.0%) |
Monthly Housing Cost Tiers in Glendale
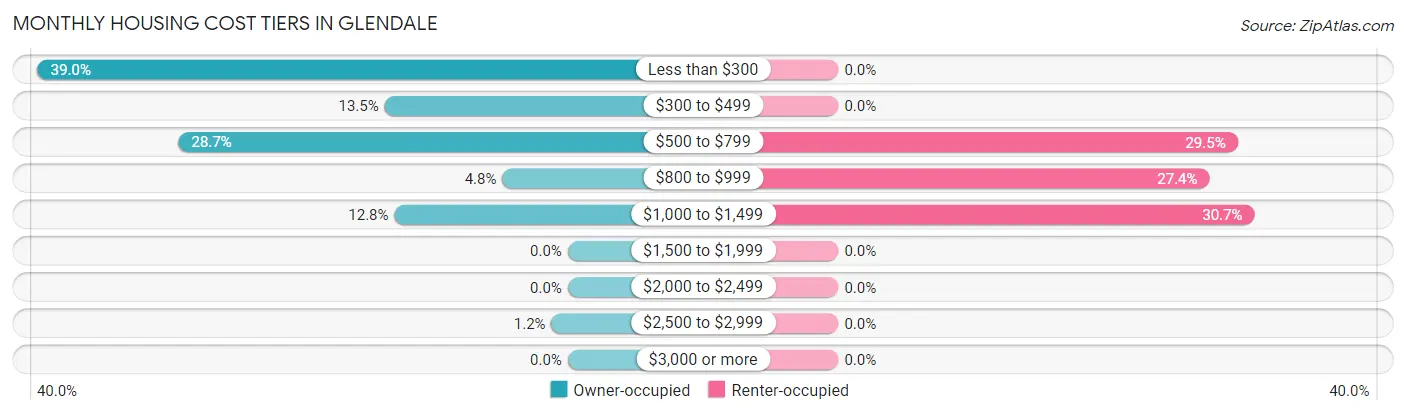
| Monthly Cost | Owner-occupied | Renter-occupied |
| Less than $300 | 162 (39.0%) | 0 (0.0%) |
| $300 to $499 | 56 (13.5%) | 0 (0.0%) |
| $500 to $799 | 119 (28.7%) | 71 (29.5%) |
| $800 to $999 | 20 (4.8%) | 66 (27.4%) |
| $1,000 to $1,499 | 53 (12.8%) | 74 (30.7%) |
| $1,500 to $1,999 | 0 (0.0%) | 0 (0.0%) |
| $2,000 to $2,499 | 0 (0.0%) | 0 (0.0%) |
| $2,500 to $2,999 | 5 (1.2%) | 0 (0.0%) |
| $3,000 or more | 0 (0.0%) | 0 (0.0%) |
| Total | 415 (100.0%) | 241 (100.0%) |
Physical Housing Characteristics in Glendale
Housing Structures in Glendale
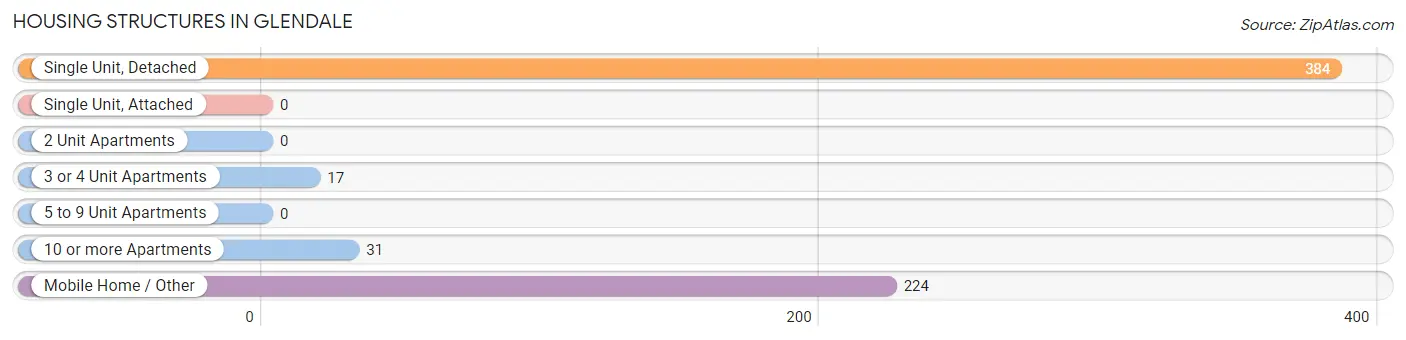
| Structure Type | # Housing Units | % Housing Units |
| Single Unit, Detached | 384 | 58.5% |
| Single Unit, Attached | 0 | 0.0% |
| 2 Unit Apartments | 0 | 0.0% |
| 3 or 4 Unit Apartments | 17 | 2.6% |
| 5 to 9 Unit Apartments | 0 | 0.0% |
| 10 or more Apartments | 31 | 4.7% |
| Mobile Home / Other | 224 | 34.2% |
| Total | 656 | 100.0% |
Housing Structures by Occupancy in Glendale
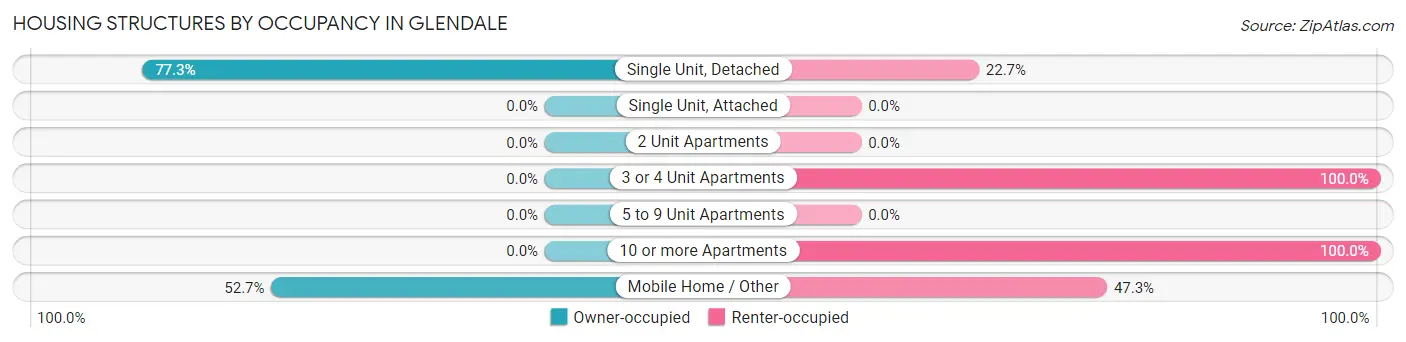
| Structure Type | Owner-occupied | Renter-occupied |
| Single Unit, Detached | 297 (77.3%) | 87 (22.7%) |
| Single Unit, Attached | 0 (0.0%) | 0 (0.0%) |
| 2 Unit Apartments | 0 (0.0%) | 0 (0.0%) |
| 3 or 4 Unit Apartments | 0 (0.0%) | 17 (100.0%) |
| 5 to 9 Unit Apartments | 0 (0.0%) | 0 (0.0%) |
| 10 or more Apartments | 0 (0.0%) | 31 (100.0%) |
| Mobile Home / Other | 118 (52.7%) | 106 (47.3%) |
| Total | 415 (63.3%) | 241 (36.7%) |
Housing Structures by Number of Rooms in Glendale
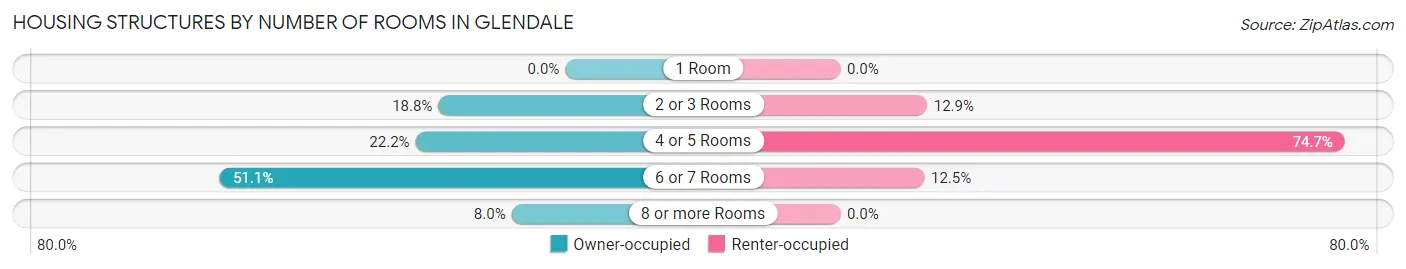
| Number of Rooms | Owner-occupied | Renter-occupied |
| 1 Room | 0 (0.0%) | 0 (0.0%) |
| 2 or 3 Rooms | 78 (18.8%) | 31 (12.9%) |
| 4 or 5 Rooms | 92 (22.2%) | 180 (74.7%) |
| 6 or 7 Rooms | 212 (51.1%) | 30 (12.4%) |
| 8 or more Rooms | 33 (8.0%) | 0 (0.0%) |
| Total | 415 (100.0%) | 241 (100.0%) |
Housing Structure by Heating Type in Glendale
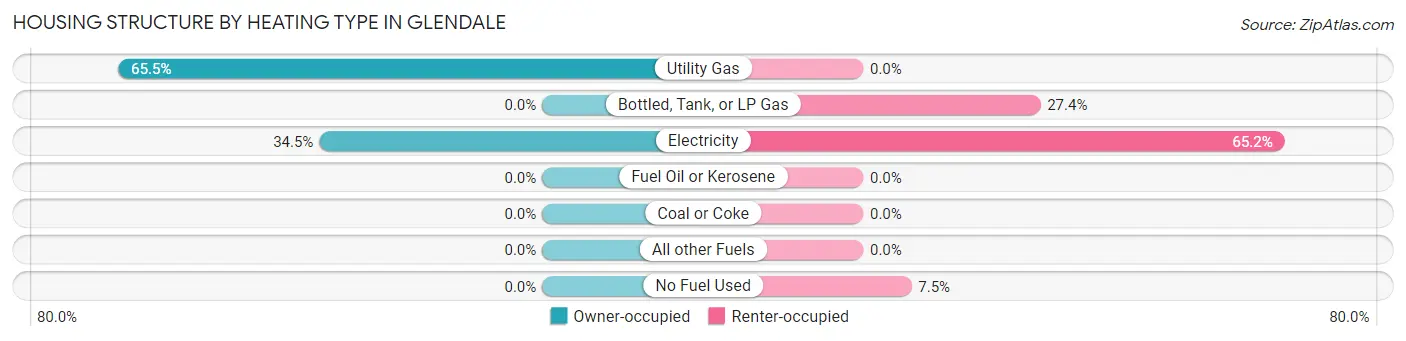
| Heating Type | Owner-occupied | Renter-occupied |
| Utility Gas | 272 (65.5%) | 0 (0.0%) |
| Bottled, Tank, or LP Gas | 0 (0.0%) | 66 (27.4%) |
| Electricity | 143 (34.5%) | 157 (65.1%) |
| Fuel Oil or Kerosene | 0 (0.0%) | 0 (0.0%) |
| Coal or Coke | 0 (0.0%) | 0 (0.0%) |
| All other Fuels | 0 (0.0%) | 0 (0.0%) |
| No Fuel Used | 0 (0.0%) | 18 (7.5%) |
| Total | 415 (100.0%) | 241 (100.0%) |
Household Vehicle Usage in Glendale
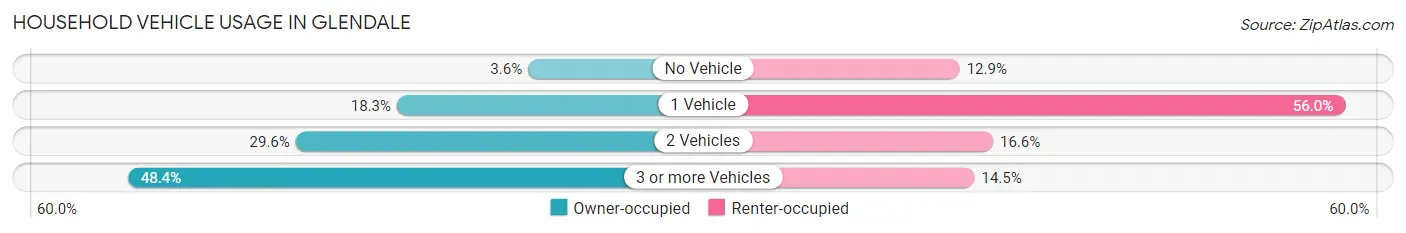
| Vehicles per Household | Owner-occupied | Renter-occupied |
| No Vehicle | 15 (3.6%) | 31 (12.9%) |
| 1 Vehicle | 76 (18.3%) | 135 (56.0%) |
| 2 Vehicles | 123 (29.6%) | 40 (16.6%) |
| 3 or more Vehicles | 201 (48.4%) | 35 (14.5%) |
| Total | 415 (100.0%) | 241 (100.0%) |
Real Estate & Mortgages in Glendale
Real Estate and Mortgage Overview in Glendale
| Characteristic | Without Mortgage | With Mortgage |
| Housing Units | 315 | 100 |
| Median Property Value | - | - |
| Median Household Income | - | - |
| Monthly Housing Costs | $293 | $0 |
| Real Estate Taxes | - | - |
Property Value by Mortgage Status in Glendale
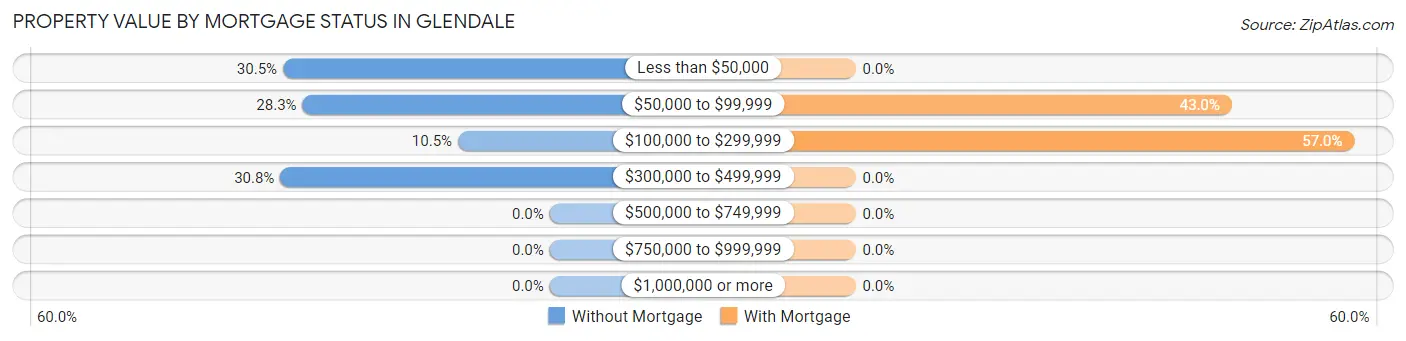
| Property Value | Without Mortgage | With Mortgage |
| Less than $50,000 | 96 (30.5%) | 0 (0.0%) |
| $50,000 to $99,999 | 89 (28.2%) | 43 (43.0%) |
| $100,000 to $299,999 | 33 (10.5%) | 57 (57.0%) |
| $300,000 to $499,999 | 97 (30.8%) | 0 (0.0%) |
| $500,000 to $749,999 | 0 (0.0%) | 0 (0.0%) |
| $750,000 to $999,999 | 0 (0.0%) | 0 (0.0%) |
| $1,000,000 or more | 0 (0.0%) | 0 (0.0%) |
| Total | 315 (100.0%) | 100 (100.0%) |
Household Income by Mortgage Status in Glendale
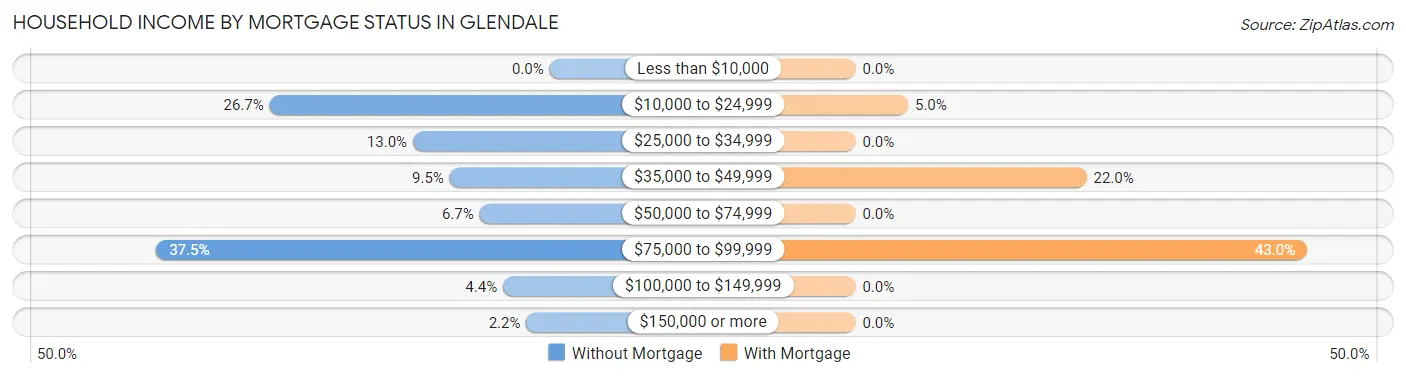
| Household Income | Without Mortgage | With Mortgage |
| Less than $10,000 | 0 (0.0%) | 0 (0.0%) |
| $10,000 to $24,999 | 84 (26.7%) | 5 (5.0%) |
| $25,000 to $34,999 | 41 (13.0%) | 0 (0.0%) |
| $35,000 to $49,999 | 30 (9.5%) | 22 (22.0%) |
| $50,000 to $74,999 | 21 (6.7%) | 0 (0.0%) |
| $75,000 to $99,999 | 118 (37.5%) | 43 (43.0%) |
| $100,000 to $149,999 | 14 (4.4%) | 0 (0.0%) |
| $150,000 or more | 7 (2.2%) | 0 (0.0%) |
| Total | 315 (100.0%) | 100 (100.0%) |
Property Value to Household Income Ratio in Glendale
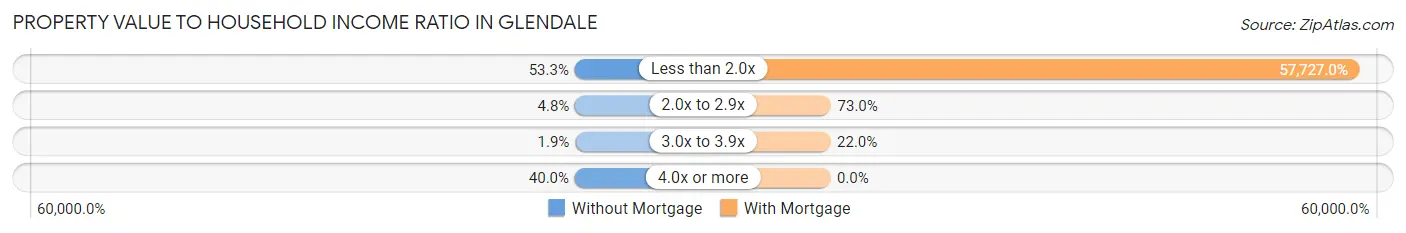
| Value-to-Income Ratio | Without Mortgage | With Mortgage |
| Less than 2.0x | 168 (53.3%) | 57,727 (57,727.0%) |
| 2.0x to 2.9x | 15 (4.8%) | 73 (73.0%) |
| 3.0x to 3.9x | 6 (1.9%) | 22 (22.0%) |
| 4.0x or more | 126 (40.0%) | 0 (0.0%) |
| Total | 315 (100.0%) | 100 (100.0%) |
Real Estate Taxes by Mortgage Status in Glendale
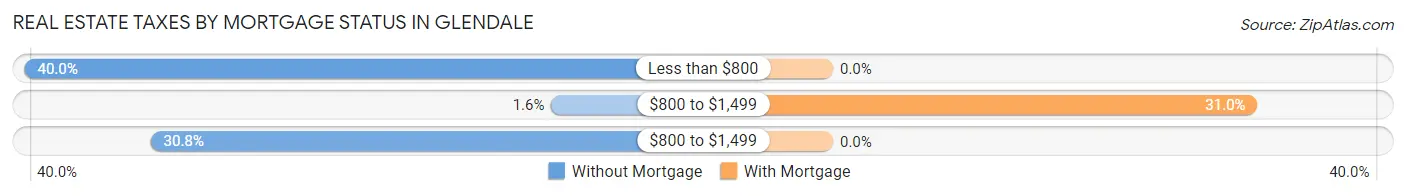
| Property Taxes | Without Mortgage | With Mortgage |
| Less than $800 | 126 (40.0%) | 0 (0.0%) |
| $800 to $1,499 | 5 (1.6%) | 31 (31.0%) |
| $800 to $1,499 | 97 (30.8%) | 0 (0.0%) |
| Total | 315 (100.0%) | 100 (100.0%) |
Health & Disability in Glendale
Health Insurance Coverage by Age in Glendale
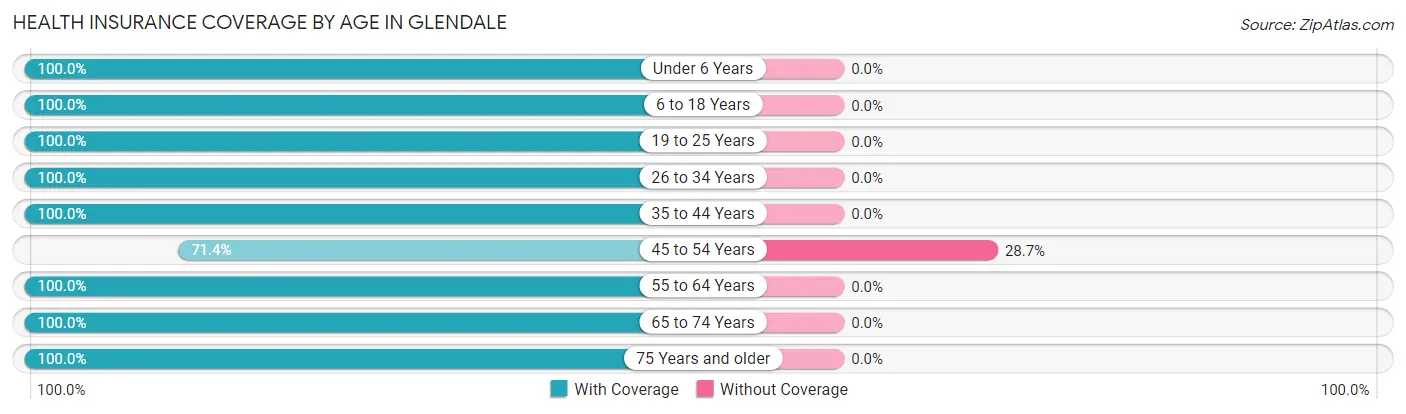
| Age Bracket | With Coverage | Without Coverage |
| Under 6 Years | 203 (100.0%) | 0 (0.0%) |
| 6 to 18 Years | 115 (100.0%) | 0 (0.0%) |
| 19 to 25 Years | 195 (100.0%) | 0 (0.0%) |
| 26 to 34 Years | 101 (100.0%) | 0 (0.0%) |
| 35 to 44 Years | 60 (100.0%) | 0 (0.0%) |
| 45 to 54 Years | 264 (71.4%) | 106 (28.6%) |
| 55 to 64 Years | 236 (100.0%) | 0 (0.0%) |
| 65 to 74 Years | 128 (100.0%) | 0 (0.0%) |
| 75 Years and older | 106 (100.0%) | 0 (0.0%) |
| Total | 1,408 (93.0%) | 106 (7.0%) |
Health Insurance Coverage by Citizenship Status in Glendale
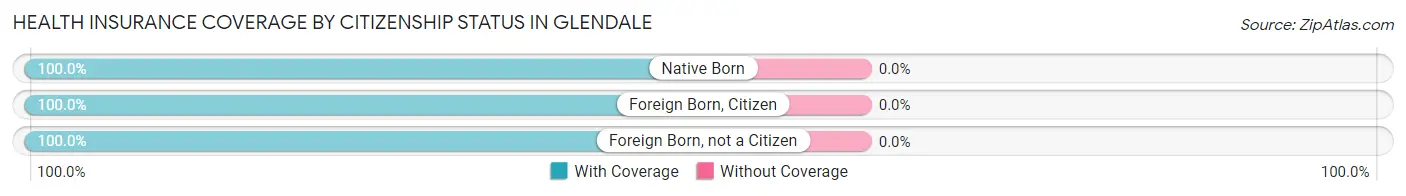
| Citizenship Status | With Coverage | Without Coverage |
| Native Born | 203 (100.0%) | 0 (0.0%) |
| Foreign Born, Citizen | 115 (100.0%) | 0 (0.0%) |
| Foreign Born, not a Citizen | 195 (100.0%) | 0 (0.0%) |
Health Insurance Coverage by Household Income in Glendale
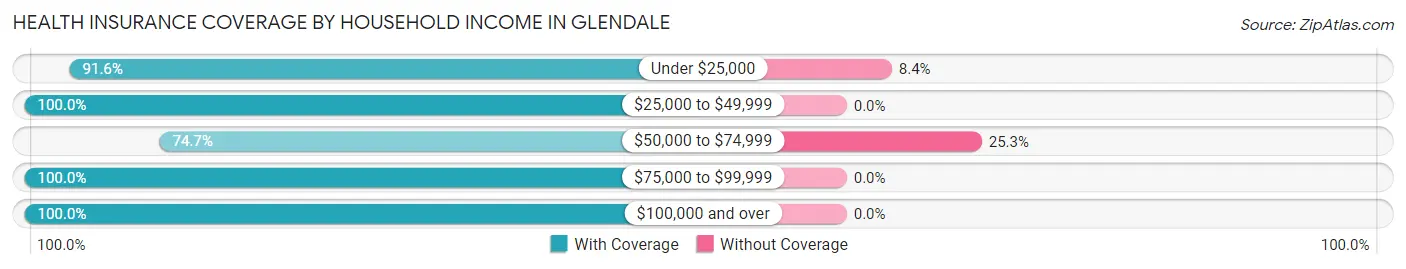
| Household Income | With Coverage | Without Coverage |
| Under $25,000 | 434 (91.6%) | 40 (8.4%) |
| $25,000 to $49,999 | 224 (100.0%) | 0 (0.0%) |
| $50,000 to $74,999 | 195 (74.7%) | 66 (25.3%) |
| $75,000 to $99,999 | 451 (100.0%) | 0 (0.0%) |
| $100,000 and over | 104 (100.0%) | 0 (0.0%) |
Public vs Private Health Insurance Coverage by Age in Glendale
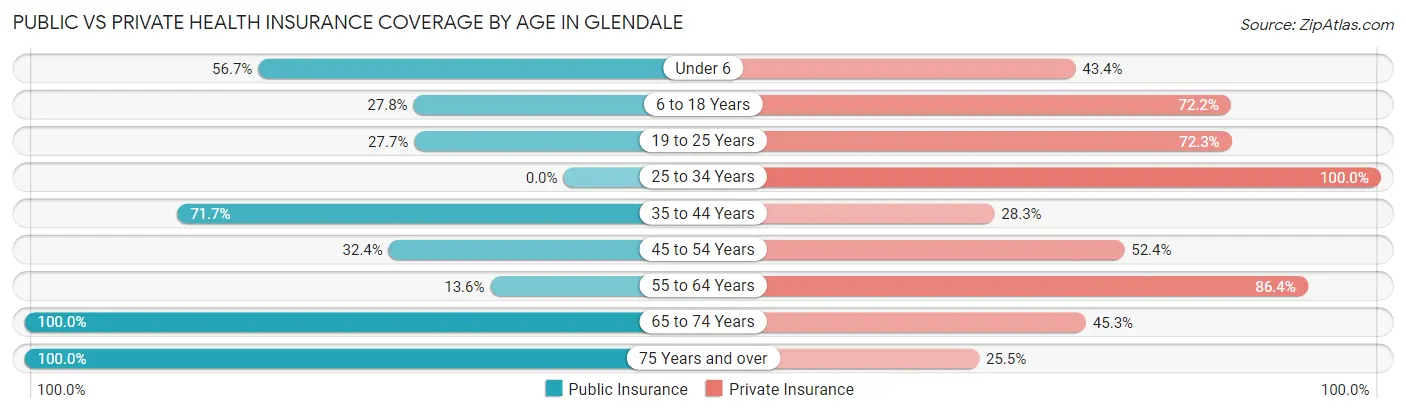
| Age Bracket | Public Insurance | Private Insurance |
| Under 6 | 115 (56.7%) | 88 (43.3%) |
| 6 to 18 Years | 32 (27.8%) | 83 (72.2%) |
| 19 to 25 Years | 54 (27.7%) | 141 (72.3%) |
| 25 to 34 Years | 0 (0.0%) | 101 (100.0%) |
| 35 to 44 Years | 43 (71.7%) | 17 (28.3%) |
| 45 to 54 Years | 120 (32.4%) | 194 (52.4%) |
| 55 to 64 Years | 32 (13.6%) | 204 (86.4%) |
| 65 to 74 Years | 128 (100.0%) | 58 (45.3%) |
| 75 Years and over | 106 (100.0%) | 27 (25.5%) |
| Total | 630 (41.6%) | 913 (60.3%) |
Disability Status by Sex by Age in Glendale
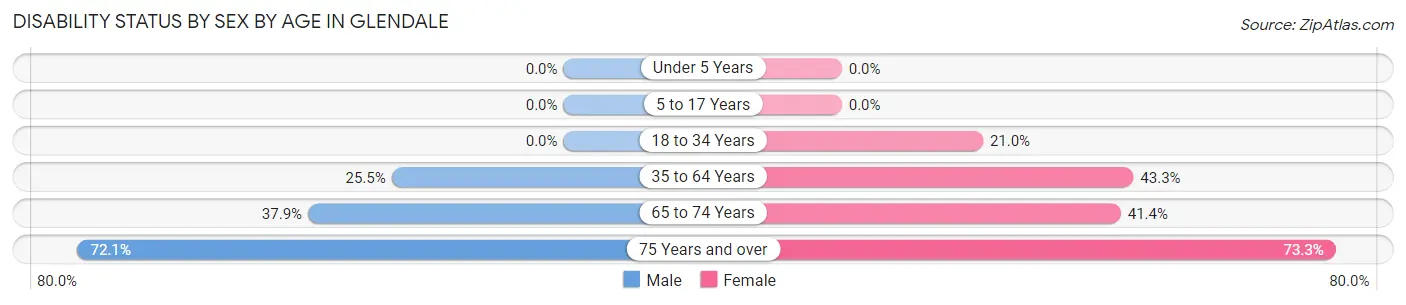
| Age Bracket | Male | Female |
| Under 5 Years | 0 (0.0%) | 0 (0.0%) |
| 5 to 17 Years | 0 (0.0%) | 0 (0.0%) |
| 18 to 34 Years | 0 (0.0%) | 35 (21.0%) |
| 35 to 64 Years | 88 (25.5%) | 139 (43.3%) |
| 65 to 74 Years | 22 (37.9%) | 29 (41.4%) |
| 75 Years and over | 44 (72.1%) | 33 (73.3%) |
Disability Class by Sex by Age in Glendale
Disability Class: Hearing Difficulty
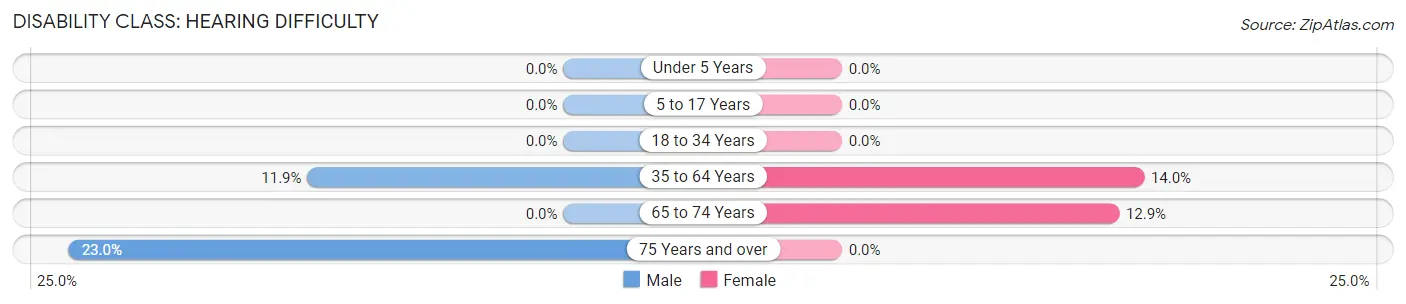
| Age Bracket | Male | Female |
| Under 5 Years | 0 (0.0%) | 0 (0.0%) |
| 5 to 17 Years | 0 (0.0%) | 0 (0.0%) |
| 18 to 34 Years | 0 (0.0%) | 0 (0.0%) |
| 35 to 64 Years | 41 (11.9%) | 45 (14.0%) |
| 65 to 74 Years | 0 (0.0%) | 9 (12.9%) |
| 75 Years and over | 14 (23.0%) | 0 (0.0%) |
Disability Class: Vision Difficulty
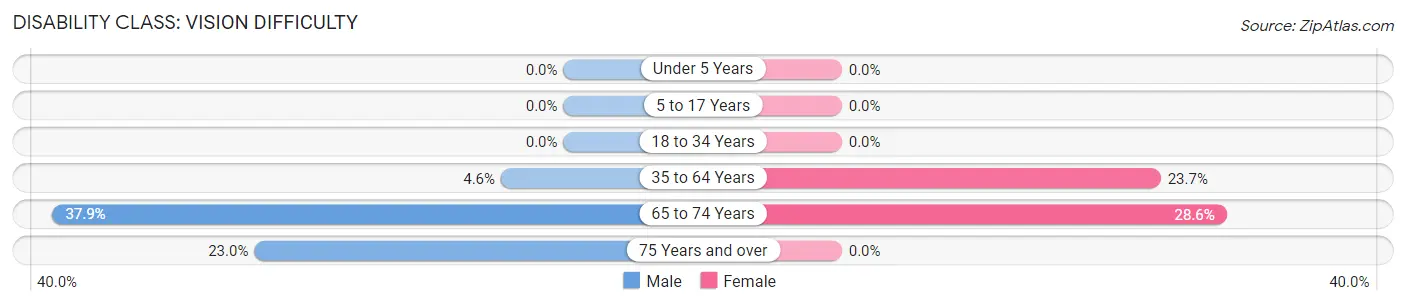
| Age Bracket | Male | Female |
| Under 5 Years | 0 (0.0%) | 0 (0.0%) |
| 5 to 17 Years | 0 (0.0%) | 0 (0.0%) |
| 18 to 34 Years | 0 (0.0%) | 0 (0.0%) |
| 35 to 64 Years | 16 (4.6%) | 76 (23.7%) |
| 65 to 74 Years | 22 (37.9%) | 20 (28.6%) |
| 75 Years and over | 14 (23.0%) | 0 (0.0%) |
Disability Class: Cognitive Difficulty
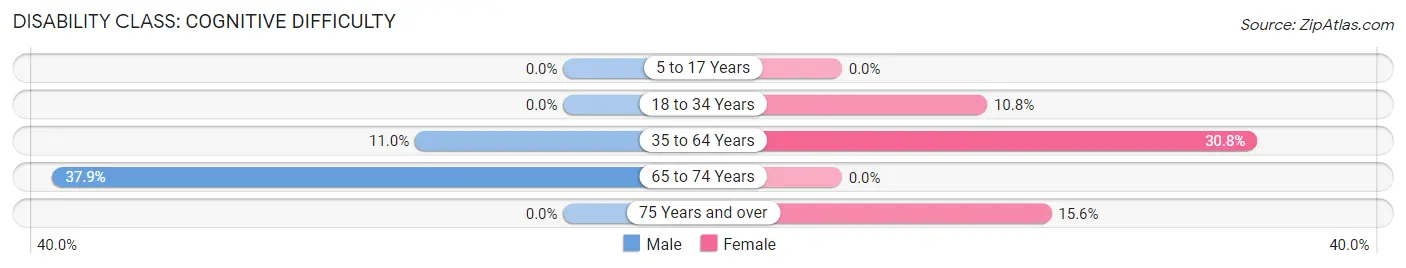
| Age Bracket | Male | Female |
| 5 to 17 Years | 0 (0.0%) | 0 (0.0%) |
| 18 to 34 Years | 0 (0.0%) | 18 (10.8%) |
| 35 to 64 Years | 38 (11.0%) | 99 (30.8%) |
| 65 to 74 Years | 22 (37.9%) | 0 (0.0%) |
| 75 Years and over | 0 (0.0%) | 7 (15.6%) |
Disability Class: Ambulatory Difficulty
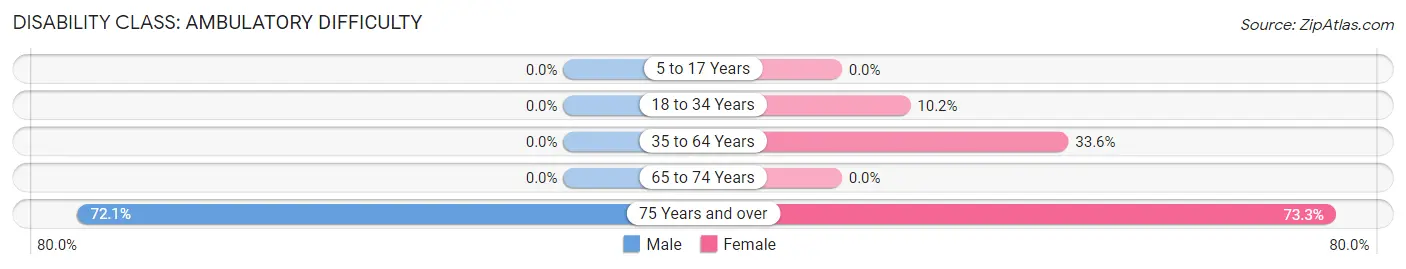
| Age Bracket | Male | Female |
| 5 to 17 Years | 0 (0.0%) | 0 (0.0%) |
| 18 to 34 Years | 0 (0.0%) | 17 (10.2%) |
| 35 to 64 Years | 0 (0.0%) | 108 (33.6%) |
| 65 to 74 Years | 0 (0.0%) | 0 (0.0%) |
| 75 Years and over | 44 (72.1%) | 33 (73.3%) |
Disability Class: Self-Care Difficulty
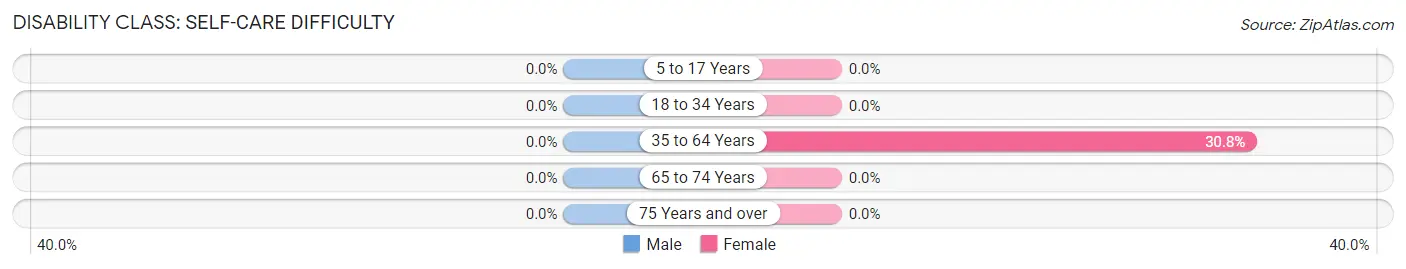
| Age Bracket | Male | Female |
| 5 to 17 Years | 0 (0.0%) | 0 (0.0%) |
| 18 to 34 Years | 0 (0.0%) | 0 (0.0%) |
| 35 to 64 Years | 0 (0.0%) | 99 (30.8%) |
| 65 to 74 Years | 0 (0.0%) | 0 (0.0%) |
| 75 Years and over | 0 (0.0%) | 0 (0.0%) |
Technology Access in Glendale
Computing Device Access in Glendale
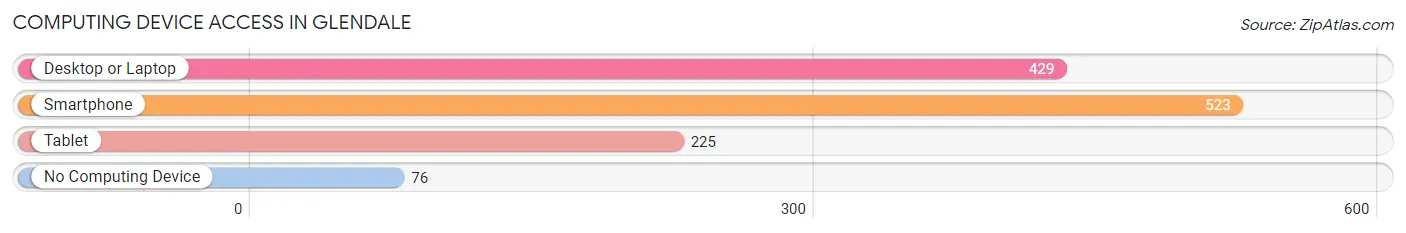
| Device Type | # Households | % Households |
| Desktop or Laptop | 429 | 65.4% |
| Smartphone | 523 | 79.7% |
| Tablet | 225 | 34.3% |
| No Computing Device | 76 | 11.6% |
| Total | 656 | 100.0% |
Internet Access in Glendale
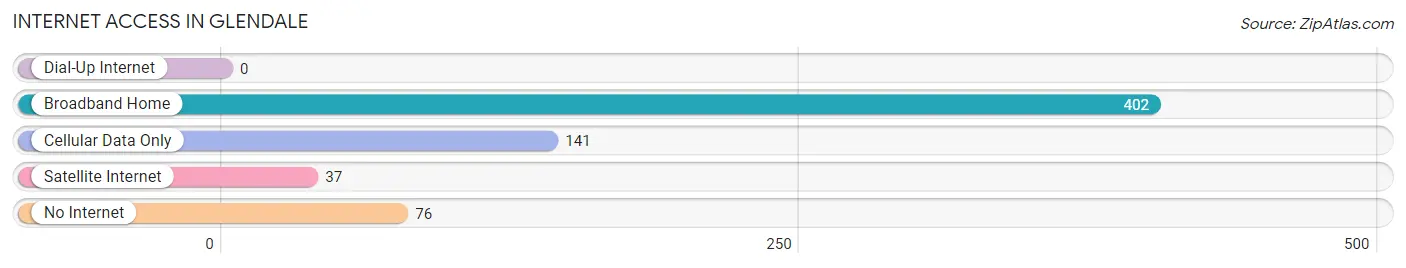
| Internet Type | # Households | % Households |
| Dial-Up Internet | 0 | 0.0% |
| Broadband Home | 402 | 61.3% |
| Cellular Data Only | 141 | 21.5% |
| Satellite Internet | 37 | 5.6% |
| No Internet | 76 | 11.6% |
| Total | 656 | 100.0% |
Glendale Summary
Glendale is a small town located in the state of Mississippi, in the United States of America. It is situated in the northern part of the state, in the county of Hinds. The town has a population of around 1,000 people, according to the 2010 census.
Geography
Glendale is located in the northern part of Mississippi, in the county of Hinds. It is situated at an elevation of around 200 feet above sea level. The town is located on the banks of the Big Black River, which is a tributary of the Mississippi River. The town is surrounded by a number of small towns and villages, including Raymond, Bolton, and Edwards. The nearest major city is Jackson, which is located around 25 miles to the south.
The climate in Glendale is humid subtropical, with hot and humid summers and mild winters. The average annual temperature is around 70 degrees Fahrenheit, with the average high in the summer months reaching around 90 degrees Fahrenheit. The average low in the winter months is around 40 degrees Fahrenheit.
History
Glendale was founded in 1837 by a group of settlers from Tennessee. The town was originally known as “Glendale Station”, and was a stop on the Mississippi Central Railroad. The town was officially incorporated in 1845, and the name was changed to Glendale.
The town grew slowly over the years, and by the early 1900s, it had a population of around 500 people. The town was home to a number of businesses, including a sawmill, a gristmill, and a cotton gin. The town also had a number of churches, including the Glendale Methodist Church, which was founded in 1845.
The town was largely unaffected by the Civil War, and the population continued to grow throughout the late 19th and early 20th centuries. The town was home to a number of businesses, including a general store, a blacksmith shop, and a cotton gin.
Economy
The economy of Glendale is largely based on agriculture. The town is home to a number of farms, which produce a variety of crops, including corn, soybeans, cotton, and hay. The town is also home to a number of small businesses, including a grocery store, a hardware store, and a restaurant.
The town is also home to a number of manufacturing companies, including a furniture factory and a woodworking shop. The town is also home to a number of service-based businesses, including a barber shop, a beauty salon, and a car repair shop.
Demographics
According to the 2010 census, the population of Glendale was 1,000 people. The racial makeup of the town was 97.2% White, 0.7% African American, 0.3% Native American, 0.2% Asian, and 1.6% from other races. The median household income was $31,250, and the median family income was $37,500.
Conclusion
Glendale is a small town located in the northern part of Mississippi, in the county of Hinds. The town has a population of around 1,000 people, and the economy is largely based on agriculture. The town is home to a number of small businesses, and the racial makeup of the town is predominantly White. The median household income is around $31,250, and the median family income is around $37,500.
Common Questions
What is Per Capita Income in Glendale?
Per Capita income in Glendale is $38,415.
What is the Median Family Income in Glendale?
Median Family Income in Glendale is $61,083.
What is the Median Household income in Glendale?
Median Household Income in Glendale is $53,091.
What is Income or Wage Gap in Glendale?
Income or Wage Gap in Glendale is 27.2%.
Women in Glendale earn 72.8 cents for every dollar earned by a man.
What is Inequality or Gini Index in Glendale?
Inequality or Gini Index in Glendale is 0.59.
What is the Total Population of Glendale?
Total Population of Glendale is 1,514.
What is the Total Male Population of Glendale?
Total Male Population of Glendale is 720.
What is the Total Female Population of Glendale?
Total Female Population of Glendale is 794.
What is the Ratio of Males per 100 Females in Glendale?
There are 90.68 Males per 100 Females in Glendale.
What is the Ratio of Females per 100 Males in Glendale?
There are 110.28 Females per 100 Males in Glendale.
What is the Median Population Age in Glendale?
Median Population Age in Glendale is 48.8 Years.
What is the Average Family Size in Glendale
Average Family Size in Glendale is 2.9 People.
What is the Average Household Size in Glendale
Average Household Size in Glendale is 2.3 People.
How Large is the Labor Force in Glendale?
There are 682 People in the Labor Forcein in Glendale.
What is the Percentage of People in the Labor Force in Glendale?
55.7% of People are in the Labor Force in Glendale.
What is the Unemployment Rate in Glendale?
Unemployment Rate in Glendale is 5.3%.