New Houlka, MS Map & Demographics
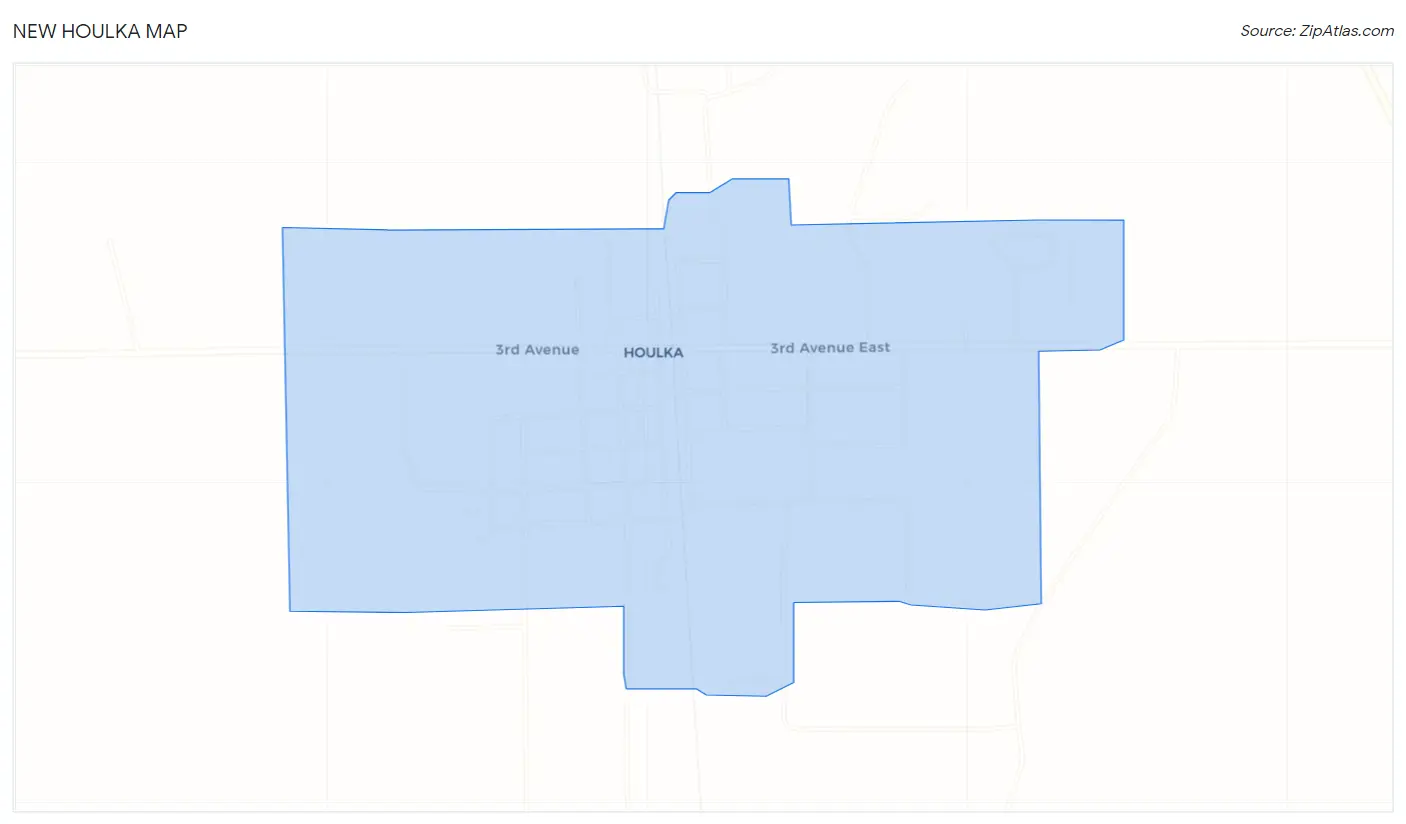
New Houlka Map
New Houlka Overview
$17,555
PER CAPITA INCOME
$45,375
AVG FAMILY INCOME
$43,750
AVG HOUSEHOLD INCOME
63.4%
WAGE / INCOME GAP [ % ]
36.6¢/ $1
WAGE / INCOME GAP [ $ ]
$13,481
FAMILY INCOME DEFICIT
0.37
INEQUALITY / GINI INDEX
564
TOTAL POPULATION
278
MALE POPULATION
286
FEMALE POPULATION
97.20
MALES / 100 FEMALES
102.88
FEMALES / 100 MALES
27.0
MEDIAN AGE
3.4
AVG FAMILY SIZE
3.1
AVG HOUSEHOLD SIZE
244
LABOR FORCE [ PEOPLE ]
60.2%
PERCENT IN LABOR FORCE
10.7%
UNEMPLOYMENT RATE
Income in New Houlka
Income Overview in New Houlka
Per Capita Income in New Houlka is $17,555, while median incomes of families and households are $45,375 and $43,750 respectively.
| Characteristic | Number | Measure |
| Per Capita Income | 564 | $17,555 |
| Median Family Income | 149 | $45,375 |
| Mean Family Income | 149 | $47,662 |
| Median Household Income | 184 | $43,750 |
| Mean Household Income | 184 | $46,549 |
| Income Deficit | 149 | $13,481 |
| Wage / Income Gap (%) | 564 | 63.38% |
| Wage / Income Gap ($) | 564 | 36.62¢ per $1 |
| Gini / Inequality Index | 564 | 0.37 |
Earnings by Sex in New Houlka
Average Earnings in New Houlka are $24,375, $45,833 for men and $16,786 for women, a difference of 63.4%.
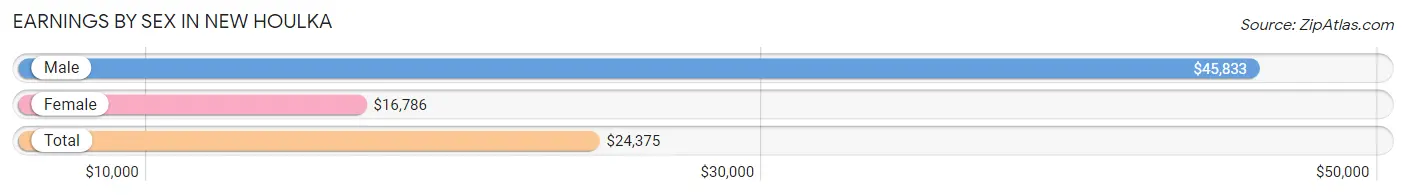
| Sex | Number | Average Earnings |
| Male | 104 (44.1%) | $45,833 |
| Female | 132 (55.9%) | $16,786 |
| Total | 236 (100.0%) | $24,375 |
Earnings by Sex by Income Bracket in New Houlka
The most common earnings brackets in New Houlka are $55,000 to $64,999 for men (21 | 20.2%) and $12,500 to $14,999 for women (28 | 21.2%).
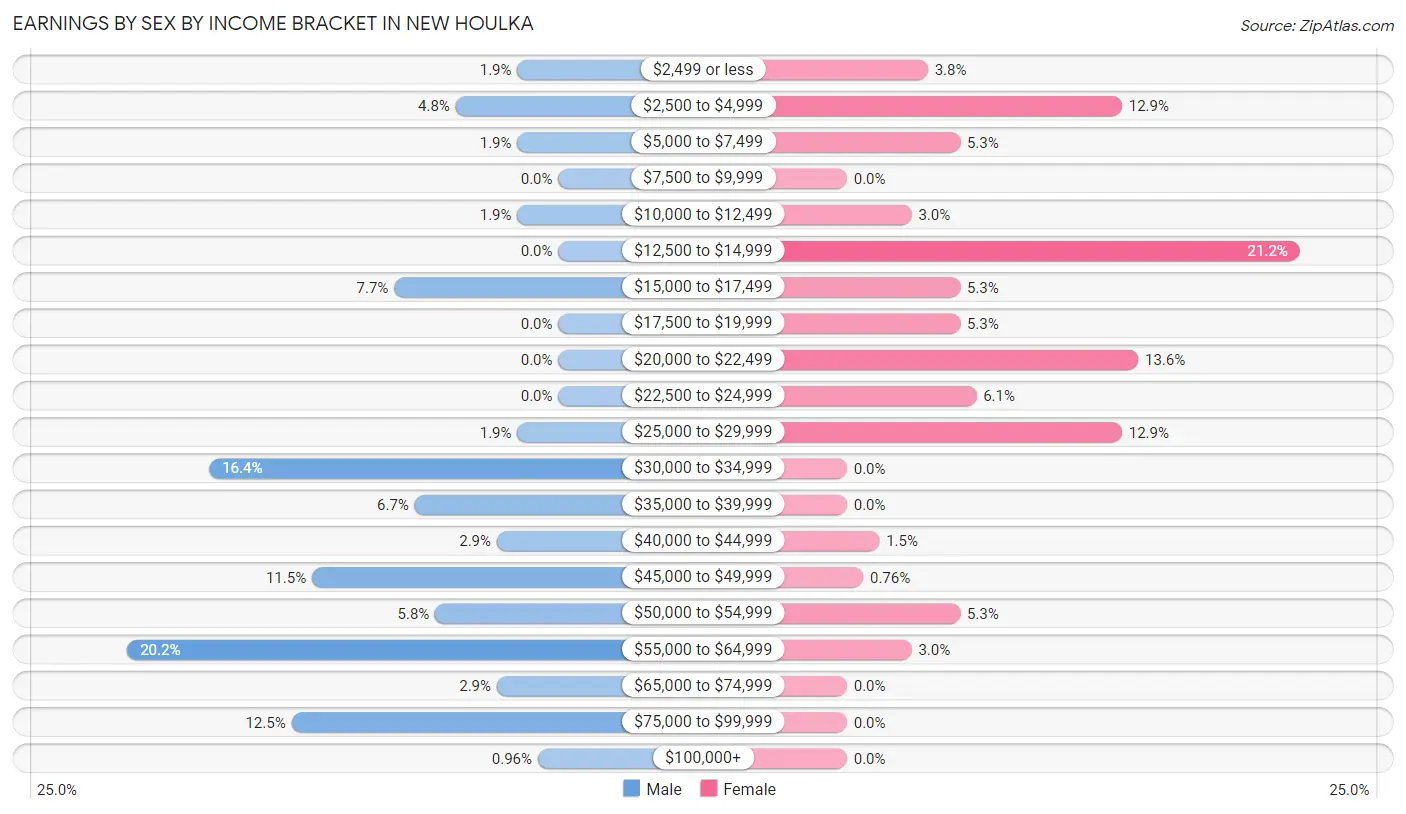
| Income | Male | Female |
| $2,499 or less | 2 (1.9%) | 5 (3.8%) |
| $2,500 to $4,999 | 5 (4.8%) | 17 (12.9%) |
| $5,000 to $7,499 | 2 (1.9%) | 7 (5.3%) |
| $7,500 to $9,999 | 0 (0.0%) | 0 (0.0%) |
| $10,000 to $12,499 | 2 (1.9%) | 4 (3.0%) |
| $12,500 to $14,999 | 0 (0.0%) | 28 (21.2%) |
| $15,000 to $17,499 | 8 (7.7%) | 7 (5.3%) |
| $17,500 to $19,999 | 0 (0.0%) | 7 (5.3%) |
| $20,000 to $22,499 | 0 (0.0%) | 18 (13.6%) |
| $22,500 to $24,999 | 0 (0.0%) | 8 (6.1%) |
| $25,000 to $29,999 | 2 (1.9%) | 17 (12.9%) |
| $30,000 to $34,999 | 17 (16.4%) | 0 (0.0%) |
| $35,000 to $39,999 | 7 (6.7%) | 0 (0.0%) |
| $40,000 to $44,999 | 3 (2.9%) | 2 (1.5%) |
| $45,000 to $49,999 | 12 (11.5%) | 1 (0.8%) |
| $50,000 to $54,999 | 6 (5.8%) | 7 (5.3%) |
| $55,000 to $64,999 | 21 (20.2%) | 4 (3.0%) |
| $65,000 to $74,999 | 3 (2.9%) | 0 (0.0%) |
| $75,000 to $99,999 | 13 (12.5%) | 0 (0.0%) |
| $100,000+ | 1 (1.0%) | 0 (0.0%) |
| Total | 104 (100.0%) | 132 (100.0%) |
Earnings by Sex by Educational Attainment in New Houlka
Average earnings in New Houlka are $45,938 for men and $16,667 for women, a difference of 63.7%. Men with an educational attainment of high school diploma enjoy the highest average annual earnings of $55,066, while those with less than high school education earn the least with $33,594. Women with an educational attainment of graduate degree earn the most with the average annual earnings of $52,500, while those with high school diploma education have the smallest earnings of $13,894.
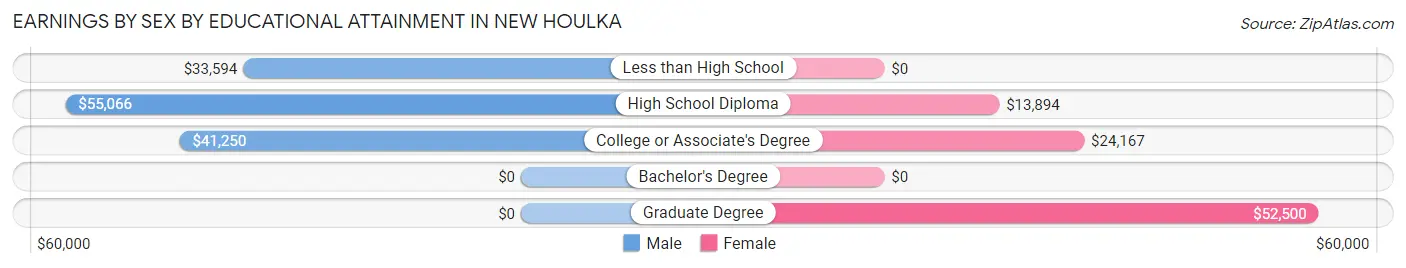
| Educational Attainment | Male Income | Female Income |
| Less than High School | $33,594 | $0 |
| High School Diploma | $55,066 | $13,894 |
| College or Associate's Degree | $41,250 | $24,167 |
| Bachelor's Degree | - | - |
| Graduate Degree | - | - |
| Total | $45,938 | $16,667 |
Family Income in New Houlka
Family Income Brackets in New Houlka
According to the New Houlka family income data, there are 38 families falling into the $50,000 to $74,999 income range, which is the most common income bracket and makes up 25.5% of all families.
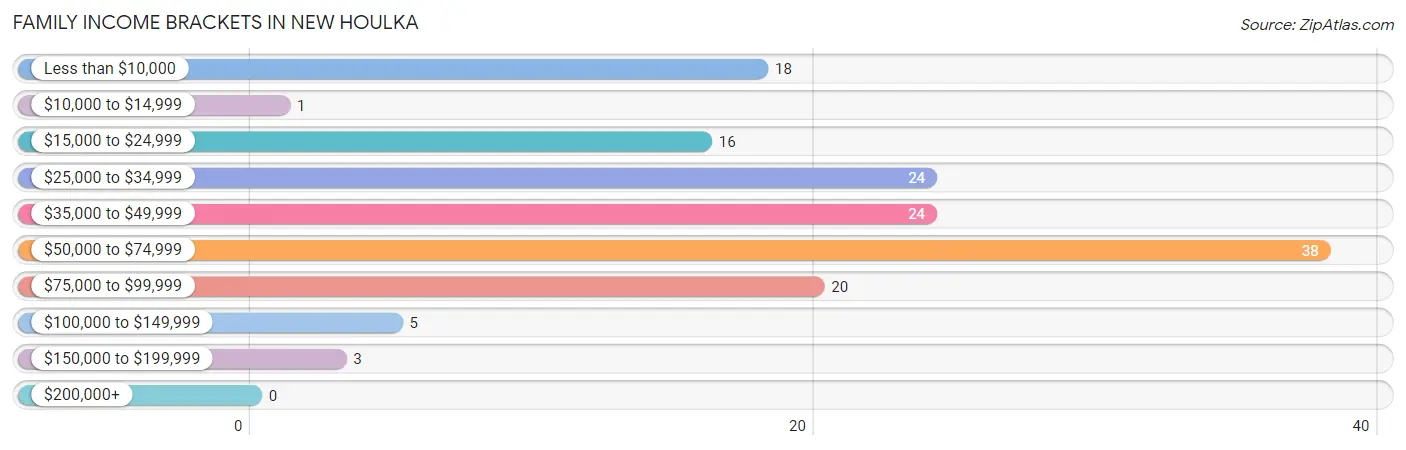
| Income Bracket | # Families | % Families |
| Less than $10,000 | 18 | 12.1% |
| $10,000 to $14,999 | 1 | 0.7% |
| $15,000 to $24,999 | 16 | 10.7% |
| $25,000 to $34,999 | 24 | 16.1% |
| $35,000 to $49,999 | 24 | 16.1% |
| $50,000 to $74,999 | 38 | 25.5% |
| $75,000 to $99,999 | 20 | 13.4% |
| $100,000 to $149,999 | 5 | 3.4% |
| $150,000 to $199,999 | 3 | 2.0% |
| $200,000+ | 0 | 0.0% |
Family Income by Famaliy Size in New Houlka
3-person families (19 | 12.8%) account for the highest median family income in New Houlka with $75,125 per family, while 2-person families (83 | 55.7%) have the highest median income of $25,938 per family member.
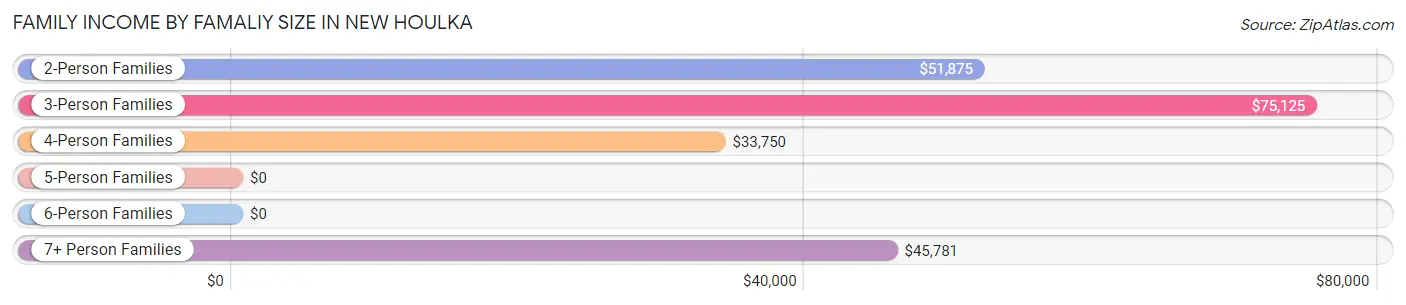
| Income Bracket | # Families | Median Income |
| 2-Person Families | 83 (55.7%) | $51,875 |
| 3-Person Families | 19 (12.8%) | $75,125 |
| 4-Person Families | 28 (18.8%) | $33,750 |
| 5-Person Families | 2 (1.3%) | $0 |
| 6-Person Families | 6 (4.0%) | $0 |
| 7+ Person Families | 11 (7.4%) | $45,781 |
| Total | 149 (100.0%) | $45,375 |
Family Income by Number of Earners in New Houlka
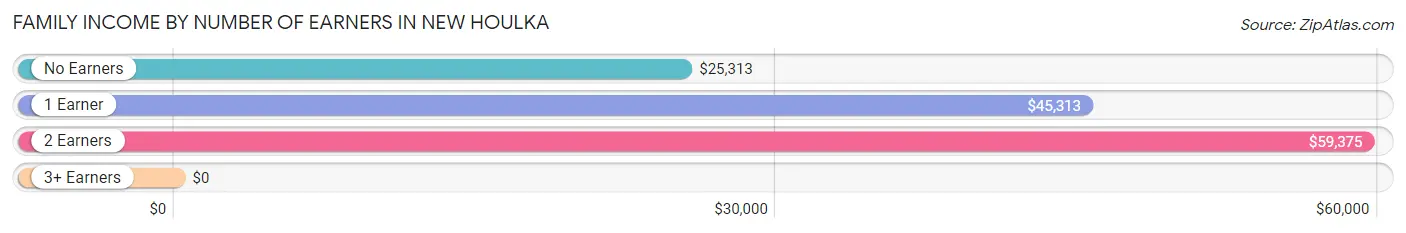
| Number of Earners | # Families | Median Income |
| No Earners | 36 (24.2%) | $25,313 |
| 1 Earner | 70 (47.0%) | $45,313 |
| 2 Earners | 32 (21.5%) | $59,375 |
| 3+ Earners | 11 (7.4%) | $0 |
| Total | 149 (100.0%) | $45,375 |
Household Income in New Houlka
Household Income Brackets in New Houlka
With 47 households falling in the category, the $50,000 to $74,999 income range is the most frequent in New Houlka, accounting for 25.5% of all households.
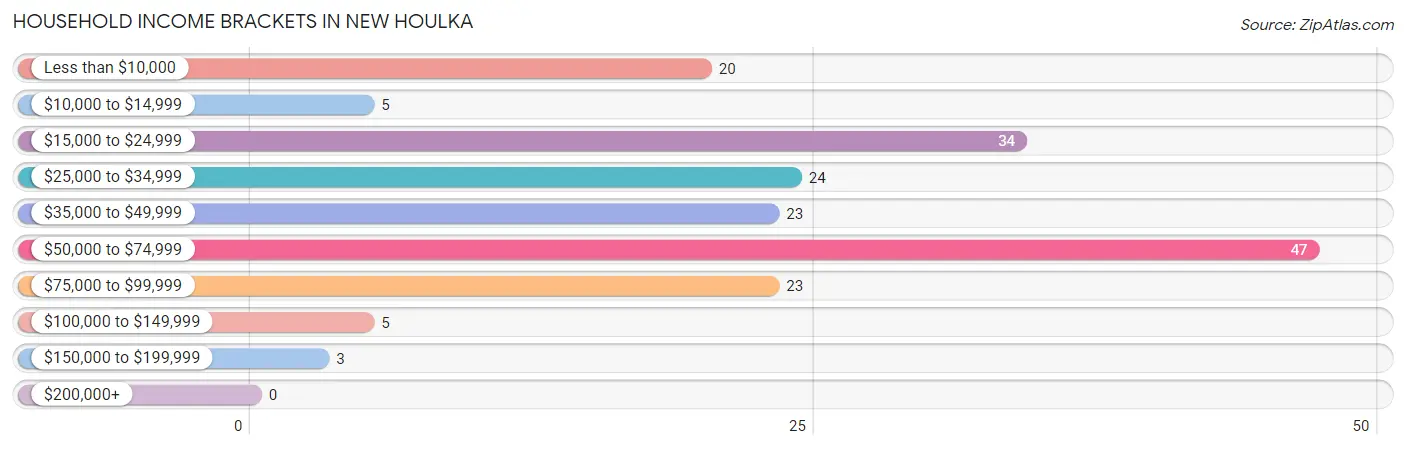
| Income Bracket | # Households | % Households |
| Less than $10,000 | 20 | 10.9% |
| $10,000 to $14,999 | 5 | 2.7% |
| $15,000 to $24,999 | 34 | 18.5% |
| $25,000 to $34,999 | 24 | 13.0% |
| $35,000 to $49,999 | 23 | 12.5% |
| $50,000 to $74,999 | 47 | 25.5% |
| $75,000 to $99,999 | 23 | 12.5% |
| $100,000 to $149,999 | 5 | 2.7% |
| $150,000 to $199,999 | 3 | 1.6% |
| $200,000+ | 0 | 0.0% |
Household Income by Householder Age in New Houlka
The median household income in New Houlka is $43,750, with the highest median household income of $45,313 found in the 25 to 44 years age bracket for the primary householder. A total of 74 households (40.2%) fall into this category. Meanwhile, the 15 to 24 years age bracket for the primary householder has the lowest median household income of $0, with 6 households (3.3%) in this group.
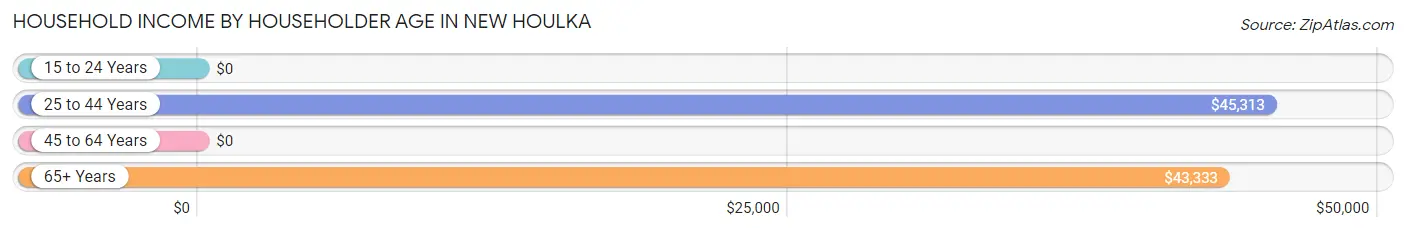
| Income Bracket | # Households | Median Income |
| 15 to 24 Years | 6 (3.3%) | $0 |
| 25 to 44 Years | 74 (40.2%) | $45,313 |
| 45 to 64 Years | 42 (22.8%) | $0 |
| 65+ Years | 62 (33.7%) | $43,333 |
| Total | 184 (100.0%) | $43,750 |
Poverty in New Houlka
Income Below Poverty by Sex and Age in New Houlka
With 19.1% poverty level for males and 43.0% for females among the residents of New Houlka, 6 to 11 year old males and under 5 year old females are the most vulnerable to poverty, with 14 males (48.3%) and 15 females (93.8%) in their respective age groups living below the poverty level.
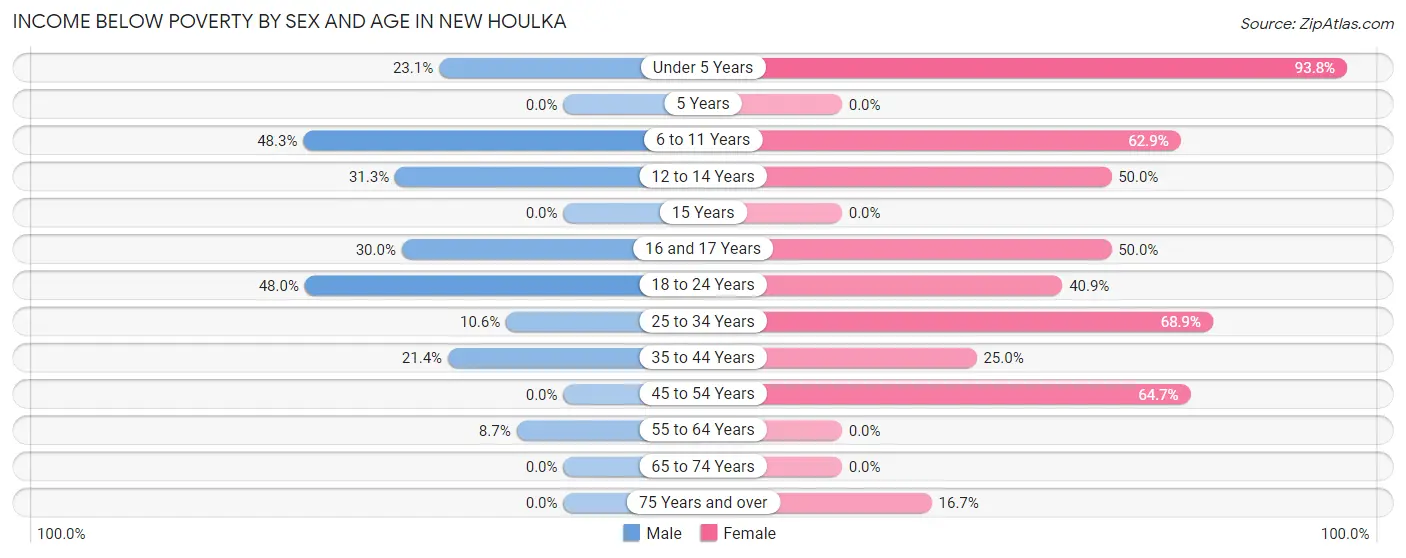
| Age Bracket | Male | Female |
| Under 5 Years | 9 (23.1%) | 15 (93.8%) |
| 5 Years | 0 (0.0%) | 0 (0.0%) |
| 6 to 11 Years | 14 (48.3%) | 22 (62.9%) |
| 12 to 14 Years | 5 (31.2%) | 3 (50.0%) |
| 15 Years | 0 (0.0%) | 0 (0.0%) |
| 16 and 17 Years | 3 (30.0%) | 3 (50.0%) |
| 18 to 24 Years | 12 (48.0%) | 18 (40.9%) |
| 25 to 34 Years | 5 (10.6%) | 42 (68.9%) |
| 35 to 44 Years | 3 (21.4%) | 6 (25.0%) |
| 45 to 54 Years | 0 (0.0%) | 11 (64.7%) |
| 55 to 64 Years | 2 (8.7%) | 0 (0.0%) |
| 65 to 74 Years | 0 (0.0%) | 0 (0.0%) |
| 75 Years and over | 0 (0.0%) | 3 (16.7%) |
| Total | 53 (19.1%) | 123 (43.0%) |
Income Above Poverty by Sex and Age in New Houlka
According to the poverty statistics in New Houlka, males aged 5 years and females aged 5 years are the age groups that are most secure financially, with 100.0% of males and 100.0% of females in these age groups living above the poverty line.
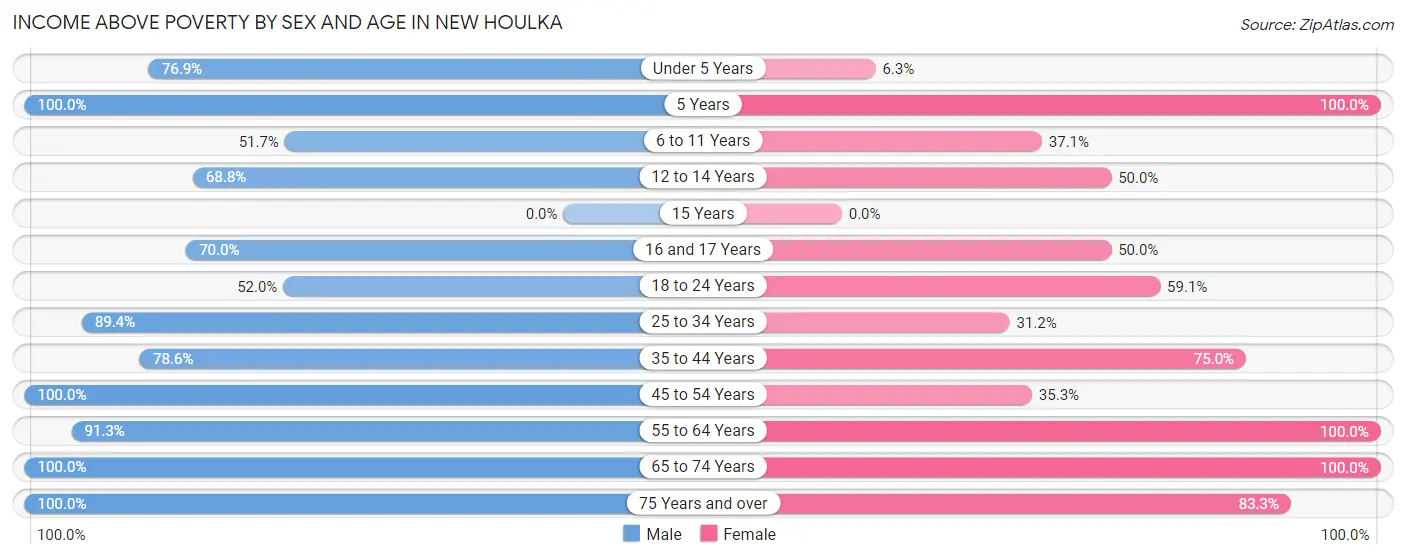
| Age Bracket | Male | Female |
| Under 5 Years | 30 (76.9%) | 1 (6.2%) |
| 5 Years | 5 (100.0%) | 13 (100.0%) |
| 6 to 11 Years | 15 (51.7%) | 13 (37.1%) |
| 12 to 14 Years | 11 (68.8%) | 3 (50.0%) |
| 15 Years | 0 (0.0%) | 0 (0.0%) |
| 16 and 17 Years | 7 (70.0%) | 3 (50.0%) |
| 18 to 24 Years | 13 (52.0%) | 26 (59.1%) |
| 25 to 34 Years | 42 (89.4%) | 19 (31.1%) |
| 35 to 44 Years | 11 (78.6%) | 18 (75.0%) |
| 45 to 54 Years | 12 (100.0%) | 6 (35.3%) |
| 55 to 64 Years | 21 (91.3%) | 23 (100.0%) |
| 65 to 74 Years | 40 (100.0%) | 23 (100.0%) |
| 75 Years and over | 18 (100.0%) | 15 (83.3%) |
| Total | 225 (80.9%) | 163 (57.0%) |
Income Below Poverty Among Married-Couple Families in New Houlka
The poverty statistics for married-couple families in New Houlka show that 10.7% or 8 of the total 75 families live below the poverty line. Families with 1 or 2 children have the highest poverty rate of 46.7%, comprising of 7 families. On the other hand, families with no children have the lowest poverty rate of 0.0%, which includes 0 families.
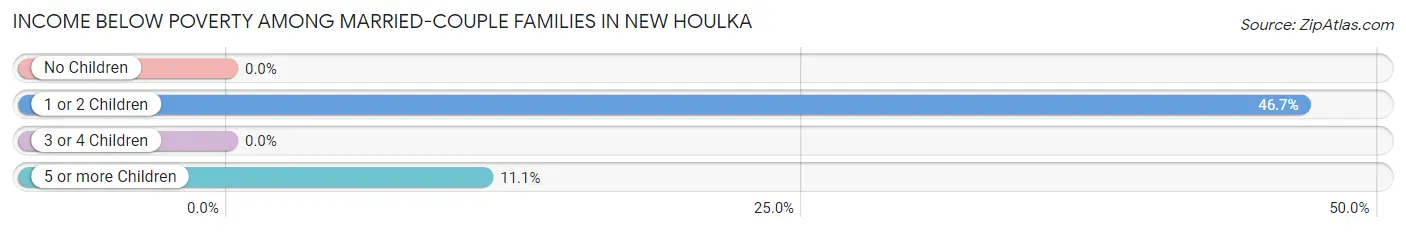
| Children | Above Poverty | Below Poverty |
| No Children | 49 (100.0%) | 0 (0.0%) |
| 1 or 2 Children | 8 (53.3%) | 7 (46.7%) |
| 3 or 4 Children | 2 (100.0%) | 0 (0.0%) |
| 5 or more Children | 8 (88.9%) | 1 (11.1%) |
| Total | 67 (89.3%) | 8 (10.7%) |
Income Below Poverty Among Single-Parent Households in New Houlka
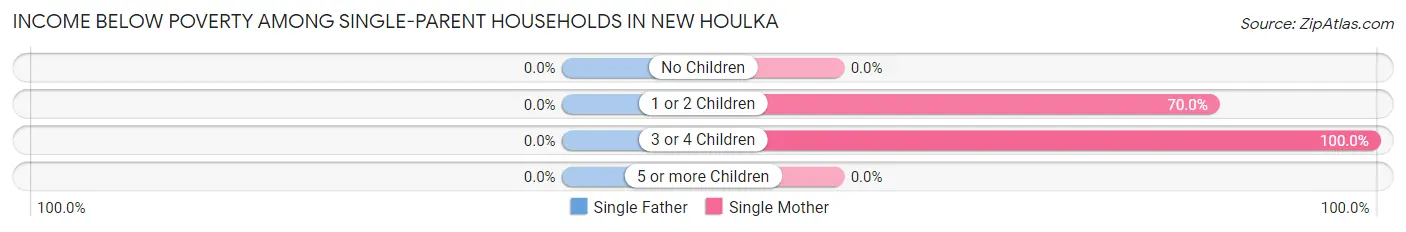
| Children | Single Father | Single Mother |
| No Children | 0 (0.0%) | 0 (0.0%) |
| 1 or 2 Children | 0 (0.0%) | 14 (70.0%) |
| 3 or 4 Children | 0 (0.0%) | 10 (100.0%) |
| 5 or more Children | 0 (0.0%) | 0 (0.0%) |
| Total | 0 (0.0%) | 24 (70.6%) |
Income Below Poverty Among Married-Couple vs Single-Parent Households in New Houlka
The poverty data for New Houlka shows that 8 of the married-couple family households (10.7%) and 24 of the single-parent households (32.4%) are living below the poverty level. Within the married-couple family households, those with 1 or 2 children have the highest poverty rate, with 7 households (46.7%) falling below the poverty line. Among the single-parent households, those with 3 or 4 children have the highest poverty rate, with 10 household (55.6%) living below poverty.
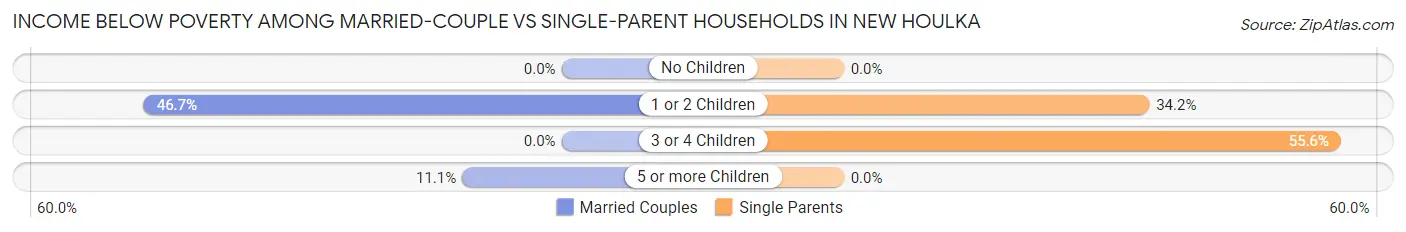
| Children | Married-Couple Families | Single-Parent Households |
| No Children | 0 (0.0%) | 0 (0.0%) |
| 1 or 2 Children | 7 (46.7%) | 14 (34.2%) |
| 3 or 4 Children | 0 (0.0%) | 10 (55.6%) |
| 5 or more Children | 1 (11.1%) | 0 (0.0%) |
| Total | 8 (10.7%) | 24 (32.4%) |
Race in New Houlka
The most populous races in New Houlka are White / Caucasian (260 | 46.1%), Black / African American (227 | 40.3%), and Hispanic or Latino (58 | 10.3%).
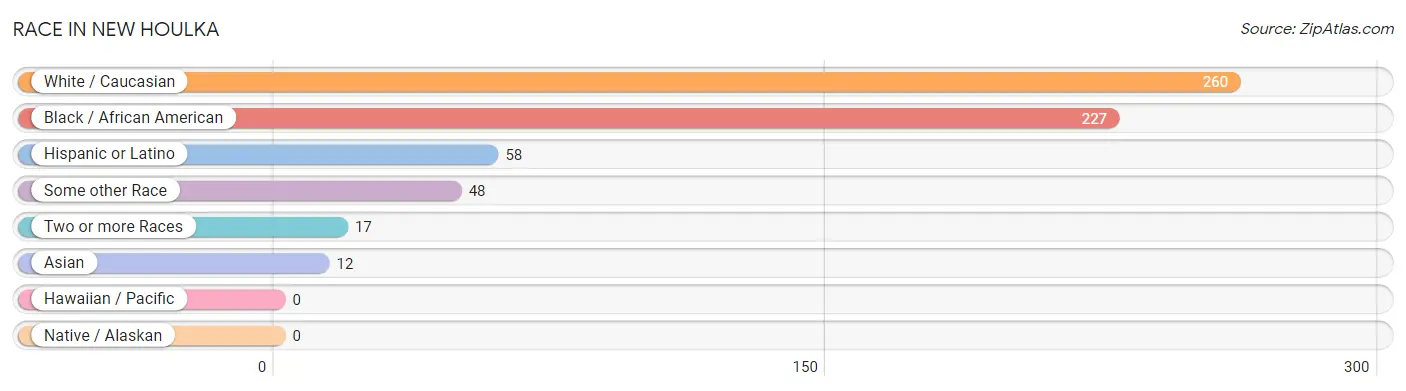
| Race | # Population | % Population |
| Asian | 12 | 2.1% |
| Black / African American | 227 | 40.3% |
| Hawaiian / Pacific | 0 | 0.0% |
| Hispanic or Latino | 58 | 10.3% |
| Native / Alaskan | 0 | 0.0% |
| White / Caucasian | 260 | 46.1% |
| Two or more Races | 17 | 3.0% |
| Some other Race | 48 | 8.5% |
| Total | 564 | 100.0% |
Ancestry in New Houlka
The most populous ancestries reported in New Houlka are American (65 | 11.5%), Puerto Rican (48 | 8.5%), English (26 | 4.6%), Irish (22 | 3.9%), and Dutch (12 | 2.1%), together accounting for 30.7% of all New Houlka residents.
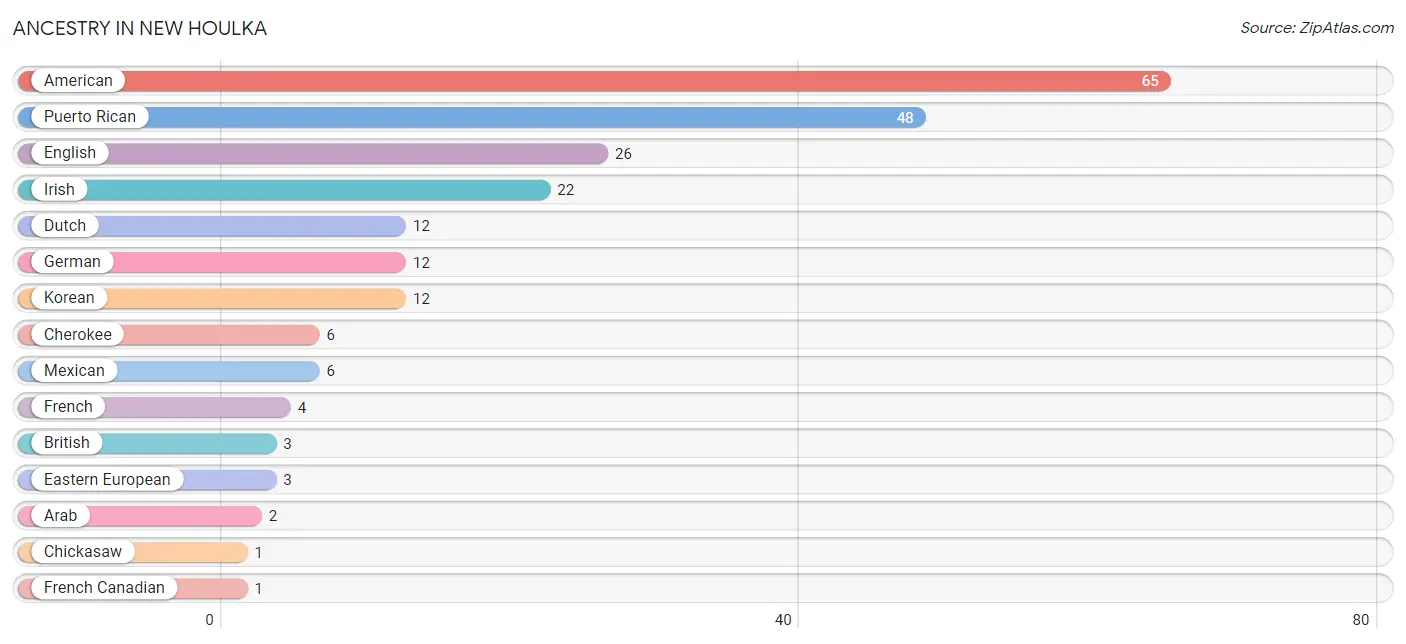
| Ancestry | # Population | % Population |
| American | 65 | 11.5% |
| Arab | 2 | 0.4% |
| British | 3 | 0.5% |
| Cherokee | 6 | 1.1% |
| Chickasaw | 1 | 0.2% |
| Dutch | 12 | 2.1% |
| Eastern European | 3 | 0.5% |
| English | 26 | 4.6% |
| French | 4 | 0.7% |
| French Canadian | 1 | 0.2% |
| German | 12 | 2.1% |
| Irish | 22 | 3.9% |
| Korean | 12 | 2.1% |
| Mexican | 6 | 1.1% |
| Puerto Rican | 48 | 8.5% |
| Scotch-Irish | 1 | 0.2% | View All 16 Rows |
Immigrants in New Houlka
The most numerous immigrant groups reported in New Houlka came from Asia (12 | 2.1%), Philippines (12 | 2.1%), and South Eastern Asia (12 | 2.1%), together accounting for 6.4% of all New Houlka residents.
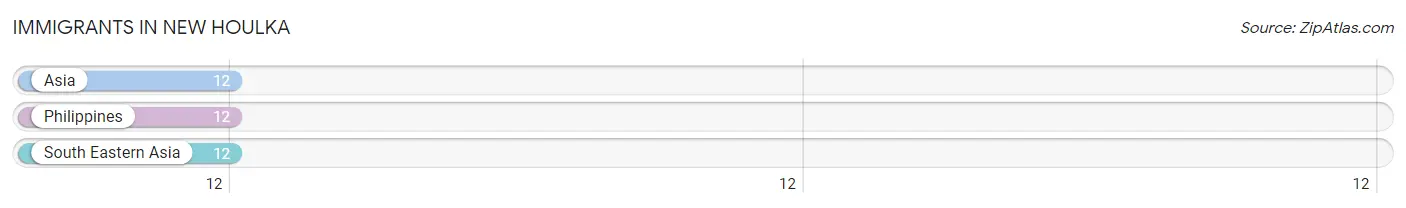
| Immigration Origin | # Population | % Population |
| Asia | 12 | 2.1% |
| Philippines | 12 | 2.1% |
| South Eastern Asia | 12 | 2.1% | View All 3 Rows |
Sex and Age in New Houlka
Sex and Age in New Houlka
The most populous age groups in New Houlka are Under 5 Years (39 | 14.0%) for men and 25 to 29 Years (41 | 14.3%) for women.
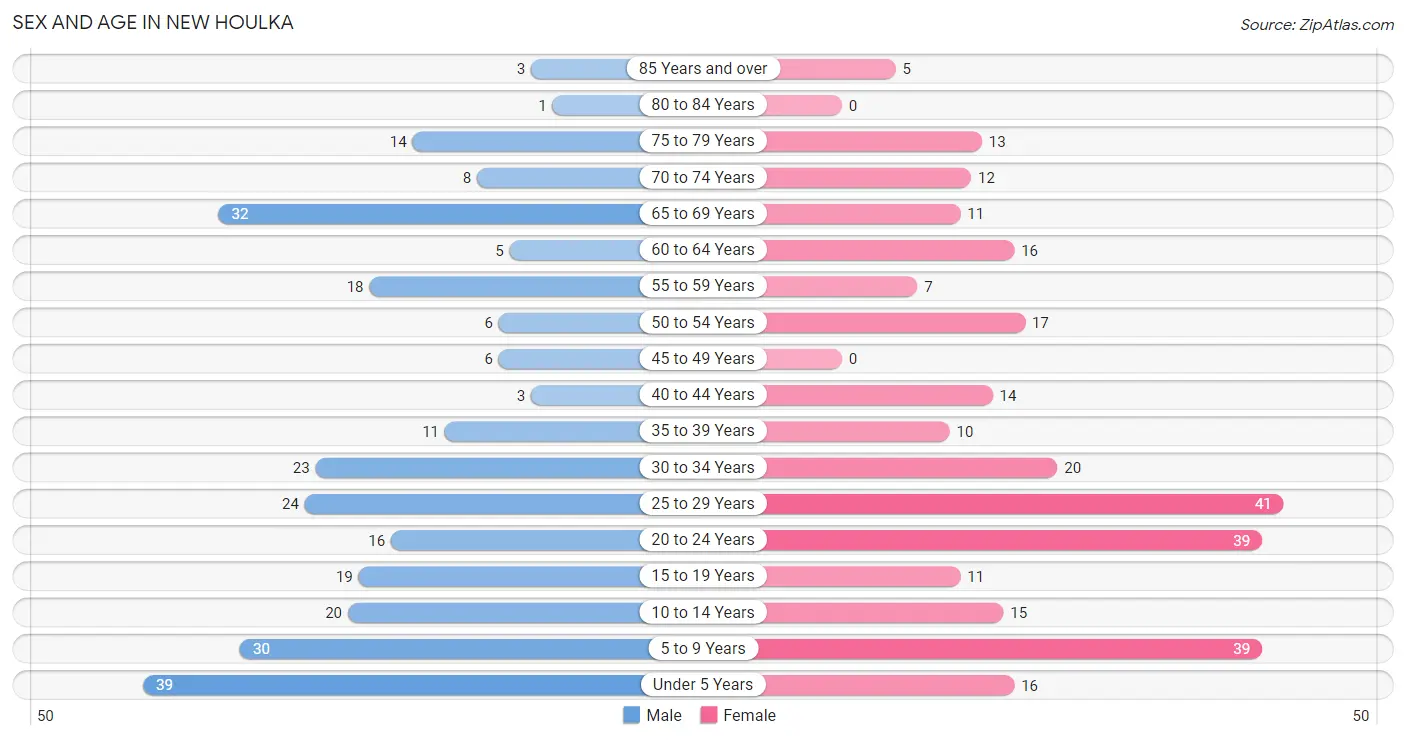
| Age Bracket | Male | Female |
| Under 5 Years | 39 (14.0%) | 16 (5.6%) |
| 5 to 9 Years | 30 (10.8%) | 39 (13.6%) |
| 10 to 14 Years | 20 (7.2%) | 15 (5.2%) |
| 15 to 19 Years | 19 (6.8%) | 11 (3.8%) |
| 20 to 24 Years | 16 (5.8%) | 39 (13.6%) |
| 25 to 29 Years | 24 (8.6%) | 41 (14.3%) |
| 30 to 34 Years | 23 (8.3%) | 20 (7.0%) |
| 35 to 39 Years | 11 (4.0%) | 10 (3.5%) |
| 40 to 44 Years | 3 (1.1%) | 14 (4.9%) |
| 45 to 49 Years | 6 (2.2%) | 0 (0.0%) |
| 50 to 54 Years | 6 (2.2%) | 17 (5.9%) |
| 55 to 59 Years | 18 (6.5%) | 7 (2.5%) |
| 60 to 64 Years | 5 (1.8%) | 16 (5.6%) |
| 65 to 69 Years | 32 (11.5%) | 11 (3.8%) |
| 70 to 74 Years | 8 (2.9%) | 12 (4.2%) |
| 75 to 79 Years | 14 (5.0%) | 13 (4.5%) |
| 80 to 84 Years | 1 (0.4%) | 0 (0.0%) |
| 85 Years and over | 3 (1.1%) | 5 (1.8%) |
| Total | 278 (100.0%) | 286 (100.0%) |
Families and Households in New Houlka
Median Family Size in New Houlka
The median family size in New Houlka is 3.35 persons per family, with married-couple families (75 | 50.3%) accounting for the largest median family size of 3.76 persons per family. On the other hand, single male/father families (40 | 26.9%) represent the smallest median family size with 2.50 persons per family.
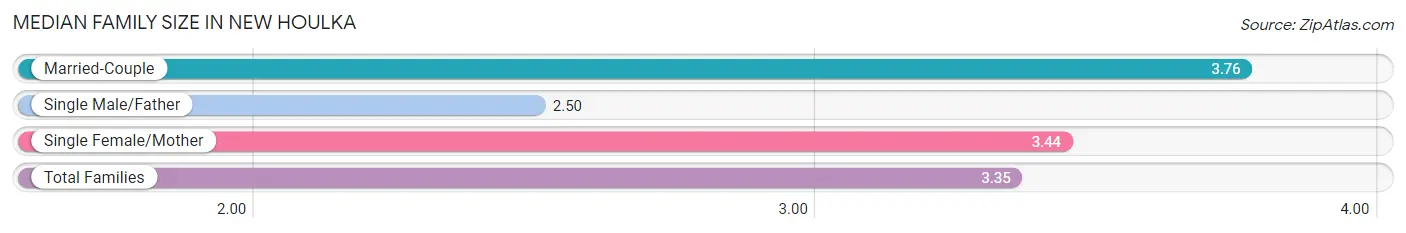
| Family Type | # Families | Family Size |
| Married-Couple | 75 (50.3%) | 3.76 |
| Single Male/Father | 40 (26.9%) | 2.50 |
| Single Female/Mother | 34 (22.8%) | 3.44 |
| Total Families | 149 (100.0%) | 3.35 |
Median Household Size in New Houlka
The median household size in New Houlka is 3.07 persons per household, with married-couple households (75 | 40.8%) accounting for the largest median household size of 3.76 persons per household. non-family households (35 | 19.0%) represent the smallest median household size with 1.11 persons per household.
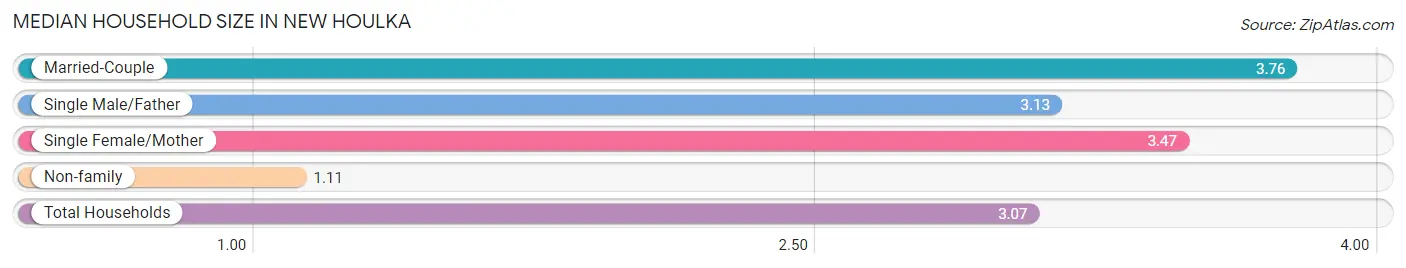
| Household Type | # Households | Household Size |
| Married-Couple | 75 (40.8%) | 3.76 |
| Single Male/Father | 40 (21.7%) | 3.13 |
| Single Female/Mother | 34 (18.5%) | 3.47 |
| Non-family | 35 (19.0%) | 1.11 |
| Total Households | 184 (100.0%) | 3.07 |
Household Size by Marriage Status in New Houlka
Out of a total of 184 households in New Houlka, 149 (81.0%) are family households, while 35 (19.0%) are nonfamily households. The most numerous type of family households are 2-person households, comprising 64, and the most common type of nonfamily households are 1-person households, comprising 33.
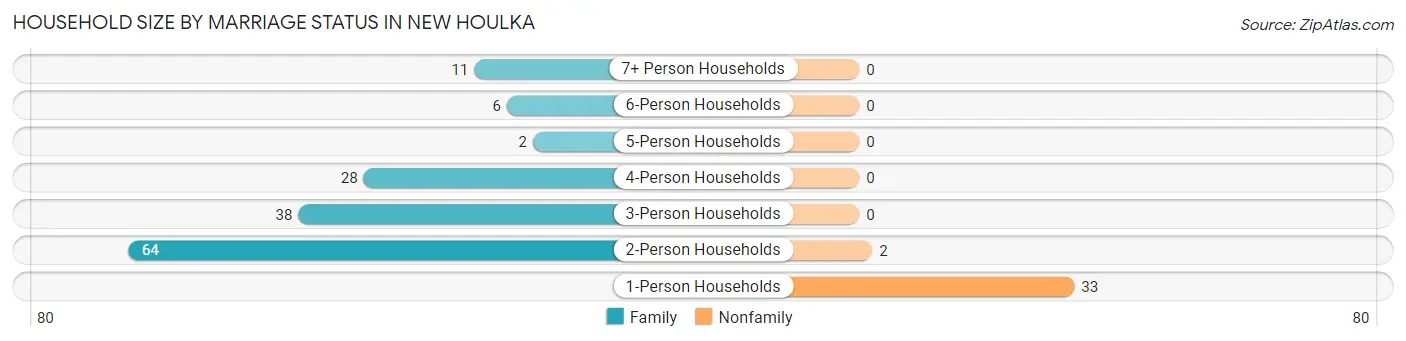
| Household Size | Family Households | Nonfamily Households |
| 1-Person Households | - | 33 (17.9%) |
| 2-Person Households | 64 (34.8%) | 2 (1.1%) |
| 3-Person Households | 38 (20.6%) | 0 (0.0%) |
| 4-Person Households | 28 (15.2%) | 0 (0.0%) |
| 5-Person Households | 2 (1.1%) | 0 (0.0%) |
| 6-Person Households | 6 (3.3%) | 0 (0.0%) |
| 7+ Person Households | 11 (6.0%) | 0 (0.0%) |
| Total | 149 (81.0%) | 35 (19.0%) |
Female Fertility in New Houlka
Fertility by Age in New Houlka
Average fertility rate in New Houlka is 109.0 births per 1,000 women. Women in the age bracket of 20 to 34 years have the highest fertility rate with 160.0 births per 1,000 women. Women in the age bracket of 20 to 34 years acount for 100.0% of all women with births.
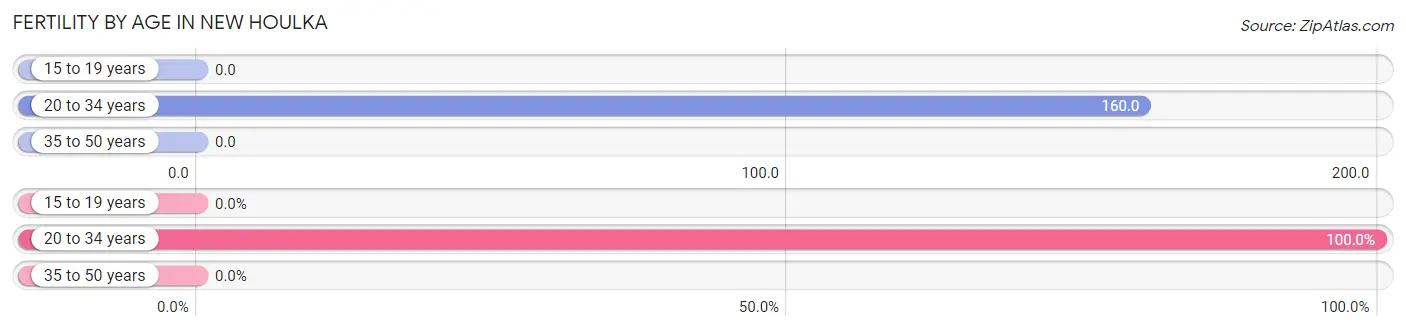
| Age Bracket | Women with Births | Births / 1,000 Women |
| 15 to 19 years | 0 (0.0%) | 0.0 |
| 20 to 34 years | 16 (100.0%) | 160.0 |
| 35 to 50 years | 0 (0.0%) | 0.0 |
| Total | 16 (100.0%) | 109.0 |
Fertility by Age by Marriage Status in New Houlka
75.0% of women with births (16) in New Houlka are married. The highest percentage of unmarried women with births falls into 20 to 34 years age bracket with 25.0% of them unmarried at the time of birth, while the lowest percentage of unmarried women with births belong to 20 to 34 years age bracket with 25.0% of them unmarried.
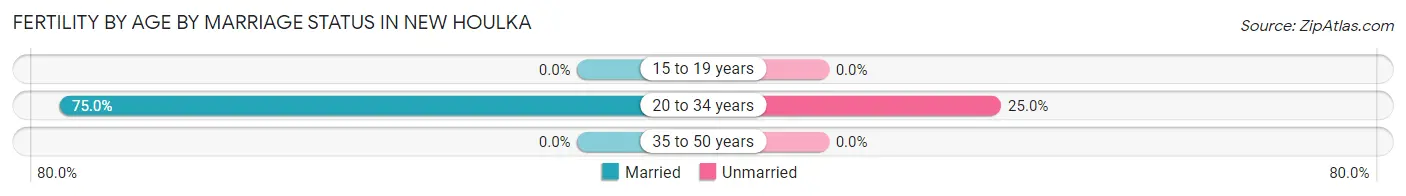
| Age Bracket | Married | Unmarried |
| 15 to 19 years | 0 (0.0%) | 0 (0.0%) |
| 20 to 34 years | 12 (75.0%) | 4 (25.0%) |
| 35 to 50 years | 0 (0.0%) | 0 (0.0%) |
| Total | 12 (75.0%) | 4 (25.0%) |
Fertility by Education in New Houlka
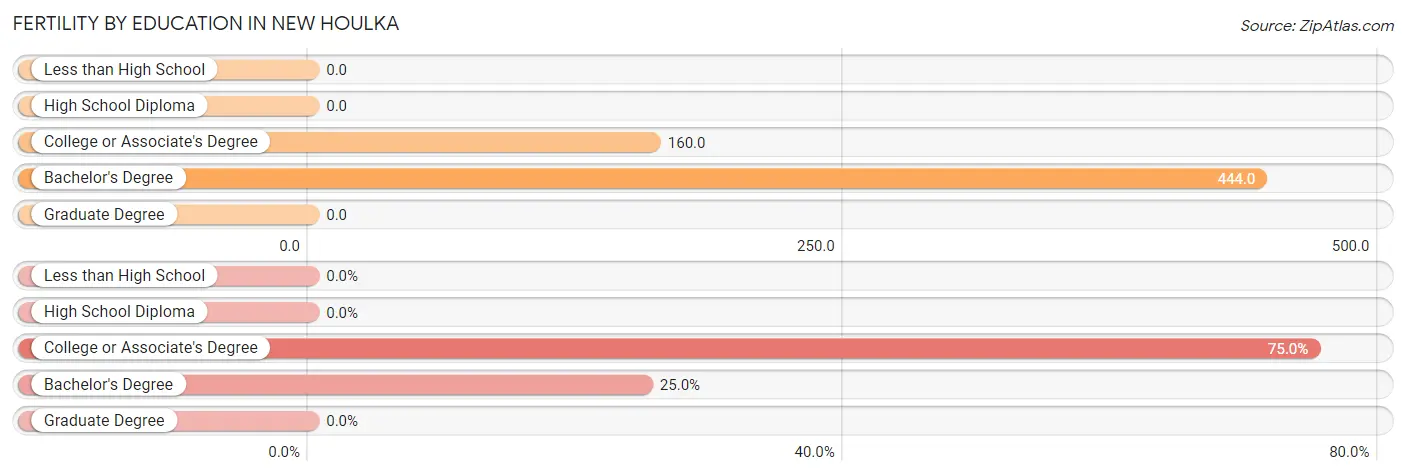
| Educational Attainment | Women with Births | Births / 1,000 Women |
| Less than High School | 0 (0.0%) | 0.0 |
| High School Diploma | 0 (0.0%) | 0.0 |
| College or Associate's Degree | 12 (75.0%) | 160.0 |
| Bachelor's Degree | 4 (25.0%) | 444.0 |
| Graduate Degree | 0 (0.0%) | 0.0 |
| Total | 16 (100.0%) | 109.0 |
Fertility by Education by Marriage Status in New Houlka
25.0% of women with births in New Houlka are unmarried. Women with the educational attainment of bachelor's degree are most likely to be married with 100.0% of them married at childbirth, while women with the educational attainment of college or associate's degree are least likely to be married with 33.3% of them unmarried at childbirth.
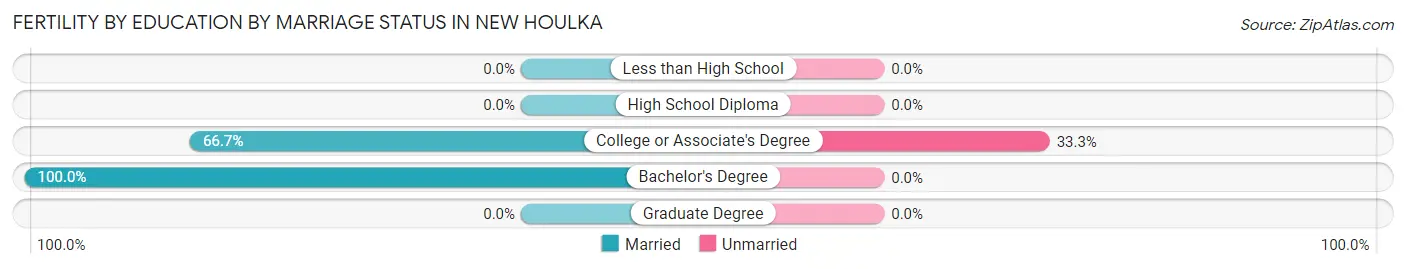
| Educational Attainment | Married | Unmarried |
| Less than High School | 0 (0.0%) | 0 (0.0%) |
| High School Diploma | 0 (0.0%) | 0 (0.0%) |
| College or Associate's Degree | 8 (66.7%) | 4 (33.3%) |
| Bachelor's Degree | 4 (100.0%) | 0 (0.0%) |
| Graduate Degree | 0 (0.0%) | 0 (0.0%) |
| Total | 12 (75.0%) | 4 (25.0%) |
Employment Characteristics in New Houlka
Employment by Class of Employer in New Houlka
Among the 212 employed individuals in New Houlka, private company employees (166 | 78.3%), local government employees (16 | 7.5%), and self-employed (not incorporated) (8 | 3.8%) make up the most common classes of employment.
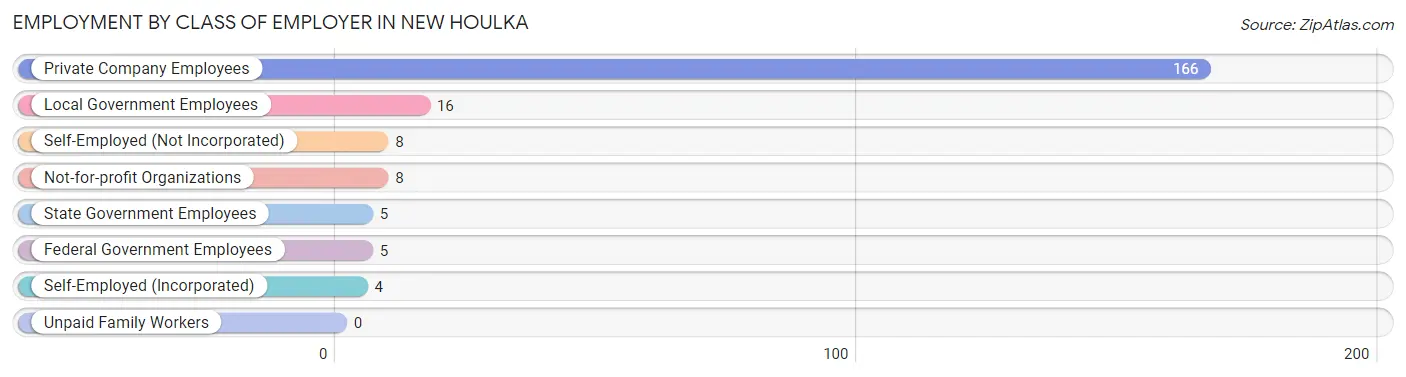
| Employer Class | # Employees | % Employees |
| Private Company Employees | 166 | 78.3% |
| Self-Employed (Incorporated) | 4 | 1.9% |
| Self-Employed (Not Incorporated) | 8 | 3.8% |
| Not-for-profit Organizations | 8 | 3.8% |
| Local Government Employees | 16 | 7.5% |
| State Government Employees | 5 | 2.4% |
| Federal Government Employees | 5 | 2.4% |
| Unpaid Family Workers | 0 | 0.0% |
| Total | 212 | 100.0% |
Employment Status by Age in New Houlka
According to the labor force statistics for New Houlka, out of the total population over 16 years of age (405), 60.2% or 244 individuals are in the labor force, with 10.7% or 26 of them unemployed. The age group with the highest labor force participation rate is 30 to 34 years, with 95.3% or 41 individuals in the labor force. Within the labor force, the 45 to 54 years age range has the highest percentage of unemployed individuals, with 44.0% or 11 of them being unemployed.
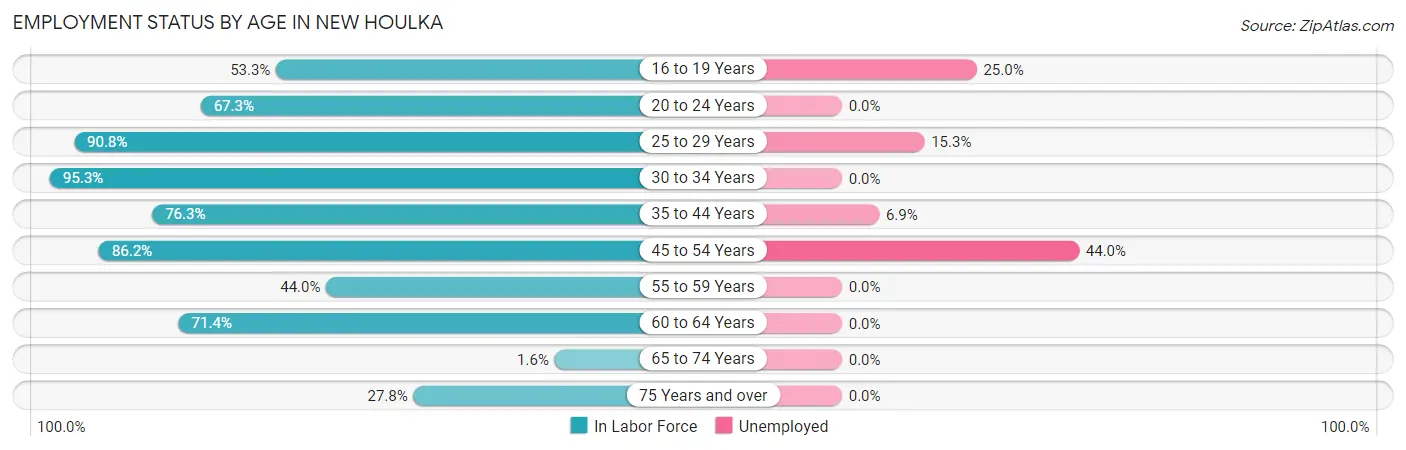
| Age Bracket | In Labor Force | Unemployed |
| 16 to 19 Years | 16 (53.3%) | 4 (25.0%) |
| 20 to 24 Years | 37 (67.3%) | 0 (0.0%) |
| 25 to 29 Years | 59 (90.8%) | 9 (15.3%) |
| 30 to 34 Years | 41 (95.3%) | 0 (0.0%) |
| 35 to 44 Years | 29 (76.3%) | 2 (6.9%) |
| 45 to 54 Years | 25 (86.2%) | 11 (44.0%) |
| 55 to 59 Years | 11 (44.0%) | 0 (0.0%) |
| 60 to 64 Years | 15 (71.4%) | 0 (0.0%) |
| 65 to 74 Years | 1 (1.6%) | 0 (0.0%) |
| 75 Years and over | 10 (27.8%) | 0 (0.0%) |
| Total | 244 (60.2%) | 26 (10.7%) |
Employment Status by Educational Attainment in New Houlka
According to labor force statistics for New Houlka, 81.4% of individuals (180) out of the total population between 25 and 64 years of age (221) are in the labor force, with 12.2% or 22 of them being unemployed. The group with the highest labor force participation rate are those with the educational attainment of bachelor's degree or higher, with 100.0% or 28 individuals in the labor force. Within the labor force, individuals with bachelor's degree or higher education have the highest percentage of unemployment, with 39.3% or 11 of them being unemployed.
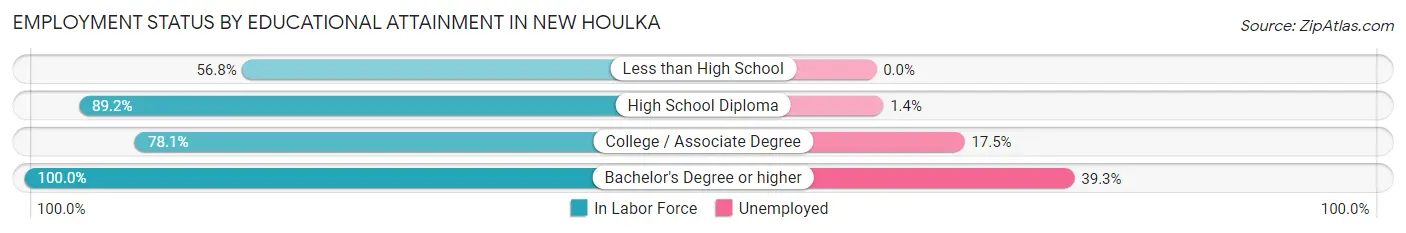
| Educational Attainment | In Labor Force | Unemployed |
| Less than High School | 21 (56.8%) | 0 (0.0%) |
| High School Diploma | 74 (89.2%) | 1 (1.4%) |
| College / Associate Degree | 57 (78.1%) | 13 (17.5%) |
| Bachelor's Degree or higher | 28 (100.0%) | 11 (39.3%) |
| Total | 180 (81.4%) | 27 (12.2%) |
Employment Occupations by Sex in New Houlka
Management, Business, Science and Arts Occupations
The most common Management, Business, Science and Arts occupations in New Houlka are Community & Social Service (12 | 5.5%), Education Instruction & Library (10 | 4.6%), Health Diagnosing & Treating (4 | 1.8%), Education, Arts & Media (2 | 0.9%), and Health Technologists (2 | 0.9%).
Management, Business, Science and Arts Occupations by Sex
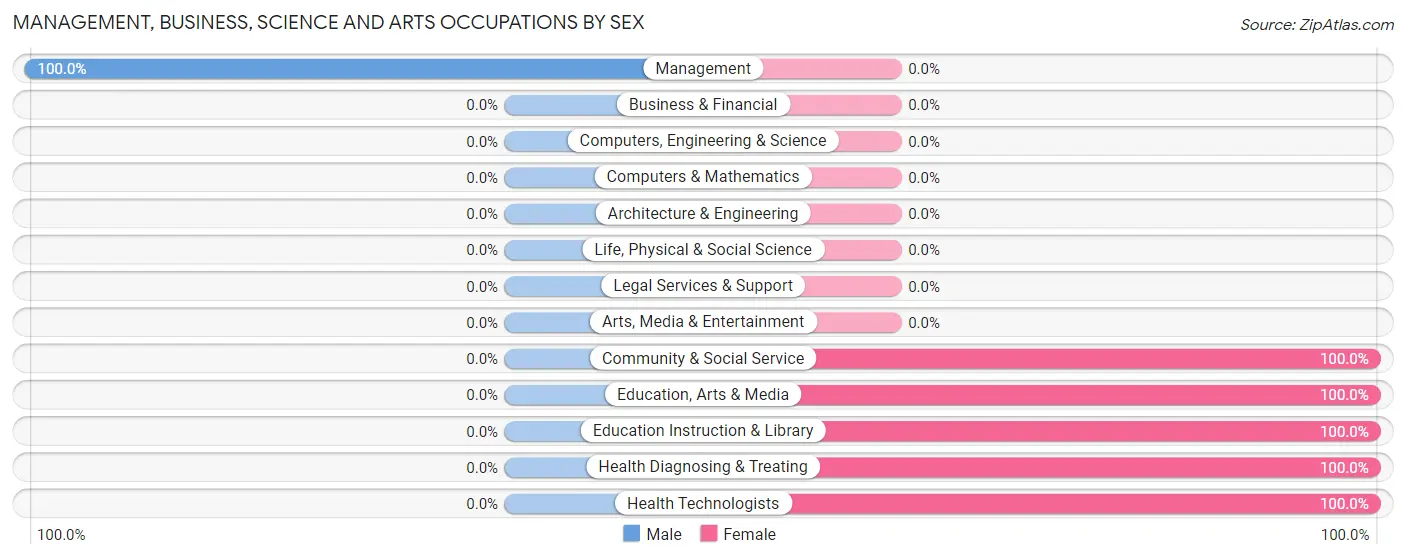
| Occupation | Male | Female |
| Management | 1 (100.0%) | 0 (0.0%) |
| Business & Financial | 0 (0.0%) | 0 (0.0%) |
| Computers, Engineering & Science | 0 (0.0%) | 0 (0.0%) |
| Computers & Mathematics | 0 (0.0%) | 0 (0.0%) |
| Architecture & Engineering | 0 (0.0%) | 0 (0.0%) |
| Life, Physical & Social Science | 0 (0.0%) | 0 (0.0%) |
| Community & Social Service | 0 (0.0%) | 12 (100.0%) |
| Education, Arts & Media | 0 (0.0%) | 2 (100.0%) |
| Legal Services & Support | 0 (0.0%) | 0 (0.0%) |
| Education Instruction & Library | 0 (0.0%) | 10 (100.0%) |
| Arts, Media & Entertainment | 0 (0.0%) | 0 (0.0%) |
| Health Diagnosing & Treating | 0 (0.0%) | 4 (100.0%) |
| Health Technologists | 0 (0.0%) | 2 (100.0%) |
| Total (Category) | 1 (5.9%) | 16 (94.1%) |
| Total (Overall) | 96 (44.0%) | 122 (56.0%) |
Services Occupations
The most common Services occupations in New Houlka are Food Preparation & Serving (36 | 16.5%), Security & Protection (17 | 7.8%), Firefighting & Prevention (10 | 4.6%), Law Enforcement (7 | 3.2%), and Cleaning & Maintenance (6 | 2.8%).
Services Occupations by Sex
Within the Services occupations in New Houlka, the most male-oriented occupations are Security & Protection (100.0%), Firefighting & Prevention (100.0%), and Law Enforcement (100.0%), while the most female-oriented occupations are Healthcare Support (100.0%), Cleaning & Maintenance (100.0%), and Food Preparation & Serving (86.1%).
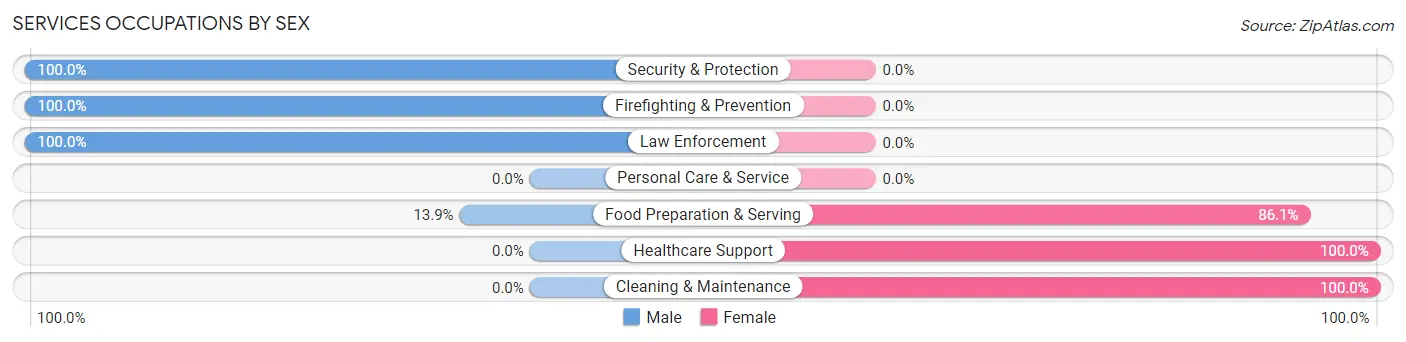
| Occupation | Male | Female |
| Healthcare Support | 0 (0.0%) | 5 (100.0%) |
| Security & Protection | 17 (100.0%) | 0 (0.0%) |
| Firefighting & Prevention | 10 (100.0%) | 0 (0.0%) |
| Law Enforcement | 7 (100.0%) | 0 (0.0%) |
| Food Preparation & Serving | 5 (13.9%) | 31 (86.1%) |
| Cleaning & Maintenance | 0 (0.0%) | 6 (100.0%) |
| Personal Care & Service | 0 (0.0%) | 0 (0.0%) |
| Total (Category) | 22 (34.4%) | 42 (65.6%) |
| Total (Overall) | 96 (44.0%) | 122 (56.0%) |
Sales and Office Occupations
The most common Sales and Office occupations in New Houlka are Sales & Related (51 | 23.4%), and Office & Administration (13 | 6.0%).

Sales and Office Occupations by Sex
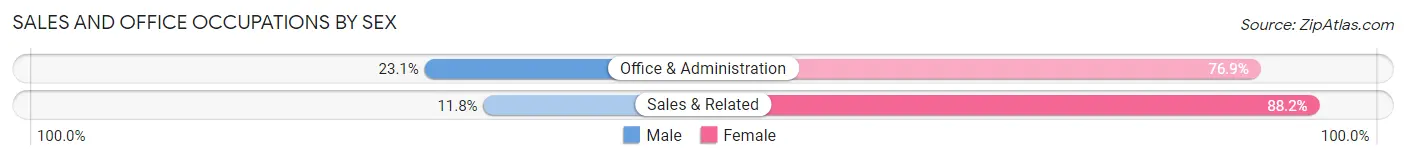
| Occupation | Male | Female |
| Sales & Related | 6 (11.8%) | 45 (88.2%) |
| Office & Administration | 3 (23.1%) | 10 (76.9%) |
| Total (Category) | 9 (14.1%) | 55 (85.9%) |
| Total (Overall) | 96 (44.0%) | 122 (56.0%) |
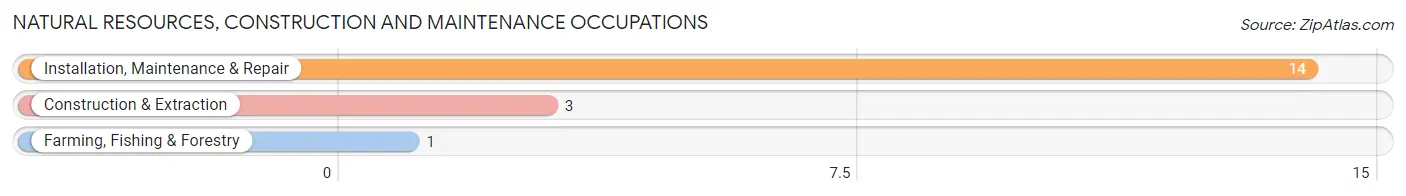
Natural Resources, Construction and Maintenance Occupations
The most common Natural Resources, Construction and Maintenance occupations in New Houlka are Installation, Maintenance & Repair (14 | 6.4%), Construction & Extraction (3 | 1.4%), and Farming, Fishing & Forestry (1 | 0.5%).
Natural Resources, Construction and Maintenance Occupations by Sex
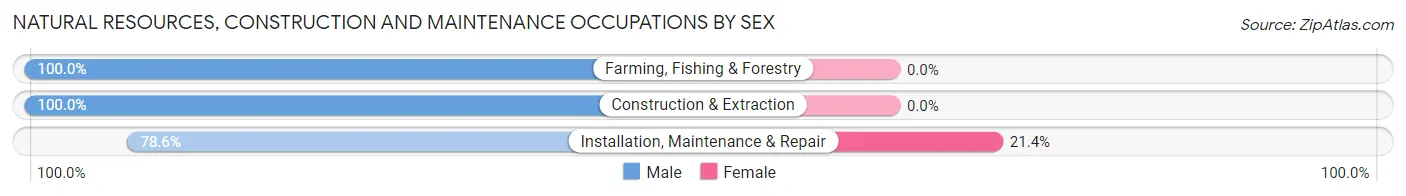
| Occupation | Male | Female |
| Farming, Fishing & Forestry | 1 (100.0%) | 0 (0.0%) |
| Construction & Extraction | 3 (100.0%) | 0 (0.0%) |
| Installation, Maintenance & Repair | 11 (78.6%) | 3 (21.4%) |
| Total (Category) | 15 (83.3%) | 3 (16.7%) |
| Total (Overall) | 96 (44.0%) | 122 (56.0%) |
Production, Transportation and Moving Occupations
The most common Production, Transportation and Moving occupations in New Houlka are Production (45 | 20.6%), Material Moving (8 | 3.7%), and Transportation (2 | 0.9%).
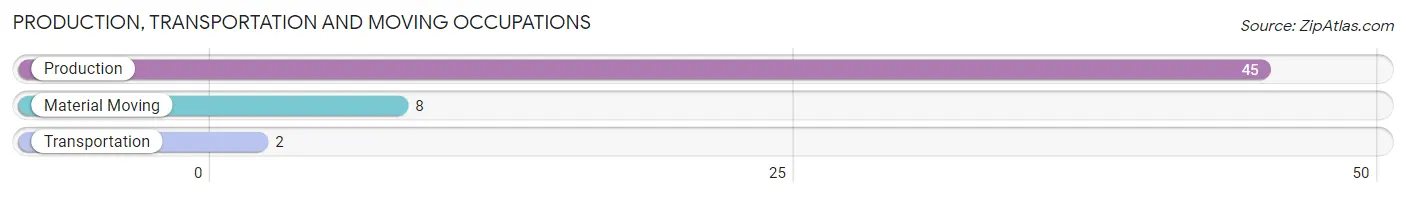
Production, Transportation and Moving Occupations by Sex
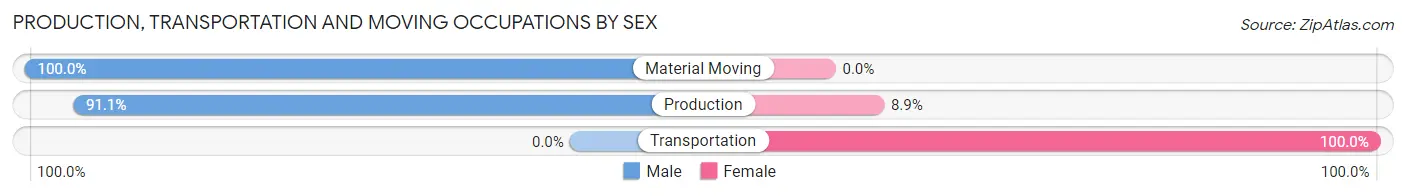
| Occupation | Male | Female |
| Production | 41 (91.1%) | 4 (8.9%) |
| Transportation | 0 (0.0%) | 2 (100.0%) |
| Material Moving | 8 (100.0%) | 0 (0.0%) |
| Total (Category) | 49 (89.1%) | 6 (10.9%) |
| Total (Overall) | 96 (44.0%) | 122 (56.0%) |
Employment Industries by Sex in New Houlka
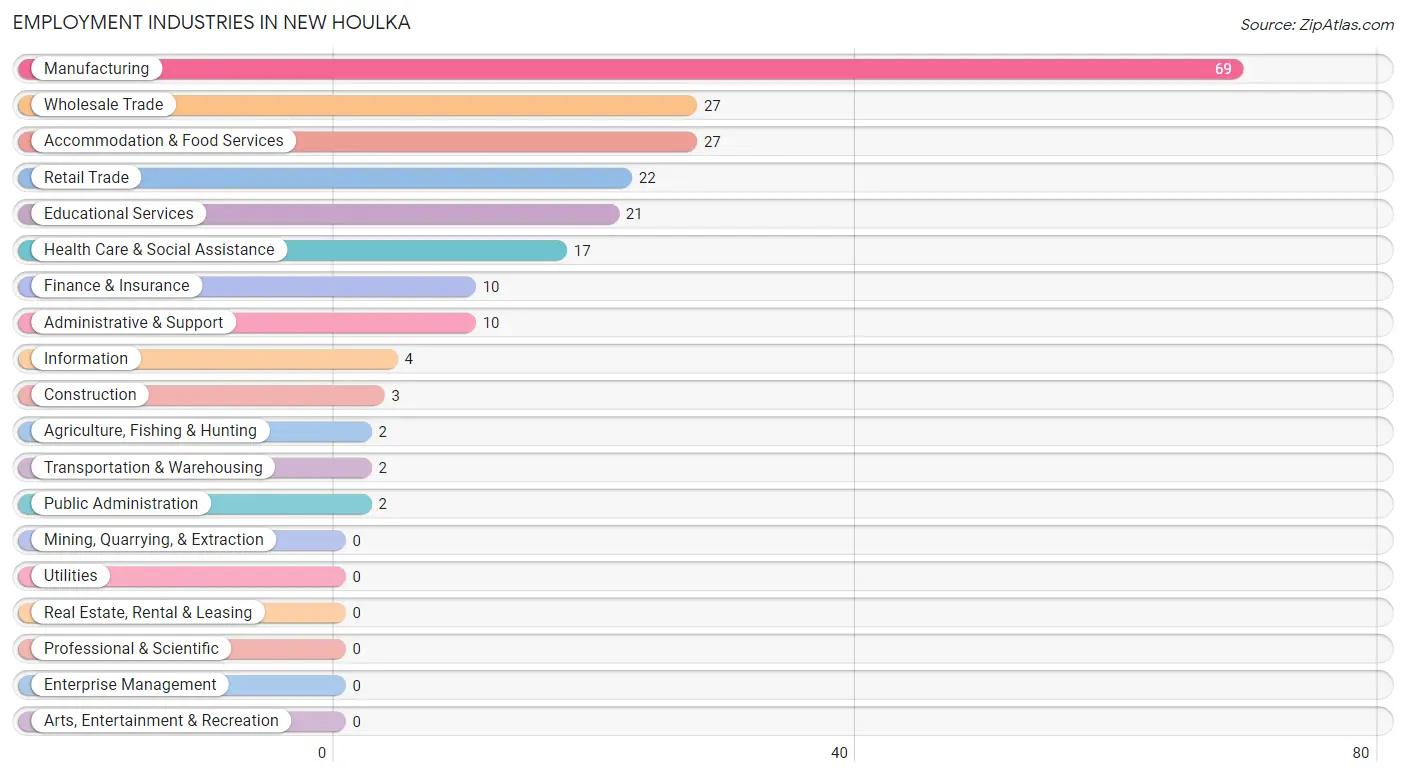
Employment Industries in New Houlka
The major employment industries in New Houlka include Manufacturing (69 | 31.7%), Wholesale Trade (27 | 12.4%), Accommodation & Food Services (27 | 12.4%), Retail Trade (22 | 10.1%), and Educational Services (21 | 9.6%).
Employment Industries by Sex in New Houlka
The New Houlka industries that see more men than women are Construction (100.0%), Administrative & Support (100.0%), and Finance & Insurance (90.0%), whereas the industries that tend to have a higher number of women are Transportation & Warehousing (100.0%), Information (100.0%), and Educational Services (100.0%).
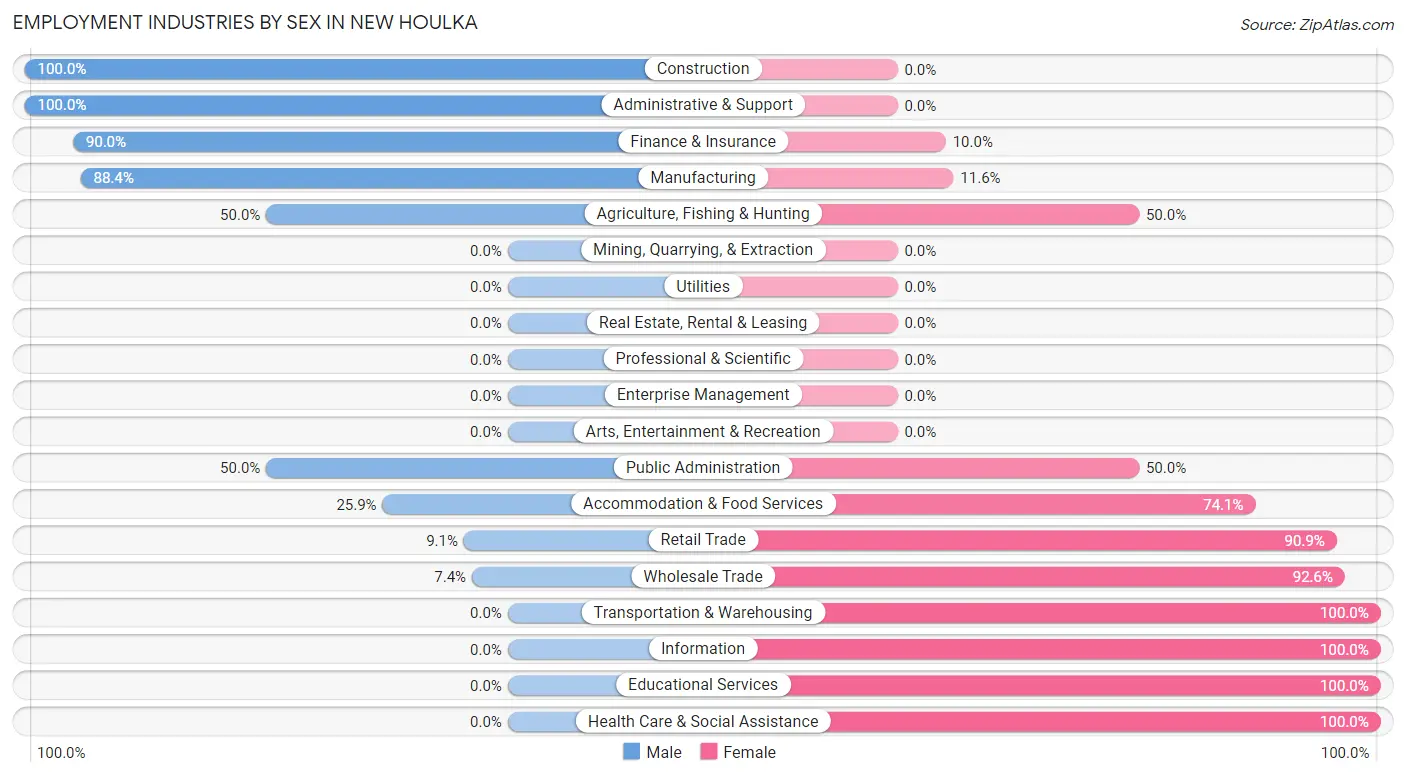
| Industry | Male | Female |
| Agriculture, Fishing & Hunting | 1 (50.0%) | 1 (50.0%) |
| Mining, Quarrying, & Extraction | 0 (0.0%) | 0 (0.0%) |
| Construction | 3 (100.0%) | 0 (0.0%) |
| Manufacturing | 61 (88.4%) | 8 (11.6%) |
| Wholesale Trade | 2 (7.4%) | 25 (92.6%) |
| Retail Trade | 2 (9.1%) | 20 (90.9%) |
| Transportation & Warehousing | 0 (0.0%) | 2 (100.0%) |
| Utilities | 0 (0.0%) | 0 (0.0%) |
| Information | 0 (0.0%) | 4 (100.0%) |
| Finance & Insurance | 9 (90.0%) | 1 (10.0%) |
| Real Estate, Rental & Leasing | 0 (0.0%) | 0 (0.0%) |
| Professional & Scientific | 0 (0.0%) | 0 (0.0%) |
| Enterprise Management | 0 (0.0%) | 0 (0.0%) |
| Administrative & Support | 10 (100.0%) | 0 (0.0%) |
| Educational Services | 0 (0.0%) | 21 (100.0%) |
| Health Care & Social Assistance | 0 (0.0%) | 17 (100.0%) |
| Arts, Entertainment & Recreation | 0 (0.0%) | 0 (0.0%) |
| Accommodation & Food Services | 7 (25.9%) | 20 (74.1%) |
| Public Administration | 1 (50.0%) | 1 (50.0%) |
| Total | 96 (44.0%) | 122 (56.0%) |
Education in New Houlka
School Enrollment in New Houlka
The most common levels of schooling among the 158 students in New Houlka are elementary school (49 | 31.0%), college / undergraduate (32 | 20.3%), and kindergarten (22 | 13.9%).
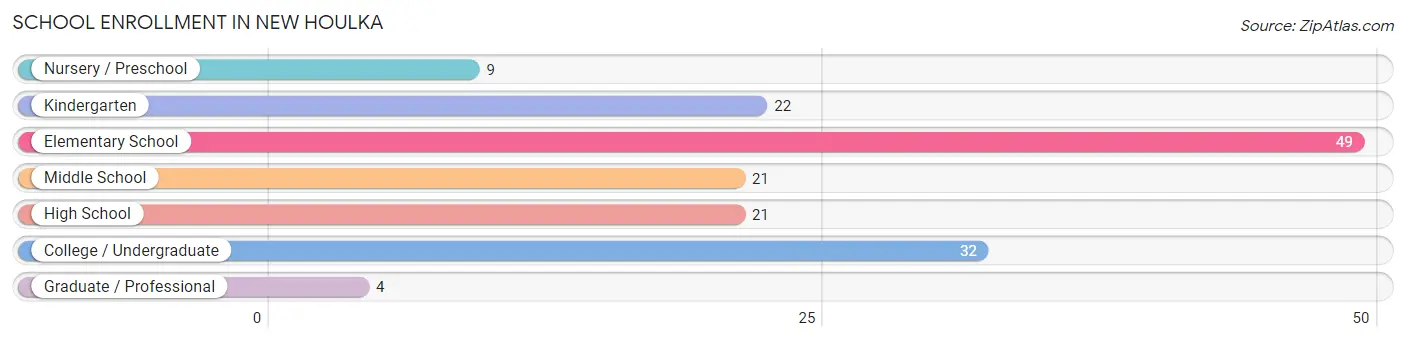
| School Level | # Students | % Students |
| Nursery / Preschool | 9 | 5.7% |
| Kindergarten | 22 | 13.9% |
| Elementary School | 49 | 31.0% |
| Middle School | 21 | 13.3% |
| High School | 21 | 13.3% |
| College / Undergraduate | 32 | 20.3% |
| Graduate / Professional | 4 | 2.5% |
| Total | 158 | 100.0% |
School Enrollment by Age by Funding Source in New Houlka
Out of a total of 158 students who are enrolled in schools in New Houlka, 3 (1.9%) attend a private institution, while the remaining 155 (98.1%) are enrolled in public schools. The age group of 3 to 4 year olds has the highest likelihood of being enrolled in private schools, with 2 (22.2% in the age bracket) enrolled. Conversely, the age group of 5 to 9 year old has the lowest likelihood of being enrolled in a private school, with 64 (100.0% in the age bracket) attending a public institution.
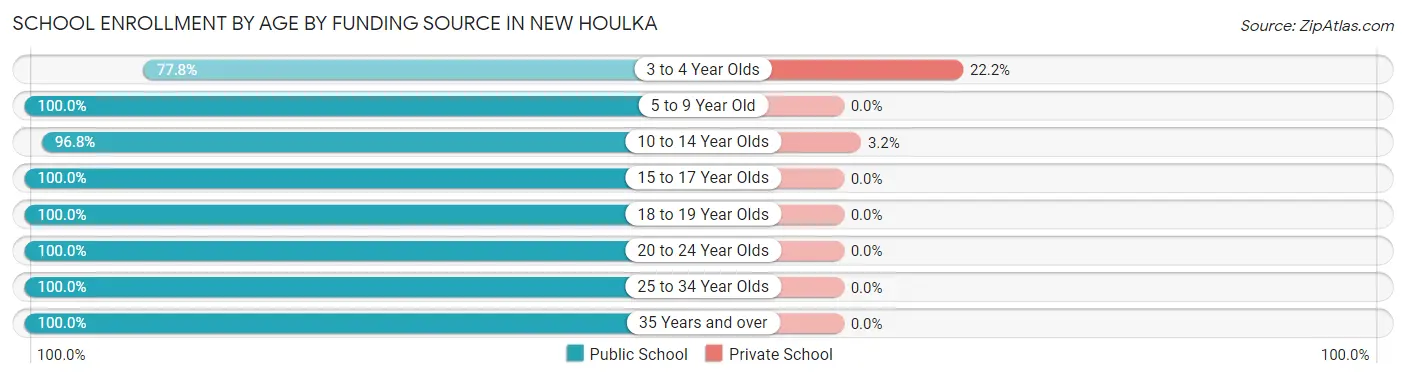
| Age Bracket | Public School | Private School |
| 3 to 4 Year Olds | 7 (77.8%) | 2 (22.2%) |
| 5 to 9 Year Old | 64 (100.0%) | 0 (0.0%) |
| 10 to 14 Year Olds | 30 (96.8%) | 1 (3.2%) |
| 15 to 17 Year Olds | 13 (100.0%) | 0 (0.0%) |
| 18 to 19 Year Olds | 11 (100.0%) | 0 (0.0%) |
| 20 to 24 Year Olds | 22 (100.0%) | 0 (0.0%) |
| 25 to 34 Year Olds | 3 (100.0%) | 0 (0.0%) |
| 35 Years and over | 5 (100.0%) | 0 (0.0%) |
| Total | 155 (98.1%) | 3 (1.9%) |
Educational Attainment by Field of Study in New Houlka
Education (12 | 30.8%), business (11 | 28.2%), arts & humanities (6 | 15.4%), literature & languages (4 | 10.3%), and bio, nature & agricultural (3 | 7.7%) are the most common fields of study among 39 individuals in New Houlka who have obtained a bachelor's degree or higher.
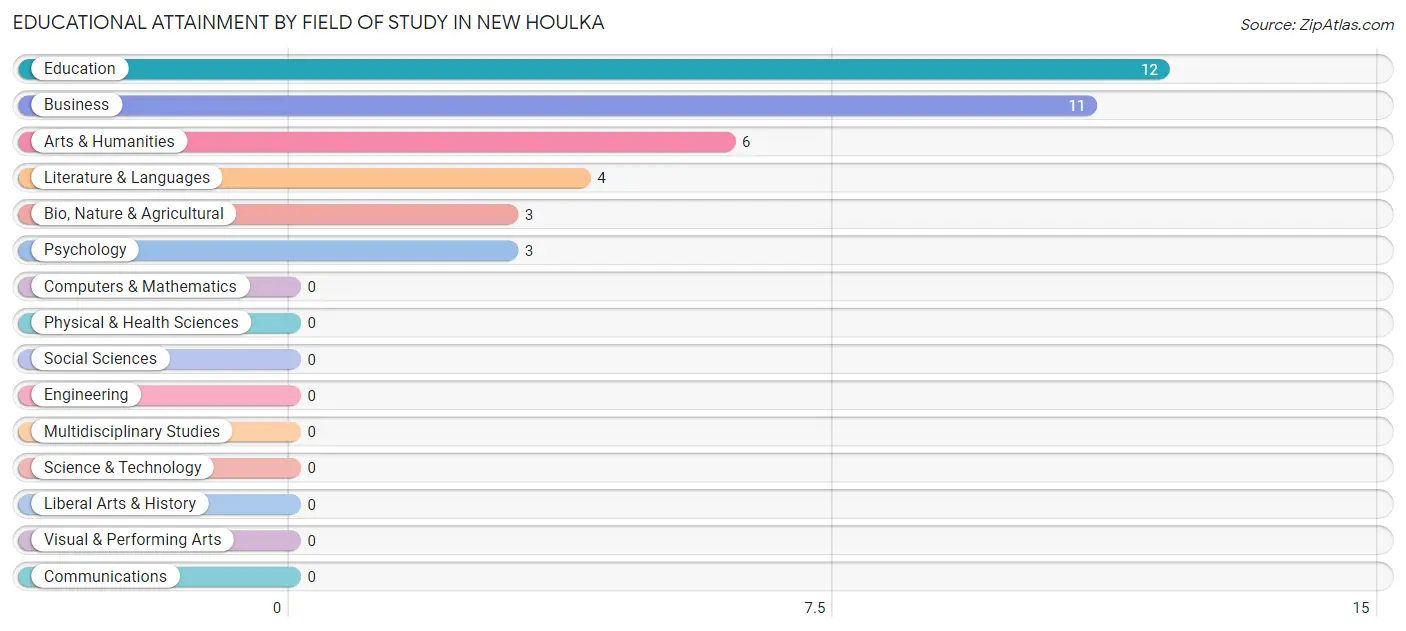
| Field of Study | # Graduates | % Graduates |
| Computers & Mathematics | 0 | 0.0% |
| Bio, Nature & Agricultural | 3 | 7.7% |
| Physical & Health Sciences | 0 | 0.0% |
| Psychology | 3 | 7.7% |
| Social Sciences | 0 | 0.0% |
| Engineering | 0 | 0.0% |
| Multidisciplinary Studies | 0 | 0.0% |
| Science & Technology | 0 | 0.0% |
| Business | 11 | 28.2% |
| Education | 12 | 30.8% |
| Literature & Languages | 4 | 10.3% |
| Liberal Arts & History | 0 | 0.0% |
| Visual & Performing Arts | 0 | 0.0% |
| Communications | 0 | 0.0% |
| Arts & Humanities | 6 | 15.4% |
| Total | 39 | 100.0% |
Transportation & Commute in New Houlka
Vehicle Availability by Sex in New Houlka
The most prevalent vehicle ownership categories in New Houlka are males with 3 vehicles (62, accounting for 64.6%) and females with 3 vehicles (62, making up 53.4%).
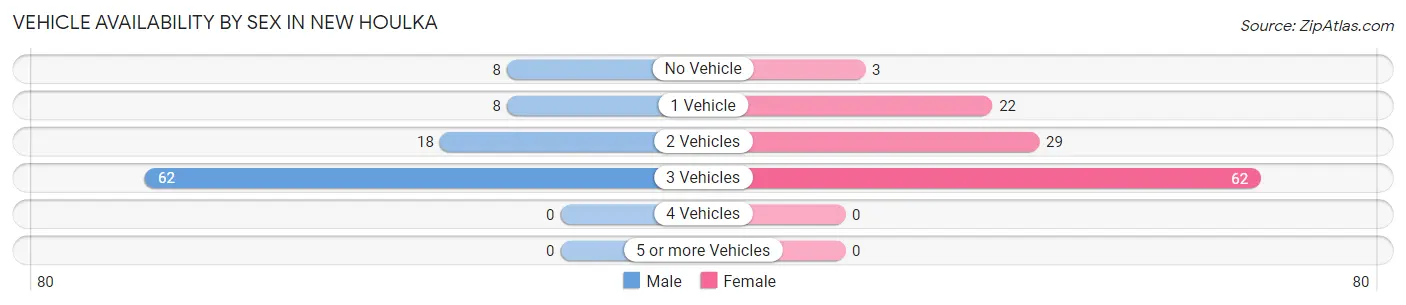
| Vehicles Available | Male | Female |
| No Vehicle | 8 (8.3%) | 3 (2.6%) |
| 1 Vehicle | 8 (8.3%) | 22 (19.0%) |
| 2 Vehicles | 18 (18.8%) | 29 (25.0%) |
| 3 Vehicles | 62 (64.6%) | 62 (53.4%) |
| 4 Vehicles | 0 (0.0%) | 0 (0.0%) |
| 5 or more Vehicles | 0 (0.0%) | 0 (0.0%) |
| Total | 96 (100.0%) | 116 (100.0%) |
Commute Time in New Houlka
The most frequently occuring commute durations in New Houlka are 15 to 19 minutes (59 commuters, 28.4%), 25 to 29 minutes (45 commuters, 21.6%), and 5 to 9 minutes (27 commuters, 13.0%).
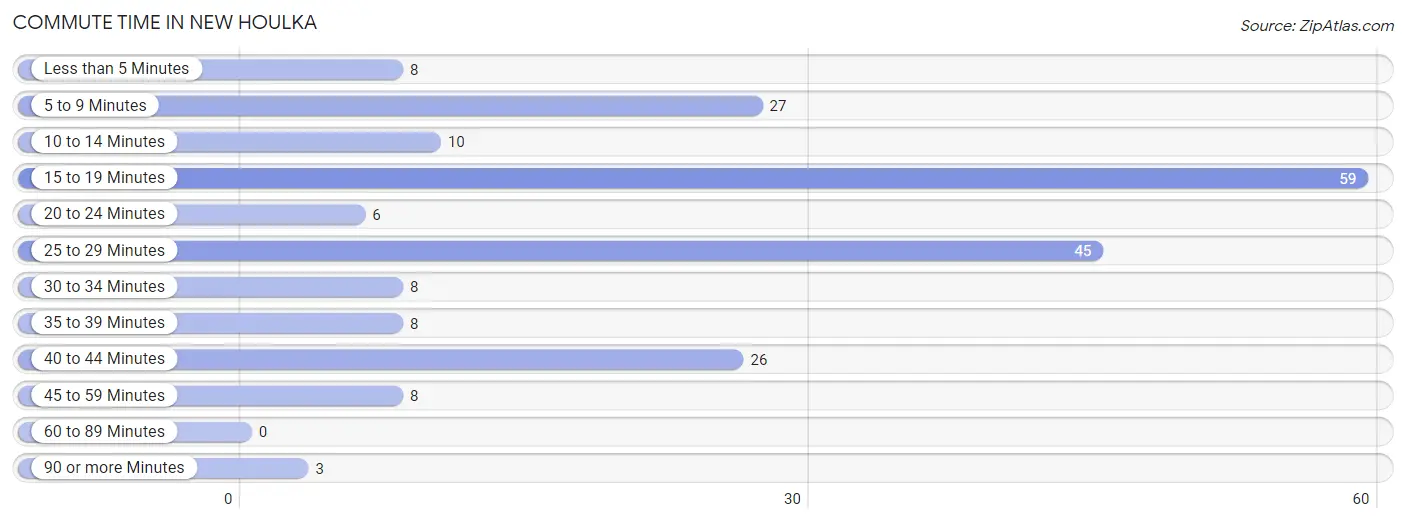
| Commute Time | # Commuters | % Commuters |
| Less than 5 Minutes | 8 | 3.8% |
| 5 to 9 Minutes | 27 | 13.0% |
| 10 to 14 Minutes | 10 | 4.8% |
| 15 to 19 Minutes | 59 | 28.4% |
| 20 to 24 Minutes | 6 | 2.9% |
| 25 to 29 Minutes | 45 | 21.6% |
| 30 to 34 Minutes | 8 | 3.8% |
| 35 to 39 Minutes | 8 | 3.8% |
| 40 to 44 Minutes | 26 | 12.5% |
| 45 to 59 Minutes | 8 | 3.8% |
| 60 to 89 Minutes | 0 | 0.0% |
| 90 or more Minutes | 3 | 1.4% |
Commute Time by Sex in New Houlka
The most common commute times in New Houlka are 15 to 19 minutes (27 commuters, 29.3%) for males and 15 to 19 minutes (32 commuters, 27.6%) for females.
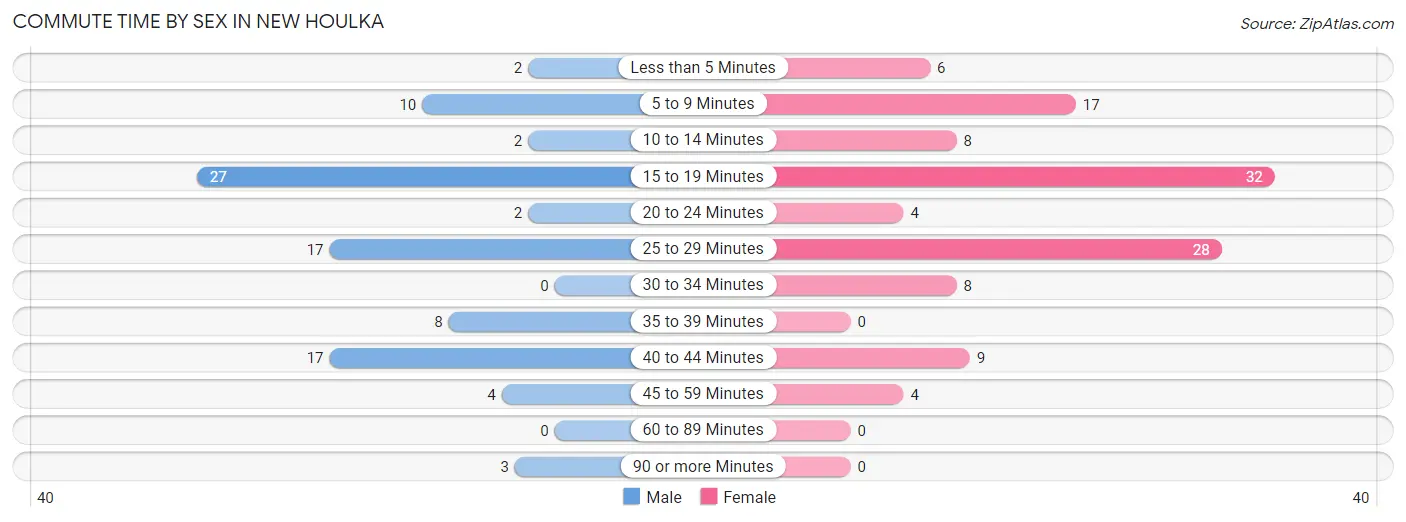
| Commute Time | Male | Female |
| Less than 5 Minutes | 2 (2.2%) | 6 (5.2%) |
| 5 to 9 Minutes | 10 (10.9%) | 17 (14.7%) |
| 10 to 14 Minutes | 2 (2.2%) | 8 (6.9%) |
| 15 to 19 Minutes | 27 (29.3%) | 32 (27.6%) |
| 20 to 24 Minutes | 2 (2.2%) | 4 (3.5%) |
| 25 to 29 Minutes | 17 (18.5%) | 28 (24.1%) |
| 30 to 34 Minutes | 0 (0.0%) | 8 (6.9%) |
| 35 to 39 Minutes | 8 (8.7%) | 0 (0.0%) |
| 40 to 44 Minutes | 17 (18.5%) | 9 (7.8%) |
| 45 to 59 Minutes | 4 (4.3%) | 4 (3.5%) |
| 60 to 89 Minutes | 0 (0.0%) | 0 (0.0%) |
| 90 or more Minutes | 3 (3.3%) | 0 (0.0%) |
Time of Departure to Work by Sex in New Houlka
The most frequent times of departure to work in New Houlka are 6:30 AM to 6:59 AM (32, 34.8%) for males and 6:00 AM to 6:29 AM (39, 33.6%) for females.
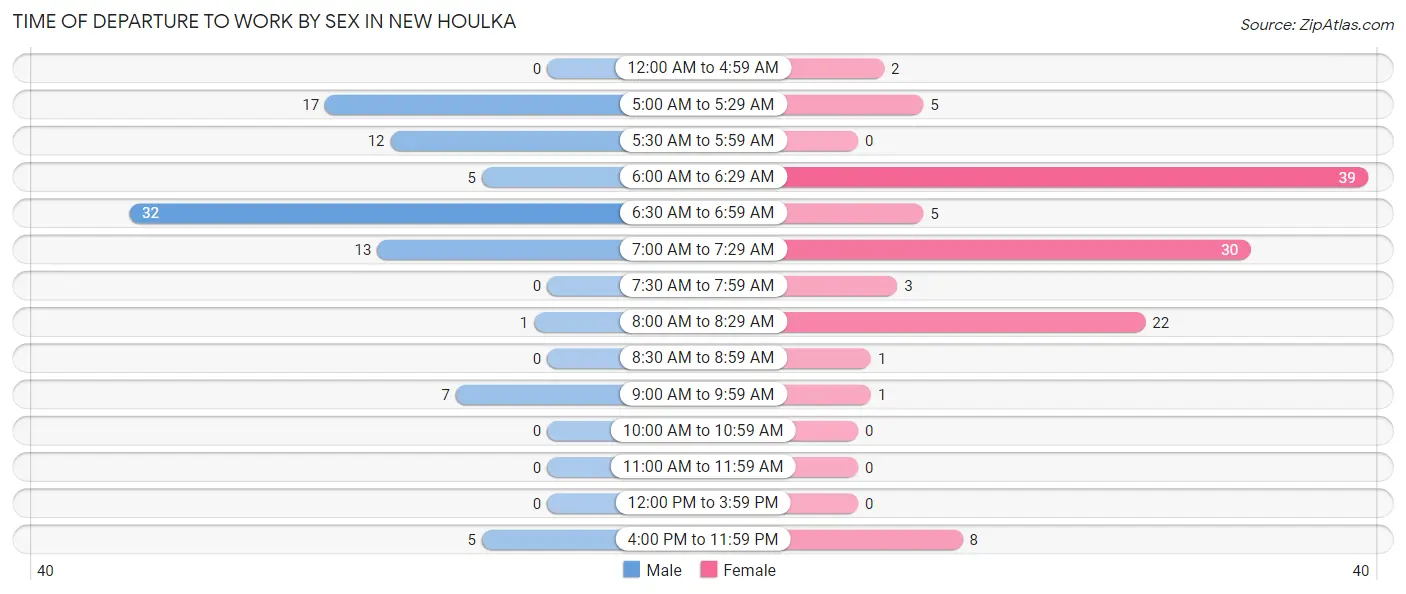
| Time of Departure | Male | Female |
| 12:00 AM to 4:59 AM | 0 (0.0%) | 2 (1.7%) |
| 5:00 AM to 5:29 AM | 17 (18.5%) | 5 (4.3%) |
| 5:30 AM to 5:59 AM | 12 (13.0%) | 0 (0.0%) |
| 6:00 AM to 6:29 AM | 5 (5.4%) | 39 (33.6%) |
| 6:30 AM to 6:59 AM | 32 (34.8%) | 5 (4.3%) |
| 7:00 AM to 7:29 AM | 13 (14.1%) | 30 (25.9%) |
| 7:30 AM to 7:59 AM | 0 (0.0%) | 3 (2.6%) |
| 8:00 AM to 8:29 AM | 1 (1.1%) | 22 (19.0%) |
| 8:30 AM to 8:59 AM | 0 (0.0%) | 1 (0.9%) |
| 9:00 AM to 9:59 AM | 7 (7.6%) | 1 (0.9%) |
| 10:00 AM to 10:59 AM | 0 (0.0%) | 0 (0.0%) |
| 11:00 AM to 11:59 AM | 0 (0.0%) | 0 (0.0%) |
| 12:00 PM to 3:59 PM | 0 (0.0%) | 0 (0.0%) |
| 4:00 PM to 11:59 PM | 5 (5.4%) | 8 (6.9%) |
| Total | 92 (100.0%) | 116 (100.0%) |
Housing Occupancy in New Houlka
Occupancy by Ownership in New Houlka
Of the total 184 dwellings in New Houlka, owner-occupied units account for 102 (55.4%), while renter-occupied units make up 82 (44.6%).
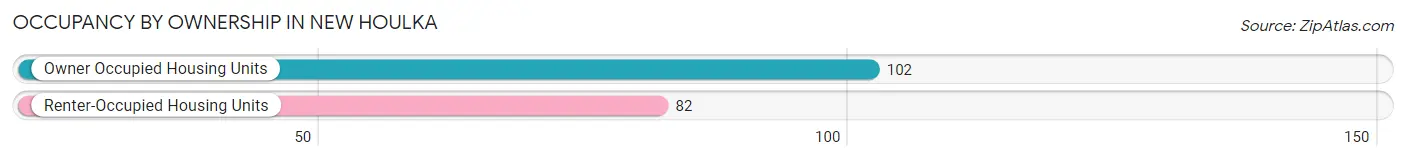
| Occupancy | # Housing Units | % Housing Units |
| Owner Occupied Housing Units | 102 | 55.4% |
| Renter-Occupied Housing Units | 82 | 44.6% |
| Total Occupied Housing Units | 184 | 100.0% |
Occupancy by Household Size in New Houlka
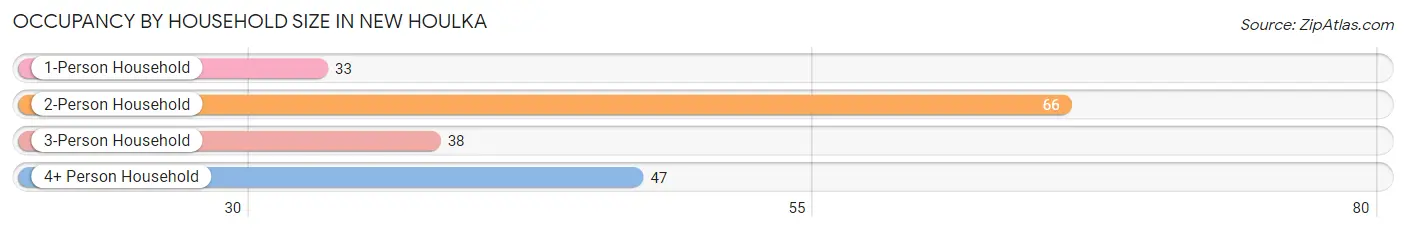
| Household Size | # Housing Units | % Housing Units |
| 1-Person Household | 33 | 17.9% |
| 2-Person Household | 66 | 35.9% |
| 3-Person Household | 38 | 20.6% |
| 4+ Person Household | 47 | 25.5% |
| Total Housing Units | 184 | 100.0% |
Occupancy by Ownership by Household Size in New Houlka
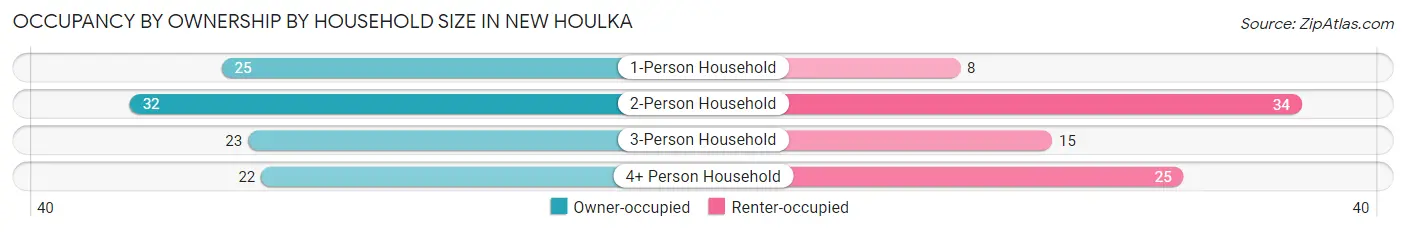
| Household Size | Owner-occupied | Renter-occupied |
| 1-Person Household | 25 (75.8%) | 8 (24.2%) |
| 2-Person Household | 32 (48.5%) | 34 (51.5%) |
| 3-Person Household | 23 (60.5%) | 15 (39.5%) |
| 4+ Person Household | 22 (46.8%) | 25 (53.2%) |
| Total Housing Units | 102 (55.4%) | 82 (44.6%) |
Occupancy by Educational Attainment in New Houlka
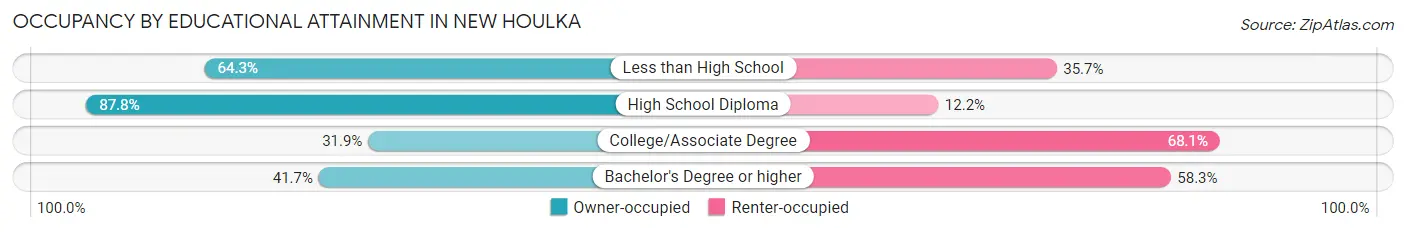
| Household Size | Owner-occupied | Renter-occupied |
| Less than High School | 27 (64.3%) | 15 (35.7%) |
| High School Diploma | 43 (87.8%) | 6 (12.2%) |
| College/Associate Degree | 22 (31.9%) | 47 (68.1%) |
| Bachelor's Degree or higher | 10 (41.7%) | 14 (58.3%) |
Occupancy by Age of Householder in New Houlka
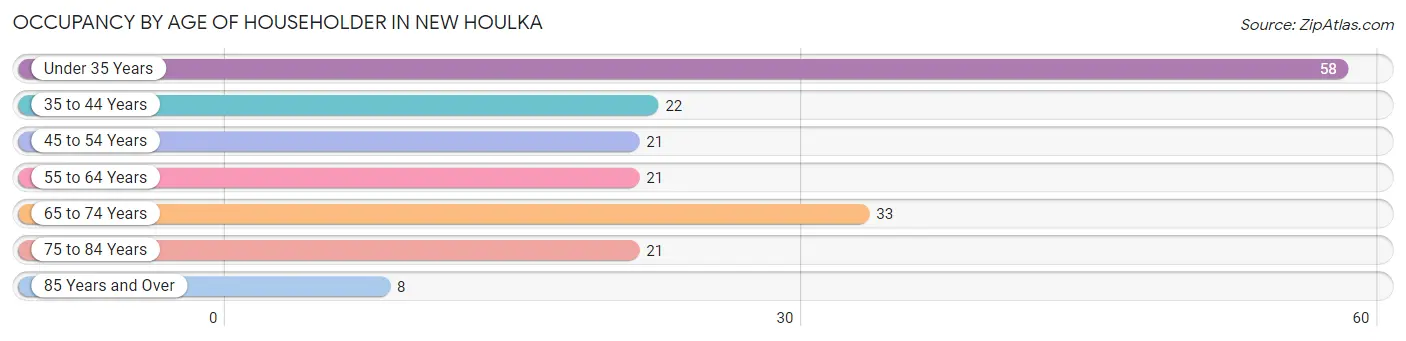
| Age Bracket | # Households | % Households |
| Under 35 Years | 58 | 31.5% |
| 35 to 44 Years | 22 | 12.0% |
| 45 to 54 Years | 21 | 11.4% |
| 55 to 64 Years | 21 | 11.4% |
| 65 to 74 Years | 33 | 17.9% |
| 75 to 84 Years | 21 | 11.4% |
| 85 Years and Over | 8 | 4.3% |
| Total | 184 | 100.0% |
Housing Finances in New Houlka
Median Income by Occupancy in New Houlka
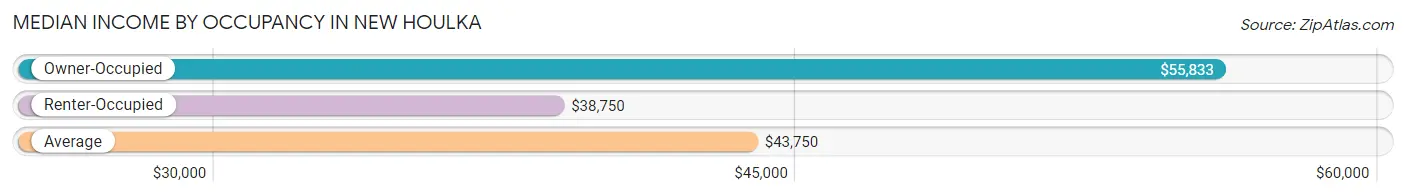
| Occupancy Type | # Households | Median Income |
| Owner-Occupied | 102 (55.4%) | $55,833 |
| Renter-Occupied | 82 (44.6%) | $38,750 |
| Average | 184 (100.0%) | $43,750 |
Occupancy by Householder Income Bracket in New Houlka
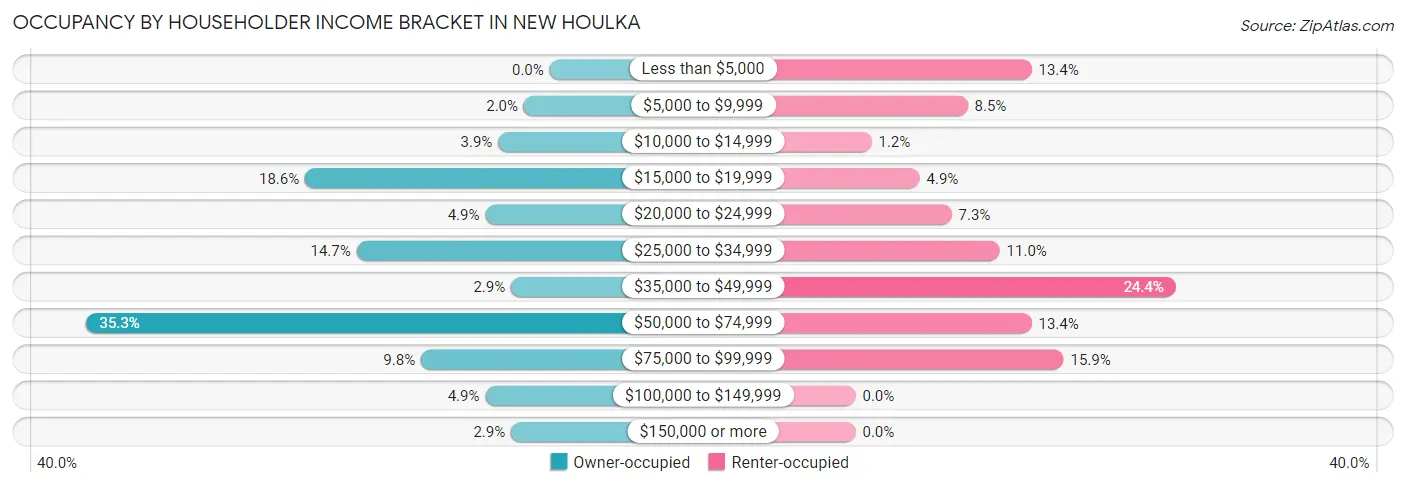
| Income Bracket | Owner-occupied | Renter-occupied |
| Less than $5,000 | 0 (0.0%) | 11 (13.4%) |
| $5,000 to $9,999 | 2 (2.0%) | 7 (8.5%) |
| $10,000 to $14,999 | 4 (3.9%) | 1 (1.2%) |
| $15,000 to $19,999 | 19 (18.6%) | 4 (4.9%) |
| $20,000 to $24,999 | 5 (4.9%) | 6 (7.3%) |
| $25,000 to $34,999 | 15 (14.7%) | 9 (11.0%) |
| $35,000 to $49,999 | 3 (2.9%) | 20 (24.4%) |
| $50,000 to $74,999 | 36 (35.3%) | 11 (13.4%) |
| $75,000 to $99,999 | 10 (9.8%) | 13 (15.9%) |
| $100,000 to $149,999 | 5 (4.9%) | 0 (0.0%) |
| $150,000 or more | 3 (2.9%) | 0 (0.0%) |
| Total | 102 (100.0%) | 82 (100.0%) |
Monthly Housing Cost Tiers in New Houlka
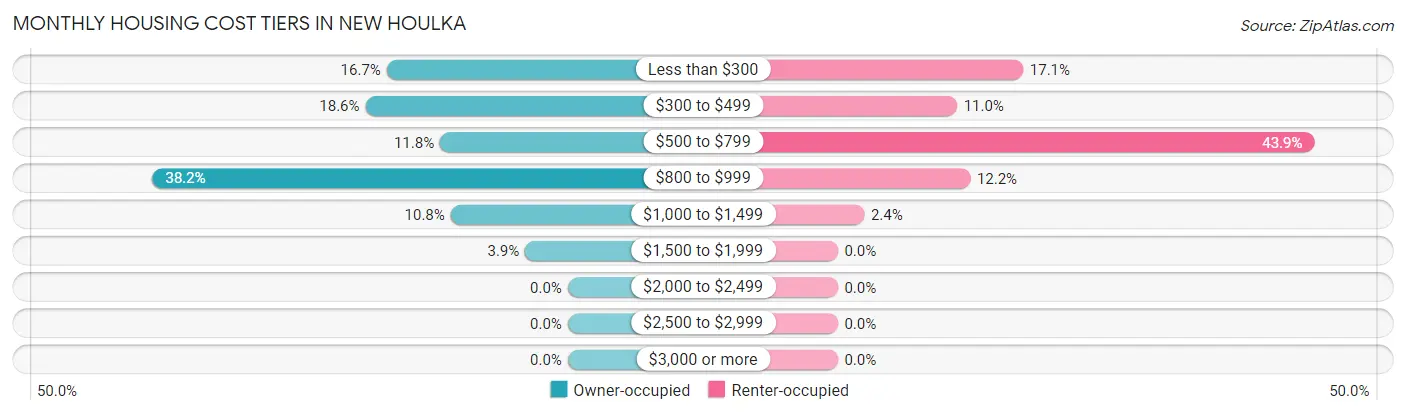
| Monthly Cost | Owner-occupied | Renter-occupied |
| Less than $300 | 17 (16.7%) | 14 (17.1%) |
| $300 to $499 | 19 (18.6%) | 9 (11.0%) |
| $500 to $799 | 12 (11.8%) | 36 (43.9%) |
| $800 to $999 | 39 (38.2%) | 10 (12.2%) |
| $1,000 to $1,499 | 11 (10.8%) | 2 (2.4%) |
| $1,500 to $1,999 | 4 (3.9%) | 0 (0.0%) |
| $2,000 to $2,499 | 0 (0.0%) | 0 (0.0%) |
| $2,500 to $2,999 | 0 (0.0%) | 0 (0.0%) |
| $3,000 or more | 0 (0.0%) | 0 (0.0%) |
| Total | 102 (100.0%) | 82 (100.0%) |
Physical Housing Characteristics in New Houlka
Housing Structures in New Houlka
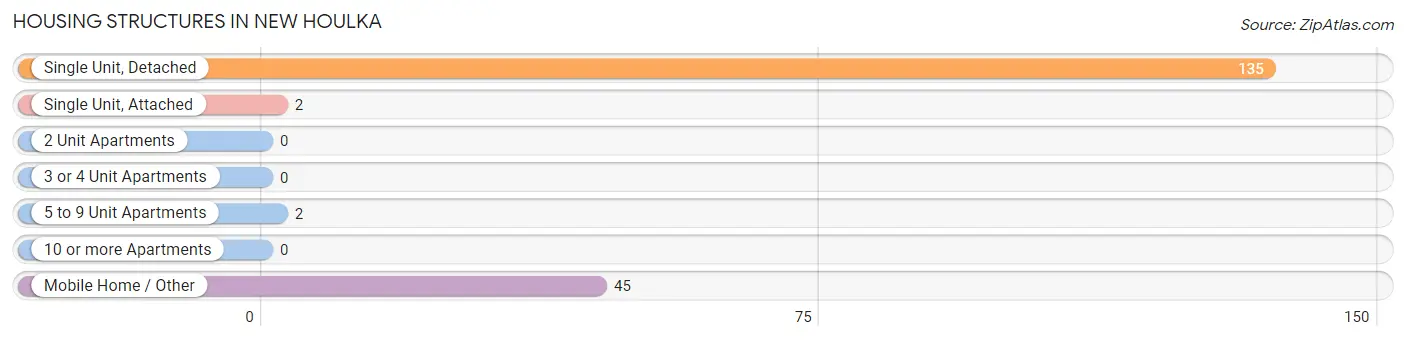
| Structure Type | # Housing Units | % Housing Units |
| Single Unit, Detached | 135 | 73.4% |
| Single Unit, Attached | 2 | 1.1% |
| 2 Unit Apartments | 0 | 0.0% |
| 3 or 4 Unit Apartments | 0 | 0.0% |
| 5 to 9 Unit Apartments | 2 | 1.1% |
| 10 or more Apartments | 0 | 0.0% |
| Mobile Home / Other | 45 | 24.5% |
| Total | 184 | 100.0% |
Housing Structures by Occupancy in New Houlka
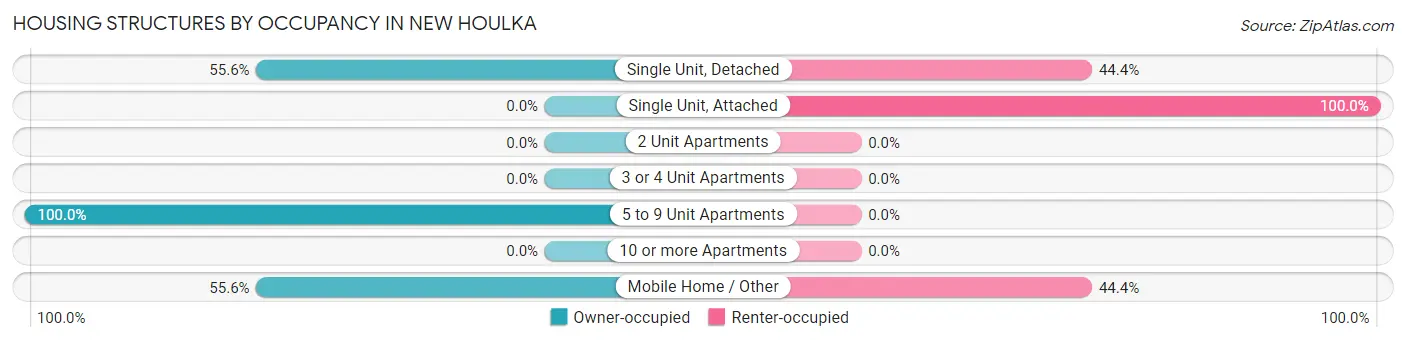
| Structure Type | Owner-occupied | Renter-occupied |
| Single Unit, Detached | 75 (55.6%) | 60 (44.4%) |
| Single Unit, Attached | 0 (0.0%) | 2 (100.0%) |
| 2 Unit Apartments | 0 (0.0%) | 0 (0.0%) |
| 3 or 4 Unit Apartments | 0 (0.0%) | 0 (0.0%) |
| 5 to 9 Unit Apartments | 2 (100.0%) | 0 (0.0%) |
| 10 or more Apartments | 0 (0.0%) | 0 (0.0%) |
| Mobile Home / Other | 25 (55.6%) | 20 (44.4%) |
| Total | 102 (55.4%) | 82 (44.6%) |
Housing Structures by Number of Rooms in New Houlka
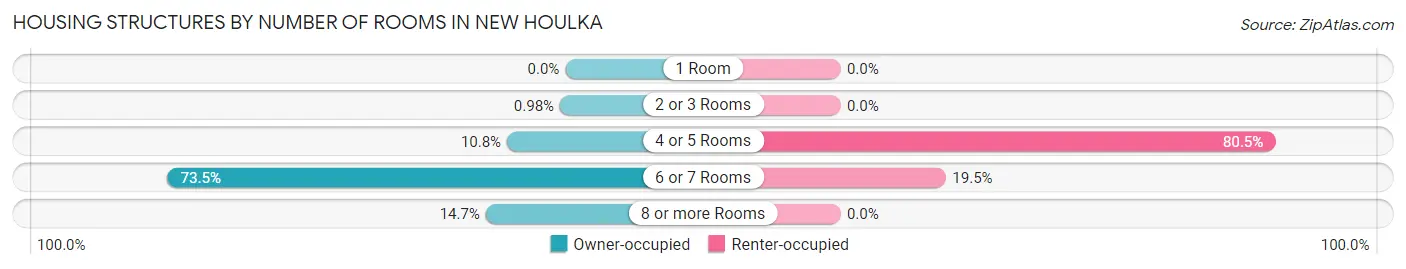
| Number of Rooms | Owner-occupied | Renter-occupied |
| 1 Room | 0 (0.0%) | 0 (0.0%) |
| 2 or 3 Rooms | 1 (1.0%) | 0 (0.0%) |
| 4 or 5 Rooms | 11 (10.8%) | 66 (80.5%) |
| 6 or 7 Rooms | 75 (73.5%) | 16 (19.5%) |
| 8 or more Rooms | 15 (14.7%) | 0 (0.0%) |
| Total | 102 (100.0%) | 82 (100.0%) |
Housing Structure by Heating Type in New Houlka
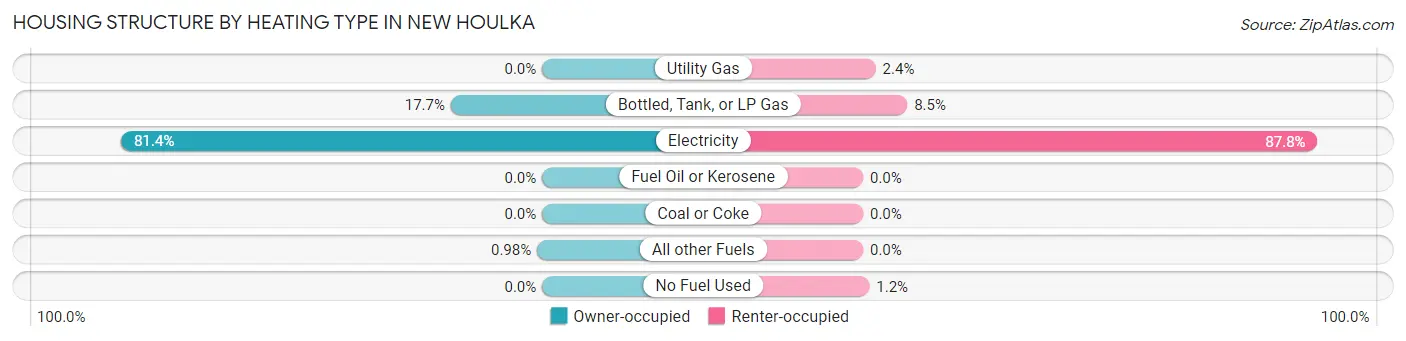
| Heating Type | Owner-occupied | Renter-occupied |
| Utility Gas | 0 (0.0%) | 2 (2.4%) |
| Bottled, Tank, or LP Gas | 18 (17.6%) | 7 (8.5%) |
| Electricity | 83 (81.4%) | 72 (87.8%) |
| Fuel Oil or Kerosene | 0 (0.0%) | 0 (0.0%) |
| Coal or Coke | 0 (0.0%) | 0 (0.0%) |
| All other Fuels | 1 (1.0%) | 0 (0.0%) |
| No Fuel Used | 0 (0.0%) | 1 (1.2%) |
| Total | 102 (100.0%) | 82 (100.0%) |
Household Vehicle Usage in New Houlka
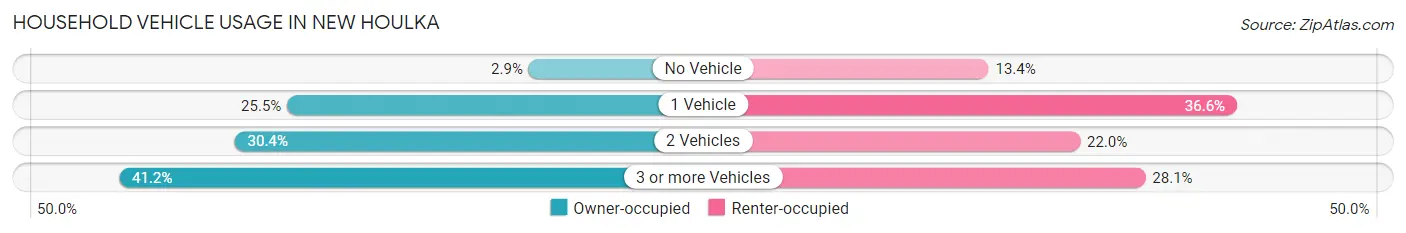
| Vehicles per Household | Owner-occupied | Renter-occupied |
| No Vehicle | 3 (2.9%) | 11 (13.4%) |
| 1 Vehicle | 26 (25.5%) | 30 (36.6%) |
| 2 Vehicles | 31 (30.4%) | 18 (22.0%) |
| 3 or more Vehicles | 42 (41.2%) | 23 (28.1%) |
| Total | 102 (100.0%) | 82 (100.0%) |
Real Estate & Mortgages in New Houlka
Real Estate and Mortgage Overview in New Houlka
| Characteristic | Without Mortgage | With Mortgage |
| Housing Units | 43 | 59 |
| Median Property Value | $84,100 | $83,400 |
| Median Household Income | $55,417 | $2 |
| Monthly Housing Costs | $345 | $0 |
| Real Estate Taxes | - | - |
Property Value by Mortgage Status in New Houlka
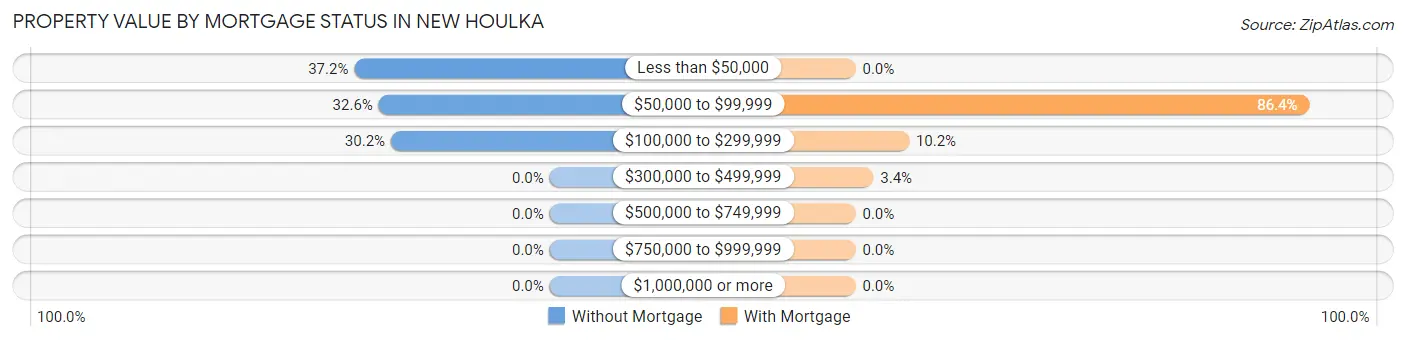
| Property Value | Without Mortgage | With Mortgage |
| Less than $50,000 | 16 (37.2%) | 0 (0.0%) |
| $50,000 to $99,999 | 14 (32.6%) | 51 (86.4%) |
| $100,000 to $299,999 | 13 (30.2%) | 6 (10.2%) |
| $300,000 to $499,999 | 0 (0.0%) | 2 (3.4%) |
| $500,000 to $749,999 | 0 (0.0%) | 0 (0.0%) |
| $750,000 to $999,999 | 0 (0.0%) | 0 (0.0%) |
| $1,000,000 or more | 0 (0.0%) | 0 (0.0%) |
| Total | 43 (100.0%) | 59 (100.0%) |
Household Income by Mortgage Status in New Houlka
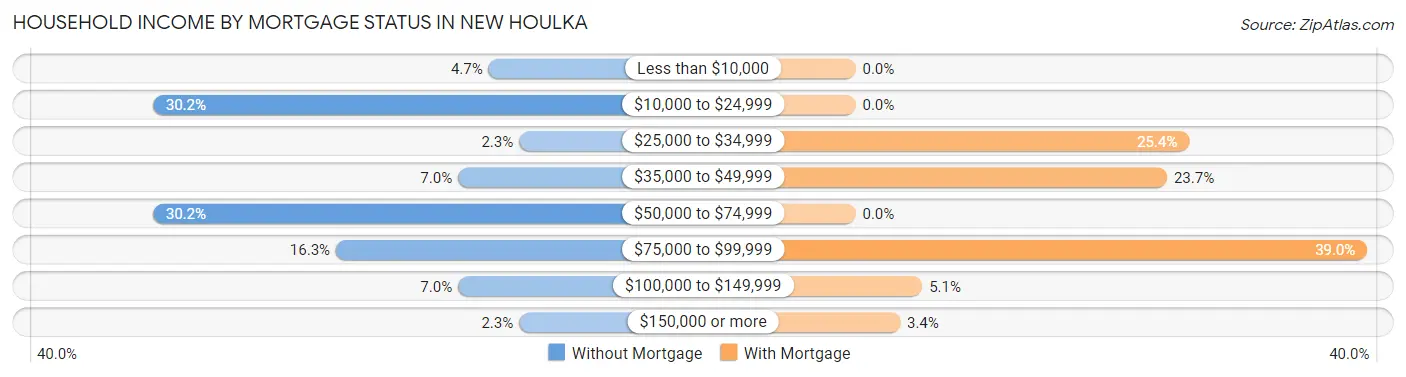
| Household Income | Without Mortgage | With Mortgage |
| Less than $10,000 | 2 (4.6%) | 0 (0.0%) |
| $10,000 to $24,999 | 13 (30.2%) | 0 (0.0%) |
| $25,000 to $34,999 | 1 (2.3%) | 15 (25.4%) |
| $35,000 to $49,999 | 3 (7.0%) | 14 (23.7%) |
| $50,000 to $74,999 | 13 (30.2%) | 0 (0.0%) |
| $75,000 to $99,999 | 7 (16.3%) | 23 (39.0%) |
| $100,000 to $149,999 | 3 (7.0%) | 3 (5.1%) |
| $150,000 or more | 1 (2.3%) | 2 (3.4%) |
| Total | 43 (100.0%) | 59 (100.0%) |
Property Value to Household Income Ratio in New Houlka
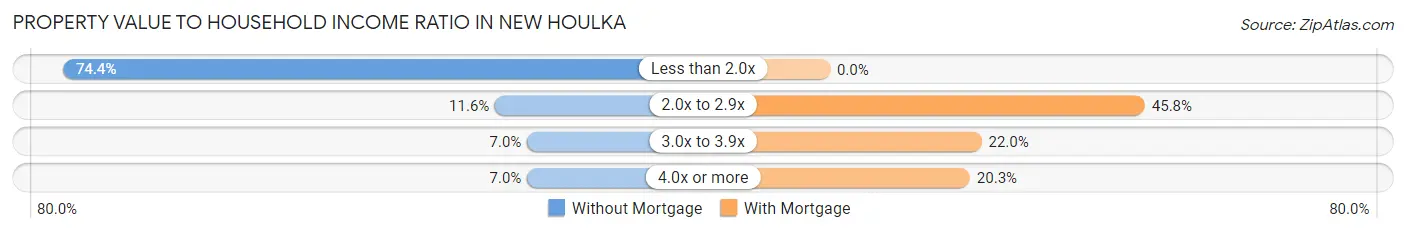
| Value-to-Income Ratio | Without Mortgage | With Mortgage |
| Less than 2.0x | 32 (74.4%) | 0 (0.0%) |
| 2.0x to 2.9x | 5 (11.6%) | 27 (45.8%) |
| 3.0x to 3.9x | 3 (7.0%) | 13 (22.0%) |
| 4.0x or more | 3 (7.0%) | 12 (20.3%) |
| Total | 43 (100.0%) | 59 (100.0%) |
Real Estate Taxes by Mortgage Status in New Houlka
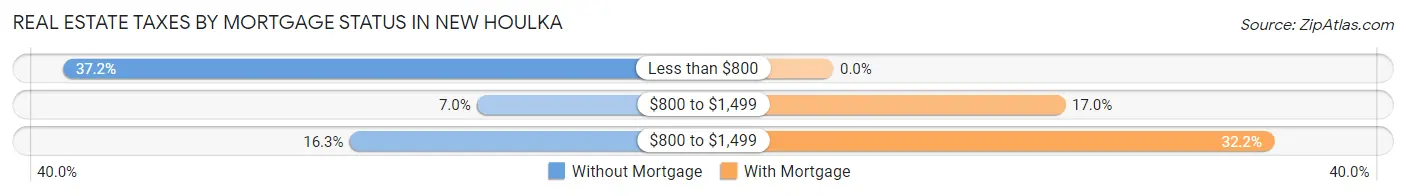
| Property Taxes | Without Mortgage | With Mortgage |
| Less than $800 | 16 (37.2%) | 0 (0.0%) |
| $800 to $1,499 | 3 (7.0%) | 10 (17.0%) |
| $800 to $1,499 | 7 (16.3%) | 19 (32.2%) |
| Total | 43 (100.0%) | 59 (100.0%) |
Health & Disability in New Houlka
Health Insurance Coverage by Age in New Houlka
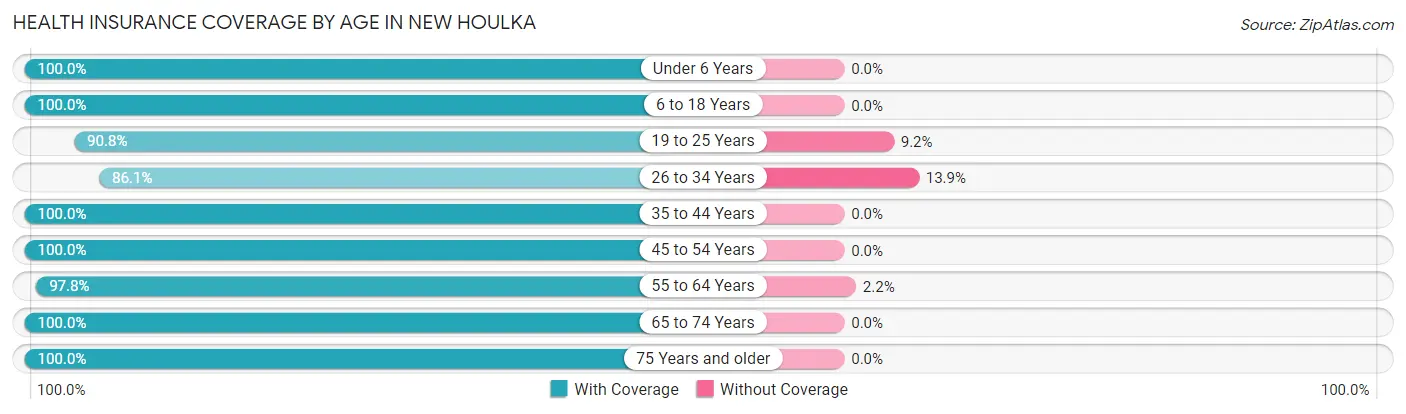
| Age Bracket | With Coverage | Without Coverage |
| Under 6 Years | 73 (100.0%) | 0 (0.0%) |
| 6 to 18 Years | 106 (100.0%) | 0 (0.0%) |
| 19 to 25 Years | 59 (90.8%) | 6 (9.2%) |
| 26 to 34 Years | 93 (86.1%) | 15 (13.9%) |
| 35 to 44 Years | 38 (100.0%) | 0 (0.0%) |
| 45 to 54 Years | 29 (100.0%) | 0 (0.0%) |
| 55 to 64 Years | 45 (97.8%) | 1 (2.2%) |
| 65 to 74 Years | 63 (100.0%) | 0 (0.0%) |
| 75 Years and older | 36 (100.0%) | 0 (0.0%) |
| Total | 542 (96.1%) | 22 (3.9%) |
Health Insurance Coverage by Citizenship Status in New Houlka
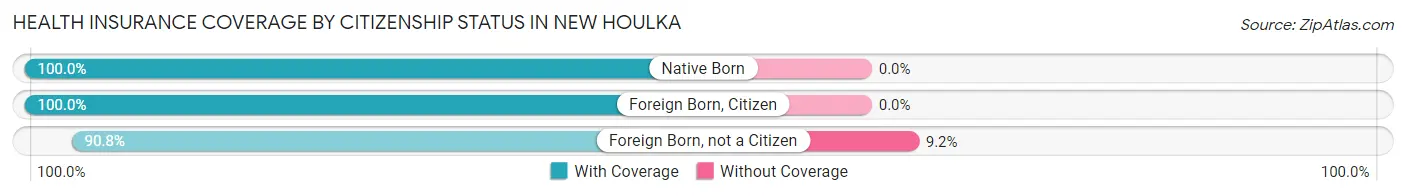
| Citizenship Status | With Coverage | Without Coverage |
| Native Born | 73 (100.0%) | 0 (0.0%) |
| Foreign Born, Citizen | 106 (100.0%) | 0 (0.0%) |
| Foreign Born, not a Citizen | 59 (90.8%) | 6 (9.2%) |
Health Insurance Coverage by Household Income in New Houlka
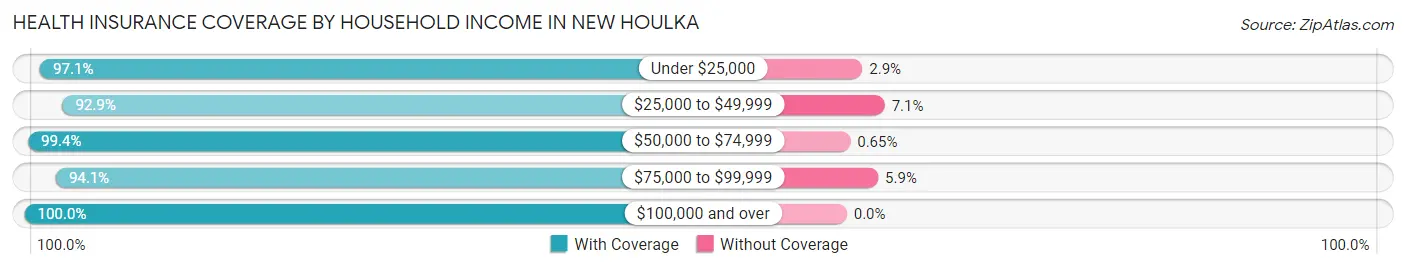
| Household Income | With Coverage | Without Coverage |
| Under $25,000 | 133 (97.1%) | 4 (2.9%) |
| $25,000 to $49,999 | 170 (92.9%) | 13 (7.1%) |
| $50,000 to $74,999 | 153 (99.4%) | 1 (0.6%) |
| $75,000 to $99,999 | 64 (94.1%) | 4 (5.9%) |
| $100,000 and over | 22 (100.0%) | 0 (0.0%) |
Public vs Private Health Insurance Coverage by Age in New Houlka
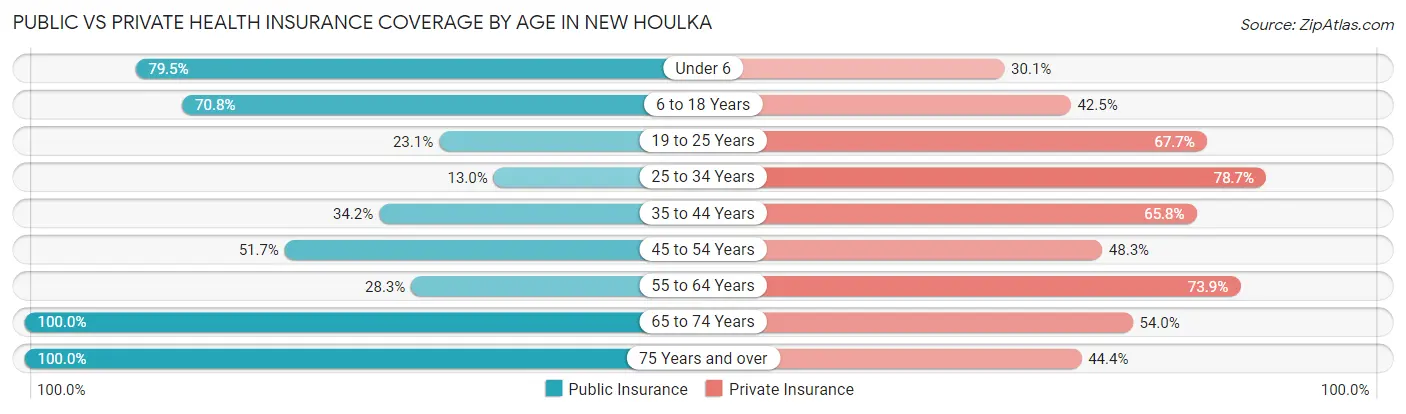
| Age Bracket | Public Insurance | Private Insurance |
| Under 6 | 58 (79.4%) | 22 (30.1%) |
| 6 to 18 Years | 75 (70.8%) | 45 (42.4%) |
| 19 to 25 Years | 15 (23.1%) | 44 (67.7%) |
| 25 to 34 Years | 14 (13.0%) | 85 (78.7%) |
| 35 to 44 Years | 13 (34.2%) | 25 (65.8%) |
| 45 to 54 Years | 15 (51.7%) | 14 (48.3%) |
| 55 to 64 Years | 13 (28.3%) | 34 (73.9%) |
| 65 to 74 Years | 63 (100.0%) | 34 (54.0%) |
| 75 Years and over | 36 (100.0%) | 16 (44.4%) |
| Total | 302 (53.5%) | 319 (56.6%) |
Disability Status by Sex by Age in New Houlka
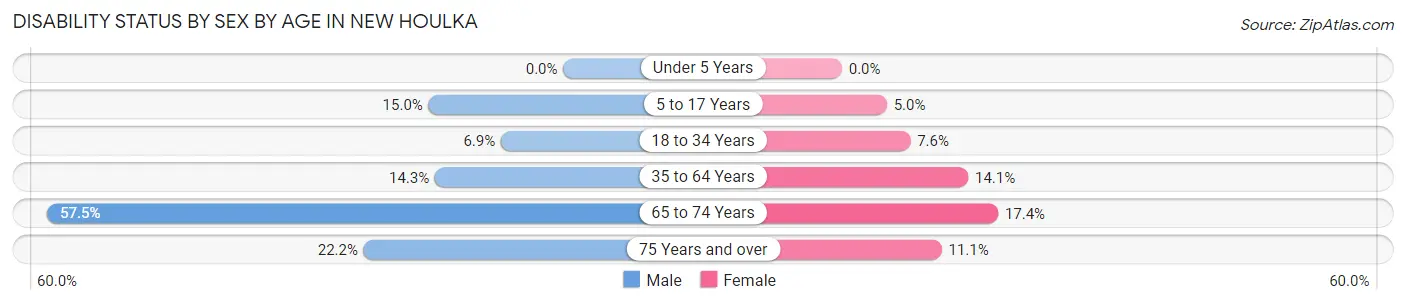
| Age Bracket | Male | Female |
| Under 5 Years | 0 (0.0%) | 0 (0.0%) |
| 5 to 17 Years | 9 (15.0%) | 3 (5.0%) |
| 18 to 34 Years | 5 (6.9%) | 8 (7.6%) |
| 35 to 64 Years | 7 (14.3%) | 9 (14.1%) |
| 65 to 74 Years | 23 (57.5%) | 4 (17.4%) |
| 75 Years and over | 4 (22.2%) | 2 (11.1%) |
Disability Class by Sex by Age in New Houlka
Disability Class: Hearing Difficulty
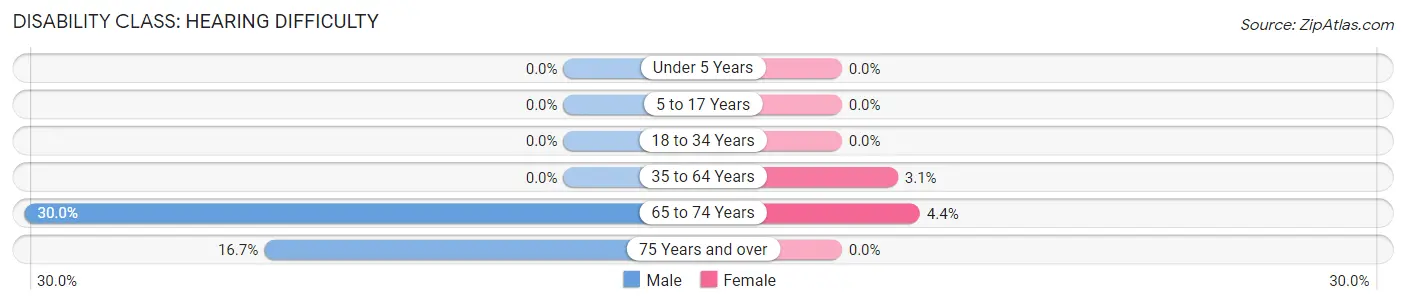
| Age Bracket | Male | Female |
| Under 5 Years | 0 (0.0%) | 0 (0.0%) |
| 5 to 17 Years | 0 (0.0%) | 0 (0.0%) |
| 18 to 34 Years | 0 (0.0%) | 0 (0.0%) |
| 35 to 64 Years | 0 (0.0%) | 2 (3.1%) |
| 65 to 74 Years | 12 (30.0%) | 1 (4.3%) |
| 75 Years and over | 3 (16.7%) | 0 (0.0%) |
Disability Class: Vision Difficulty
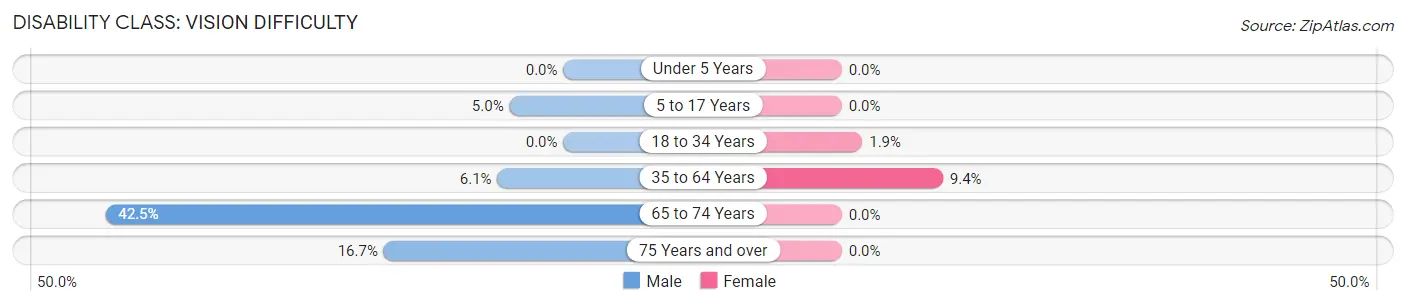
| Age Bracket | Male | Female |
| Under 5 Years | 0 (0.0%) | 0 (0.0%) |
| 5 to 17 Years | 3 (5.0%) | 0 (0.0%) |
| 18 to 34 Years | 0 (0.0%) | 2 (1.9%) |
| 35 to 64 Years | 3 (6.1%) | 6 (9.4%) |
| 65 to 74 Years | 17 (42.5%) | 0 (0.0%) |
| 75 Years and over | 3 (16.7%) | 0 (0.0%) |
Disability Class: Cognitive Difficulty
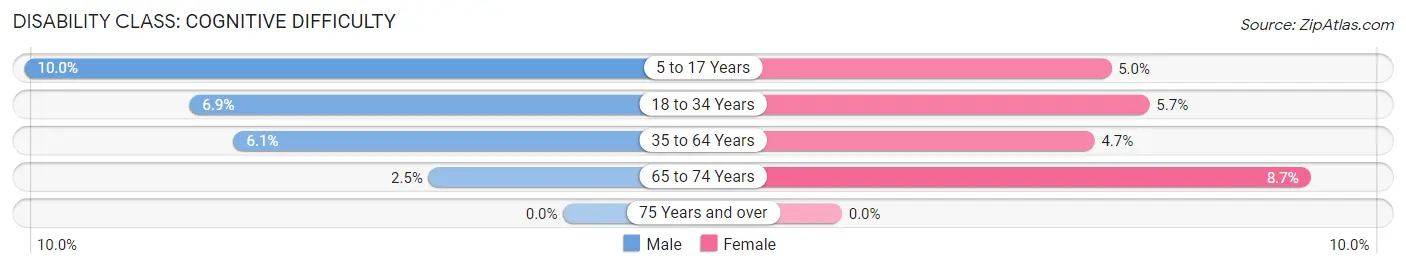
| Age Bracket | Male | Female |
| 5 to 17 Years | 6 (10.0%) | 3 (5.0%) |
| 18 to 34 Years | 5 (6.9%) | 6 (5.7%) |
| 35 to 64 Years | 3 (6.1%) | 3 (4.7%) |
| 65 to 74 Years | 1 (2.5%) | 2 (8.7%) |
| 75 Years and over | 0 (0.0%) | 0 (0.0%) |
Disability Class: Ambulatory Difficulty
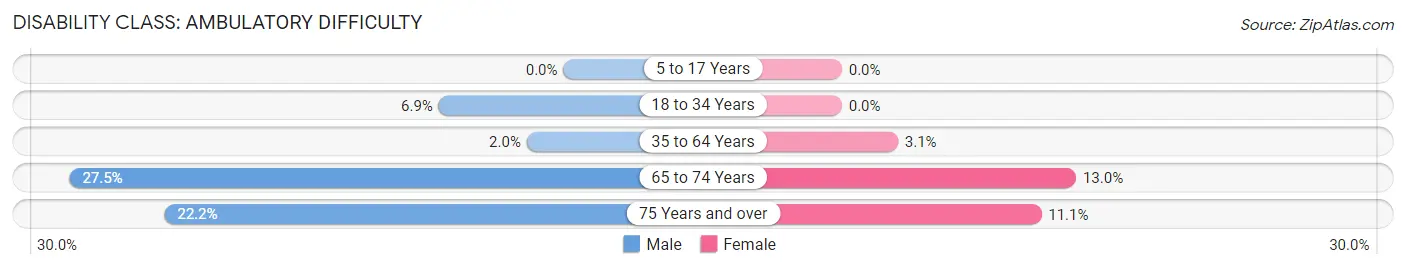
| Age Bracket | Male | Female |
| 5 to 17 Years | 0 (0.0%) | 0 (0.0%) |
| 18 to 34 Years | 5 (6.9%) | 0 (0.0%) |
| 35 to 64 Years | 1 (2.0%) | 2 (3.1%) |
| 65 to 74 Years | 11 (27.5%) | 3 (13.0%) |
| 75 Years and over | 4 (22.2%) | 2 (11.1%) |
Disability Class: Self-Care Difficulty
| Age Bracket | Male | Female |
| 5 to 17 Years | 0 (0.0%) | 0 (0.0%) |
| 18 to 34 Years | 5 (6.9%) | 0 (0.0%) |
| 35 to 64 Years | 0 (0.0%) | 2 (3.1%) |
| 65 to 74 Years | 0 (0.0%) | 0 (0.0%) |
| 75 Years and over | 3 (16.7%) | 0 (0.0%) |
Technology Access in New Houlka
Computing Device Access in New Houlka
| Device Type | # Households | % Households |
| Desktop or Laptop | 90 | 48.9% |
| Smartphone | 152 | 82.6% |
| Tablet | 81 | 44.0% |
| No Computing Device | 24 | 13.0% |
| Total | 184 | 100.0% |
Internet Access in New Houlka
| Internet Type | # Households | % Households |
| Dial-Up Internet | 0 | 0.0% |
| Broadband Home | 89 | 48.4% |
| Cellular Data Only | 43 | 23.4% |
| Satellite Internet | 25 | 13.6% |
| No Internet | 37 | 20.1% |
| Total | 184 | 100.0% |
New Houlka Summary
Houlka is a small town located in Chickasaw County, Mississippi. It is situated in the northeast corner of the state, approximately 20 miles from Tupelo and 30 miles from Oxford. The town was founded in 1872 and has a population of approximately 1,000 people.
History
Houlka was founded in 1872 by a group of settlers from Tennessee. The town was named after the Houlka Creek, which runs through the area. The creek was named after a Choctaw Indian chief who lived in the area. The town was originally a farming community, and the main crops were cotton and corn.
In the early 1900s, the town began to grow and develop. The first school was built in 1906, and the first bank opened in 1908. The town also had a post office, a hotel, and a few stores.
In the 1920s, the town began to experience a period of growth and prosperity. The population increased from 500 to 1,000 people. The town also had a movie theater, a library, and a hospital.
In the 1950s, the town experienced a decline in population as many people moved away to larger cities. The population decreased to 500 people.
In the 1970s, the town began to experience a resurgence in population. The population increased to 1,000 people. The town also had a new school, a new library, and a new hospital.
Geography
Houlka is located in the northeast corner of Mississippi, approximately 20 miles from Tupelo and 30 miles from Oxford. The town is situated in the foothills of the Appalachian Mountains. The town is surrounded by rolling hills and forests. The town is located on the banks of the Houlka Creek, which runs through the area.
Economy
The economy of Houlka is largely based on agriculture. The main crops are cotton, corn, soybeans, and wheat. The town also has a few small businesses, such as a grocery store, a hardware store, and a few restaurants.
Demographics
As of the 2010 census, the population of Houlka was 1,000 people. The racial makeup of the town was 97.2% White, 0.9% African American, 0.3% Native American, 0.3% Asian, and 1.3% from other races. The median household income was $30,000. The median age was 40 years.
Conclusion
Houlka is a small town located in Chickasaw County, Mississippi. It was founded in 1872 and has a population of approximately 1,000 people. The town is situated in the foothills of the Appalachian Mountains and is surrounded by rolling hills and forests. The economy of Houlka is largely based on agriculture, and the main crops are cotton, corn, soybeans, and wheat. The racial makeup of the town is 97.2% White, 0.9% African American, 0.3% Native American, 0.3% Asian, and 1.3% from other races. The median household income is $30,000 and the median age is 40 years.
Common Questions
What is Per Capita Income in New Houlka?
Per Capita income in New Houlka is $17,555.
What is the Median Family Income in New Houlka?
Median Family Income in New Houlka is $45,375.
What is the Median Household income in New Houlka?
Median Household Income in New Houlka is $43,750.
What is Income or Wage Gap in New Houlka?
Income or Wage Gap in New Houlka is 63.4%.
Women in New Houlka earn 36.6 cents for every dollar earned by a man.
What is Family Income Deficit in New Houlka?
Family Income Deficit in New Houlka is $13,481.
Families that are below poverty line in New Houlka earn $13,481 less on average than the poverty threshold level.
What is Inequality or Gini Index in New Houlka?
Inequality or Gini Index in New Houlka is 0.37.
What is the Total Population of New Houlka?
Total Population of New Houlka is 564.
What is the Total Male Population of New Houlka?
Total Male Population of New Houlka is 278.
What is the Total Female Population of New Houlka?
Total Female Population of New Houlka is 286.
What is the Ratio of Males per 100 Females in New Houlka?
There are 97.20 Males per 100 Females in New Houlka.
What is the Ratio of Females per 100 Males in New Houlka?
There are 102.88 Females per 100 Males in New Houlka.
What is the Median Population Age in New Houlka?
Median Population Age in New Houlka is 27.0 Years.
What is the Average Family Size in New Houlka
Average Family Size in New Houlka is 3.4 People.
What is the Average Household Size in New Houlka
Average Household Size in New Houlka is 3.1 People.
How Large is the Labor Force in New Houlka?
There are 244 People in the Labor Forcein in New Houlka.
What is the Percentage of People in the Labor Force in New Houlka?
60.2% of People are in the Labor Force in New Houlka.
What is the Unemployment Rate in New Houlka?
Unemployment Rate in New Houlka is 10.7%.