Verona, MS Map & Demographics
Verona Map
Verona Overview
$20,791
PER CAPITA INCOME
$52,622
AVG FAMILY INCOME
$41,216
AVG HOUSEHOLD INCOME
3.0%
WAGE / INCOME GAP [ % ]
97.0¢/ $1
WAGE / INCOME GAP [ $ ]
0.44
INEQUALITY / GINI INDEX
2,800
TOTAL POPULATION
1,342
MALE POPULATION
1,458
FEMALE POPULATION
92.04
MALES / 100 FEMALES
108.64
FEMALES / 100 MALES
31.9
MEDIAN AGE
3.1
AVG FAMILY SIZE
2.6
AVG HOUSEHOLD SIZE
1,465
LABOR FORCE [ PEOPLE ]
67.2%
PERCENT IN LABOR FORCE
5.7%
UNEMPLOYMENT RATE
Verona Zip Codes
Verona Area Codes
Income in Verona
Income Overview in Verona
Per Capita Income in Verona is $20,791, while median incomes of families and households are $52,622 and $41,216 respectively.
| Characteristic | Number | Measure |
| Per Capita Income | 2,800 | $20,791 |
| Median Family Income | 694 | $52,622 |
| Mean Family Income | 694 | $53,941 |
| Median Household Income | 1,066 | $41,216 |
| Mean Household Income | 1,066 | $52,183 |
| Income Deficit | 694 | $0 |
| Wage / Income Gap (%) | 2,800 | 2.98% |
| Wage / Income Gap ($) | 2,800 | 97.02¢ per $1 |
| Gini / Inequality Index | 2,800 | 0.44 |
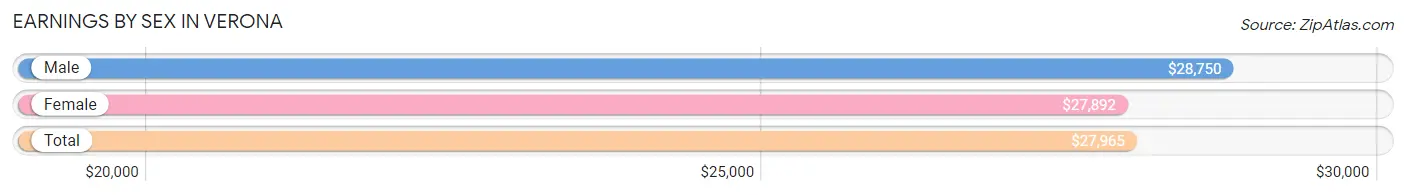
Earnings by Sex in Verona
Average Earnings in Verona are $27,965, $28,750 for men and $27,892 for women, a difference of 3.0%.
| Sex | Number | Average Earnings |
| Male | 794 (54.3%) | $28,750 |
| Female | 669 (45.7%) | $27,892 |
| Total | 1,463 (100.0%) | $27,965 |
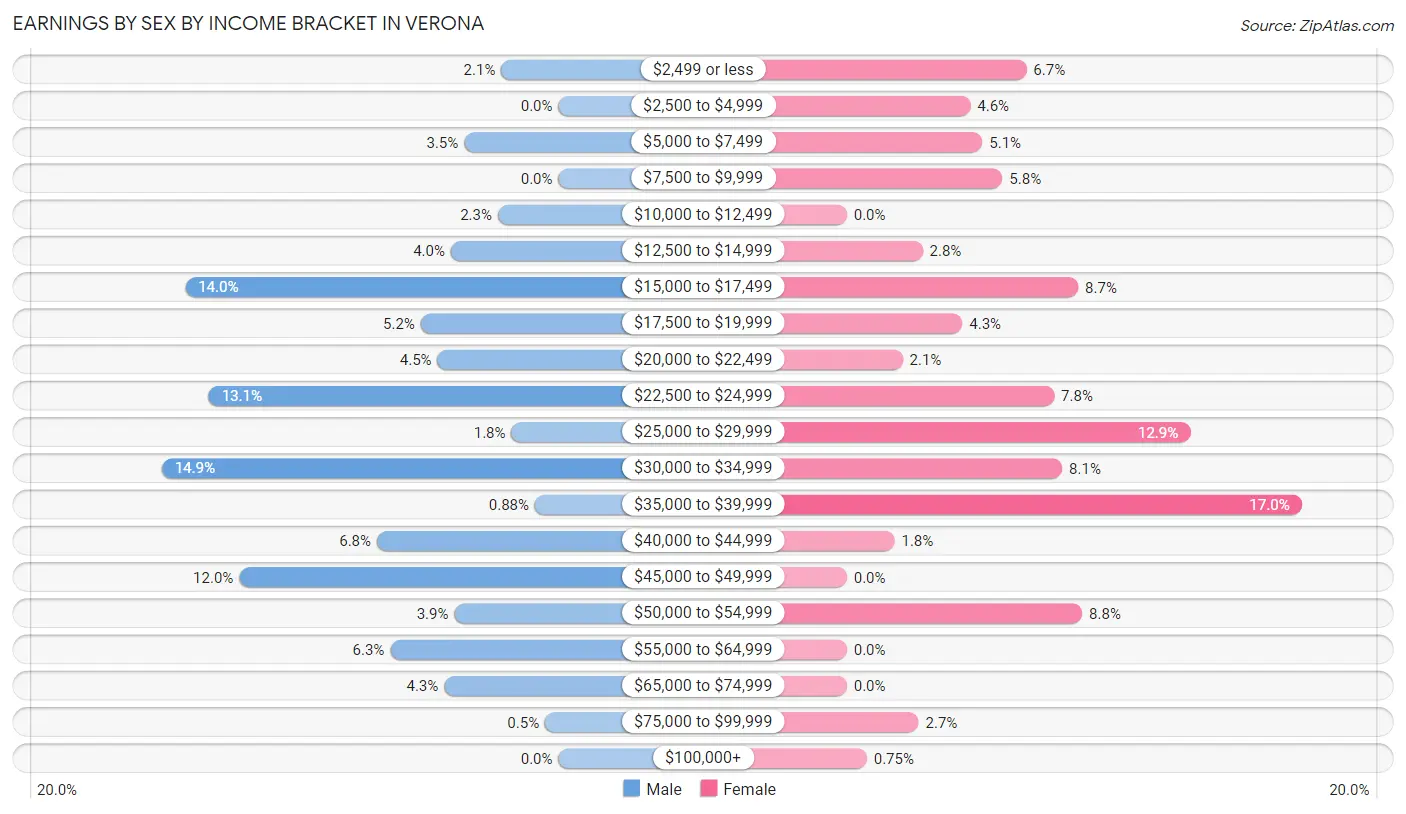
Earnings by Sex by Income Bracket in Verona
The most common earnings brackets in Verona are $30,000 to $34,999 for men (118 | 14.9%) and $35,000 to $39,999 for women (114 | 17.0%).
| Income | Male | Female |
| $2,499 or less | 17 (2.1%) | 45 (6.7%) |
| $2,500 to $4,999 | 0 (0.0%) | 31 (4.6%) |
| $5,000 to $7,499 | 28 (3.5%) | 34 (5.1%) |
| $7,500 to $9,999 | 0 (0.0%) | 39 (5.8%) |
| $10,000 to $12,499 | 18 (2.3%) | 0 (0.0%) |
| $12,500 to $14,999 | 32 (4.0%) | 19 (2.8%) |
| $15,000 to $17,499 | 111 (14.0%) | 58 (8.7%) |
| $17,500 to $19,999 | 41 (5.2%) | 29 (4.3%) |
| $20,000 to $22,499 | 36 (4.5%) | 14 (2.1%) |
| $22,500 to $24,999 | 104 (13.1%) | 52 (7.8%) |
| $25,000 to $29,999 | 14 (1.8%) | 86 (12.9%) |
| $30,000 to $34,999 | 118 (14.9%) | 54 (8.1%) |
| $35,000 to $39,999 | 7 (0.9%) | 114 (17.0%) |
| $40,000 to $44,999 | 54 (6.8%) | 12 (1.8%) |
| $45,000 to $49,999 | 95 (12.0%) | 0 (0.0%) |
| $50,000 to $54,999 | 31 (3.9%) | 59 (8.8%) |
| $55,000 to $64,999 | 50 (6.3%) | 0 (0.0%) |
| $65,000 to $74,999 | 34 (4.3%) | 0 (0.0%) |
| $75,000 to $99,999 | 4 (0.5%) | 18 (2.7%) |
| $100,000+ | 0 (0.0%) | 5 (0.7%) |
| Total | 794 (100.0%) | 669 (100.0%) |
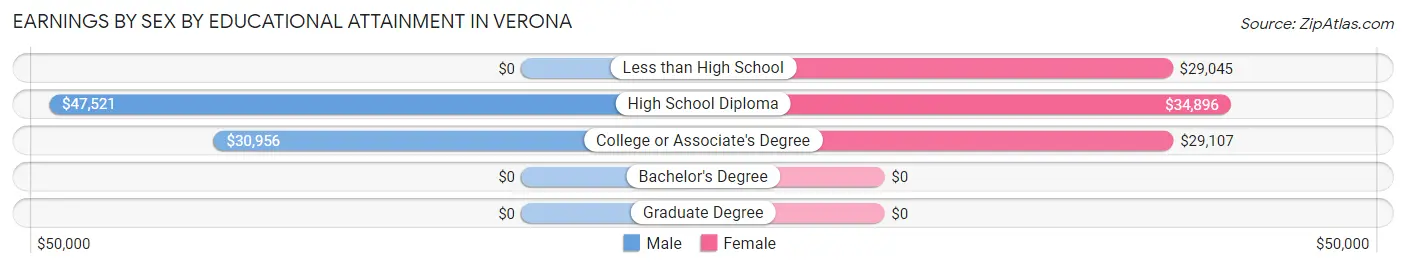
Earnings by Sex by Educational Attainment in Verona
Average earnings in Verona are $28,906 for men and $29,738 for women, a difference of 2.8%. Men with an educational attainment of high school diploma enjoy the highest average annual earnings of $47,521, while those with college or associate's degree education earn the least with $30,956. Women with an educational attainment of high school diploma earn the most with the average annual earnings of $34,896, while those with less than high school education have the smallest earnings of $29,045.
| Educational Attainment | Male Income | Female Income |
| Less than High School | - | - |
| High School Diploma | $47,521 | $34,896 |
| College or Associate's Degree | $30,956 | $29,107 |
| Bachelor's Degree | - | - |
| Graduate Degree | - | - |
| Total | $28,906 | $29,738 |
Family Income in Verona
Family Income Brackets in Verona
According to the Verona family income data, there are 220 families falling into the $75,000 to $99,999 income range, which is the most common income bracket and makes up 31.7% of all families.
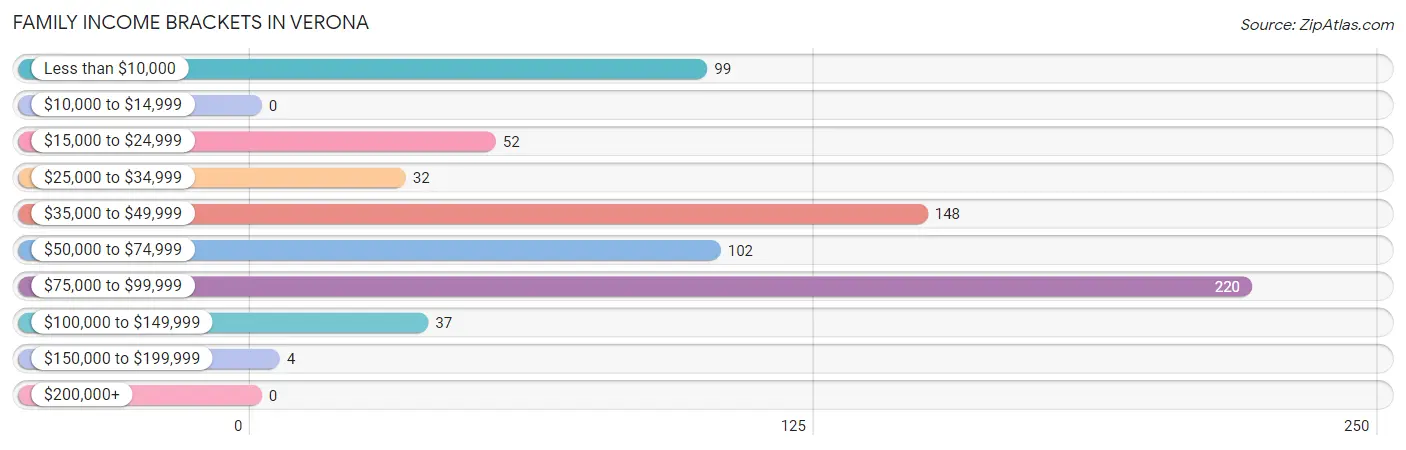
| Income Bracket | # Families | % Families |
| Less than $10,000 | 99 | 14.3% |
| $10,000 to $14,999 | 0 | 0.0% |
| $15,000 to $24,999 | 52 | 7.5% |
| $25,000 to $34,999 | 32 | 4.6% |
| $35,000 to $49,999 | 148 | 21.3% |
| $50,000 to $74,999 | 102 | 14.7% |
| $75,000 to $99,999 | 220 | 31.7% |
| $100,000 to $149,999 | 37 | 5.3% |
| $150,000 to $199,999 | 4 | 0.6% |
| $200,000+ | 0 | 0.0% |
Family Income by Famaliy Size in Verona
6-person families (91 | 13.1%) account for the highest median family income in Verona with $78,420 per family, while 2-person families (317 | 45.7%) have the highest median income of $25,670 per family member.
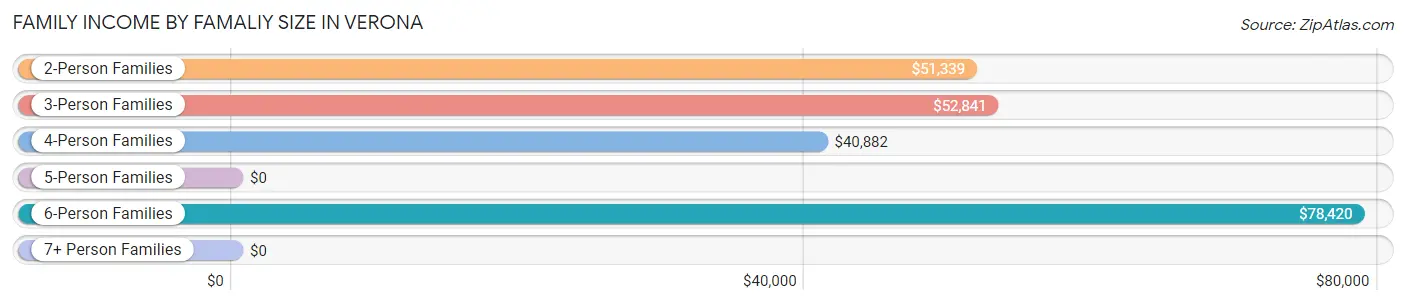
| Income Bracket | # Families | Median Income |
| 2-Person Families | 317 (45.7%) | $51,339 |
| 3-Person Families | 151 (21.8%) | $52,841 |
| 4-Person Families | 114 (16.4%) | $40,882 |
| 5-Person Families | 21 (3.0%) | $0 |
| 6-Person Families | 91 (13.1%) | $78,420 |
| 7+ Person Families | 0 (0.0%) | $0 |
| Total | 694 (100.0%) | $52,622 |
Family Income by Number of Earners in Verona
The median family income in Verona is $52,622, with families comprising 3+ earners (78) having the highest median family income of $90,122, while families with no earners (105) have the lowest median family income of $4,798, accounting for 11.2% and 15.1% of families, respectively.
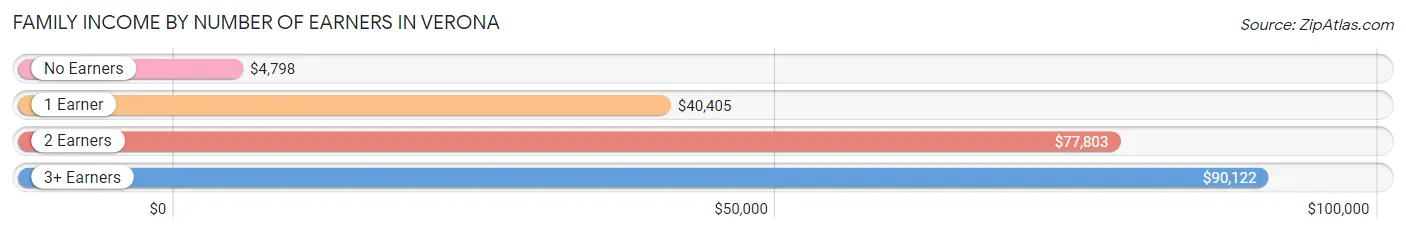
| Number of Earners | # Families | Median Income |
| No Earners | 105 (15.1%) | $4,798 |
| 1 Earner | 208 (30.0%) | $40,405 |
| 2 Earners | 303 (43.7%) | $77,803 |
| 3+ Earners | 78 (11.2%) | $90,122 |
| Total | 694 (100.0%) | $52,622 |
Household Income in Verona
Household Income Brackets in Verona
With 274 households falling in the category, the $35,000 to $49,999 income range is the most frequent in Verona, accounting for 25.7% of all households. In contrast, only 4 households (0.4%) fall into the $150,000 to $199,999 income bracket, making it the least populous group.
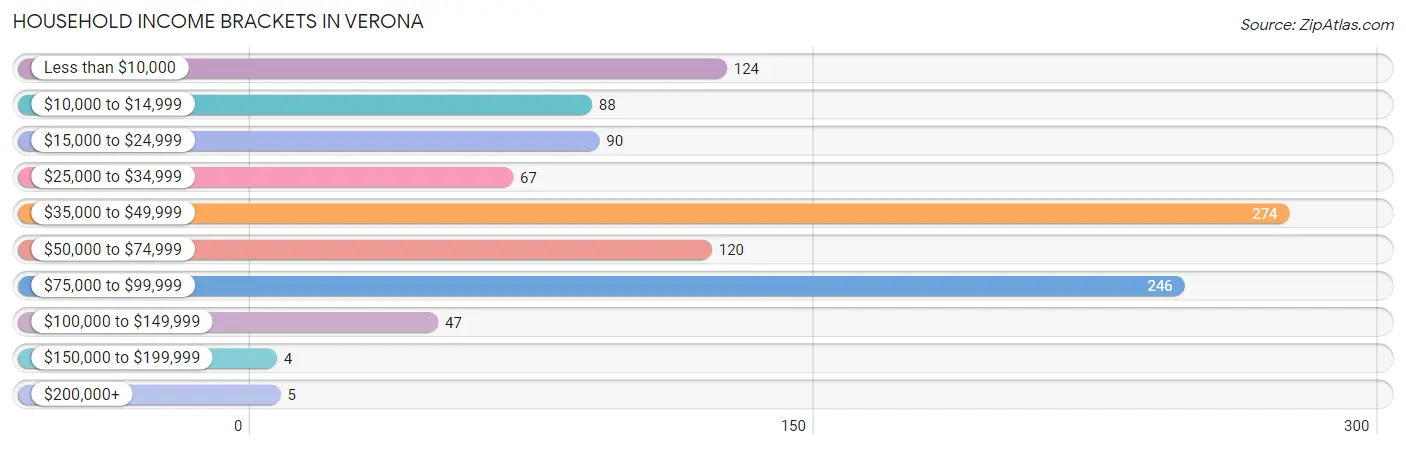
| Income Bracket | # Households | % Households |
| Less than $10,000 | 124 | 11.6% |
| $10,000 to $14,999 | 88 | 8.3% |
| $15,000 to $24,999 | 90 | 8.4% |
| $25,000 to $34,999 | 67 | 6.3% |
| $35,000 to $49,999 | 274 | 25.7% |
| $50,000 to $74,999 | 120 | 11.3% |
| $75,000 to $99,999 | 246 | 23.1% |
| $100,000 to $149,999 | 47 | 4.4% |
| $150,000 to $199,999 | 4 | 0.4% |
| $200,000+ | 5 | 0.5% |
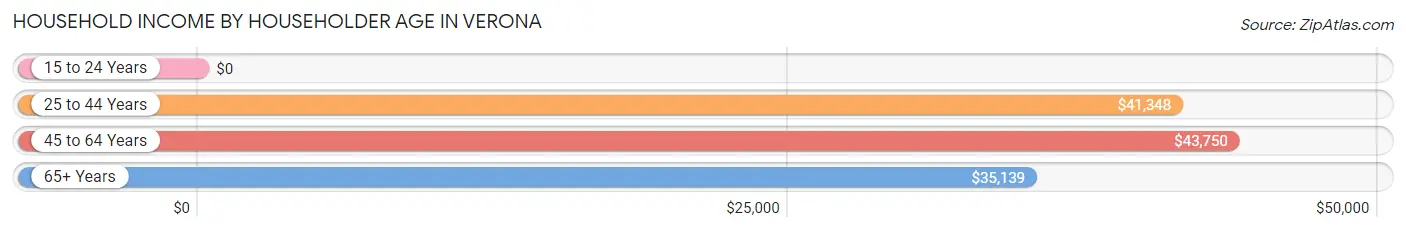
Household Income by Householder Age in Verona
The median household income in Verona is $41,216, with the highest median household income of $43,750 found in the 45 to 64 years age bracket for the primary householder. A total of 356 households (33.4%) fall into this category. Meanwhile, the 15 to 24 years age bracket for the primary householder has the lowest median household income of $0, with 26 households (2.4%) in this group.
| Income Bracket | # Households | Median Income |
| 15 to 24 Years | 26 (2.4%) | $0 |
| 25 to 44 Years | 459 (43.1%) | $41,348 |
| 45 to 64 Years | 356 (33.4%) | $43,750 |
| 65+ Years | 225 (21.1%) | $35,139 |
| Total | 1,066 (100.0%) | $41,216 |
Poverty in Verona
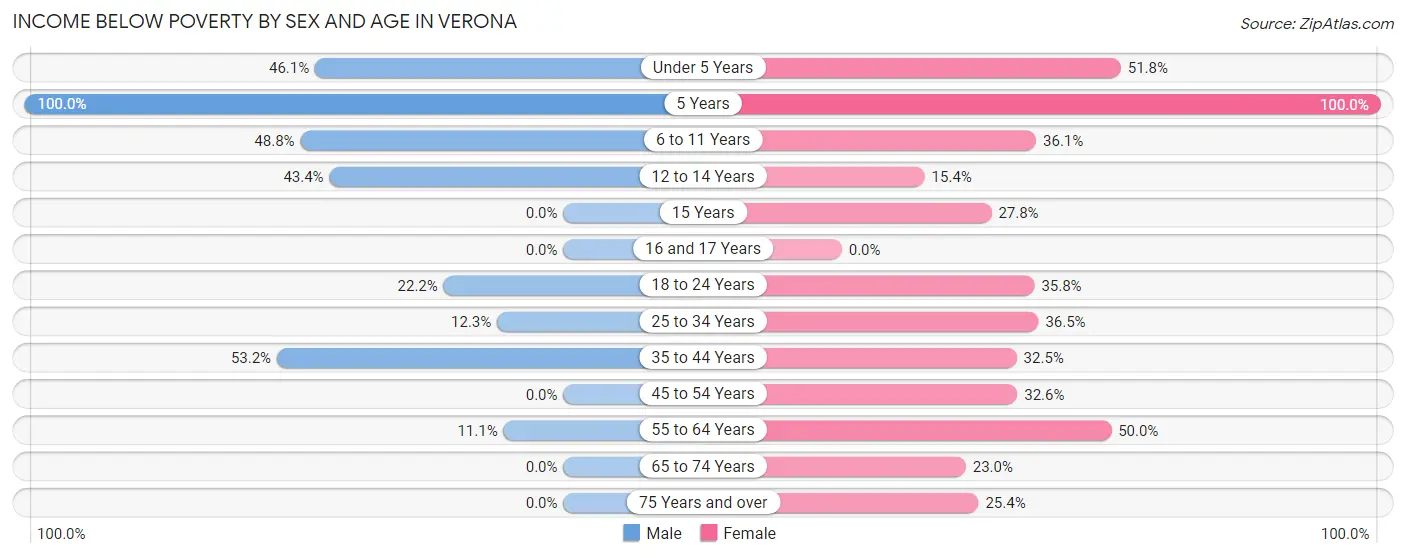
Income Below Poverty by Sex and Age in Verona
With 22.5% poverty level for males and 37.1% for females among the residents of Verona, 5 year old males and 5 year old females are the most vulnerable to poverty, with 17 males (100.0%) and 54 females (100.0%) in their respective age groups living below the poverty level.
| Age Bracket | Male | Female |
| Under 5 Years | 59 (46.1%) | 29 (51.8%) |
| 5 Years | 17 (100.0%) | 54 (100.0%) |
| 6 to 11 Years | 41 (48.8%) | 44 (36.1%) |
| 12 to 14 Years | 33 (43.4%) | 10 (15.4%) |
| 15 Years | 0 (0.0%) | 5 (27.8%) |
| 16 and 17 Years | 0 (0.0%) | 0 (0.0%) |
| 18 to 24 Years | 44 (22.2%) | 59 (35.8%) |
| 25 to 34 Years | 54 (12.3%) | 100 (36.5%) |
| 35 to 44 Years | 42 (53.2%) | 62 (32.5%) |
| 45 to 54 Years | 0 (0.0%) | 58 (32.6%) |
| 55 to 64 Years | 11 (11.1%) | 76 (50.0%) |
| 65 to 74 Years | 0 (0.0%) | 26 (23.0%) |
| 75 Years and over | 0 (0.0%) | 17 (25.4%) |
| Total | 301 (22.5%) | 540 (37.1%) |
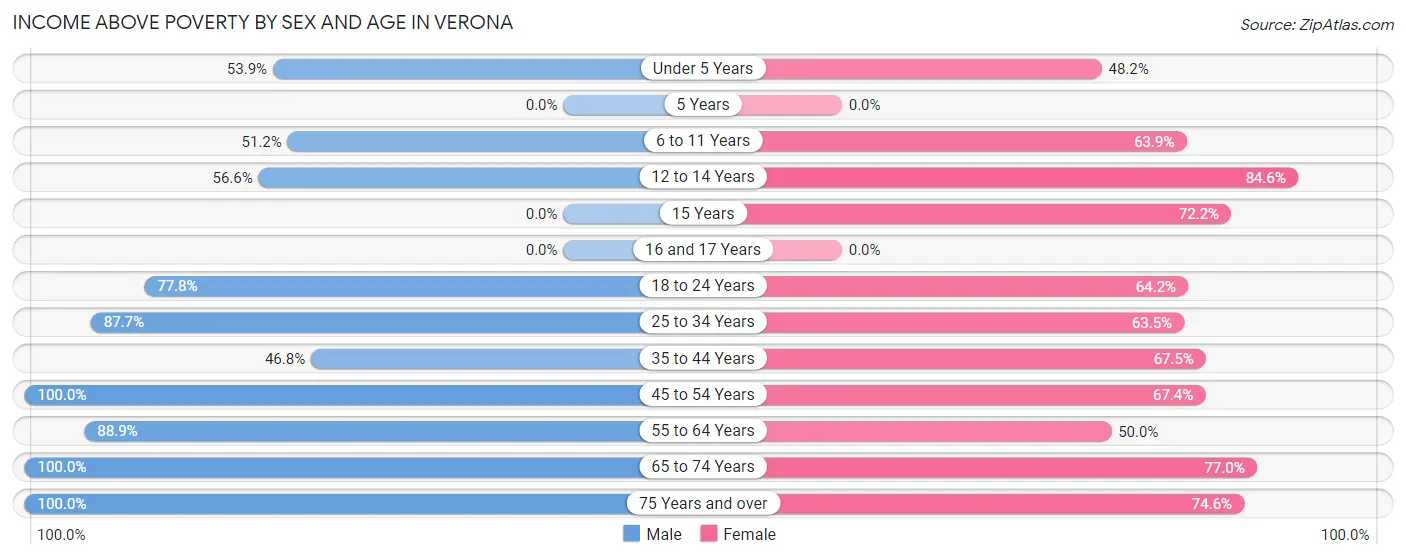
Income Above Poverty by Sex and Age in Verona
According to the poverty statistics in Verona, males aged 45 to 54 years and females aged 12 to 14 years are the age groups that are most secure financially, with 100.0% of males and 84.6% of females in these age groups living above the poverty line.
| Age Bracket | Male | Female |
| Under 5 Years | 69 (53.9%) | 27 (48.2%) |
| 5 Years | 0 (0.0%) | 0 (0.0%) |
| 6 to 11 Years | 43 (51.2%) | 78 (63.9%) |
| 12 to 14 Years | 43 (56.6%) | 55 (84.6%) |
| 15 Years | 0 (0.0%) | 13 (72.2%) |
| 16 and 17 Years | 0 (0.0%) | 0 (0.0%) |
| 18 to 24 Years | 154 (77.8%) | 106 (64.2%) |
| 25 to 34 Years | 385 (87.7%) | 174 (63.5%) |
| 35 to 44 Years | 37 (46.8%) | 129 (67.5%) |
| 45 to 54 Years | 100 (100.0%) | 120 (67.4%) |
| 55 to 64 Years | 88 (88.9%) | 76 (50.0%) |
| 65 to 74 Years | 54 (100.0%) | 87 (77.0%) |
| 75 Years and over | 64 (100.0%) | 50 (74.6%) |
| Total | 1,037 (77.5%) | 915 (62.9%) |
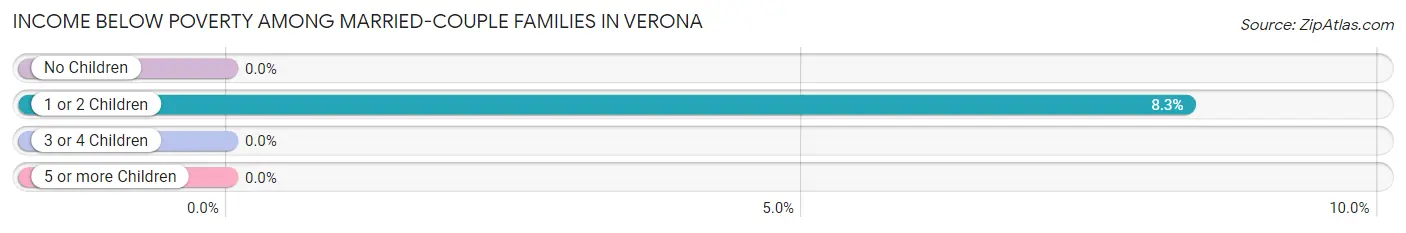
Income Below Poverty Among Married-Couple Families in Verona
The poverty statistics for married-couple families in Verona show that 2.7% or 9 of the total 333 families live below the poverty line. Families with 1 or 2 children have the highest poverty rate of 8.3%, comprising of 9 families. On the other hand, families with no children have the lowest poverty rate of 0.0%, which includes 0 families.
| Children | Above Poverty | Below Poverty |
| No Children | 153 (100.0%) | 0 (0.0%) |
| 1 or 2 Children | 99 (91.7%) | 9 (8.3%) |
| 3 or 4 Children | 72 (100.0%) | 0 (0.0%) |
| 5 or more Children | 0 (0.0%) | 0 (0.0%) |
| Total | 324 (97.3%) | 9 (2.7%) |
Income Below Poverty Among Single-Parent Households in Verona
According to the poverty data in Verona, 12.2% or 10 single-father households and 55.2% or 154 single-mother households are living below the poverty line. Among single-father households, those with 1 or 2 children have the highest poverty rate, with 10 households (58.8%) experiencing poverty. Likewise, among single-mother households, those with 3 or 4 children have the highest poverty rate, with 41 households (100.0%) falling below the poverty line.
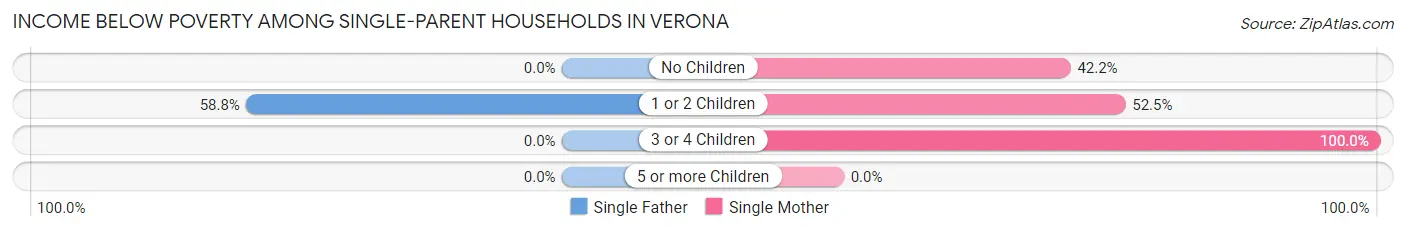
| Children | Single Father | Single Mother |
| No Children | 0 (0.0%) | 49 (42.2%) |
| 1 or 2 Children | 10 (58.8%) | 64 (52.5%) |
| 3 or 4 Children | 0 (0.0%) | 41 (100.0%) |
| 5 or more Children | 0 (0.0%) | 0 (0.0%) |
| Total | 10 (12.2%) | 154 (55.2%) |
Income Below Poverty Among Married-Couple vs Single-Parent Households in Verona
The poverty data for Verona shows that 9 of the married-couple family households (2.7%) and 164 of the single-parent households (45.4%) are living below the poverty level. Within the married-couple family households, those with 1 or 2 children have the highest poverty rate, with 9 households (8.3%) falling below the poverty line. Among the single-parent households, those with 3 or 4 children have the highest poverty rate, with 41 household (100.0%) living below poverty.
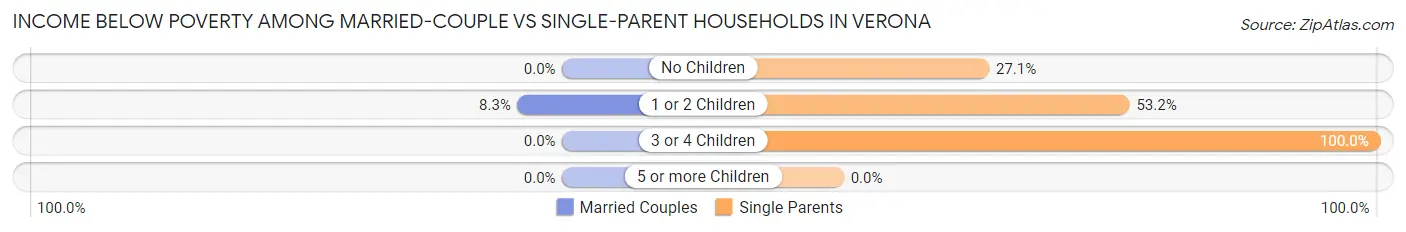
| Children | Married-Couple Families | Single-Parent Households |
| No Children | 0 (0.0%) | 49 (27.1%) |
| 1 or 2 Children | 9 (8.3%) | 74 (53.2%) |
| 3 or 4 Children | 0 (0.0%) | 41 (100.0%) |
| 5 or more Children | 0 (0.0%) | 0 (0.0%) |
| Total | 9 (2.7%) | 164 (45.4%) |
Race in Verona
The most populous races in Verona are Black / African American (2,293 | 81.9%), White / Caucasian (321 | 11.5%), and Hispanic or Latino (174 | 6.2%).
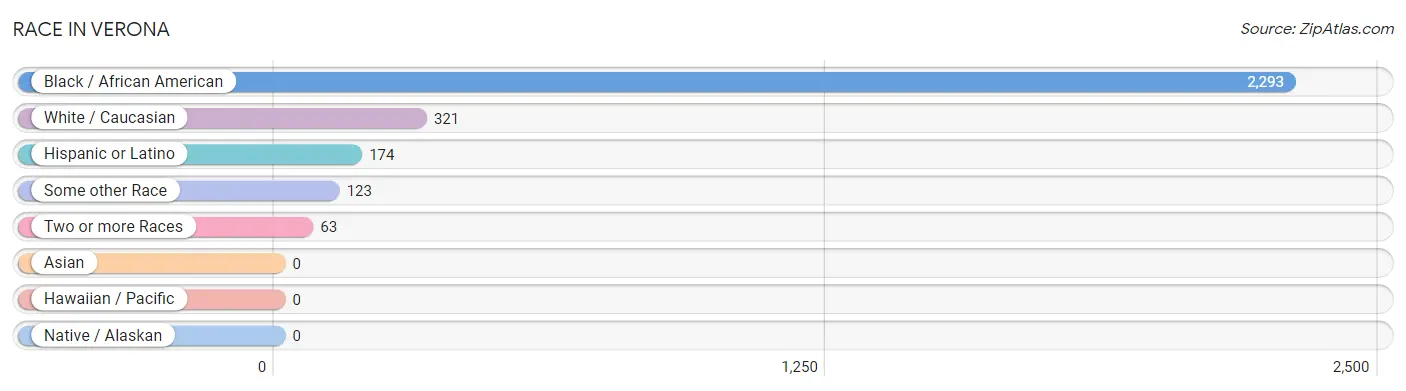
| Race | # Population | % Population |
| Asian | 0 | 0.0% |
| Black / African American | 2,293 | 81.9% |
| Hawaiian / Pacific | 0 | 0.0% |
| Hispanic or Latino | 174 | 6.2% |
| Native / Alaskan | 0 | 0.0% |
| White / Caucasian | 321 | 11.5% |
| Two or more Races | 63 | 2.2% |
| Some other Race | 123 | 4.4% |
| Total | 2,800 | 100.0% |
Ancestry in Verona
The most populous ancestries reported in Verona are Central American (111 | 4.0%), Guatemalan (111 | 4.0%), Scottish (61 | 2.2%), Dominican (51 | 1.8%), and English (42 | 1.5%), together accounting for 13.4% of all Verona residents.
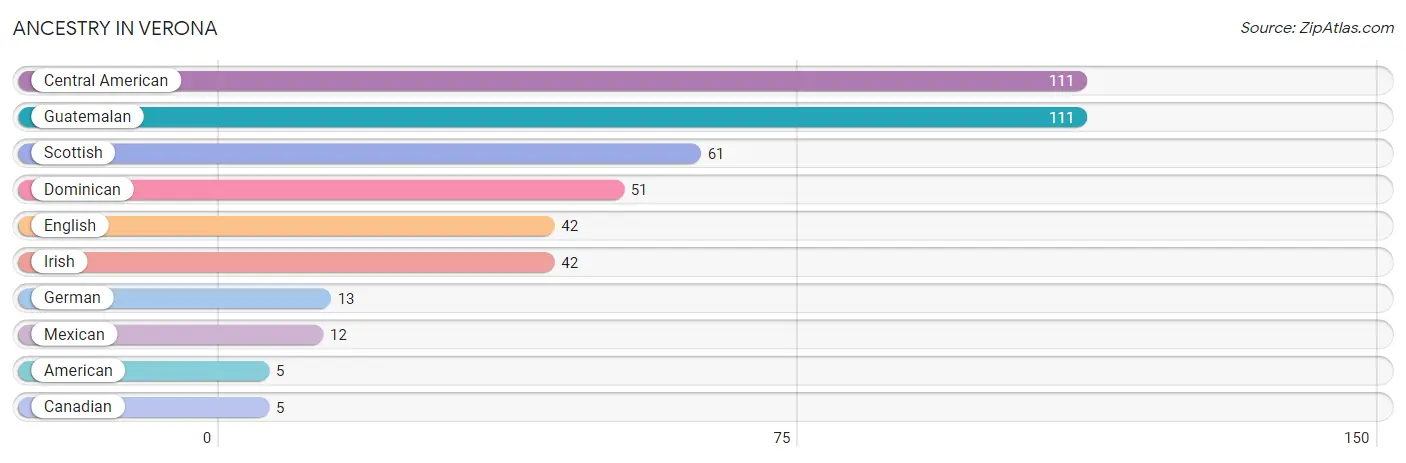
| Ancestry | # Population | % Population |
| American | 5 | 0.2% |
| Canadian | 5 | 0.2% |
| Central American | 111 | 4.0% |
| Dominican | 51 | 1.8% |
| English | 42 | 1.5% |
| German | 13 | 0.5% |
| Guatemalan | 111 | 4.0% |
| Irish | 42 | 1.5% |
| Mexican | 12 | 0.4% |
| Scottish | 61 | 2.2% | View All 10 Rows |
Immigrants in Verona
The most numerous immigrant groups reported in Verona came from Latin America (146 | 5.2%), Central America (111 | 4.0%), Mexico (83 | 3.0%), Guatemala (28 | 1.0%), and Caribbean (23 | 0.8%), together accounting for 14.0% of all Verona residents.
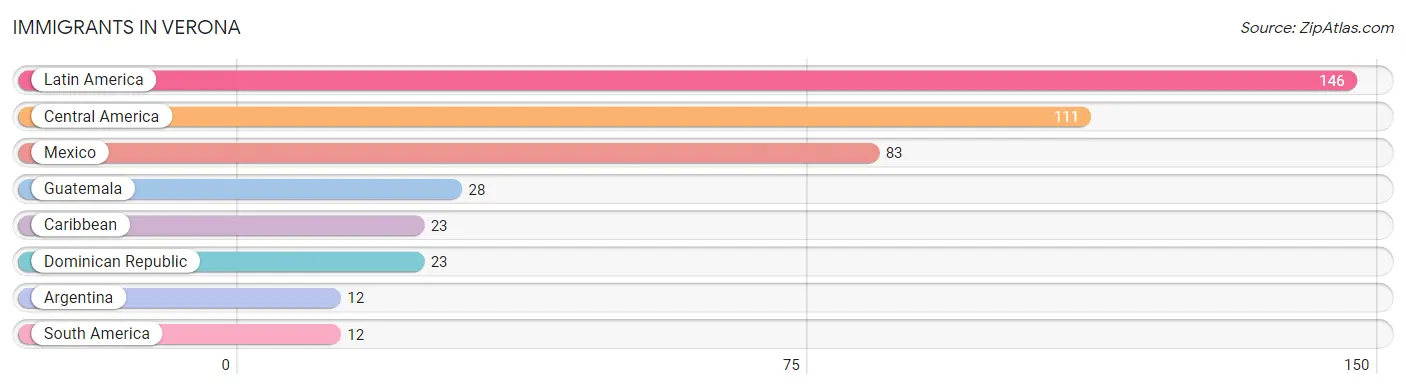
| Immigration Origin | # Population | % Population |
| Argentina | 12 | 0.4% |
| Caribbean | 23 | 0.8% |
| Central America | 111 | 4.0% |
| Dominican Republic | 23 | 0.8% |
| Guatemala | 28 | 1.0% |
| Latin America | 146 | 5.2% |
| Mexico | 83 | 3.0% |
| South America | 12 | 0.4% | View All 8 Rows |
Sex and Age in Verona
Sex and Age in Verona
The most populous age groups in Verona are 30 to 34 Years (283 | 21.1%) for men and 25 to 29 Years (166 | 11.4%) for women.
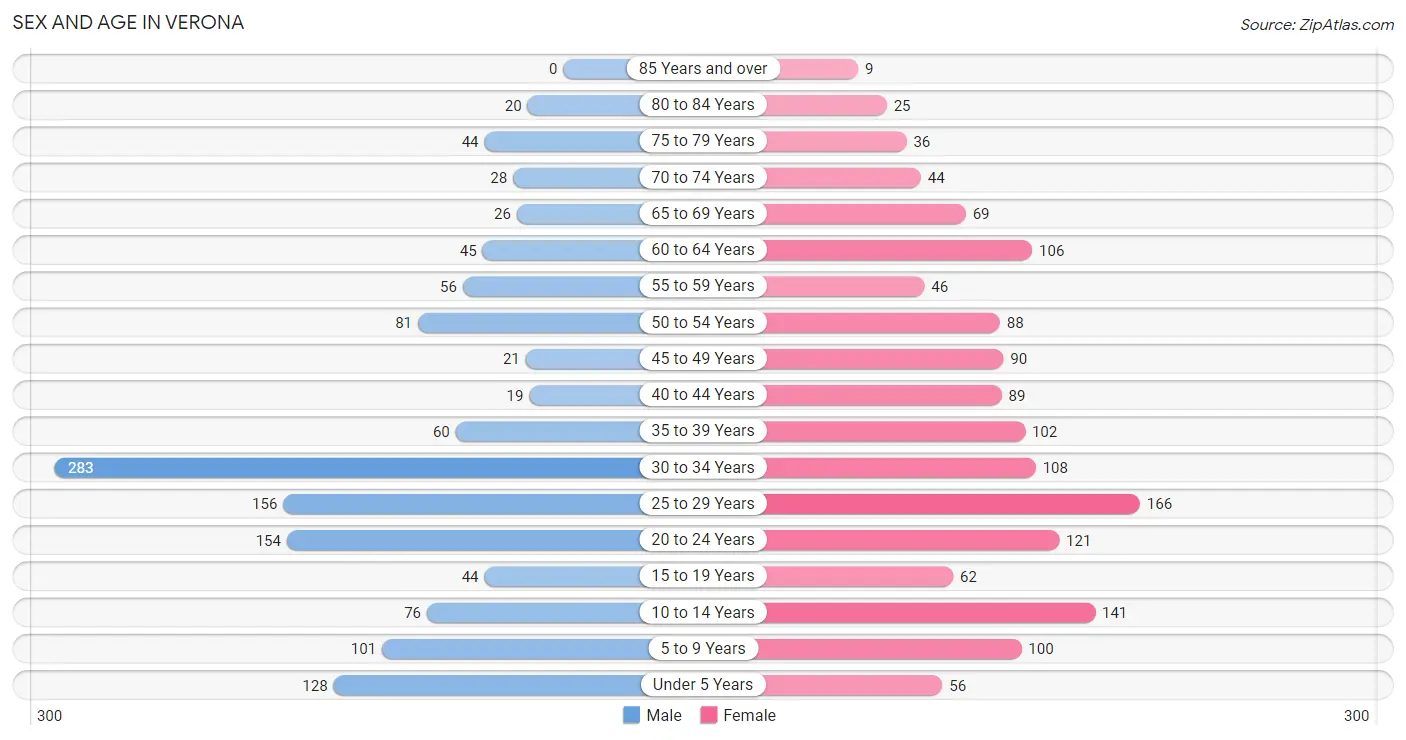
| Age Bracket | Male | Female |
| Under 5 Years | 128 (9.5%) | 56 (3.8%) |
| 5 to 9 Years | 101 (7.5%) | 100 (6.9%) |
| 10 to 14 Years | 76 (5.7%) | 141 (9.7%) |
| 15 to 19 Years | 44 (3.3%) | 62 (4.3%) |
| 20 to 24 Years | 154 (11.5%) | 121 (8.3%) |
| 25 to 29 Years | 156 (11.6%) | 166 (11.4%) |
| 30 to 34 Years | 283 (21.1%) | 108 (7.4%) |
| 35 to 39 Years | 60 (4.5%) | 102 (7.0%) |
| 40 to 44 Years | 19 (1.4%) | 89 (6.1%) |
| 45 to 49 Years | 21 (1.6%) | 90 (6.2%) |
| 50 to 54 Years | 81 (6.0%) | 88 (6.0%) |
| 55 to 59 Years | 56 (4.2%) | 46 (3.2%) |
| 60 to 64 Years | 45 (3.4%) | 106 (7.3%) |
| 65 to 69 Years | 26 (1.9%) | 69 (4.7%) |
| 70 to 74 Years | 28 (2.1%) | 44 (3.0%) |
| 75 to 79 Years | 44 (3.3%) | 36 (2.5%) |
| 80 to 84 Years | 20 (1.5%) | 25 (1.7%) |
| 85 Years and over | 0 (0.0%) | 9 (0.6%) |
| Total | 1,342 (100.0%) | 1,458 (100.0%) |
Families and Households in Verona
Median Family Size in Verona
The median family size in Verona is 3.13 persons per family, with single female/mother families (279 | 40.2%) accounting for the largest median family size of 3.32 persons per family. On the other hand, single male/father families (82 | 11.8%) represent the smallest median family size with 2.77 persons per family.
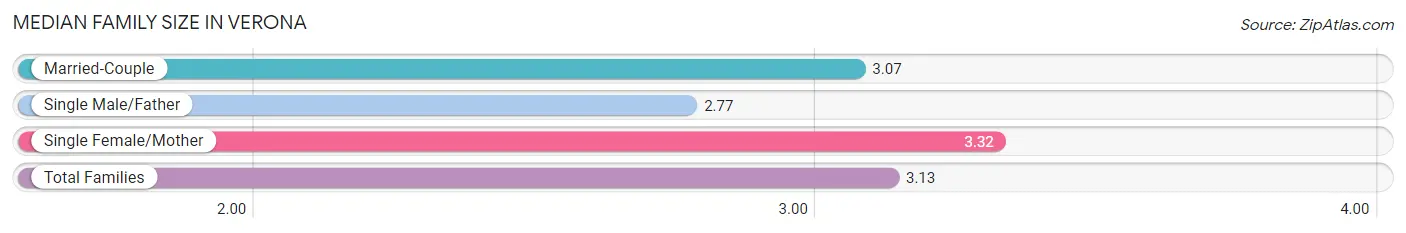
| Family Type | # Families | Family Size |
| Married-Couple | 333 (48.0%) | 3.07 |
| Single Male/Father | 82 (11.8%) | 2.77 |
| Single Female/Mother | 279 (40.2%) | 3.32 |
| Total Families | 694 (100.0%) | 3.13 |
Median Household Size in Verona
The median household size in Verona is 2.62 persons per household, with single female/mother households (279 | 26.2%) accounting for the largest median household size of 3.41 persons per household. non-family households (372 | 34.9%) represent the smallest median household size with 1.56 persons per household.
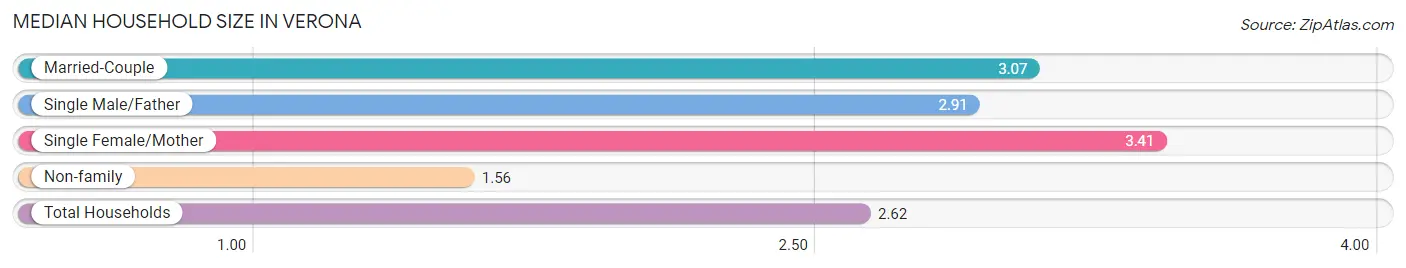
| Household Type | # Households | Household Size |
| Married-Couple | 333 (31.2%) | 3.07 |
| Single Male/Father | 82 (7.7%) | 2.91 |
| Single Female/Mother | 279 (26.2%) | 3.41 |
| Non-family | 372 (34.9%) | 1.56 |
| Total Households | 1,066 (100.0%) | 2.62 |
Household Size by Marriage Status in Verona
Out of a total of 1,066 households in Verona, 694 (65.1%) are family households, while 372 (34.9%) are nonfamily households. The most numerous type of family households are 2-person households, comprising 317, and the most common type of nonfamily households are 1-person households, comprising 276.
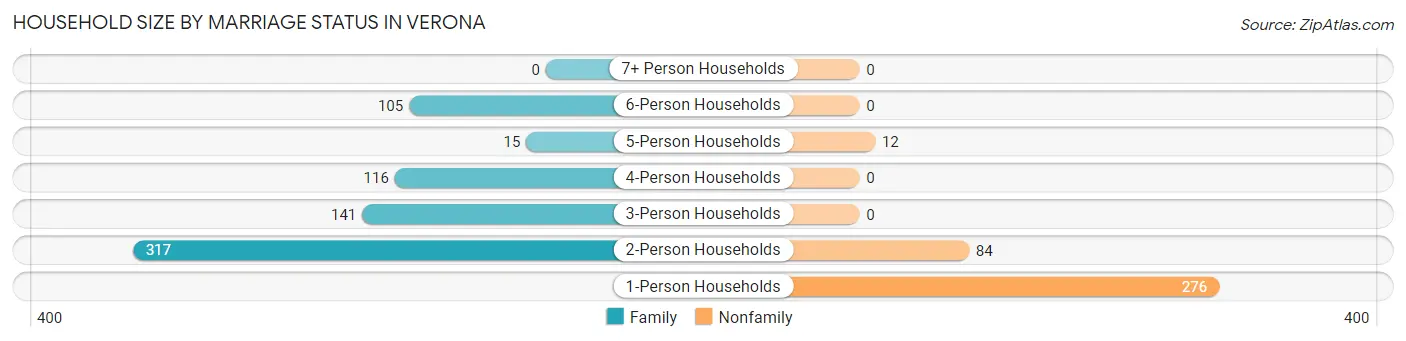
| Household Size | Family Households | Nonfamily Households |
| 1-Person Households | - | 276 (25.9%) |
| 2-Person Households | 317 (29.7%) | 84 (7.9%) |
| 3-Person Households | 141 (13.2%) | 0 (0.0%) |
| 4-Person Households | 116 (10.9%) | 0 (0.0%) |
| 5-Person Households | 15 (1.4%) | 12 (1.1%) |
| 6-Person Households | 105 (9.9%) | 0 (0.0%) |
| 7+ Person Households | 0 (0.0%) | 0 (0.0%) |
| Total | 694 (65.1%) | 372 (34.9%) |
Female Fertility in Verona
Fertility by Age in Verona
Average fertility rate in Verona is 30.0 births per 1,000 women. Women in the age bracket of 20 to 34 years have the highest fertility rate with 61.0 births per 1,000 women. Women in the age bracket of 20 to 34 years acount for 100.0% of all women with births.
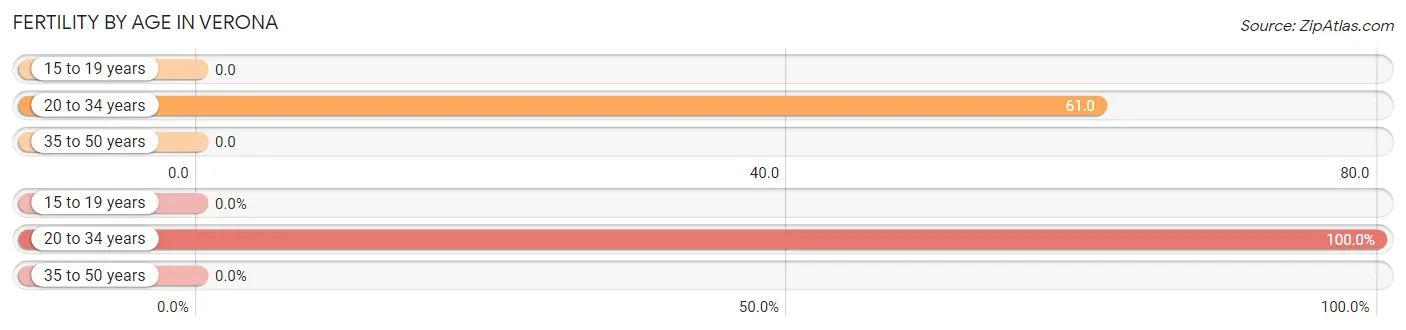
| Age Bracket | Women with Births | Births / 1,000 Women |
| 15 to 19 years | 0 (0.0%) | 0.0 |
| 20 to 34 years | 24 (100.0%) | 61.0 |
| 35 to 50 years | 0 (0.0%) | 0.0 |
| Total | 24 (100.0%) | 30.0 |
Fertility by Age by Marriage Status in Verona
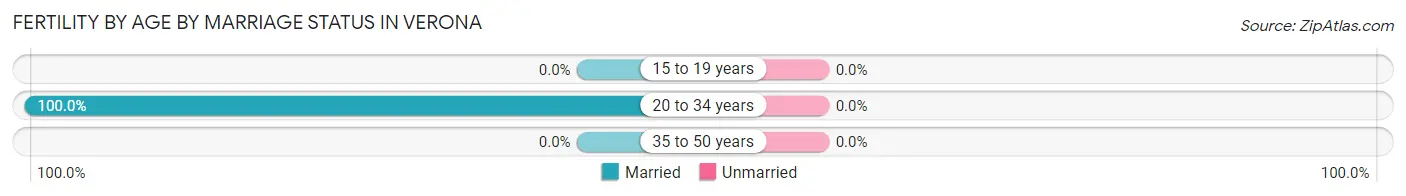
| Age Bracket | Married | Unmarried |
| 15 to 19 years | 0 (0.0%) | 0 (0.0%) |
| 20 to 34 years | 24 (100.0%) | 0 (0.0%) |
| 35 to 50 years | 0 (0.0%) | 0 (0.0%) |
| Total | 24 (100.0%) | 0 (0.0%) |
Fertility by Education in Verona
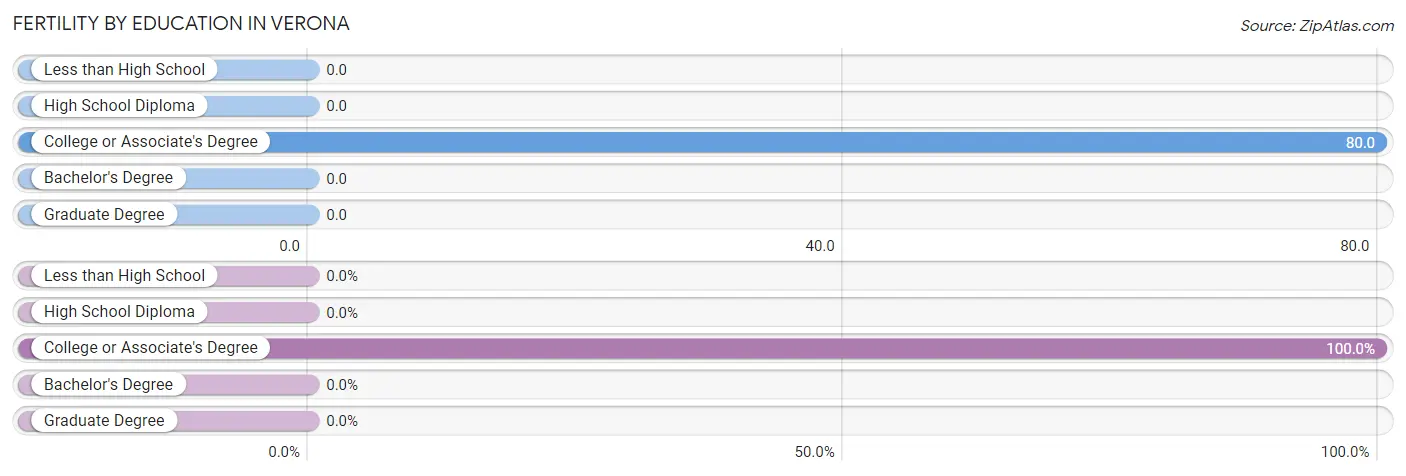
| Educational Attainment | Women with Births | Births / 1,000 Women |
| Less than High School | 0 (0.0%) | 0.0 |
| High School Diploma | 0 (0.0%) | 0.0 |
| College or Associate's Degree | 24 (100.0%) | 80.0 |
| Bachelor's Degree | 0 (0.0%) | 0.0 |
| Graduate Degree | 0 (0.0%) | 0.0 |
| Total | 24 (100.0%) | 30.0 |
Fertility by Education by Marriage Status in Verona
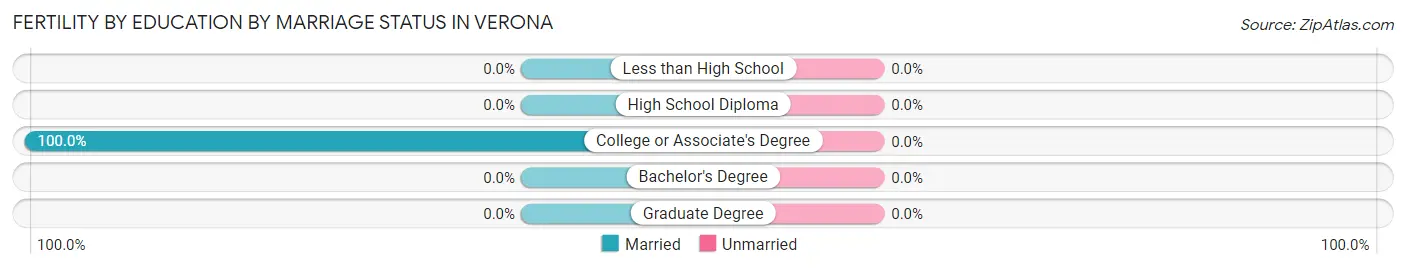
| Educational Attainment | Married | Unmarried |
| Less than High School | 0 (0.0%) | 0 (0.0%) |
| High School Diploma | 0 (0.0%) | 0 (0.0%) |
| College or Associate's Degree | 24 (100.0%) | 0 (0.0%) |
| Bachelor's Degree | 0 (0.0%) | 0 (0.0%) |
| Graduate Degree | 0 (0.0%) | 0 (0.0%) |
| Total | 24 (100.0%) | 0 (0.0%) |
Employment Characteristics in Verona
Employment by Class of Employer in Verona
Among the 1,363 employed individuals in Verona, private company employees (1,179 | 86.5%), self-employed (not incorporated) (82 | 6.0%), and not-for-profit organizations (62 | 4.5%) make up the most common classes of employment.
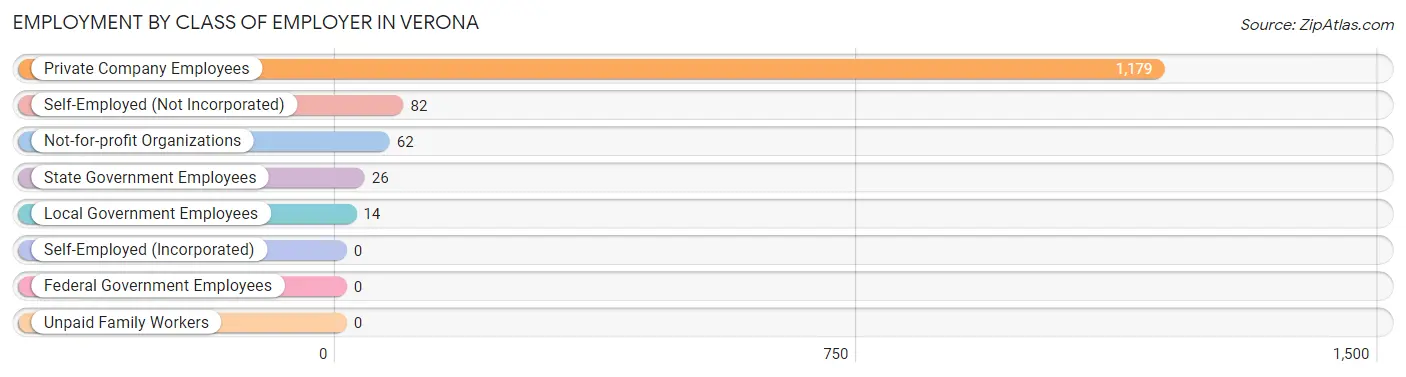
| Employer Class | # Employees | % Employees |
| Private Company Employees | 1,179 | 86.5% |
| Self-Employed (Incorporated) | 0 | 0.0% |
| Self-Employed (Not Incorporated) | 82 | 6.0% |
| Not-for-profit Organizations | 62 | 4.5% |
| Local Government Employees | 14 | 1.0% |
| State Government Employees | 26 | 1.9% |
| Federal Government Employees | 0 | 0.0% |
| Unpaid Family Workers | 0 | 0.0% |
| Total | 1,363 | 100.0% |
Employment Status by Age in Verona
According to the labor force statistics for Verona, out of the total population over 16 years of age (2,180), 67.2% or 1,465 individuals are in the labor force, with 5.7% or 84 of them unemployed. The age group with the highest labor force participation rate is 30 to 34 years, with 93.9% or 367 individuals in the labor force. Within the labor force, the 35 to 44 years age range has the highest percentage of unemployed individuals, with 12.7% or 19 of them being unemployed.
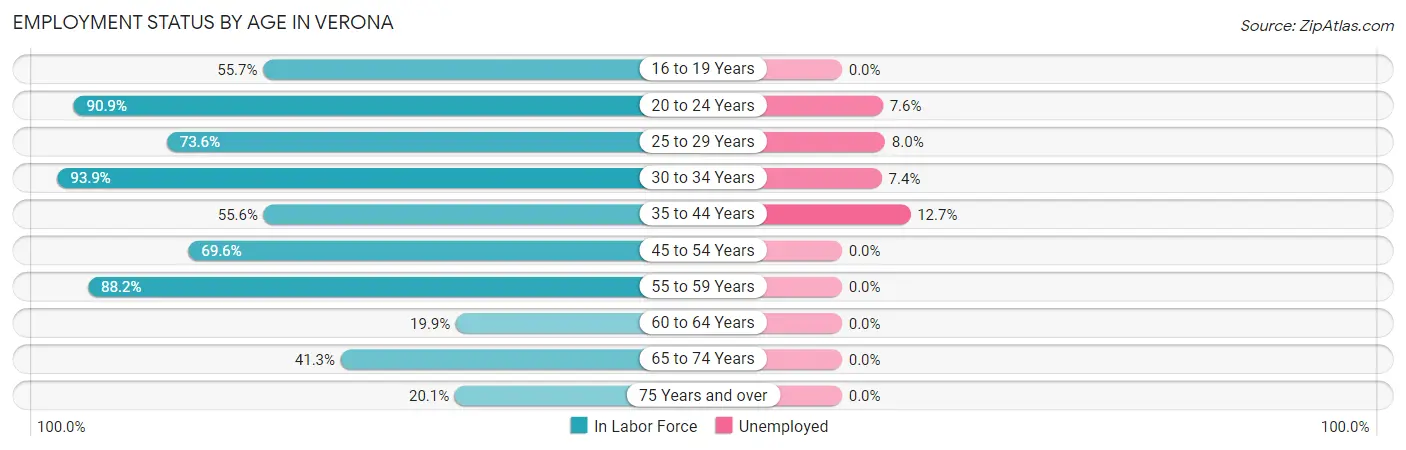
| Age Bracket | In Labor Force | Unemployed |
| 16 to 19 Years | 49 (55.7%) | 0 (0.0%) |
| 20 to 24 Years | 250 (90.9%) | 19 (7.6%) |
| 25 to 29 Years | 237 (73.6%) | 19 (8.0%) |
| 30 to 34 Years | 367 (93.9%) | 27 (7.4%) |
| 35 to 44 Years | 150 (55.6%) | 19 (12.7%) |
| 45 to 54 Years | 195 (69.6%) | 0 (0.0%) |
| 55 to 59 Years | 90 (88.2%) | 0 (0.0%) |
| 60 to 64 Years | 30 (19.9%) | 0 (0.0%) |
| 65 to 74 Years | 69 (41.3%) | 0 (0.0%) |
| 75 Years and over | 27 (20.1%) | 0 (0.0%) |
| Total | 1,465 (67.2%) | 84 (5.7%) |
Employment Status by Educational Attainment in Verona
According to labor force statistics for Verona, 70.5% of individuals (1,069) out of the total population between 25 and 64 years of age (1,516) are in the labor force, with 6.1% or 65 of them being unemployed. The group with the highest labor force participation rate are those with the educational attainment of bachelor's degree or higher, with 97.1% or 68 individuals in the labor force. Within the labor force, individuals with college / associate degree education have the highest percentage of unemployment, with 8.2% or 32 of them being unemployed.
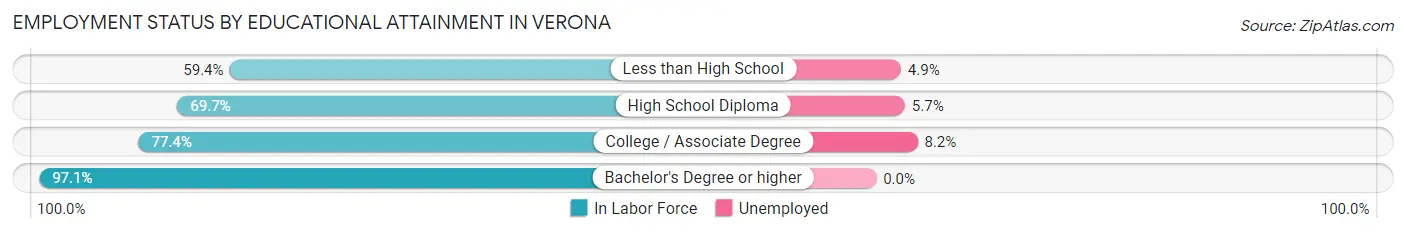
| Educational Attainment | In Labor Force | Unemployed |
| Less than High School | 263 (59.4%) | 22 (4.9%) |
| High School Diploma | 350 (69.7%) | 29 (5.7%) |
| College / Associate Degree | 388 (77.4%) | 41 (8.2%) |
| Bachelor's Degree or higher | 68 (97.1%) | 0 (0.0%) |
| Total | 1,069 (70.5%) | 92 (6.1%) |
Employment Occupations by Sex in Verona
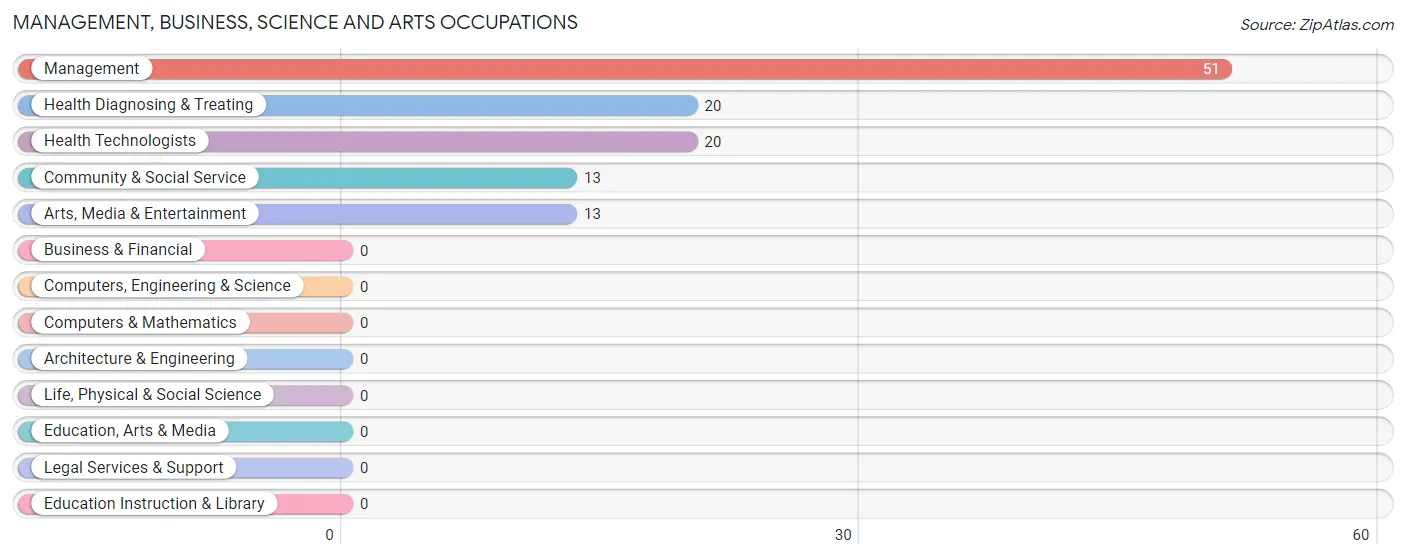
Management, Business, Science and Arts Occupations
The most common Management, Business, Science and Arts occupations in Verona are Management (51 | 3.7%), Health Diagnosing & Treating (20 | 1.5%), Health Technologists (20 | 1.5%), Community & Social Service (13 | 0.9%), and Arts, Media & Entertainment (13 | 0.9%).
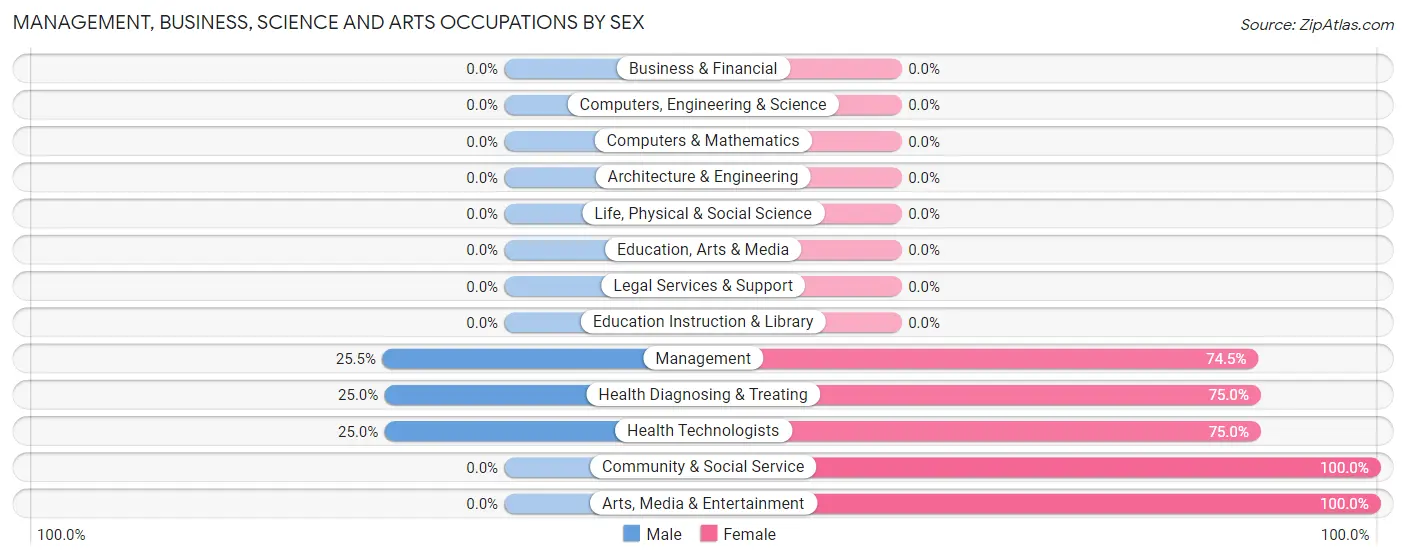
Management, Business, Science and Arts Occupations by Sex
Within the Management, Business, Science and Arts occupations in Verona, the most male-oriented occupations are Management (25.5%), Health Diagnosing & Treating (25.0%), and Health Technologists (25.0%), while the most female-oriented occupations are Community & Social Service (100.0%), Arts, Media & Entertainment (100.0%), and Health Diagnosing & Treating (75.0%).
| Occupation | Male | Female |
| Management | 13 (25.5%) | 38 (74.5%) |
| Business & Financial | 0 (0.0%) | 0 (0.0%) |
| Computers, Engineering & Science | 0 (0.0%) | 0 (0.0%) |
| Computers & Mathematics | 0 (0.0%) | 0 (0.0%) |
| Architecture & Engineering | 0 (0.0%) | 0 (0.0%) |
| Life, Physical & Social Science | 0 (0.0%) | 0 (0.0%) |
| Community & Social Service | 0 (0.0%) | 13 (100.0%) |
| Education, Arts & Media | 0 (0.0%) | 0 (0.0%) |
| Legal Services & Support | 0 (0.0%) | 0 (0.0%) |
| Education Instruction & Library | 0 (0.0%) | 0 (0.0%) |
| Arts, Media & Entertainment | 0 (0.0%) | 13 (100.0%) |
| Health Diagnosing & Treating | 5 (25.0%) | 15 (75.0%) |
| Health Technologists | 5 (25.0%) | 15 (75.0%) |
| Total (Category) | 18 (21.4%) | 66 (78.6%) |
| Total (Overall) | 756 (54.8%) | 624 (45.2%) |
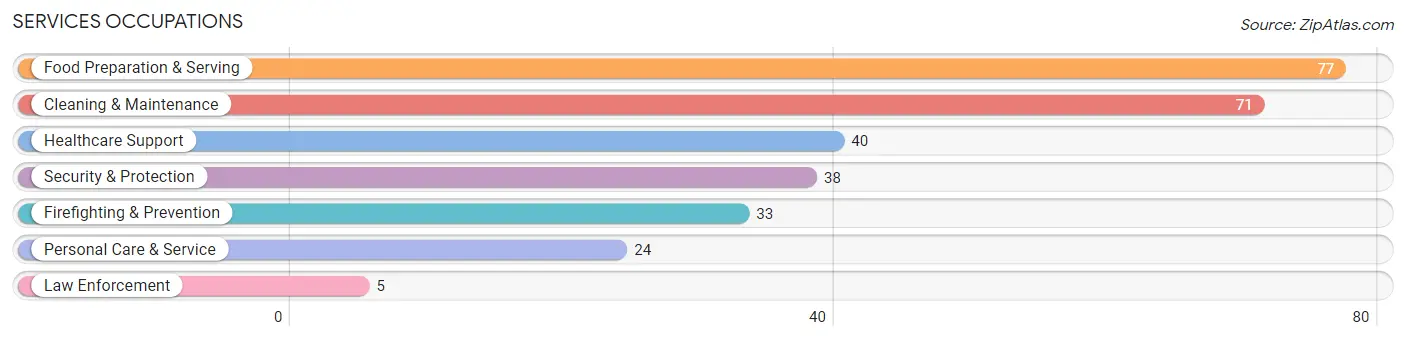
Services Occupations
The most common Services occupations in Verona are Food Preparation & Serving (77 | 5.6%), Cleaning & Maintenance (71 | 5.1%), Healthcare Support (40 | 2.9%), Security & Protection (38 | 2.8%), and Firefighting & Prevention (33 | 2.4%).
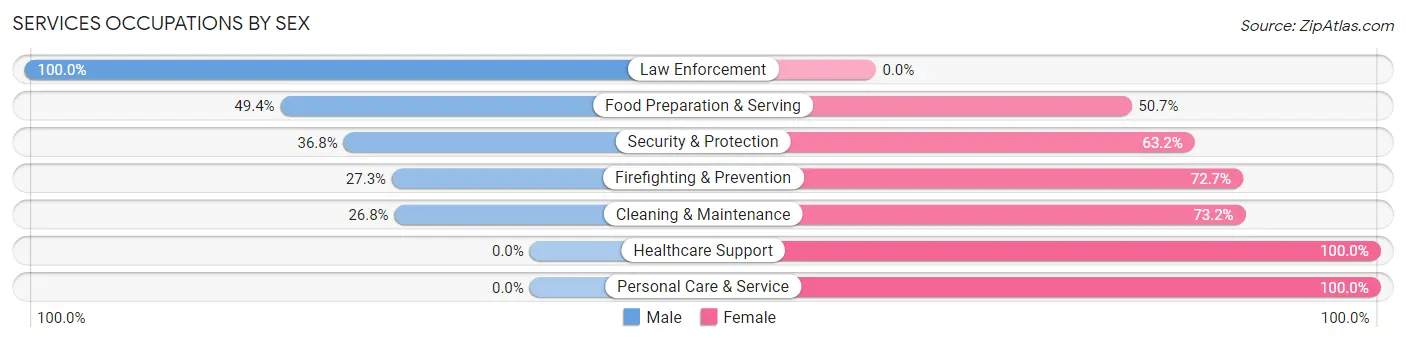
Services Occupations by Sex
Within the Services occupations in Verona, the most male-oriented occupations are Law Enforcement (100.0%), Food Preparation & Serving (49.3%), and Security & Protection (36.8%), while the most female-oriented occupations are Healthcare Support (100.0%), Personal Care & Service (100.0%), and Cleaning & Maintenance (73.2%).
| Occupation | Male | Female |
| Healthcare Support | 0 (0.0%) | 40 (100.0%) |
| Security & Protection | 14 (36.8%) | 24 (63.2%) |
| Firefighting & Prevention | 9 (27.3%) | 24 (72.7%) |
| Law Enforcement | 5 (100.0%) | 0 (0.0%) |
| Food Preparation & Serving | 38 (49.3%) | 39 (50.6%) |
| Cleaning & Maintenance | 19 (26.8%) | 52 (73.2%) |
| Personal Care & Service | 0 (0.0%) | 24 (100.0%) |
| Total (Category) | 71 (28.4%) | 179 (71.6%) |
| Total (Overall) | 756 (54.8%) | 624 (45.2%) |
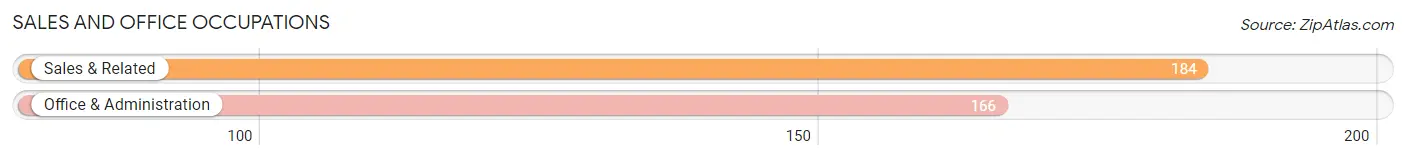
Sales and Office Occupations
The most common Sales and Office occupations in Verona are Sales & Related (184 | 13.3%), and Office & Administration (166 | 12.0%).
Sales and Office Occupations by Sex
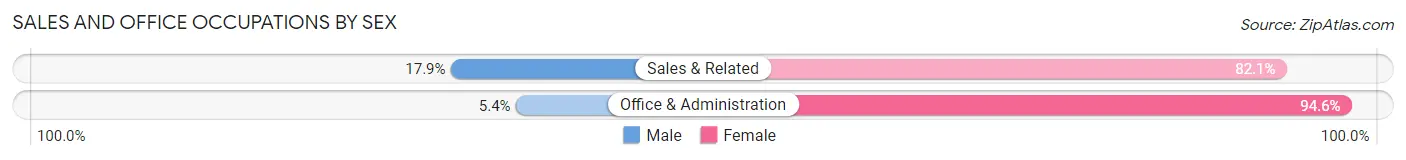
| Occupation | Male | Female |
| Sales & Related | 33 (17.9%) | 151 (82.1%) |
| Office & Administration | 9 (5.4%) | 157 (94.6%) |
| Total (Category) | 42 (12.0%) | 308 (88.0%) |
| Total (Overall) | 756 (54.8%) | 624 (45.2%) |
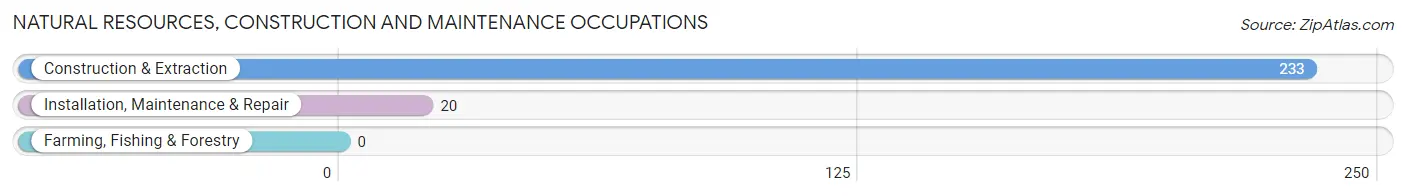
Natural Resources, Construction and Maintenance Occupations
The most common Natural Resources, Construction and Maintenance occupations in Verona are Construction & Extraction (233 | 16.9%), and Installation, Maintenance & Repair (20 | 1.5%).
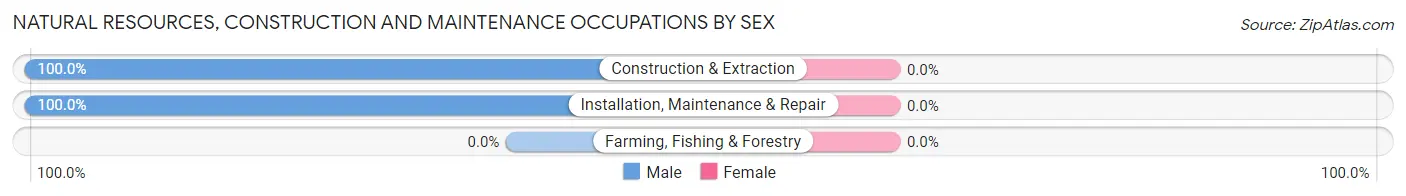
Natural Resources, Construction and Maintenance Occupations by Sex
| Occupation | Male | Female |
| Farming, Fishing & Forestry | 0 (0.0%) | 0 (0.0%) |
| Construction & Extraction | 233 (100.0%) | 0 (0.0%) |
| Installation, Maintenance & Repair | 20 (100.0%) | 0 (0.0%) |
| Total (Category) | 253 (100.0%) | 0 (0.0%) |
| Total (Overall) | 756 (54.8%) | 624 (45.2%) |
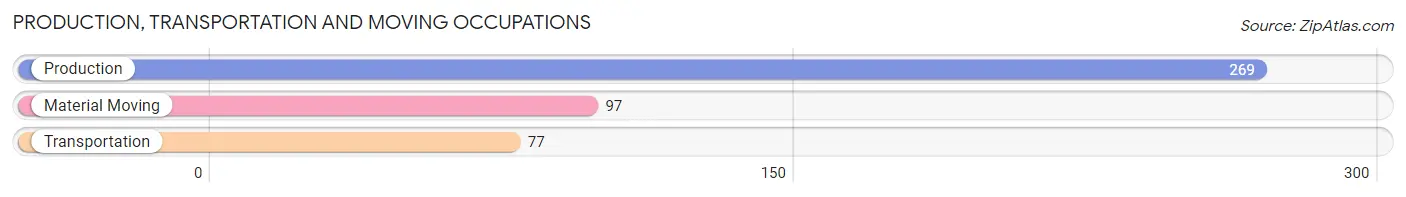
Production, Transportation and Moving Occupations
The most common Production, Transportation and Moving occupations in Verona are Production (269 | 19.5%), Material Moving (97 | 7.0%), and Transportation (77 | 5.6%).
Production, Transportation and Moving Occupations by Sex
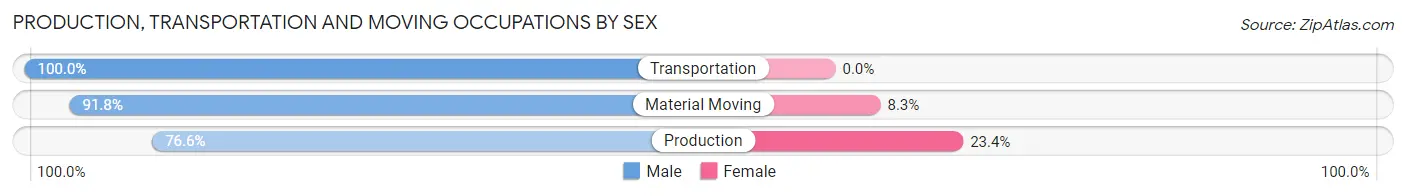
| Occupation | Male | Female |
| Production | 206 (76.6%) | 63 (23.4%) |
| Transportation | 77 (100.0%) | 0 (0.0%) |
| Material Moving | 89 (91.7%) | 8 (8.3%) |
| Total (Category) | 372 (84.0%) | 71 (16.0%) |
| Total (Overall) | 756 (54.8%) | 624 (45.2%) |
Employment Industries by Sex in Verona
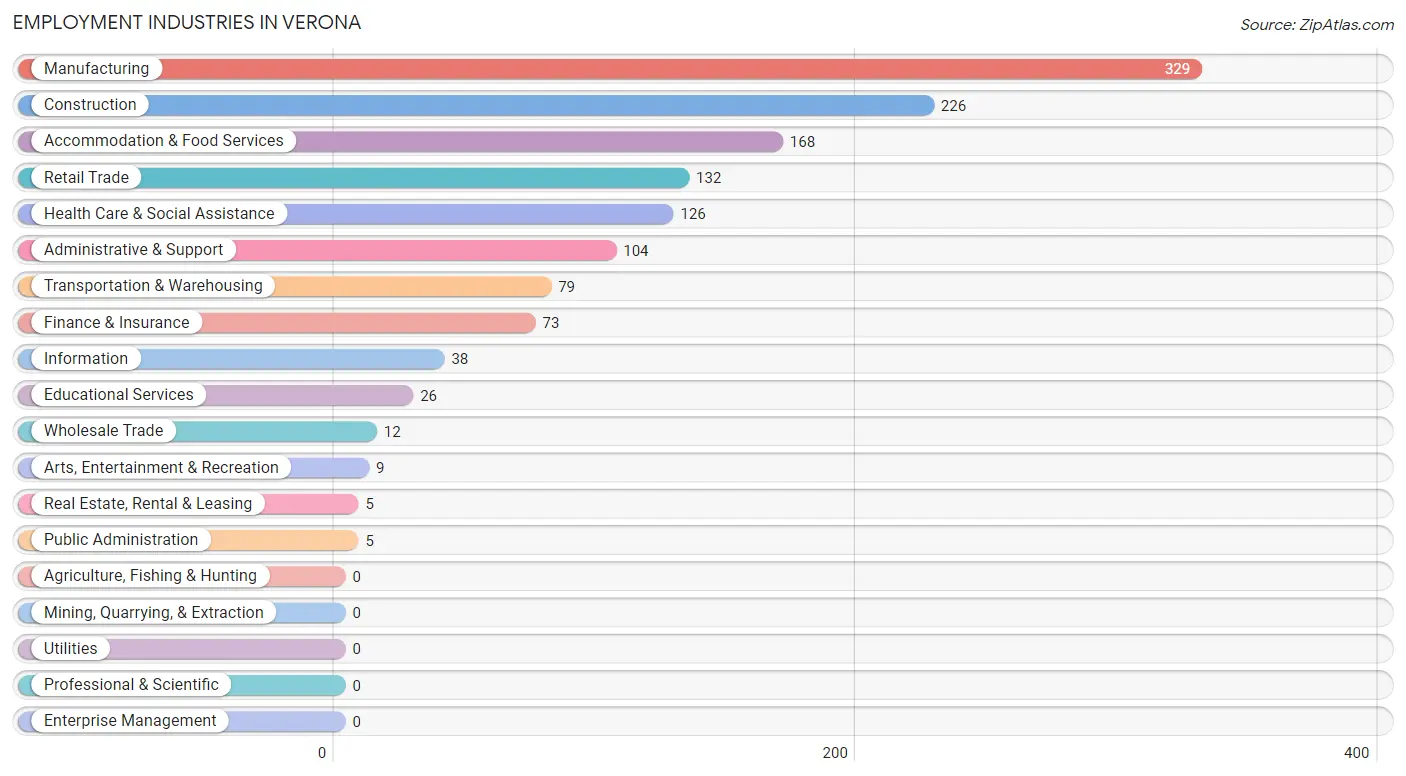
Employment Industries in Verona
The major employment industries in Verona include Manufacturing (329 | 23.8%), Construction (226 | 16.4%), Accommodation & Food Services (168 | 12.2%), Retail Trade (132 | 9.6%), and Health Care & Social Assistance (126 | 9.1%).
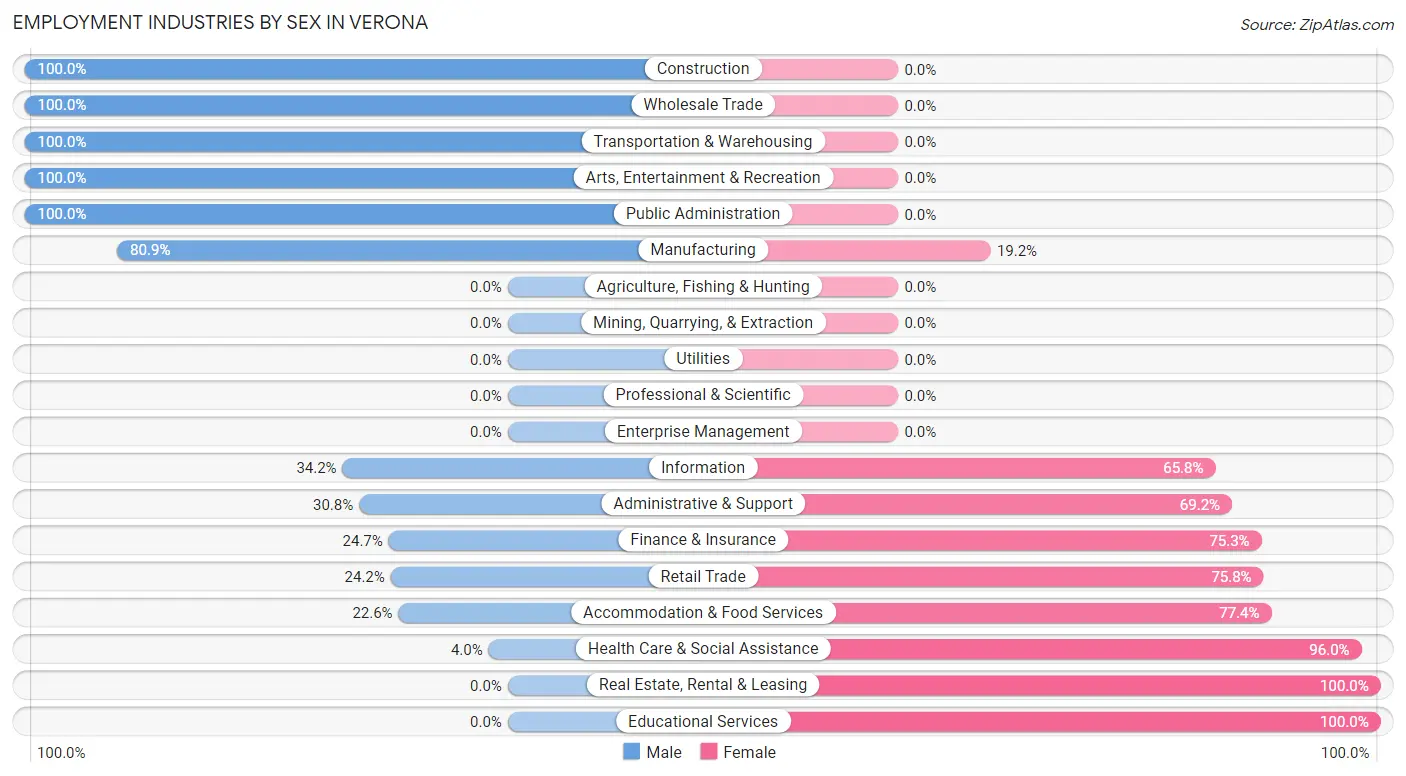
Employment Industries by Sex in Verona
The Verona industries that see more men than women are Construction (100.0%), Wholesale Trade (100.0%), and Transportation & Warehousing (100.0%), whereas the industries that tend to have a higher number of women are Real Estate, Rental & Leasing (100.0%), Educational Services (100.0%), and Health Care & Social Assistance (96.0%).
| Industry | Male | Female |
| Agriculture, Fishing & Hunting | 0 (0.0%) | 0 (0.0%) |
| Mining, Quarrying, & Extraction | 0 (0.0%) | 0 (0.0%) |
| Construction | 226 (100.0%) | 0 (0.0%) |
| Manufacturing | 266 (80.8%) | 63 (19.2%) |
| Wholesale Trade | 12 (100.0%) | 0 (0.0%) |
| Retail Trade | 32 (24.2%) | 100 (75.8%) |
| Transportation & Warehousing | 79 (100.0%) | 0 (0.0%) |
| Utilities | 0 (0.0%) | 0 (0.0%) |
| Information | 13 (34.2%) | 25 (65.8%) |
| Finance & Insurance | 18 (24.7%) | 55 (75.3%) |
| Real Estate, Rental & Leasing | 0 (0.0%) | 5 (100.0%) |
| Professional & Scientific | 0 (0.0%) | 0 (0.0%) |
| Enterprise Management | 0 (0.0%) | 0 (0.0%) |
| Administrative & Support | 32 (30.8%) | 72 (69.2%) |
| Educational Services | 0 (0.0%) | 26 (100.0%) |
| Health Care & Social Assistance | 5 (4.0%) | 121 (96.0%) |
| Arts, Entertainment & Recreation | 9 (100.0%) | 0 (0.0%) |
| Accommodation & Food Services | 38 (22.6%) | 130 (77.4%) |
| Public Administration | 5 (100.0%) | 0 (0.0%) |
| Total | 756 (54.8%) | 624 (45.2%) |
Education in Verona
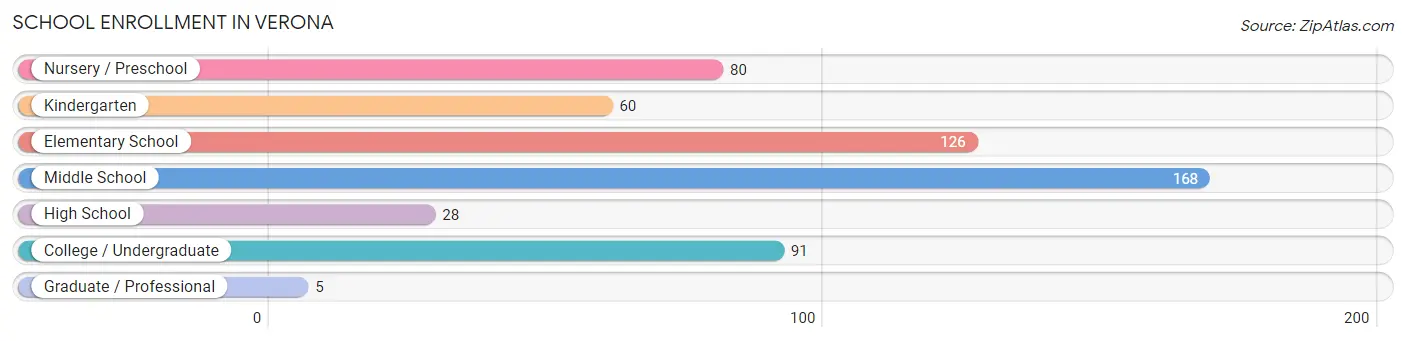
School Enrollment in Verona
The most common levels of schooling among the 558 students in Verona are middle school (168 | 30.1%), elementary school (126 | 22.6%), and college / undergraduate (91 | 16.3%).
| School Level | # Students | % Students |
| Nursery / Preschool | 80 | 14.3% |
| Kindergarten | 60 | 10.7% |
| Elementary School | 126 | 22.6% |
| Middle School | 168 | 30.1% |
| High School | 28 | 5.0% |
| College / Undergraduate | 91 | 16.3% |
| Graduate / Professional | 5 | 0.9% |
| Total | 558 | 100.0% |
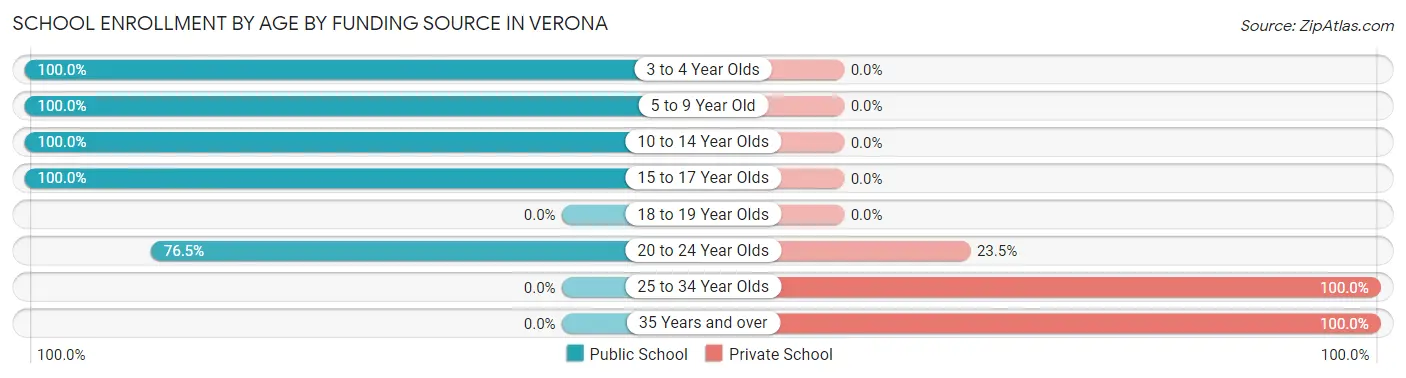
School Enrollment by Age by Funding Source in Verona
Out of a total of 558 students who are enrolled in schools in Verona, 57 (10.2%) attend a private institution, while the remaining 501 (89.8%) are enrolled in public schools. The age group of 25 to 34 year olds has the highest likelihood of being enrolled in private schools, with 40 (100.0% in the age bracket) enrolled. Conversely, the age group of 3 to 4 year olds has the lowest likelihood of being enrolled in a private school, with 63 (100.0% in the age bracket) attending a public institution.
| Age Bracket | Public School | Private School |
| 3 to 4 Year Olds | 63 (100.0%) | 0 (0.0%) |
| 5 to 9 Year Old | 164 (100.0%) | 0 (0.0%) |
| 10 to 14 Year Olds | 217 (100.0%) | 0 (0.0%) |
| 15 to 17 Year Olds | 18 (100.0%) | 0 (0.0%) |
| 18 to 19 Year Olds | 0 (0.0%) | 0 (0.0%) |
| 20 to 24 Year Olds | 39 (76.5%) | 12 (23.5%) |
| 25 to 34 Year Olds | 0 (0.0%) | 40 (100.0%) |
| 35 Years and over | 0 (0.0%) | 5 (100.0%) |
| Total | 501 (89.8%) | 57 (10.2%) |
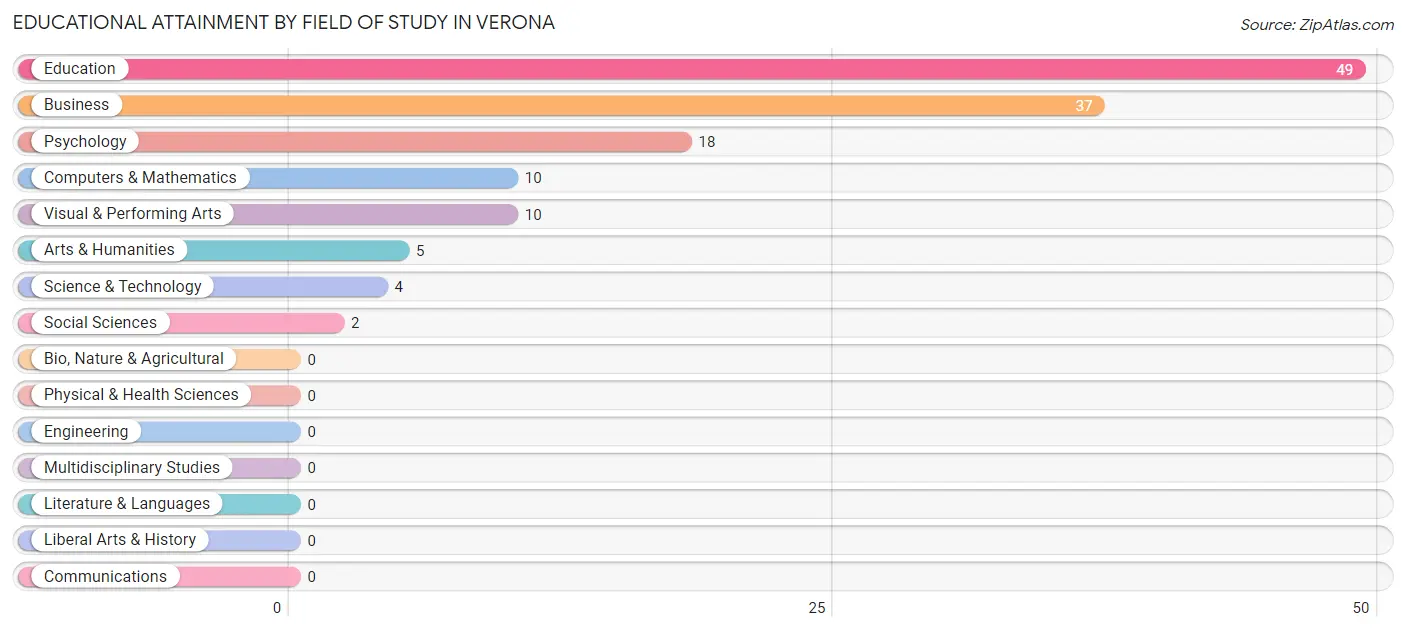
Educational Attainment by Field of Study in Verona
Education (49 | 36.3%), business (37 | 27.4%), psychology (18 | 13.3%), computers & mathematics (10 | 7.4%), and visual & performing arts (10 | 7.4%) are the most common fields of study among 135 individuals in Verona who have obtained a bachelor's degree or higher.
| Field of Study | # Graduates | % Graduates |
| Computers & Mathematics | 10 | 7.4% |
| Bio, Nature & Agricultural | 0 | 0.0% |
| Physical & Health Sciences | 0 | 0.0% |
| Psychology | 18 | 13.3% |
| Social Sciences | 2 | 1.5% |
| Engineering | 0 | 0.0% |
| Multidisciplinary Studies | 0 | 0.0% |
| Science & Technology | 4 | 3.0% |
| Business | 37 | 27.4% |
| Education | 49 | 36.3% |
| Literature & Languages | 0 | 0.0% |
| Liberal Arts & History | 0 | 0.0% |
| Visual & Performing Arts | 10 | 7.4% |
| Communications | 0 | 0.0% |
| Arts & Humanities | 5 | 3.7% |
| Total | 135 | 100.0% |
Transportation & Commute in Verona
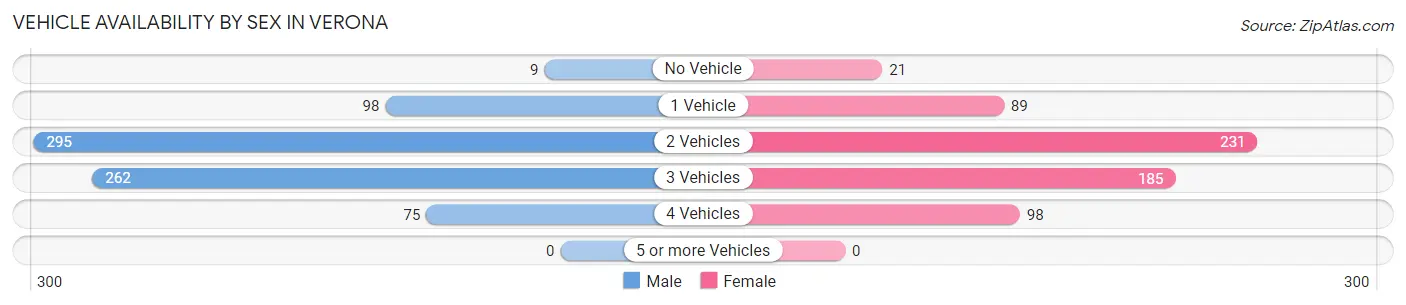
Vehicle Availability by Sex in Verona
The most prevalent vehicle ownership categories in Verona are males with 2 vehicles (295, accounting for 39.9%) and females with 2 vehicles (231, making up 47.3%).
| Vehicles Available | Male | Female |
| No Vehicle | 9 (1.2%) | 21 (3.4%) |
| 1 Vehicle | 98 (13.3%) | 89 (14.3%) |
| 2 Vehicles | 295 (39.9%) | 231 (37.0%) |
| 3 Vehicles | 262 (35.4%) | 185 (29.6%) |
| 4 Vehicles | 75 (10.2%) | 98 (15.7%) |
| 5 or more Vehicles | 0 (0.0%) | 0 (0.0%) |
| Total | 739 (100.0%) | 624 (100.0%) |
Commute Time in Verona
The most frequently occuring commute durations in Verona are 15 to 19 minutes (440 commuters, 32.3%), 10 to 14 minutes (274 commuters, 20.1%), and 20 to 24 minutes (261 commuters, 19.2%).
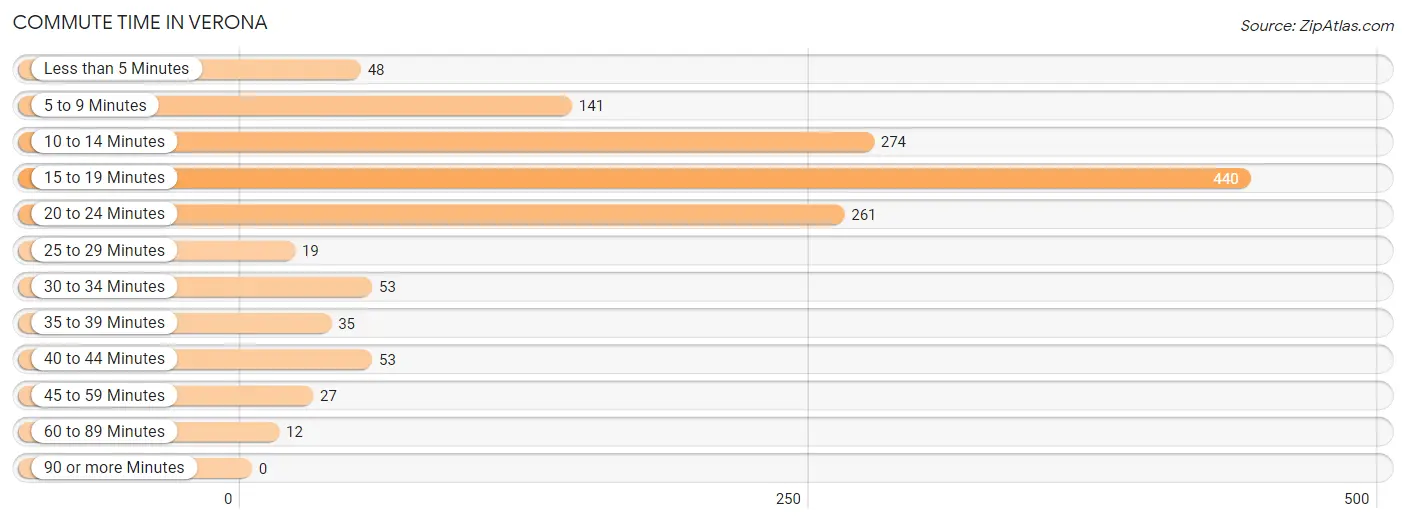
| Commute Time | # Commuters | % Commuters |
| Less than 5 Minutes | 48 | 3.5% |
| 5 to 9 Minutes | 141 | 10.3% |
| 10 to 14 Minutes | 274 | 20.1% |
| 15 to 19 Minutes | 440 | 32.3% |
| 20 to 24 Minutes | 261 | 19.2% |
| 25 to 29 Minutes | 19 | 1.4% |
| 30 to 34 Minutes | 53 | 3.9% |
| 35 to 39 Minutes | 35 | 2.6% |
| 40 to 44 Minutes | 53 | 3.9% |
| 45 to 59 Minutes | 27 | 2.0% |
| 60 to 89 Minutes | 12 | 0.9% |
| 90 or more Minutes | 0 | 0.0% |
Commute Time by Sex in Verona
The most common commute times in Verona are 10 to 14 minutes (170 commuters, 23.0%) for males and 15 to 19 minutes (298 commuters, 47.8%) for females.
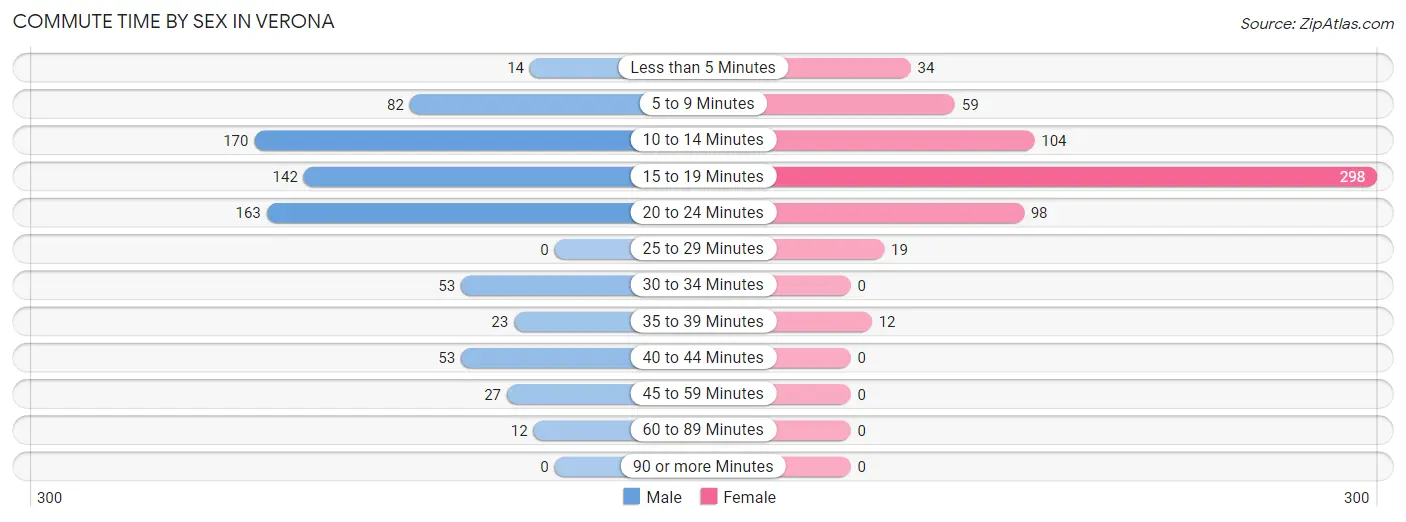
| Commute Time | Male | Female |
| Less than 5 Minutes | 14 (1.9%) | 34 (5.4%) |
| 5 to 9 Minutes | 82 (11.1%) | 59 (9.5%) |
| 10 to 14 Minutes | 170 (23.0%) | 104 (16.7%) |
| 15 to 19 Minutes | 142 (19.2%) | 298 (47.8%) |
| 20 to 24 Minutes | 163 (22.1%) | 98 (15.7%) |
| 25 to 29 Minutes | 0 (0.0%) | 19 (3.0%) |
| 30 to 34 Minutes | 53 (7.2%) | 0 (0.0%) |
| 35 to 39 Minutes | 23 (3.1%) | 12 (1.9%) |
| 40 to 44 Minutes | 53 (7.2%) | 0 (0.0%) |
| 45 to 59 Minutes | 27 (3.6%) | 0 (0.0%) |
| 60 to 89 Minutes | 12 (1.6%) | 0 (0.0%) |
| 90 or more Minutes | 0 (0.0%) | 0 (0.0%) |
Time of Departure to Work by Sex in Verona
The most frequent times of departure to work in Verona are 6:00 AM to 6:29 AM (134, 18.1%) for males and 6:00 AM to 6:29 AM (152, 24.4%) for females.
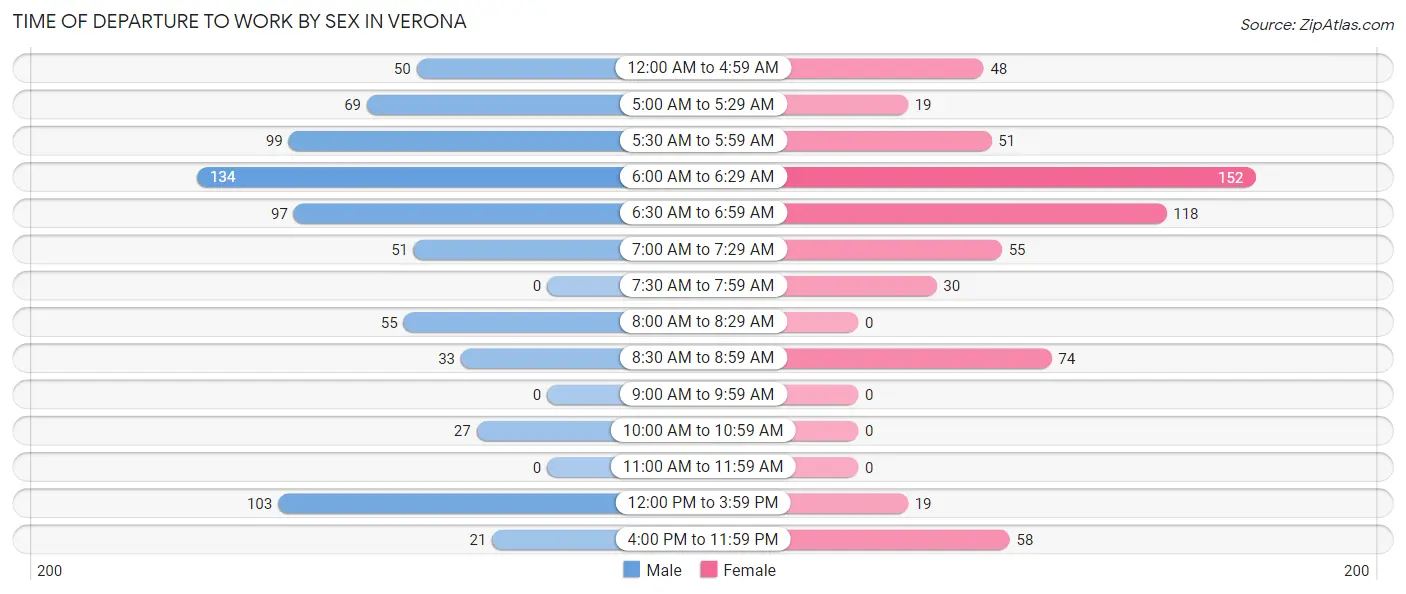
| Time of Departure | Male | Female |
| 12:00 AM to 4:59 AM | 50 (6.8%) | 48 (7.7%) |
| 5:00 AM to 5:29 AM | 69 (9.3%) | 19 (3.0%) |
| 5:30 AM to 5:59 AM | 99 (13.4%) | 51 (8.2%) |
| 6:00 AM to 6:29 AM | 134 (18.1%) | 152 (24.4%) |
| 6:30 AM to 6:59 AM | 97 (13.1%) | 118 (18.9%) |
| 7:00 AM to 7:29 AM | 51 (6.9%) | 55 (8.8%) |
| 7:30 AM to 7:59 AM | 0 (0.0%) | 30 (4.8%) |
| 8:00 AM to 8:29 AM | 55 (7.4%) | 0 (0.0%) |
| 8:30 AM to 8:59 AM | 33 (4.5%) | 74 (11.9%) |
| 9:00 AM to 9:59 AM | 0 (0.0%) | 0 (0.0%) |
| 10:00 AM to 10:59 AM | 27 (3.6%) | 0 (0.0%) |
| 11:00 AM to 11:59 AM | 0 (0.0%) | 0 (0.0%) |
| 12:00 PM to 3:59 PM | 103 (13.9%) | 19 (3.0%) |
| 4:00 PM to 11:59 PM | 21 (2.8%) | 58 (9.3%) |
| Total | 739 (100.0%) | 624 (100.0%) |
Housing Occupancy in Verona
Occupancy by Ownership in Verona
Of the total 1,066 dwellings in Verona, owner-occupied units account for 352 (33.0%), while renter-occupied units make up 714 (67.0%).
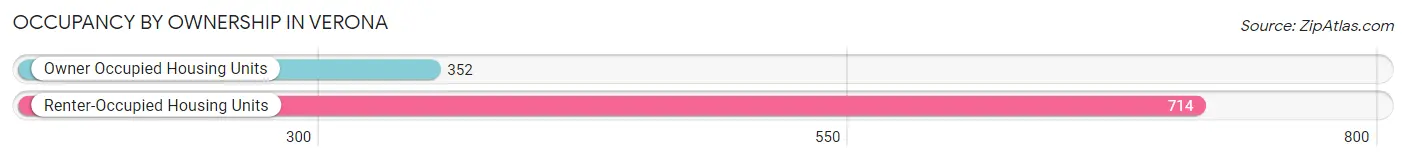
| Occupancy | # Housing Units | % Housing Units |
| Owner Occupied Housing Units | 352 | 33.0% |
| Renter-Occupied Housing Units | 714 | 67.0% |
| Total Occupied Housing Units | 1,066 | 100.0% |
Occupancy by Household Size in Verona
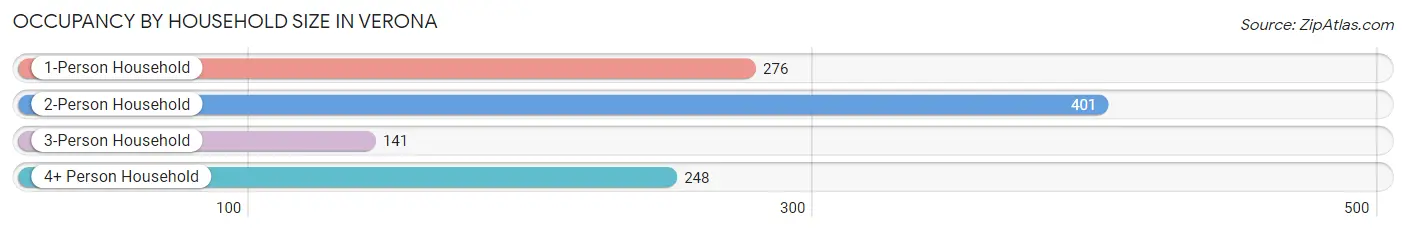
| Household Size | # Housing Units | % Housing Units |
| 1-Person Household | 276 | 25.9% |
| 2-Person Household | 401 | 37.6% |
| 3-Person Household | 141 | 13.2% |
| 4+ Person Household | 248 | 23.3% |
| Total Housing Units | 1,066 | 100.0% |
Occupancy by Ownership by Household Size in Verona
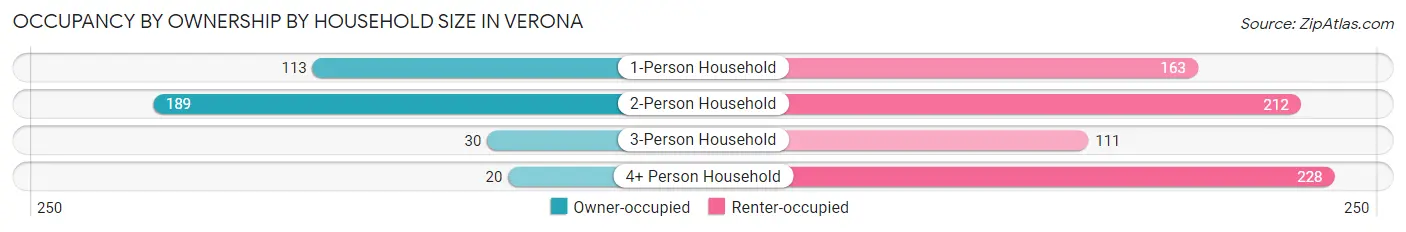
| Household Size | Owner-occupied | Renter-occupied |
| 1-Person Household | 113 (40.9%) | 163 (59.1%) |
| 2-Person Household | 189 (47.1%) | 212 (52.9%) |
| 3-Person Household | 30 (21.3%) | 111 (78.7%) |
| 4+ Person Household | 20 (8.1%) | 228 (91.9%) |
| Total Housing Units | 352 (33.0%) | 714 (67.0%) |
Occupancy by Educational Attainment in Verona
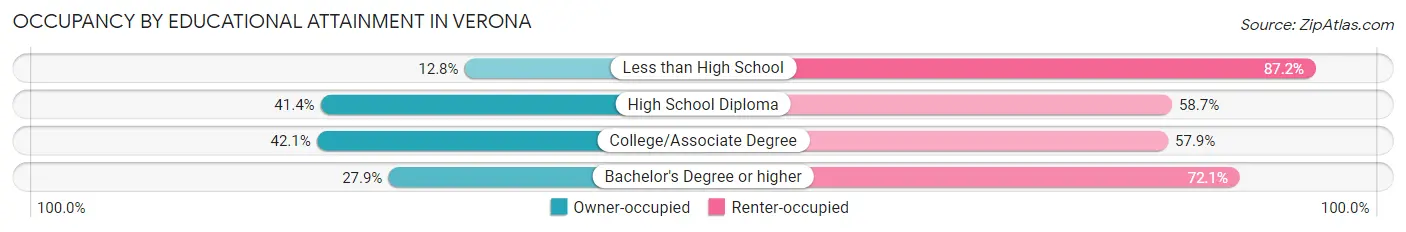
| Household Size | Owner-occupied | Renter-occupied |
| Less than High School | 36 (12.8%) | 245 (87.2%) |
| High School Diploma | 129 (41.3%) | 183 (58.7%) |
| College/Associate Degree | 163 (42.1%) | 224 (57.9%) |
| Bachelor's Degree or higher | 24 (27.9%) | 62 (72.1%) |
Occupancy by Age of Householder in Verona
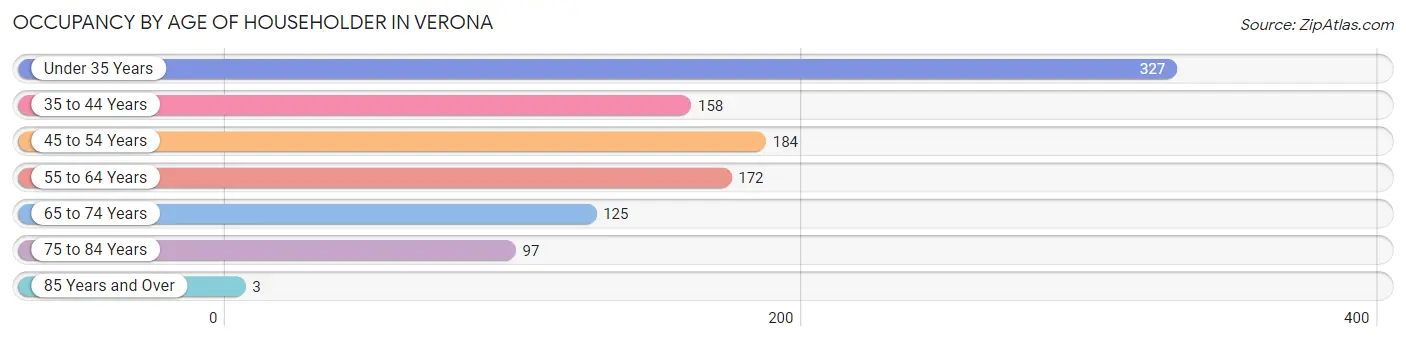
| Age Bracket | # Households | % Households |
| Under 35 Years | 327 | 30.7% |
| 35 to 44 Years | 158 | 14.8% |
| 45 to 54 Years | 184 | 17.3% |
| 55 to 64 Years | 172 | 16.1% |
| 65 to 74 Years | 125 | 11.7% |
| 75 to 84 Years | 97 | 9.1% |
| 85 Years and Over | 3 | 0.3% |
| Total | 1,066 | 100.0% |
Housing Finances in Verona
Median Income by Occupancy in Verona
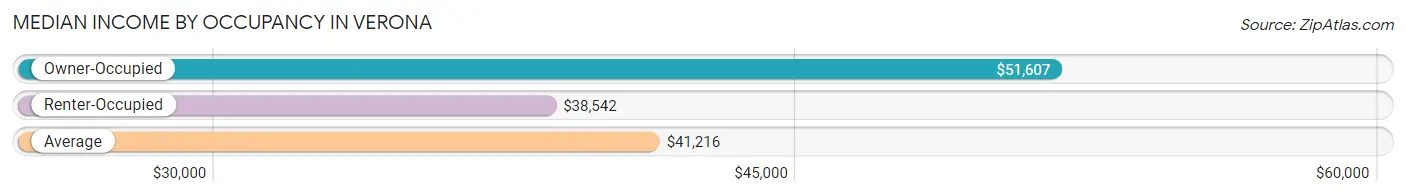
| Occupancy Type | # Households | Median Income |
| Owner-Occupied | 352 (33.0%) | $51,607 |
| Renter-Occupied | 714 (67.0%) | $38,542 |
| Average | 1,066 (100.0%) | $41,216 |
Occupancy by Householder Income Bracket in Verona
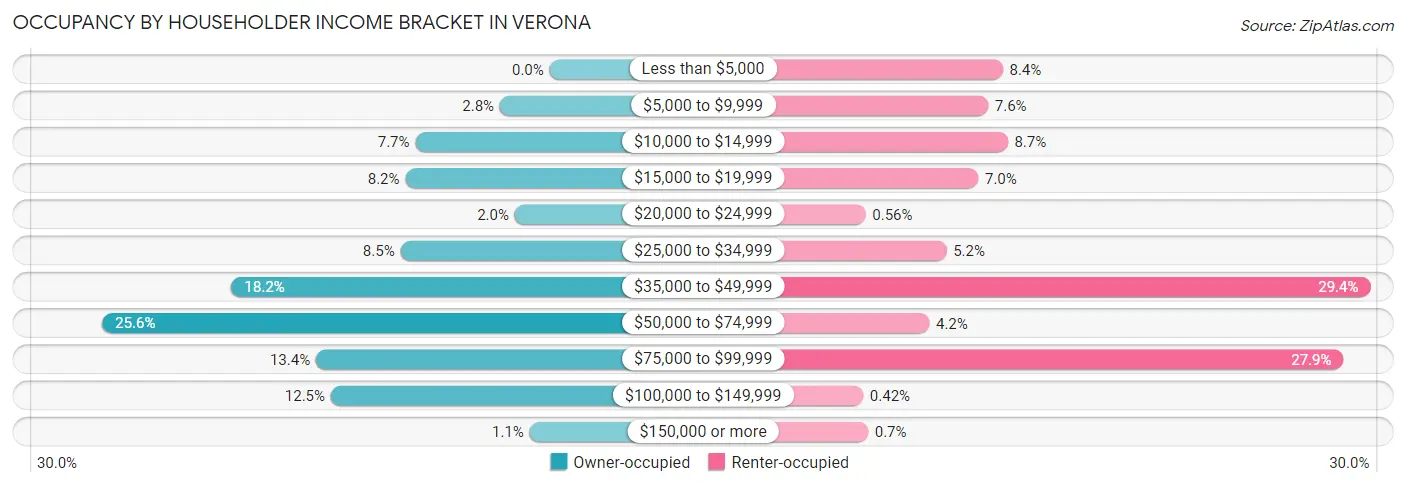
| Income Bracket | Owner-occupied | Renter-occupied |
| Less than $5,000 | 0 (0.0%) | 60 (8.4%) |
| $5,000 to $9,999 | 10 (2.8%) | 54 (7.6%) |
| $10,000 to $14,999 | 27 (7.7%) | 62 (8.7%) |
| $15,000 to $19,999 | 29 (8.2%) | 50 (7.0%) |
| $20,000 to $24,999 | 7 (2.0%) | 4 (0.6%) |
| $25,000 to $34,999 | 30 (8.5%) | 37 (5.2%) |
| $35,000 to $49,999 | 64 (18.2%) | 210 (29.4%) |
| $50,000 to $74,999 | 90 (25.6%) | 30 (4.2%) |
| $75,000 to $99,999 | 47 (13.4%) | 199 (27.9%) |
| $100,000 to $149,999 | 44 (12.5%) | 3 (0.4%) |
| $150,000 or more | 4 (1.1%) | 5 (0.7%) |
| Total | 352 (100.0%) | 714 (100.0%) |
Monthly Housing Cost Tiers in Verona
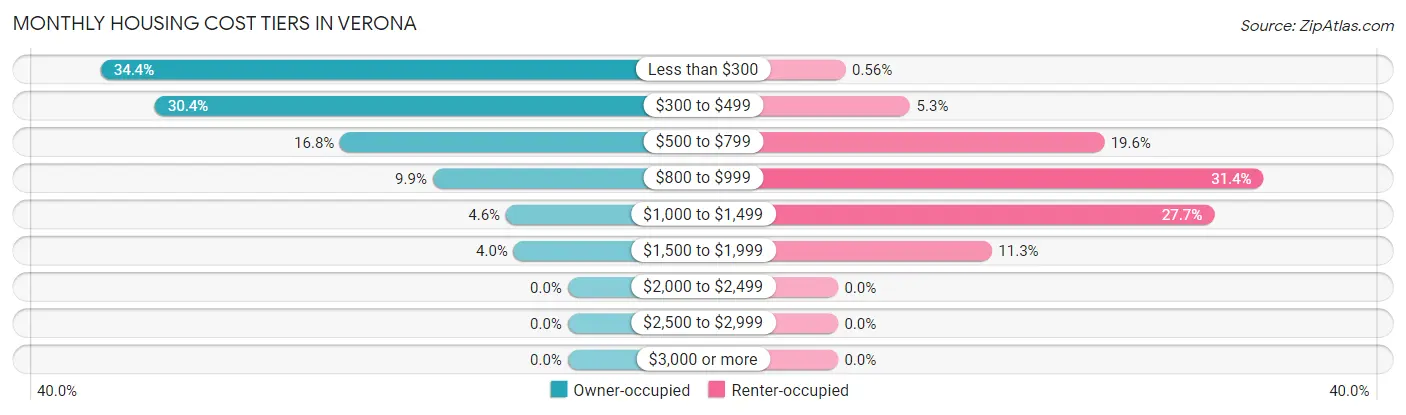
| Monthly Cost | Owner-occupied | Renter-occupied |
| Less than $300 | 121 (34.4%) | 4 (0.6%) |
| $300 to $499 | 107 (30.4%) | 38 (5.3%) |
| $500 to $799 | 59 (16.8%) | 140 (19.6%) |
| $800 to $999 | 35 (9.9%) | 224 (31.4%) |
| $1,000 to $1,499 | 16 (4.5%) | 198 (27.7%) |
| $1,500 to $1,999 | 14 (4.0%) | 81 (11.3%) |
| $2,000 to $2,499 | 0 (0.0%) | 0 (0.0%) |
| $2,500 to $2,999 | 0 (0.0%) | 0 (0.0%) |
| $3,000 or more | 0 (0.0%) | 0 (0.0%) |
| Total | 352 (100.0%) | 714 (100.0%) |
Physical Housing Characteristics in Verona
Housing Structures in Verona
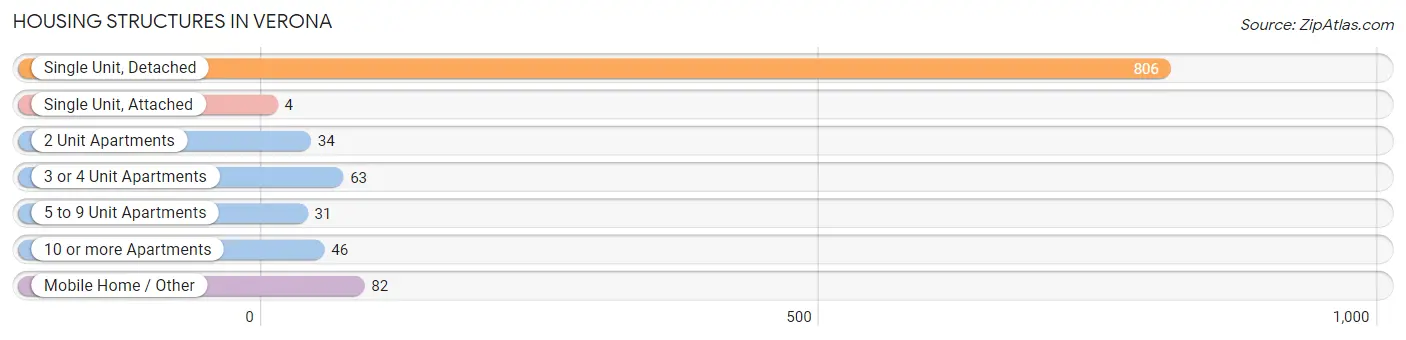
| Structure Type | # Housing Units | % Housing Units |
| Single Unit, Detached | 806 | 75.6% |
| Single Unit, Attached | 4 | 0.4% |
| 2 Unit Apartments | 34 | 3.2% |
| 3 or 4 Unit Apartments | 63 | 5.9% |
| 5 to 9 Unit Apartments | 31 | 2.9% |
| 10 or more Apartments | 46 | 4.3% |
| Mobile Home / Other | 82 | 7.7% |
| Total | 1,066 | 100.0% |
Housing Structures by Occupancy in Verona
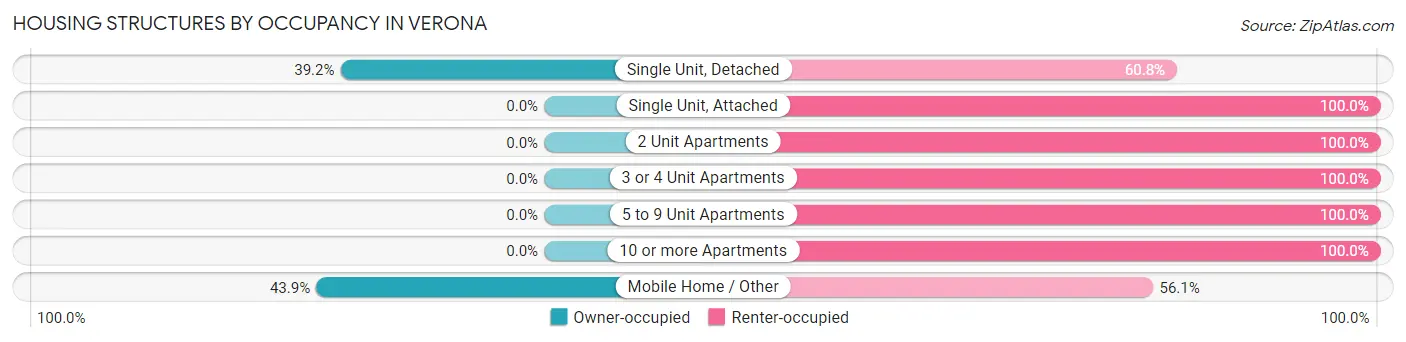
| Structure Type | Owner-occupied | Renter-occupied |
| Single Unit, Detached | 316 (39.2%) | 490 (60.8%) |
| Single Unit, Attached | 0 (0.0%) | 4 (100.0%) |
| 2 Unit Apartments | 0 (0.0%) | 34 (100.0%) |
| 3 or 4 Unit Apartments | 0 (0.0%) | 63 (100.0%) |
| 5 to 9 Unit Apartments | 0 (0.0%) | 31 (100.0%) |
| 10 or more Apartments | 0 (0.0%) | 46 (100.0%) |
| Mobile Home / Other | 36 (43.9%) | 46 (56.1%) |
| Total | 352 (33.0%) | 714 (67.0%) |
Housing Structures by Number of Rooms in Verona
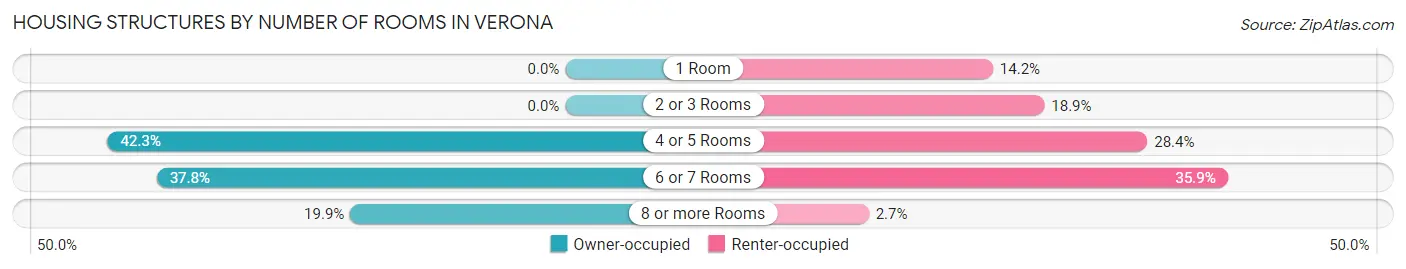
| Number of Rooms | Owner-occupied | Renter-occupied |
| 1 Room | 0 (0.0%) | 101 (14.1%) |
| 2 or 3 Rooms | 0 (0.0%) | 135 (18.9%) |
| 4 or 5 Rooms | 149 (42.3%) | 203 (28.4%) |
| 6 or 7 Rooms | 133 (37.8%) | 256 (35.8%) |
| 8 or more Rooms | 70 (19.9%) | 19 (2.7%) |
| Total | 352 (100.0%) | 714 (100.0%) |
Housing Structure by Heating Type in Verona
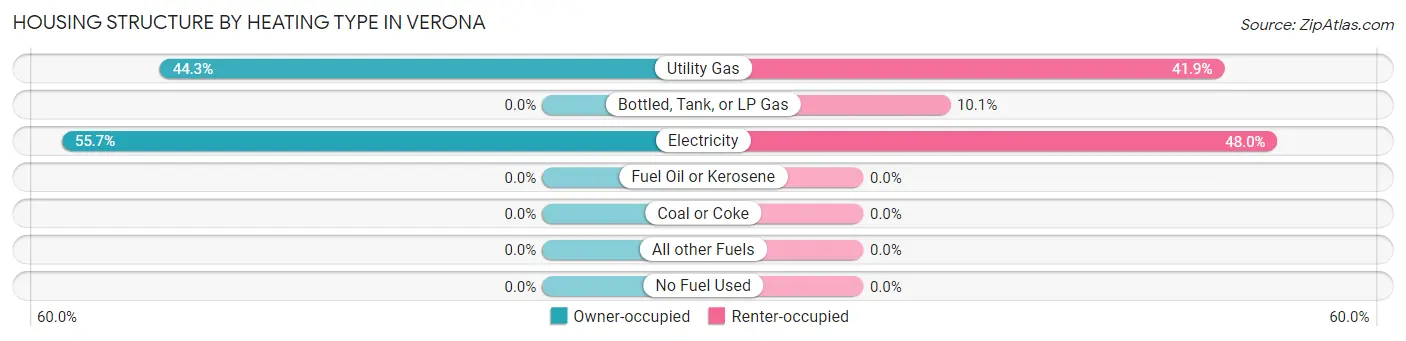
| Heating Type | Owner-occupied | Renter-occupied |
| Utility Gas | 156 (44.3%) | 299 (41.9%) |
| Bottled, Tank, or LP Gas | 0 (0.0%) | 72 (10.1%) |
| Electricity | 196 (55.7%) | 343 (48.0%) |
| Fuel Oil or Kerosene | 0 (0.0%) | 0 (0.0%) |
| Coal or Coke | 0 (0.0%) | 0 (0.0%) |
| All other Fuels | 0 (0.0%) | 0 (0.0%) |
| No Fuel Used | 0 (0.0%) | 0 (0.0%) |
| Total | 352 (100.0%) | 714 (100.0%) |
Household Vehicle Usage in Verona
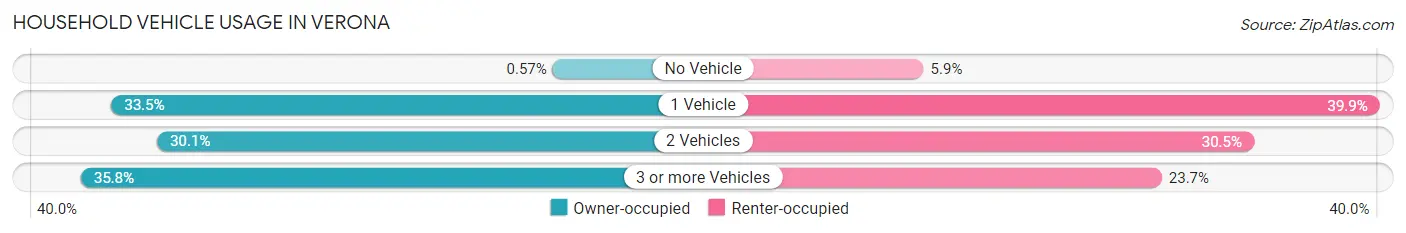
| Vehicles per Household | Owner-occupied | Renter-occupied |
| No Vehicle | 2 (0.6%) | 42 (5.9%) |
| 1 Vehicle | 118 (33.5%) | 285 (39.9%) |
| 2 Vehicles | 106 (30.1%) | 218 (30.5%) |
| 3 or more Vehicles | 126 (35.8%) | 169 (23.7%) |
| Total | 352 (100.0%) | 714 (100.0%) |
Real Estate & Mortgages in Verona
Real Estate and Mortgage Overview in Verona
| Characteristic | Without Mortgage | With Mortgage |
| Housing Units | 224 | 128 |
| Median Property Value | $94,900 | $104,900 |
| Median Household Income | $61,293 | $0 |
| Monthly Housing Costs | $290 | $0 |
| Real Estate Taxes | $585 | $33 |
Property Value by Mortgage Status in Verona
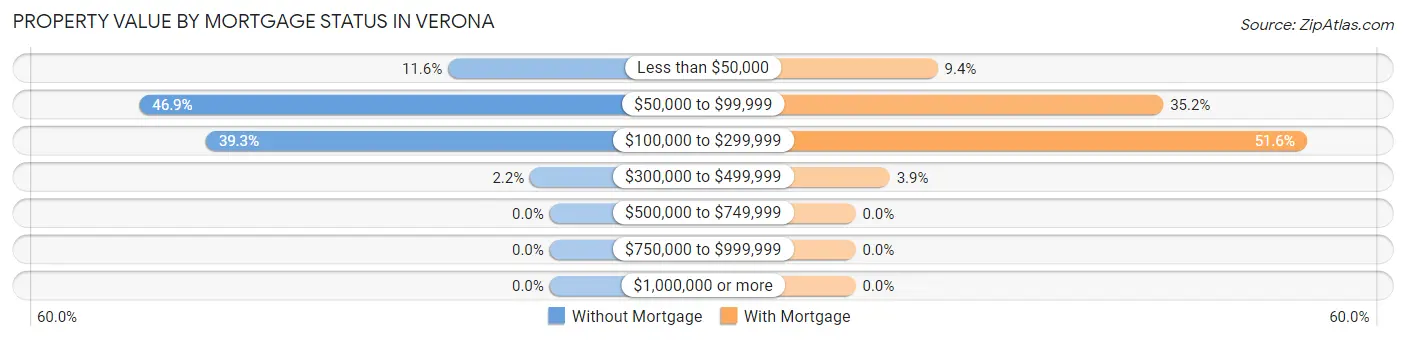
| Property Value | Without Mortgage | With Mortgage |
| Less than $50,000 | 26 (11.6%) | 12 (9.4%) |
| $50,000 to $99,999 | 105 (46.9%) | 45 (35.2%) |
| $100,000 to $299,999 | 88 (39.3%) | 66 (51.6%) |
| $300,000 to $499,999 | 5 (2.2%) | 5 (3.9%) |
| $500,000 to $749,999 | 0 (0.0%) | 0 (0.0%) |
| $750,000 to $999,999 | 0 (0.0%) | 0 (0.0%) |
| $1,000,000 or more | 0 (0.0%) | 0 (0.0%) |
| Total | 224 (100.0%) | 128 (100.0%) |
Household Income by Mortgage Status in Verona
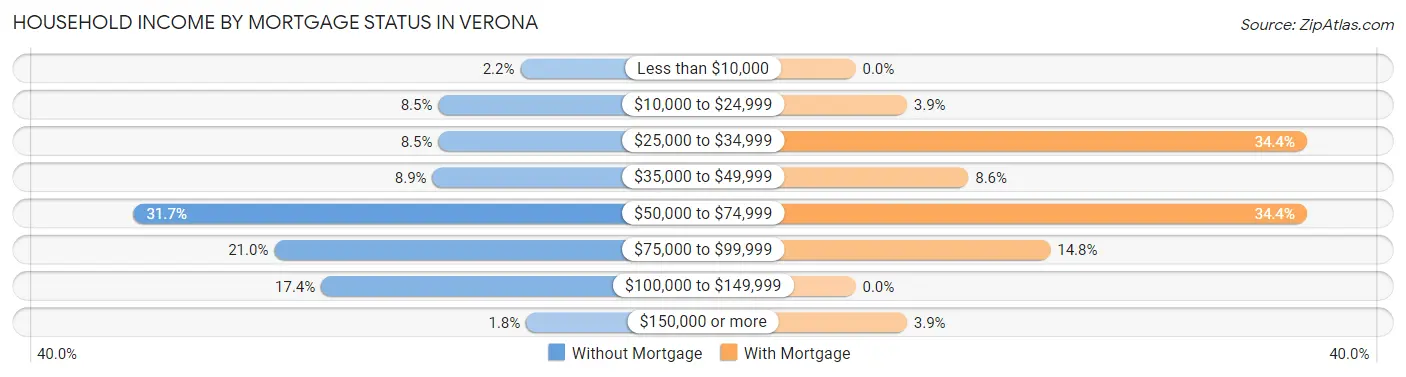
| Household Income | Without Mortgage | With Mortgage |
| Less than $10,000 | 5 (2.2%) | 0 (0.0%) |
| $10,000 to $24,999 | 19 (8.5%) | 5 (3.9%) |
| $25,000 to $34,999 | 19 (8.5%) | 44 (34.4%) |
| $35,000 to $49,999 | 20 (8.9%) | 11 (8.6%) |
| $50,000 to $74,999 | 71 (31.7%) | 44 (34.4%) |
| $75,000 to $99,999 | 47 (21.0%) | 19 (14.8%) |
| $100,000 to $149,999 | 39 (17.4%) | 0 (0.0%) |
| $150,000 or more | 4 (1.8%) | 5 (3.9%) |
| Total | 224 (100.0%) | 128 (100.0%) |
Property Value to Household Income Ratio in Verona
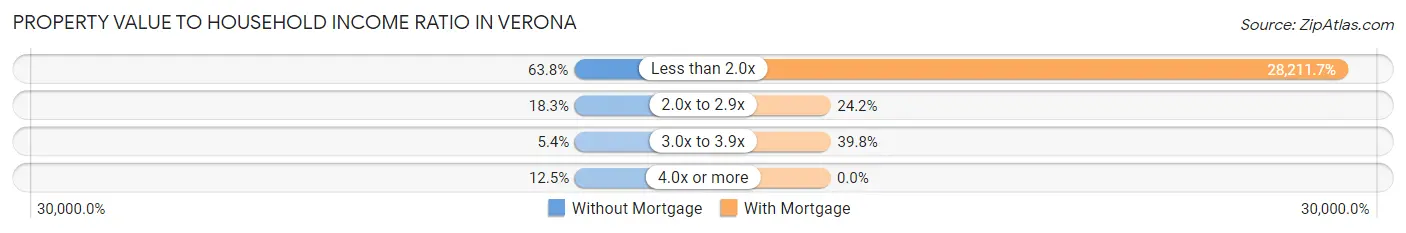
| Value-to-Income Ratio | Without Mortgage | With Mortgage |
| Less than 2.0x | 143 (63.8%) | 36,111 (28,211.7%) |
| 2.0x to 2.9x | 41 (18.3%) | 31 (24.2%) |
| 3.0x to 3.9x | 12 (5.4%) | 51 (39.8%) |
| 4.0x or more | 28 (12.5%) | 0 (0.0%) |
| Total | 224 (100.0%) | 128 (100.0%) |
Real Estate Taxes by Mortgage Status in Verona
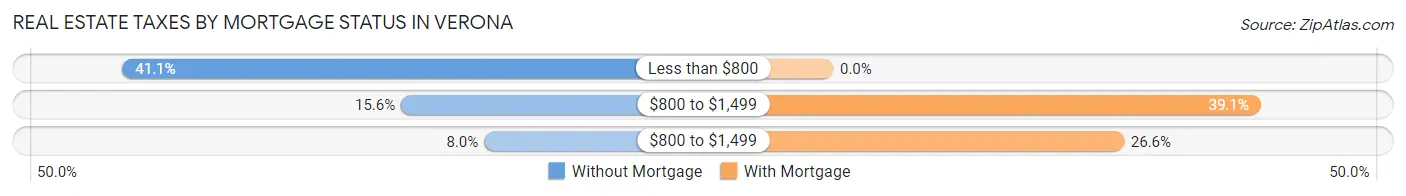
| Property Taxes | Without Mortgage | With Mortgage |
| Less than $800 | 92 (41.1%) | 0 (0.0%) |
| $800 to $1,499 | 35 (15.6%) | 50 (39.1%) |
| $800 to $1,499 | 18 (8.0%) | 34 (26.6%) |
| Total | 224 (100.0%) | 128 (100.0%) |
Health & Disability in Verona
Health Insurance Coverage by Age in Verona
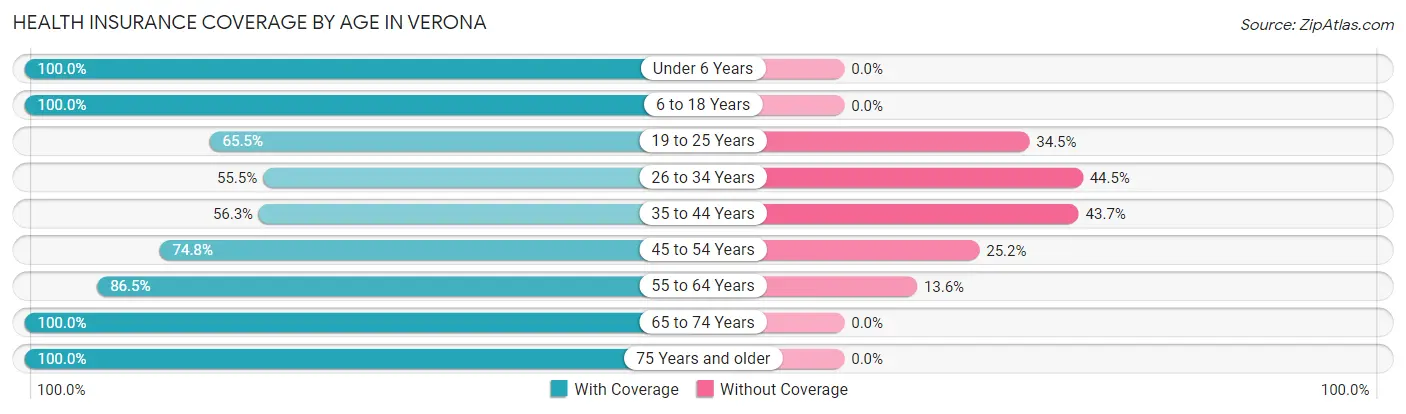
| Age Bracket | With Coverage | Without Coverage |
| Under 6 Years | 255 (100.0%) | 0 (0.0%) |
| 6 to 18 Years | 444 (100.0%) | 0 (0.0%) |
| 19 to 25 Years | 186 (65.5%) | 98 (34.5%) |
| 26 to 34 Years | 396 (55.5%) | 317 (44.5%) |
| 35 to 44 Years | 152 (56.3%) | 118 (43.7%) |
| 45 to 54 Years | 208 (74.8%) | 70 (25.2%) |
| 55 to 64 Years | 217 (86.5%) | 34 (13.6%) |
| 65 to 74 Years | 167 (100.0%) | 0 (0.0%) |
| 75 Years and older | 131 (100.0%) | 0 (0.0%) |
| Total | 2,156 (77.2%) | 637 (22.8%) |
Health Insurance Coverage by Citizenship Status in Verona
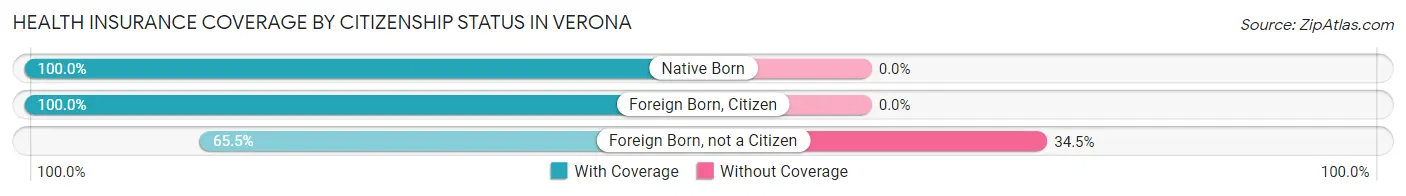
| Citizenship Status | With Coverage | Without Coverage |
| Native Born | 255 (100.0%) | 0 (0.0%) |
| Foreign Born, Citizen | 444 (100.0%) | 0 (0.0%) |
| Foreign Born, not a Citizen | 186 (65.5%) | 98 (34.5%) |
Health Insurance Coverage by Household Income in Verona
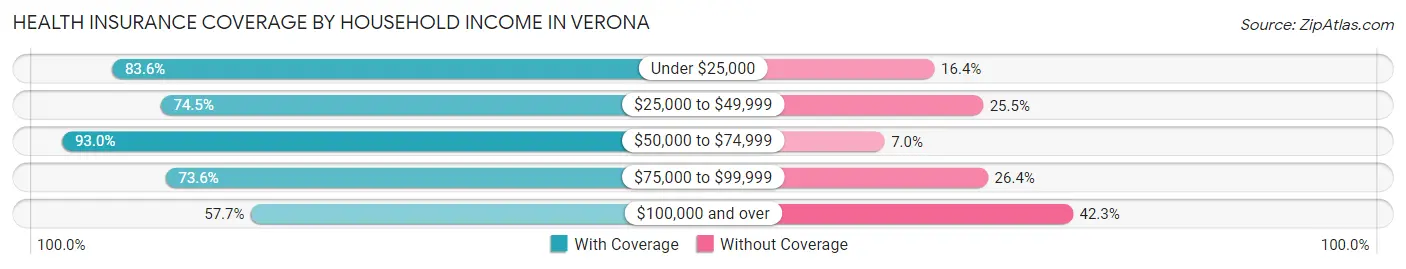
| Household Income | With Coverage | Without Coverage |
| Under $25,000 | 567 (83.6%) | 111 (16.4%) |
| $25,000 to $49,999 | 600 (74.5%) | 205 (25.5%) |
| $50,000 to $74,999 | 252 (93.0%) | 19 (7.0%) |
| $75,000 to $99,999 | 636 (73.6%) | 228 (26.4%) |
| $100,000 and over | 101 (57.7%) | 74 (42.3%) |
Public vs Private Health Insurance Coverage by Age in Verona
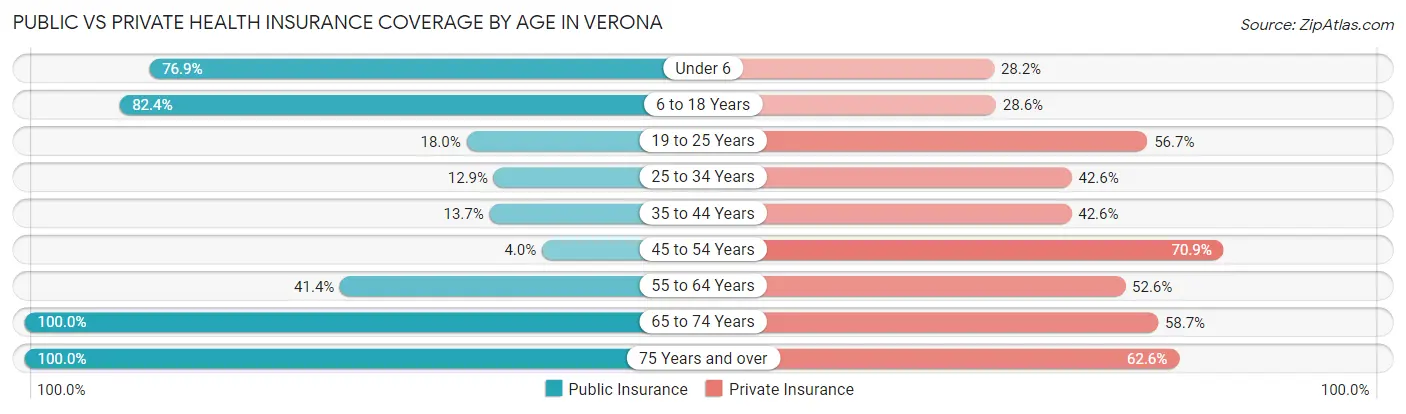
| Age Bracket | Public Insurance | Private Insurance |
| Under 6 | 196 (76.9%) | 72 (28.2%) |
| 6 to 18 Years | 366 (82.4%) | 127 (28.6%) |
| 19 to 25 Years | 51 (18.0%) | 161 (56.7%) |
| 25 to 34 Years | 92 (12.9%) | 304 (42.6%) |
| 35 to 44 Years | 37 (13.7%) | 115 (42.6%) |
| 45 to 54 Years | 11 (4.0%) | 197 (70.9%) |
| 55 to 64 Years | 104 (41.4%) | 132 (52.6%) |
| 65 to 74 Years | 167 (100.0%) | 98 (58.7%) |
| 75 Years and over | 131 (100.0%) | 82 (62.6%) |
| Total | 1,155 (41.3%) | 1,288 (46.1%) |
Disability Status by Sex by Age in Verona
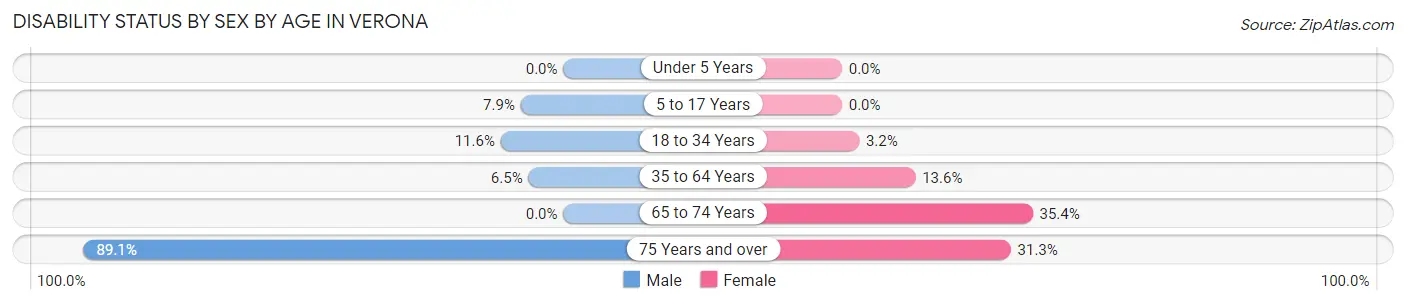
| Age Bracket | Male | Female |
| Under 5 Years | 0 (0.0%) | 0 (0.0%) |
| 5 to 17 Years | 14 (7.9%) | 0 (0.0%) |
| 18 to 34 Years | 74 (11.6%) | 14 (3.2%) |
| 35 to 64 Years | 18 (6.5%) | 71 (13.6%) |
| 65 to 74 Years | 0 (0.0%) | 40 (35.4%) |
| 75 Years and over | 57 (89.1%) | 21 (31.3%) |
Disability Class by Sex by Age in Verona
Disability Class: Hearing Difficulty
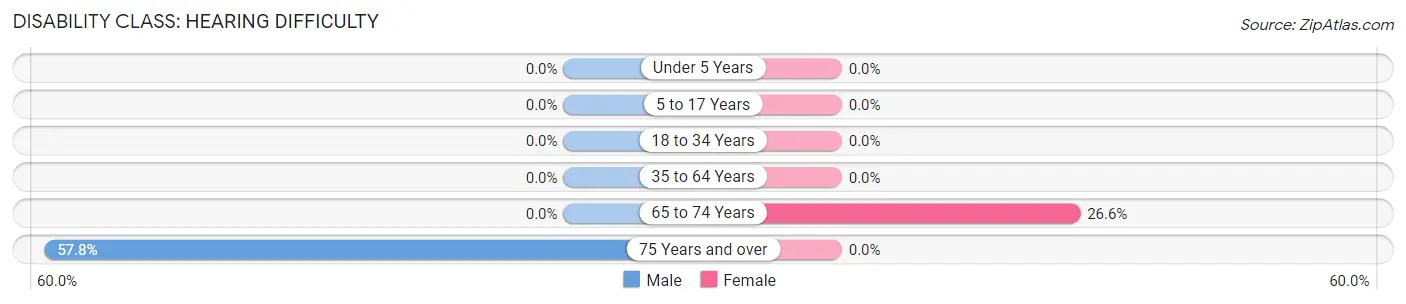
| Age Bracket | Male | Female |
| Under 5 Years | 0 (0.0%) | 0 (0.0%) |
| 5 to 17 Years | 0 (0.0%) | 0 (0.0%) |
| 18 to 34 Years | 0 (0.0%) | 0 (0.0%) |
| 35 to 64 Years | 0 (0.0%) | 0 (0.0%) |
| 65 to 74 Years | 0 (0.0%) | 30 (26.6%) |
| 75 Years and over | 37 (57.8%) | 0 (0.0%) |
Disability Class: Vision Difficulty
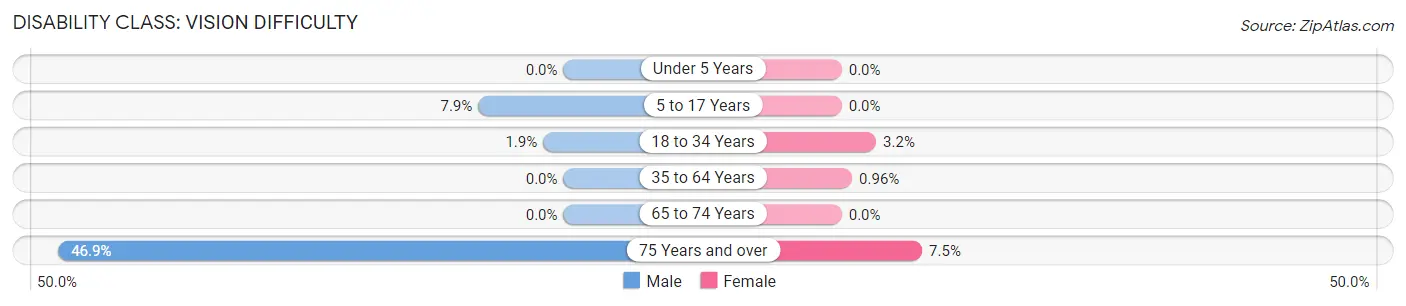
| Age Bracket | Male | Female |
| Under 5 Years | 0 (0.0%) | 0 (0.0%) |
| 5 to 17 Years | 14 (7.9%) | 0 (0.0%) |
| 18 to 34 Years | 12 (1.9%) | 14 (3.2%) |
| 35 to 64 Years | 0 (0.0%) | 5 (1.0%) |
| 65 to 74 Years | 0 (0.0%) | 0 (0.0%) |
| 75 Years and over | 30 (46.9%) | 5 (7.5%) |
Disability Class: Cognitive Difficulty
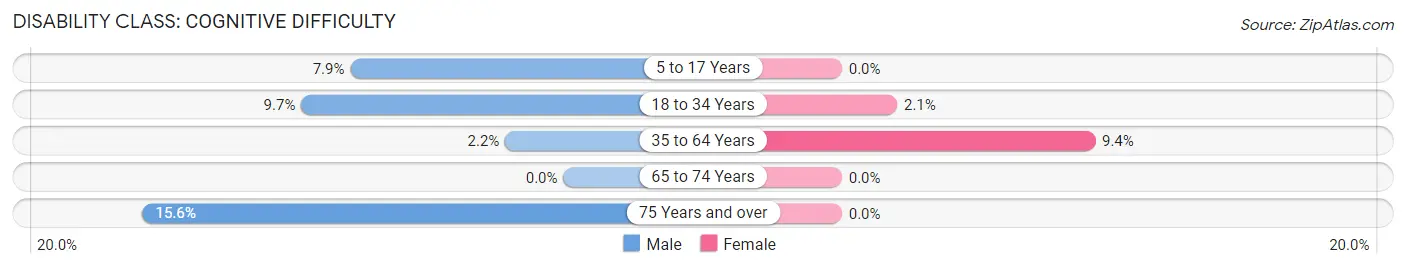
| Age Bracket | Male | Female |
| 5 to 17 Years | 14 (7.9%) | 0 (0.0%) |
| 18 to 34 Years | 62 (9.7%) | 9 (2.1%) |
| 35 to 64 Years | 6 (2.2%) | 49 (9.4%) |
| 65 to 74 Years | 0 (0.0%) | 0 (0.0%) |
| 75 Years and over | 10 (15.6%) | 0 (0.0%) |
Disability Class: Ambulatory Difficulty
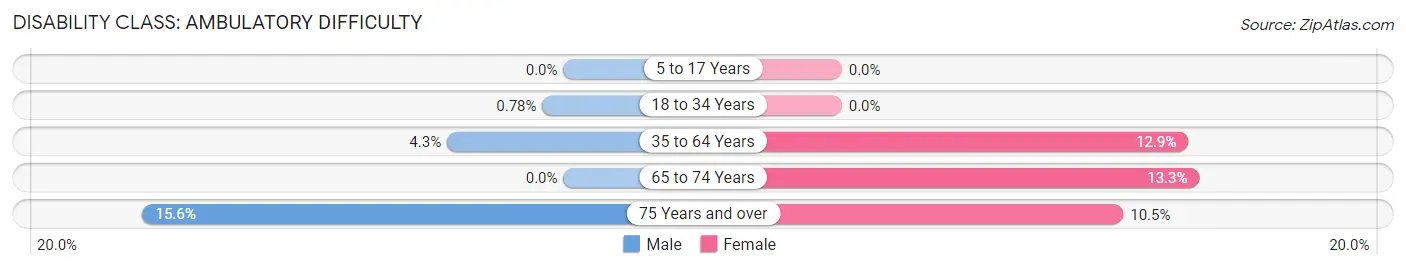
| Age Bracket | Male | Female |
| 5 to 17 Years | 0 (0.0%) | 0 (0.0%) |
| 18 to 34 Years | 5 (0.8%) | 0 (0.0%) |
| 35 to 64 Years | 12 (4.3%) | 67 (12.9%) |
| 65 to 74 Years | 0 (0.0%) | 15 (13.3%) |
| 75 Years and over | 10 (15.6%) | 7 (10.4%) |
Disability Class: Self-Care Difficulty
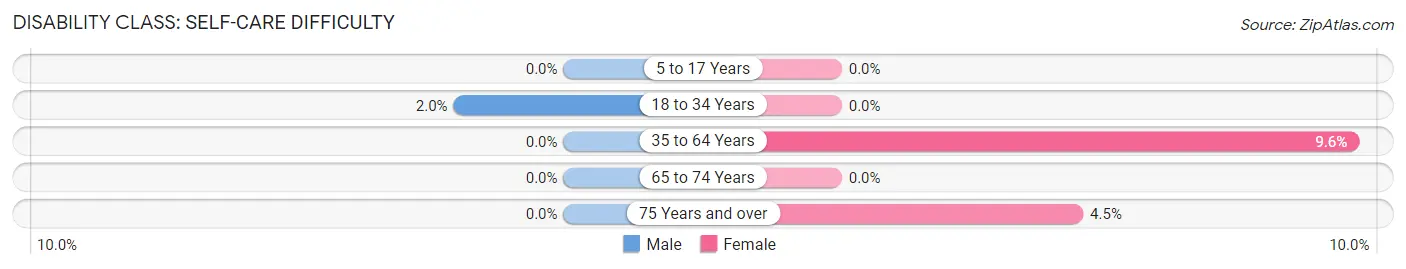
| Age Bracket | Male | Female |
| 5 to 17 Years | 0 (0.0%) | 0 (0.0%) |
| 18 to 34 Years | 13 (2.0%) | 0 (0.0%) |
| 35 to 64 Years | 0 (0.0%) | 50 (9.6%) |
| 65 to 74 Years | 0 (0.0%) | 0 (0.0%) |
| 75 Years and over | 0 (0.0%) | 3 (4.5%) |
Technology Access in Verona
Computing Device Access in Verona
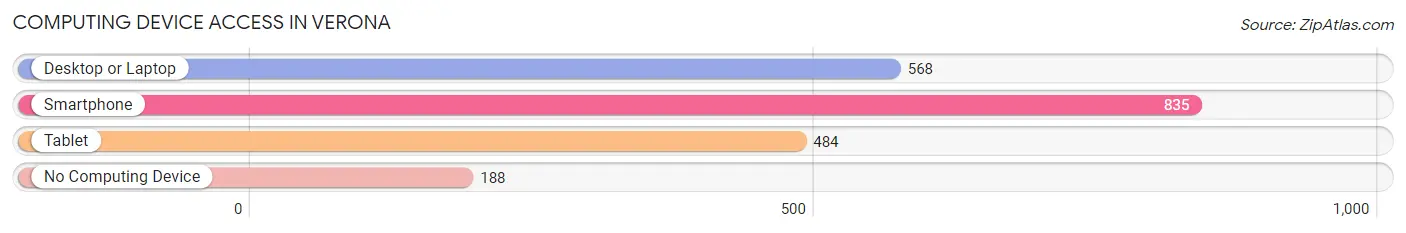
| Device Type | # Households | % Households |
| Desktop or Laptop | 568 | 53.3% |
| Smartphone | 835 | 78.3% |
| Tablet | 484 | 45.4% |
| No Computing Device | 188 | 17.6% |
| Total | 1,066 | 100.0% |
Internet Access in Verona
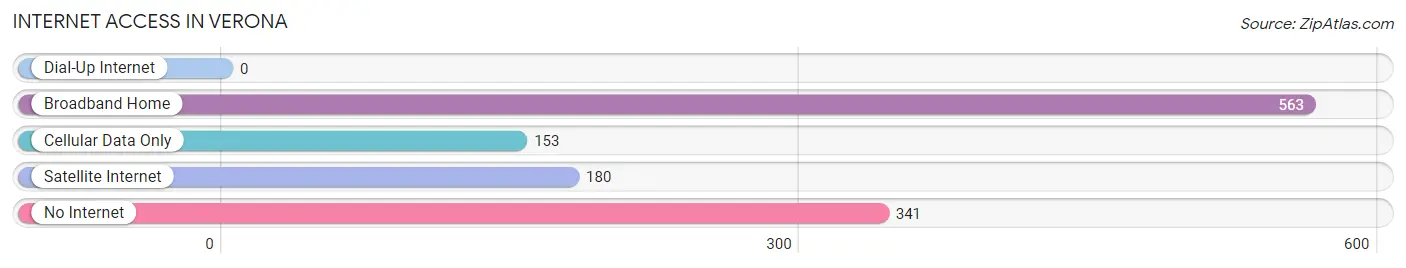
| Internet Type | # Households | % Households |
| Dial-Up Internet | 0 | 0.0% |
| Broadband Home | 563 | 52.8% |
| Cellular Data Only | 153 | 14.3% |
| Satellite Internet | 180 | 16.9% |
| No Internet | 341 | 32.0% |
| Total | 1,066 | 100.0% |
Verona Summary
Verona, Mississippi is a small town located in Lee County, Mississippi. It is situated on the banks of the Tombigbee River, approximately 20 miles south of Tupelo. The town was founded in 1837 and was named after the Italian city of Verona. The population of Verona was 1,845 in the 2010 census.
History
Verona was founded in 1837 by a group of settlers from Georgia and Alabama. The town was named after the Italian city of Verona. The town was originally located on the banks of the Tombigbee River, but was moved to its current location in 1845. The town was incorporated in 1848.
Verona was an important trading center during the Civil War. The town was the site of a Confederate victory in the Battle of Verona in 1863. The town was also the site of a skirmish between Union and Confederate forces in 1864.
Verona was an important railroad hub during the late 19th and early 20th centuries. The town was served by the Mobile and Ohio Railroad, the Yazoo and Mississippi Valley Railroad, and the Illinois Central Railroad.
Geography
Verona is located in Lee County, Mississippi. It is situated on the banks of the Tombigbee River, approximately 20 miles south of Tupelo. The town is located at an elevation of approximately 300 feet above sea level.
The climate in Verona is humid subtropical, with hot, humid summers and mild winters. The average annual temperature is 64°F, and the average annual precipitation is 51 inches.
Economy
Verona’s economy is largely based on agriculture. The town is home to several farms, including cotton, soybean, and corn farms. The town is also home to several manufacturing companies, including a furniture factory and a paper mill.
The town is also home to several retail stores, including a grocery store, a hardware store, and a pharmacy. The town is also home to several restaurants, including a pizza parlor and a Mexican restaurant.
Demographics
Verona’s population was 1,845 in the 2010 census. The town is approximately 75% white, 20% African American, and 5% Hispanic. The median household income in Verona is $31,000, and the median home value is $90,000. The town has a poverty rate of 22%.
Verona is served by the Lee County School District. The town is home to one elementary school, one middle school, and one high school. The town is also home to a branch of the Itawamba Community College.
Verona is home to several churches, including Baptist, Methodist, and Presbyterian churches. The town is also home to several parks, including a city park and a county park. The town is also home to a public library.
Common Questions
What is Per Capita Income in Verona?
Per Capita income in Verona is $20,791.
What is the Median Family Income in Verona?
Median Family Income in Verona is $52,622.
What is the Median Household income in Verona?
Median Household Income in Verona is $41,216.
What is Income or Wage Gap in Verona?
Income or Wage Gap in Verona is 3.0%.
Women in Verona earn 97.0 cents for every dollar earned by a man.
What is Inequality or Gini Index in Verona?
Inequality or Gini Index in Verona is 0.44.
What is the Total Population of Verona?
Total Population of Verona is 2,800.
What is the Total Male Population of Verona?
Total Male Population of Verona is 1,342.
What is the Total Female Population of Verona?
Total Female Population of Verona is 1,458.
What is the Ratio of Males per 100 Females in Verona?
There are 92.04 Males per 100 Females in Verona.
What is the Ratio of Females per 100 Males in Verona?
There are 108.64 Females per 100 Males in Verona.
What is the Median Population Age in Verona?
Median Population Age in Verona is 31.9 Years.
What is the Average Family Size in Verona
Average Family Size in Verona is 3.1 People.
What is the Average Household Size in Verona
Average Household Size in Verona is 2.6 People.
How Large is the Labor Force in Verona?
There are 1,465 People in the Labor Forcein in Verona.
What is the Percentage of People in the Labor Force in Verona?
67.2% of People are in the Labor Force in Verona.
What is the Unemployment Rate in Verona?
Unemployment Rate in Verona is 5.7%.