Osyka, MS Map & Demographics
Osyka Map
Osyka Overview
$13,974
PER CAPITA INCOME
$58,661
AVG FAMILY INCOME
13.0%
WAGE / INCOME GAP [ % ]
87.0¢/ $1
WAGE / INCOME GAP [ $ ]
0.51
INEQUALITY / GINI INDEX
408
TOTAL POPULATION
230
MALE POPULATION
178
FEMALE POPULATION
129.21
MALES / 100 FEMALES
77.39
FEMALES / 100 MALES
35.5
MEDIAN AGE
4.1
AVG FAMILY SIZE
2.7
AVG HOUSEHOLD SIZE
133
LABOR FORCE [ PEOPLE ]
42.1%
PERCENT IN LABOR FORCE
6.0%
UNEMPLOYMENT RATE
Osyka Zip Codes
Income in Osyka
Income Overview in Osyka
| Characteristic | Number | Measure |
| Per Capita Income | 408 | $13,974 |
| Median Family Income | 83 | $58,661 |
| Mean Family Income | 83 | $52,864 |
| Median Household Income | 151 | $0 |
| Mean Household Income | 151 | $34,805 |
| Income Deficit | 83 | $0 |
| Wage / Income Gap (%) | 408 | 12.97% |
| Wage / Income Gap ($) | 408 | 87.03¢ per $1 |
| Gini / Inequality Index | 408 | 0.51 |
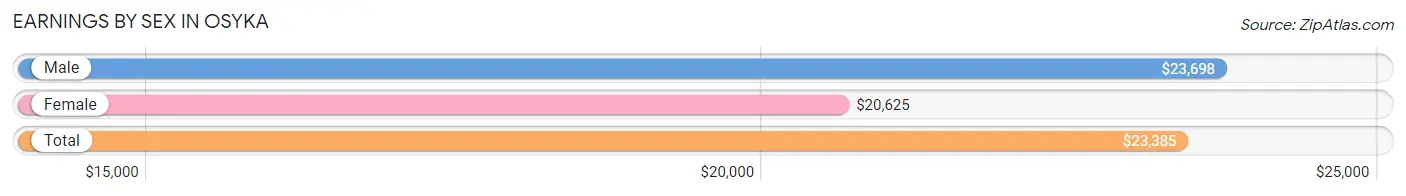
Earnings by Sex in Osyka
Average Earnings in Osyka are $23,385, $23,698 for men and $20,625 for women, a difference of 13.0%.
| Sex | Number | Average Earnings |
| Male | 67 (50.4%) | $23,698 |
| Female | 66 (49.6%) | $20,625 |
| Total | 133 (100.0%) | $23,385 |
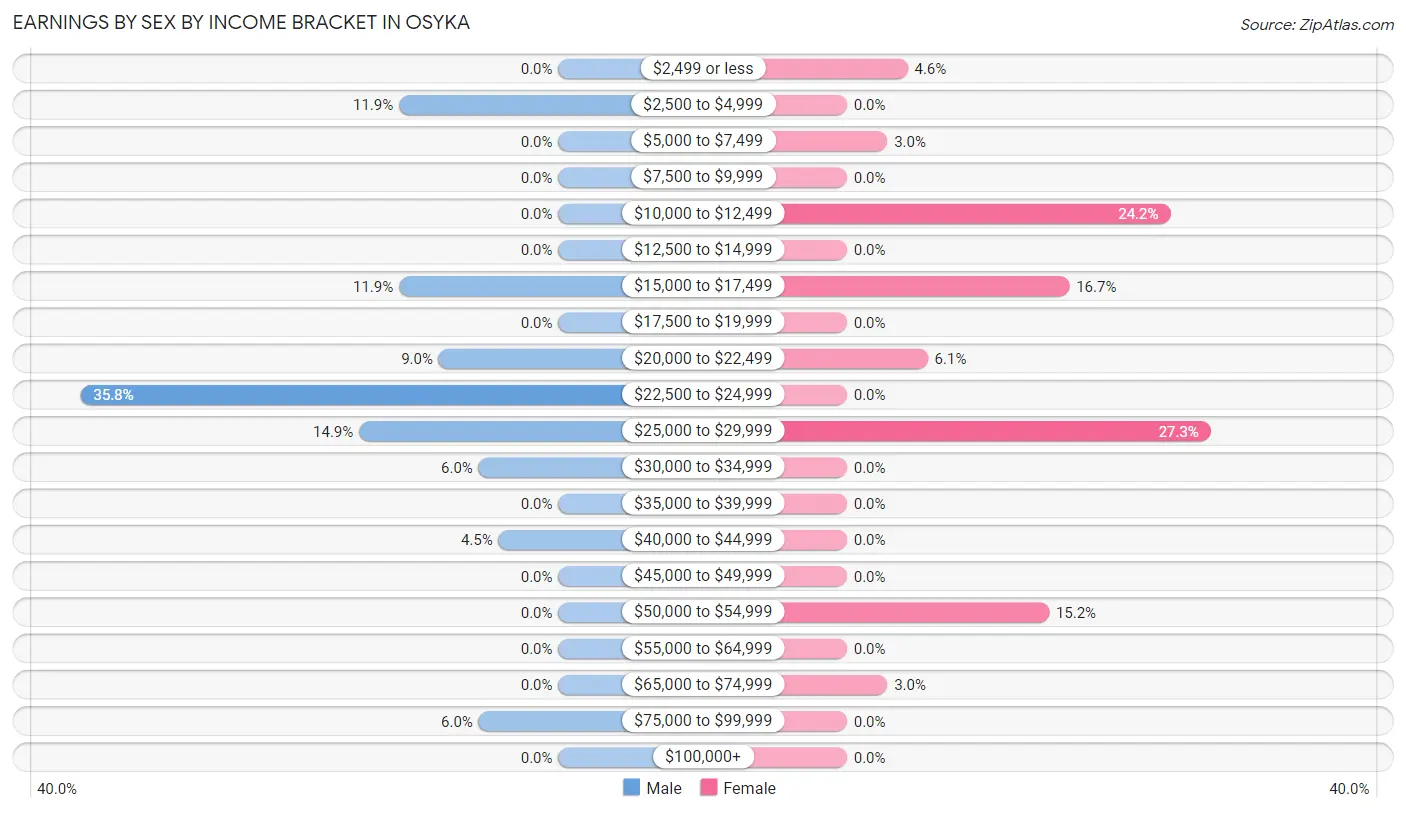
Earnings by Sex by Income Bracket in Osyka
The most common earnings brackets in Osyka are $22,500 to $24,999 for men (24 | 35.8%) and $25,000 to $29,999 for women (18 | 27.3%).
| Income | Male | Female |
| $2,499 or less | 0 (0.0%) | 3 (4.5%) |
| $2,500 to $4,999 | 8 (11.9%) | 0 (0.0%) |
| $5,000 to $7,499 | 0 (0.0%) | 2 (3.0%) |
| $7,500 to $9,999 | 0 (0.0%) | 0 (0.0%) |
| $10,000 to $12,499 | 0 (0.0%) | 16 (24.2%) |
| $12,500 to $14,999 | 0 (0.0%) | 0 (0.0%) |
| $15,000 to $17,499 | 8 (11.9%) | 11 (16.7%) |
| $17,500 to $19,999 | 0 (0.0%) | 0 (0.0%) |
| $20,000 to $22,499 | 6 (9.0%) | 4 (6.1%) |
| $22,500 to $24,999 | 24 (35.8%) | 0 (0.0%) |
| $25,000 to $29,999 | 10 (14.9%) | 18 (27.3%) |
| $30,000 to $34,999 | 4 (6.0%) | 0 (0.0%) |
| $35,000 to $39,999 | 0 (0.0%) | 0 (0.0%) |
| $40,000 to $44,999 | 3 (4.5%) | 0 (0.0%) |
| $45,000 to $49,999 | 0 (0.0%) | 0 (0.0%) |
| $50,000 to $54,999 | 0 (0.0%) | 10 (15.1%) |
| $55,000 to $64,999 | 0 (0.0%) | 0 (0.0%) |
| $65,000 to $74,999 | 0 (0.0%) | 2 (3.0%) |
| $75,000 to $99,999 | 4 (6.0%) | 0 (0.0%) |
| $100,000+ | 0 (0.0%) | 0 (0.0%) |
| Total | 67 (100.0%) | 66 (100.0%) |
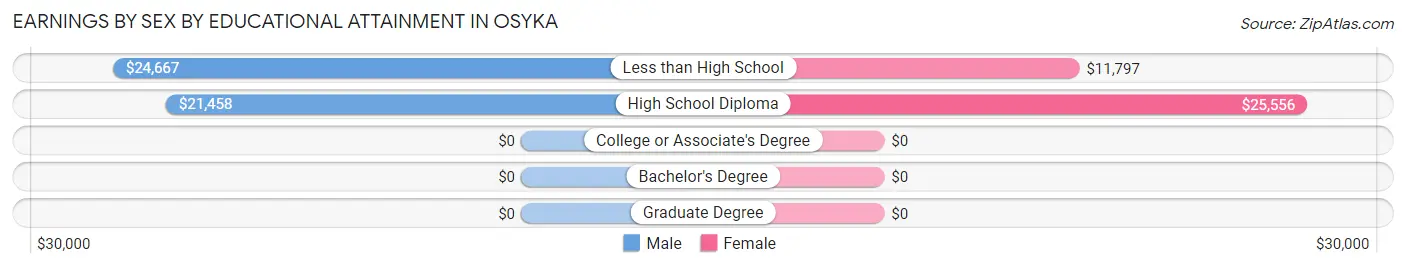
Earnings by Sex by Educational Attainment in Osyka
Average earnings in Osyka are $24,115 for men and $20,625 for women, a difference of 14.5%. Men with an educational attainment of less than high school enjoy the highest average annual earnings of $24,667, while those with high school diploma education earn the least with $21,458. Women with an educational attainment of high school diploma earn the most with the average annual earnings of $25,556, while those with less than high school education have the smallest earnings of $11,797.
| Educational Attainment | Male Income | Female Income |
| Less than High School | $24,667 | $11,797 |
| High School Diploma | $21,458 | $25,556 |
| College or Associate's Degree | - | - |
| Bachelor's Degree | - | - |
| Graduate Degree | - | - |
| Total | $24,115 | $20,625 |
Family Income in Osyka
Family Income Brackets in Osyka
According to the Osyka family income data, there are 33 families falling into the $50,000 to $74,999 income range, which is the most common income bracket and makes up 39.8% of all families.
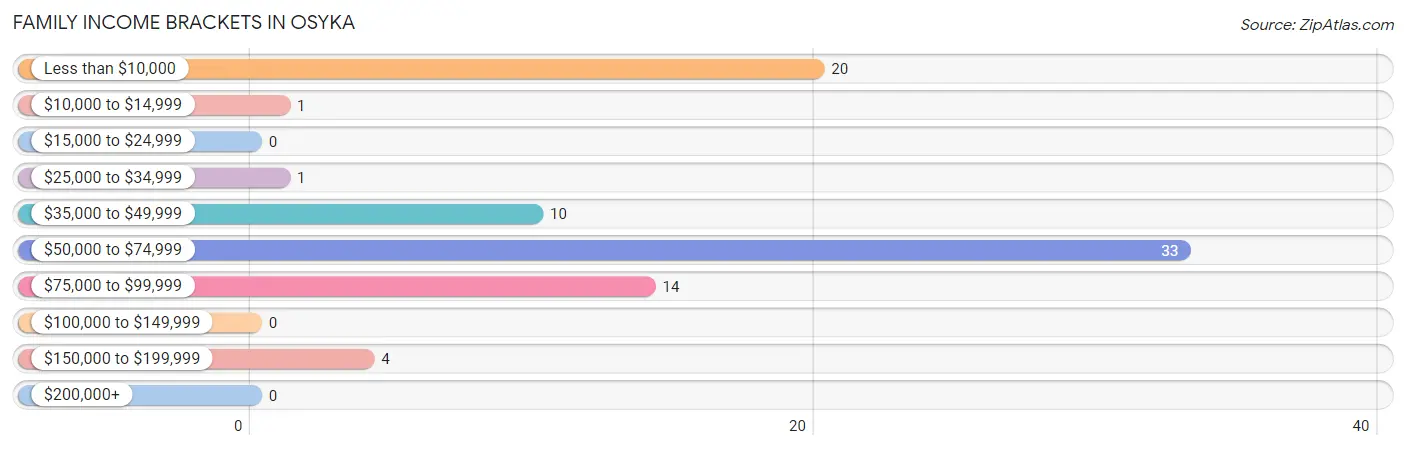
| Income Bracket | # Families | % Families |
| Less than $10,000 | 20 | 24.1% |
| $10,000 to $14,999 | 1 | 1.2% |
| $15,000 to $24,999 | 0 | 0.0% |
| $25,000 to $34,999 | 1 | 1.2% |
| $35,000 to $49,999 | 10 | 12.0% |
| $50,000 to $74,999 | 33 | 39.8% |
| $75,000 to $99,999 | 14 | 16.9% |
| $100,000 to $149,999 | 0 | 0.0% |
| $150,000 to $199,999 | 4 | 4.8% |
| $200,000+ | 0 | 0.0% |
Family Income by Famaliy Size in Osyka
4-person families (30 | 36.1%) account for the highest median family income in Osyka with $61,786 per family, while 2-person families (37 | 44.6%) have the highest median income of $29,532 per family member.
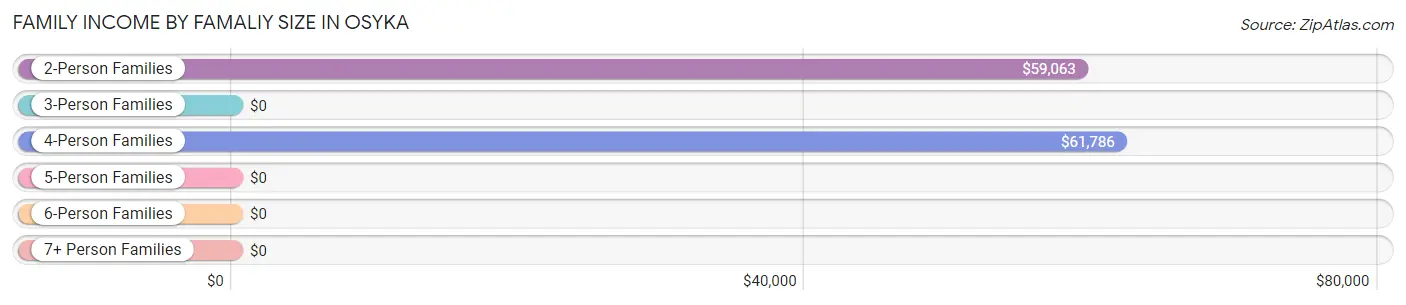
| Income Bracket | # Families | Median Income |
| 2-Person Families | 37 (44.6%) | $59,063 |
| 3-Person Families | 16 (19.3%) | $0 |
| 4-Person Families | 30 (36.1%) | $61,786 |
| 5-Person Families | 0 (0.0%) | $0 |
| 6-Person Families | 0 (0.0%) | $0 |
| 7+ Person Families | 0 (0.0%) | $0 |
| Total | 83 (100.0%) | $58,661 |
Family Income by Number of Earners in Osyka
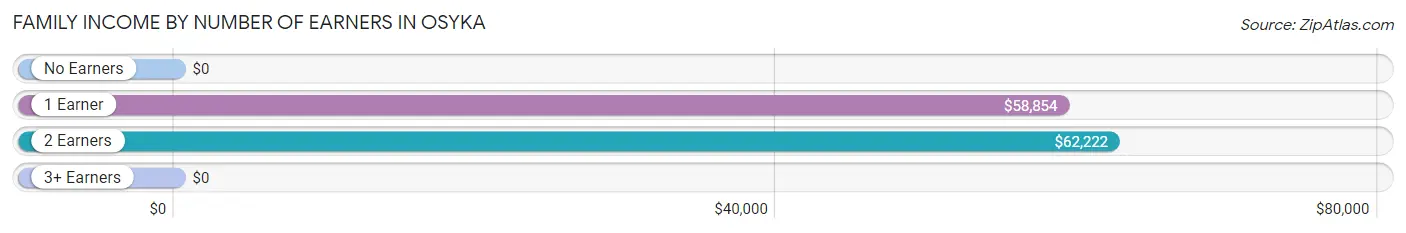
| Number of Earners | # Families | Median Income |
| No Earners | 22 (26.5%) | $0 |
| 1 Earner | 33 (39.8%) | $58,854 |
| 2 Earners | 28 (33.7%) | $62,222 |
| 3+ Earners | 0 (0.0%) | $0 |
| Total | 83 (100.0%) | $58,661 |
Household Income in Osyka
Household Income Brackets in Osyka
With 46 households falling in the category, the $10,000 to $14,999 income range is the most frequent in Osyka, accounting for 30.5% of all households.
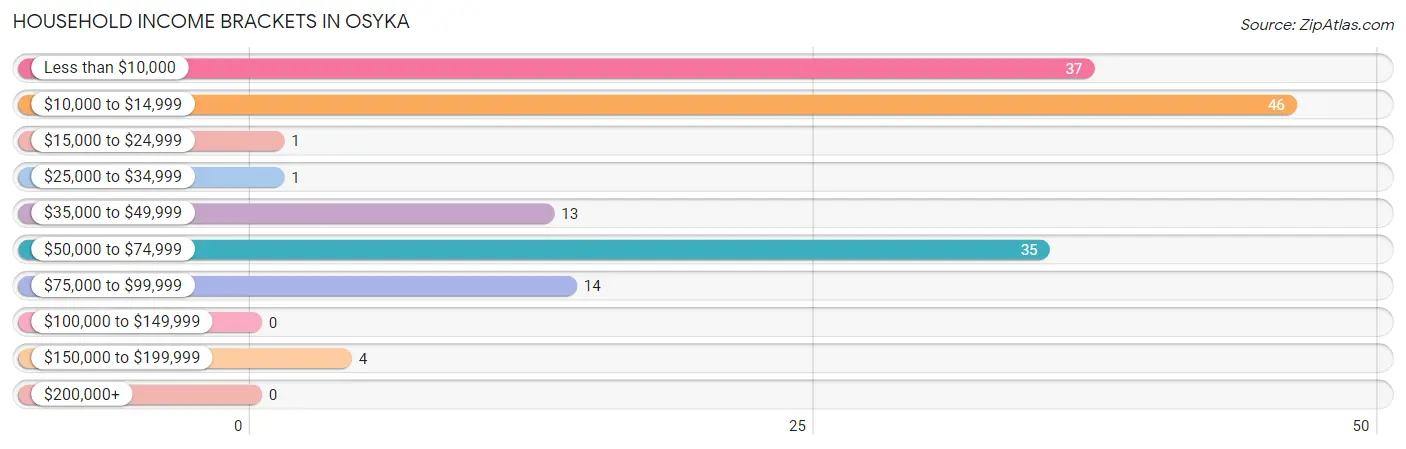
| Income Bracket | # Households | % Households |
| Less than $10,000 | 37 | 24.5% |
| $10,000 to $14,999 | 46 | 30.5% |
| $15,000 to $24,999 | 1 | 0.7% |
| $25,000 to $34,999 | 1 | 0.7% |
| $35,000 to $49,999 | 13 | 8.6% |
| $50,000 to $74,999 | 35 | 23.2% |
| $75,000 to $99,999 | 14 | 9.3% |
| $100,000 to $149,999 | 0 | 0.0% |
| $150,000 to $199,999 | 4 | 2.6% |
| $200,000+ | 0 | 0.0% |
Household Income by Householder Age in Osyka
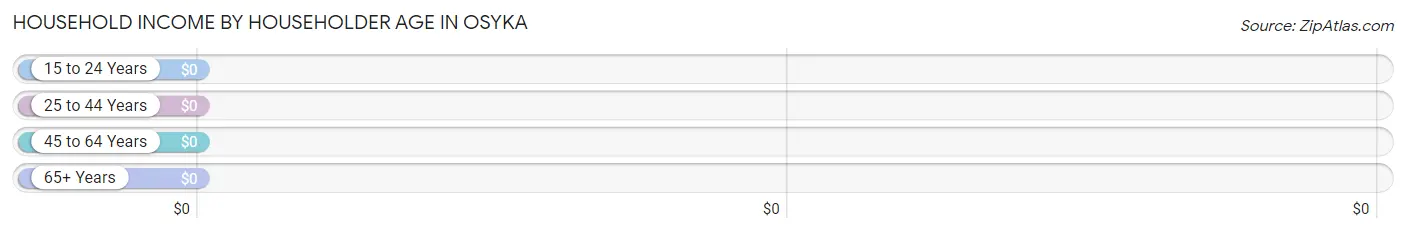
| Income Bracket | # Households | Median Income |
| 15 to 24 Years | 8 (5.3%) | $0 |
| 25 to 44 Years | 22 (14.6%) | $0 |
| 45 to 64 Years | 74 (49.0%) | $0 |
| 65+ Years | 47 (31.1%) | $0 |
| Total | 151 (100.0%) | $0 |
Poverty in Osyka
Income Below Poverty by Sex and Age in Osyka
With 33.0% poverty level for males and 41.0% for females among the residents of Osyka, 18 to 24 year old males and 6 to 11 year old females are the most vulnerable to poverty, with 8 males (100.0%) and 5 females (100.0%) in their respective age groups living below the poverty level.
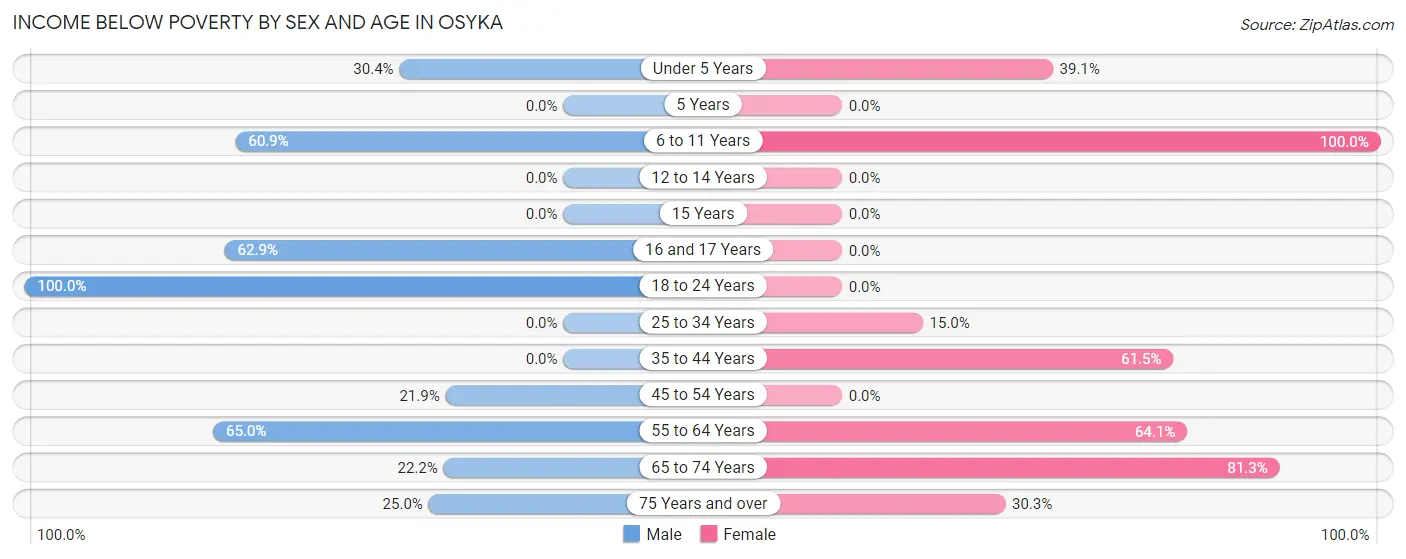
| Age Bracket | Male | Female |
| Under 5 Years | 7 (30.4%) | 9 (39.1%) |
| 5 Years | 0 (0.0%) | 0 (0.0%) |
| 6 to 11 Years | 14 (60.9%) | 5 (100.0%) |
| 12 to 14 Years | 0 (0.0%) | 0 (0.0%) |
| 15 Years | 0 (0.0%) | 0 (0.0%) |
| 16 and 17 Years | 22 (62.9%) | 0 (0.0%) |
| 18 to 24 Years | 8 (100.0%) | 0 (0.0%) |
| 25 to 34 Years | 0 (0.0%) | 3 (15.0%) |
| 35 to 44 Years | 0 (0.0%) | 8 (61.5%) |
| 45 to 54 Years | 7 (21.9%) | 0 (0.0%) |
| 55 to 64 Years | 13 (65.0%) | 25 (64.1%) |
| 65 to 74 Years | 4 (22.2%) | 13 (81.2%) |
| 75 Years and over | 1 (25.0%) | 10 (30.3%) |
| Total | 76 (33.0%) | 73 (41.0%) |
Income Above Poverty by Sex and Age in Osyka
According to the poverty statistics in Osyka, males aged 12 to 14 years and females aged 12 to 14 years are the age groups that are most secure financially, with 100.0% of males and 100.0% of females in these age groups living above the poverty line.
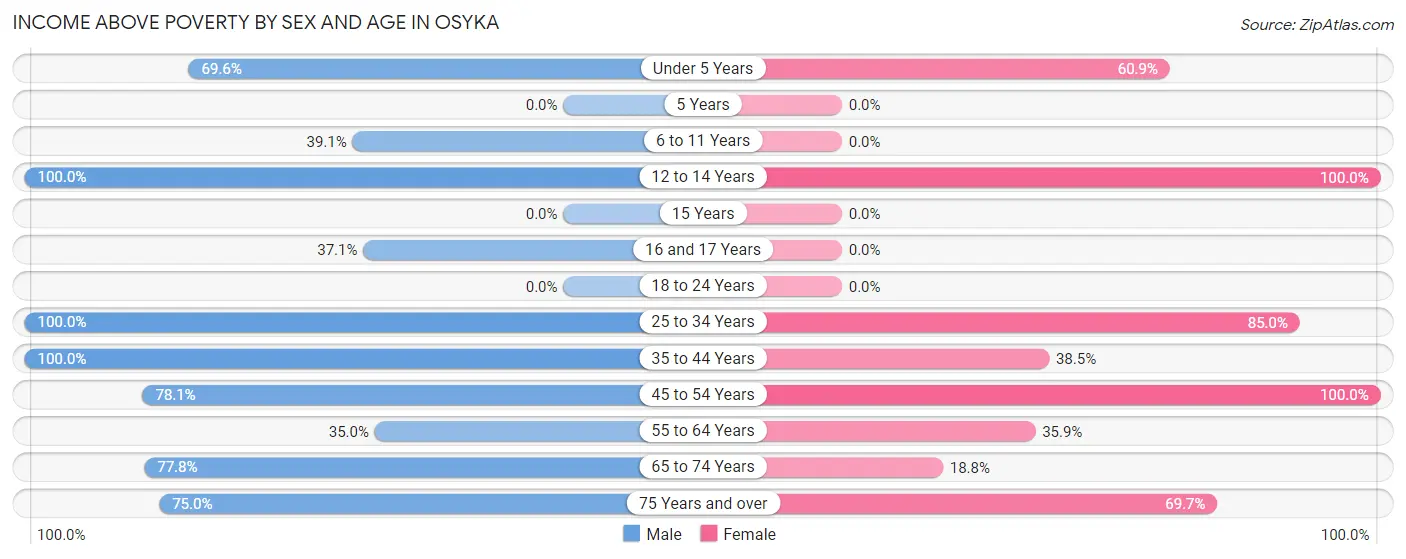
| Age Bracket | Male | Female |
| Under 5 Years | 16 (69.6%) | 14 (60.9%) |
| 5 Years | 0 (0.0%) | 0 (0.0%) |
| 6 to 11 Years | 9 (39.1%) | 0 (0.0%) |
| 12 to 14 Years | 14 (100.0%) | 4 (100.0%) |
| 15 Years | 0 (0.0%) | 0 (0.0%) |
| 16 and 17 Years | 13 (37.1%) | 0 (0.0%) |
| 18 to 24 Years | 0 (0.0%) | 0 (0.0%) |
| 25 to 34 Years | 43 (100.0%) | 17 (85.0%) |
| 35 to 44 Years | 10 (100.0%) | 5 (38.5%) |
| 45 to 54 Years | 25 (78.1%) | 25 (100.0%) |
| 55 to 64 Years | 7 (35.0%) | 14 (35.9%) |
| 65 to 74 Years | 14 (77.8%) | 3 (18.8%) |
| 75 Years and over | 3 (75.0%) | 23 (69.7%) |
| Total | 154 (67.0%) | 105 (59.0%) |
Income Below Poverty Among Married-Couple Families in Osyka
The poverty statistics for married-couple families in Osyka show that 14.5% or 9 of the total 62 families live below the poverty line. Families with 1 or 2 children have the highest poverty rate of 21.6%, comprising of 8 families. On the other hand, families with no children have the lowest poverty rate of 4.0%, which includes 1 families.
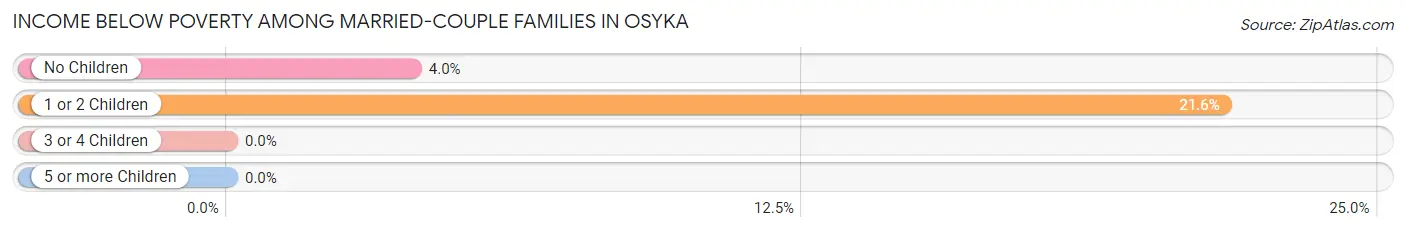
| Children | Above Poverty | Below Poverty |
| No Children | 24 (96.0%) | 1 (4.0%) |
| 1 or 2 Children | 29 (78.4%) | 8 (21.6%) |
| 3 or 4 Children | 0 (0.0%) | 0 (0.0%) |
| 5 or more Children | 0 (0.0%) | 0 (0.0%) |
| Total | 53 (85.5%) | 9 (14.5%) |
Income Below Poverty Among Single-Parent Households in Osyka
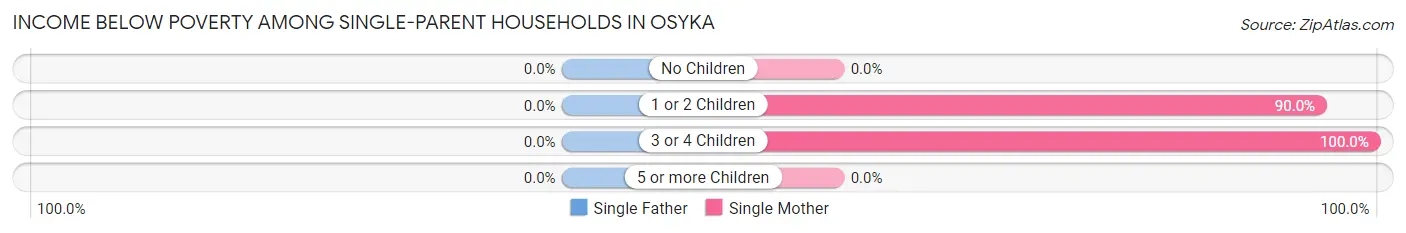
| Children | Single Father | Single Mother |
| No Children | 0 (0.0%) | 0 (0.0%) |
| 1 or 2 Children | 0 (0.0%) | 9 (90.0%) |
| 3 or 4 Children | 0 (0.0%) | 3 (100.0%) |
| 5 or more Children | 0 (0.0%) | 0 (0.0%) |
| Total | 0 (0.0%) | 12 (57.1%) |
Income Below Poverty Among Married-Couple vs Single-Parent Households in Osyka
The poverty data for Osyka shows that 9 of the married-couple family households (14.5%) and 12 of the single-parent households (57.1%) are living below the poverty level. Within the married-couple family households, those with 1 or 2 children have the highest poverty rate, with 8 households (21.6%) falling below the poverty line. Among the single-parent households, those with 3 or 4 children have the highest poverty rate, with 3 household (100.0%) living below poverty.
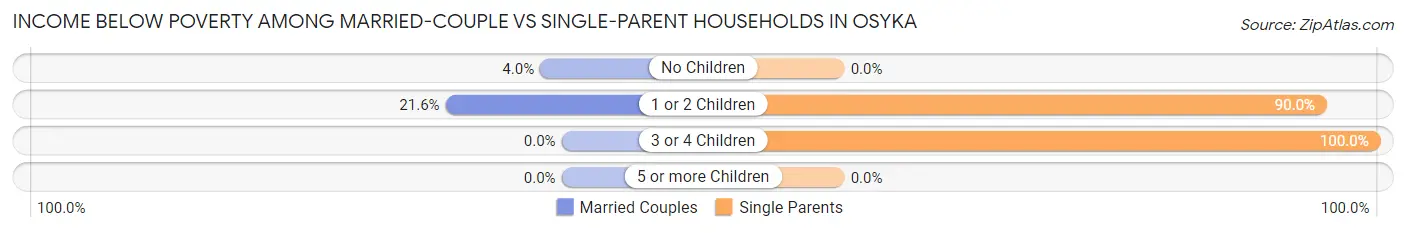
| Children | Married-Couple Families | Single-Parent Households |
| No Children | 1 (4.0%) | 0 (0.0%) |
| 1 or 2 Children | 8 (21.6%) | 9 (90.0%) |
| 3 or 4 Children | 0 (0.0%) | 3 (100.0%) |
| 5 or more Children | 0 (0.0%) | 0 (0.0%) |
| Total | 9 (14.5%) | 12 (57.1%) |
Race in Osyka
The most populous races in Osyka are Black / African American (239 | 58.6%), White / Caucasian (145 | 35.5%), and Two or more Races (12 | 2.9%).
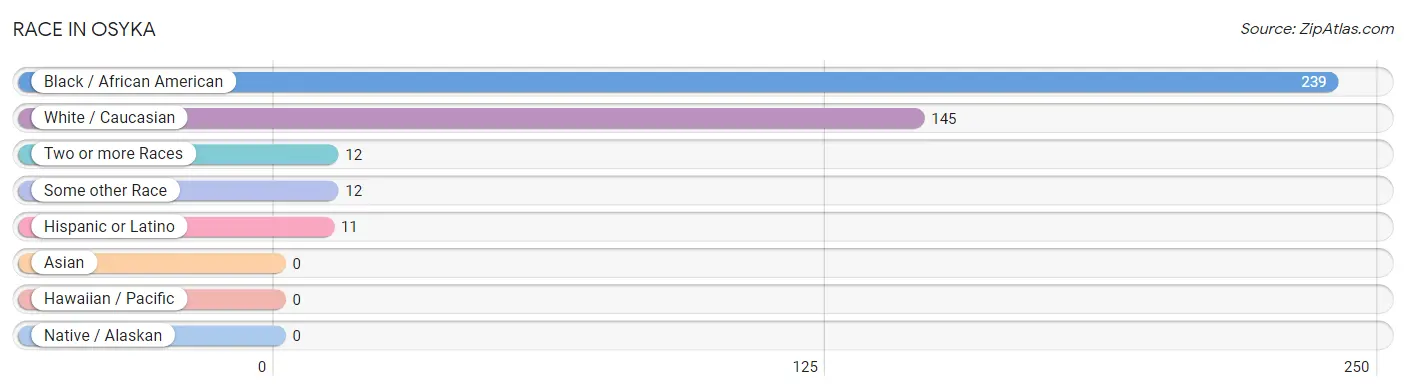
| Race | # Population | % Population |
| Asian | 0 | 0.0% |
| Black / African American | 239 | 58.6% |
| Hawaiian / Pacific | 0 | 0.0% |
| Hispanic or Latino | 11 | 2.7% |
| Native / Alaskan | 0 | 0.0% |
| White / Caucasian | 145 | 35.5% |
| Two or more Races | 12 | 2.9% |
| Some other Race | 12 | 2.9% |
| Total | 408 | 100.0% |
Ancestry in Osyka
The most populous ancestries reported in Osyka are English (30 | 7.3%), German (14 | 3.4%), Irish (14 | 3.4%), European (13 | 3.2%), and Mexican (11 | 2.7%), together accounting for 20.1% of all Osyka residents.
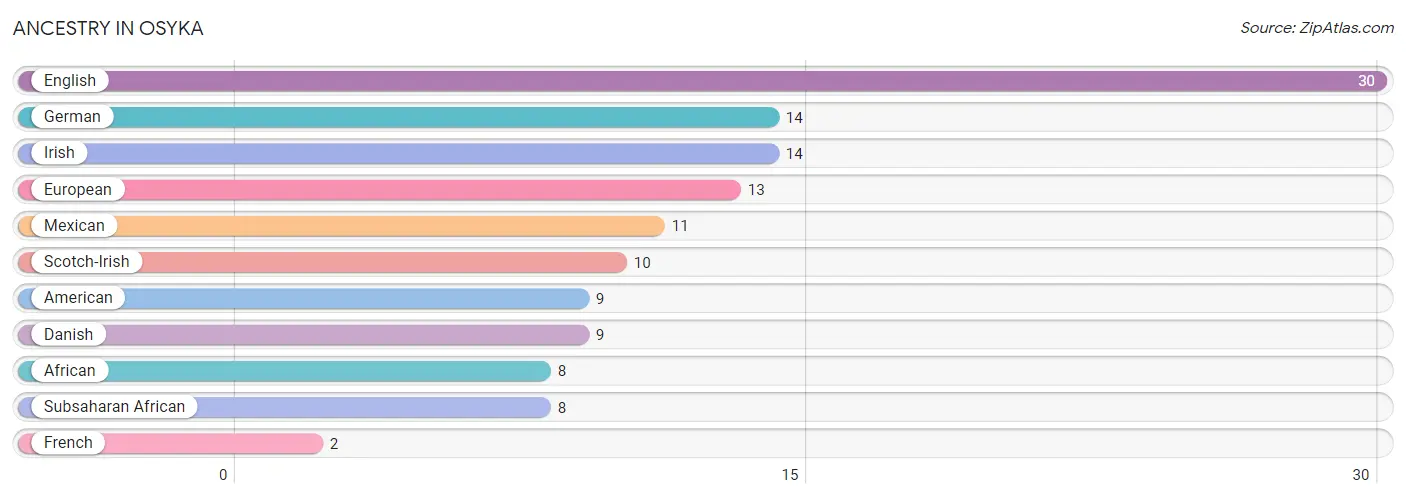
| Ancestry | # Population | % Population |
| African | 8 | 2.0% |
| American | 9 | 2.2% |
| Danish | 9 | 2.2% |
| English | 30 | 7.3% |
| European | 13 | 3.2% |
| French | 2 | 0.5% |
| German | 14 | 3.4% |
| Irish | 14 | 3.4% |
| Mexican | 11 | 2.7% |
| Scotch-Irish | 10 | 2.5% |
| Subsaharan African | 8 | 2.0% | View All 11 Rows |
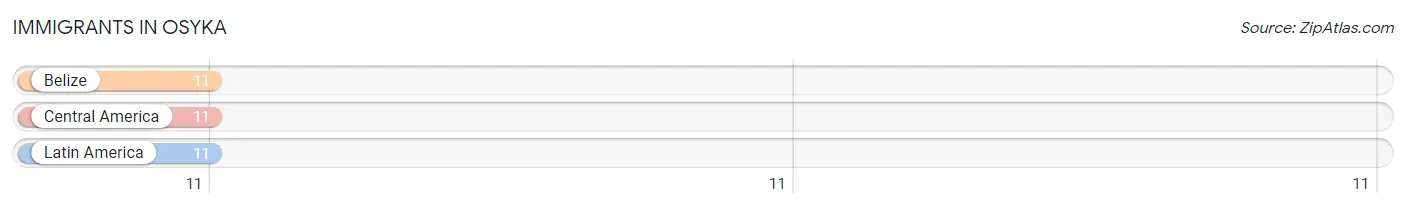
Immigrants in Osyka
The most numerous immigrant groups reported in Osyka came from Belize (11 | 2.7%), Central America (11 | 2.7%), and Latin America (11 | 2.7%), together accounting for 8.1% of all Osyka residents.
| Immigration Origin | # Population | % Population |
| Belize | 11 | 2.7% |
| Central America | 11 | 2.7% |
| Latin America | 11 | 2.7% | View All 3 Rows |
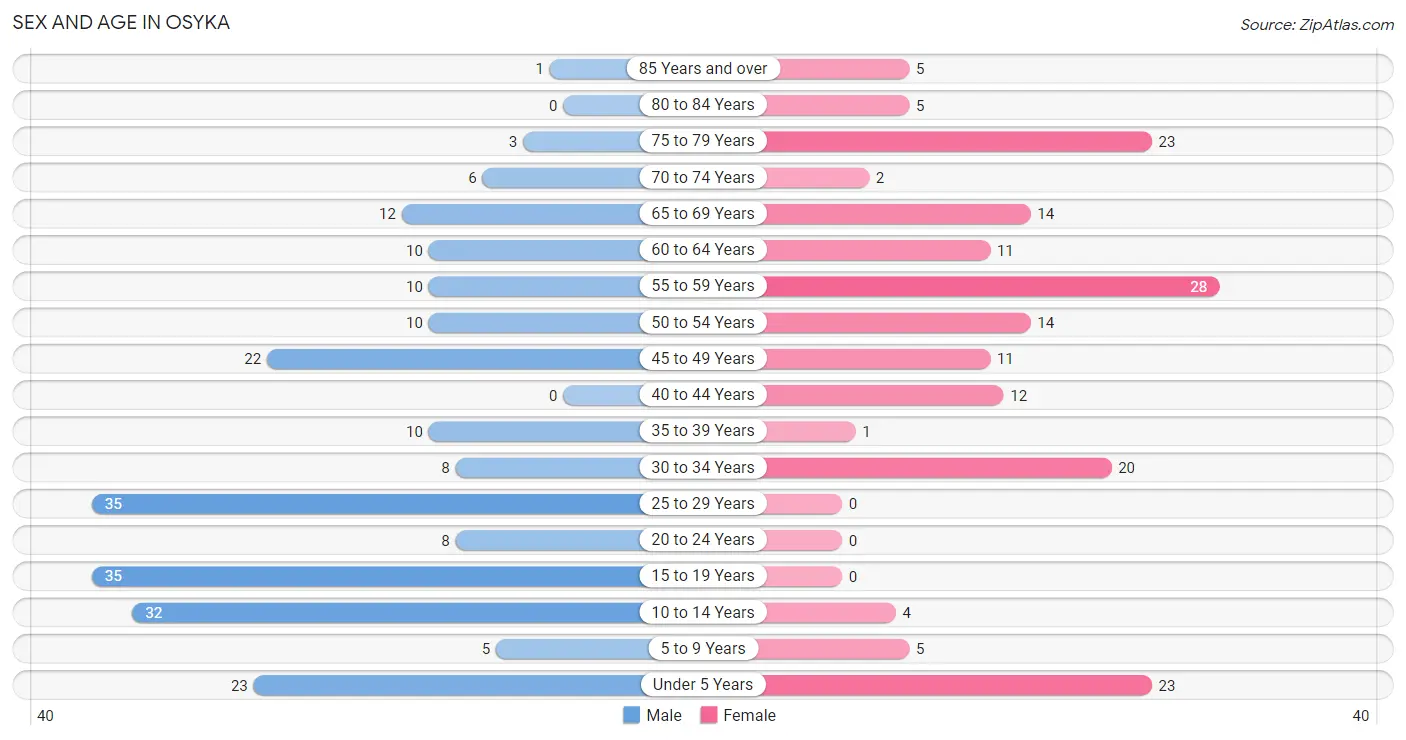
Sex and Age in Osyka
Sex and Age in Osyka
The most populous age groups in Osyka are 15 to 19 Years (35 | 15.2%) for men and 55 to 59 Years (28 | 15.7%) for women.
| Age Bracket | Male | Female |
| Under 5 Years | 23 (10.0%) | 23 (12.9%) |
| 5 to 9 Years | 5 (2.2%) | 5 (2.8%) |
| 10 to 14 Years | 32 (13.9%) | 4 (2.2%) |
| 15 to 19 Years | 35 (15.2%) | 0 (0.0%) |
| 20 to 24 Years | 8 (3.5%) | 0 (0.0%) |
| 25 to 29 Years | 35 (15.2%) | 0 (0.0%) |
| 30 to 34 Years | 8 (3.5%) | 20 (11.2%) |
| 35 to 39 Years | 10 (4.3%) | 1 (0.6%) |
| 40 to 44 Years | 0 (0.0%) | 12 (6.7%) |
| 45 to 49 Years | 22 (9.6%) | 11 (6.2%) |
| 50 to 54 Years | 10 (4.3%) | 14 (7.9%) |
| 55 to 59 Years | 10 (4.3%) | 28 (15.7%) |
| 60 to 64 Years | 10 (4.3%) | 11 (6.2%) |
| 65 to 69 Years | 12 (5.2%) | 14 (7.9%) |
| 70 to 74 Years | 6 (2.6%) | 2 (1.1%) |
| 75 to 79 Years | 3 (1.3%) | 23 (12.9%) |
| 80 to 84 Years | 0 (0.0%) | 5 (2.8%) |
| 85 Years and over | 1 (0.4%) | 5 (2.8%) |
| Total | 230 (100.0%) | 178 (100.0%) |
Families and Households in Osyka
Median Family Size in Osyka
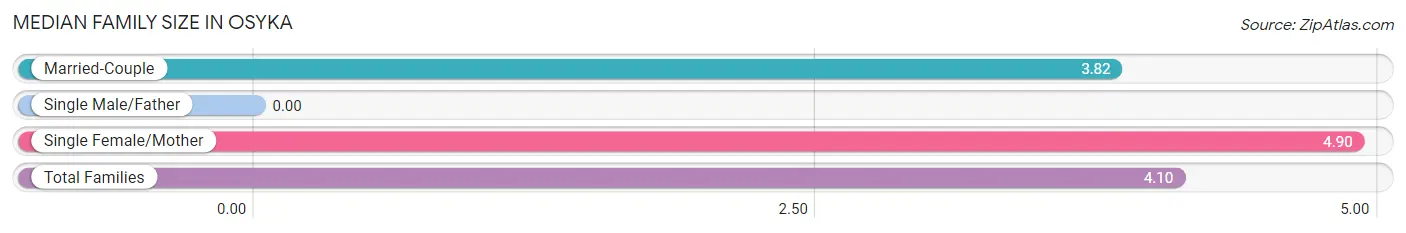
| Family Type | # Families | Family Size |
| Married-Couple | 62 (74.7%) | 3.82 |
| Single Male/Father | 0 (0.0%) | - |
| Single Female/Mother | 21 (25.3%) | 4.90 |
| Total Families | 83 (100.0%) | 4.10 |
Median Household Size in Osyka
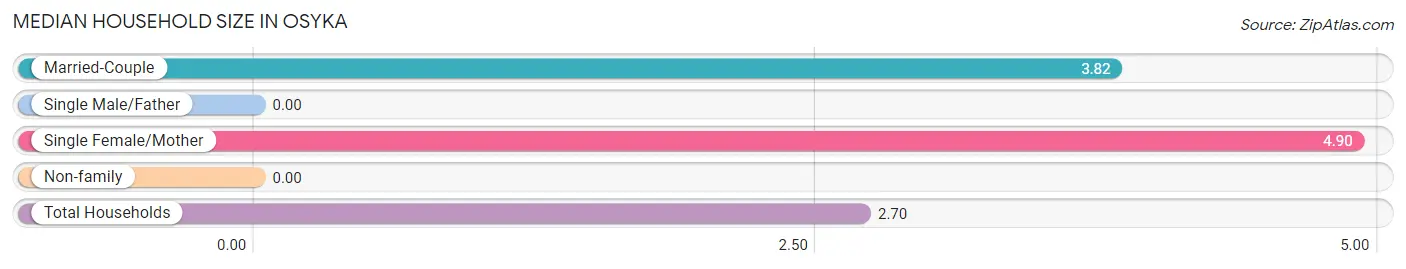
| Household Type | # Households | Household Size |
| Married-Couple | 62 (41.1%) | 3.82 |
| Single Male/Father | 0 (0.0%) | - |
| Single Female/Mother | 21 (13.9%) | 4.90 |
| Non-family | 68 (45.0%) | - |
| Total Households | 151 (100.0%) | 2.70 |
Household Size by Marriage Status in Osyka
Out of a total of 151 households in Osyka, 83 (55.0%) are family households, while 68 (45.0%) are nonfamily households. The most numerous type of family households are 2-person households, comprising 37, and the most common type of nonfamily households are 1-person households, comprising 68.
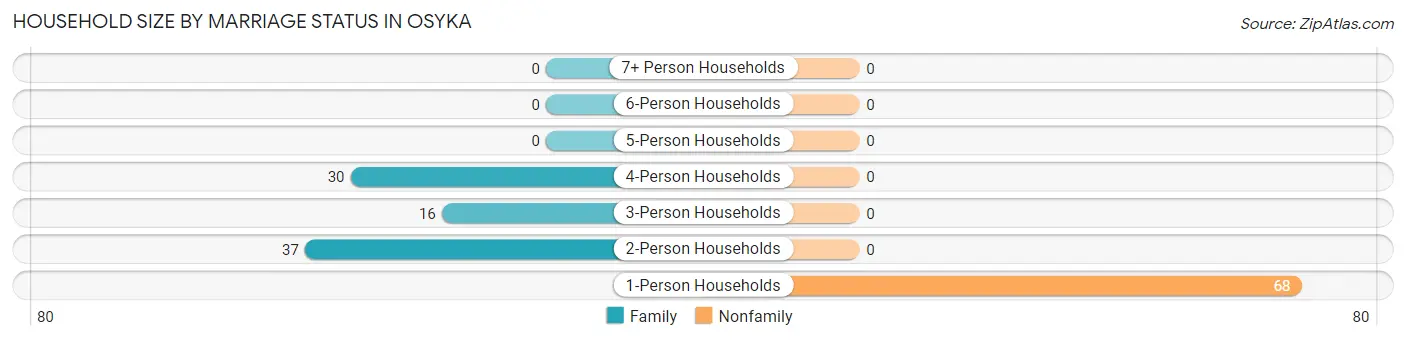
| Household Size | Family Households | Nonfamily Households |
| 1-Person Households | - | 68 (45.0%) |
| 2-Person Households | 37 (24.5%) | 0 (0.0%) |
| 3-Person Households | 16 (10.6%) | 0 (0.0%) |
| 4-Person Households | 30 (19.9%) | 0 (0.0%) |
| 5-Person Households | 0 (0.0%) | 0 (0.0%) |
| 6-Person Households | 0 (0.0%) | 0 (0.0%) |
| 7+ Person Households | 0 (0.0%) | 0 (0.0%) |
| Total | 83 (55.0%) | 68 (45.0%) |
Female Fertility in Osyka
Fertility by Age in Osyka
Average fertility rate in Osyka is 245.0 births per 1,000 women. Women in the age bracket of 20 to 34 years have the highest fertility rate with 650.0 births per 1,000 women. Women in the age bracket of 20 to 34 years acount for 100.0% of all women with births.
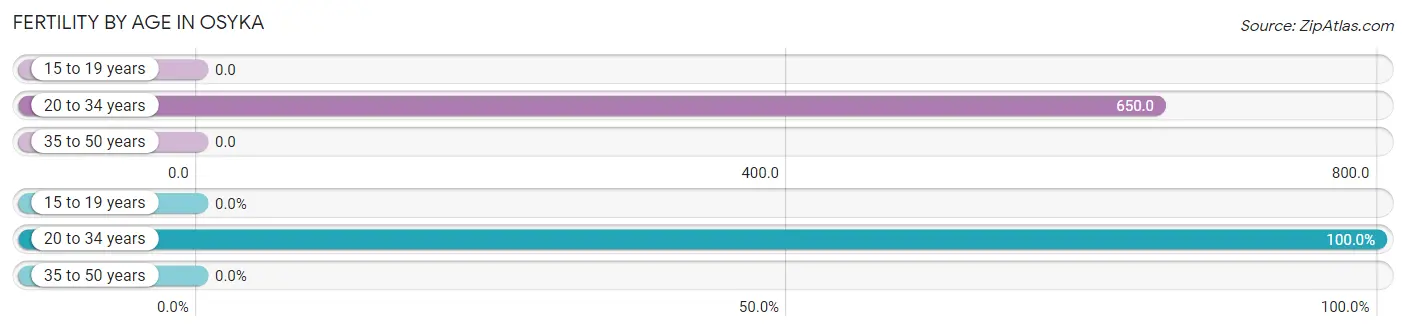
| Age Bracket | Women with Births | Births / 1,000 Women |
| 15 to 19 years | 0 (0.0%) | 0.0 |
| 20 to 34 years | 13 (100.0%) | 650.0 |
| 35 to 50 years | 0 (0.0%) | 0.0 |
| Total | 13 (100.0%) | 245.0 |
Fertility by Age by Marriage Status in Osyka
76.9% of women with births (13) in Osyka are married. The highest percentage of unmarried women with births falls into 20 to 34 years age bracket with 23.1% of them unmarried at the time of birth, while the lowest percentage of unmarried women with births belong to 20 to 34 years age bracket with 23.1% of them unmarried.
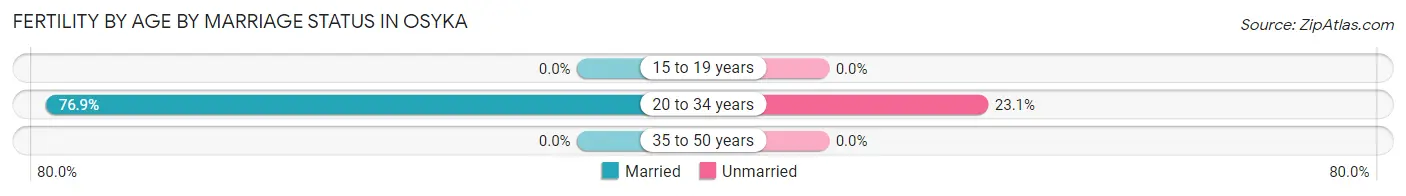
| Age Bracket | Married | Unmarried |
| 15 to 19 years | 0 (0.0%) | 0 (0.0%) |
| 20 to 34 years | 10 (76.9%) | 3 (23.1%) |
| 35 to 50 years | 0 (0.0%) | 0 (0.0%) |
| Total | 10 (76.9%) | 3 (23.1%) |
Fertility by Education in Osyka
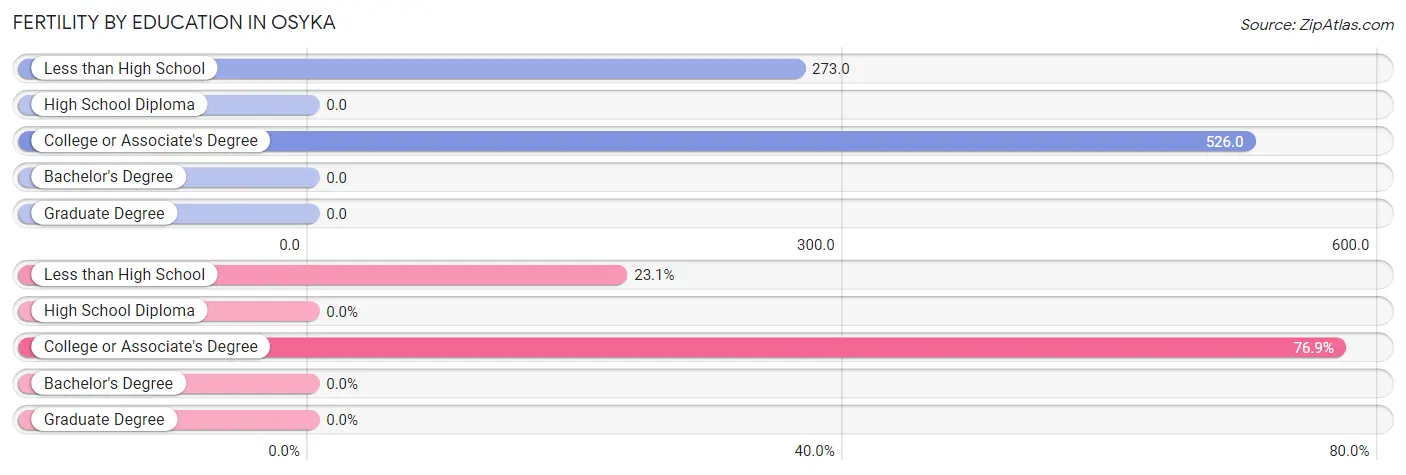
| Educational Attainment | Women with Births | Births / 1,000 Women |
| Less than High School | 3 (23.1%) | 273.0 |
| High School Diploma | 0 (0.0%) | 0.0 |
| College or Associate's Degree | 10 (76.9%) | 526.0 |
| Bachelor's Degree | 0 (0.0%) | 0.0 |
| Graduate Degree | 0 (0.0%) | 0.0 |
| Total | 13 (100.0%) | 245.0 |
Fertility by Education by Marriage Status in Osyka
23.1% of women with births in Osyka are unmarried. Women with the educational attainment of college or associate's degree are most likely to be married with 100.0% of them married at childbirth, while women with the educational attainment of less than high school are least likely to be married with 100.0% of them unmarried at childbirth.
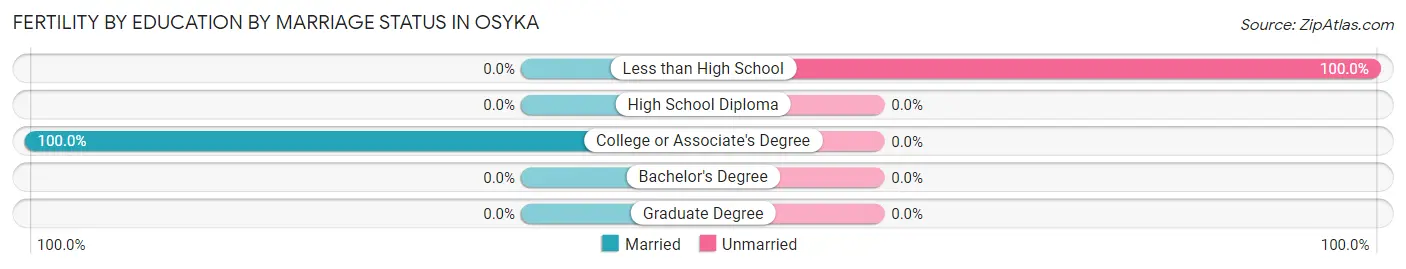
| Educational Attainment | Married | Unmarried |
| Less than High School | 0 (0.0%) | 3 (100.0%) |
| High School Diploma | 0 (0.0%) | 0 (0.0%) |
| College or Associate's Degree | 10 (100.0%) | 0 (0.0%) |
| Bachelor's Degree | 0 (0.0%) | 0 (0.0%) |
| Graduate Degree | 0 (0.0%) | 0 (0.0%) |
| Total | 10 (76.9%) | 3 (23.1%) |
Employment Characteristics in Osyka
Employment by Class of Employer in Osyka
Among the 122 employed individuals in Osyka, private company employees (82 | 67.2%), self-employed (not incorporated) (23 | 18.9%), and local government employees (17 | 13.9%) make up the most common classes of employment.
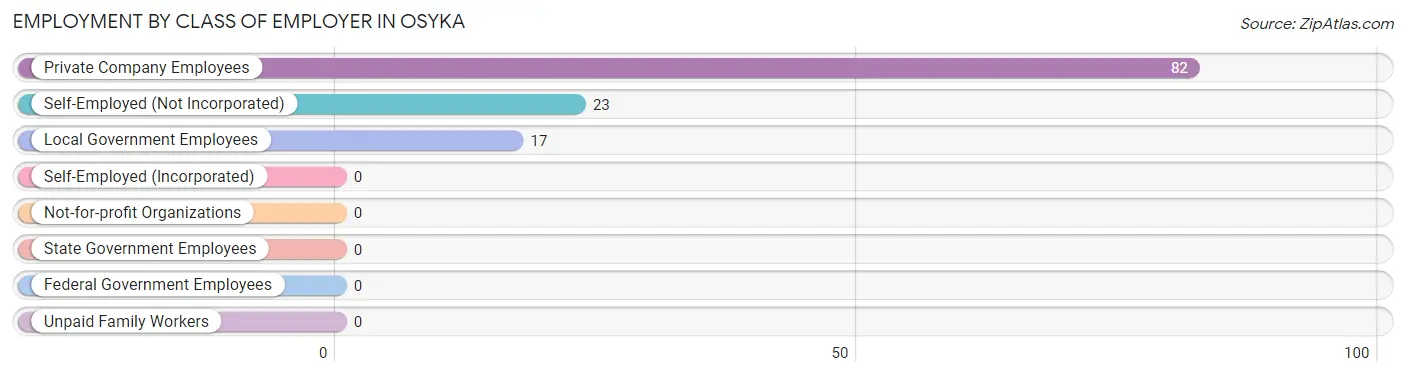
| Employer Class | # Employees | % Employees |
| Private Company Employees | 82 | 67.2% |
| Self-Employed (Incorporated) | 0 | 0.0% |
| Self-Employed (Not Incorporated) | 23 | 18.9% |
| Not-for-profit Organizations | 0 | 0.0% |
| Local Government Employees | 17 | 13.9% |
| State Government Employees | 0 | 0.0% |
| Federal Government Employees | 0 | 0.0% |
| Unpaid Family Workers | 0 | 0.0% |
| Total | 122 | 100.0% |
Employment Status by Age in Osyka
According to the labor force statistics for Osyka, out of the total population over 16 years of age (316), 42.1% or 133 individuals are in the labor force, with 6.0% or 8 of them unemployed. The age group with the highest labor force participation rate is 20 to 24 years, with 100.0% or 8 individuals in the labor force. Within the labor force, the 20 to 24 years age range has the highest percentage of unemployed individuals, with 100.0% or 8 of them being unemployed.
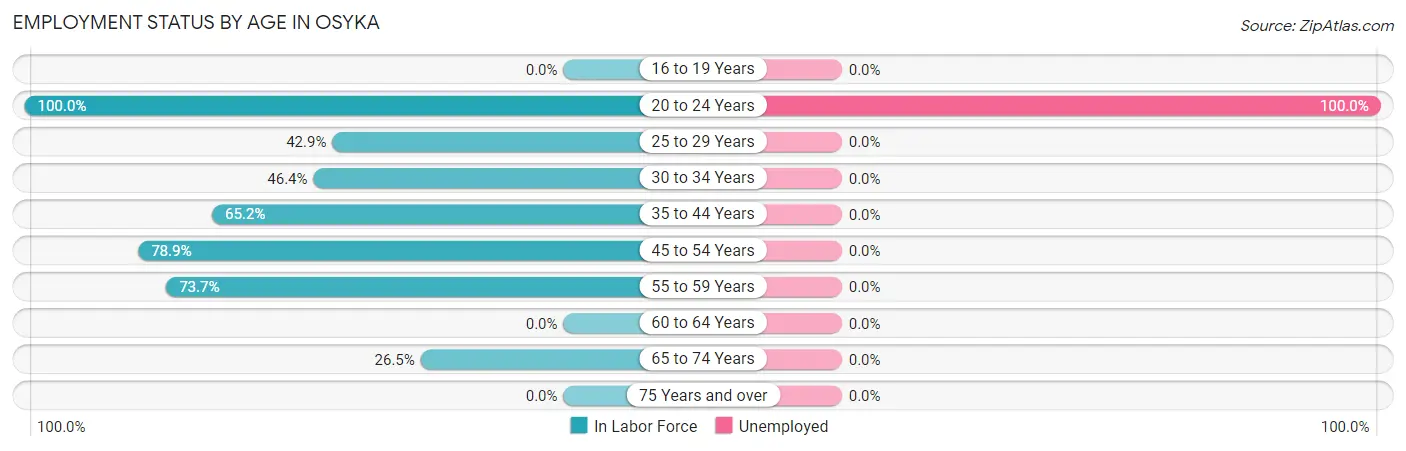
| Age Bracket | In Labor Force | Unemployed |
| 16 to 19 Years | 0 (0.0%) | 0 (0.0%) |
| 20 to 24 Years | 8 (100.0%) | 8 (100.0%) |
| 25 to 29 Years | 15 (42.9%) | 0 (0.0%) |
| 30 to 34 Years | 13 (46.4%) | 0 (0.0%) |
| 35 to 44 Years | 15 (65.2%) | 0 (0.0%) |
| 45 to 54 Years | 45 (78.9%) | 0 (0.0%) |
| 55 to 59 Years | 28 (73.7%) | 0 (0.0%) |
| 60 to 64 Years | 0 (0.0%) | 0 (0.0%) |
| 65 to 74 Years | 9 (26.5%) | 0 (0.0%) |
| 75 Years and over | 0 (0.0%) | 0 (0.0%) |
| Total | 133 (42.1%) | 8 (6.0%) |
Employment Status by Educational Attainment in Osyka
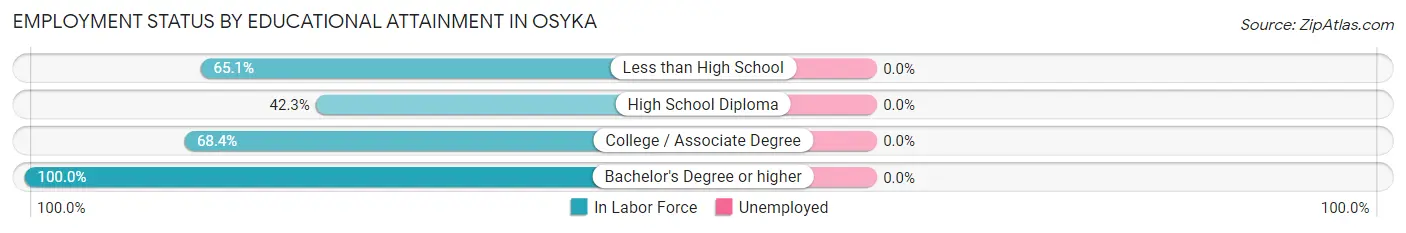
| Educational Attainment | In Labor Force | Unemployed |
| Less than High School | 54 (65.1%) | 0 (0.0%) |
| High School Diploma | 33 (42.3%) | 0 (0.0%) |
| College / Associate Degree | 26 (68.4%) | 0 (0.0%) |
| Bachelor's Degree or higher | 3 (100.0%) | 0 (0.0%) |
| Total | 116 (57.4%) | 0 (0.0%) |
Employment Occupations by Sex in Osyka
Management, Business, Science and Arts Occupations
The most common Management, Business, Science and Arts occupations in Osyka are Management (18 | 14.4%), Health Diagnosing & Treating (10 | 8.0%), and Health Technologists (10 | 8.0%).
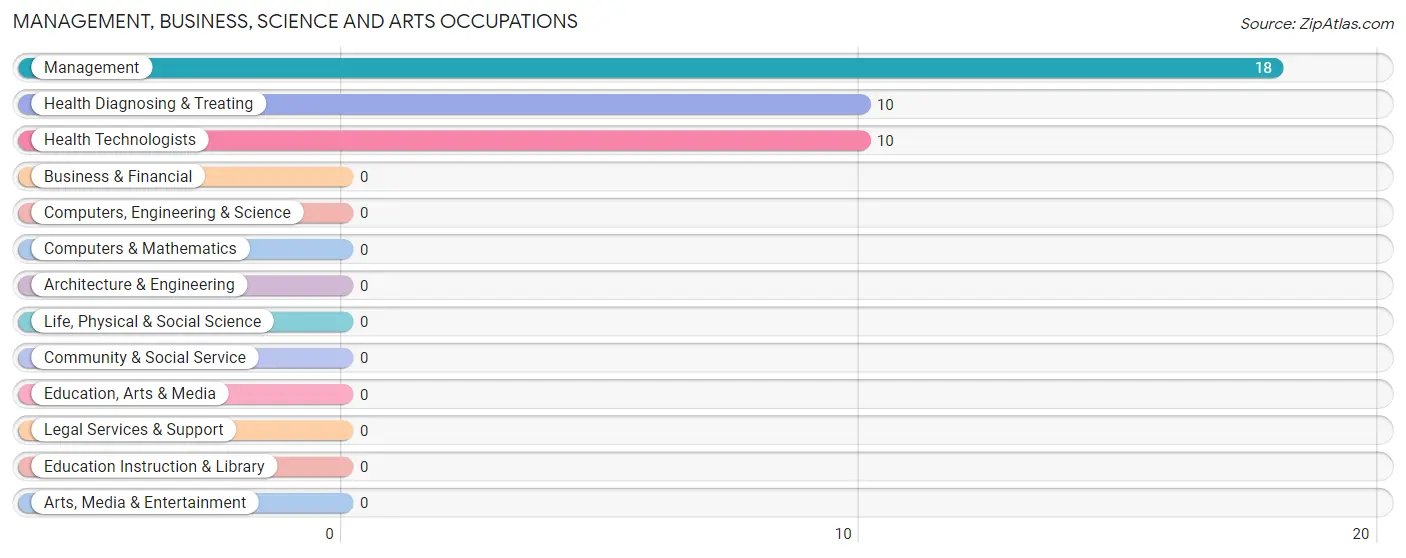
Management, Business, Science and Arts Occupations by Sex

| Occupation | Male | Female |
| Management | 7 (38.9%) | 11 (61.1%) |
| Business & Financial | 0 (0.0%) | 0 (0.0%) |
| Computers, Engineering & Science | 0 (0.0%) | 0 (0.0%) |
| Computers & Mathematics | 0 (0.0%) | 0 (0.0%) |
| Architecture & Engineering | 0 (0.0%) | 0 (0.0%) |
| Life, Physical & Social Science | 0 (0.0%) | 0 (0.0%) |
| Community & Social Service | 0 (0.0%) | 0 (0.0%) |
| Education, Arts & Media | 0 (0.0%) | 0 (0.0%) |
| Legal Services & Support | 0 (0.0%) | 0 (0.0%) |
| Education Instruction & Library | 0 (0.0%) | 0 (0.0%) |
| Arts, Media & Entertainment | 0 (0.0%) | 0 (0.0%) |
| Health Diagnosing & Treating | 0 (0.0%) | 10 (100.0%) |
| Health Technologists | 0 (0.0%) | 10 (100.0%) |
| Total (Category) | 7 (25.0%) | 21 (75.0%) |
| Total (Overall) | 59 (47.2%) | 66 (52.8%) |
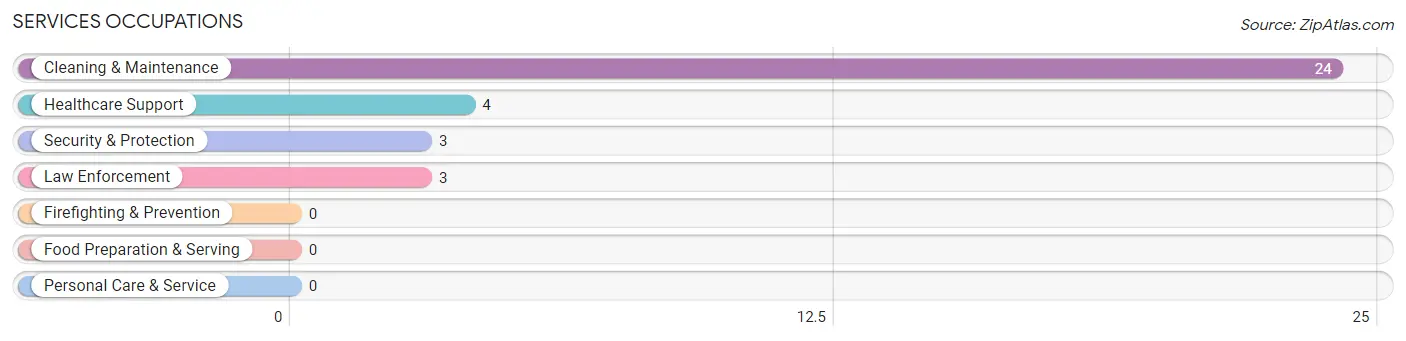
Services Occupations
The most common Services occupations in Osyka are Cleaning & Maintenance (24 | 19.2%), Healthcare Support (4 | 3.2%), Security & Protection (3 | 2.4%), and Law Enforcement (3 | 2.4%).
Services Occupations by Sex
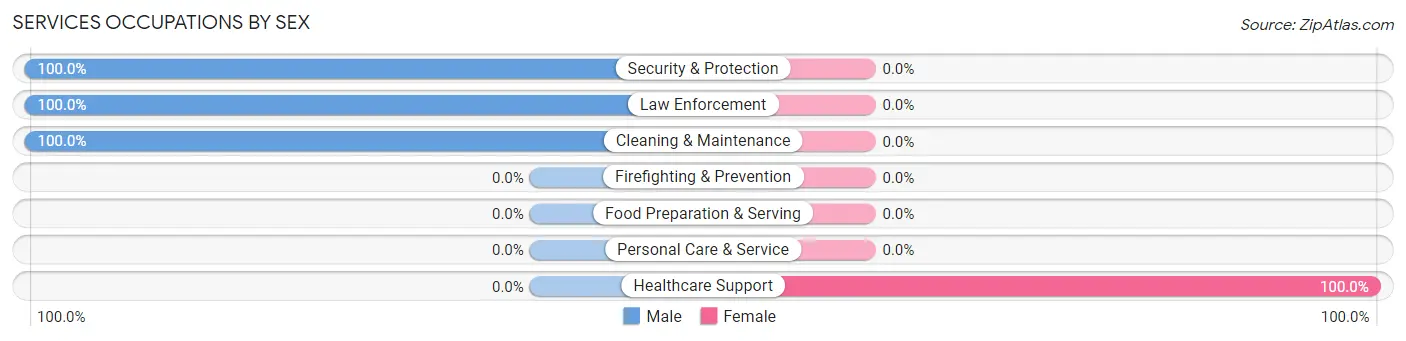
| Occupation | Male | Female |
| Healthcare Support | 0 (0.0%) | 4 (100.0%) |
| Security & Protection | 3 (100.0%) | 0 (0.0%) |
| Firefighting & Prevention | 0 (0.0%) | 0 (0.0%) |
| Law Enforcement | 3 (100.0%) | 0 (0.0%) |
| Food Preparation & Serving | 0 (0.0%) | 0 (0.0%) |
| Cleaning & Maintenance | 24 (100.0%) | 0 (0.0%) |
| Personal Care & Service | 0 (0.0%) | 0 (0.0%) |
| Total (Category) | 27 (87.1%) | 4 (12.9%) |
| Total (Overall) | 59 (47.2%) | 66 (52.8%) |
Sales and Office Occupations
The most common Sales and Office occupations in Osyka are , and Sales & Related (39 | 31.2%).

Sales and Office Occupations by Sex

| Occupation | Male | Female |
| Sales & Related | 0 (0.0%) | 39 (100.0%) |
| Office & Administration | 0 (0.0%) | 0 (0.0%) |
| Total (Category) | 0 (0.0%) | 39 (100.0%) |
| Total (Overall) | 59 (47.2%) | 66 (52.8%) |
Natural Resources, Construction and Maintenance Occupations
The most common Natural Resources, Construction and Maintenance occupations in Osyka are Construction & Extraction (4 | 3.2%), and Installation, Maintenance & Repair (3 | 2.4%).

Natural Resources, Construction and Maintenance Occupations by Sex

| Occupation | Male | Female |
| Farming, Fishing & Forestry | 0 (0.0%) | 0 (0.0%) |
| Construction & Extraction | 4 (100.0%) | 0 (0.0%) |
| Installation, Maintenance & Repair | 3 (100.0%) | 0 (0.0%) |
| Total (Category) | 7 (100.0%) | 0 (0.0%) |
| Total (Overall) | 59 (47.2%) | 66 (52.8%) |
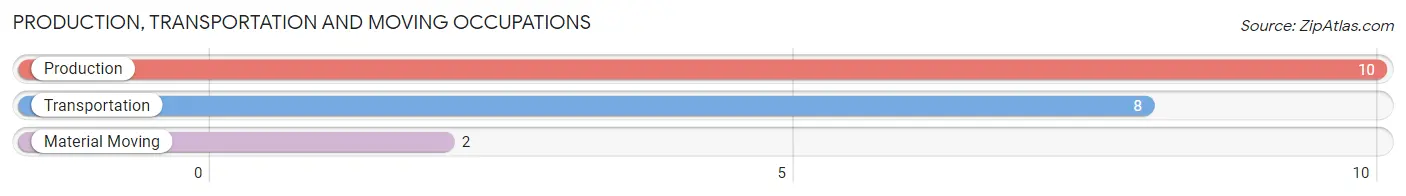
Production, Transportation and Moving Occupations
The most common Production, Transportation and Moving occupations in Osyka are Production (10 | 8.0%), Transportation (8 | 6.4%), and Material Moving (2 | 1.6%).
Production, Transportation and Moving Occupations by Sex
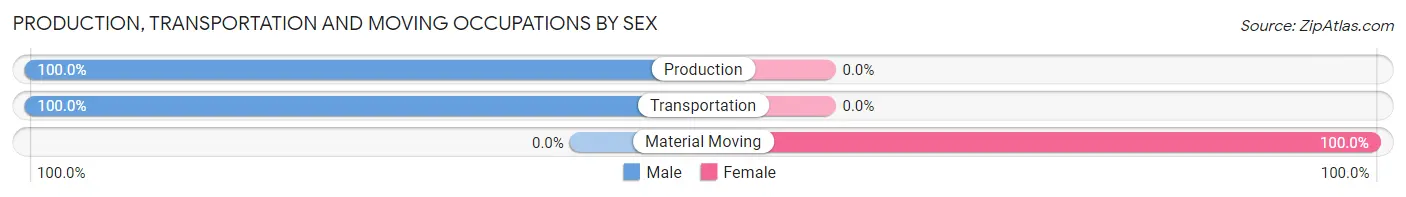
| Occupation | Male | Female |
| Production | 10 (100.0%) | 0 (0.0%) |
| Transportation | 8 (100.0%) | 0 (0.0%) |
| Material Moving | 0 (0.0%) | 2 (100.0%) |
| Total (Category) | 18 (90.0%) | 2 (10.0%) |
| Total (Overall) | 59 (47.2%) | 66 (52.8%) |
Employment Industries by Sex in Osyka
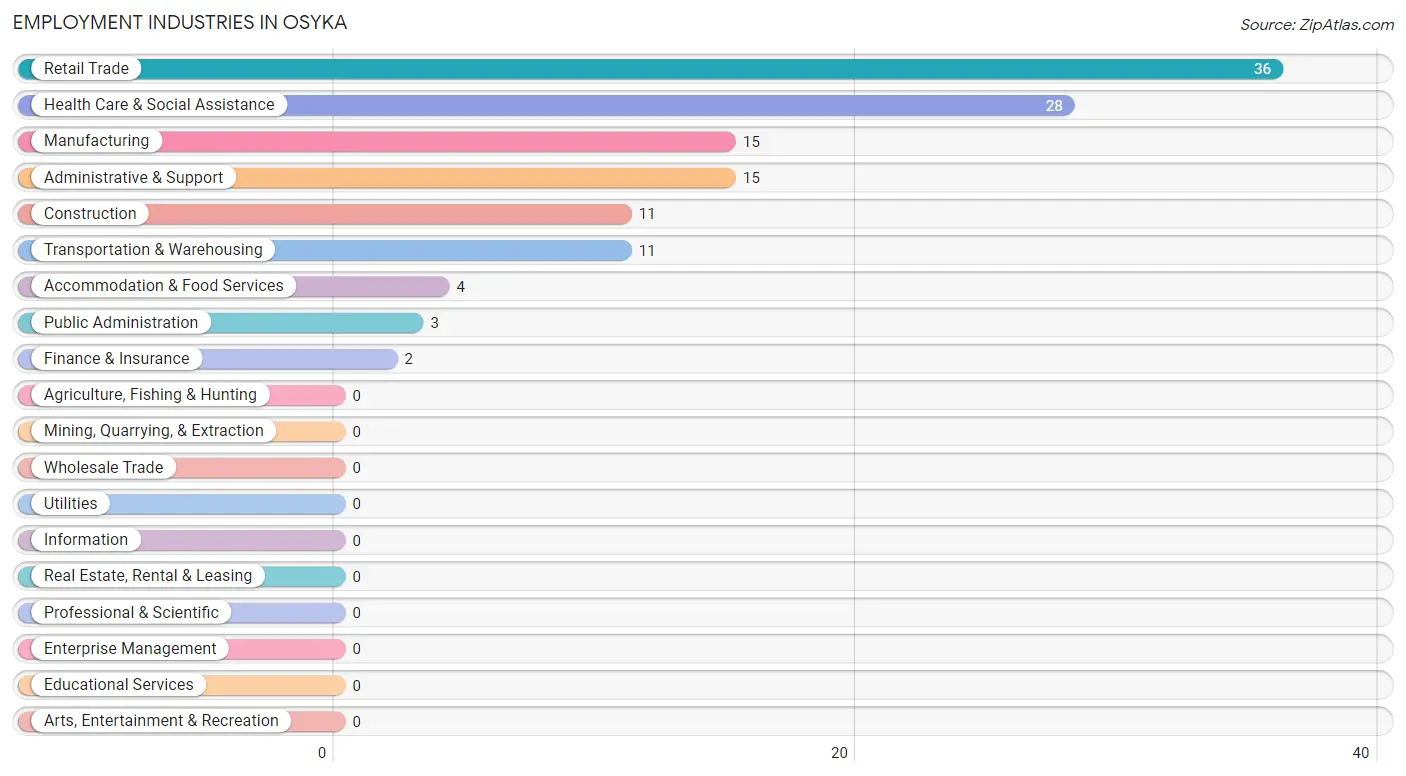
Employment Industries in Osyka
The major employment industries in Osyka include Retail Trade (36 | 28.8%), Health Care & Social Assistance (28 | 22.4%), Manufacturing (15 | 12.0%), Administrative & Support (15 | 12.0%), and Construction (11 | 8.8%).
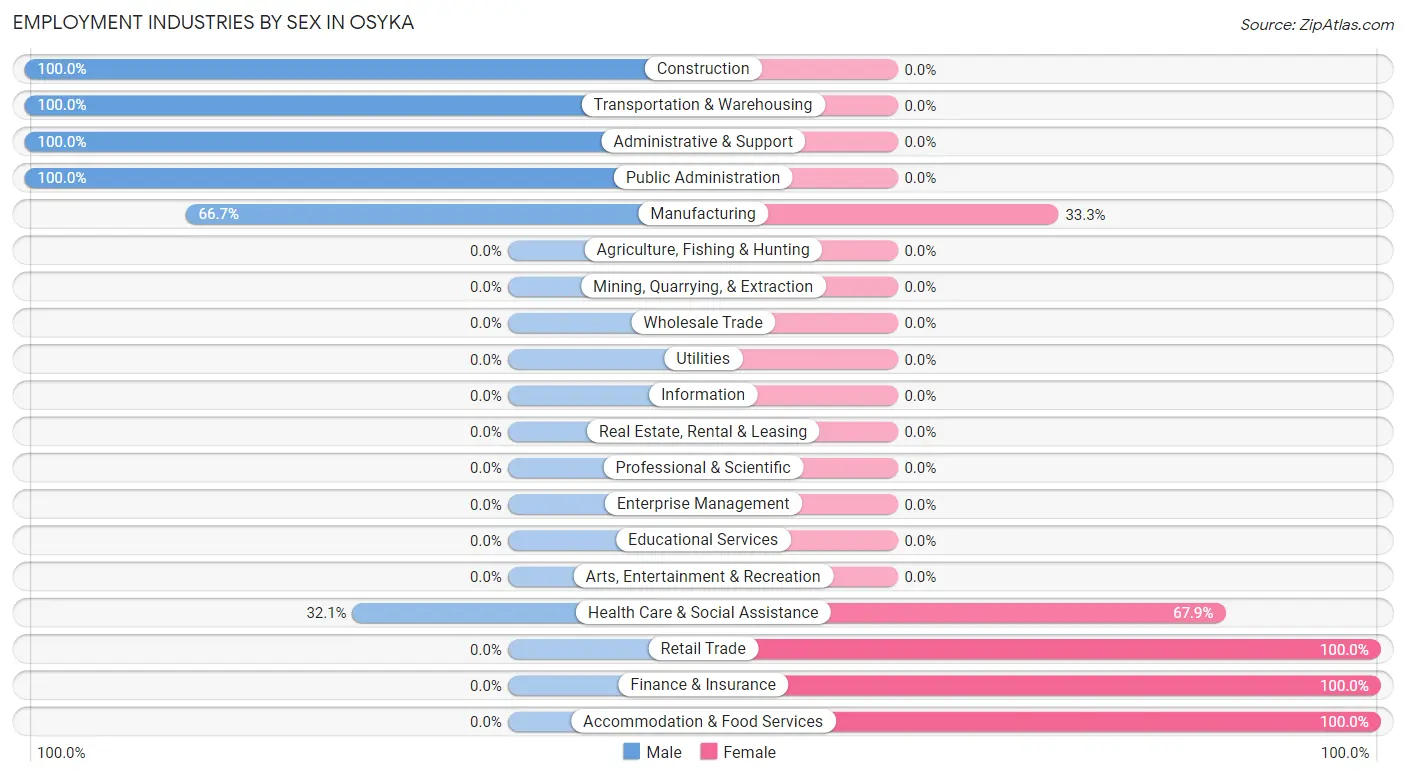
Employment Industries by Sex in Osyka
The Osyka industries that see more men than women are Construction (100.0%), Transportation & Warehousing (100.0%), and Administrative & Support (100.0%), whereas the industries that tend to have a higher number of women are Retail Trade (100.0%), Finance & Insurance (100.0%), and Accommodation & Food Services (100.0%).
| Industry | Male | Female |
| Agriculture, Fishing & Hunting | 0 (0.0%) | 0 (0.0%) |
| Mining, Quarrying, & Extraction | 0 (0.0%) | 0 (0.0%) |
| Construction | 11 (100.0%) | 0 (0.0%) |
| Manufacturing | 10 (66.7%) | 5 (33.3%) |
| Wholesale Trade | 0 (0.0%) | 0 (0.0%) |
| Retail Trade | 0 (0.0%) | 36 (100.0%) |
| Transportation & Warehousing | 11 (100.0%) | 0 (0.0%) |
| Utilities | 0 (0.0%) | 0 (0.0%) |
| Information | 0 (0.0%) | 0 (0.0%) |
| Finance & Insurance | 0 (0.0%) | 2 (100.0%) |
| Real Estate, Rental & Leasing | 0 (0.0%) | 0 (0.0%) |
| Professional & Scientific | 0 (0.0%) | 0 (0.0%) |
| Enterprise Management | 0 (0.0%) | 0 (0.0%) |
| Administrative & Support | 15 (100.0%) | 0 (0.0%) |
| Educational Services | 0 (0.0%) | 0 (0.0%) |
| Health Care & Social Assistance | 9 (32.1%) | 19 (67.9%) |
| Arts, Entertainment & Recreation | 0 (0.0%) | 0 (0.0%) |
| Accommodation & Food Services | 0 (0.0%) | 4 (100.0%) |
| Public Administration | 3 (100.0%) | 0 (0.0%) |
| Total | 59 (47.2%) | 66 (52.8%) |
Education in Osyka
School Enrollment in Osyka
The most common levels of schooling among the 89 students in Osyka are middle school (36 | 40.5%), college / undergraduate (30 | 33.7%), and high school (13 | 14.6%).
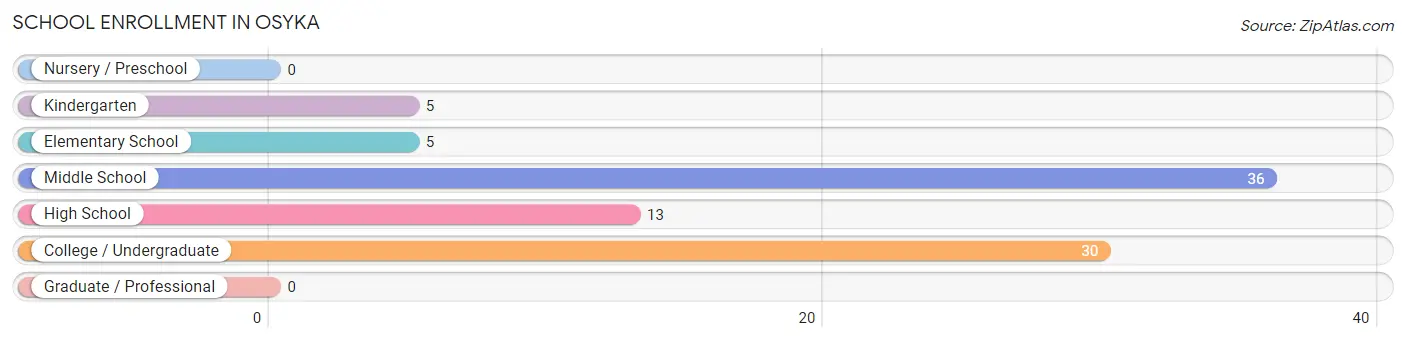
| School Level | # Students | % Students |
| Nursery / Preschool | 0 | 0.0% |
| Kindergarten | 5 | 5.6% |
| Elementary School | 5 | 5.6% |
| Middle School | 36 | 40.5% |
| High School | 13 | 14.6% |
| College / Undergraduate | 30 | 33.7% |
| Graduate / Professional | 0 | 0.0% |
| Total | 89 | 100.0% |
School Enrollment by Age by Funding Source in Osyka
Out of a total of 89 students who are enrolled in schools in Osyka, 8 (9.0%) attend a private institution, while the remaining 81 (91.0%) are enrolled in public schools. The age group of 15 to 17 year olds has the highest likelihood of being enrolled in private schools, with 4 (30.8% in the age bracket) enrolled. Conversely, the age group of 5 to 9 year old has the lowest likelihood of being enrolled in a private school, with 10 (100.0% in the age bracket) attending a public institution.
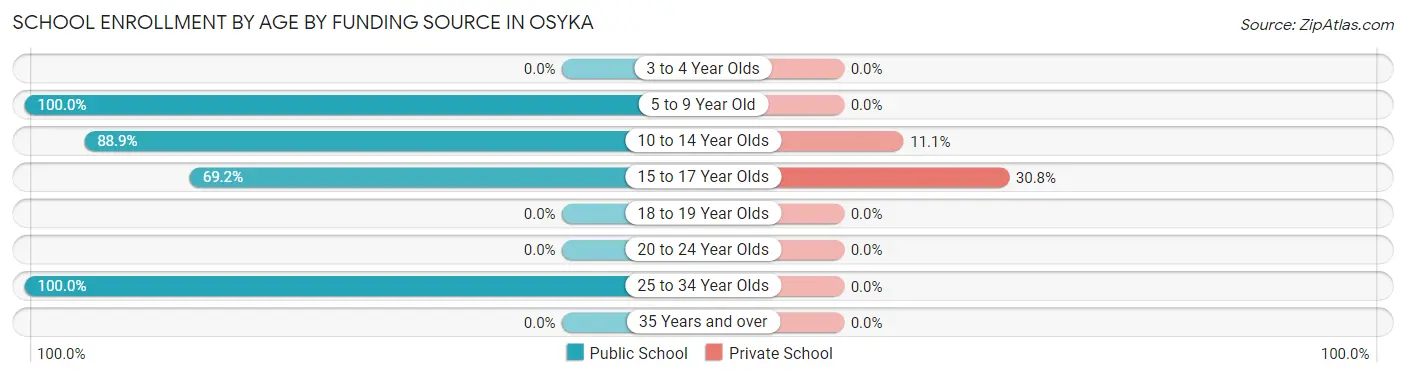
| Age Bracket | Public School | Private School |
| 3 to 4 Year Olds | 0 (0.0%) | 0 (0.0%) |
| 5 to 9 Year Old | 10 (100.0%) | 0 (0.0%) |
| 10 to 14 Year Olds | 32 (88.9%) | 4 (11.1%) |
| 15 to 17 Year Olds | 9 (69.2%) | 4 (30.8%) |
| 18 to 19 Year Olds | 0 (0.0%) | 0 (0.0%) |
| 20 to 24 Year Olds | 0 (0.0%) | 0 (0.0%) |
| 25 to 34 Year Olds | 30 (100.0%) | 0 (0.0%) |
| 35 Years and over | 0 (0.0%) | 0 (0.0%) |
| Total | 81 (91.0%) | 8 (9.0%) |
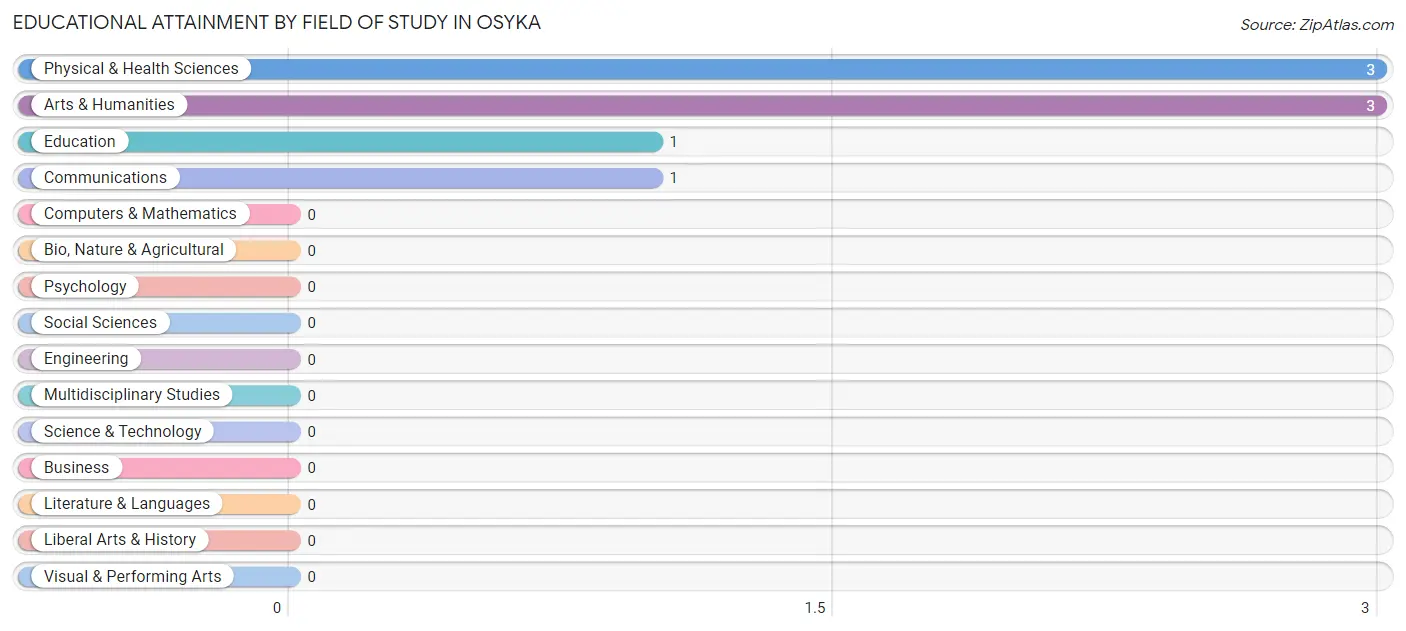
Educational Attainment by Field of Study in Osyka
Physical & health sciences (3 | 37.5%), arts & humanities (3 | 37.5%), education (1 | 12.5%), and communications (1 | 12.5%) are the most common fields of study among 8 individuals in Osyka who have obtained a bachelor's degree or higher.
| Field of Study | # Graduates | % Graduates |
| Computers & Mathematics | 0 | 0.0% |
| Bio, Nature & Agricultural | 0 | 0.0% |
| Physical & Health Sciences | 3 | 37.5% |
| Psychology | 0 | 0.0% |
| Social Sciences | 0 | 0.0% |
| Engineering | 0 | 0.0% |
| Multidisciplinary Studies | 0 | 0.0% |
| Science & Technology | 0 | 0.0% |
| Business | 0 | 0.0% |
| Education | 1 | 12.5% |
| Literature & Languages | 0 | 0.0% |
| Liberal Arts & History | 0 | 0.0% |
| Visual & Performing Arts | 0 | 0.0% |
| Communications | 1 | 12.5% |
| Arts & Humanities | 3 | 37.5% |
| Total | 8 | 100.0% |
Transportation & Commute in Osyka
Vehicle Availability by Sex in Osyka
The most prevalent vehicle ownership categories in Osyka are males with 2 vehicles (27, accounting for 45.8%) and females with 2 vehicles (47, making up 42.9%).
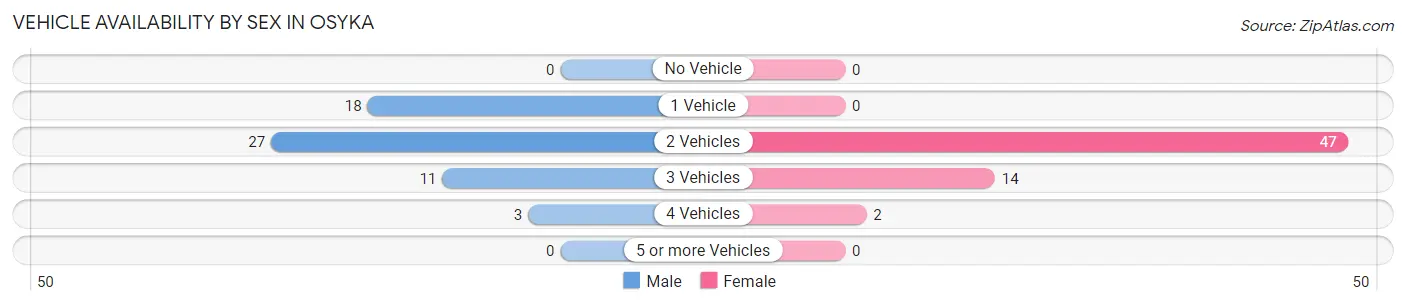
| Vehicles Available | Male | Female |
| No Vehicle | 0 (0.0%) | 0 (0.0%) |
| 1 Vehicle | 18 (30.5%) | 0 (0.0%) |
| 2 Vehicles | 27 (45.8%) | 47 (74.6%) |
| 3 Vehicles | 11 (18.6%) | 14 (22.2%) |
| 4 Vehicles | 3 (5.1%) | 2 (3.2%) |
| 5 or more Vehicles | 0 (0.0%) | 0 (0.0%) |
| Total | 59 (100.0%) | 63 (100.0%) |
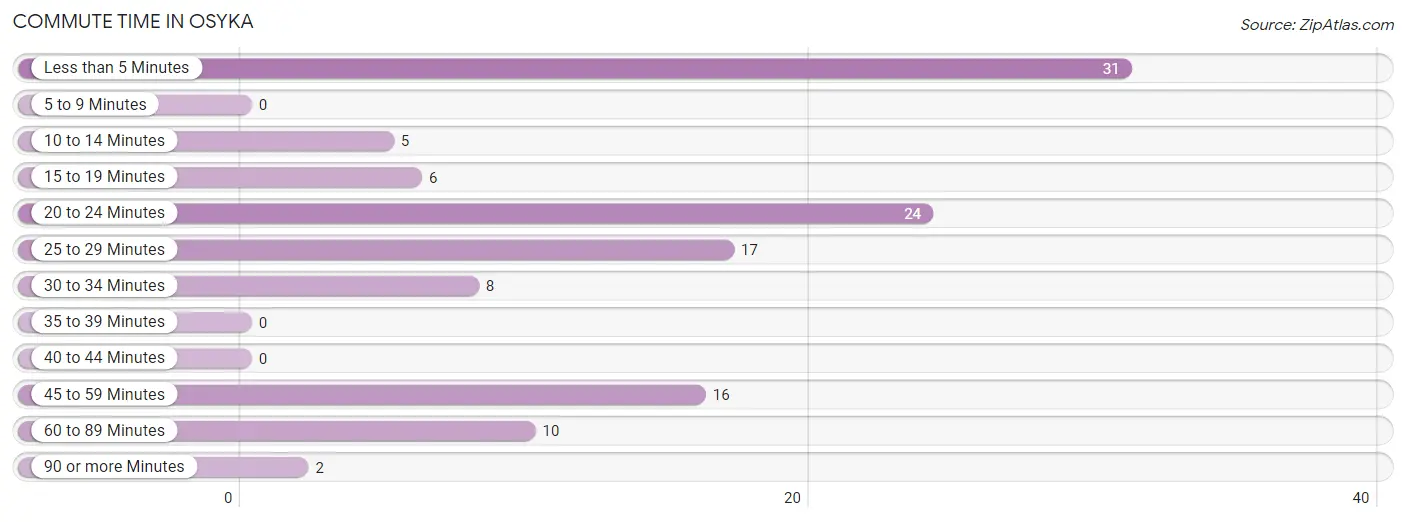
Commute Time in Osyka
The most frequently occuring commute durations in Osyka are less than 5 minutes (31 commuters, 26.1%), 20 to 24 minutes (24 commuters, 20.2%), and 25 to 29 minutes (17 commuters, 14.3%).
| Commute Time | # Commuters | % Commuters |
| Less than 5 Minutes | 31 | 26.1% |
| 5 to 9 Minutes | 0 | 0.0% |
| 10 to 14 Minutes | 5 | 4.2% |
| 15 to 19 Minutes | 6 | 5.0% |
| 20 to 24 Minutes | 24 | 20.2% |
| 25 to 29 Minutes | 17 | 14.3% |
| 30 to 34 Minutes | 8 | 6.7% |
| 35 to 39 Minutes | 0 | 0.0% |
| 40 to 44 Minutes | 0 | 0.0% |
| 45 to 59 Minutes | 16 | 13.5% |
| 60 to 89 Minutes | 10 | 8.4% |
| 90 or more Minutes | 2 | 1.7% |
Commute Time by Sex in Osyka
The most common commute times in Osyka are less than 5 minutes (15 commuters, 26.8%) for males and less than 5 minutes (16 commuters, 25.4%) for females.
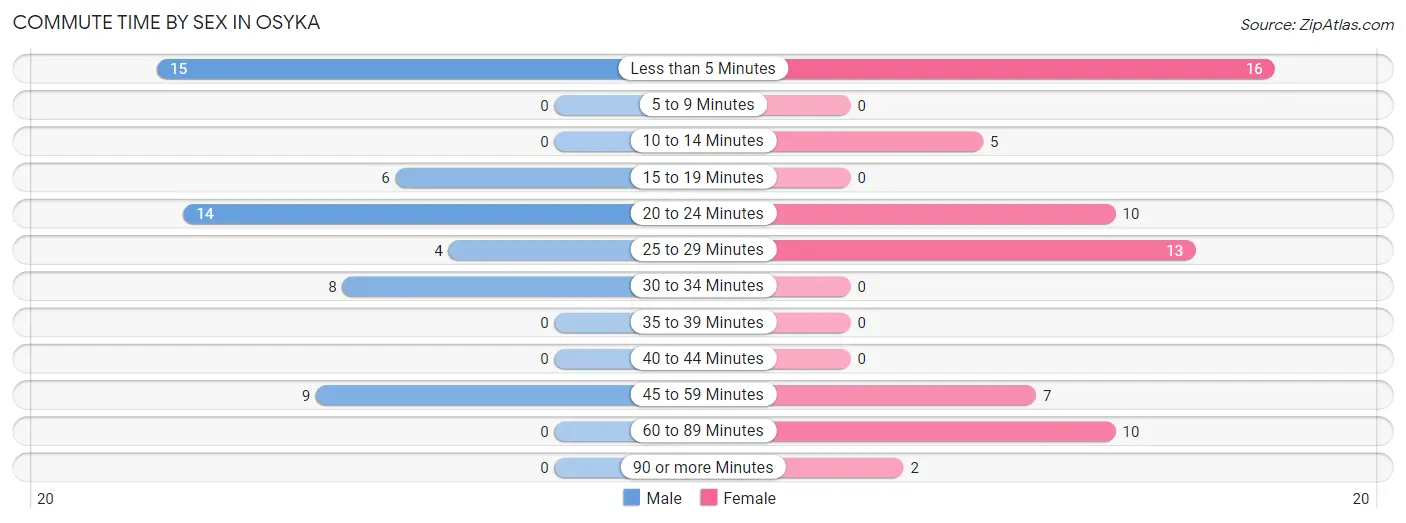
| Commute Time | Male | Female |
| Less than 5 Minutes | 15 (26.8%) | 16 (25.4%) |
| 5 to 9 Minutes | 0 (0.0%) | 0 (0.0%) |
| 10 to 14 Minutes | 0 (0.0%) | 5 (7.9%) |
| 15 to 19 Minutes | 6 (10.7%) | 0 (0.0%) |
| 20 to 24 Minutes | 14 (25.0%) | 10 (15.9%) |
| 25 to 29 Minutes | 4 (7.1%) | 13 (20.6%) |
| 30 to 34 Minutes | 8 (14.3%) | 0 (0.0%) |
| 35 to 39 Minutes | 0 (0.0%) | 0 (0.0%) |
| 40 to 44 Minutes | 0 (0.0%) | 0 (0.0%) |
| 45 to 59 Minutes | 9 (16.1%) | 7 (11.1%) |
| 60 to 89 Minutes | 0 (0.0%) | 10 (15.9%) |
| 90 or more Minutes | 0 (0.0%) | 2 (3.2%) |
Time of Departure to Work by Sex in Osyka
The most frequent times of departure to work in Osyka are 12:00 AM to 4:59 AM (19, 33.9%) for males and 5:00 AM to 5:29 AM (17, 27.0%) for females.
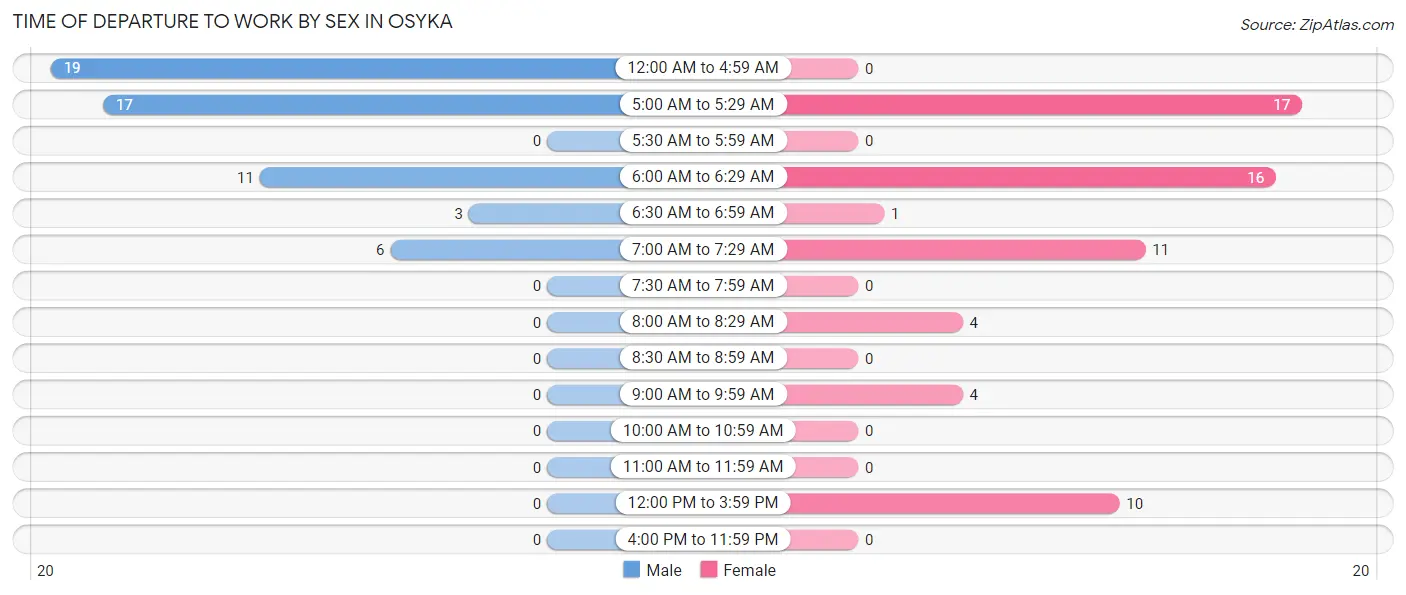
| Time of Departure | Male | Female |
| 12:00 AM to 4:59 AM | 19 (33.9%) | 0 (0.0%) |
| 5:00 AM to 5:29 AM | 17 (30.4%) | 17 (27.0%) |
| 5:30 AM to 5:59 AM | 0 (0.0%) | 0 (0.0%) |
| 6:00 AM to 6:29 AM | 11 (19.6%) | 16 (25.4%) |
| 6:30 AM to 6:59 AM | 3 (5.4%) | 1 (1.6%) |
| 7:00 AM to 7:29 AM | 6 (10.7%) | 11 (17.5%) |
| 7:30 AM to 7:59 AM | 0 (0.0%) | 0 (0.0%) |
| 8:00 AM to 8:29 AM | 0 (0.0%) | 4 (6.4%) |
| 8:30 AM to 8:59 AM | 0 (0.0%) | 0 (0.0%) |
| 9:00 AM to 9:59 AM | 0 (0.0%) | 4 (6.4%) |
| 10:00 AM to 10:59 AM | 0 (0.0%) | 0 (0.0%) |
| 11:00 AM to 11:59 AM | 0 (0.0%) | 0 (0.0%) |
| 12:00 PM to 3:59 PM | 0 (0.0%) | 10 (15.9%) |
| 4:00 PM to 11:59 PM | 0 (0.0%) | 0 (0.0%) |
| Total | 56 (100.0%) | 63 (100.0%) |
Housing Occupancy in Osyka
Occupancy by Ownership in Osyka
Of the total 151 dwellings in Osyka, owner-occupied units account for 74 (49.0%), while renter-occupied units make up 77 (51.0%).
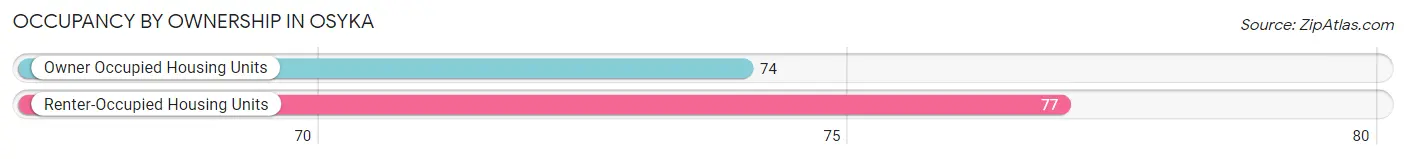
| Occupancy | # Housing Units | % Housing Units |
| Owner Occupied Housing Units | 74 | 49.0% |
| Renter-Occupied Housing Units | 77 | 51.0% |
| Total Occupied Housing Units | 151 | 100.0% |
Occupancy by Household Size in Osyka
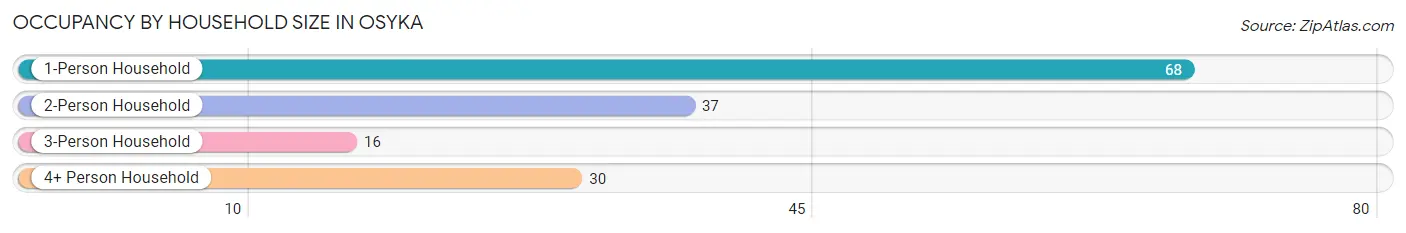
| Household Size | # Housing Units | % Housing Units |
| 1-Person Household | 68 | 45.0% |
| 2-Person Household | 37 | 24.5% |
| 3-Person Household | 16 | 10.6% |
| 4+ Person Household | 30 | 19.9% |
| Total Housing Units | 151 | 100.0% |
Occupancy by Ownership by Household Size in Osyka
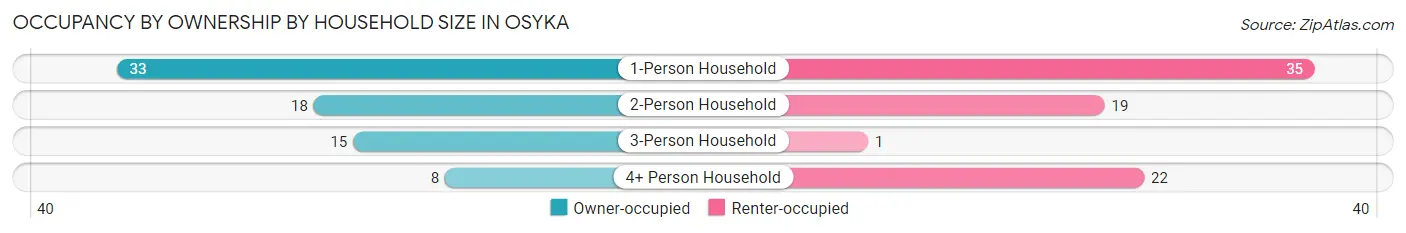
| Household Size | Owner-occupied | Renter-occupied |
| 1-Person Household | 33 (48.5%) | 35 (51.5%) |
| 2-Person Household | 18 (48.6%) | 19 (51.3%) |
| 3-Person Household | 15 (93.8%) | 1 (6.2%) |
| 4+ Person Household | 8 (26.7%) | 22 (73.3%) |
| Total Housing Units | 74 (49.0%) | 77 (51.0%) |
Occupancy by Educational Attainment in Osyka
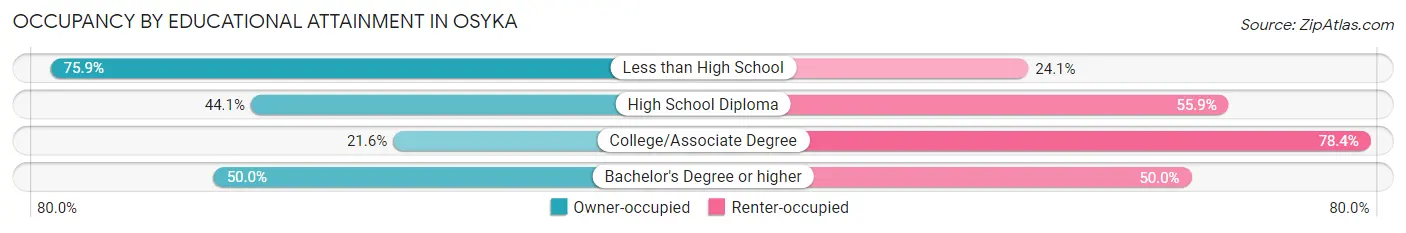
| Household Size | Owner-occupied | Renter-occupied |
| Less than High School | 44 (75.9%) | 14 (24.1%) |
| High School Diploma | 15 (44.1%) | 19 (55.9%) |
| College/Associate Degree | 11 (21.6%) | 40 (78.4%) |
| Bachelor's Degree or higher | 4 (50.0%) | 4 (50.0%) |
Occupancy by Age of Householder in Osyka
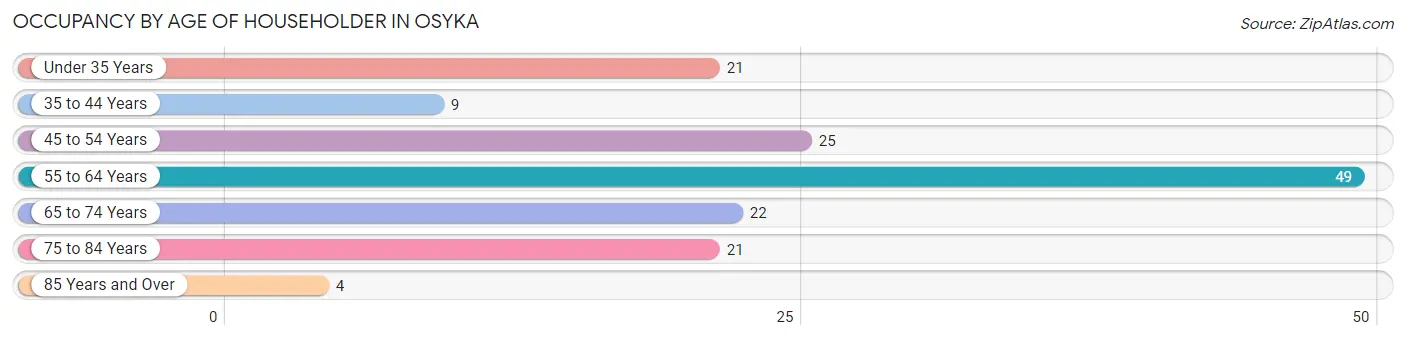
| Age Bracket | # Households | % Households |
| Under 35 Years | 21 | 13.9% |
| 35 to 44 Years | 9 | 6.0% |
| 45 to 54 Years | 25 | 16.6% |
| 55 to 64 Years | 49 | 32.5% |
| 65 to 74 Years | 22 | 14.6% |
| 75 to 84 Years | 21 | 13.9% |
| 85 Years and Over | 4 | 2.6% |
| Total | 151 | 100.0% |
Housing Finances in Osyka
Median Income by Occupancy in Osyka
| Occupancy Type | # Households | Median Income |
| Owner-Occupied | 74 (49.0%) | $0 |
| Renter-Occupied | 77 (51.0%) | $0 |
| Average | 151 (100.0%) | $0 |
Occupancy by Householder Income Bracket in Osyka
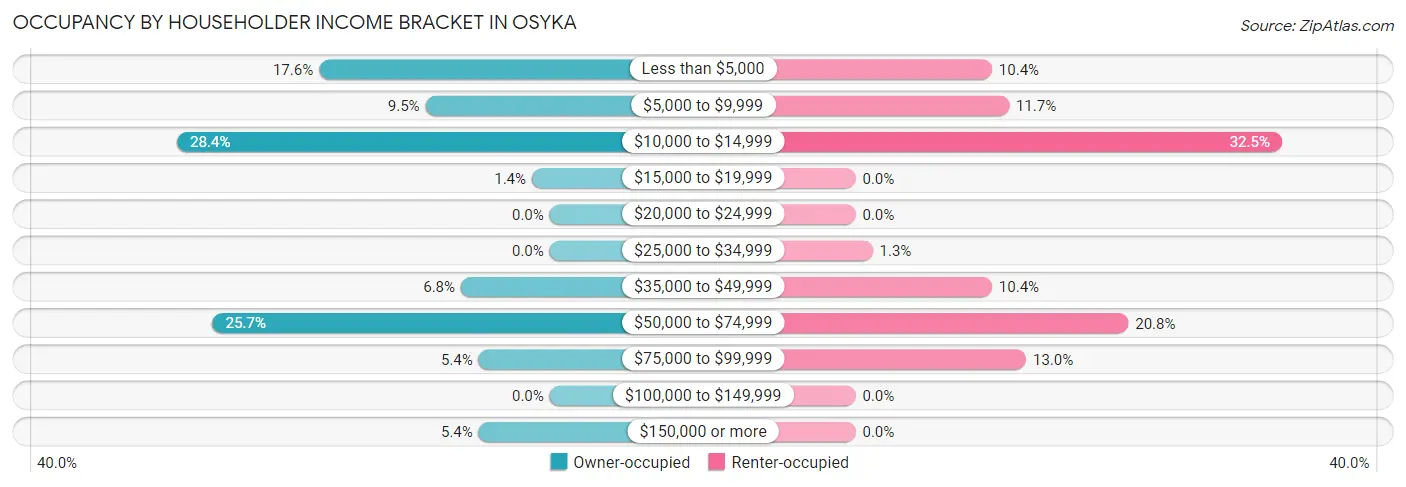
| Income Bracket | Owner-occupied | Renter-occupied |
| Less than $5,000 | 13 (17.6%) | 8 (10.4%) |
| $5,000 to $9,999 | 7 (9.5%) | 9 (11.7%) |
| $10,000 to $14,999 | 21 (28.4%) | 25 (32.5%) |
| $15,000 to $19,999 | 1 (1.3%) | 0 (0.0%) |
| $20,000 to $24,999 | 0 (0.0%) | 0 (0.0%) |
| $25,000 to $34,999 | 0 (0.0%) | 1 (1.3%) |
| $35,000 to $49,999 | 5 (6.8%) | 8 (10.4%) |
| $50,000 to $74,999 | 19 (25.7%) | 16 (20.8%) |
| $75,000 to $99,999 | 4 (5.4%) | 10 (13.0%) |
| $100,000 to $149,999 | 0 (0.0%) | 0 (0.0%) |
| $150,000 or more | 4 (5.4%) | 0 (0.0%) |
| Total | 74 (100.0%) | 77 (100.0%) |
Monthly Housing Cost Tiers in Osyka
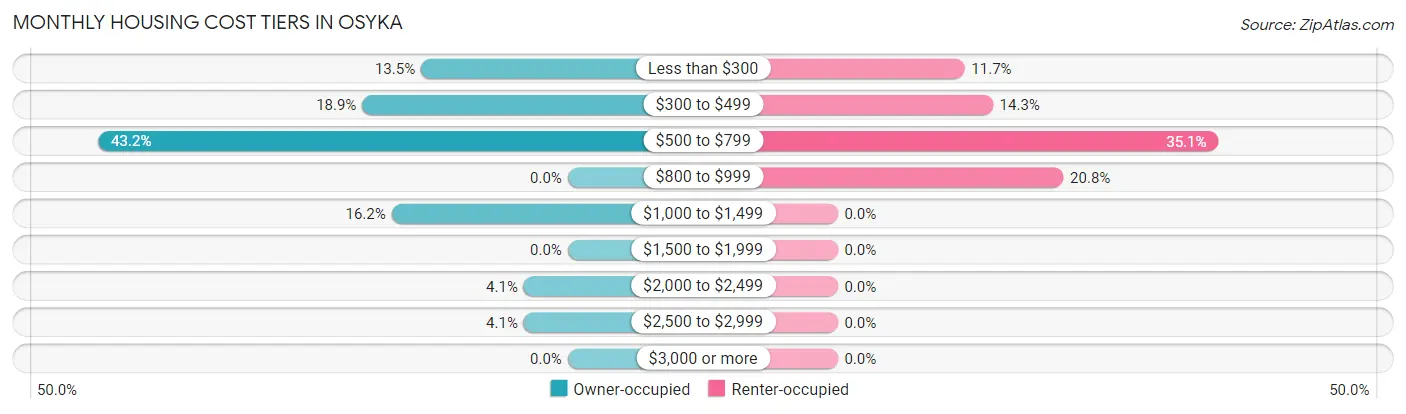
| Monthly Cost | Owner-occupied | Renter-occupied |
| Less than $300 | 10 (13.5%) | 9 (11.7%) |
| $300 to $499 | 14 (18.9%) | 11 (14.3%) |
| $500 to $799 | 32 (43.2%) | 27 (35.1%) |
| $800 to $999 | 0 (0.0%) | 16 (20.8%) |
| $1,000 to $1,499 | 12 (16.2%) | 0 (0.0%) |
| $1,500 to $1,999 | 0 (0.0%) | 0 (0.0%) |
| $2,000 to $2,499 | 3 (4.1%) | 0 (0.0%) |
| $2,500 to $2,999 | 3 (4.1%) | 0 (0.0%) |
| $3,000 or more | 0 (0.0%) | 0 (0.0%) |
| Total | 74 (100.0%) | 77 (100.0%) |
Physical Housing Characteristics in Osyka
Housing Structures in Osyka
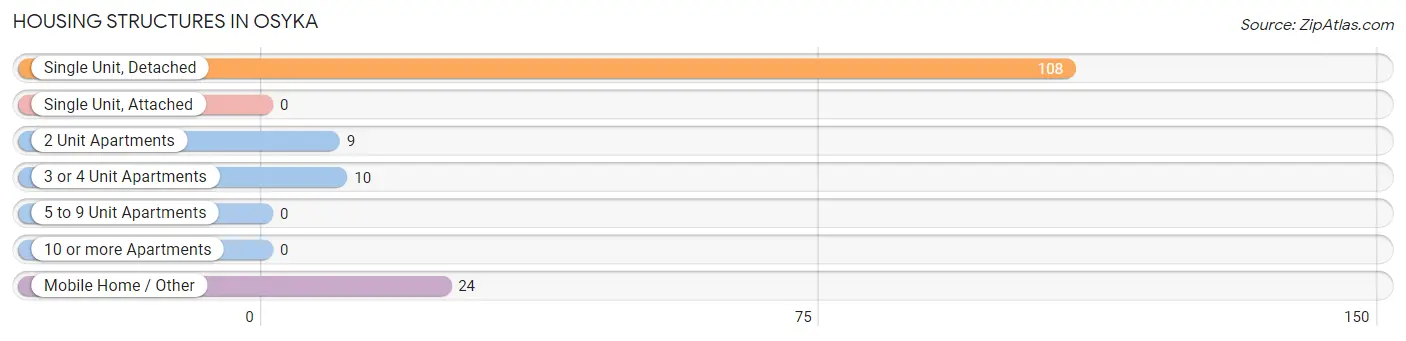
| Structure Type | # Housing Units | % Housing Units |
| Single Unit, Detached | 108 | 71.5% |
| Single Unit, Attached | 0 | 0.0% |
| 2 Unit Apartments | 9 | 6.0% |
| 3 or 4 Unit Apartments | 10 | 6.6% |
| 5 to 9 Unit Apartments | 0 | 0.0% |
| 10 or more Apartments | 0 | 0.0% |
| Mobile Home / Other | 24 | 15.9% |
| Total | 151 | 100.0% |
Housing Structures by Occupancy in Osyka
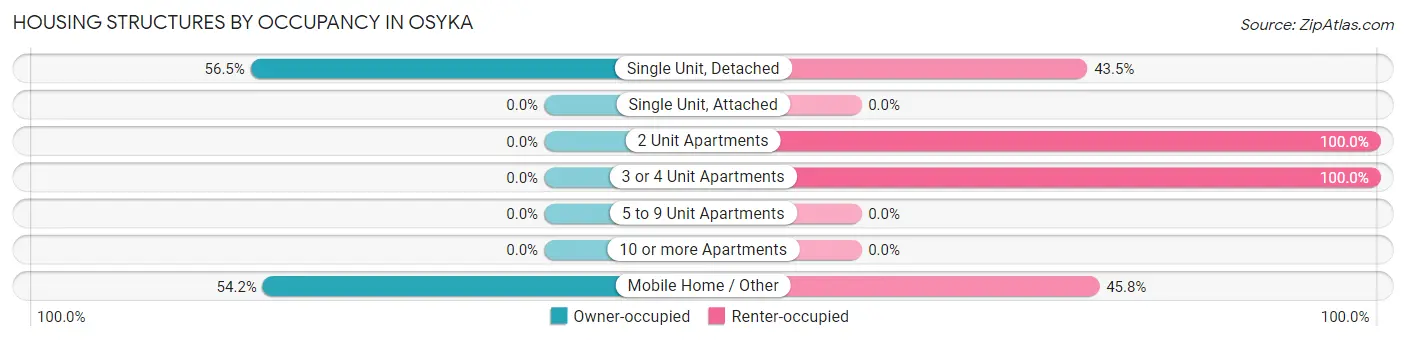
| Structure Type | Owner-occupied | Renter-occupied |
| Single Unit, Detached | 61 (56.5%) | 47 (43.5%) |
| Single Unit, Attached | 0 (0.0%) | 0 (0.0%) |
| 2 Unit Apartments | 0 (0.0%) | 9 (100.0%) |
| 3 or 4 Unit Apartments | 0 (0.0%) | 10 (100.0%) |
| 5 to 9 Unit Apartments | 0 (0.0%) | 0 (0.0%) |
| 10 or more Apartments | 0 (0.0%) | 0 (0.0%) |
| Mobile Home / Other | 13 (54.2%) | 11 (45.8%) |
| Total | 74 (49.0%) | 77 (51.0%) |
Housing Structures by Number of Rooms in Osyka
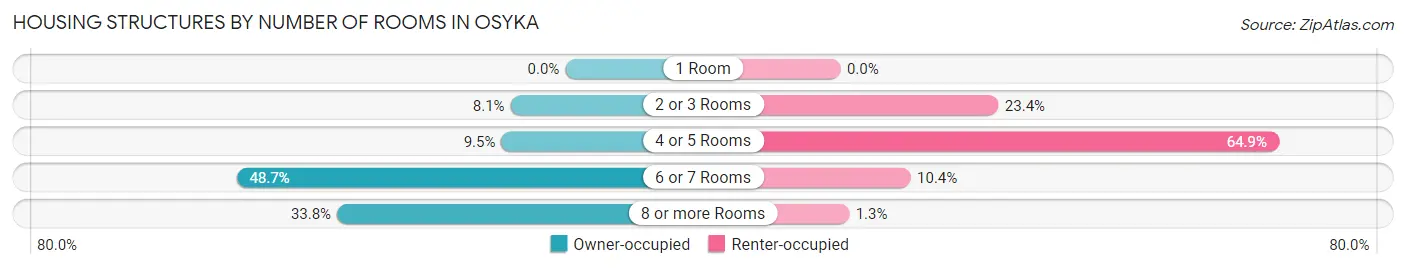
| Number of Rooms | Owner-occupied | Renter-occupied |
| 1 Room | 0 (0.0%) | 0 (0.0%) |
| 2 or 3 Rooms | 6 (8.1%) | 18 (23.4%) |
| 4 or 5 Rooms | 7 (9.5%) | 50 (64.9%) |
| 6 or 7 Rooms | 36 (48.6%) | 8 (10.4%) |
| 8 or more Rooms | 25 (33.8%) | 1 (1.3%) |
| Total | 74 (100.0%) | 77 (100.0%) |
Housing Structure by Heating Type in Osyka
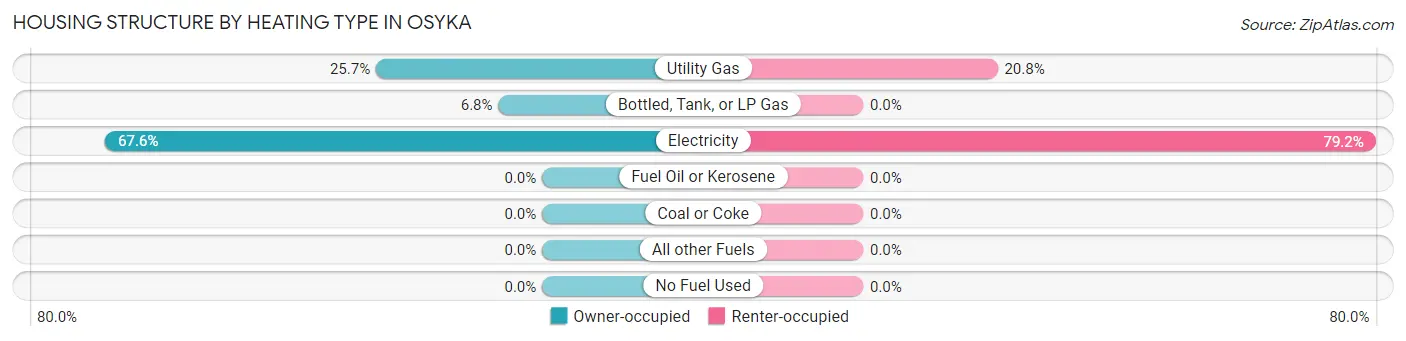
| Heating Type | Owner-occupied | Renter-occupied |
| Utility Gas | 19 (25.7%) | 16 (20.8%) |
| Bottled, Tank, or LP Gas | 5 (6.8%) | 0 (0.0%) |
| Electricity | 50 (67.6%) | 61 (79.2%) |
| Fuel Oil or Kerosene | 0 (0.0%) | 0 (0.0%) |
| Coal or Coke | 0 (0.0%) | 0 (0.0%) |
| All other Fuels | 0 (0.0%) | 0 (0.0%) |
| No Fuel Used | 0 (0.0%) | 0 (0.0%) |
| Total | 74 (100.0%) | 77 (100.0%) |
Household Vehicle Usage in Osyka
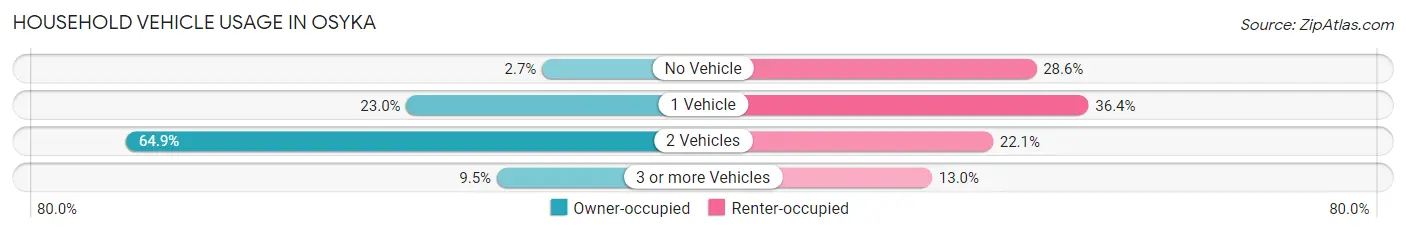
| Vehicles per Household | Owner-occupied | Renter-occupied |
| No Vehicle | 2 (2.7%) | 22 (28.6%) |
| 1 Vehicle | 17 (23.0%) | 28 (36.4%) |
| 2 Vehicles | 48 (64.9%) | 17 (22.1%) |
| 3 or more Vehicles | 7 (9.5%) | 10 (13.0%) |
| Total | 74 (100.0%) | 77 (100.0%) |
Real Estate & Mortgages in Osyka
Real Estate and Mortgage Overview in Osyka
| Characteristic | Without Mortgage | With Mortgage |
| Housing Units | 38 | 36 |
| Median Property Value | $74,000 | $91,700 |
| Median Household Income | - | - |
| Monthly Housing Costs | $429 | $0 |
| Real Estate Taxes | $1,650 | $12 |
Property Value by Mortgage Status in Osyka
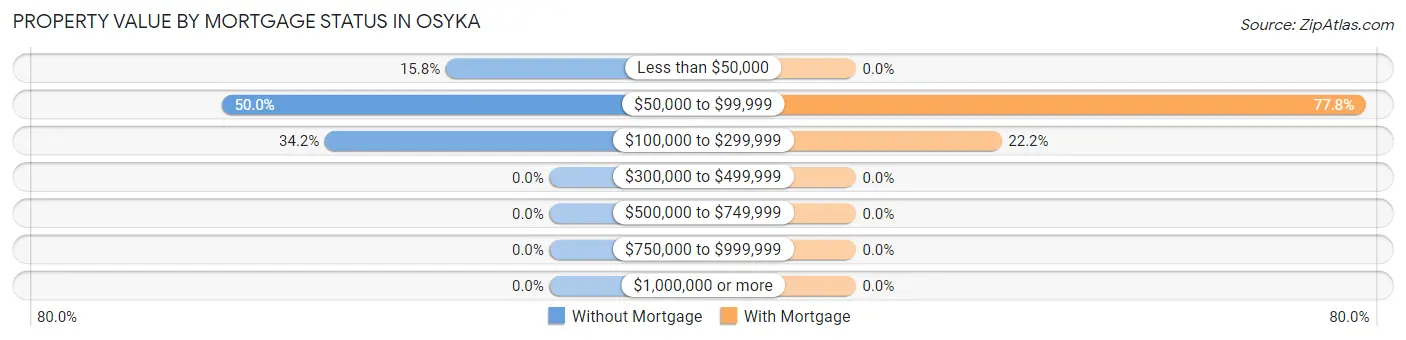
| Property Value | Without Mortgage | With Mortgage |
| Less than $50,000 | 6 (15.8%) | 0 (0.0%) |
| $50,000 to $99,999 | 19 (50.0%) | 28 (77.8%) |
| $100,000 to $299,999 | 13 (34.2%) | 8 (22.2%) |
| $300,000 to $499,999 | 0 (0.0%) | 0 (0.0%) |
| $500,000 to $749,999 | 0 (0.0%) | 0 (0.0%) |
| $750,000 to $999,999 | 0 (0.0%) | 0 (0.0%) |
| $1,000,000 or more | 0 (0.0%) | 0 (0.0%) |
| Total | 38 (100.0%) | 36 (100.0%) |
Household Income by Mortgage Status in Osyka
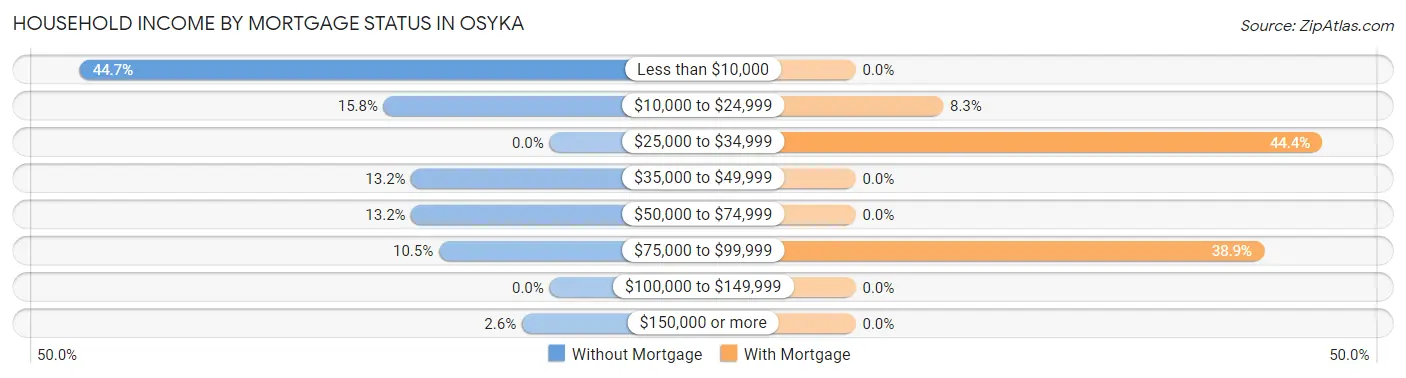
| Household Income | Without Mortgage | With Mortgage |
| Less than $10,000 | 17 (44.7%) | 0 (0.0%) |
| $10,000 to $24,999 | 6 (15.8%) | 3 (8.3%) |
| $25,000 to $34,999 | 0 (0.0%) | 16 (44.4%) |
| $35,000 to $49,999 | 5 (13.2%) | 0 (0.0%) |
| $50,000 to $74,999 | 5 (13.2%) | 0 (0.0%) |
| $75,000 to $99,999 | 4 (10.5%) | 14 (38.9%) |
| $100,000 to $149,999 | 0 (0.0%) | 0 (0.0%) |
| $150,000 or more | 1 (2.6%) | 0 (0.0%) |
| Total | 38 (100.0%) | 36 (100.0%) |
Property Value to Household Income Ratio in Osyka
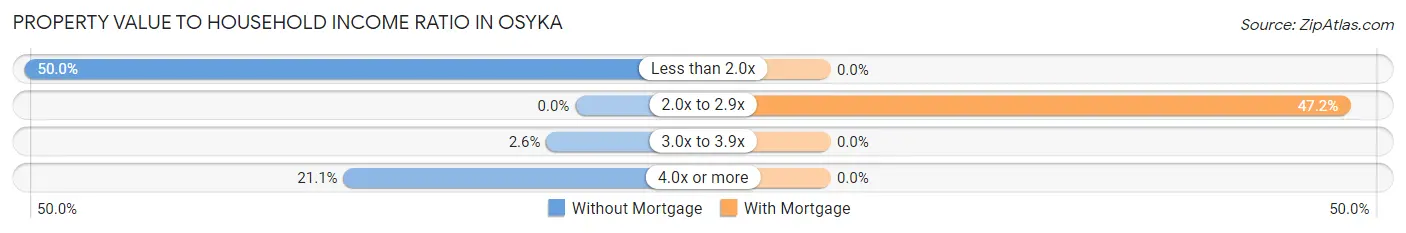
| Value-to-Income Ratio | Without Mortgage | With Mortgage |
| Less than 2.0x | 19 (50.0%) | 0 (0.0%) |
| 2.0x to 2.9x | 0 (0.0%) | 17 (47.2%) |
| 3.0x to 3.9x | 1 (2.6%) | 0 (0.0%) |
| 4.0x or more | 8 (21.0%) | 0 (0.0%) |
| Total | 38 (100.0%) | 36 (100.0%) |
Real Estate Taxes by Mortgage Status in Osyka
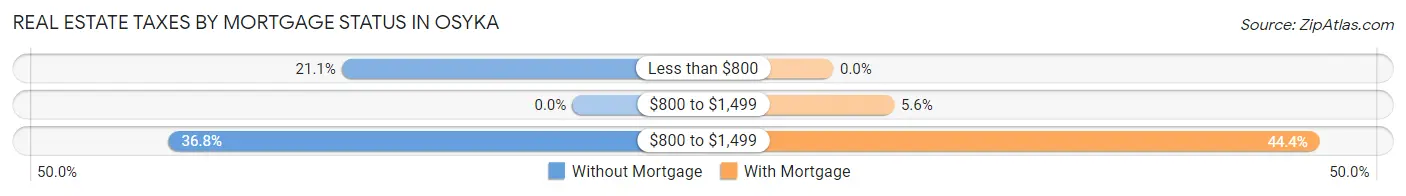
| Property Taxes | Without Mortgage | With Mortgage |
| Less than $800 | 8 (21.0%) | 0 (0.0%) |
| $800 to $1,499 | 0 (0.0%) | 2 (5.6%) |
| $800 to $1,499 | 14 (36.8%) | 16 (44.4%) |
| Total | 38 (100.0%) | 36 (100.0%) |
Health & Disability in Osyka
Health Insurance Coverage by Age in Osyka
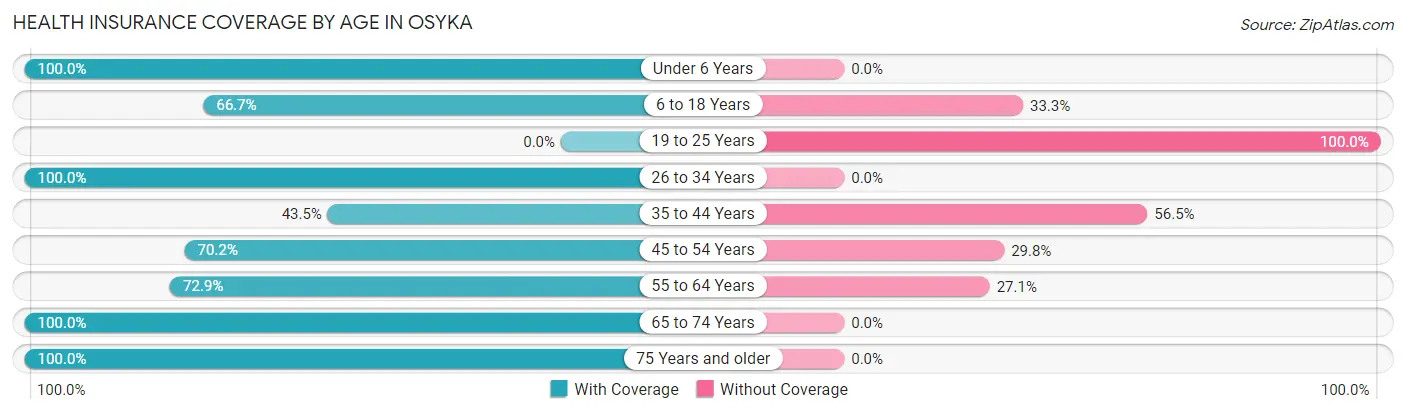
| Age Bracket | With Coverage | Without Coverage |
| Under 6 Years | 46 (100.0%) | 0 (0.0%) |
| 6 to 18 Years | 54 (66.7%) | 27 (33.3%) |
| 19 to 25 Years | 0 (0.0%) | 8 (100.0%) |
| 26 to 34 Years | 63 (100.0%) | 0 (0.0%) |
| 35 to 44 Years | 10 (43.5%) | 13 (56.5%) |
| 45 to 54 Years | 40 (70.2%) | 17 (29.8%) |
| 55 to 64 Years | 43 (72.9%) | 16 (27.1%) |
| 65 to 74 Years | 34 (100.0%) | 0 (0.0%) |
| 75 Years and older | 37 (100.0%) | 0 (0.0%) |
| Total | 327 (80.1%) | 81 (19.9%) |
Health Insurance Coverage by Citizenship Status in Osyka

| Citizenship Status | With Coverage | Without Coverage |
| Native Born | 46 (100.0%) | 0 (0.0%) |
| Foreign Born, Citizen | 54 (66.7%) | 27 (33.3%) |
| Foreign Born, not a Citizen | 0 (0.0%) | 8 (100.0%) |
Health Insurance Coverage by Household Income in Osyka
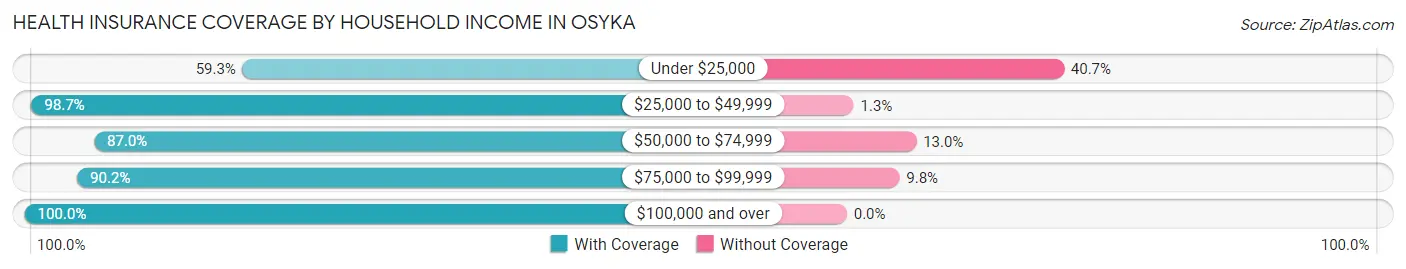
| Household Income | With Coverage | Without Coverage |
| Under $25,000 | 89 (59.3%) | 61 (40.7%) |
| $25,000 to $49,999 | 77 (98.7%) | 1 (1.3%) |
| $50,000 to $74,999 | 87 (87.0%) | 13 (13.0%) |
| $75,000 to $99,999 | 55 (90.2%) | 6 (9.8%) |
| $100,000 and over | 19 (100.0%) | 0 (0.0%) |
Public vs Private Health Insurance Coverage by Age in Osyka
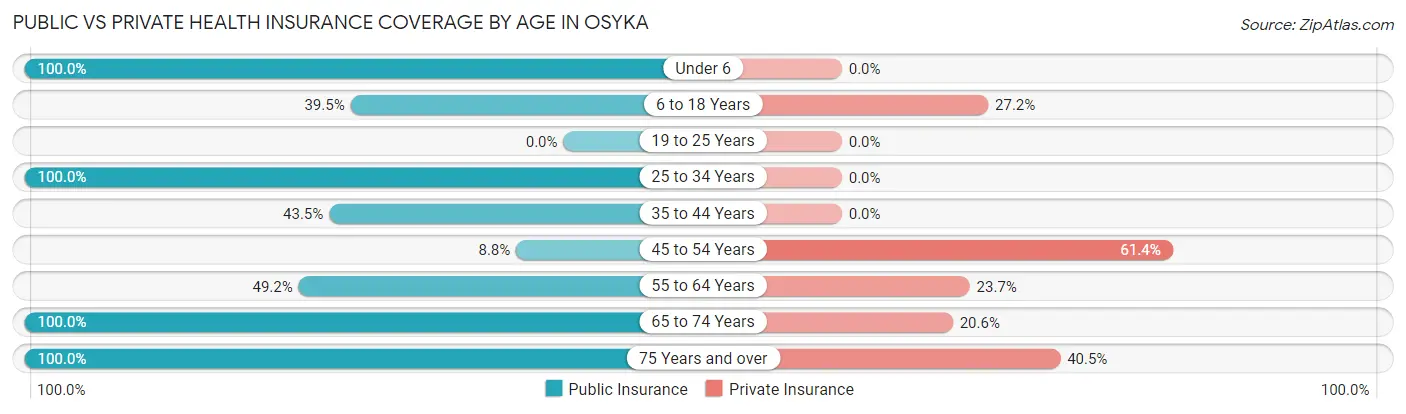
| Age Bracket | Public Insurance | Private Insurance |
| Under 6 | 46 (100.0%) | 0 (0.0%) |
| 6 to 18 Years | 32 (39.5%) | 22 (27.2%) |
| 19 to 25 Years | 0 (0.0%) | 0 (0.0%) |
| 25 to 34 Years | 63 (100.0%) | 0 (0.0%) |
| 35 to 44 Years | 10 (43.5%) | 0 (0.0%) |
| 45 to 54 Years | 5 (8.8%) | 35 (61.4%) |
| 55 to 64 Years | 29 (49.1%) | 14 (23.7%) |
| 65 to 74 Years | 34 (100.0%) | 7 (20.6%) |
| 75 Years and over | 37 (100.0%) | 15 (40.5%) |
| Total | 256 (62.7%) | 93 (22.8%) |
Disability Status by Sex by Age in Osyka
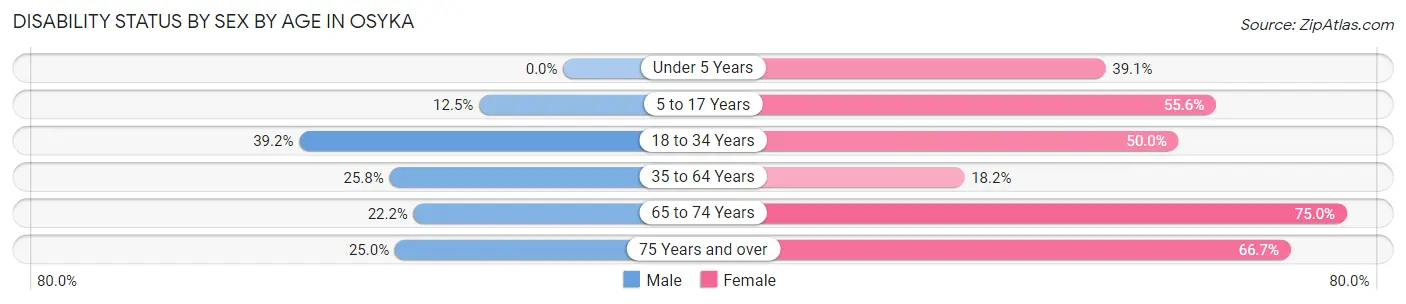
| Age Bracket | Male | Female |
| Under 5 Years | 0 (0.0%) | 9 (39.1%) |
| 5 to 17 Years | 9 (12.5%) | 5 (55.6%) |
| 18 to 34 Years | 20 (39.2%) | 10 (50.0%) |
| 35 to 64 Years | 16 (25.8%) | 14 (18.2%) |
| 65 to 74 Years | 4 (22.2%) | 12 (75.0%) |
| 75 Years and over | 1 (25.0%) | 22 (66.7%) |
Disability Class by Sex by Age in Osyka
Disability Class: Hearing Difficulty
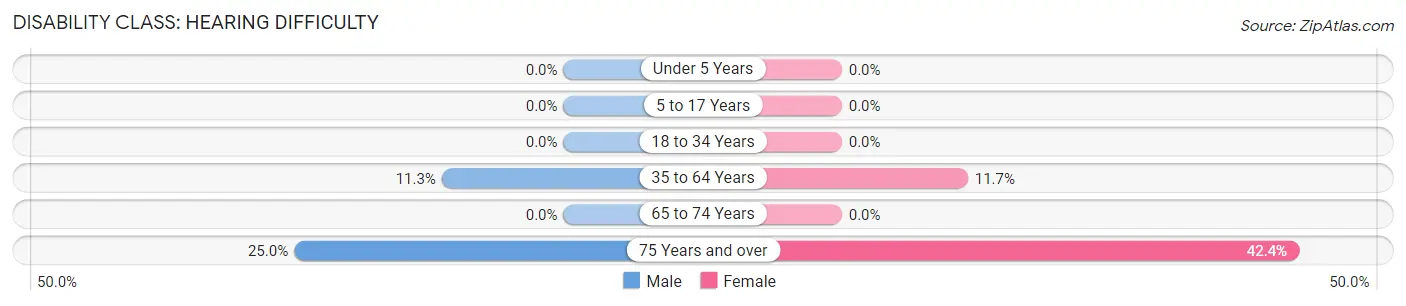
| Age Bracket | Male | Female |
| Under 5 Years | 0 (0.0%) | 0 (0.0%) |
| 5 to 17 Years | 0 (0.0%) | 0 (0.0%) |
| 18 to 34 Years | 0 (0.0%) | 0 (0.0%) |
| 35 to 64 Years | 7 (11.3%) | 9 (11.7%) |
| 65 to 74 Years | 0 (0.0%) | 0 (0.0%) |
| 75 Years and over | 1 (25.0%) | 14 (42.4%) |
Disability Class: Vision Difficulty
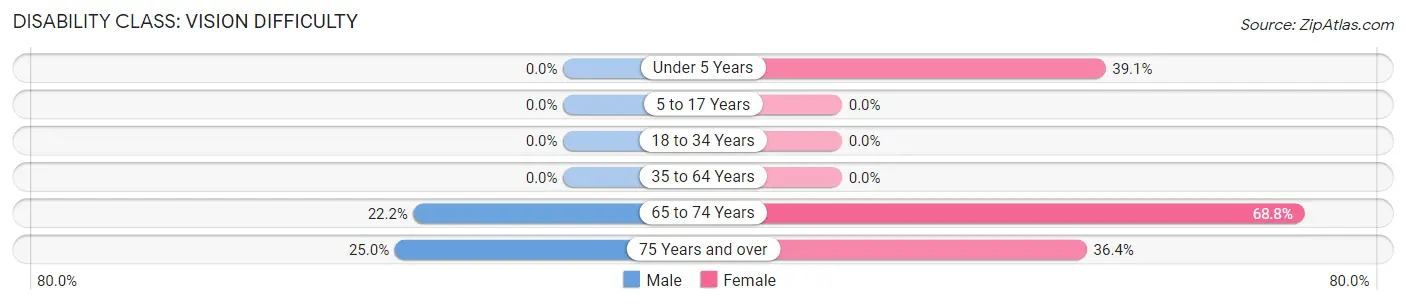
| Age Bracket | Male | Female |
| Under 5 Years | 0 (0.0%) | 9 (39.1%) |
| 5 to 17 Years | 0 (0.0%) | 0 (0.0%) |
| 18 to 34 Years | 0 (0.0%) | 0 (0.0%) |
| 35 to 64 Years | 0 (0.0%) | 0 (0.0%) |
| 65 to 74 Years | 4 (22.2%) | 11 (68.8%) |
| 75 Years and over | 1 (25.0%) | 12 (36.4%) |
Disability Class: Cognitive Difficulty
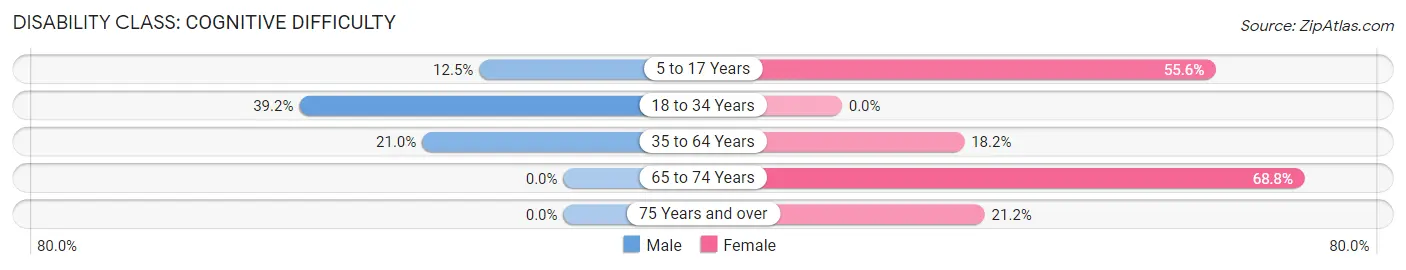
| Age Bracket | Male | Female |
| 5 to 17 Years | 9 (12.5%) | 5 (55.6%) |
| 18 to 34 Years | 20 (39.2%) | 0 (0.0%) |
| 35 to 64 Years | 13 (21.0%) | 14 (18.2%) |
| 65 to 74 Years | 0 (0.0%) | 11 (68.8%) |
| 75 Years and over | 0 (0.0%) | 7 (21.2%) |
Disability Class: Ambulatory Difficulty
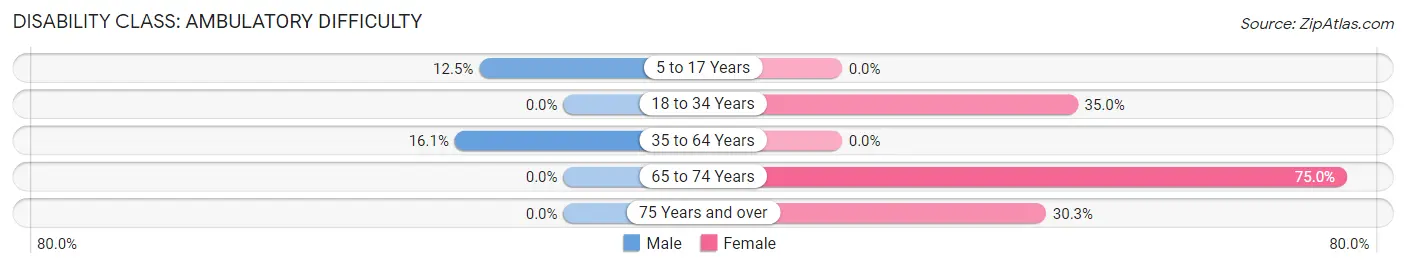
| Age Bracket | Male | Female |
| 5 to 17 Years | 9 (12.5%) | 0 (0.0%) |
| 18 to 34 Years | 0 (0.0%) | 7 (35.0%) |
| 35 to 64 Years | 10 (16.1%) | 0 (0.0%) |
| 65 to 74 Years | 0 (0.0%) | 12 (75.0%) |
| 75 Years and over | 0 (0.0%) | 10 (30.3%) |
Disability Class: Self-Care Difficulty
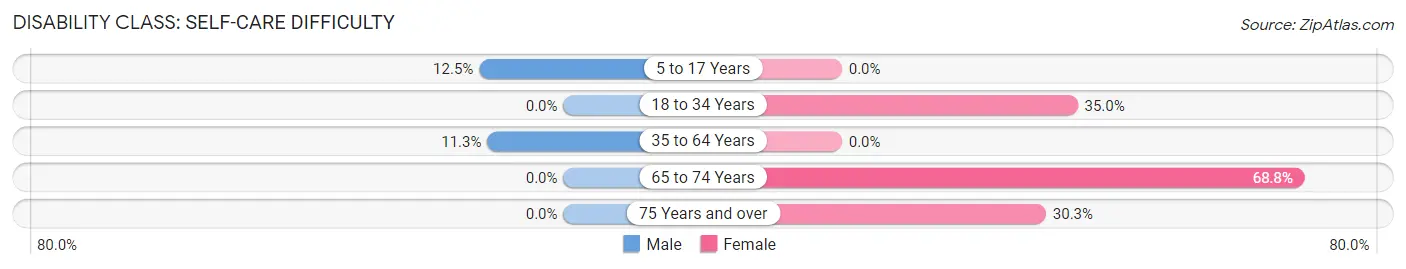
| Age Bracket | Male | Female |
| 5 to 17 Years | 9 (12.5%) | 0 (0.0%) |
| 18 to 34 Years | 0 (0.0%) | 7 (35.0%) |
| 35 to 64 Years | 7 (11.3%) | 0 (0.0%) |
| 65 to 74 Years | 0 (0.0%) | 11 (68.8%) |
| 75 Years and over | 0 (0.0%) | 10 (30.3%) |
Technology Access in Osyka
Computing Device Access in Osyka
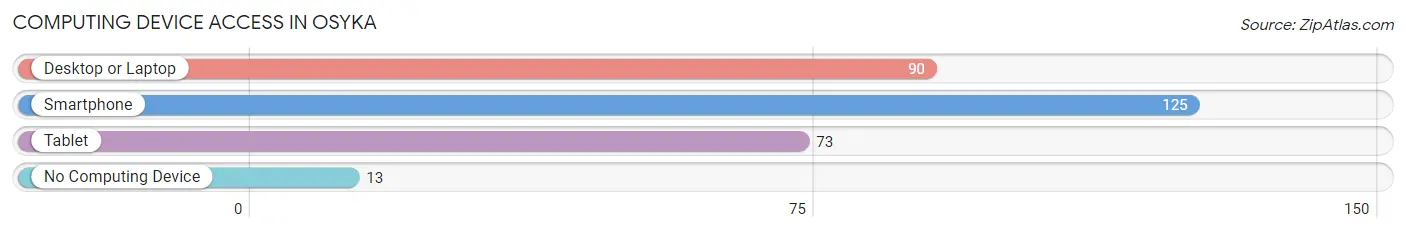
| Device Type | # Households | % Households |
| Desktop or Laptop | 90 | 59.6% |
| Smartphone | 125 | 82.8% |
| Tablet | 73 | 48.3% |
| No Computing Device | 13 | 8.6% |
| Total | 151 | 100.0% |
Internet Access in Osyka
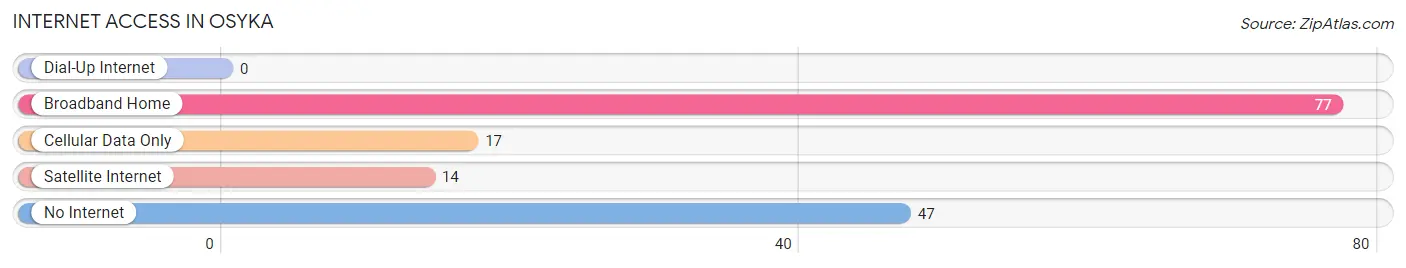
| Internet Type | # Households | % Households |
| Dial-Up Internet | 0 | 0.0% |
| Broadband Home | 77 | 51.0% |
| Cellular Data Only | 17 | 11.3% |
| Satellite Internet | 14 | 9.3% |
| No Internet | 47 | 31.1% |
| Total | 151 | 100.0% |
Osyka Summary
Osyka is a small town located in Pike County, Mississippi. It is situated in the southwestern part of the state, about 40 miles from the Louisiana border. The town has a population of approximately 1,000 people and is part of the McComb, Mississippi Metropolitan Statistical Area.
History
Osyka was founded in 1837 by a group of settlers from Georgia. The town was named after the Osyka Creek, which runs through the area. The creek was named after a Choctaw Indian chief who lived in the area. The town was originally a trading post and was known as Osyka Station.
In 1845, the town was incorporated and the first post office was established. The town grew slowly but steadily over the years, and by the late 19th century, it had become a thriving agricultural center. The town was also home to several sawmills and other businesses.
In the early 20th century, Osyka experienced a period of growth and prosperity. The town was home to several banks, a hotel, a movie theater, and a variety of other businesses. The town also had a thriving lumber industry, which provided jobs for many of the town's residents.
Geography
Osyka is located in southwestern Mississippi, about 40 miles from the Louisiana border. The town is situated in the rolling hills of the Piney Woods region of the state. The town is located near the Osyka Creek, which runs through the area. The town is also located near the Pearl River, which is a major tributary of the Mississippi River.
The climate in Osyka is humid subtropical, with hot, humid summers and mild winters. The average annual temperature is around 68 degrees Fahrenheit. The average annual precipitation is around 50 inches.
Economy
The economy of Osyka is largely based on agriculture. The town is home to several farms, which produce a variety of crops, including corn, soybeans, cotton, and wheat. The town is also home to several lumber mills, which provide jobs for many of the town's residents.
In addition to agriculture and lumber, Osyka is home to several small businesses, including restaurants, retail stores, and service providers. The town is also home to several manufacturing companies, which produce a variety of products, including furniture, clothing, and electronics.
Demographics
As of the 2010 census, the population of Osyka was 1,000. The racial makeup of the town was 95.2% White, 2.7% African American, 0.2% Native American, 0.2% Asian, and 1.7% from other races. The median household income was $31,250, and the median family income was $37,500.
The town is served by the Pike County School District, which includes two elementary schools, one middle school, and one high school. The town is also home to a branch of the University of Southern Mississippi.
Conclusion
Osyka is a small town located in Pike County, Mississippi. It is situated in the southwestern part of the state, about 40 miles from the Louisiana border. The town has a population of approximately 1,000 people and is part of the McComb, Mississippi Metropolitan Statistical Area. The economy of Osyka is largely based on agriculture, lumber, and small businesses. The town is served by the Pike County School District, which includes two elementary schools, one middle school, and one high school. The town is also home to a branch of the University of Southern Mississippi.
Common Questions
What is Per Capita Income in Osyka?
Per Capita income in Osyka is $13,974.
What is the Median Family Income in Osyka?
Median Family Income in Osyka is $58,661.
What is Income or Wage Gap in Osyka?
Income or Wage Gap in Osyka is 13.0%.
Women in Osyka earn 87.0 cents for every dollar earned by a man.
What is Inequality or Gini Index in Osyka?
Inequality or Gini Index in Osyka is 0.51.
What is the Total Population of Osyka?
Total Population of Osyka is 408.
What is the Total Male Population of Osyka?
Total Male Population of Osyka is 230.
What is the Total Female Population of Osyka?
Total Female Population of Osyka is 178.
What is the Ratio of Males per 100 Females in Osyka?
There are 129.21 Males per 100 Females in Osyka.
What is the Ratio of Females per 100 Males in Osyka?
There are 77.39 Females per 100 Males in Osyka.
What is the Median Population Age in Osyka?
Median Population Age in Osyka is 35.5 Years.
What is the Average Family Size in Osyka
Average Family Size in Osyka is 4.1 People.
What is the Average Household Size in Osyka
Average Household Size in Osyka is 2.7 People.
How Large is the Labor Force in Osyka?
There are 133 People in the Labor Forcein in Osyka.
What is the Percentage of People in the Labor Force in Osyka?
42.1% of People are in the Labor Force in Osyka.
What is the Unemployment Rate in Osyka?
Unemployment Rate in Osyka is 6.0%.