Centreville, MS Map & Demographics
Centreville Map
Centreville Overview
$22,546
PER CAPITA INCOME
$33,859
AVG FAMILY INCOME
$44,779
AVG HOUSEHOLD INCOME
37.7%
WAGE / INCOME GAP [ % ]
62.3¢/ $1
WAGE / INCOME GAP [ $ ]
$12,895
FAMILY INCOME DEFICIT
0.53
INEQUALITY / GINI INDEX
2,352
TOTAL POPULATION
1,054
MALE POPULATION
1,298
FEMALE POPULATION
81.20
MALES / 100 FEMALES
123.15
FEMALES / 100 MALES
29.5
MEDIAN AGE
3.5
AVG FAMILY SIZE
2.4
AVG HOUSEHOLD SIZE
735
LABOR FORCE [ PEOPLE ]
47.5%
PERCENT IN LABOR FORCE
1.0%
UNEMPLOYMENT RATE
Centreville Zip Codes
Centreville Area Codes
Income in Centreville
Income Overview in Centreville
Per Capita Income in Centreville is $22,546, while median incomes of families and households are $33,859 and $44,779 respectively.
| Characteristic | Number | Measure |
| Per Capita Income | 2,352 | $22,546 |
| Median Family Income | 522 | $33,859 |
| Mean Family Income | 522 | $65,077 |
| Median Household Income | 925 | $44,779 |
| Mean Household Income | 925 | $56,208 |
| Income Deficit | 522 | $12,895 |
| Wage / Income Gap (%) | 2,352 | 37.67% |
| Wage / Income Gap ($) | 2,352 | 62.33¢ per $1 |
| Gini / Inequality Index | 2,352 | 0.53 |
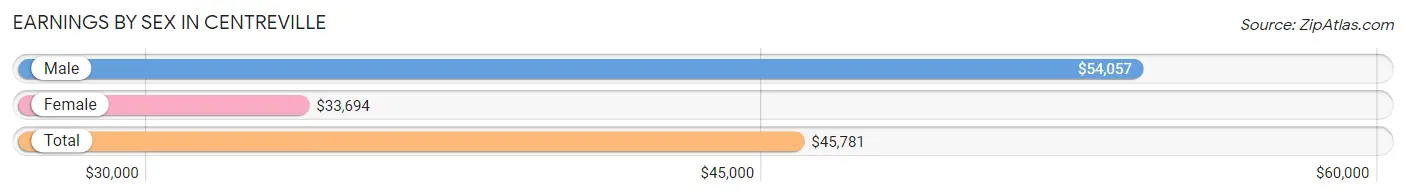
Earnings by Sex in Centreville
Average Earnings in Centreville are $45,781, $54,057 for men and $33,694 for women, a difference of 37.7%.
| Sex | Number | Average Earnings |
| Male | 316 (39.5%) | $54,057 |
| Female | 485 (60.6%) | $33,694 |
| Total | 801 (100.0%) | $45,781 |
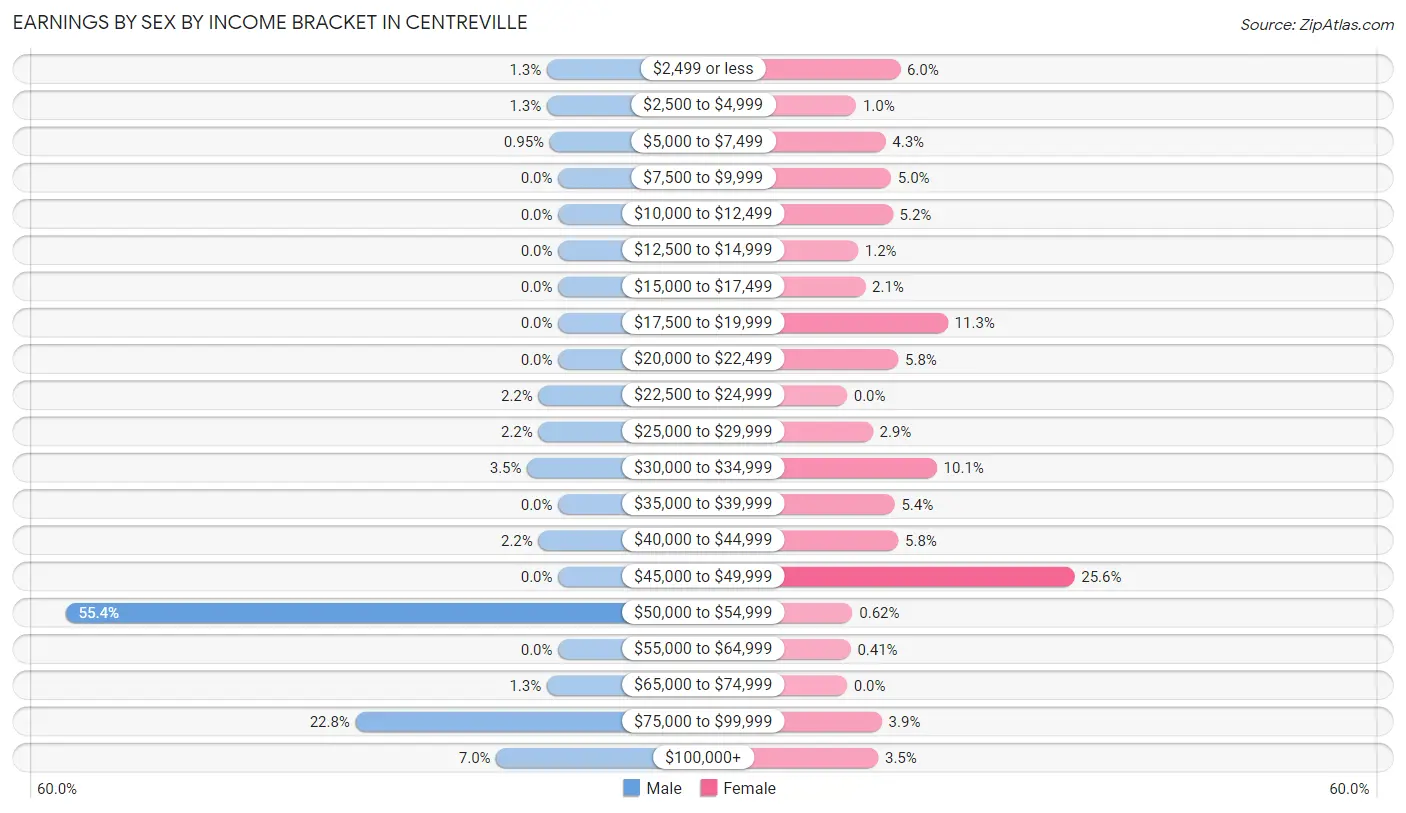
Earnings by Sex by Income Bracket in Centreville
The most common earnings brackets in Centreville are $50,000 to $54,999 for men (175 | 55.4%) and $45,000 to $49,999 for women (124 | 25.6%).
| Income | Male | Female |
| $2,499 or less | 4 (1.3%) | 29 (6.0%) |
| $2,500 to $4,999 | 4 (1.3%) | 5 (1.0%) |
| $5,000 to $7,499 | 3 (0.9%) | 21 (4.3%) |
| $7,500 to $9,999 | 0 (0.0%) | 24 (5.0%) |
| $10,000 to $12,499 | 0 (0.0%) | 25 (5.1%) |
| $12,500 to $14,999 | 0 (0.0%) | 6 (1.2%) |
| $15,000 to $17,499 | 0 (0.0%) | 10 (2.1%) |
| $17,500 to $19,999 | 0 (0.0%) | 55 (11.3%) |
| $20,000 to $22,499 | 0 (0.0%) | 28 (5.8%) |
| $22,500 to $24,999 | 7 (2.2%) | 0 (0.0%) |
| $25,000 to $29,999 | 7 (2.2%) | 14 (2.9%) |
| $30,000 to $34,999 | 11 (3.5%) | 49 (10.1%) |
| $35,000 to $39,999 | 0 (0.0%) | 26 (5.4%) |
| $40,000 to $44,999 | 7 (2.2%) | 28 (5.8%) |
| $45,000 to $49,999 | 0 (0.0%) | 124 (25.6%) |
| $50,000 to $54,999 | 175 (55.4%) | 3 (0.6%) |
| $55,000 to $64,999 | 0 (0.0%) | 2 (0.4%) |
| $65,000 to $74,999 | 4 (1.3%) | 0 (0.0%) |
| $75,000 to $99,999 | 72 (22.8%) | 19 (3.9%) |
| $100,000+ | 22 (7.0%) | 17 (3.5%) |
| Total | 316 (100.0%) | 485 (100.0%) |
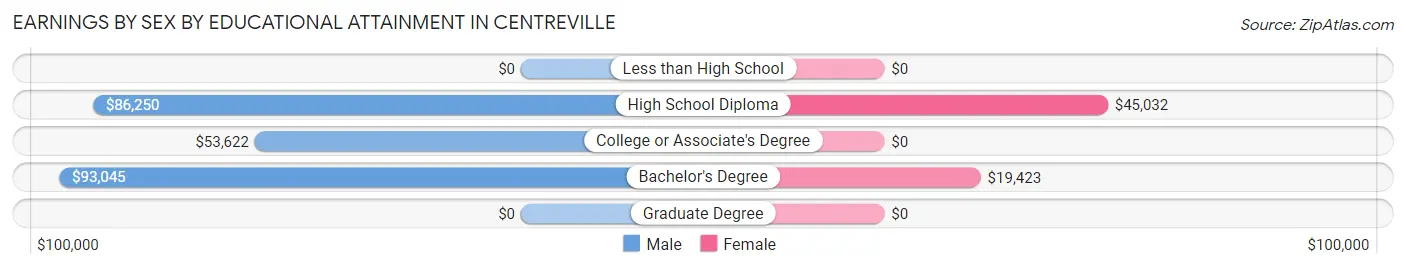
Earnings by Sex by Educational Attainment in Centreville
Average earnings in Centreville are $54,143 for men and $33,783 for women, a difference of 37.6%. Men with an educational attainment of bachelor's degree enjoy the highest average annual earnings of $93,045, while those with college or associate's degree education earn the least with $53,622. Women with an educational attainment of high school diploma earn the most with the average annual earnings of $45,032, while those with bachelor's degree education have the smallest earnings of $19,423.
| Educational Attainment | Male Income | Female Income |
| Less than High School | - | - |
| High School Diploma | $86,250 | $45,032 |
| College or Associate's Degree | $53,622 | $0 |
| Bachelor's Degree | $93,045 | $19,423 |
| Graduate Degree | - | - |
| Total | $54,143 | $33,783 |
Family Income in Centreville
Family Income Brackets in Centreville
According to the Centreville family income data, there are 140 families falling into the $35,000 to $49,999 income range, which is the most common income bracket and makes up 26.8% of all families. Conversely, the $50,000 to $74,999 income bracket is the least frequent group with only 12 families (2.3%) belonging to this category.
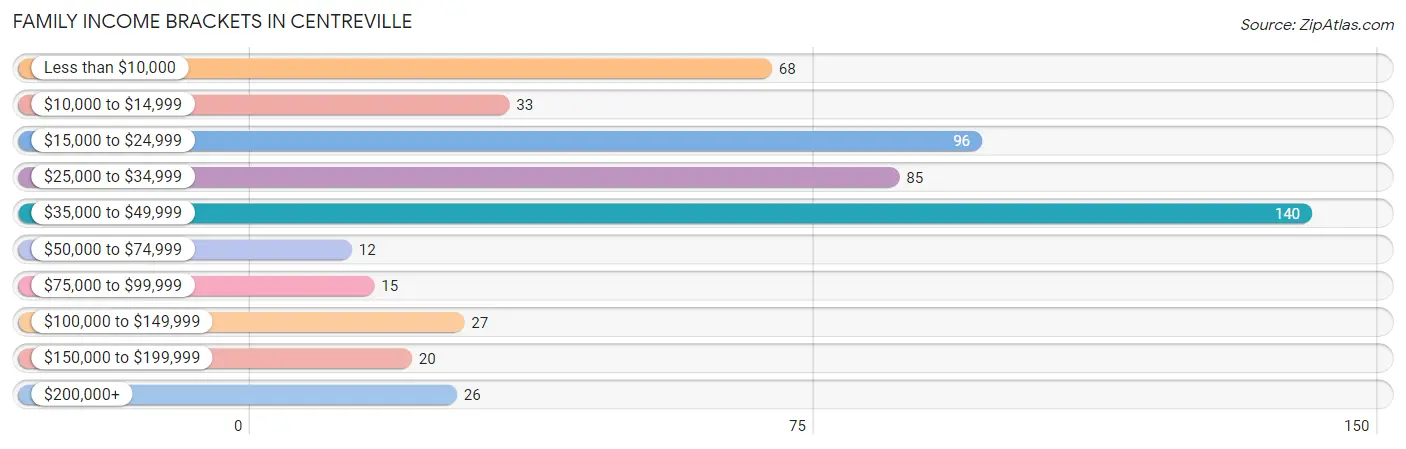
| Income Bracket | # Families | % Families |
| Less than $10,000 | 68 | 13.0% |
| $10,000 to $14,999 | 33 | 6.3% |
| $15,000 to $24,999 | 96 | 18.4% |
| $25,000 to $34,999 | 85 | 16.3% |
| $35,000 to $49,999 | 140 | 26.8% |
| $50,000 to $74,999 | 12 | 2.3% |
| $75,000 to $99,999 | 15 | 2.9% |
| $100,000 to $149,999 | 27 | 5.2% |
| $150,000 to $199,999 | 20 | 3.8% |
| $200,000+ | 26 | 5.0% |
Family Income by Famaliy Size in Centreville
4-person families (85 | 16.3%) account for the highest median family income in Centreville with $43,173 per family, while 3-person families (258 | 49.4%) have the highest median income of $11,272 per family member.
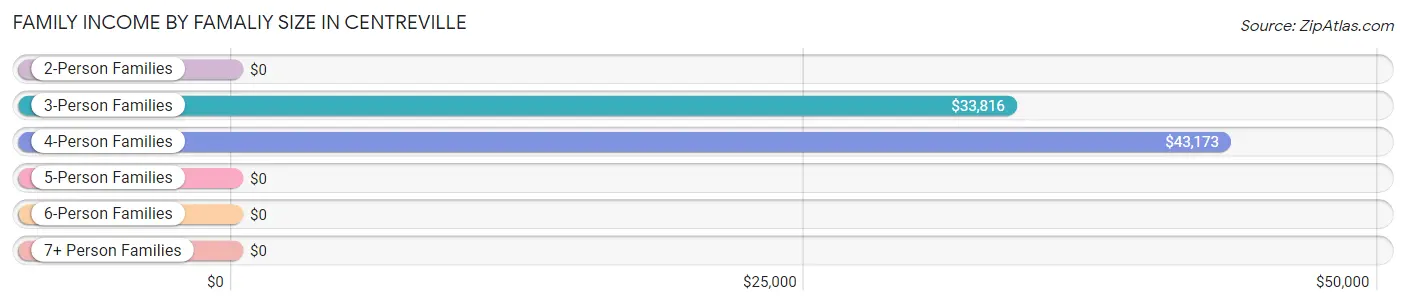
| Income Bracket | # Families | Median Income |
| 2-Person Families | 140 (26.8%) | $0 |
| 3-Person Families | 258 (49.4%) | $33,816 |
| 4-Person Families | 85 (16.3%) | $43,173 |
| 5-Person Families | 25 (4.8%) | $0 |
| 6-Person Families | 5 (1.0%) | $0 |
| 7+ Person Families | 9 (1.7%) | $0 |
| Total | 522 (100.0%) | $33,859 |
Family Income by Number of Earners in Centreville
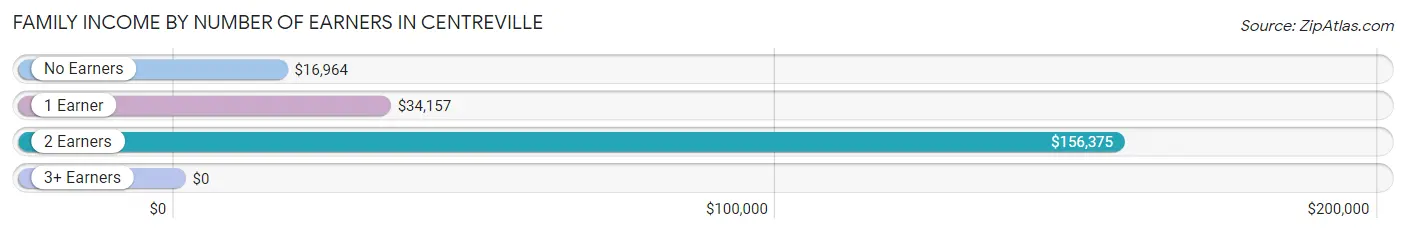
| Number of Earners | # Families | Median Income |
| No Earners | 108 (20.7%) | $16,964 |
| 1 Earner | 325 (62.3%) | $34,157 |
| 2 Earners | 81 (15.5%) | $156,375 |
| 3+ Earners | 8 (1.5%) | $0 |
| Total | 522 (100.0%) | $33,859 |
Household Income in Centreville
Household Income Brackets in Centreville
With 193 households falling in the category, the $50,000 to $74,999 income range is the most frequent in Centreville, accounting for 20.9% of all households. In contrast, only 20 households (2.2%) fall into the $150,000 to $199,999 income bracket, making it the least populous group.
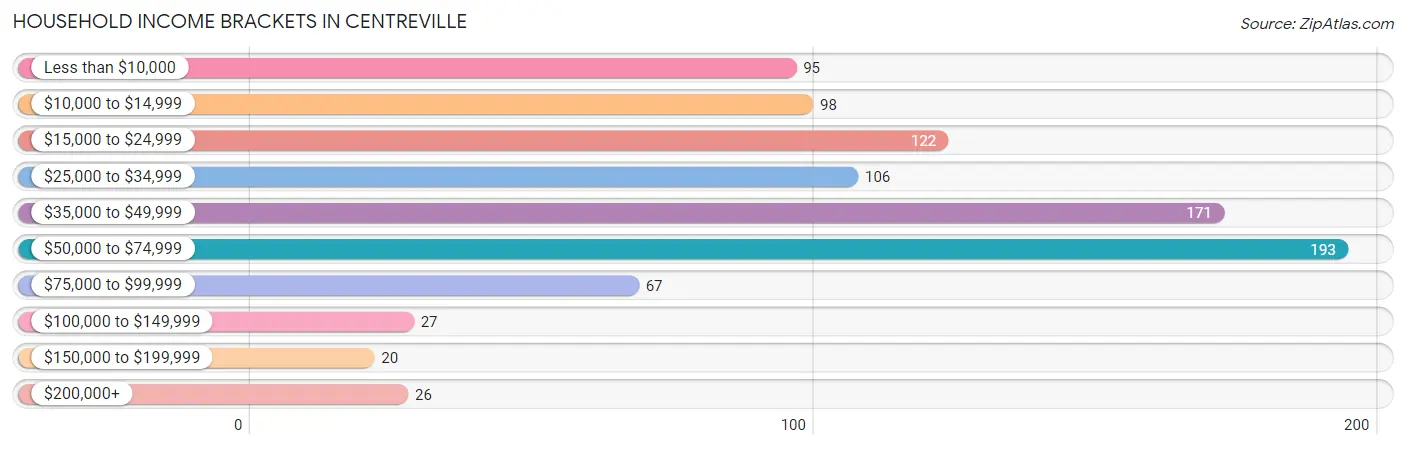
| Income Bracket | # Households | % Households |
| Less than $10,000 | 95 | 10.3% |
| $10,000 to $14,999 | 98 | 10.6% |
| $15,000 to $24,999 | 122 | 13.2% |
| $25,000 to $34,999 | 106 | 11.5% |
| $35,000 to $49,999 | 171 | 18.5% |
| $50,000 to $74,999 | 193 | 20.9% |
| $75,000 to $99,999 | 67 | 7.2% |
| $100,000 to $149,999 | 27 | 2.9% |
| $150,000 to $199,999 | 20 | 2.2% |
| $200,000+ | 26 | 2.8% |
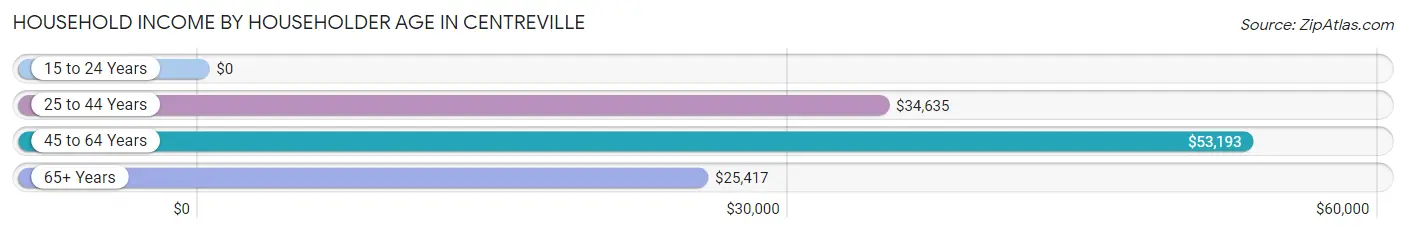
Household Income by Householder Age in Centreville
The median household income in Centreville is $44,779, with the highest median household income of $53,193 found in the 45 to 64 years age bracket for the primary householder. A total of 408 households (44.1%) fall into this category.
| Income Bracket | # Households | Median Income |
| 15 to 24 Years | 0 (0.0%) | $0 |
| 25 to 44 Years | 353 (38.2%) | $34,635 |
| 45 to 64 Years | 408 (44.1%) | $53,193 |
| 65+ Years | 164 (17.7%) | $25,417 |
| Total | 925 (100.0%) | $44,779 |
Poverty in Centreville
Income Below Poverty by Sex and Age in Centreville
With 18.1% poverty level for males and 50.0% for females among the residents of Centreville, 5 year old males and under 5 year old females are the most vulnerable to poverty, with 14 males (100.0%) and 93 females (93.9%) in their respective age groups living below the poverty level.
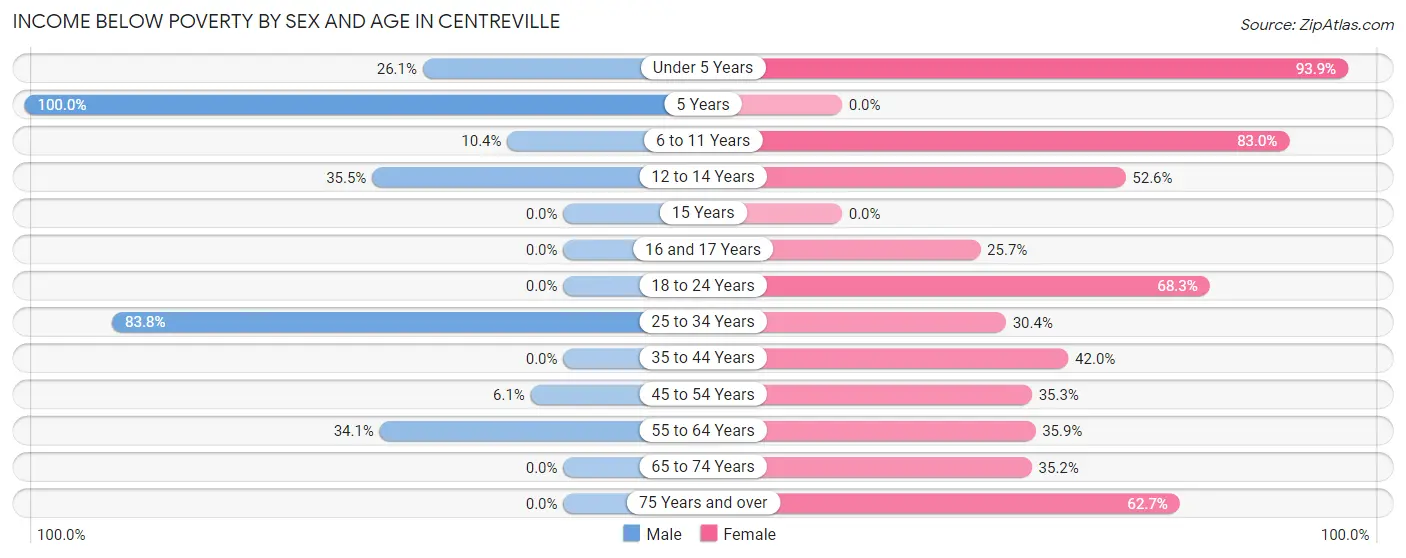
| Age Bracket | Male | Female |
| Under 5 Years | 36 (26.1%) | 93 (93.9%) |
| 5 Years | 14 (100.0%) | 0 (0.0%) |
| 6 to 11 Years | 24 (10.4%) | 142 (83.0%) |
| 12 to 14 Years | 11 (35.5%) | 50 (52.6%) |
| 15 Years | 0 (0.0%) | 0 (0.0%) |
| 16 and 17 Years | 0 (0.0%) | 19 (25.7%) |
| 18 to 24 Years | 0 (0.0%) | 43 (68.2%) |
| 25 to 34 Years | 67 (83.8%) | 77 (30.4%) |
| 35 to 44 Years | 0 (0.0%) | 50 (42.0%) |
| 45 to 54 Years | 16 (6.1%) | 49 (35.2%) |
| 55 to 64 Years | 15 (34.1%) | 28 (35.9%) |
| 65 to 74 Years | 0 (0.0%) | 31 (35.2%) |
| 75 Years and over | 0 (0.0%) | 37 (62.7%) |
| Total | 183 (18.1%) | 619 (50.0%) |
Income Above Poverty by Sex and Age in Centreville
According to the poverty statistics in Centreville, males aged 15 years and females aged 16 and 17 years are the age groups that are most secure financially, with 100.0% of males and 74.3% of females in these age groups living above the poverty line.
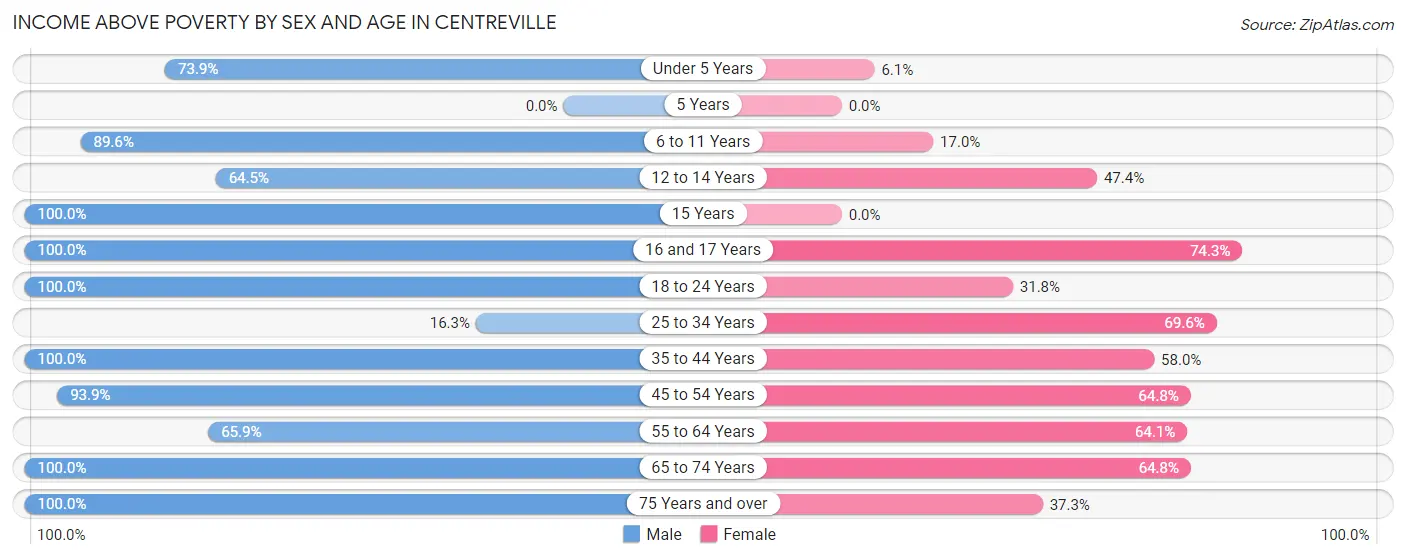
| Age Bracket | Male | Female |
| Under 5 Years | 102 (73.9%) | 6 (6.1%) |
| 5 Years | 0 (0.0%) | 0 (0.0%) |
| 6 to 11 Years | 207 (89.6%) | 29 (17.0%) |
| 12 to 14 Years | 20 (64.5%) | 45 (47.4%) |
| 15 Years | 26 (100.0%) | 0 (0.0%) |
| 16 and 17 Years | 46 (100.0%) | 55 (74.3%) |
| 18 to 24 Years | 36 (100.0%) | 20 (31.8%) |
| 25 to 34 Years | 13 (16.3%) | 176 (69.6%) |
| 35 to 44 Years | 21 (100.0%) | 69 (58.0%) |
| 45 to 54 Years | 248 (93.9%) | 90 (64.7%) |
| 55 to 64 Years | 29 (65.9%) | 50 (64.1%) |
| 65 to 74 Years | 39 (100.0%) | 57 (64.8%) |
| 75 Years and over | 42 (100.0%) | 22 (37.3%) |
| Total | 829 (81.9%) | 619 (50.0%) |
Income Below Poverty Among Married-Couple Families in Centreville
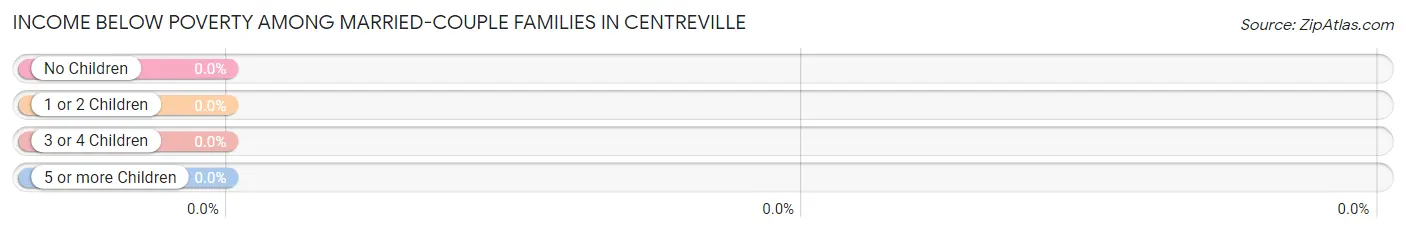
| Children | Above Poverty | Below Poverty |
| No Children | 68 (100.0%) | 0 (0.0%) |
| 1 or 2 Children | 49 (100.0%) | 0 (0.0%) |
| 3 or 4 Children | 5 (100.0%) | 0 (0.0%) |
| 5 or more Children | 0 (0.0%) | 0 (0.0%) |
| Total | 122 (100.0%) | 0 (0.0%) |
Income Below Poverty Among Single-Parent Households in Centreville
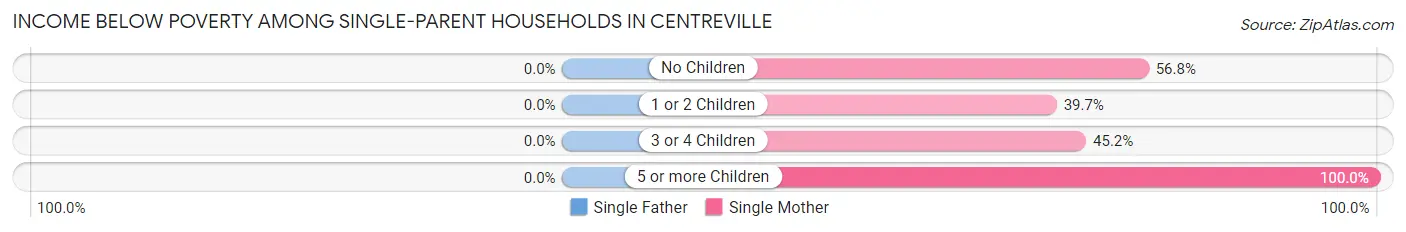
| Children | Single Father | Single Mother |
| No Children | 0 (0.0%) | 25 (56.8%) |
| 1 or 2 Children | 0 (0.0%) | 123 (39.7%) |
| 3 or 4 Children | 0 (0.0%) | 14 (45.2%) |
| 5 or more Children | 0 (0.0%) | 9 (100.0%) |
| Total | 0 (0.0%) | 171 (43.4%) |
Income Below Poverty Among Married-Couple vs Single-Parent Households in Centreville
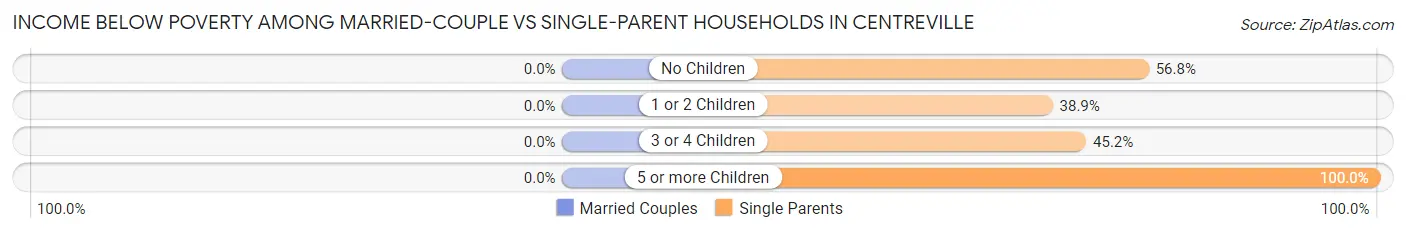
| Children | Married-Couple Families | Single-Parent Households |
| No Children | 0 (0.0%) | 25 (56.8%) |
| 1 or 2 Children | 0 (0.0%) | 123 (38.9%) |
| 3 or 4 Children | 0 (0.0%) | 14 (45.2%) |
| 5 or more Children | 0 (0.0%) | 9 (100.0%) |
| Total | 0 (0.0%) | 171 (42.7%) |
Race in Centreville
The most populous races in Centreville are Black / African American (1,693 | 72.0%), White / Caucasian (440 | 18.7%), and Some other Race (177 | 7.5%).
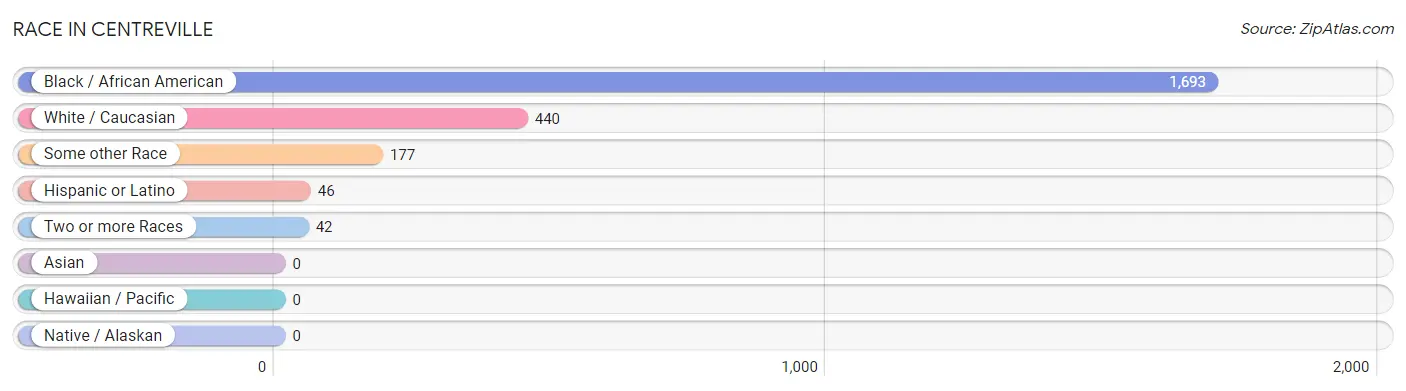
| Race | # Population | % Population |
| Asian | 0 | 0.0% |
| Black / African American | 1,693 | 72.0% |
| Hawaiian / Pacific | 0 | 0.0% |
| Hispanic or Latino | 46 | 2.0% |
| Native / Alaskan | 0 | 0.0% |
| White / Caucasian | 440 | 18.7% |
| Two or more Races | 42 | 1.8% |
| Some other Race | 177 | 7.5% |
| Total | 2,352 | 100.0% |
Ancestry in Centreville
The most populous ancestries reported in Centreville are American (236 | 10.0%), German (112 | 4.8%), Irish (105 | 4.5%), English (66 | 2.8%), and Italian (30 | 1.3%), together accounting for 23.3% of all Centreville residents.
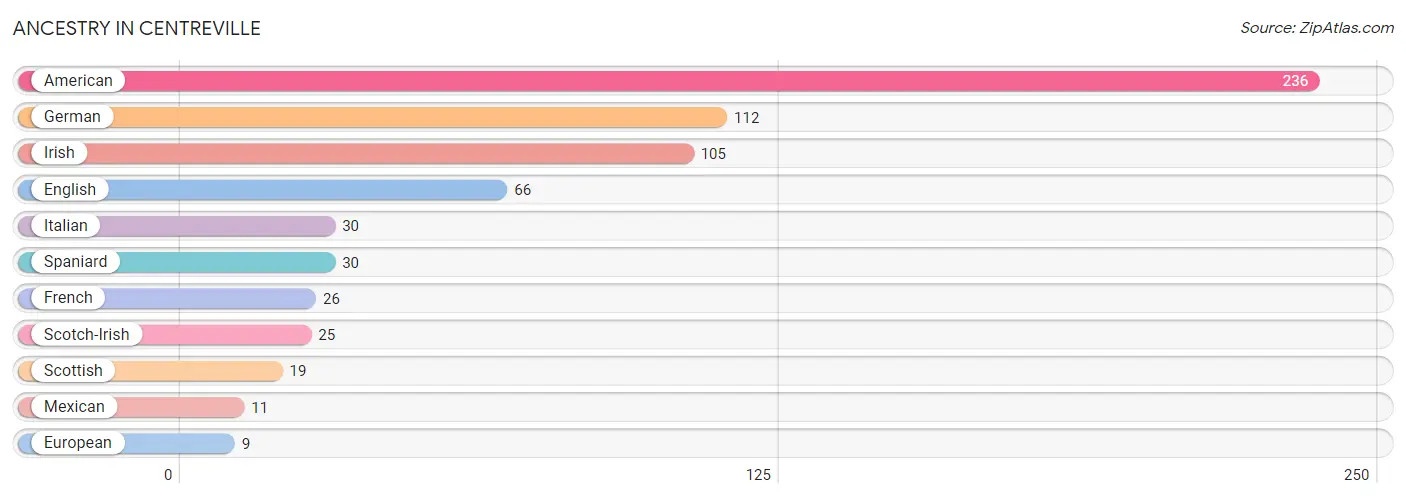
| Ancestry | # Population | % Population |
| American | 236 | 10.0% |
| English | 66 | 2.8% |
| European | 9 | 0.4% |
| French | 26 | 1.1% |
| German | 112 | 4.8% |
| Irish | 105 | 4.5% |
| Italian | 30 | 1.3% |
| Mexican | 11 | 0.5% |
| Scotch-Irish | 25 | 1.1% |
| Scottish | 19 | 0.8% |
| Spaniard | 30 | 1.3% | View All 11 Rows |
Immigrants in Centreville

| Immigration Origin | # Population | % Population | View All 0 Rows |
Sex and Age in Centreville
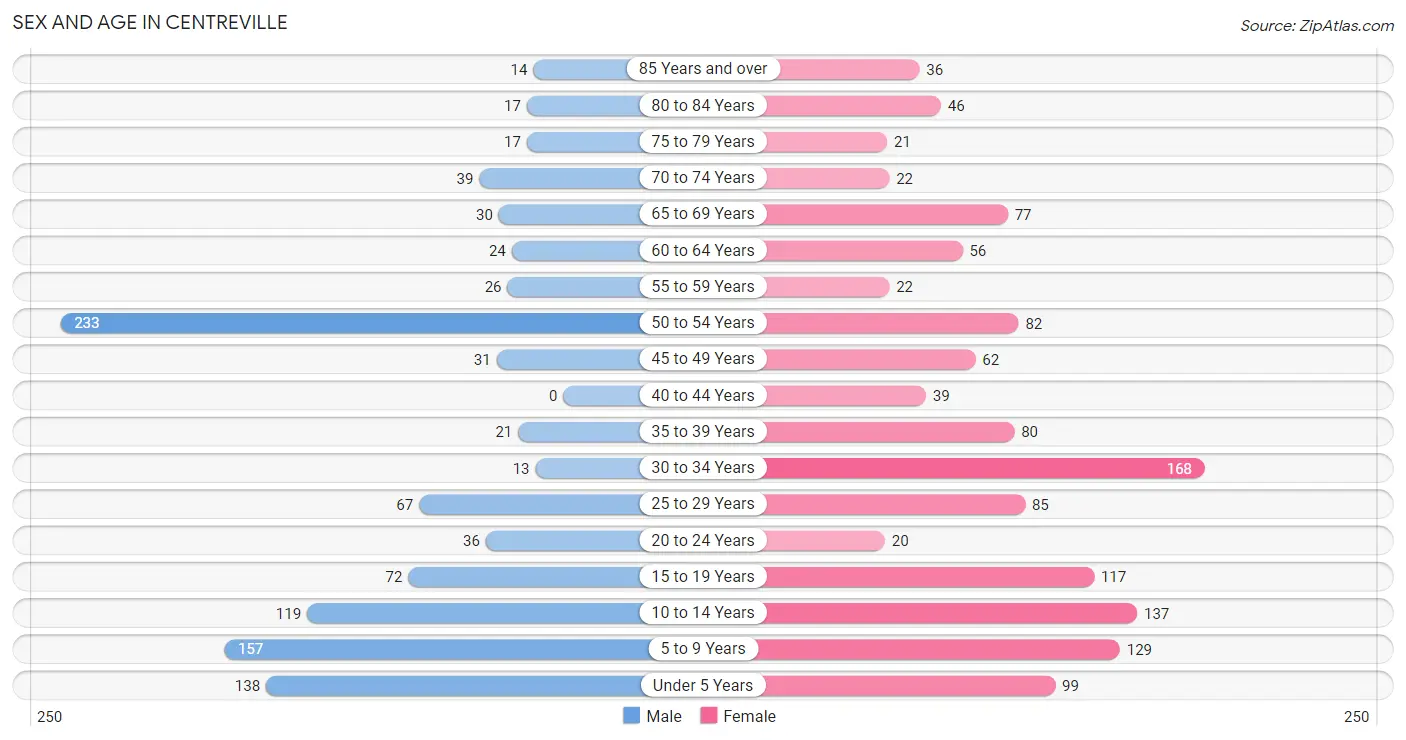
Sex and Age in Centreville
The most populous age groups in Centreville are 50 to 54 Years (233 | 22.1%) for men and 30 to 34 Years (168 | 12.9%) for women.
| Age Bracket | Male | Female |
| Under 5 Years | 138 (13.1%) | 99 (7.6%) |
| 5 to 9 Years | 157 (14.9%) | 129 (9.9%) |
| 10 to 14 Years | 119 (11.3%) | 137 (10.5%) |
| 15 to 19 Years | 72 (6.8%) | 117 (9.0%) |
| 20 to 24 Years | 36 (3.4%) | 20 (1.5%) |
| 25 to 29 Years | 67 (6.4%) | 85 (6.6%) |
| 30 to 34 Years | 13 (1.2%) | 168 (12.9%) |
| 35 to 39 Years | 21 (2.0%) | 80 (6.2%) |
| 40 to 44 Years | 0 (0.0%) | 39 (3.0%) |
| 45 to 49 Years | 31 (2.9%) | 62 (4.8%) |
| 50 to 54 Years | 233 (22.1%) | 82 (6.3%) |
| 55 to 59 Years | 26 (2.5%) | 22 (1.7%) |
| 60 to 64 Years | 24 (2.3%) | 56 (4.3%) |
| 65 to 69 Years | 30 (2.9%) | 77 (5.9%) |
| 70 to 74 Years | 39 (3.7%) | 22 (1.7%) |
| 75 to 79 Years | 17 (1.6%) | 21 (1.6%) |
| 80 to 84 Years | 17 (1.6%) | 46 (3.5%) |
| 85 Years and over | 14 (1.3%) | 36 (2.8%) |
| Total | 1,054 (100.0%) | 1,298 (100.0%) |
Families and Households in Centreville
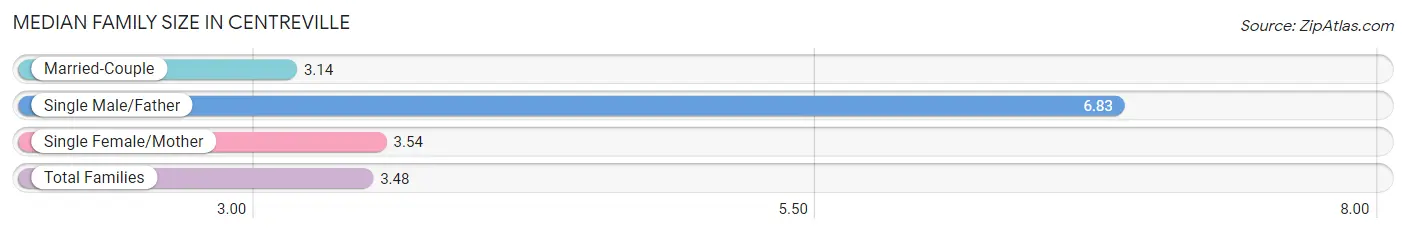
Median Family Size in Centreville
The median family size in Centreville is 3.48 persons per family, with single male/father families (6 | 1.1%) accounting for the largest median family size of 6.83 persons per family. On the other hand, married-couple families (122 | 23.4%) represent the smallest median family size with 3.14 persons per family.
| Family Type | # Families | Family Size |
| Married-Couple | 122 (23.4%) | 3.14 |
| Single Male/Father | 6 (1.1%) | 6.83 |
| Single Female/Mother | 394 (75.5%) | 3.54 |
| Total Families | 522 (100.0%) | 3.48 |
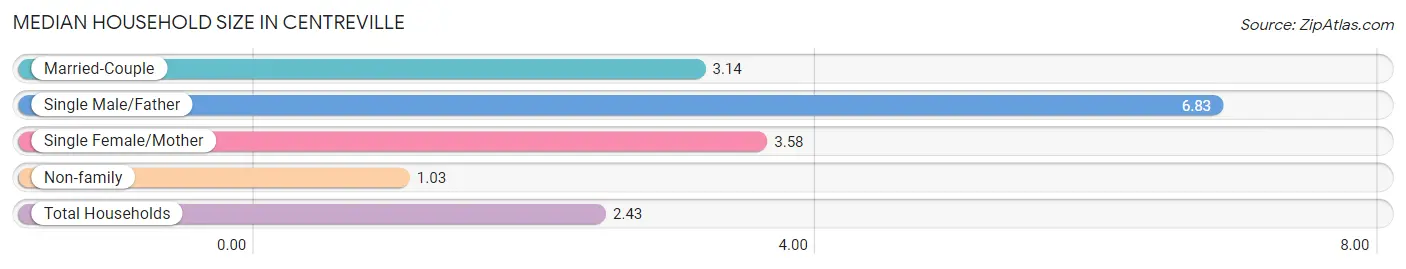
Median Household Size in Centreville
The median household size in Centreville is 2.43 persons per household, with single male/father households (6 | 0.6%) accounting for the largest median household size of 6.83 persons per household. non-family households (403 | 43.6%) represent the smallest median household size with 1.03 persons per household.
| Household Type | # Households | Household Size |
| Married-Couple | 122 (13.2%) | 3.14 |
| Single Male/Father | 6 (0.6%) | 6.83 |
| Single Female/Mother | 394 (42.6%) | 3.58 |
| Non-family | 403 (43.6%) | 1.03 |
| Total Households | 925 (100.0%) | 2.43 |
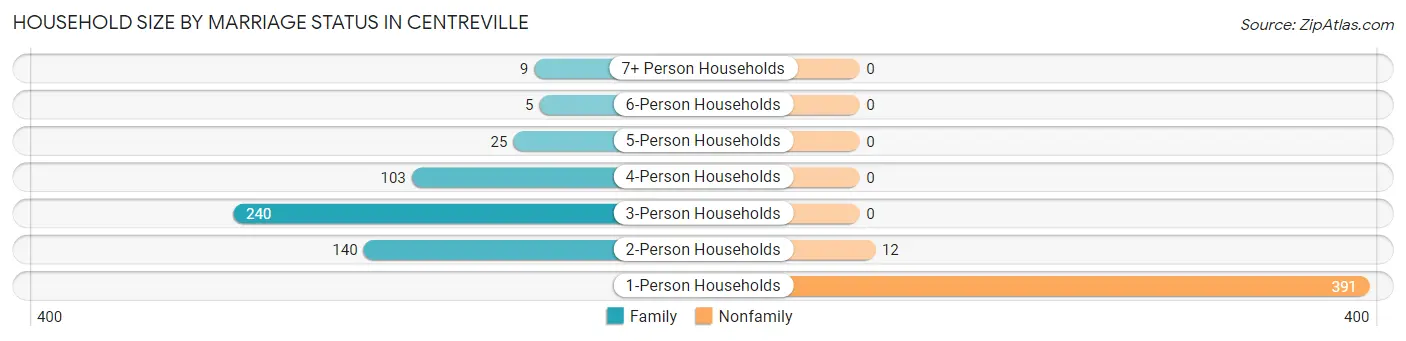
Household Size by Marriage Status in Centreville
Out of a total of 925 households in Centreville, 522 (56.4%) are family households, while 403 (43.6%) are nonfamily households. The most numerous type of family households are 3-person households, comprising 240, and the most common type of nonfamily households are 1-person households, comprising 391.
| Household Size | Family Households | Nonfamily Households |
| 1-Person Households | - | 391 (42.3%) |
| 2-Person Households | 140 (15.1%) | 12 (1.3%) |
| 3-Person Households | 240 (26.0%) | 0 (0.0%) |
| 4-Person Households | 103 (11.1%) | 0 (0.0%) |
| 5-Person Households | 25 (2.7%) | 0 (0.0%) |
| 6-Person Households | 5 (0.5%) | 0 (0.0%) |
| 7+ Person Households | 9 (1.0%) | 0 (0.0%) |
| Total | 522 (56.4%) | 403 (43.6%) |
Female Fertility in Centreville
Fertility by Age in Centreville
Average fertility rate in Centreville is 52.0 births per 1,000 women. Women in the age bracket of 20 to 34 years have the highest fertility rate with 110.0 births per 1,000 women. Women in the age bracket of 20 to 34 years acount for 100.0% of all women with births.
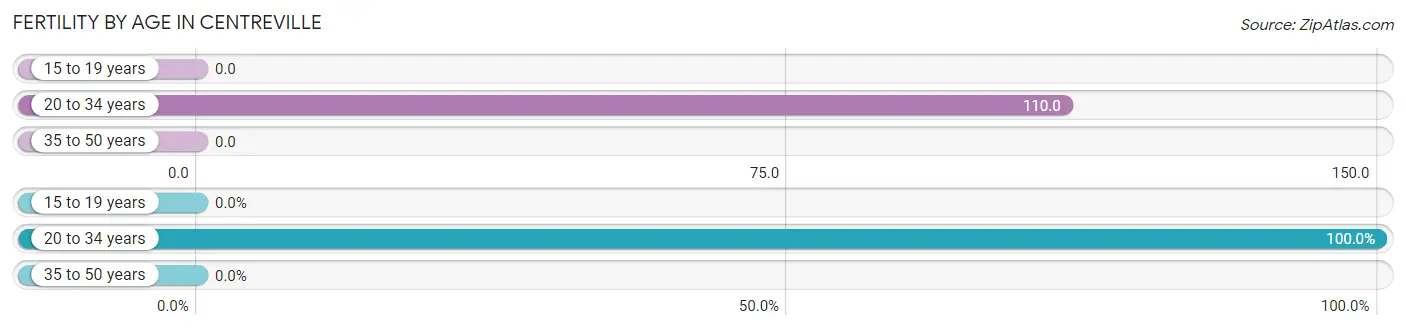
| Age Bracket | Women with Births | Births / 1,000 Women |
| 15 to 19 years | 0 (0.0%) | 0.0 |
| 20 to 34 years | 30 (100.0%) | 110.0 |
| 35 to 50 years | 0 (0.0%) | 0.0 |
| Total | 30 (100.0%) | 52.0 |
Fertility by Age by Marriage Status in Centreville
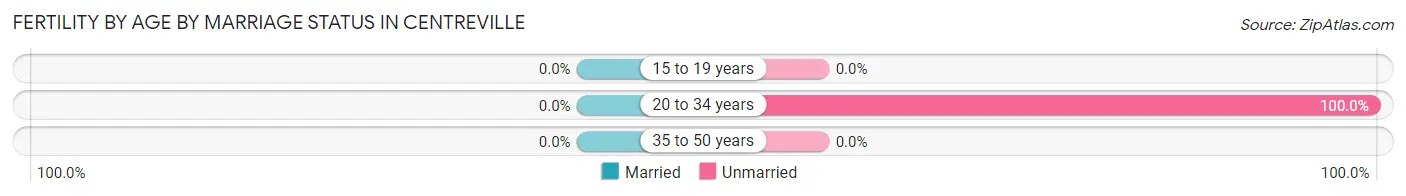
| Age Bracket | Married | Unmarried |
| 15 to 19 years | 0 (0.0%) | 0 (0.0%) |
| 20 to 34 years | 0 (0.0%) | 30 (100.0%) |
| 35 to 50 years | 0 (0.0%) | 0 (0.0%) |
| Total | 0 (0.0%) | 30 (100.0%) |
Fertility by Education in Centreville
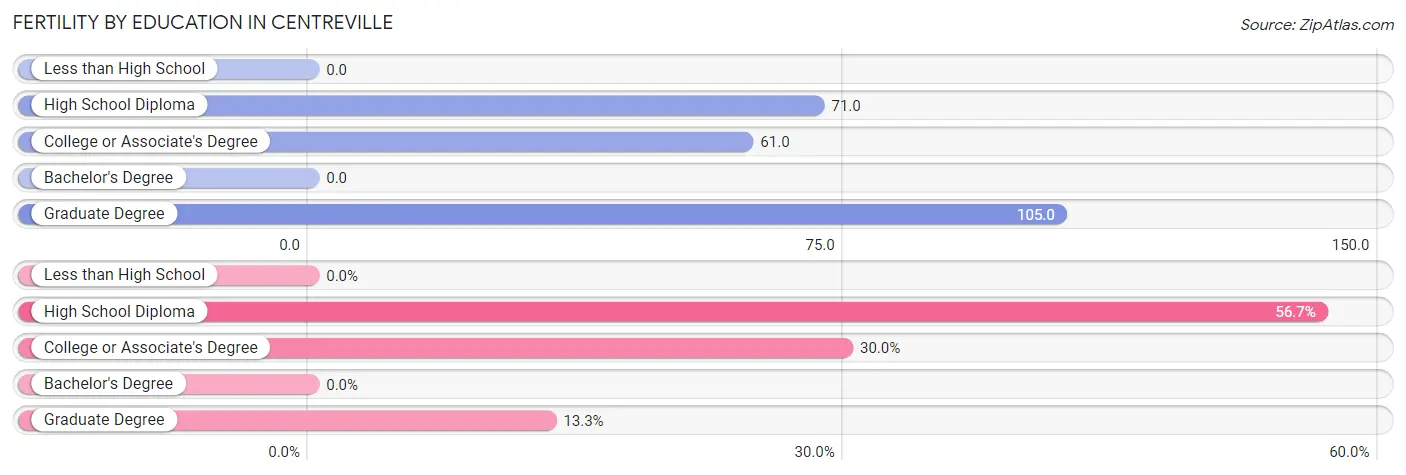
| Educational Attainment | Women with Births | Births / 1,000 Women |
| Less than High School | 0 (0.0%) | 0.0 |
| High School Diploma | 17 (56.7%) | 71.0 |
| College or Associate's Degree | 9 (30.0%) | 61.0 |
| Bachelor's Degree | 0 (0.0%) | 0.0 |
| Graduate Degree | 4 (13.3%) | 105.0 |
| Total | 30 (100.0%) | 52.0 |
Fertility by Education by Marriage Status in Centreville
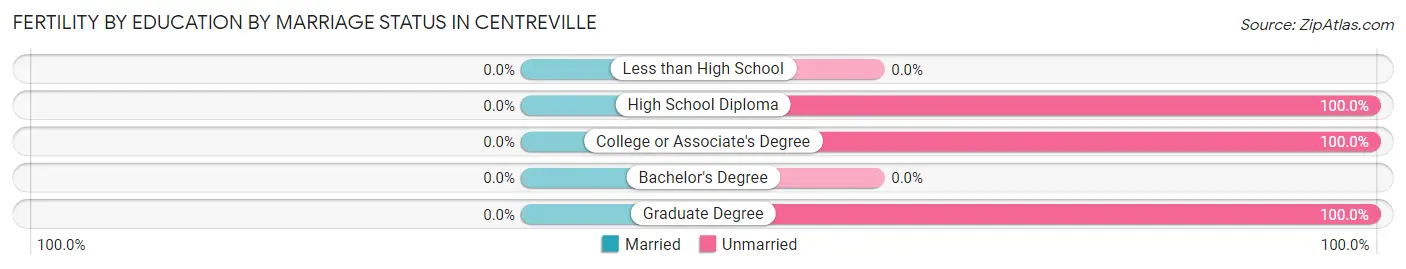
| Educational Attainment | Married | Unmarried |
| Less than High School | 0 (0.0%) | 0 (0.0%) |
| High School Diploma | 0 (0.0%) | 17 (100.0%) |
| College or Associate's Degree | 0 (0.0%) | 9 (100.0%) |
| Bachelor's Degree | 0 (0.0%) | 0 (0.0%) |
| Graduate Degree | 0 (0.0%) | 4 (100.0%) |
| Total | 0 (0.0%) | 30 (100.0%) |
Employment Characteristics in Centreville
Employment by Class of Employer in Centreville
Among the 724 employed individuals in Centreville, private company employees (455 | 62.8%), state government employees (95 | 13.1%), and local government employees (57 | 7.9%) make up the most common classes of employment.
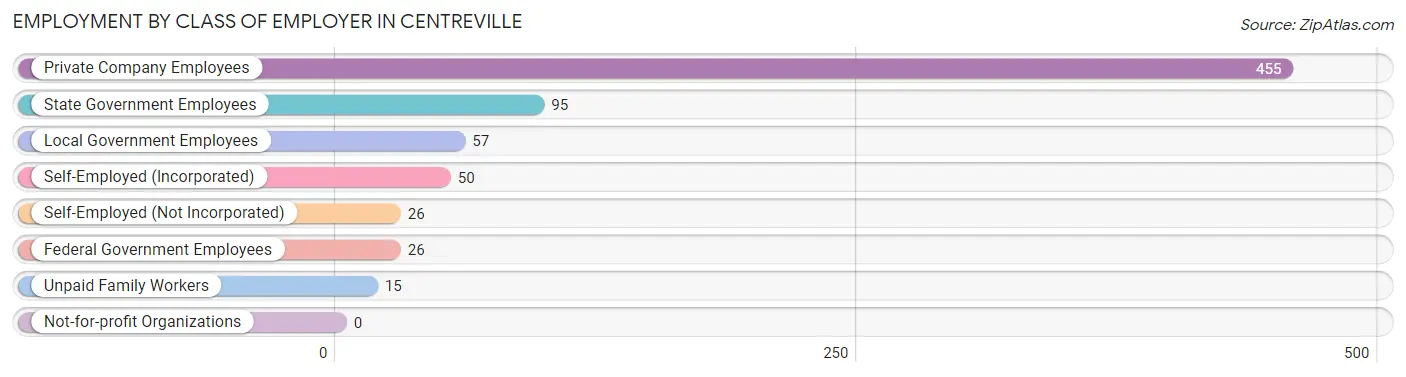
| Employer Class | # Employees | % Employees |
| Private Company Employees | 455 | 62.8% |
| Self-Employed (Incorporated) | 50 | 6.9% |
| Self-Employed (Not Incorporated) | 26 | 3.6% |
| Not-for-profit Organizations | 0 | 0.0% |
| Local Government Employees | 57 | 7.9% |
| State Government Employees | 95 | 13.1% |
| Federal Government Employees | 26 | 3.6% |
| Unpaid Family Workers | 15 | 2.1% |
| Total | 724 | 100.0% |
Employment Status by Age in Centreville
According to the labor force statistics for Centreville, out of the total population over 16 years of age (1,547), 47.5% or 735 individuals are in the labor force, with 1.0% or 7 of them unemployed. The age group with the highest labor force participation rate is 30 to 34 years, with 95.0% or 172 individuals in the labor force. Within the labor force, the 20 to 24 years age range has the highest percentage of unemployed individuals, with 19.0% or 4 of them being unemployed.
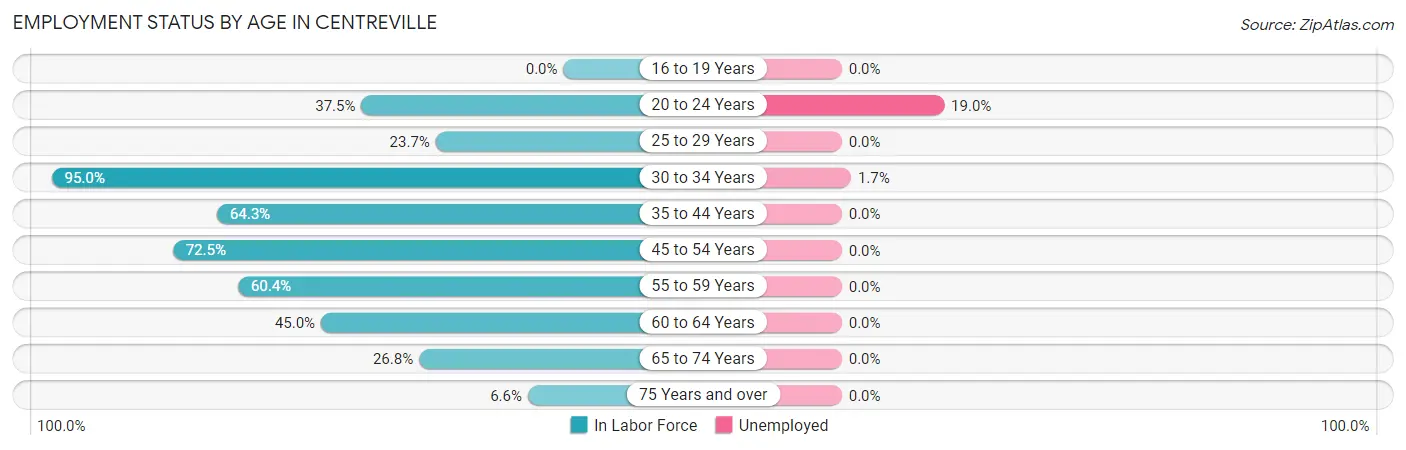
| Age Bracket | In Labor Force | Unemployed |
| 16 to 19 Years | 0 (0.0%) | 0 (0.0%) |
| 20 to 24 Years | 21 (37.5%) | 4 (19.0%) |
| 25 to 29 Years | 36 (23.7%) | 0 (0.0%) |
| 30 to 34 Years | 172 (95.0%) | 3 (1.7%) |
| 35 to 44 Years | 90 (64.3%) | 0 (0.0%) |
| 45 to 54 Years | 296 (72.5%) | 0 (0.0%) |
| 55 to 59 Years | 29 (60.4%) | 0 (0.0%) |
| 60 to 64 Years | 36 (45.0%) | 0 (0.0%) |
| 65 to 74 Years | 45 (26.8%) | 0 (0.0%) |
| 75 Years and over | 10 (6.6%) | 0 (0.0%) |
| Total | 735 (47.5%) | 7 (1.0%) |
Employment Status by Educational Attainment in Centreville
According to labor force statistics for Centreville, 65.3% of individuals (659) out of the total population between 25 and 64 years of age (1,009) are in the labor force, with 0.5% or 3 of them being unemployed. The group with the highest labor force participation rate are those with the educational attainment of bachelor's degree or higher, with 90.6% or 126 individuals in the labor force. Within the labor force, individuals with college / associate degree education have the highest percentage of unemployment, with 1.0% or 3 of them being unemployed.
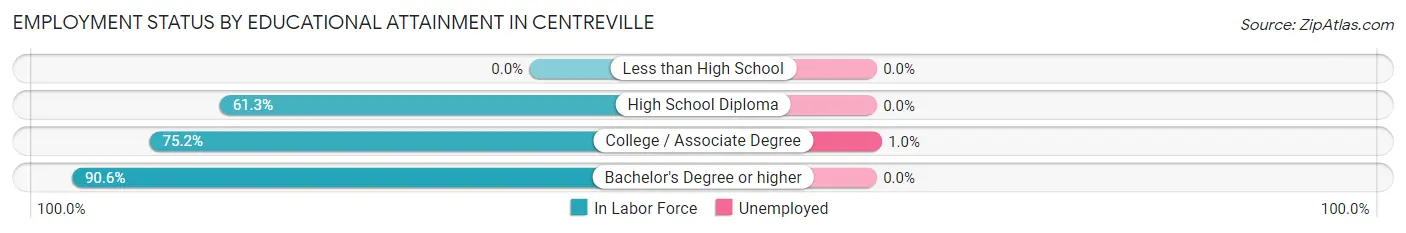
| Educational Attainment | In Labor Force | Unemployed |
| Less than High School | 0 (0.0%) | 0 (0.0%) |
| High School Diploma | 233 (61.3%) | 0 (0.0%) |
| College / Associate Degree | 300 (75.2%) | 4 (1.0%) |
| Bachelor's Degree or higher | 126 (90.6%) | 0 (0.0%) |
| Total | 659 (65.3%) | 5 (0.5%) |
Employment Occupations by Sex in Centreville
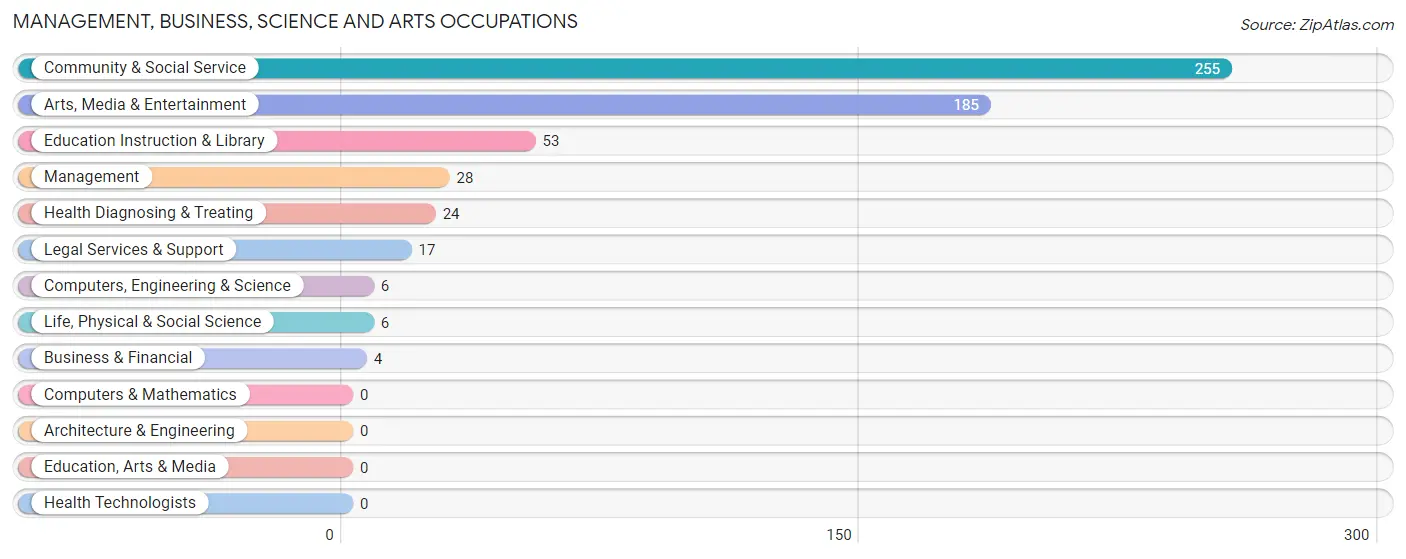
Management, Business, Science and Arts Occupations
The most common Management, Business, Science and Arts occupations in Centreville are Community & Social Service (255 | 35.0%), Arts, Media & Entertainment (185 | 25.4%), Education Instruction & Library (53 | 7.3%), Management (28 | 3.8%), and Health Diagnosing & Treating (24 | 3.3%).
Management, Business, Science and Arts Occupations by Sex
Within the Management, Business, Science and Arts occupations in Centreville, the most male-oriented occupations are Business & Financial (100.0%), Arts, Media & Entertainment (100.0%), and Management (78.6%), while the most female-oriented occupations are Legal Services & Support (100.0%), Education Instruction & Library (100.0%), and Health Diagnosing & Treating (100.0%).
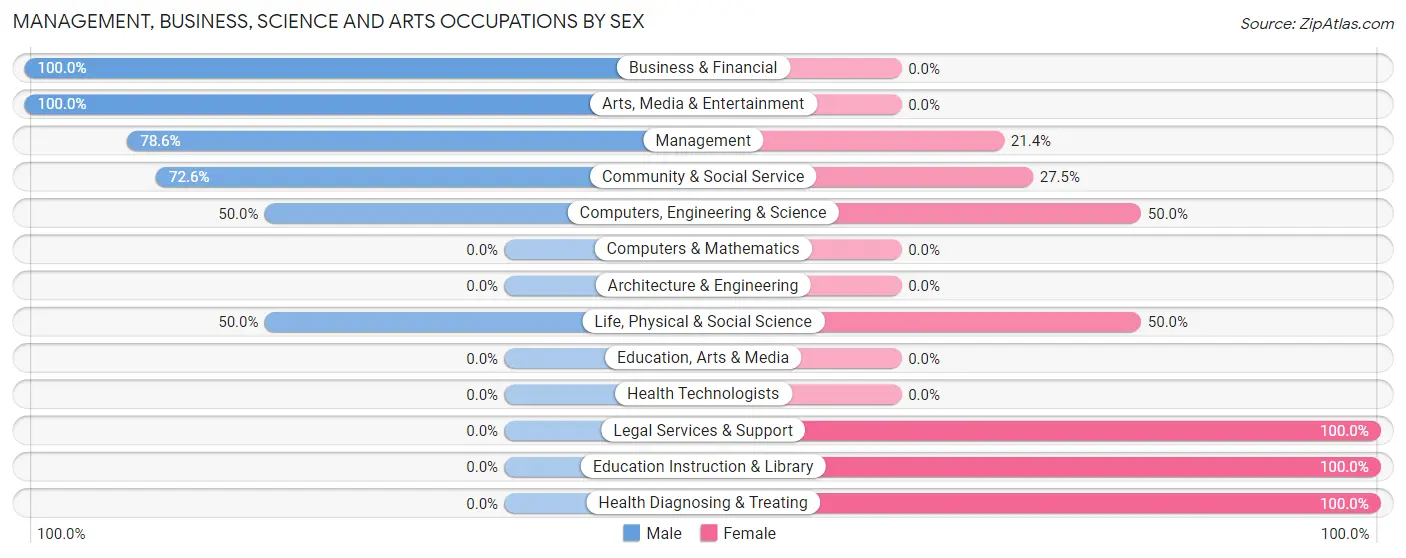
| Occupation | Male | Female |
| Management | 22 (78.6%) | 6 (21.4%) |
| Business & Financial | 4 (100.0%) | 0 (0.0%) |
| Computers, Engineering & Science | 3 (50.0%) | 3 (50.0%) |
| Computers & Mathematics | 0 (0.0%) | 0 (0.0%) |
| Architecture & Engineering | 0 (0.0%) | 0 (0.0%) |
| Life, Physical & Social Science | 3 (50.0%) | 3 (50.0%) |
| Community & Social Service | 185 (72.6%) | 70 (27.5%) |
| Education, Arts & Media | 0 (0.0%) | 0 (0.0%) |
| Legal Services & Support | 0 (0.0%) | 17 (100.0%) |
| Education Instruction & Library | 0 (0.0%) | 53 (100.0%) |
| Arts, Media & Entertainment | 185 (100.0%) | 0 (0.0%) |
| Health Diagnosing & Treating | 0 (0.0%) | 24 (100.0%) |
| Health Technologists | 0 (0.0%) | 0 (0.0%) |
| Total (Category) | 214 (67.5%) | 103 (32.5%) |
| Total (Overall) | 297 (40.8%) | 431 (59.2%) |
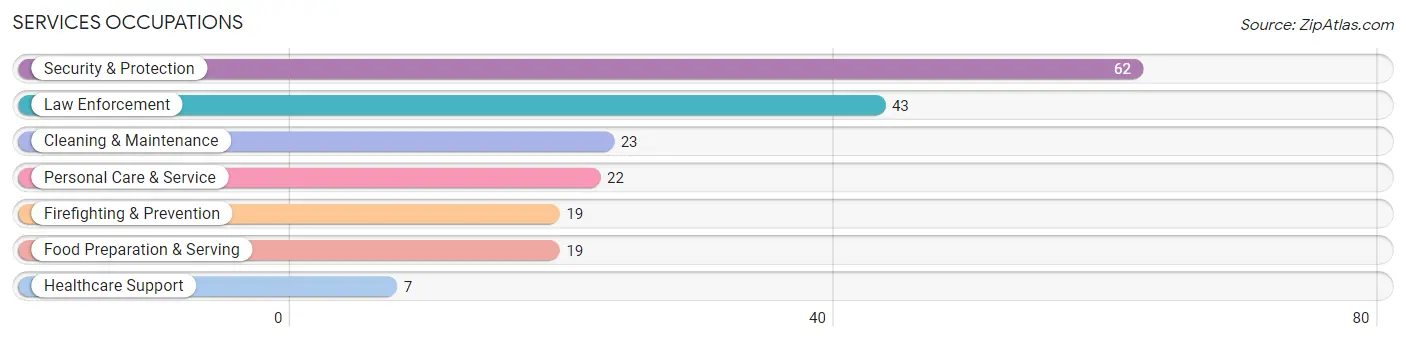
Services Occupations
The most common Services occupations in Centreville are Security & Protection (62 | 8.5%), Law Enforcement (43 | 5.9%), Cleaning & Maintenance (23 | 3.2%), Personal Care & Service (22 | 3.0%), and Firefighting & Prevention (19 | 2.6%).
Services Occupations by Sex
Within the Services occupations in Centreville, the most male-oriented occupations are Firefighting & Prevention (89.5%), Cleaning & Maintenance (47.8%), and Security & Protection (27.4%), while the most female-oriented occupations are Healthcare Support (100.0%), Law Enforcement (100.0%), and Food Preparation & Serving (100.0%).
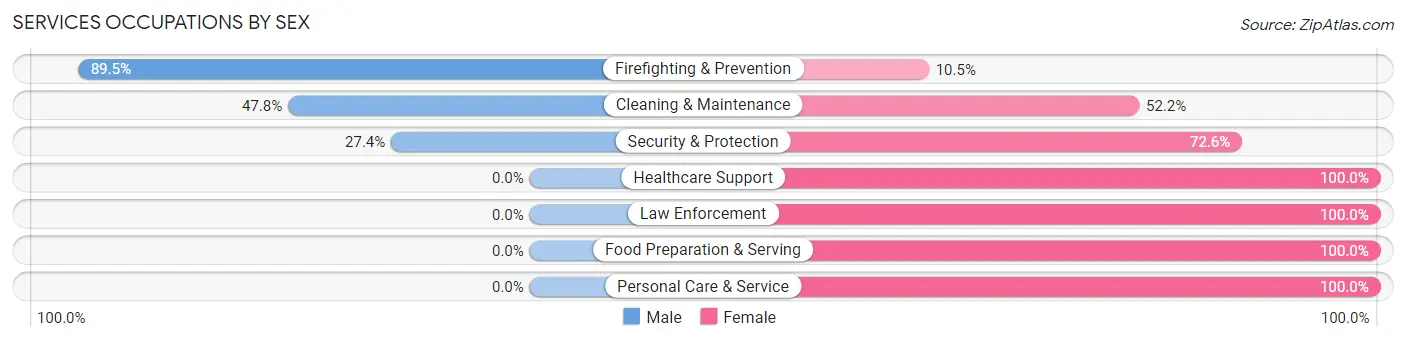
| Occupation | Male | Female |
| Healthcare Support | 0 (0.0%) | 7 (100.0%) |
| Security & Protection | 17 (27.4%) | 45 (72.6%) |
| Firefighting & Prevention | 17 (89.5%) | 2 (10.5%) |
| Law Enforcement | 0 (0.0%) | 43 (100.0%) |
| Food Preparation & Serving | 0 (0.0%) | 19 (100.0%) |
| Cleaning & Maintenance | 11 (47.8%) | 12 (52.2%) |
| Personal Care & Service | 0 (0.0%) | 22 (100.0%) |
| Total (Category) | 28 (21.0%) | 105 (78.9%) |
| Total (Overall) | 297 (40.8%) | 431 (59.2%) |
Sales and Office Occupations
The most common Sales and Office occupations in Centreville are Sales & Related (166 | 22.8%), and Office & Administration (69 | 9.5%).

Sales and Office Occupations by Sex
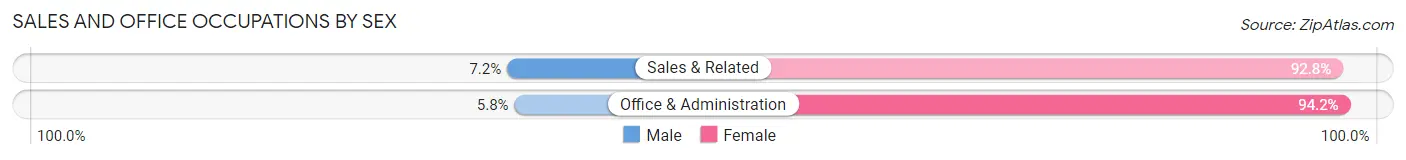
| Occupation | Male | Female |
| Sales & Related | 12 (7.2%) | 154 (92.8%) |
| Office & Administration | 4 (5.8%) | 65 (94.2%) |
| Total (Category) | 16 (6.8%) | 219 (93.2%) |
| Total (Overall) | 297 (40.8%) | 431 (59.2%) |
Natural Resources, Construction and Maintenance Occupations
The most common Natural Resources, Construction and Maintenance occupations in Centreville are Installation, Maintenance & Repair (11 | 1.5%), and Construction & Extraction (4 | 0.5%).

Natural Resources, Construction and Maintenance Occupations by Sex

| Occupation | Male | Female |
| Farming, Fishing & Forestry | 0 (0.0%) | 0 (0.0%) |
| Construction & Extraction | 4 (100.0%) | 0 (0.0%) |
| Installation, Maintenance & Repair | 11 (100.0%) | 0 (0.0%) |
| Total (Category) | 15 (100.0%) | 0 (0.0%) |
| Total (Overall) | 297 (40.8%) | 431 (59.2%) |
Production, Transportation and Moving Occupations
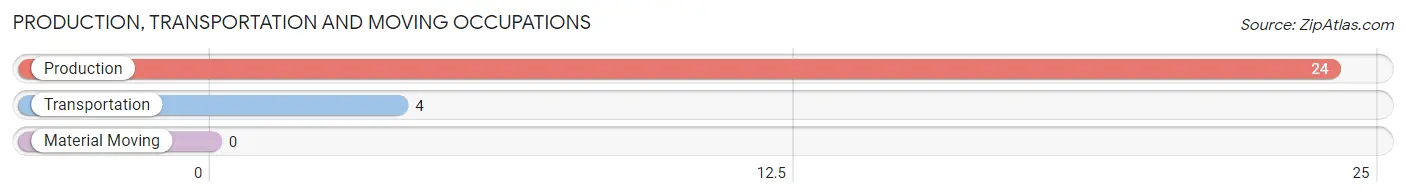
The most common Production, Transportation and Moving occupations in Centreville are Production (24 | 3.3%), and Transportation (4 | 0.5%).
Production, Transportation and Moving Occupations by Sex
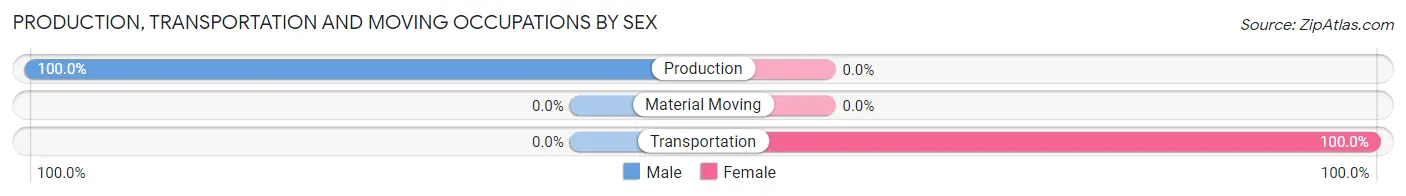
| Occupation | Male | Female |
| Production | 24 (100.0%) | 0 (0.0%) |
| Transportation | 0 (0.0%) | 4 (100.0%) |
| Material Moving | 0 (0.0%) | 0 (0.0%) |
| Total (Category) | 24 (85.7%) | 4 (14.3%) |
| Total (Overall) | 297 (40.8%) | 431 (59.2%) |
Employment Industries by Sex in Centreville
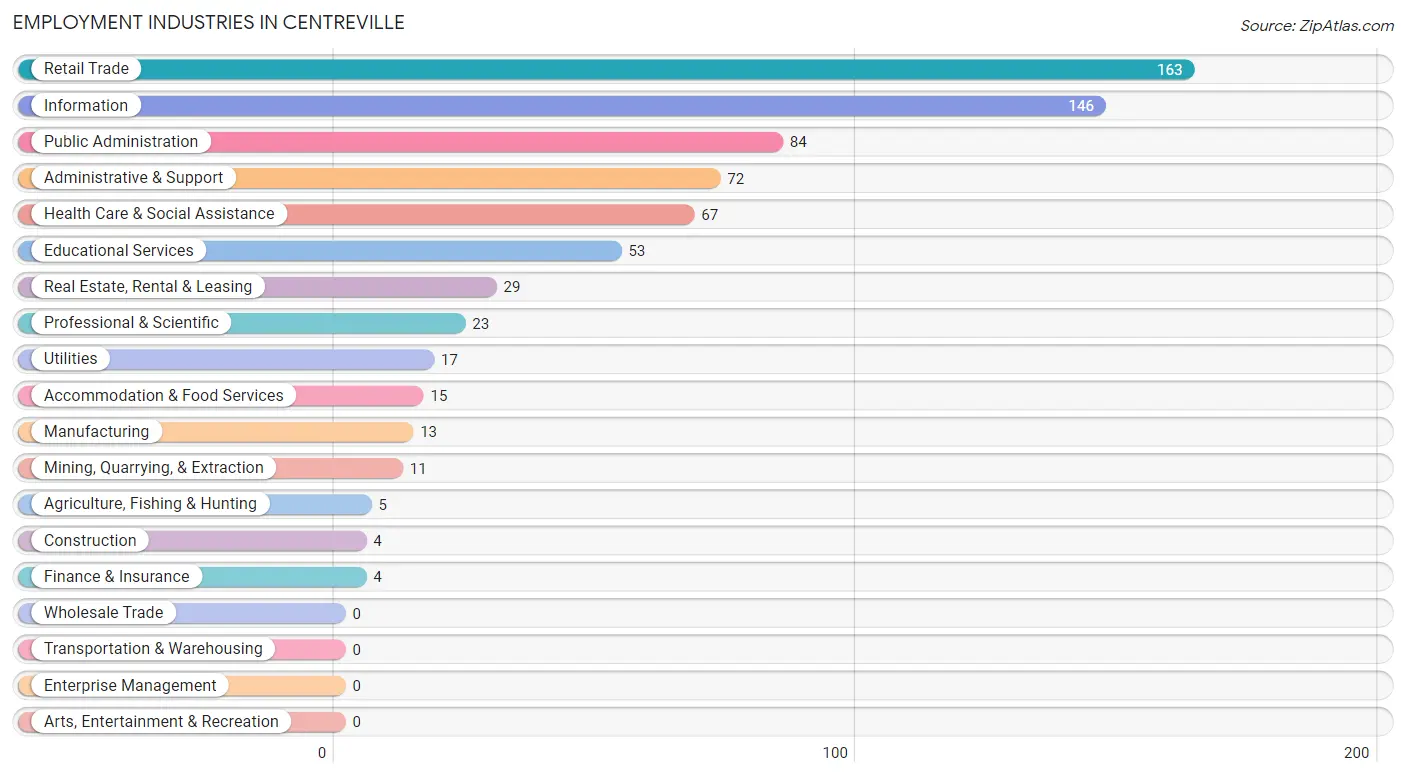
Employment Industries in Centreville
The major employment industries in Centreville include Retail Trade (163 | 22.4%), Information (146 | 20.1%), Public Administration (84 | 11.5%), Administrative & Support (72 | 9.9%), and Health Care & Social Assistance (67 | 9.2%).
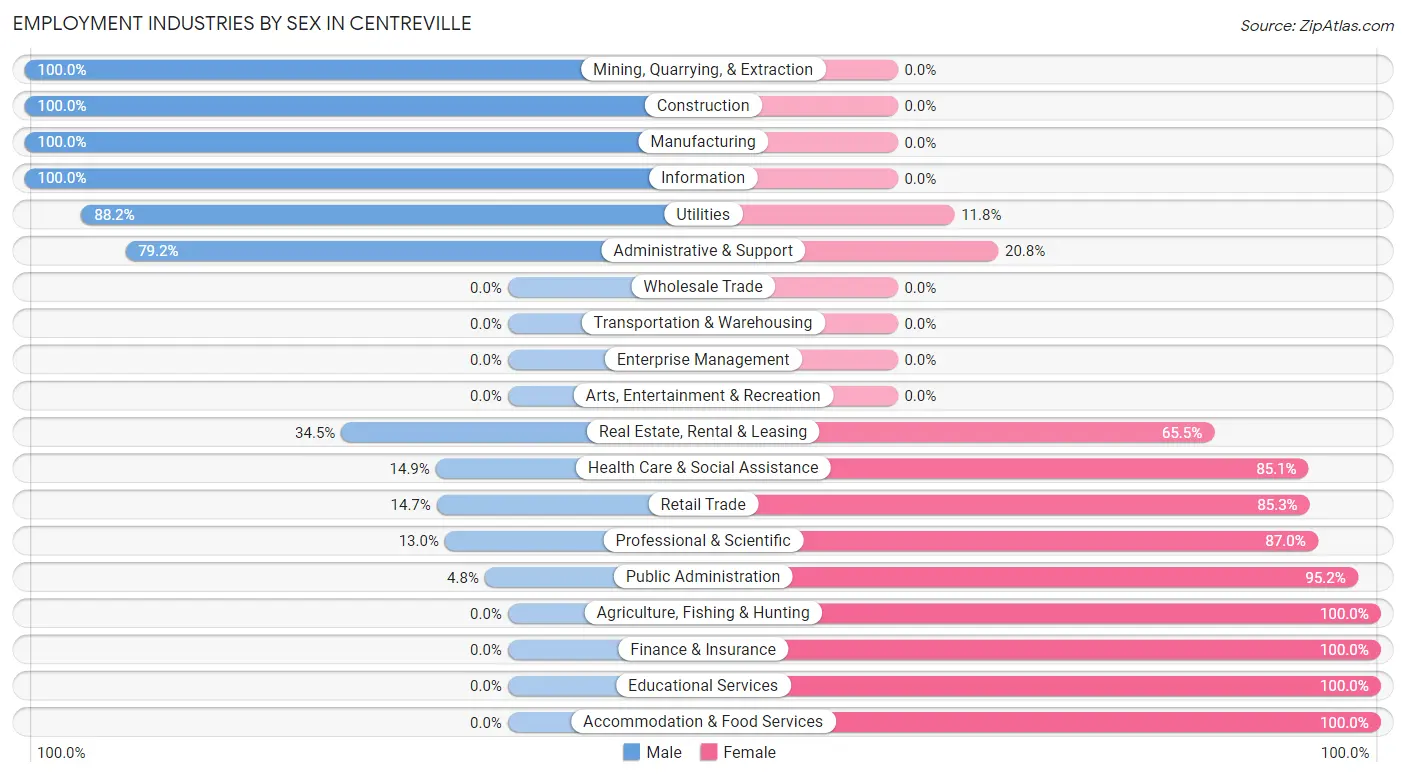
Employment Industries by Sex in Centreville
The Centreville industries that see more men than women are Mining, Quarrying, & Extraction (100.0%), Construction (100.0%), and Manufacturing (100.0%), whereas the industries that tend to have a higher number of women are Agriculture, Fishing & Hunting (100.0%), Finance & Insurance (100.0%), and Educational Services (100.0%).
| Industry | Male | Female |
| Agriculture, Fishing & Hunting | 0 (0.0%) | 5 (100.0%) |
| Mining, Quarrying, & Extraction | 11 (100.0%) | 0 (0.0%) |
| Construction | 4 (100.0%) | 0 (0.0%) |
| Manufacturing | 13 (100.0%) | 0 (0.0%) |
| Wholesale Trade | 0 (0.0%) | 0 (0.0%) |
| Retail Trade | 24 (14.7%) | 139 (85.3%) |
| Transportation & Warehousing | 0 (0.0%) | 0 (0.0%) |
| Utilities | 15 (88.2%) | 2 (11.8%) |
| Information | 146 (100.0%) | 0 (0.0%) |
| Finance & Insurance | 0 (0.0%) | 4 (100.0%) |
| Real Estate, Rental & Leasing | 10 (34.5%) | 19 (65.5%) |
| Professional & Scientific | 3 (13.0%) | 20 (87.0%) |
| Enterprise Management | 0 (0.0%) | 0 (0.0%) |
| Administrative & Support | 57 (79.2%) | 15 (20.8%) |
| Educational Services | 0 (0.0%) | 53 (100.0%) |
| Health Care & Social Assistance | 10 (14.9%) | 57 (85.1%) |
| Arts, Entertainment & Recreation | 0 (0.0%) | 0 (0.0%) |
| Accommodation & Food Services | 0 (0.0%) | 15 (100.0%) |
| Public Administration | 4 (4.8%) | 80 (95.2%) |
| Total | 297 (40.8%) | 431 (59.2%) |
Education in Centreville
School Enrollment in Centreville
The most common levels of schooling among the 679 students in Centreville are elementary school (247 | 36.4%), middle school (192 | 28.3%), and high school (182 | 26.8%).
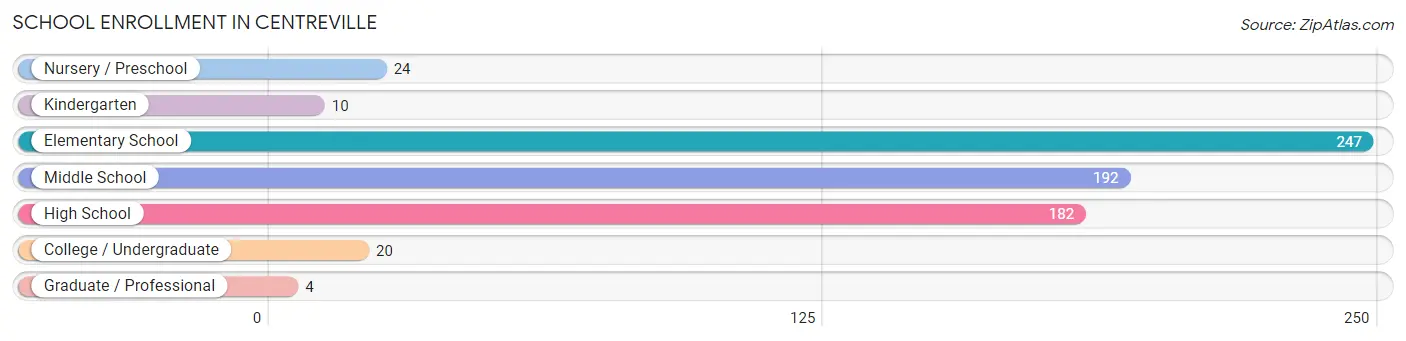
| School Level | # Students | % Students |
| Nursery / Preschool | 24 | 3.5% |
| Kindergarten | 10 | 1.5% |
| Elementary School | 247 | 36.4% |
| Middle School | 192 | 28.3% |
| High School | 182 | 26.8% |
| College / Undergraduate | 20 | 2.9% |
| Graduate / Professional | 4 | 0.6% |
| Total | 679 | 100.0% |
School Enrollment by Age by Funding Source in Centreville
Out of a total of 679 students who are enrolled in schools in Centreville, 107 (15.8%) attend a private institution, while the remaining 572 (84.2%) are enrolled in public schools. The age group of 3 to 4 year olds has the highest likelihood of being enrolled in private schools, with 10 (41.7% in the age bracket) enrolled. Conversely, the age group of 18 to 19 year olds has the lowest likelihood of being enrolled in a private school, with 23 (100.0% in the age bracket) attending a public institution.
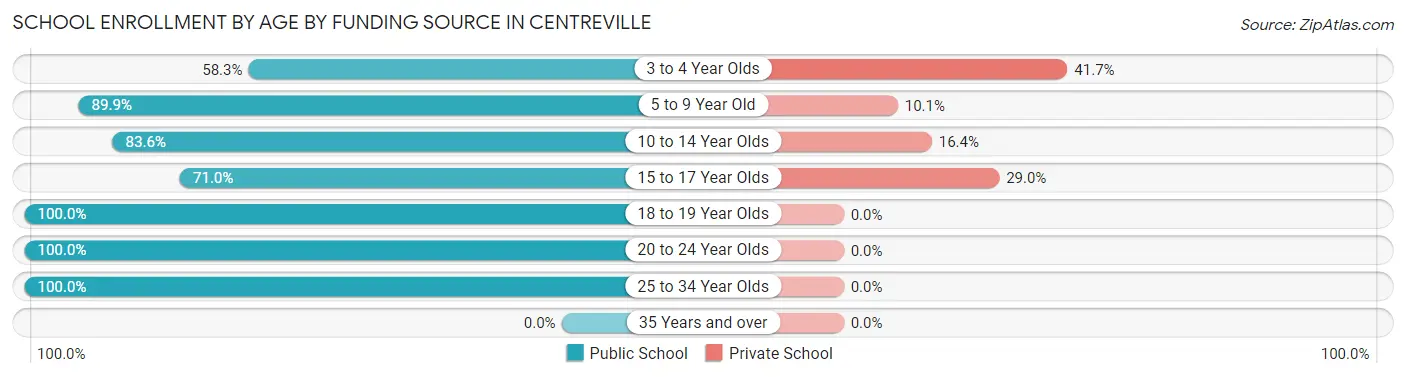
| Age Bracket | Public School | Private School |
| 3 to 4 Year Olds | 14 (58.3%) | 10 (41.7%) |
| 5 to 9 Year Old | 214 (89.9%) | 24 (10.1%) |
| 10 to 14 Year Olds | 214 (83.6%) | 42 (16.4%) |
| 15 to 17 Year Olds | 76 (71.0%) | 31 (29.0%) |
| 18 to 19 Year Olds | 23 (100.0%) | 0 (0.0%) |
| 20 to 24 Year Olds | 7 (100.0%) | 0 (0.0%) |
| 25 to 34 Year Olds | 24 (100.0%) | 0 (0.0%) |
| 35 Years and over | 0 (0.0%) | 0 (0.0%) |
| Total | 572 (84.2%) | 107 (15.8%) |
Educational Attainment by Field of Study in Centreville
Education (72 | 36.5%), psychology (35 | 17.8%), business (26 | 13.2%), science & technology (23 | 11.7%), and bio, nature & agricultural (20 | 10.2%) are the most common fields of study among 197 individuals in Centreville who have obtained a bachelor's degree or higher.
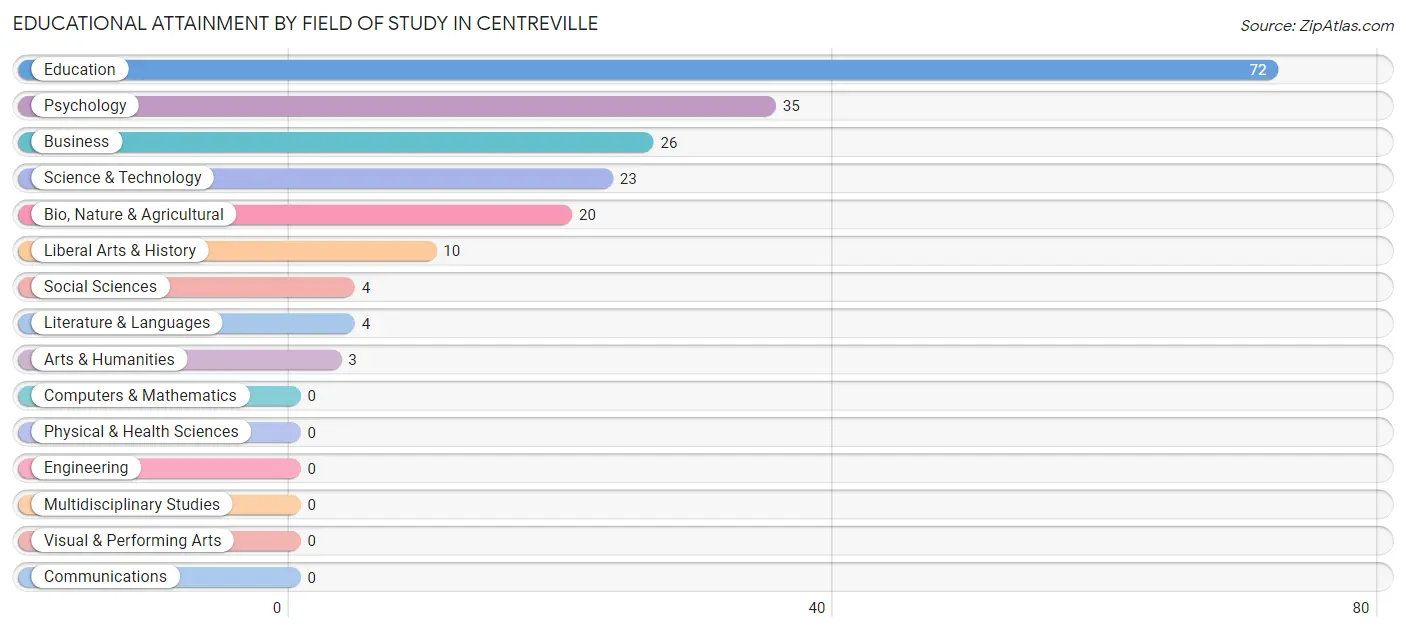
| Field of Study | # Graduates | % Graduates |
| Computers & Mathematics | 0 | 0.0% |
| Bio, Nature & Agricultural | 20 | 10.2% |
| Physical & Health Sciences | 0 | 0.0% |
| Psychology | 35 | 17.8% |
| Social Sciences | 4 | 2.0% |
| Engineering | 0 | 0.0% |
| Multidisciplinary Studies | 0 | 0.0% |
| Science & Technology | 23 | 11.7% |
| Business | 26 | 13.2% |
| Education | 72 | 36.5% |
| Literature & Languages | 4 | 2.0% |
| Liberal Arts & History | 10 | 5.1% |
| Visual & Performing Arts | 0 | 0.0% |
| Communications | 0 | 0.0% |
| Arts & Humanities | 3 | 1.5% |
| Total | 197 | 100.0% |
Transportation & Commute in Centreville
Vehicle Availability by Sex in Centreville
The most prevalent vehicle ownership categories in Centreville are males with 1 vehicle (202, accounting for 68.0%) and females with 1 vehicle (234, making up 47.3%).
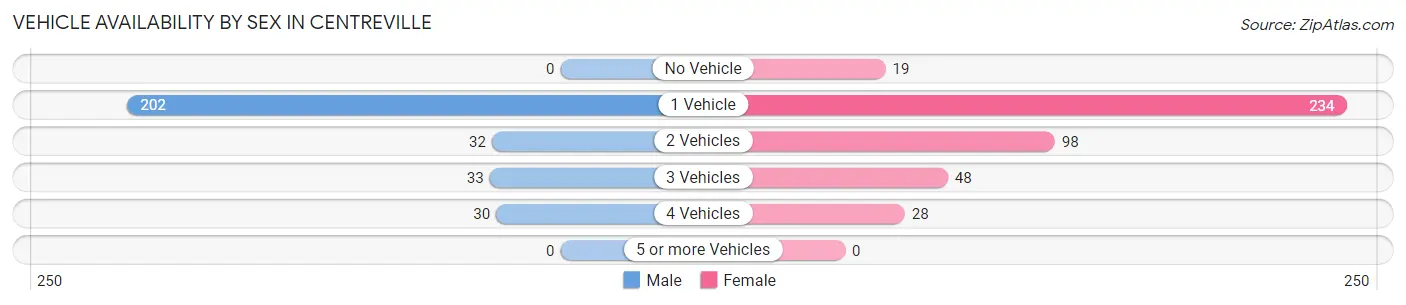
| Vehicles Available | Male | Female |
| No Vehicle | 0 (0.0%) | 19 (4.4%) |
| 1 Vehicle | 202 (68.0%) | 234 (54.8%) |
| 2 Vehicles | 32 (10.8%) | 98 (23.0%) |
| 3 Vehicles | 33 (11.1%) | 48 (11.2%) |
| 4 Vehicles | 30 (10.1%) | 28 (6.6%) |
| 5 or more Vehicles | 0 (0.0%) | 0 (0.0%) |
| Total | 297 (100.0%) | 427 (100.0%) |
Commute Time in Centreville
The most frequently occuring commute durations in Centreville are 60 to 89 minutes (201 commuters, 29.4%), 35 to 39 minutes (166 commuters, 24.3%), and 45 to 59 minutes (88 commuters, 12.9%).
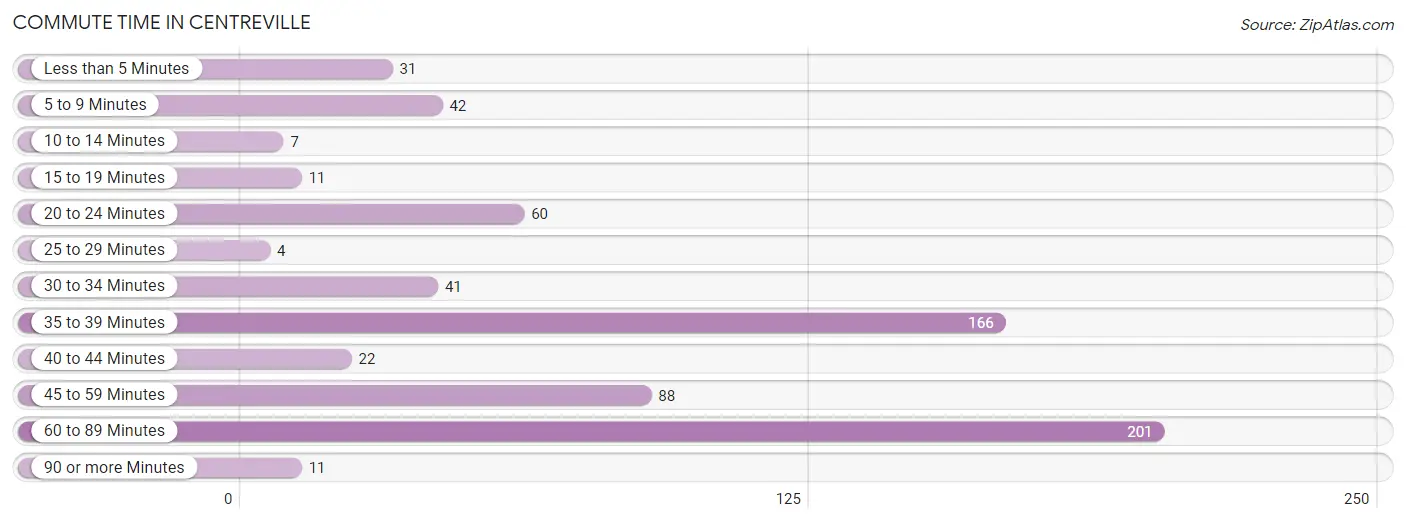
| Commute Time | # Commuters | % Commuters |
| Less than 5 Minutes | 31 | 4.5% |
| 5 to 9 Minutes | 42 | 6.1% |
| 10 to 14 Minutes | 7 | 1.0% |
| 15 to 19 Minutes | 11 | 1.6% |
| 20 to 24 Minutes | 60 | 8.8% |
| 25 to 29 Minutes | 4 | 0.6% |
| 30 to 34 Minutes | 41 | 6.0% |
| 35 to 39 Minutes | 166 | 24.3% |
| 40 to 44 Minutes | 22 | 3.2% |
| 45 to 59 Minutes | 88 | 12.9% |
| 60 to 89 Minutes | 201 | 29.4% |
| 90 or more Minutes | 11 | 1.6% |
Commute Time by Sex in Centreville
The most common commute times in Centreville are 60 to 89 minutes (173 commuters, 58.8%) for males and 35 to 39 minutes (127 commuters, 32.6%) for females.
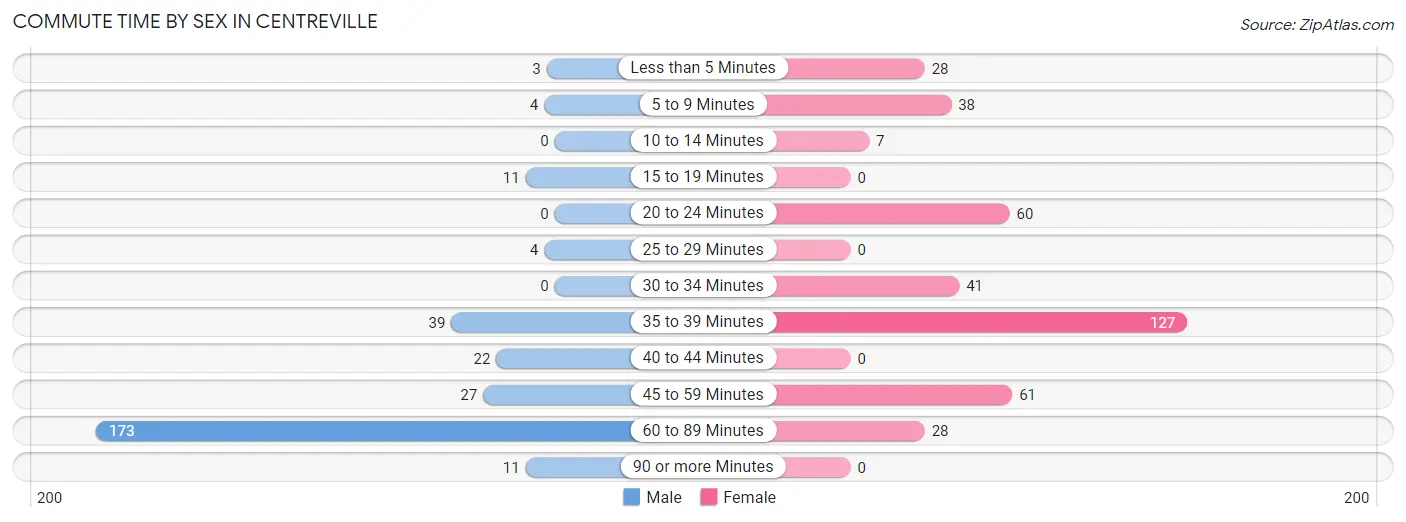
| Commute Time | Male | Female |
| Less than 5 Minutes | 3 (1.0%) | 28 (7.2%) |
| 5 to 9 Minutes | 4 (1.4%) | 38 (9.7%) |
| 10 to 14 Minutes | 0 (0.0%) | 7 (1.8%) |
| 15 to 19 Minutes | 11 (3.7%) | 0 (0.0%) |
| 20 to 24 Minutes | 0 (0.0%) | 60 (15.4%) |
| 25 to 29 Minutes | 4 (1.4%) | 0 (0.0%) |
| 30 to 34 Minutes | 0 (0.0%) | 41 (10.5%) |
| 35 to 39 Minutes | 39 (13.3%) | 127 (32.6%) |
| 40 to 44 Minutes | 22 (7.5%) | 0 (0.0%) |
| 45 to 59 Minutes | 27 (9.2%) | 61 (15.6%) |
| 60 to 89 Minutes | 173 (58.8%) | 28 (7.2%) |
| 90 or more Minutes | 11 (3.7%) | 0 (0.0%) |
Time of Departure to Work by Sex in Centreville
The most frequent times of departure to work in Centreville are 7:30 AM to 7:59 AM (165, 56.1%) for males and 6:00 AM to 6:29 AM (119, 30.5%) for females.
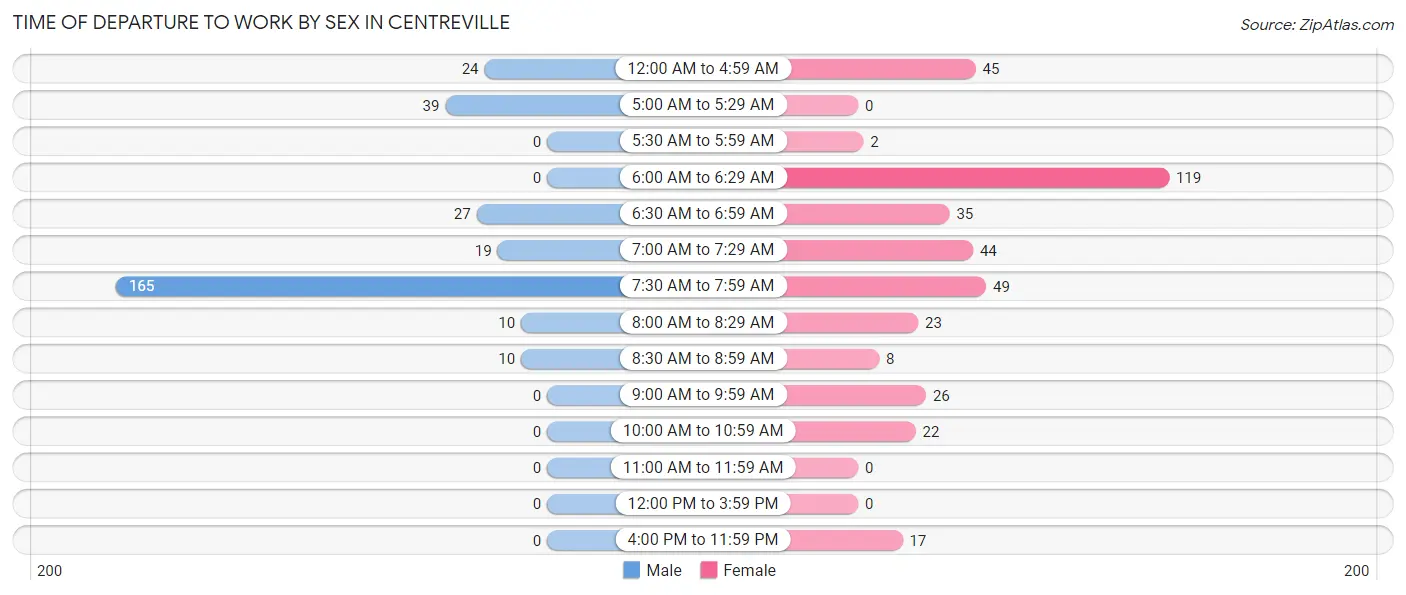
| Time of Departure | Male | Female |
| 12:00 AM to 4:59 AM | 24 (8.2%) | 45 (11.5%) |
| 5:00 AM to 5:29 AM | 39 (13.3%) | 0 (0.0%) |
| 5:30 AM to 5:59 AM | 0 (0.0%) | 2 (0.5%) |
| 6:00 AM to 6:29 AM | 0 (0.0%) | 119 (30.5%) |
| 6:30 AM to 6:59 AM | 27 (9.2%) | 35 (9.0%) |
| 7:00 AM to 7:29 AM | 19 (6.5%) | 44 (11.3%) |
| 7:30 AM to 7:59 AM | 165 (56.1%) | 49 (12.6%) |
| 8:00 AM to 8:29 AM | 10 (3.4%) | 23 (5.9%) |
| 8:30 AM to 8:59 AM | 10 (3.4%) | 8 (2.1%) |
| 9:00 AM to 9:59 AM | 0 (0.0%) | 26 (6.7%) |
| 10:00 AM to 10:59 AM | 0 (0.0%) | 22 (5.6%) |
| 11:00 AM to 11:59 AM | 0 (0.0%) | 0 (0.0%) |
| 12:00 PM to 3:59 PM | 0 (0.0%) | 0 (0.0%) |
| 4:00 PM to 11:59 PM | 0 (0.0%) | 17 (4.4%) |
| Total | 294 (100.0%) | 390 (100.0%) |
Housing Occupancy in Centreville
Occupancy by Ownership in Centreville
Of the total 925 dwellings in Centreville, owner-occupied units account for 544 (58.8%), while renter-occupied units make up 381 (41.2%).
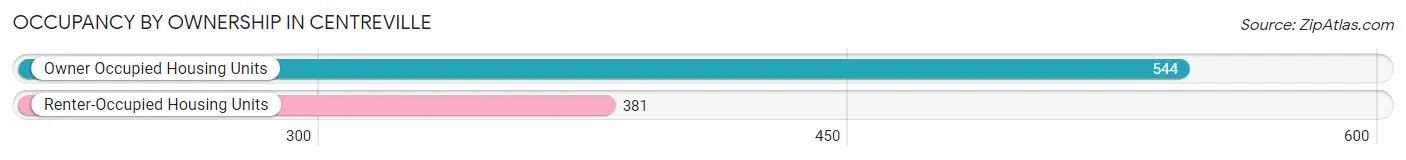
| Occupancy | # Housing Units | % Housing Units |
| Owner Occupied Housing Units | 544 | 58.8% |
| Renter-Occupied Housing Units | 381 | 41.2% |
| Total Occupied Housing Units | 925 | 100.0% |
Occupancy by Household Size in Centreville
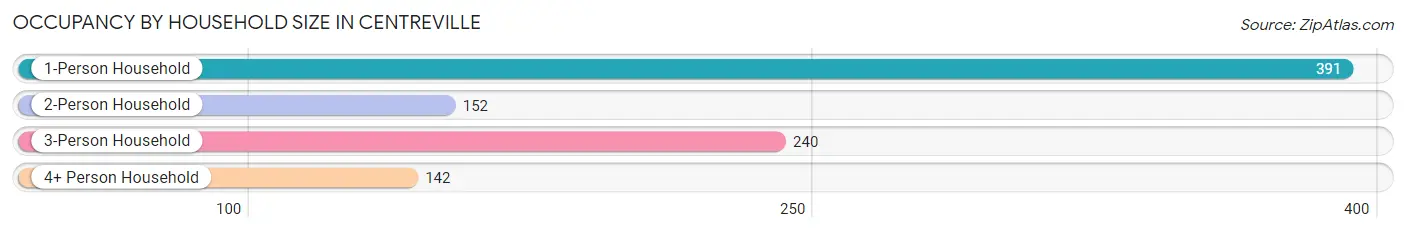
| Household Size | # Housing Units | % Housing Units |
| 1-Person Household | 391 | 42.3% |
| 2-Person Household | 152 | 16.4% |
| 3-Person Household | 240 | 26.0% |
| 4+ Person Household | 142 | 15.3% |
| Total Housing Units | 925 | 100.0% |
Occupancy by Ownership by Household Size in Centreville
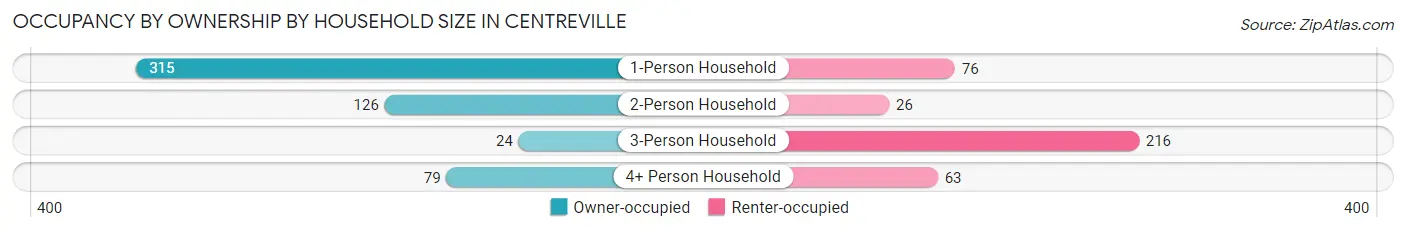
| Household Size | Owner-occupied | Renter-occupied |
| 1-Person Household | 315 (80.6%) | 76 (19.4%) |
| 2-Person Household | 126 (82.9%) | 26 (17.1%) |
| 3-Person Household | 24 (10.0%) | 216 (90.0%) |
| 4+ Person Household | 79 (55.6%) | 63 (44.4%) |
| Total Housing Units | 544 (58.8%) | 381 (41.2%) |
Occupancy by Educational Attainment in Centreville
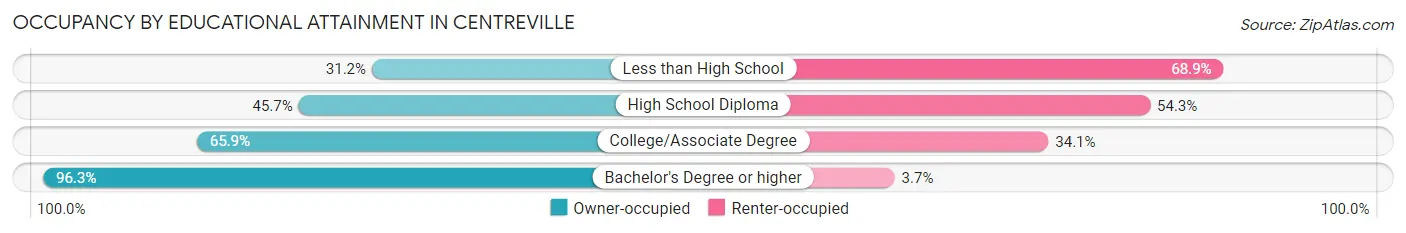
| Household Size | Owner-occupied | Renter-occupied |
| Less than High School | 19 (31.1%) | 42 (68.9%) |
| High School Diploma | 175 (45.7%) | 208 (54.3%) |
| College/Associate Degree | 245 (65.9%) | 127 (34.1%) |
| Bachelor's Degree or higher | 105 (96.3%) | 4 (3.7%) |
Occupancy by Age of Householder in Centreville
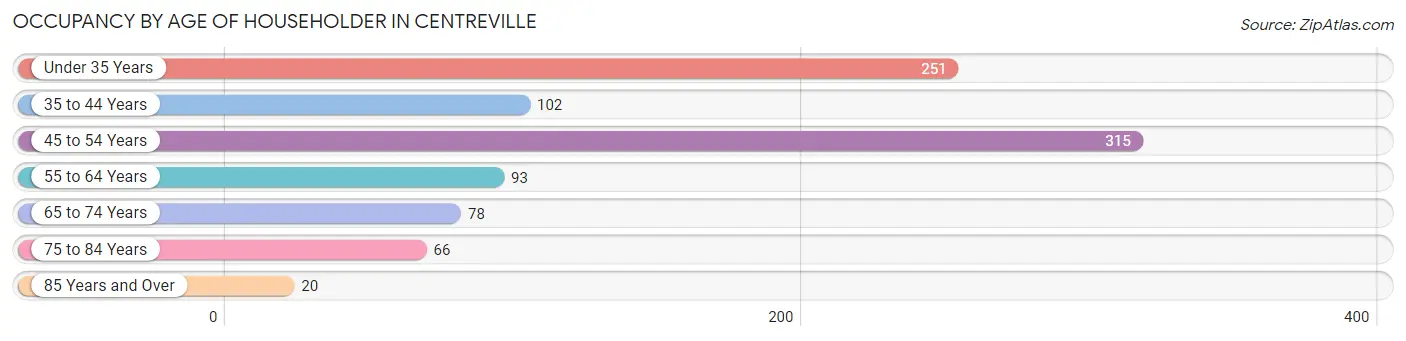
| Age Bracket | # Households | % Households |
| Under 35 Years | 251 | 27.1% |
| 35 to 44 Years | 102 | 11.0% |
| 45 to 54 Years | 315 | 34.1% |
| 55 to 64 Years | 93 | 10.1% |
| 65 to 74 Years | 78 | 8.4% |
| 75 to 84 Years | 66 | 7.1% |
| 85 Years and Over | 20 | 2.2% |
| Total | 925 | 100.0% |
Housing Finances in Centreville
Median Income by Occupancy in Centreville
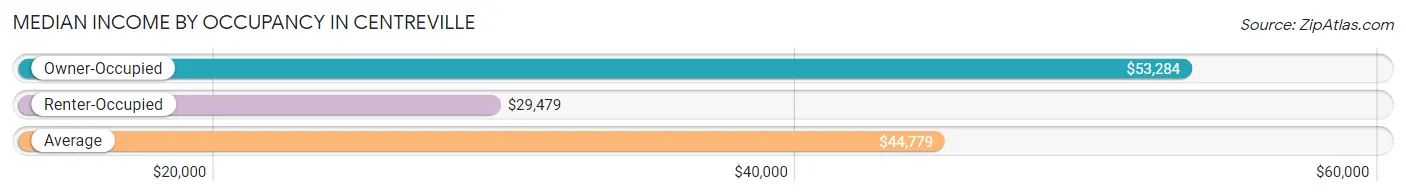
| Occupancy Type | # Households | Median Income |
| Owner-Occupied | 544 (58.8%) | $53,284 |
| Renter-Occupied | 381 (41.2%) | $29,479 |
| Average | 925 (100.0%) | $44,779 |
Occupancy by Householder Income Bracket in Centreville
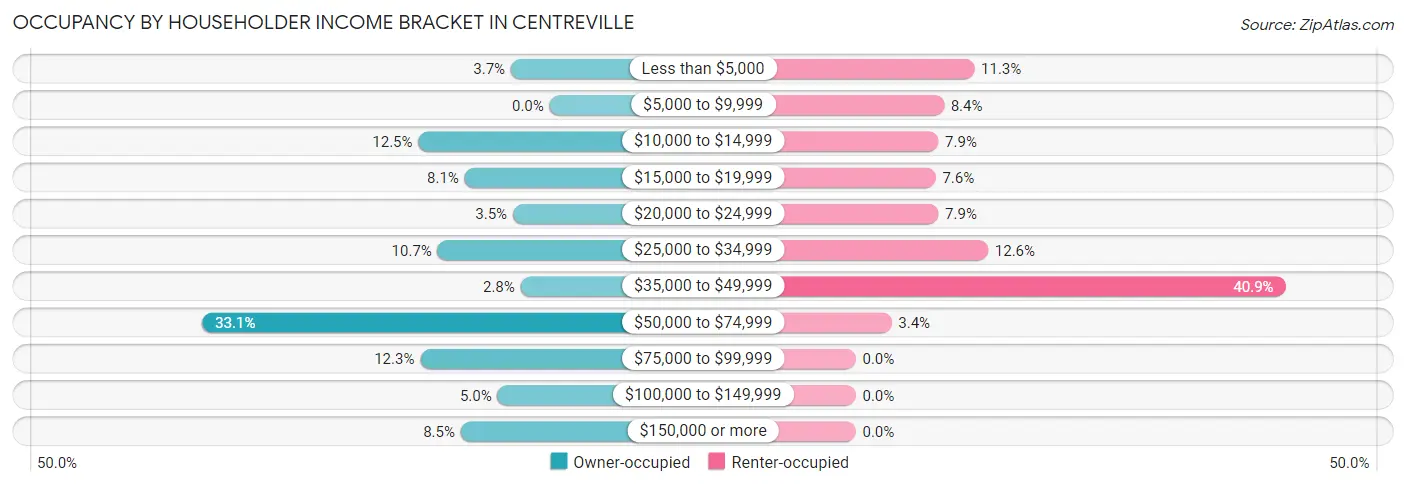
| Income Bracket | Owner-occupied | Renter-occupied |
| Less than $5,000 | 20 (3.7%) | 43 (11.3%) |
| $5,000 to $9,999 | 0 (0.0%) | 32 (8.4%) |
| $10,000 to $14,999 | 68 (12.5%) | 30 (7.9%) |
| $15,000 to $19,999 | 44 (8.1%) | 29 (7.6%) |
| $20,000 to $24,999 | 19 (3.5%) | 30 (7.9%) |
| $25,000 to $34,999 | 58 (10.7%) | 48 (12.6%) |
| $35,000 to $49,999 | 15 (2.8%) | 156 (40.9%) |
| $50,000 to $74,999 | 180 (33.1%) | 13 (3.4%) |
| $75,000 to $99,999 | 67 (12.3%) | 0 (0.0%) |
| $100,000 to $149,999 | 27 (5.0%) | 0 (0.0%) |
| $150,000 or more | 46 (8.5%) | 0 (0.0%) |
| Total | 544 (100.0%) | 381 (100.0%) |
Monthly Housing Cost Tiers in Centreville
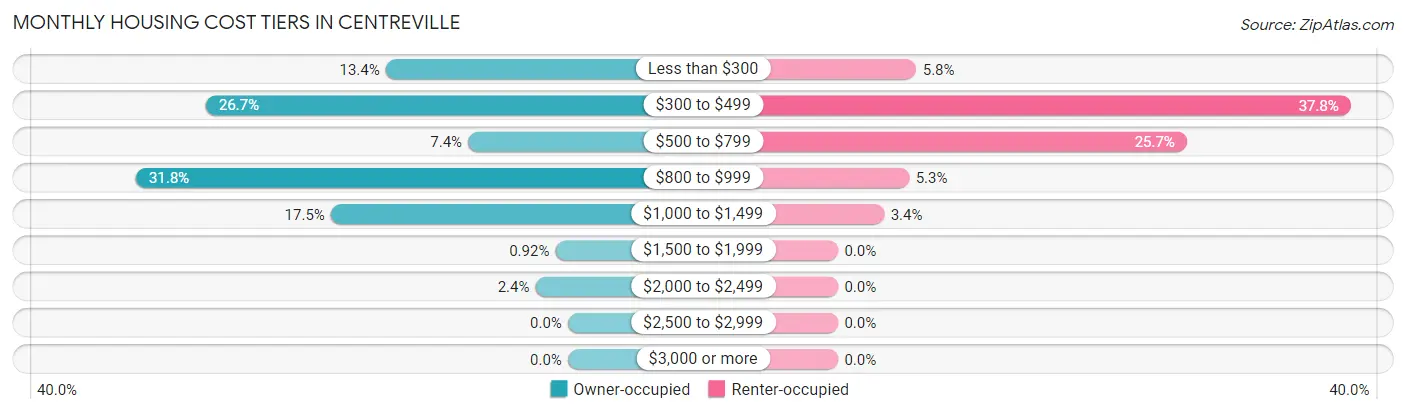
| Monthly Cost | Owner-occupied | Renter-occupied |
| Less than $300 | 73 (13.4%) | 22 (5.8%) |
| $300 to $499 | 145 (26.7%) | 144 (37.8%) |
| $500 to $799 | 40 (7.3%) | 98 (25.7%) |
| $800 to $999 | 173 (31.8%) | 20 (5.2%) |
| $1,000 to $1,499 | 95 (17.5%) | 13 (3.4%) |
| $1,500 to $1,999 | 5 (0.9%) | 0 (0.0%) |
| $2,000 to $2,499 | 13 (2.4%) | 0 (0.0%) |
| $2,500 to $2,999 | 0 (0.0%) | 0 (0.0%) |
| $3,000 or more | 0 (0.0%) | 0 (0.0%) |
| Total | 544 (100.0%) | 381 (100.0%) |
Physical Housing Characteristics in Centreville
Housing Structures in Centreville
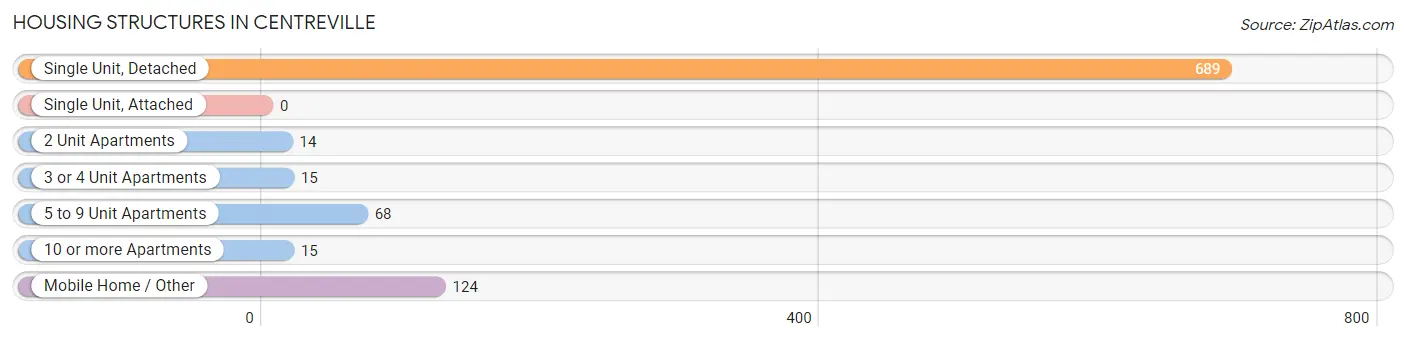
| Structure Type | # Housing Units | % Housing Units |
| Single Unit, Detached | 689 | 74.5% |
| Single Unit, Attached | 0 | 0.0% |
| 2 Unit Apartments | 14 | 1.5% |
| 3 or 4 Unit Apartments | 15 | 1.6% |
| 5 to 9 Unit Apartments | 68 | 7.3% |
| 10 or more Apartments | 15 | 1.6% |
| Mobile Home / Other | 124 | 13.4% |
| Total | 925 | 100.0% |
Housing Structures by Occupancy in Centreville
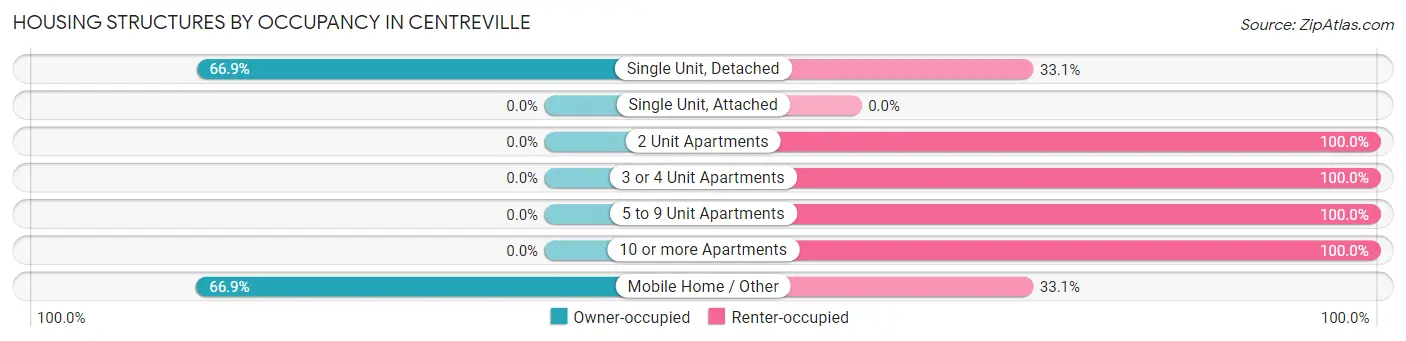
| Structure Type | Owner-occupied | Renter-occupied |
| Single Unit, Detached | 461 (66.9%) | 228 (33.1%) |
| Single Unit, Attached | 0 (0.0%) | 0 (0.0%) |
| 2 Unit Apartments | 0 (0.0%) | 14 (100.0%) |
| 3 or 4 Unit Apartments | 0 (0.0%) | 15 (100.0%) |
| 5 to 9 Unit Apartments | 0 (0.0%) | 68 (100.0%) |
| 10 or more Apartments | 0 (0.0%) | 15 (100.0%) |
| Mobile Home / Other | 83 (66.9%) | 41 (33.1%) |
| Total | 544 (58.8%) | 381 (41.2%) |
Housing Structures by Number of Rooms in Centreville
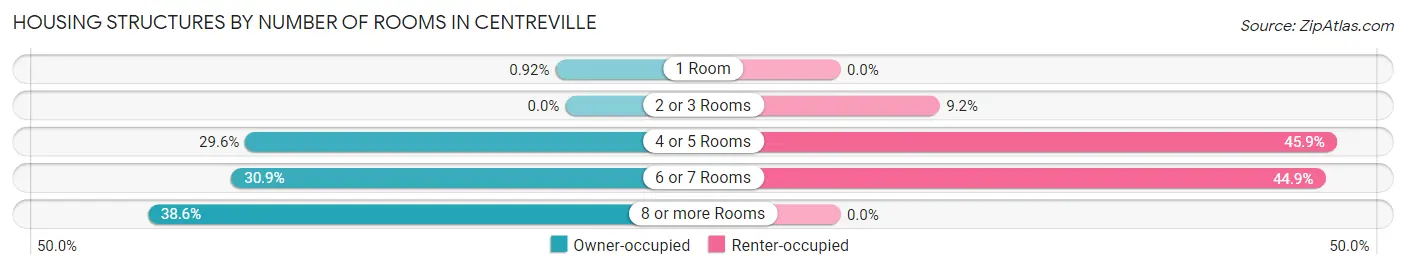
| Number of Rooms | Owner-occupied | Renter-occupied |
| 1 Room | 5 (0.9%) | 0 (0.0%) |
| 2 or 3 Rooms | 0 (0.0%) | 35 (9.2%) |
| 4 or 5 Rooms | 161 (29.6%) | 175 (45.9%) |
| 6 or 7 Rooms | 168 (30.9%) | 171 (44.9%) |
| 8 or more Rooms | 210 (38.6%) | 0 (0.0%) |
| Total | 544 (100.0%) | 381 (100.0%) |
Housing Structure by Heating Type in Centreville
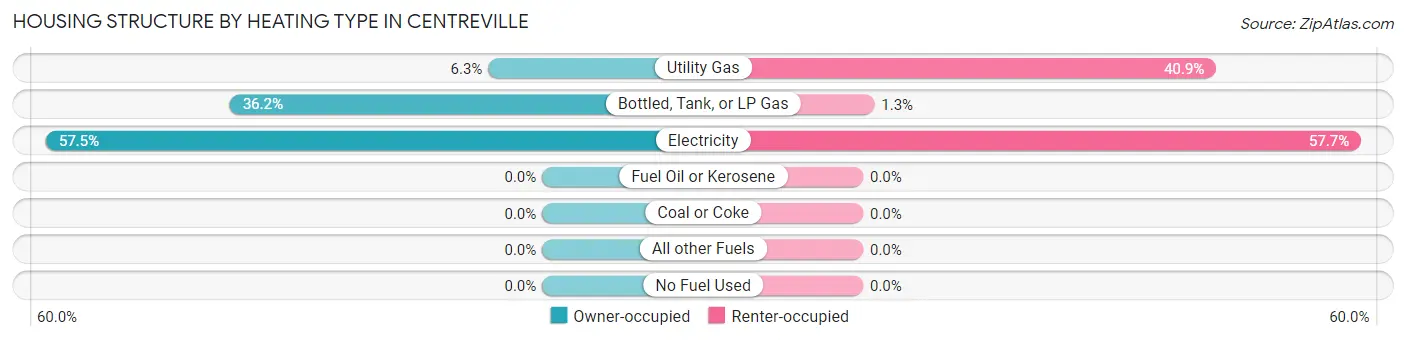
| Heating Type | Owner-occupied | Renter-occupied |
| Utility Gas | 34 (6.2%) | 156 (40.9%) |
| Bottled, Tank, or LP Gas | 197 (36.2%) | 5 (1.3%) |
| Electricity | 313 (57.5%) | 220 (57.7%) |
| Fuel Oil or Kerosene | 0 (0.0%) | 0 (0.0%) |
| Coal or Coke | 0 (0.0%) | 0 (0.0%) |
| All other Fuels | 0 (0.0%) | 0 (0.0%) |
| No Fuel Used | 0 (0.0%) | 0 (0.0%) |
| Total | 544 (100.0%) | 381 (100.0%) |
Household Vehicle Usage in Centreville
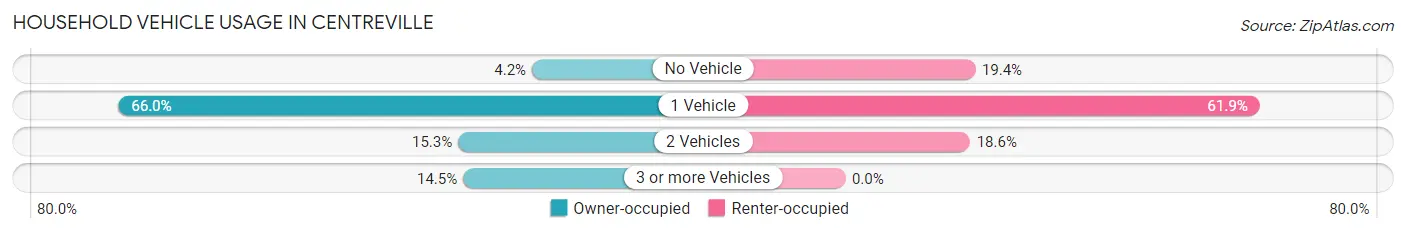
| Vehicles per Household | Owner-occupied | Renter-occupied |
| No Vehicle | 23 (4.2%) | 74 (19.4%) |
| 1 Vehicle | 359 (66.0%) | 236 (61.9%) |
| 2 Vehicles | 83 (15.3%) | 71 (18.6%) |
| 3 or more Vehicles | 79 (14.5%) | 0 (0.0%) |
| Total | 544 (100.0%) | 381 (100.0%) |
Real Estate & Mortgages in Centreville
Real Estate and Mortgage Overview in Centreville
| Characteristic | Without Mortgage | With Mortgage |
| Housing Units | 273 | 271 |
| Median Property Value | $56,300 | $0 |
| Median Household Income | $22,875 | $38 |
| Monthly Housing Costs | $383 | $0 |
| Real Estate Taxes | $565 | $22 |
Property Value by Mortgage Status in Centreville
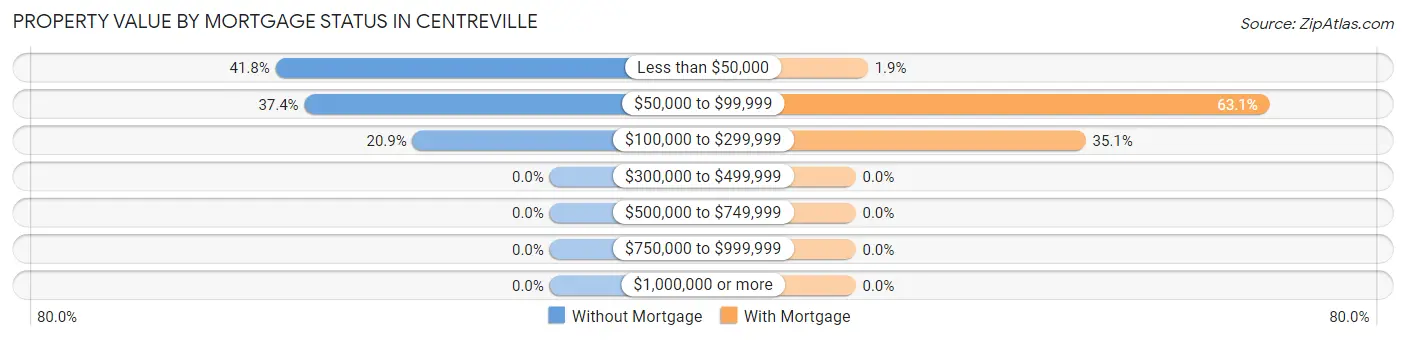
| Property Value | Without Mortgage | With Mortgage |
| Less than $50,000 | 114 (41.8%) | 5 (1.8%) |
| $50,000 to $99,999 | 102 (37.4%) | 171 (63.1%) |
| $100,000 to $299,999 | 57 (20.9%) | 95 (35.1%) |
| $300,000 to $499,999 | 0 (0.0%) | 0 (0.0%) |
| $500,000 to $749,999 | 0 (0.0%) | 0 (0.0%) |
| $750,000 to $999,999 | 0 (0.0%) | 0 (0.0%) |
| $1,000,000 or more | 0 (0.0%) | 0 (0.0%) |
| Total | 273 (100.0%) | 271 (100.0%) |
Household Income by Mortgage Status in Centreville
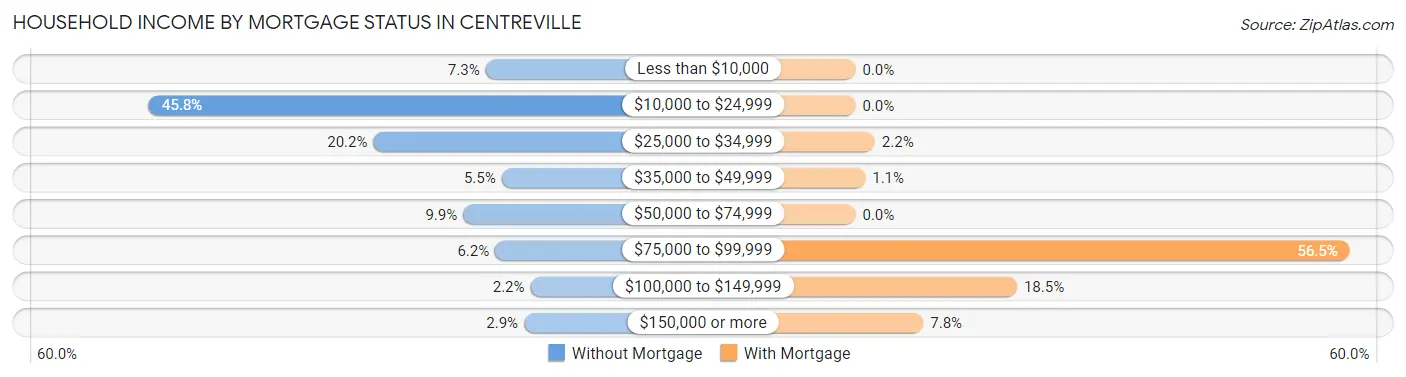
| Household Income | Without Mortgage | With Mortgage |
| Less than $10,000 | 20 (7.3%) | 0 (0.0%) |
| $10,000 to $24,999 | 125 (45.8%) | 0 (0.0%) |
| $25,000 to $34,999 | 55 (20.2%) | 6 (2.2%) |
| $35,000 to $49,999 | 15 (5.5%) | 3 (1.1%) |
| $50,000 to $74,999 | 27 (9.9%) | 0 (0.0%) |
| $75,000 to $99,999 | 17 (6.2%) | 153 (56.5%) |
| $100,000 to $149,999 | 6 (2.2%) | 50 (18.4%) |
| $150,000 or more | 8 (2.9%) | 21 (7.7%) |
| Total | 273 (100.0%) | 271 (100.0%) |
Property Value to Household Income Ratio in Centreville
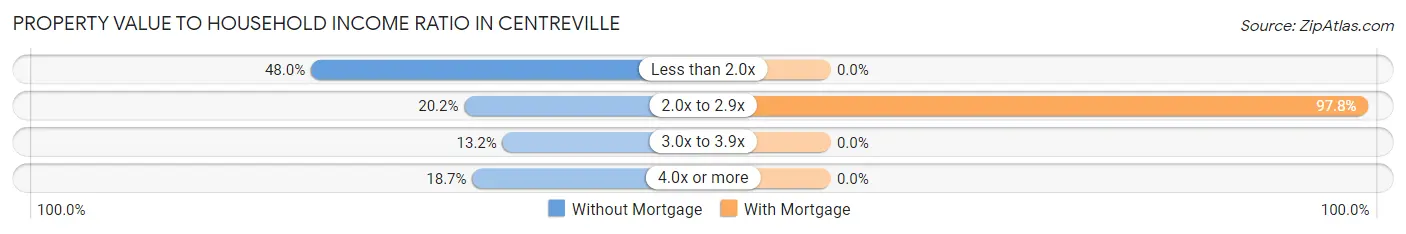
| Value-to-Income Ratio | Without Mortgage | With Mortgage |
| Less than 2.0x | 131 (48.0%) | 0 (0.0%) |
| 2.0x to 2.9x | 55 (20.2%) | 265 (97.8%) |
| 3.0x to 3.9x | 36 (13.2%) | 0 (0.0%) |
| 4.0x or more | 51 (18.7%) | 0 (0.0%) |
| Total | 273 (100.0%) | 271 (100.0%) |
Real Estate Taxes by Mortgage Status in Centreville
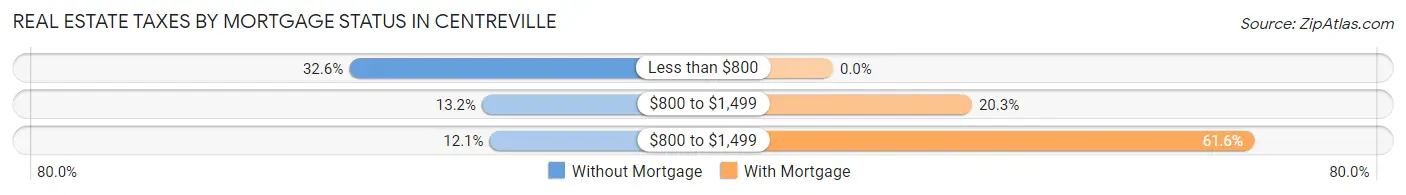
| Property Taxes | Without Mortgage | With Mortgage |
| Less than $800 | 89 (32.6%) | 0 (0.0%) |
| $800 to $1,499 | 36 (13.2%) | 55 (20.3%) |
| $800 to $1,499 | 33 (12.1%) | 167 (61.6%) |
| Total | 273 (100.0%) | 271 (100.0%) |
Health & Disability in Centreville
Health Insurance Coverage by Age in Centreville
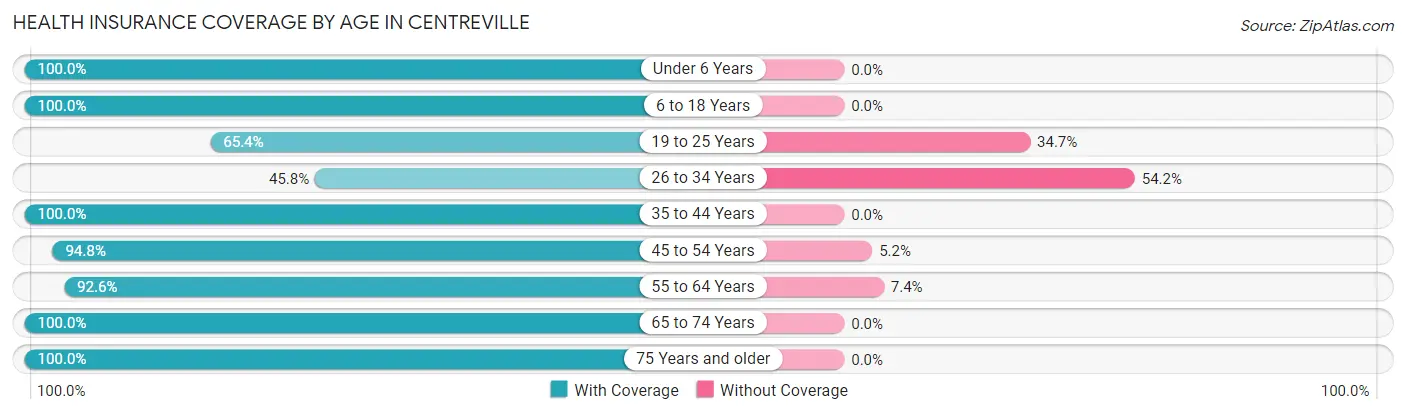
| Age Bracket | With Coverage | Without Coverage |
| Under 6 Years | 251 (100.0%) | 0 (0.0%) |
| 6 to 18 Years | 717 (100.0%) | 0 (0.0%) |
| 19 to 25 Years | 66 (65.3%) | 35 (34.6%) |
| 26 to 34 Years | 132 (45.8%) | 156 (54.2%) |
| 35 to 44 Years | 140 (100.0%) | 0 (0.0%) |
| 45 to 54 Years | 382 (94.8%) | 21 (5.2%) |
| 55 to 64 Years | 113 (92.6%) | 9 (7.4%) |
| 65 to 74 Years | 127 (100.0%) | 0 (0.0%) |
| 75 Years and older | 101 (100.0%) | 0 (0.0%) |
| Total | 2,029 (90.2%) | 221 (9.8%) |
Health Insurance Coverage by Citizenship Status in Centreville

| Citizenship Status | With Coverage | Without Coverage |
| Native Born | 251 (100.0%) | 0 (0.0%) |
| Foreign Born, Citizen | 717 (100.0%) | 0 (0.0%) |
| Foreign Born, not a Citizen | 66 (65.3%) | 35 (34.6%) |
Health Insurance Coverage by Household Income in Centreville
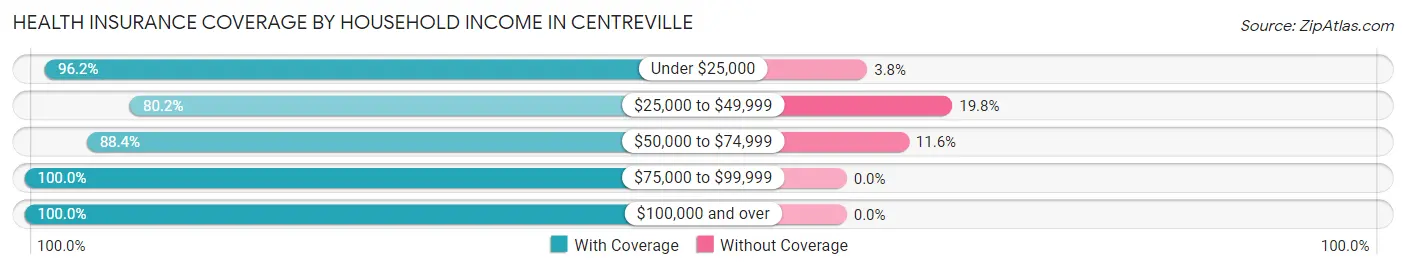
| Household Income | With Coverage | Without Coverage |
| Under $25,000 | 801 (96.2%) | 32 (3.8%) |
| $25,000 to $49,999 | 629 (80.2%) | 155 (19.8%) |
| $50,000 to $74,999 | 258 (88.4%) | 34 (11.6%) |
| $75,000 to $99,999 | 130 (100.0%) | 0 (0.0%) |
| $100,000 and over | 211 (100.0%) | 0 (0.0%) |
Public vs Private Health Insurance Coverage by Age in Centreville
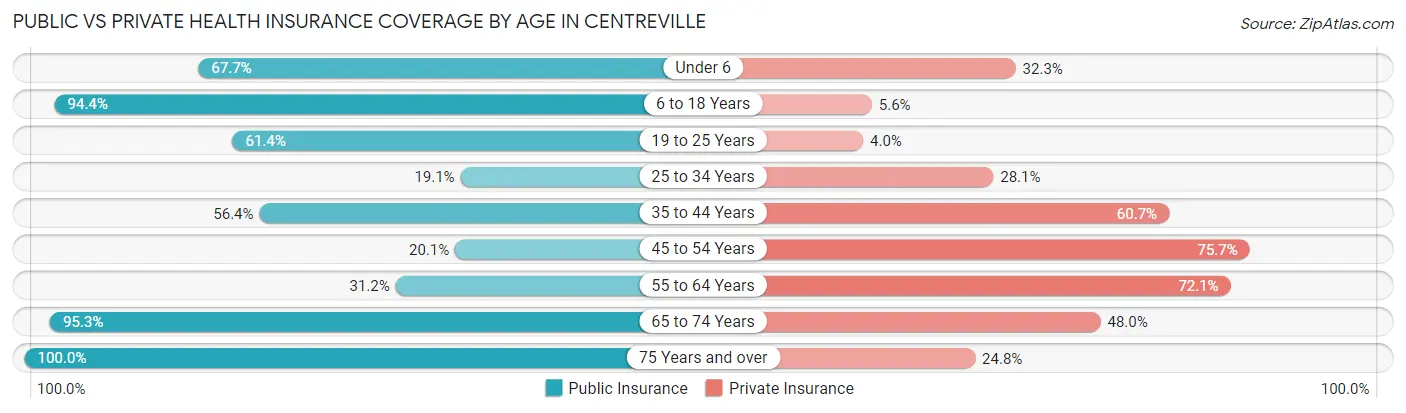
| Age Bracket | Public Insurance | Private Insurance |
| Under 6 | 170 (67.7%) | 81 (32.3%) |
| 6 to 18 Years | 677 (94.4%) | 40 (5.6%) |
| 19 to 25 Years | 62 (61.4%) | 4 (4.0%) |
| 25 to 34 Years | 55 (19.1%) | 81 (28.1%) |
| 35 to 44 Years | 79 (56.4%) | 85 (60.7%) |
| 45 to 54 Years | 81 (20.1%) | 305 (75.7%) |
| 55 to 64 Years | 38 (31.1%) | 88 (72.1%) |
| 65 to 74 Years | 121 (95.3%) | 61 (48.0%) |
| 75 Years and over | 101 (100.0%) | 25 (24.7%) |
| Total | 1,384 (61.5%) | 770 (34.2%) |
Disability Status by Sex by Age in Centreville
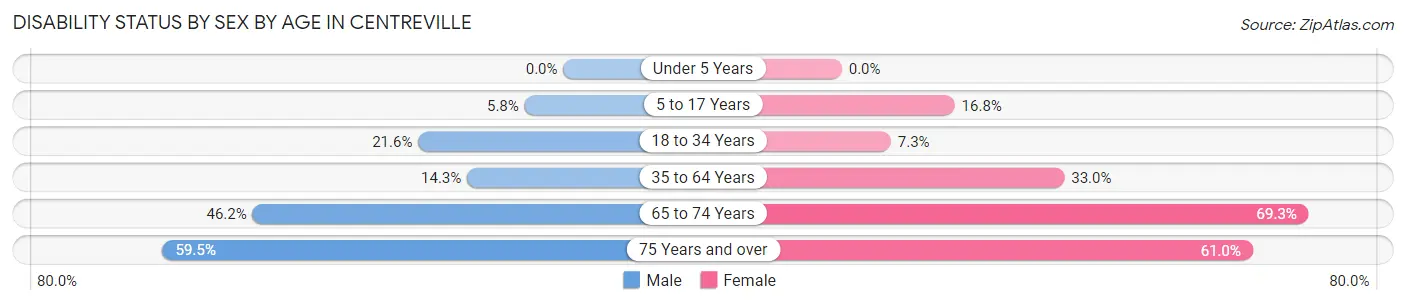
| Age Bracket | Male | Female |
| Under 5 Years | 0 (0.0%) | 0 (0.0%) |
| 5 to 17 Years | 20 (5.8%) | 57 (16.8%) |
| 18 to 34 Years | 25 (21.5%) | 23 (7.3%) |
| 35 to 64 Years | 47 (14.3%) | 111 (33.0%) |
| 65 to 74 Years | 18 (46.2%) | 61 (69.3%) |
| 75 Years and over | 25 (59.5%) | 36 (61.0%) |
Disability Class by Sex by Age in Centreville
Disability Class: Hearing Difficulty
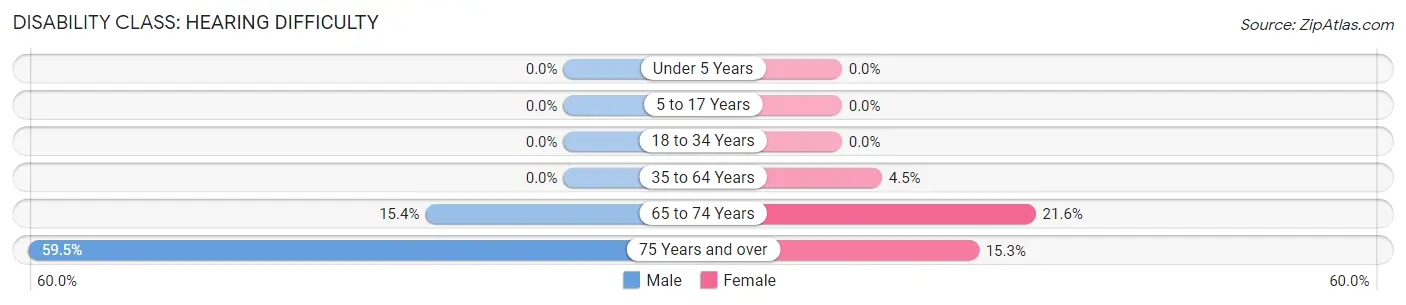
| Age Bracket | Male | Female |
| Under 5 Years | 0 (0.0%) | 0 (0.0%) |
| 5 to 17 Years | 0 (0.0%) | 0 (0.0%) |
| 18 to 34 Years | 0 (0.0%) | 0 (0.0%) |
| 35 to 64 Years | 0 (0.0%) | 15 (4.5%) |
| 65 to 74 Years | 6 (15.4%) | 19 (21.6%) |
| 75 Years and over | 25 (59.5%) | 9 (15.2%) |
Disability Class: Vision Difficulty
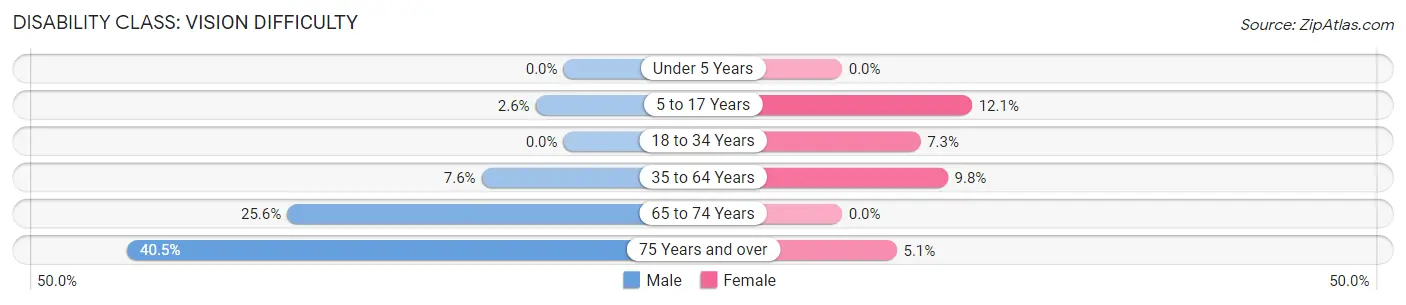
| Age Bracket | Male | Female |
| Under 5 Years | 0 (0.0%) | 0 (0.0%) |
| 5 to 17 Years | 9 (2.6%) | 41 (12.1%) |
| 18 to 34 Years | 0 (0.0%) | 23 (7.3%) |
| 35 to 64 Years | 25 (7.6%) | 33 (9.8%) |
| 65 to 74 Years | 10 (25.6%) | 0 (0.0%) |
| 75 Years and over | 17 (40.5%) | 3 (5.1%) |
Disability Class: Cognitive Difficulty
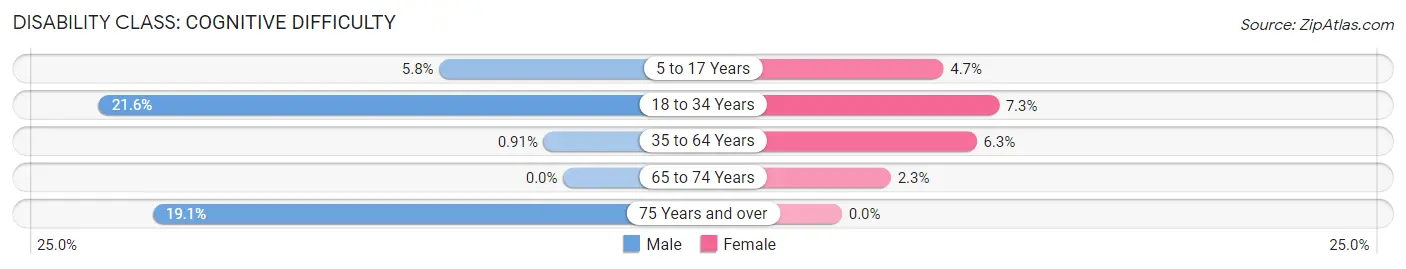
| Age Bracket | Male | Female |
| 5 to 17 Years | 20 (5.8%) | 16 (4.7%) |
| 18 to 34 Years | 25 (21.5%) | 23 (7.3%) |
| 35 to 64 Years | 3 (0.9%) | 21 (6.2%) |
| 65 to 74 Years | 0 (0.0%) | 2 (2.3%) |
| 75 Years and over | 8 (19.1%) | 0 (0.0%) |
Disability Class: Ambulatory Difficulty
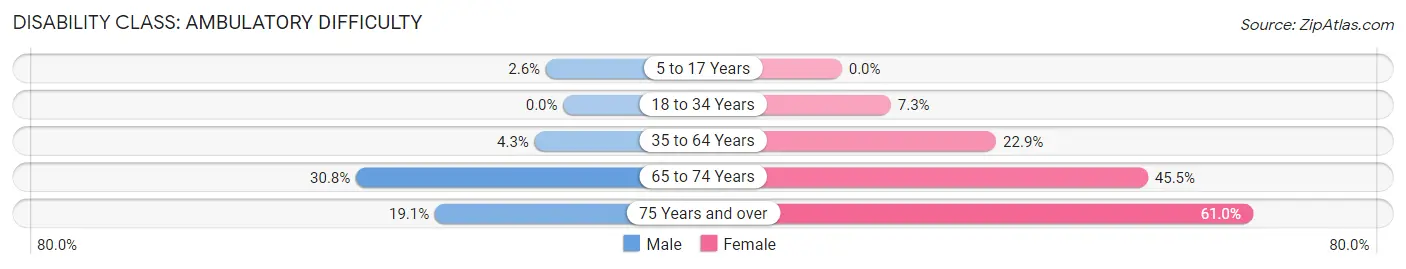
| Age Bracket | Male | Female |
| 5 to 17 Years | 9 (2.6%) | 0 (0.0%) |
| 18 to 34 Years | 0 (0.0%) | 23 (7.3%) |
| 35 to 64 Years | 14 (4.3%) | 77 (22.9%) |
| 65 to 74 Years | 12 (30.8%) | 40 (45.5%) |
| 75 Years and over | 8 (19.1%) | 36 (61.0%) |
Disability Class: Self-Care Difficulty
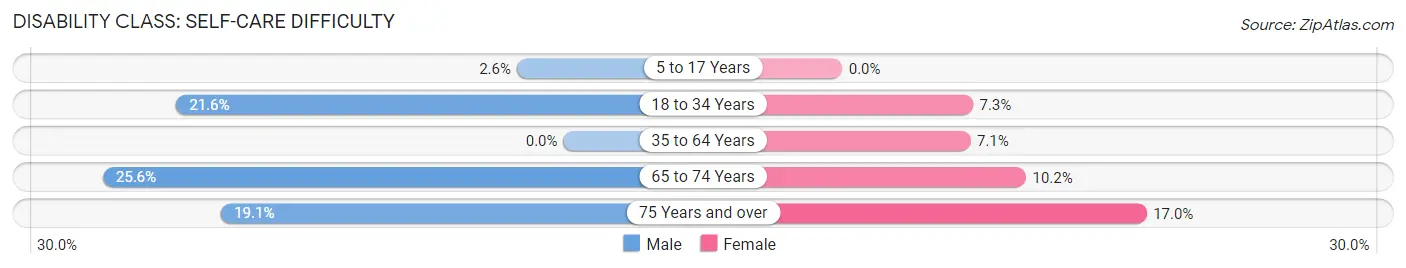
| Age Bracket | Male | Female |
| 5 to 17 Years | 9 (2.6%) | 0 (0.0%) |
| 18 to 34 Years | 25 (21.5%) | 23 (7.3%) |
| 35 to 64 Years | 0 (0.0%) | 24 (7.1%) |
| 65 to 74 Years | 10 (25.6%) | 9 (10.2%) |
| 75 Years and over | 8 (19.1%) | 10 (17.0%) |
Technology Access in Centreville
Computing Device Access in Centreville
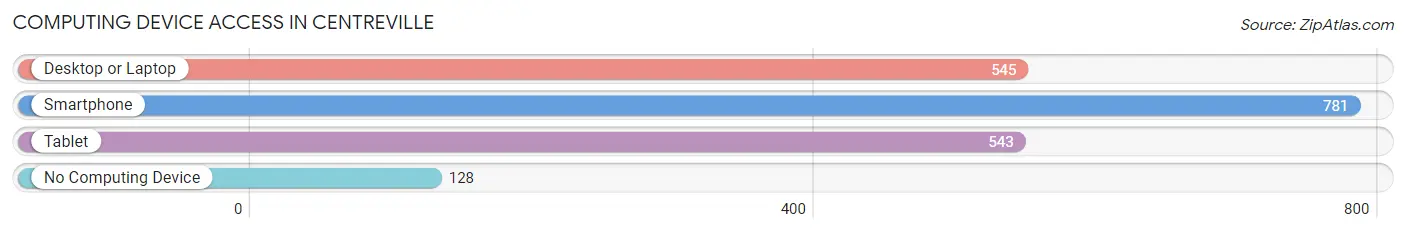
| Device Type | # Households | % Households |
| Desktop or Laptop | 545 | 58.9% |
| Smartphone | 781 | 84.4% |
| Tablet | 543 | 58.7% |
| No Computing Device | 128 | 13.8% |
| Total | 925 | 100.0% |
Internet Access in Centreville
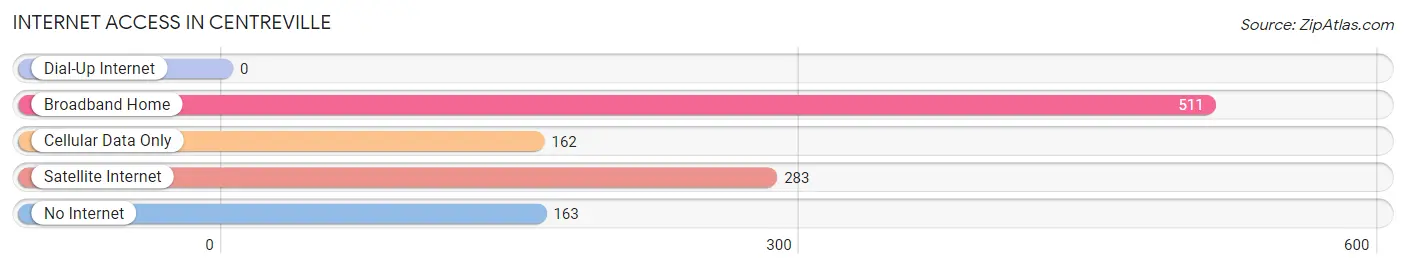
| Internet Type | # Households | % Households |
| Dial-Up Internet | 0 | 0.0% |
| Broadband Home | 511 | 55.2% |
| Cellular Data Only | 162 | 17.5% |
| Satellite Internet | 283 | 30.6% |
| No Internet | 163 | 17.6% |
| Total | 925 | 100.0% |
Centreville Summary
Centreville is a small town located in Wilkinson County, Mississippi. It is situated on the banks of the Homochitto River, approximately 40 miles south of Jackson, the state capital. The town was founded in 1820 and is the county seat of Wilkinson County. As of the 2010 census, the population of Centreville was 1,564.
History
Centreville was founded in 1820 by a group of settlers from Georgia and South Carolina. The town was named after the nearby Centreville Plantation, which was owned by the prominent local family of the same name. The town was incorporated in 1824 and quickly became an important trading center for the surrounding area.
In the early 19th century, Centreville was a major stop on the Natchez Trace, a major trade route between Nashville and Natchez. The town was also a major stop on the Mississippi Central Railroad, which connected the town to Jackson and other major cities in the region.
During the Civil War, Centreville was the site of several battles between Union and Confederate forces. The town was occupied by Union forces in 1863 and remained under their control until the end of the war.
Geography
Centreville is located in Wilkinson County, Mississippi, approximately 40 miles south of Jackson, the state capital. The town is situated on the banks of the Homochitto River and is surrounded by rolling hills and forests. The town is located in the Central Hills region of Mississippi and is part of the Jackson metropolitan area.
The climate in Centreville is humid subtropical, with hot, humid summers and mild winters. The average annual temperature is around 68°F (20°C). The average annual precipitation is around 50 inches (127 cm).
Economy
The economy of Centreville is largely based on agriculture and timber production. The town is home to several large timber companies, including Weyerhaeuser and International Paper. The town is also home to several small businesses, including restaurants, retail stores, and service providers.
The town is also home to several manufacturing companies, including a furniture factory and a paper mill. The town is also home to a large poultry processing plant.
Demographics
As of the 2010 census, the population of Centreville was 1,564. The racial makeup of the town was 79.3% White, 19.2% African American, 0.3% Native American, 0.2% Asian, and 0.9% from other races. Hispanic or Latino of any race were 1.2% of the population.
The median household income in Centreville was $30,938, and the median family income was $37,813. The per capita income in Centreville was $15,945. About 17.2% of families and 20.7% of the population were below the poverty line, including 28.2% of those under age 18 and 16.2% of those age 65 or over.
Common Questions
What is Per Capita Income in Centreville?
Per Capita income in Centreville is $22,546.
What is the Median Family Income in Centreville?
Median Family Income in Centreville is $33,859.
What is the Median Household income in Centreville?
Median Household Income in Centreville is $44,779.
What is Income or Wage Gap in Centreville?
Income or Wage Gap in Centreville is 37.7%.
Women in Centreville earn 62.3 cents for every dollar earned by a man.
What is Family Income Deficit in Centreville?
Family Income Deficit in Centreville is $12,895.
Families that are below poverty line in Centreville earn $12,895 less on average than the poverty threshold level.
What is Inequality or Gini Index in Centreville?
Inequality or Gini Index in Centreville is 0.53.
What is the Total Population of Centreville?
Total Population of Centreville is 2,352.
What is the Total Male Population of Centreville?
Total Male Population of Centreville is 1,054.
What is the Total Female Population of Centreville?
Total Female Population of Centreville is 1,298.
What is the Ratio of Males per 100 Females in Centreville?
There are 81.20 Males per 100 Females in Centreville.
What is the Ratio of Females per 100 Males in Centreville?
There are 123.15 Females per 100 Males in Centreville.
What is the Median Population Age in Centreville?
Median Population Age in Centreville is 29.5 Years.
What is the Average Family Size in Centreville
Average Family Size in Centreville is 3.5 People.
What is the Average Household Size in Centreville
Average Household Size in Centreville is 2.4 People.
How Large is the Labor Force in Centreville?
There are 735 People in the Labor Forcein in Centreville.
What is the Percentage of People in the Labor Force in Centreville?
47.5% of People are in the Labor Force in Centreville.
What is the Unemployment Rate in Centreville?
Unemployment Rate in Centreville is 1.0%.