Maben, MS Map & Demographics
Maben Map
Maben Overview
$11,604
PER CAPITA INCOME
$24,440
AVG FAMILY INCOME
$28,472
AVG HOUSEHOLD INCOME
0.36
INEQUALITY / GINI INDEX
1,024
TOTAL POPULATION
340
MALE POPULATION
684
FEMALE POPULATION
49.71
MALES / 100 FEMALES
201.18
FEMALES / 100 MALES
22.5
MEDIAN AGE
3.5
AVG FAMILY SIZE
2.8
AVG HOUSEHOLD SIZE
380
LABOR FORCE [ PEOPLE ]
64.3%
PERCENT IN LABOR FORCE
6.3%
UNEMPLOYMENT RATE
Maben Zip Codes
Maben Area Codes
Income in Maben
Income Overview in Maben
Per Capita Income in Maben is $11,604, while median incomes of families and households are $24,440 and $28,472 respectively.
| Characteristic | Number | Measure |
| Per Capita Income | 1,024 | $11,604 |
| Median Family Income | 228 | $24,440 |
| Mean Family Income | 228 | $38,768 |
| Median Household Income | 360 | $28,472 |
| Mean Household Income | 360 | $34,309 |
| Income Deficit | 228 | $0 |
| Wage / Income Gap (%) | 1,024 | 0.00% |
| Wage / Income Gap ($) | 1,024 | 100.00¢ per $1 |
| Gini / Inequality Index | 1,024 | 0.36 |
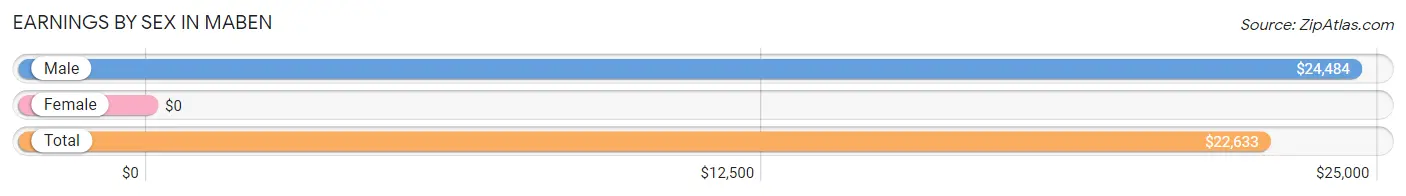
Earnings by Sex in Maben
| Sex | Number | Average Earnings |
| Male | 206 (51.4%) | $24,484 |
| Female | 195 (48.6%) | $0 |
| Total | 401 (100.0%) | $22,633 |
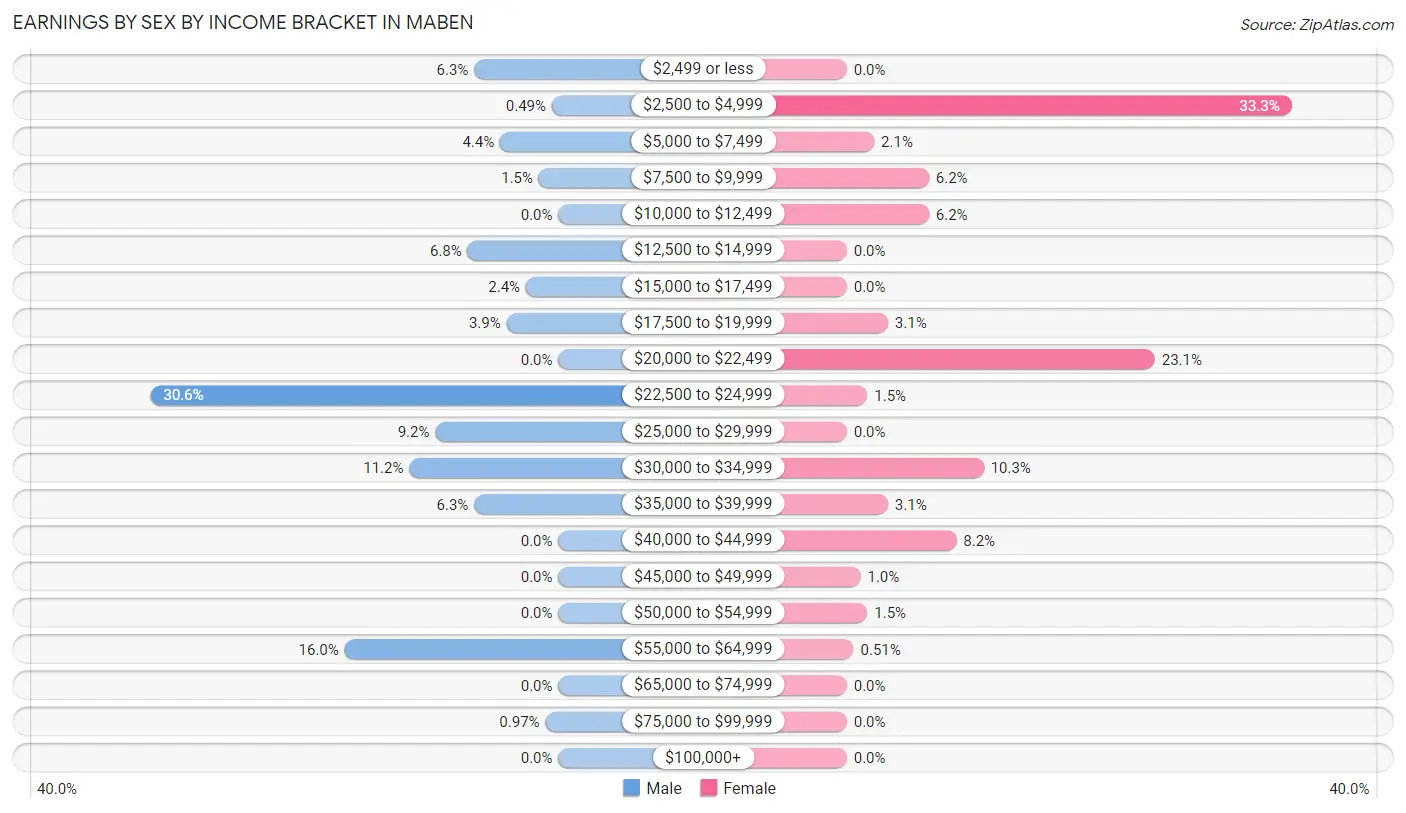
Earnings by Sex by Income Bracket in Maben
The most common earnings brackets in Maben are $22,500 to $24,999 for men (63 | 30.6%) and $2,500 to $4,999 for women (65 | 33.3%).
| Income | Male | Female |
| $2,499 or less | 13 (6.3%) | 0 (0.0%) |
| $2,500 to $4,999 | 1 (0.5%) | 65 (33.3%) |
| $5,000 to $7,499 | 9 (4.4%) | 4 (2.1%) |
| $7,500 to $9,999 | 3 (1.5%) | 12 (6.1%) |
| $10,000 to $12,499 | 0 (0.0%) | 12 (6.1%) |
| $12,500 to $14,999 | 14 (6.8%) | 0 (0.0%) |
| $15,000 to $17,499 | 5 (2.4%) | 0 (0.0%) |
| $17,500 to $19,999 | 8 (3.9%) | 6 (3.1%) |
| $20,000 to $22,499 | 0 (0.0%) | 45 (23.1%) |
| $22,500 to $24,999 | 63 (30.6%) | 3 (1.5%) |
| $25,000 to $29,999 | 19 (9.2%) | 0 (0.0%) |
| $30,000 to $34,999 | 23 (11.2%) | 20 (10.3%) |
| $35,000 to $39,999 | 13 (6.3%) | 6 (3.1%) |
| $40,000 to $44,999 | 0 (0.0%) | 16 (8.2%) |
| $45,000 to $49,999 | 0 (0.0%) | 2 (1.0%) |
| $50,000 to $54,999 | 0 (0.0%) | 3 (1.5%) |
| $55,000 to $64,999 | 33 (16.0%) | 1 (0.5%) |
| $65,000 to $74,999 | 0 (0.0%) | 0 (0.0%) |
| $75,000 to $99,999 | 2 (1.0%) | 0 (0.0%) |
| $100,000+ | 0 (0.0%) | 0 (0.0%) |
| Total | 206 (100.0%) | 195 (100.0%) |
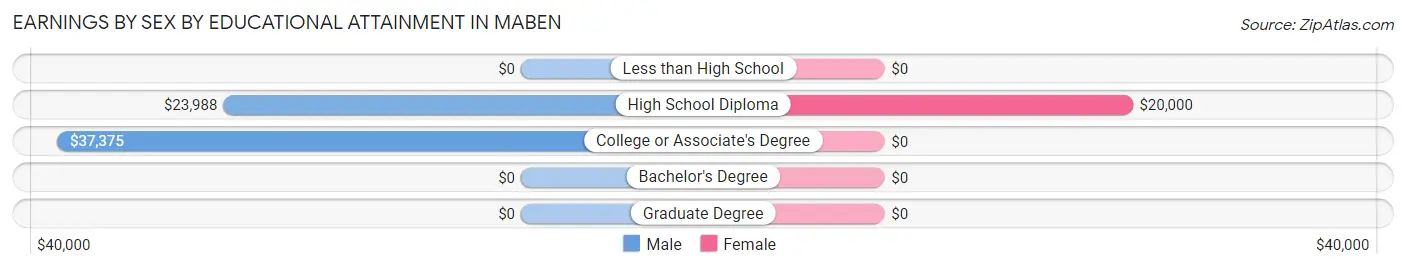
Earnings by Sex by Educational Attainment in Maben
Average earnings in Maben are $24,742 for men and $27,500 for women, a difference of 10.0%. Men with an educational attainment of college or associate's degree enjoy the highest average annual earnings of $37,375, while those with high school diploma education earn the least with $23,988. Women with an educational attainment of high school diploma earn the most with the average annual earnings of $20,000, while those with high school diploma education have the smallest earnings of $20,000.
| Educational Attainment | Male Income | Female Income |
| Less than High School | - | - |
| High School Diploma | $23,988 | $20,000 |
| College or Associate's Degree | $37,375 | $0 |
| Bachelor's Degree | - | - |
| Graduate Degree | - | - |
| Total | $24,742 | $27,500 |
Family Income in Maben
Family Income Brackets in Maben
According to the Maben family income data, there are 111 families falling into the $15,000 to $24,999 income range, which is the most common income bracket and makes up 48.7% of all families.
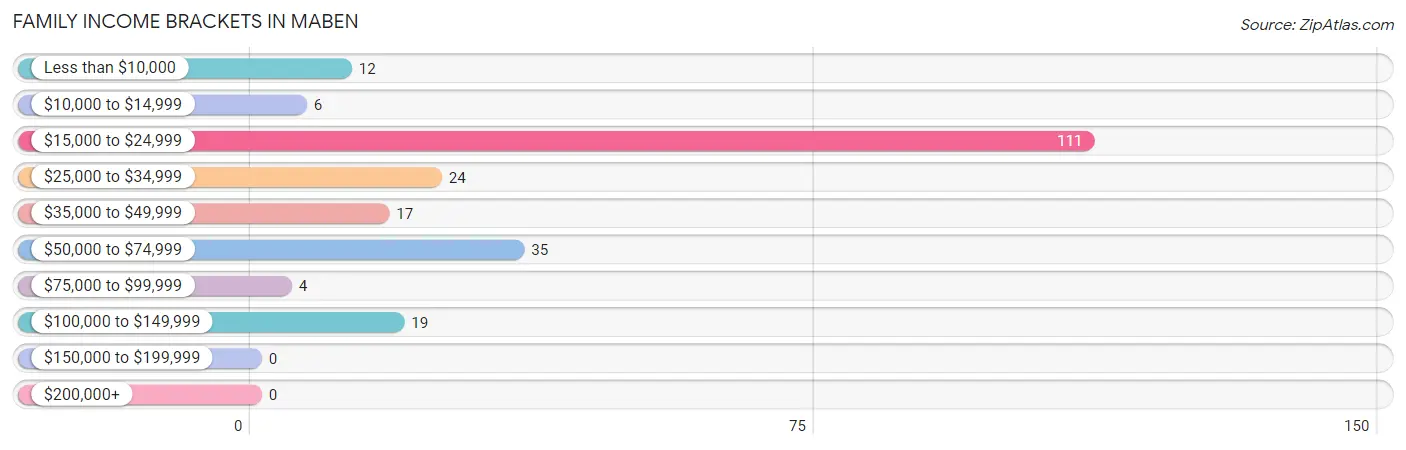
| Income Bracket | # Families | % Families |
| Less than $10,000 | 12 | 5.3% |
| $10,000 to $14,999 | 6 | 2.6% |
| $15,000 to $24,999 | 111 | 48.7% |
| $25,000 to $34,999 | 24 | 10.5% |
| $35,000 to $49,999 | 17 | 7.5% |
| $50,000 to $74,999 | 35 | 15.4% |
| $75,000 to $99,999 | 4 | 1.8% |
| $100,000 to $149,999 | 19 | 8.3% |
| $150,000 to $199,999 | 0 | 0.0% |
| $200,000+ | 0 | 0.0% |
Family Income by Famaliy Size in Maben
3-person families (25 | 11.0%) account for the highest median family income in Maben with $61,250 per family, while 3-person families (25 | 11.0%) have the highest median income of $20,417 per family member.
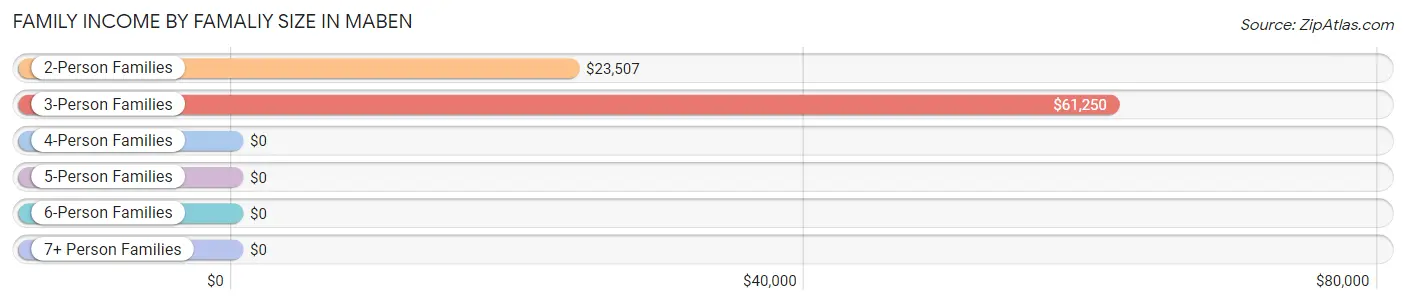
| Income Bracket | # Families | Median Income |
| 2-Person Families | 164 (71.9%) | $23,507 |
| 3-Person Families | 25 (11.0%) | $61,250 |
| 4-Person Families | 16 (7.0%) | $0 |
| 5-Person Families | 13 (5.7%) | $0 |
| 6-Person Families | 10 (4.4%) | $0 |
| 7+ Person Families | 0 (0.0%) | $0 |
| Total | 228 (100.0%) | $24,440 |
Family Income by Number of Earners in Maben
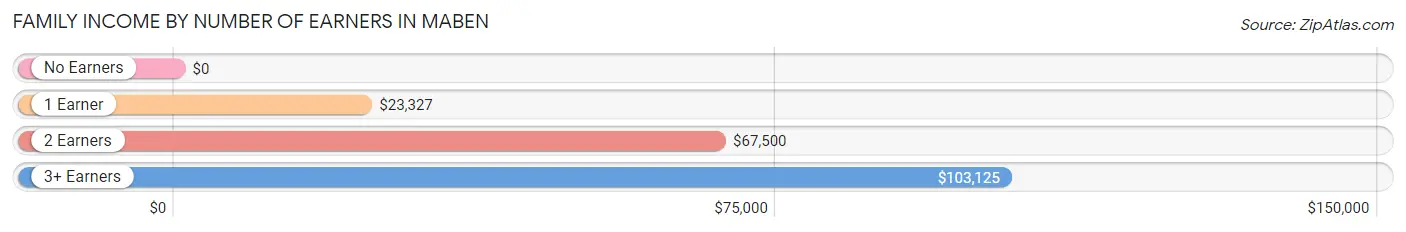
| Number of Earners | # Families | Median Income |
| No Earners | 13 (5.7%) | $0 |
| 1 Earner | 165 (72.4%) | $23,327 |
| 2 Earners | 30 (13.2%) | $67,500 |
| 3+ Earners | 20 (8.8%) | $103,125 |
| Total | 228 (100.0%) | $24,440 |
Household Income in Maben
Household Income Brackets in Maben
With 118 households falling in the category, the $25,000 to $34,999 income range is the most frequent in Maben, accounting for 32.8% of all households.
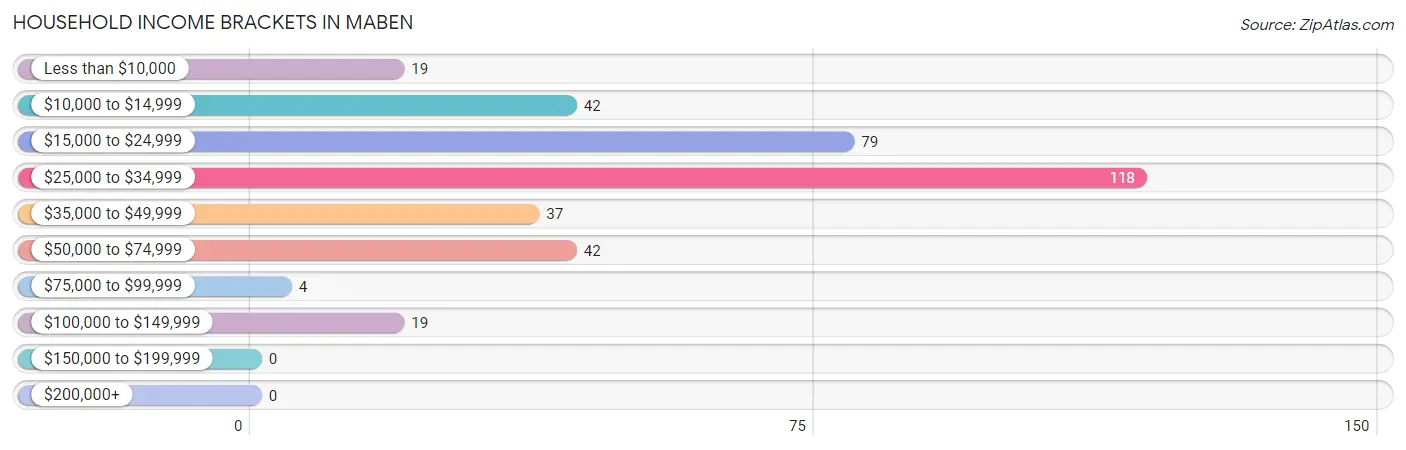
| Income Bracket | # Households | % Households |
| Less than $10,000 | 19 | 5.3% |
| $10,000 to $14,999 | 42 | 11.7% |
| $15,000 to $24,999 | 79 | 21.9% |
| $25,000 to $34,999 | 118 | 32.8% |
| $35,000 to $49,999 | 37 | 10.3% |
| $50,000 to $74,999 | 42 | 11.7% |
| $75,000 to $99,999 | 4 | 1.1% |
| $100,000 to $149,999 | 19 | 5.3% |
| $150,000 to $199,999 | 0 | 0.0% |
| $200,000+ | 0 | 0.0% |
Household Income by Householder Age in Maben
The median household income in Maben is $28,472, with the highest median household income of $41,979 found in the 45 to 64 years age bracket for the primary householder. A total of 101 households (28.1%) fall into this category. Meanwhile, the 65+ years age bracket for the primary householder has the lowest median household income of $0, with 55 households (15.3%) in this group.
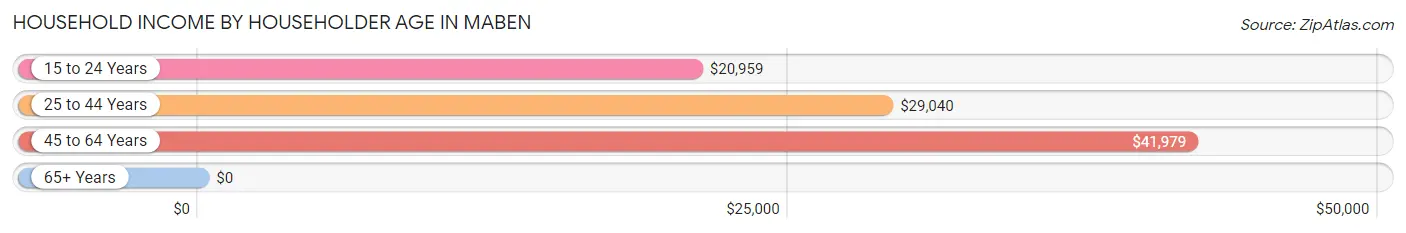
| Income Bracket | # Households | Median Income |
| 15 to 24 Years | 71 (19.7%) | $20,959 |
| 25 to 44 Years | 133 (36.9%) | $29,040 |
| 45 to 64 Years | 101 (28.1%) | $41,979 |
| 65+ Years | 55 (15.3%) | $0 |
| Total | 360 (100.0%) | $28,472 |
Poverty in Maben
Income Below Poverty by Sex and Age in Maben
With 25.9% poverty level for males and 25.6% for females among the residents of Maben, 15 year old males and 35 to 44 year old females are the most vulnerable to poverty, with 2 males (100.0%) and 24 females (63.2%) in their respective age groups living below the poverty level.
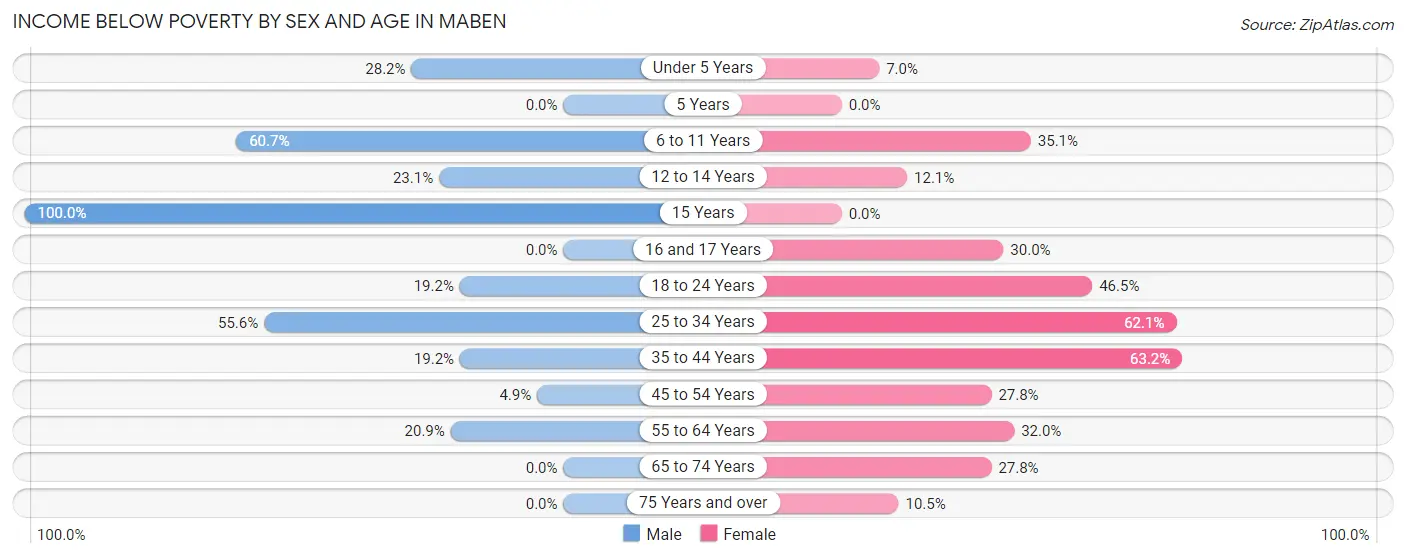
| Age Bracket | Male | Female |
| Under 5 Years | 11 (28.2%) | 18 (7.0%) |
| 5 Years | 0 (0.0%) | 0 (0.0%) |
| 6 to 11 Years | 17 (60.7%) | 20 (35.1%) |
| 12 to 14 Years | 3 (23.1%) | 4 (12.1%) |
| 15 Years | 2 (100.0%) | 0 (0.0%) |
| 16 and 17 Years | 0 (0.0%) | 3 (30.0%) |
| 18 to 24 Years | 5 (19.2%) | 53 (46.5%) |
| 25 to 34 Years | 20 (55.6%) | 18 (62.1%) |
| 35 to 44 Years | 19 (19.2%) | 24 (63.2%) |
| 45 to 54 Years | 2 (4.9%) | 10 (27.8%) |
| 55 to 64 Years | 9 (20.9%) | 16 (32.0%) |
| 65 to 74 Years | 0 (0.0%) | 5 (27.8%) |
| 75 Years and over | 0 (0.0%) | 4 (10.5%) |
| Total | 88 (25.9%) | 175 (25.6%) |
Income Above Poverty by Sex and Age in Maben
According to the poverty statistics in Maben, males aged 16 and 17 years and females aged 15 years are the age groups that are most secure financially, with 100.0% of males and 100.0% of females in these age groups living above the poverty line.
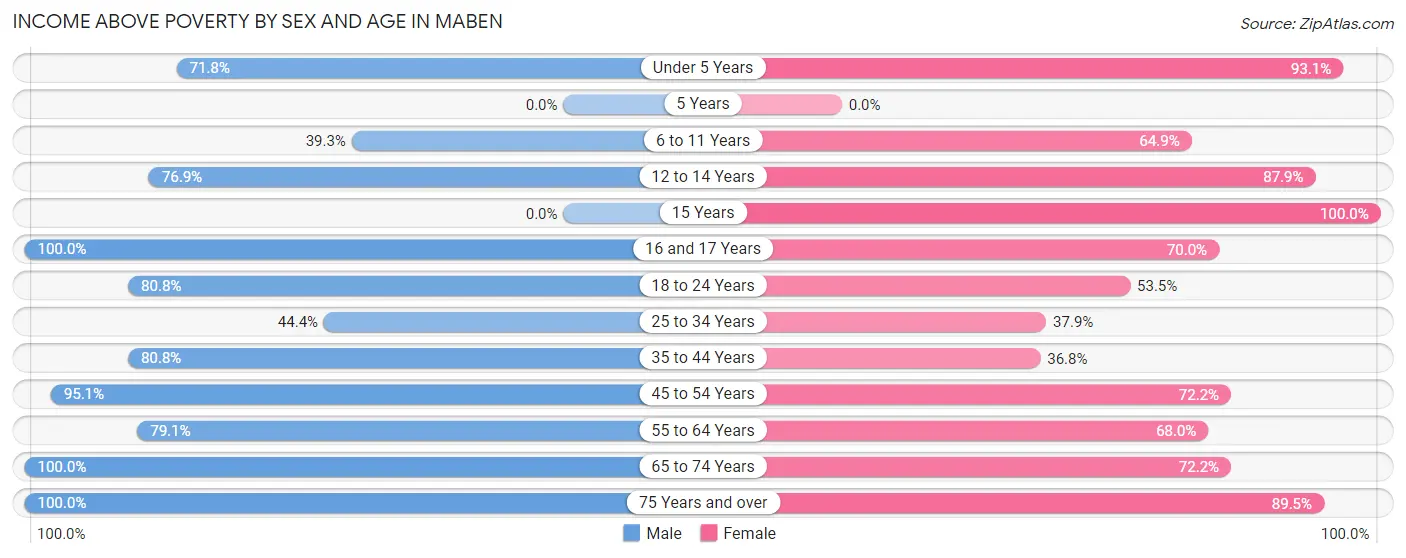
| Age Bracket | Male | Female |
| Under 5 Years | 28 (71.8%) | 241 (93.0%) |
| 5 Years | 0 (0.0%) | 0 (0.0%) |
| 6 to 11 Years | 11 (39.3%) | 37 (64.9%) |
| 12 to 14 Years | 10 (76.9%) | 29 (87.9%) |
| 15 Years | 0 (0.0%) | 2 (100.0%) |
| 16 and 17 Years | 3 (100.0%) | 7 (70.0%) |
| 18 to 24 Years | 21 (80.8%) | 61 (53.5%) |
| 25 to 34 Years | 16 (44.4%) | 11 (37.9%) |
| 35 to 44 Years | 80 (80.8%) | 14 (36.8%) |
| 45 to 54 Years | 39 (95.1%) | 26 (72.2%) |
| 55 to 64 Years | 34 (79.1%) | 34 (68.0%) |
| 65 to 74 Years | 7 (100.0%) | 13 (72.2%) |
| 75 Years and over | 3 (100.0%) | 34 (89.5%) |
| Total | 252 (74.1%) | 509 (74.4%) |
Income Below Poverty Among Married-Couple Families in Maben
The poverty statistics for married-couple families in Maben show that 5.0% or 3 of the total 60 families live below the poverty line. Families with 1 or 2 children have the highest poverty rate of 13.0%, comprising of 3 families. On the other hand, families with no children have the lowest poverty rate of 0.0%, which includes 0 families.
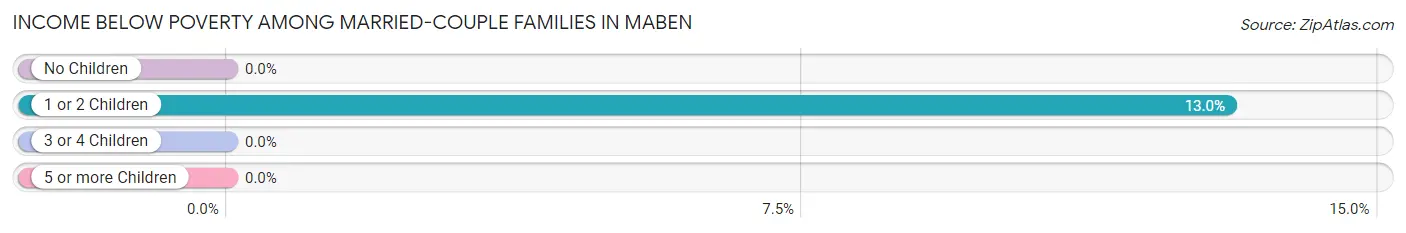
| Children | Above Poverty | Below Poverty |
| No Children | 33 (100.0%) | 0 (0.0%) |
| 1 or 2 Children | 20 (87.0%) | 3 (13.0%) |
| 3 or 4 Children | 4 (100.0%) | 0 (0.0%) |
| 5 or more Children | 0 (0.0%) | 0 (0.0%) |
| Total | 57 (95.0%) | 3 (5.0%) |
Income Below Poverty Among Single-Parent Households in Maben
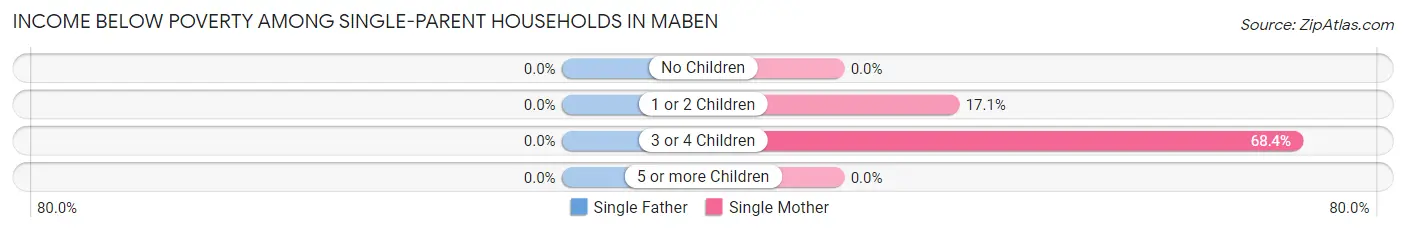
| Children | Single Father | Single Mother |
| No Children | 0 (0.0%) | 0 (0.0%) |
| 1 or 2 Children | 0 (0.0%) | 12 (17.1%) |
| 3 or 4 Children | 0 (0.0%) | 13 (68.4%) |
| 5 or more Children | 0 (0.0%) | 0 (0.0%) |
| Total | 0 (0.0%) | 25 (24.5%) |
Income Below Poverty Among Married-Couple vs Single-Parent Households in Maben
The poverty data for Maben shows that 3 of the married-couple family households (5.0%) and 25 of the single-parent households (14.9%) are living below the poverty level. Within the married-couple family households, those with 1 or 2 children have the highest poverty rate, with 3 households (13.0%) falling below the poverty line. Among the single-parent households, those with 3 or 4 children have the highest poverty rate, with 13 household (68.4%) living below poverty.
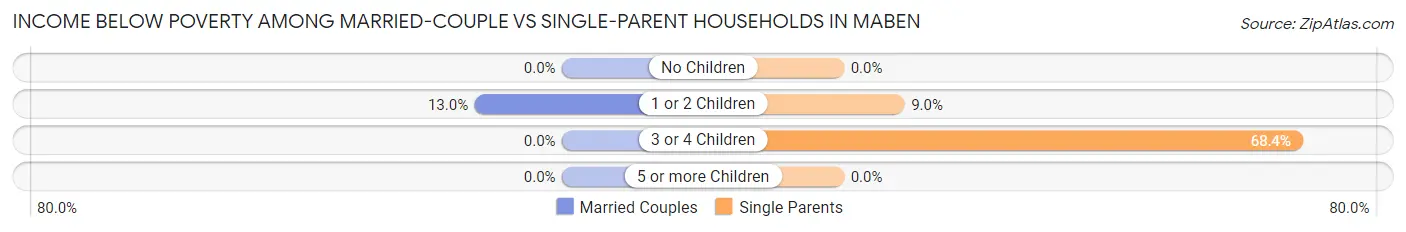
| Children | Married-Couple Families | Single-Parent Households |
| No Children | 0 (0.0%) | 0 (0.0%) |
| 1 or 2 Children | 3 (13.0%) | 12 (9.0%) |
| 3 or 4 Children | 0 (0.0%) | 13 (68.4%) |
| 5 or more Children | 0 (0.0%) | 0 (0.0%) |
| Total | 3 (5.0%) | 25 (14.9%) |
Race in Maben
The most populous races in Maben are Black / African American (521 | 50.9%), Two or more Races (270 | 26.4%), and White / Caucasian (200 | 19.5%).
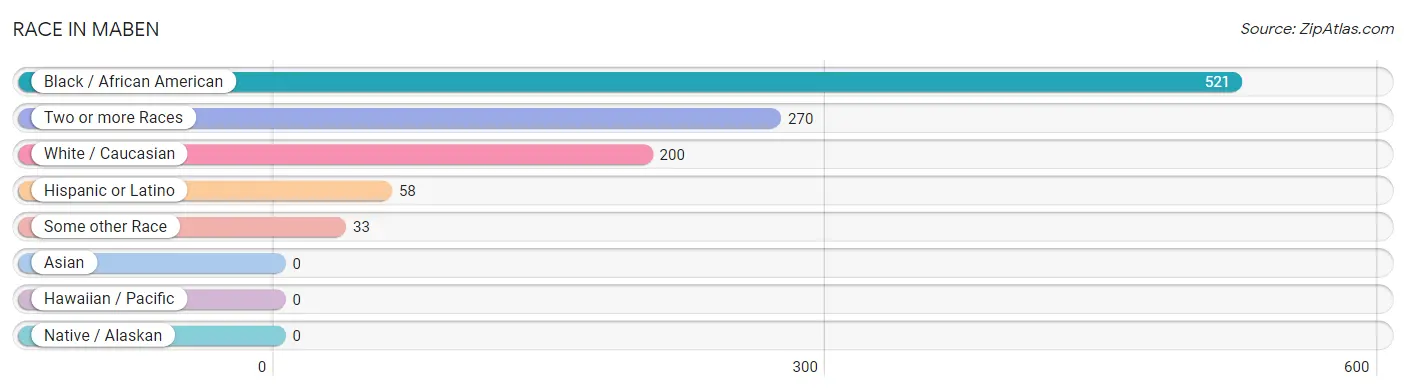
| Race | # Population | % Population |
| Asian | 0 | 0.0% |
| Black / African American | 521 | 50.9% |
| Hawaiian / Pacific | 0 | 0.0% |
| Hispanic or Latino | 58 | 5.7% |
| Native / Alaskan | 0 | 0.0% |
| White / Caucasian | 200 | 19.5% |
| Two or more Races | 270 | 26.4% |
| Some other Race | 33 | 3.2% |
| Total | 1,024 | 100.0% |
Ancestry in Maben
The most populous ancestries reported in Maben are English (313 | 30.6%), American (59 | 5.8%), Mexican (58 | 5.7%), Irish (13 | 1.3%), and Scottish (6 | 0.6%), together accounting for 43.9% of all Maben residents.
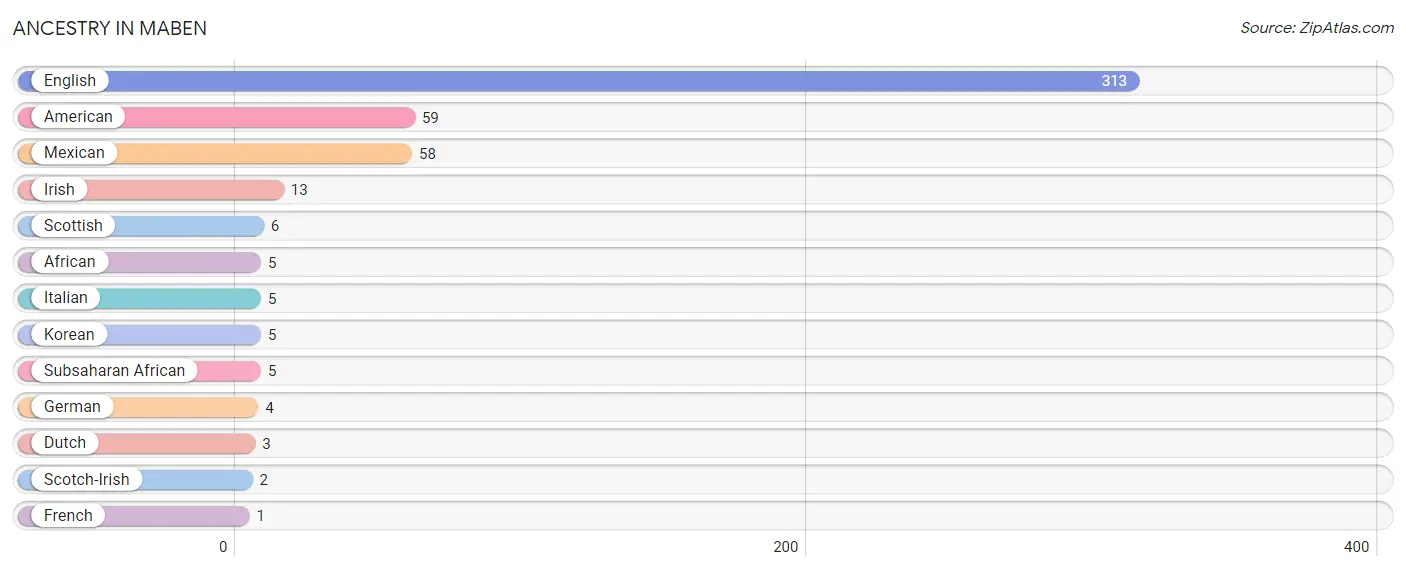
| Ancestry | # Population | % Population |
| African | 5 | 0.5% |
| American | 59 | 5.8% |
| Dutch | 3 | 0.3% |
| English | 313 | 30.6% |
| French | 1 | 0.1% |
| German | 4 | 0.4% |
| Irish | 13 | 1.3% |
| Italian | 5 | 0.5% |
| Korean | 5 | 0.5% |
| Mexican | 58 | 5.7% |
| Scotch-Irish | 2 | 0.2% |
| Scottish | 6 | 0.6% |
| Subsaharan African | 5 | 0.5% | View All 13 Rows |
Immigrants in Maben
The most numerous immigrant groups reported in Maben came from Central America (10 | 1.0%), Latin America (10 | 1.0%), and Mexico (10 | 1.0%), together accounting for 2.9% of all Maben residents.
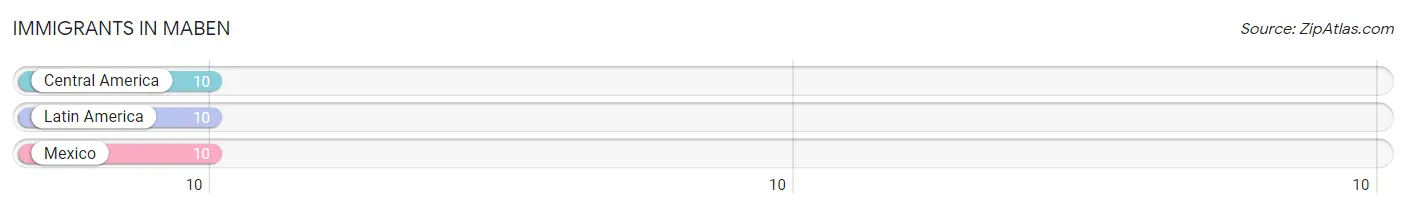
| Immigration Origin | # Population | % Population |
| Central America | 10 | 1.0% |
| Latin America | 10 | 1.0% |
| Mexico | 10 | 1.0% | View All 3 Rows |
Sex and Age in Maben
Sex and Age in Maben
The most populous age groups in Maben are 40 to 44 Years (84 | 24.7%) for men and Under 5 Years (259 | 37.9%) for women.
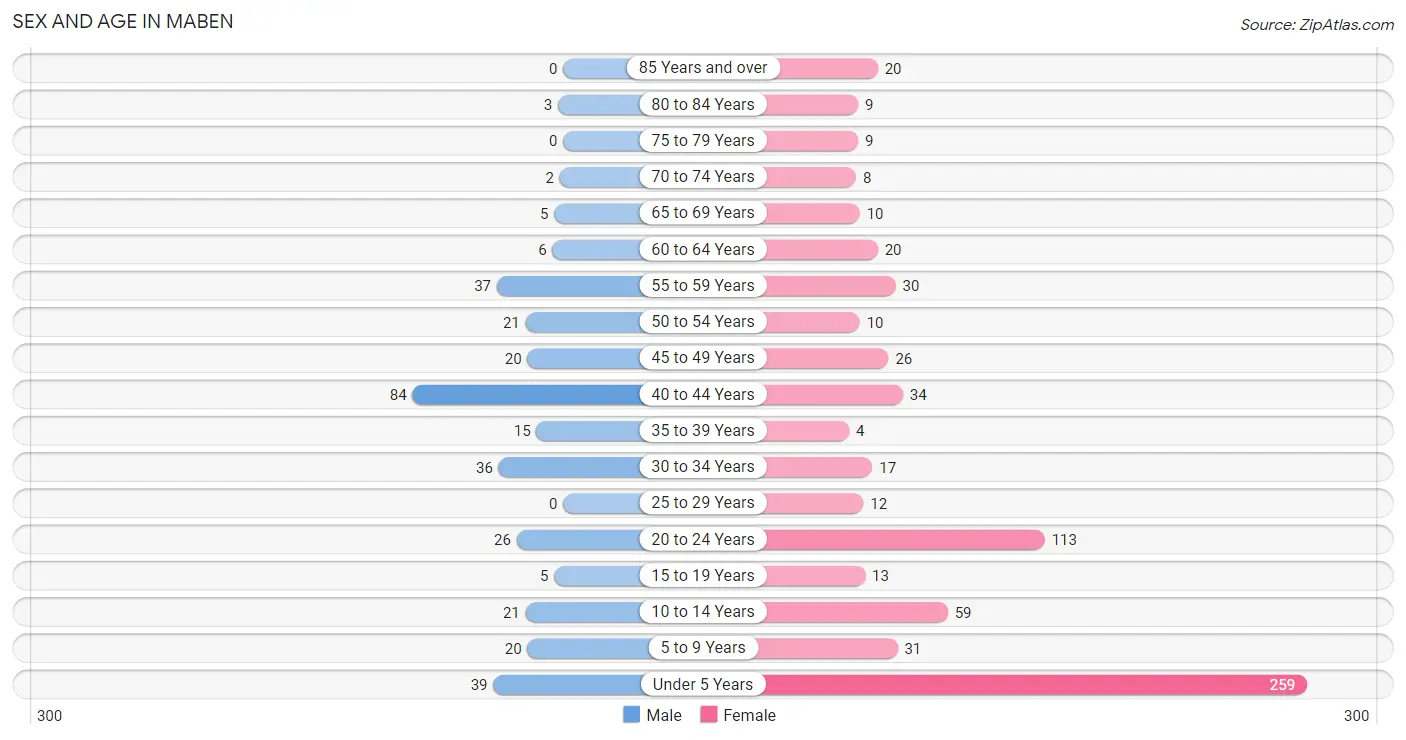
| Age Bracket | Male | Female |
| Under 5 Years | 39 (11.5%) | 259 (37.9%) |
| 5 to 9 Years | 20 (5.9%) | 31 (4.5%) |
| 10 to 14 Years | 21 (6.2%) | 59 (8.6%) |
| 15 to 19 Years | 5 (1.5%) | 13 (1.9%) |
| 20 to 24 Years | 26 (7.6%) | 113 (16.5%) |
| 25 to 29 Years | 0 (0.0%) | 12 (1.8%) |
| 30 to 34 Years | 36 (10.6%) | 17 (2.5%) |
| 35 to 39 Years | 15 (4.4%) | 4 (0.6%) |
| 40 to 44 Years | 84 (24.7%) | 34 (5.0%) |
| 45 to 49 Years | 20 (5.9%) | 26 (3.8%) |
| 50 to 54 Years | 21 (6.2%) | 10 (1.5%) |
| 55 to 59 Years | 37 (10.9%) | 30 (4.4%) |
| 60 to 64 Years | 6 (1.8%) | 20 (2.9%) |
| 65 to 69 Years | 5 (1.5%) | 10 (1.5%) |
| 70 to 74 Years | 2 (0.6%) | 8 (1.2%) |
| 75 to 79 Years | 0 (0.0%) | 9 (1.3%) |
| 80 to 84 Years | 3 (0.9%) | 9 (1.3%) |
| 85 Years and over | 0 (0.0%) | 20 (2.9%) |
| Total | 340 (100.0%) | 684 (100.0%) |
Families and Households in Maben
Median Family Size in Maben
The median family size in Maben is 3.45 persons per family, with single male/father families (66 | 28.9%) accounting for the largest median family size of 4.64 persons per family. On the other hand, single female/mother families (102 | 44.7%) represent the smallest median family size with 2.76 persons per family.
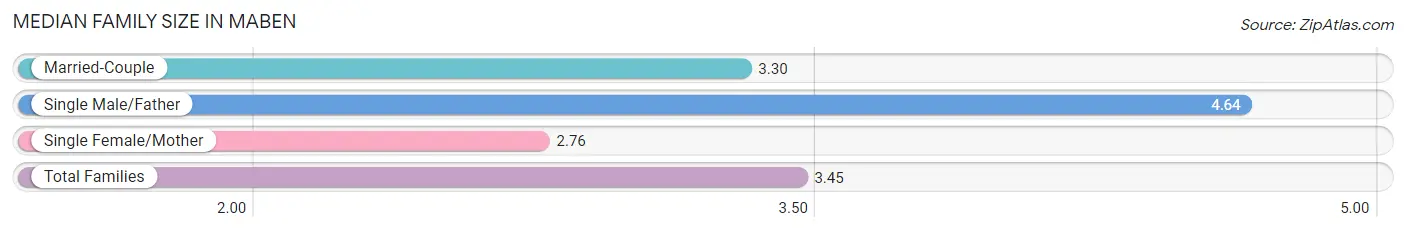
| Family Type | # Families | Family Size |
| Married-Couple | 60 (26.3%) | 3.30 |
| Single Male/Father | 66 (28.9%) | 4.64 |
| Single Female/Mother | 102 (44.7%) | 2.76 |
| Total Families | 228 (100.0%) | 3.45 |
Median Household Size in Maben
The median household size in Maben is 2.84 persons per household, with single male/father households (66 | 18.3%) accounting for the largest median household size of 5.21 persons per household. non-family households (132 | 36.7%) represent the smallest median household size with 1.44 persons per household.
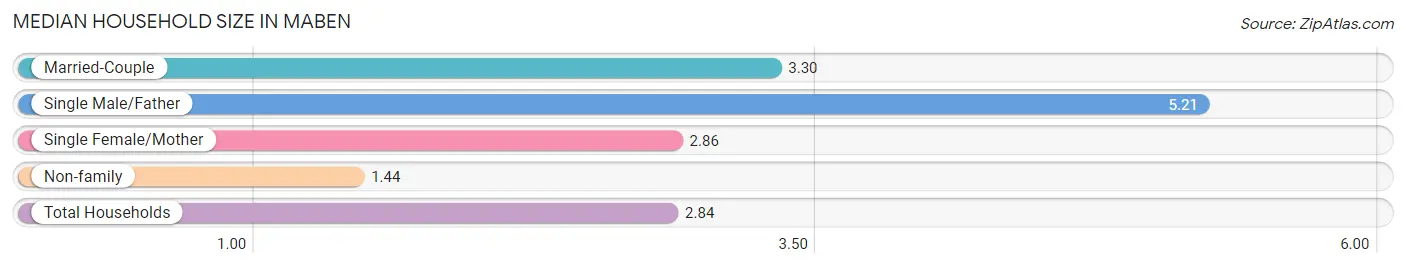
| Household Type | # Households | Household Size |
| Married-Couple | 60 (16.7%) | 3.30 |
| Single Male/Father | 66 (18.3%) | 5.21 |
| Single Female/Mother | 102 (28.3%) | 2.86 |
| Non-family | 132 (36.7%) | 1.44 |
| Total Households | 360 (100.0%) | 2.84 |
Household Size by Marriage Status in Maben
Out of a total of 360 households in Maben, 228 (63.3%) are family households, while 132 (36.7%) are nonfamily households. The most numerous type of family households are 3-person households, comprising 102, and the most common type of nonfamily households are 1-person households, comprising 96.
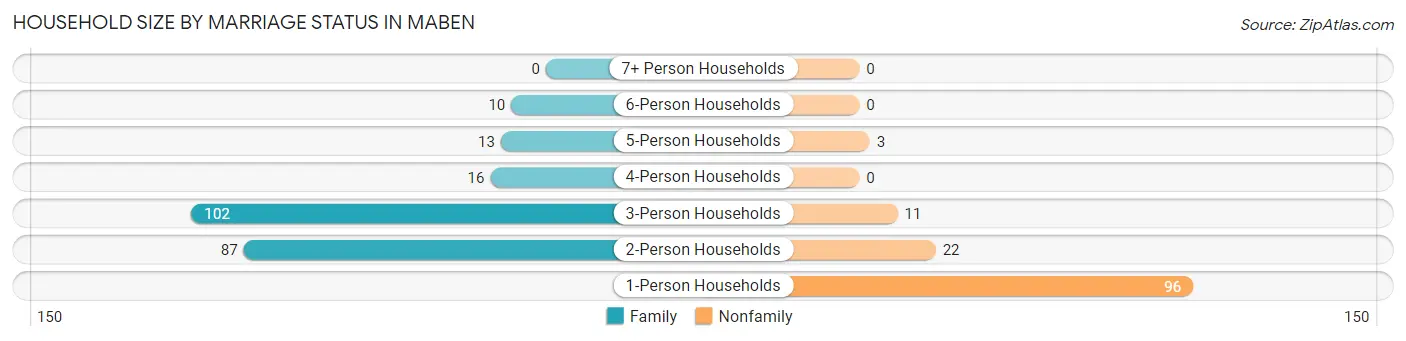
| Household Size | Family Households | Nonfamily Households |
| 1-Person Households | - | 96 (26.7%) |
| 2-Person Households | 87 (24.2%) | 22 (6.1%) |
| 3-Person Households | 102 (28.3%) | 11 (3.1%) |
| 4-Person Households | 16 (4.4%) | 0 (0.0%) |
| 5-Person Households | 13 (3.6%) | 3 (0.8%) |
| 6-Person Households | 10 (2.8%) | 0 (0.0%) |
| 7+ Person Households | 0 (0.0%) | 0 (0.0%) |
| Total | 228 (63.3%) | 132 (36.7%) |
Female Fertility in Maben
Fertility by Age in Maben
Average fertility rate in Maben is 297.0 births per 1,000 women. Women in the age bracket of 20 to 34 years have the highest fertility rate with 458.0 births per 1,000 women. Women in the age bracket of 20 to 34 years acount for 100.0% of all women with births.
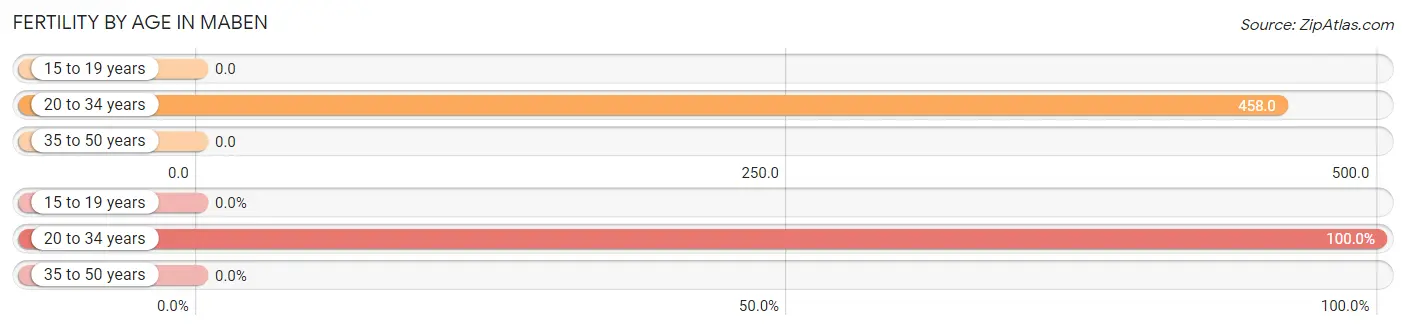
| Age Bracket | Women with Births | Births / 1,000 Women |
| 15 to 19 years | 0 (0.0%) | 0.0 |
| 20 to 34 years | 65 (100.0%) | 458.0 |
| 35 to 50 years | 0 (0.0%) | 0.0 |
| Total | 65 (100.0%) | 297.0 |
Fertility by Age by Marriage Status in Maben
9.2% of women with births (65) in Maben are married. The highest percentage of unmarried women with births falls into 20 to 34 years age bracket with 90.8% of them unmarried at the time of birth, while the lowest percentage of unmarried women with births belong to 20 to 34 years age bracket with 90.8% of them unmarried.
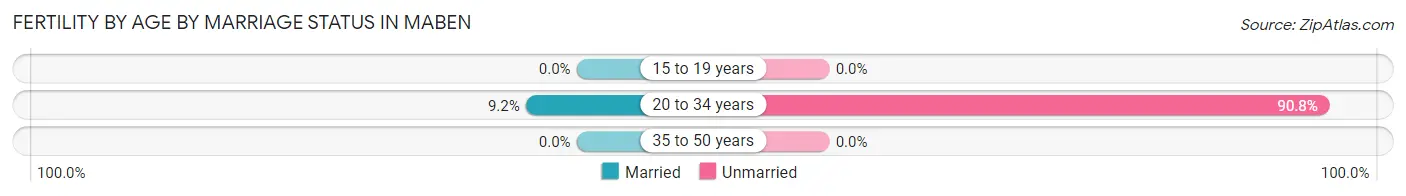
| Age Bracket | Married | Unmarried |
| 15 to 19 years | 0 (0.0%) | 0 (0.0%) |
| 20 to 34 years | 6 (9.2%) | 59 (90.8%) |
| 35 to 50 years | 0 (0.0%) | 0 (0.0%) |
| Total | 6 (9.2%) | 59 (90.8%) |
Fertility by Education in Maben
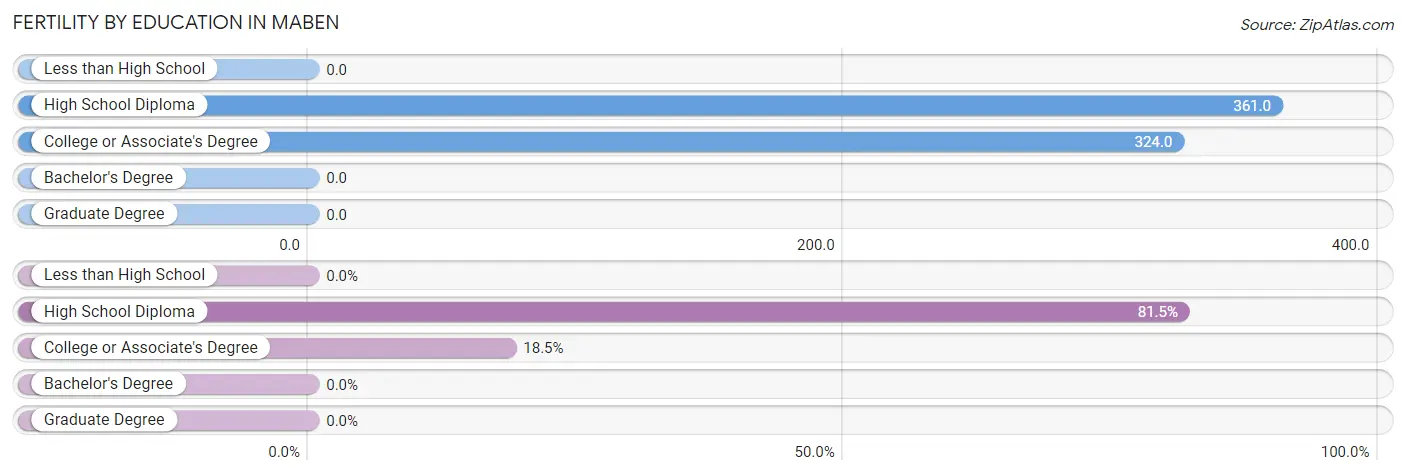
| Educational Attainment | Women with Births | Births / 1,000 Women |
| Less than High School | 0 (0.0%) | 0.0 |
| High School Diploma | 53 (81.5%) | 361.0 |
| College or Associate's Degree | 12 (18.5%) | 324.0 |
| Bachelor's Degree | 0 (0.0%) | 0.0 |
| Graduate Degree | 0 (0.0%) | 0.0 |
| Total | 65 (100.0%) | 297.0 |
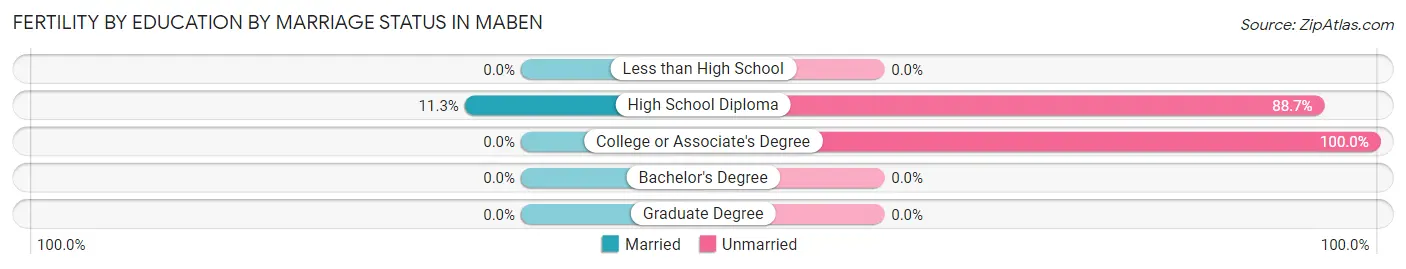
Fertility by Education by Marriage Status in Maben
90.8% of women with births in Maben are unmarried. Women with the educational attainment of high school diploma are most likely to be married with 11.3% of them married at childbirth, while women with the educational attainment of college or associate's degree are least likely to be married with 100.0% of them unmarried at childbirth.
| Educational Attainment | Married | Unmarried |
| Less than High School | 0 (0.0%) | 0 (0.0%) |
| High School Diploma | 6 (11.3%) | 47 (88.7%) |
| College or Associate's Degree | 0 (0.0%) | 12 (100.0%) |
| Bachelor's Degree | 0 (0.0%) | 0 (0.0%) |
| Graduate Degree | 0 (0.0%) | 0 (0.0%) |
| Total | 6 (9.2%) | 59 (90.8%) |
Employment Characteristics in Maben
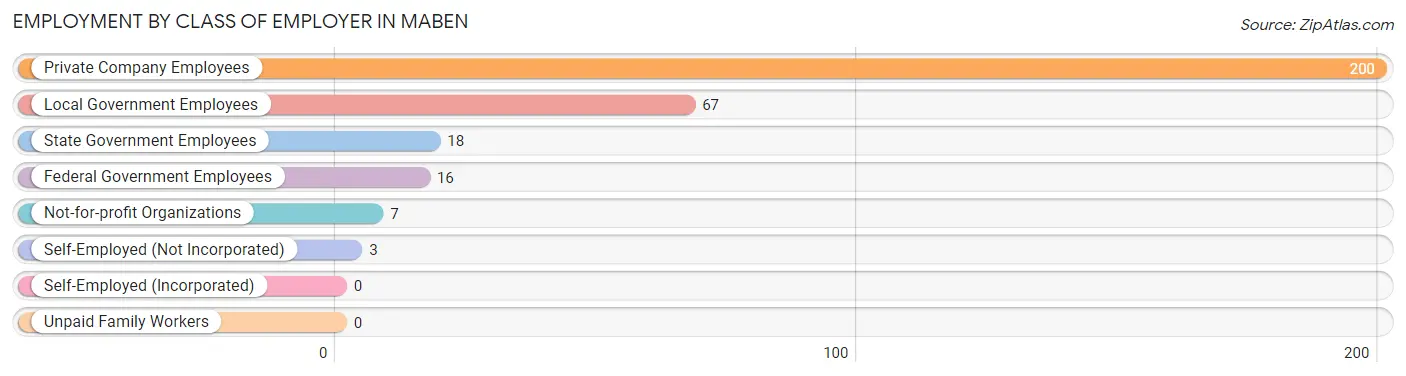
Employment by Class of Employer in Maben
Among the 311 employed individuals in Maben, private company employees (200 | 64.3%), local government employees (67 | 21.5%), and state government employees (18 | 5.8%) make up the most common classes of employment.
| Employer Class | # Employees | % Employees |
| Private Company Employees | 200 | 64.3% |
| Self-Employed (Incorporated) | 0 | 0.0% |
| Self-Employed (Not Incorporated) | 3 | 1.0% |
| Not-for-profit Organizations | 7 | 2.2% |
| Local Government Employees | 67 | 21.5% |
| State Government Employees | 18 | 5.8% |
| Federal Government Employees | 16 | 5.1% |
| Unpaid Family Workers | 0 | 0.0% |
| Total | 311 | 100.0% |
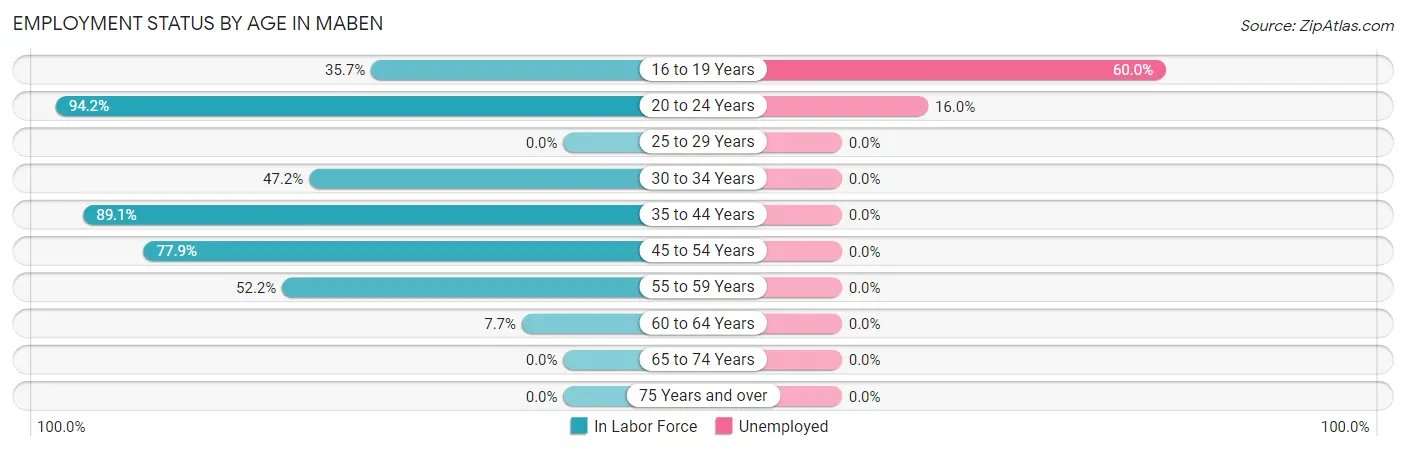
Employment Status by Age in Maben
According to the labor force statistics for Maben, out of the total population over 16 years of age (591), 64.3% or 380 individuals are in the labor force, with 6.3% or 24 of them unemployed. The age group with the highest labor force participation rate is 20 to 24 years, with 94.2% or 131 individuals in the labor force. Within the labor force, the 16 to 19 years age range has the highest percentage of unemployed individuals, with 60.0% or 3 of them being unemployed.
| Age Bracket | In Labor Force | Unemployed |
| 16 to 19 Years | 5 (35.7%) | 3 (60.0%) |
| 20 to 24 Years | 131 (94.2%) | 21 (16.0%) |
| 25 to 29 Years | 0 (0.0%) | 0 (0.0%) |
| 30 to 34 Years | 25 (47.2%) | 0 (0.0%) |
| 35 to 44 Years | 122 (89.1%) | 0 (0.0%) |
| 45 to 54 Years | 60 (77.9%) | 0 (0.0%) |
| 55 to 59 Years | 35 (52.2%) | 0 (0.0%) |
| 60 to 64 Years | 2 (7.7%) | 0 (0.0%) |
| 65 to 74 Years | 0 (0.0%) | 0 (0.0%) |
| 75 Years and over | 0 (0.0%) | 0 (0.0%) |
| Total | 380 (64.3%) | 24 (6.3%) |
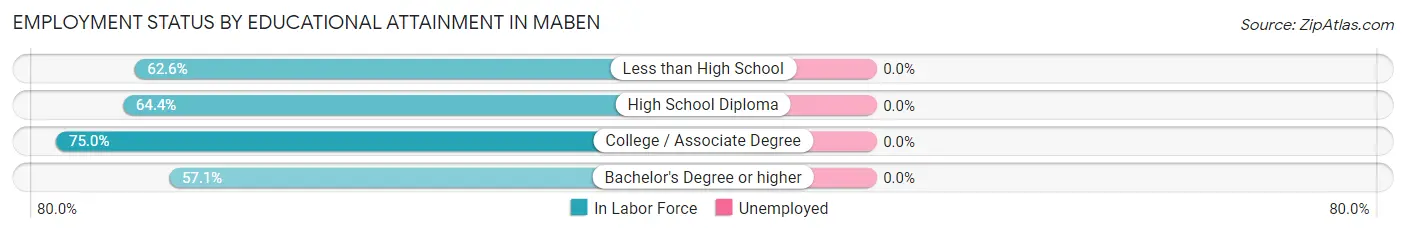
Employment Status by Educational Attainment in Maben
| Educational Attainment | In Labor Force | Unemployed |
| Less than High School | 57 (62.6%) | 0 (0.0%) |
| High School Diploma | 121 (64.4%) | 0 (0.0%) |
| College / Associate Degree | 54 (75.0%) | 0 (0.0%) |
| Bachelor's Degree or higher | 12 (57.1%) | 0 (0.0%) |
| Total | 244 (65.6%) | 0 (0.0%) |
Employment Occupations by Sex in Maben
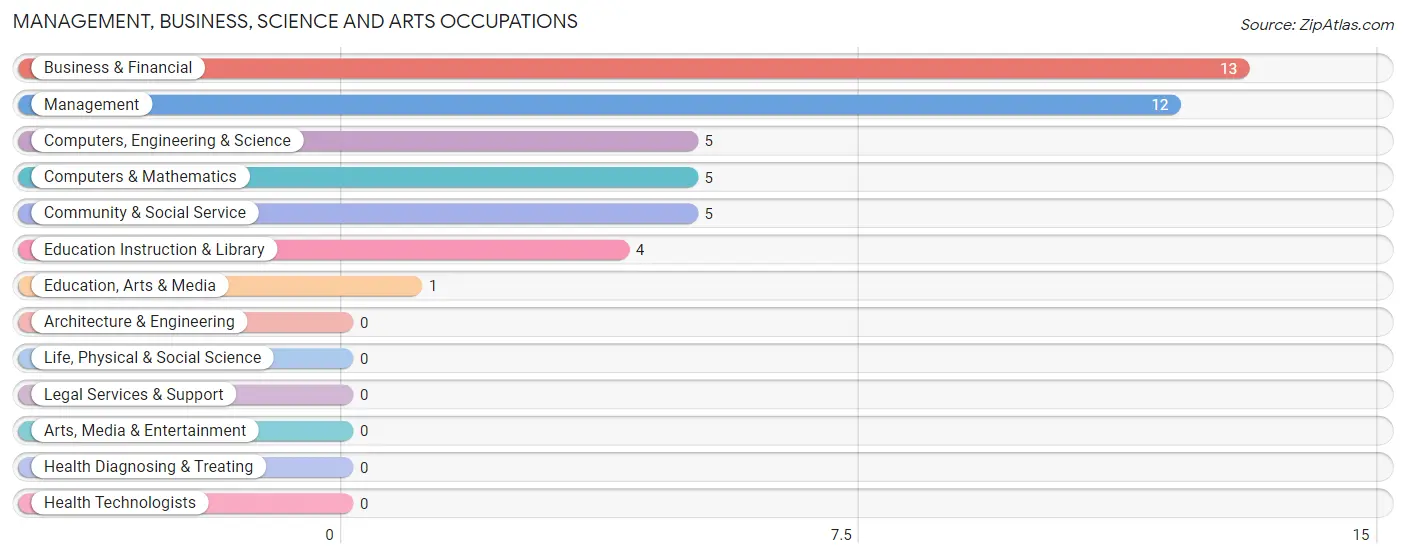
Management, Business, Science and Arts Occupations
The most common Management, Business, Science and Arts occupations in Maben are Business & Financial (13 | 3.6%), Management (12 | 3.4%), Computers, Engineering & Science (5 | 1.4%), Computers & Mathematics (5 | 1.4%), and Community & Social Service (5 | 1.4%).
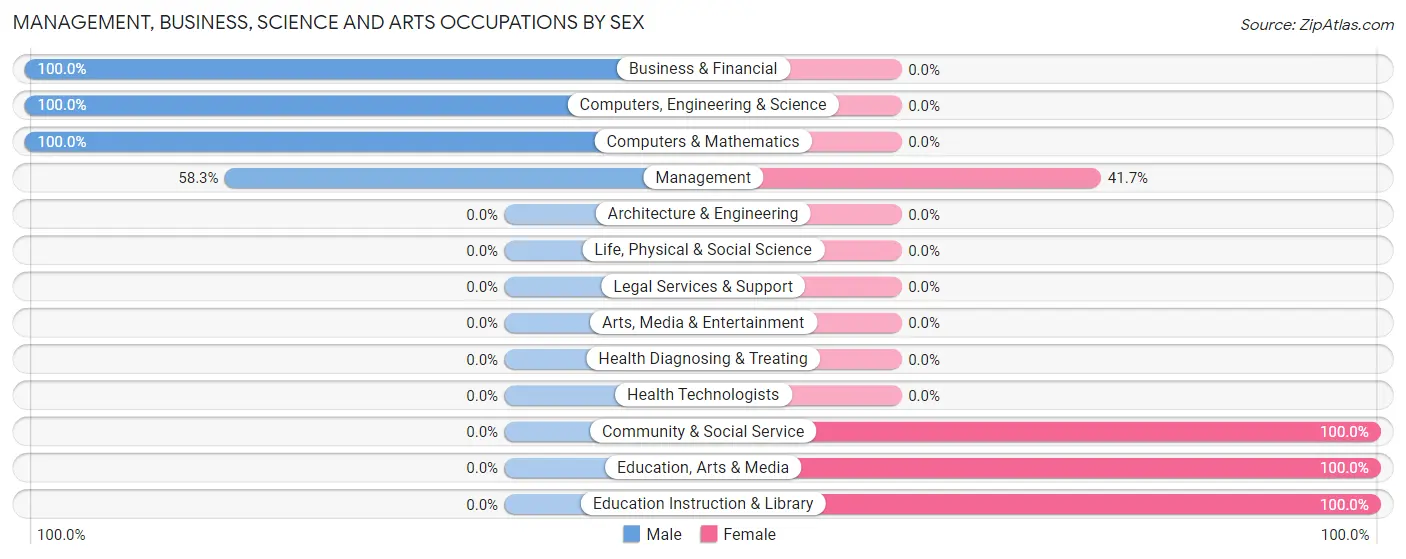
Management, Business, Science and Arts Occupations by Sex
Within the Management, Business, Science and Arts occupations in Maben, the most male-oriented occupations are Business & Financial (100.0%), Computers, Engineering & Science (100.0%), and Computers & Mathematics (100.0%), while the most female-oriented occupations are Community & Social Service (100.0%), Education, Arts & Media (100.0%), and Education Instruction & Library (100.0%).
| Occupation | Male | Female |
| Management | 7 (58.3%) | 5 (41.7%) |
| Business & Financial | 13 (100.0%) | 0 (0.0%) |
| Computers, Engineering & Science | 5 (100.0%) | 0 (0.0%) |
| Computers & Mathematics | 5 (100.0%) | 0 (0.0%) |
| Architecture & Engineering | 0 (0.0%) | 0 (0.0%) |
| Life, Physical & Social Science | 0 (0.0%) | 0 (0.0%) |
| Community & Social Service | 0 (0.0%) | 5 (100.0%) |
| Education, Arts & Media | 0 (0.0%) | 1 (100.0%) |
| Legal Services & Support | 0 (0.0%) | 0 (0.0%) |
| Education Instruction & Library | 0 (0.0%) | 4 (100.0%) |
| Arts, Media & Entertainment | 0 (0.0%) | 0 (0.0%) |
| Health Diagnosing & Treating | 0 (0.0%) | 0 (0.0%) |
| Health Technologists | 0 (0.0%) | 0 (0.0%) |
| Total (Category) | 25 (71.4%) | 10 (28.6%) |
| Total (Overall) | 191 (53.6%) | 165 (46.4%) |
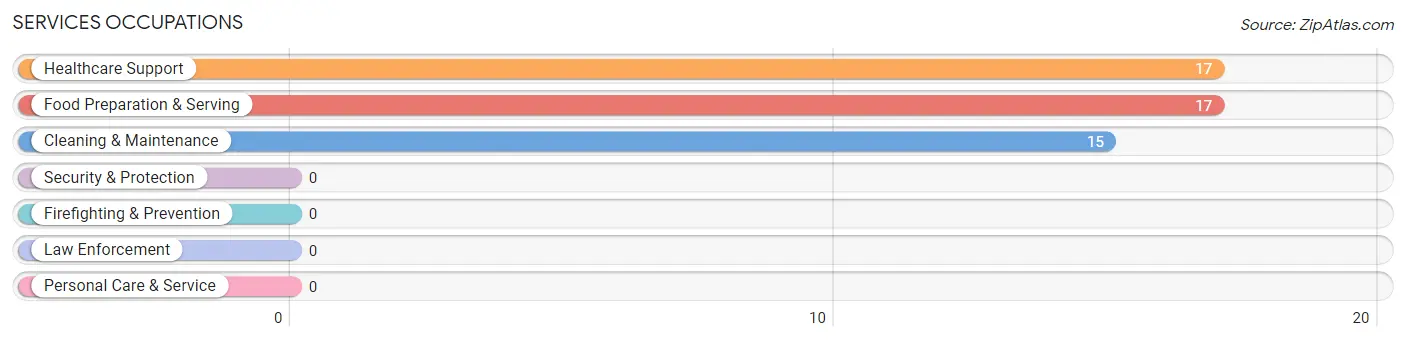
Services Occupations
The most common Services occupations in Maben are Healthcare Support (17 | 4.8%), Food Preparation & Serving (17 | 4.8%), and Cleaning & Maintenance (15 | 4.2%).
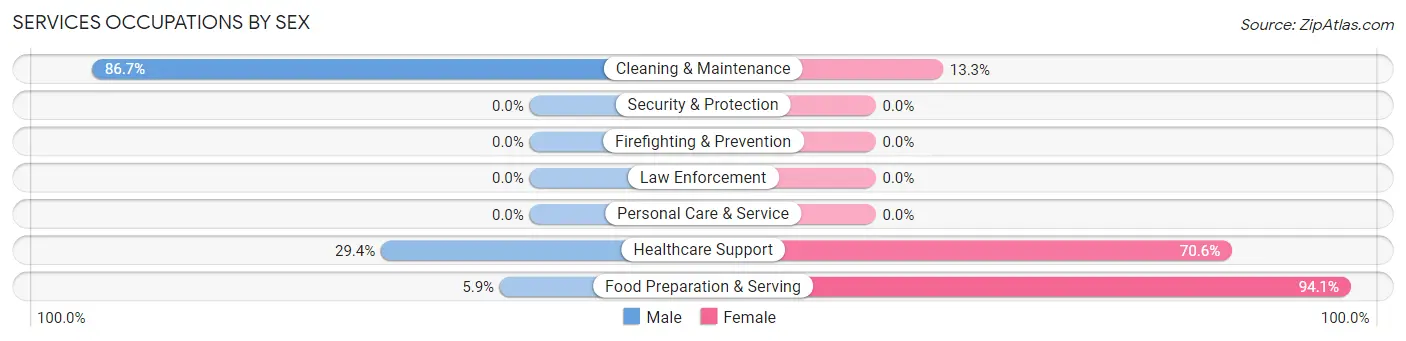
Services Occupations by Sex
Within the Services occupations in Maben, the most male-oriented occupations are Cleaning & Maintenance (86.7%), Healthcare Support (29.4%), and Food Preparation & Serving (5.9%), while the most female-oriented occupations are Food Preparation & Serving (94.1%), Healthcare Support (70.6%), and Cleaning & Maintenance (13.3%).
| Occupation | Male | Female |
| Healthcare Support | 5 (29.4%) | 12 (70.6%) |
| Security & Protection | 0 (0.0%) | 0 (0.0%) |
| Firefighting & Prevention | 0 (0.0%) | 0 (0.0%) |
| Law Enforcement | 0 (0.0%) | 0 (0.0%) |
| Food Preparation & Serving | 1 (5.9%) | 16 (94.1%) |
| Cleaning & Maintenance | 13 (86.7%) | 2 (13.3%) |
| Personal Care & Service | 0 (0.0%) | 0 (0.0%) |
| Total (Category) | 19 (38.8%) | 30 (61.2%) |
| Total (Overall) | 191 (53.6%) | 165 (46.4%) |
Sales and Office Occupations
The most common Sales and Office occupations in Maben are Sales & Related (89 | 25.0%), and Office & Administration (21 | 5.9%).
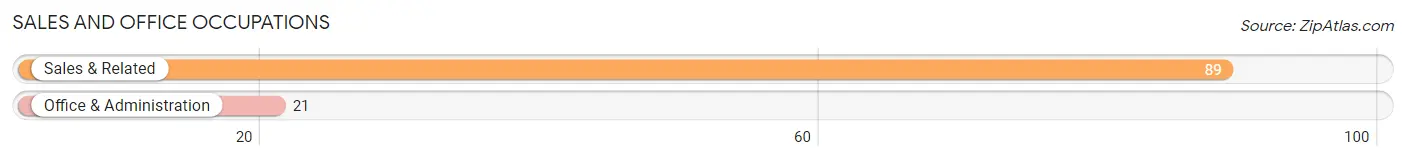
Sales and Office Occupations by Sex
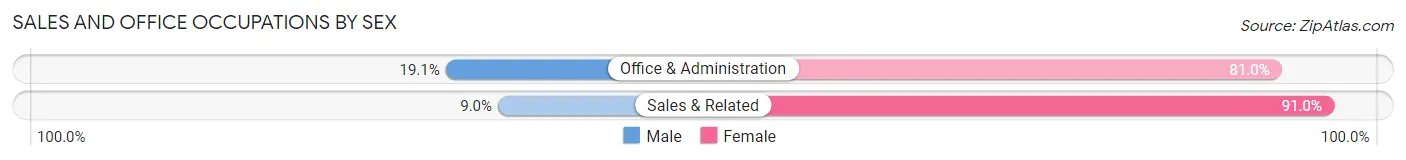
| Occupation | Male | Female |
| Sales & Related | 8 (9.0%) | 81 (91.0%) |
| Office & Administration | 4 (19.1%) | 17 (80.9%) |
| Total (Category) | 12 (10.9%) | 98 (89.1%) |
| Total (Overall) | 191 (53.6%) | 165 (46.4%) |
Natural Resources, Construction and Maintenance Occupations
The most common Natural Resources, Construction and Maintenance occupations in Maben are Construction & Extraction (78 | 21.9%), Farming, Fishing & Forestry (9 | 2.5%), and Installation, Maintenance & Repair (6 | 1.7%).
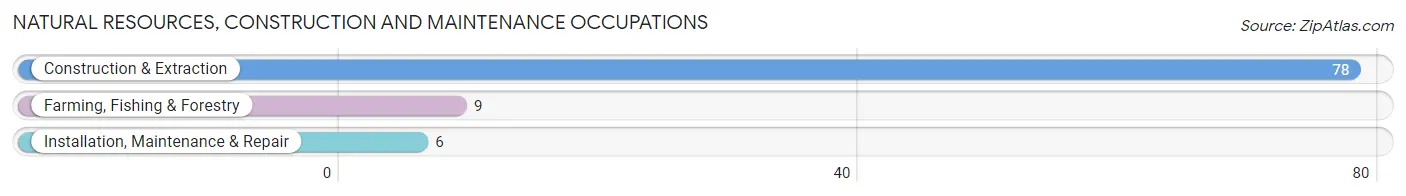
Natural Resources, Construction and Maintenance Occupations by Sex
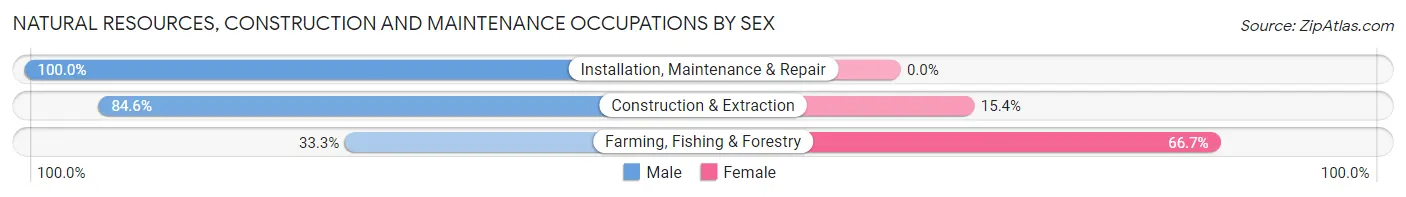
| Occupation | Male | Female |
| Farming, Fishing & Forestry | 3 (33.3%) | 6 (66.7%) |
| Construction & Extraction | 66 (84.6%) | 12 (15.4%) |
| Installation, Maintenance & Repair | 6 (100.0%) | 0 (0.0%) |
| Total (Category) | 75 (80.6%) | 18 (19.4%) |
| Total (Overall) | 191 (53.6%) | 165 (46.4%) |
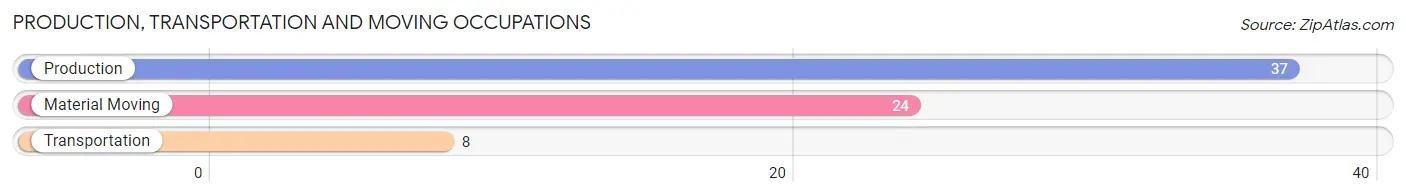
Production, Transportation and Moving Occupations
The most common Production, Transportation and Moving occupations in Maben are Production (37 | 10.4%), Material Moving (24 | 6.7%), and Transportation (8 | 2.2%).
Production, Transportation and Moving Occupations by Sex
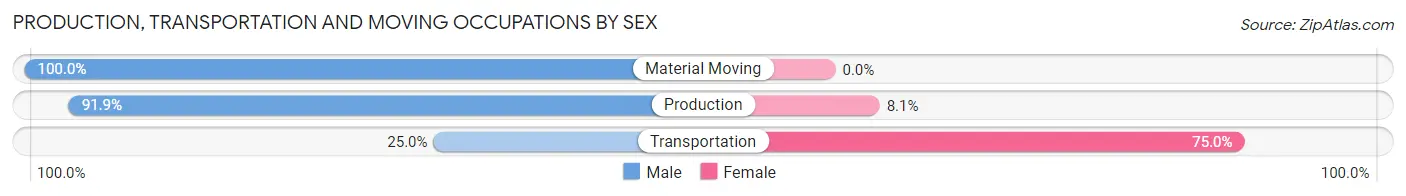
| Occupation | Male | Female |
| Production | 34 (91.9%) | 3 (8.1%) |
| Transportation | 2 (25.0%) | 6 (75.0%) |
| Material Moving | 24 (100.0%) | 0 (0.0%) |
| Total (Category) | 60 (87.0%) | 9 (13.0%) |
| Total (Overall) | 191 (53.6%) | 165 (46.4%) |
Employment Industries by Sex in Maben
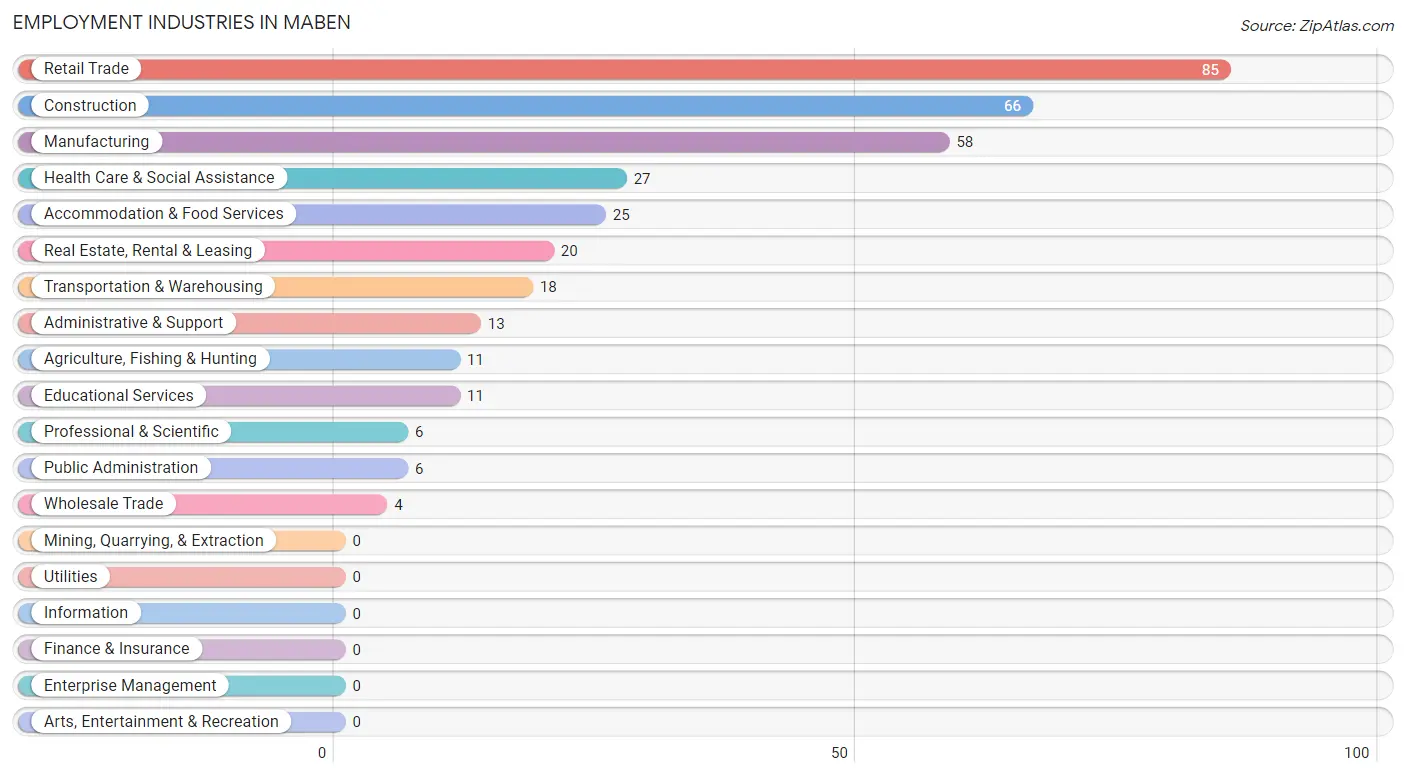
Employment Industries in Maben
The major employment industries in Maben include Retail Trade (85 | 23.9%), Construction (66 | 18.5%), Manufacturing (58 | 16.3%), Health Care & Social Assistance (27 | 7.6%), and Accommodation & Food Services (25 | 7.0%).
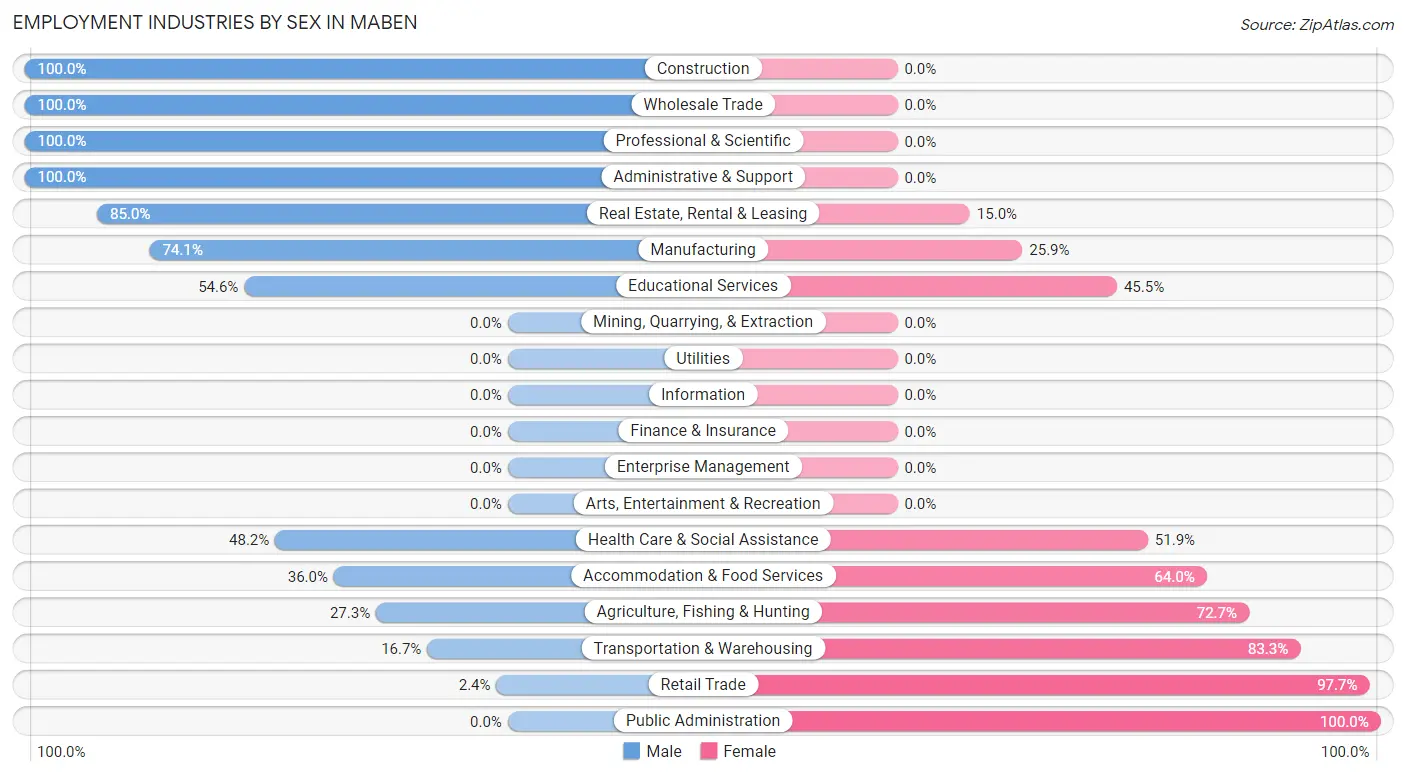
Employment Industries by Sex in Maben
The Maben industries that see more men than women are Construction (100.0%), Wholesale Trade (100.0%), and Professional & Scientific (100.0%), whereas the industries that tend to have a higher number of women are Public Administration (100.0%), Retail Trade (97.7%), and Transportation & Warehousing (83.3%).
| Industry | Male | Female |
| Agriculture, Fishing & Hunting | 3 (27.3%) | 8 (72.7%) |
| Mining, Quarrying, & Extraction | 0 (0.0%) | 0 (0.0%) |
| Construction | 66 (100.0%) | 0 (0.0%) |
| Manufacturing | 43 (74.1%) | 15 (25.9%) |
| Wholesale Trade | 4 (100.0%) | 0 (0.0%) |
| Retail Trade | 2 (2.4%) | 83 (97.7%) |
| Transportation & Warehousing | 3 (16.7%) | 15 (83.3%) |
| Utilities | 0 (0.0%) | 0 (0.0%) |
| Information | 0 (0.0%) | 0 (0.0%) |
| Finance & Insurance | 0 (0.0%) | 0 (0.0%) |
| Real Estate, Rental & Leasing | 17 (85.0%) | 3 (15.0%) |
| Professional & Scientific | 6 (100.0%) | 0 (0.0%) |
| Enterprise Management | 0 (0.0%) | 0 (0.0%) |
| Administrative & Support | 13 (100.0%) | 0 (0.0%) |
| Educational Services | 6 (54.5%) | 5 (45.5%) |
| Health Care & Social Assistance | 13 (48.1%) | 14 (51.8%) |
| Arts, Entertainment & Recreation | 0 (0.0%) | 0 (0.0%) |
| Accommodation & Food Services | 9 (36.0%) | 16 (64.0%) |
| Public Administration | 0 (0.0%) | 6 (100.0%) |
| Total | 191 (53.6%) | 165 (46.4%) |
Education in Maben
School Enrollment in Maben
The most common levels of schooling among the 162 students in Maben are middle school (75 | 46.3%), elementary school (51 | 31.5%), and college / undergraduate (16 | 9.9%).
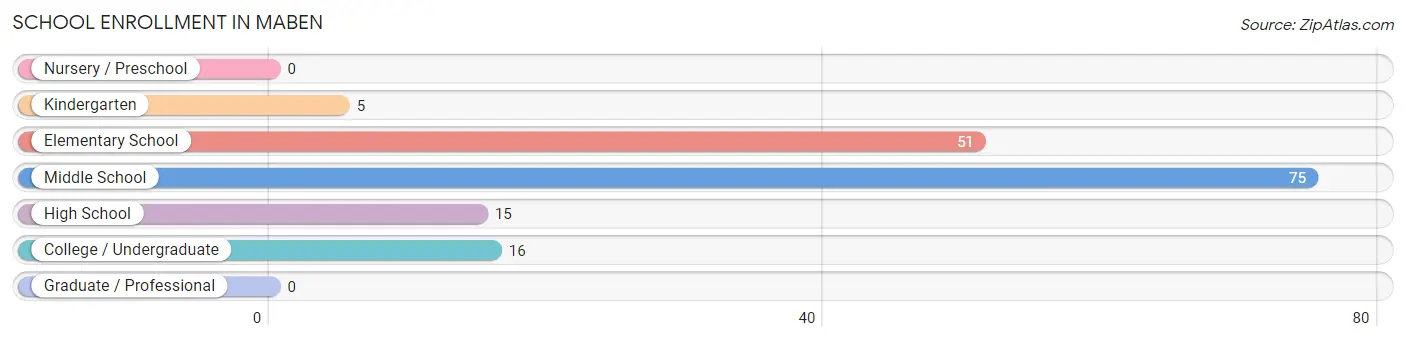
| School Level | # Students | % Students |
| Nursery / Preschool | 0 | 0.0% |
| Kindergarten | 5 | 3.1% |
| Elementary School | 51 | 31.5% |
| Middle School | 75 | 46.3% |
| High School | 15 | 9.3% |
| College / Undergraduate | 16 | 9.9% |
| Graduate / Professional | 0 | 0.0% |
| Total | 162 | 100.0% |
School Enrollment by Age by Funding Source in Maben
Out of a total of 162 students who are enrolled in schools in Maben, 1 (0.6%) attend a private institution, while the remaining 161 (99.4%) are enrolled in public schools. The age group of 35 years and over has the highest likelihood of being enrolled in private schools, with 1 (100.0% in the age bracket) enrolled. Conversely, the age group of 5 to 9 year old has the lowest likelihood of being enrolled in a private school, with 51 (100.0% in the age bracket) attending a public institution.
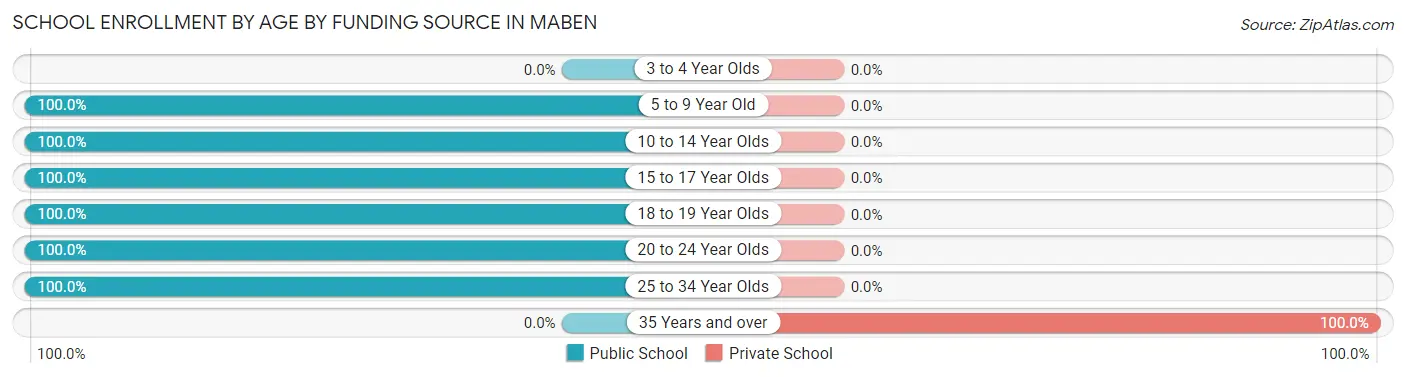
| Age Bracket | Public School | Private School |
| 3 to 4 Year Olds | 0 (0.0%) | 0 (0.0%) |
| 5 to 9 Year Old | 51 (100.0%) | 0 (0.0%) |
| 10 to 14 Year Olds | 80 (100.0%) | 0 (0.0%) |
| 15 to 17 Year Olds | 17 (100.0%) | 0 (0.0%) |
| 18 to 19 Year Olds | 1 (100.0%) | 0 (0.0%) |
| 20 to 24 Year Olds | 11 (100.0%) | 0 (0.0%) |
| 25 to 34 Year Olds | 1 (100.0%) | 0 (0.0%) |
| 35 Years and over | 0 (0.0%) | 1 (100.0%) |
| Total | 161 (99.4%) | 1 (0.6%) |
Educational Attainment by Field of Study in Maben
Business (12 | 50.0%), education (8 | 33.3%), and communications (4 | 16.7%) are the most common fields of study among 24 individuals in Maben who have obtained a bachelor's degree or higher.
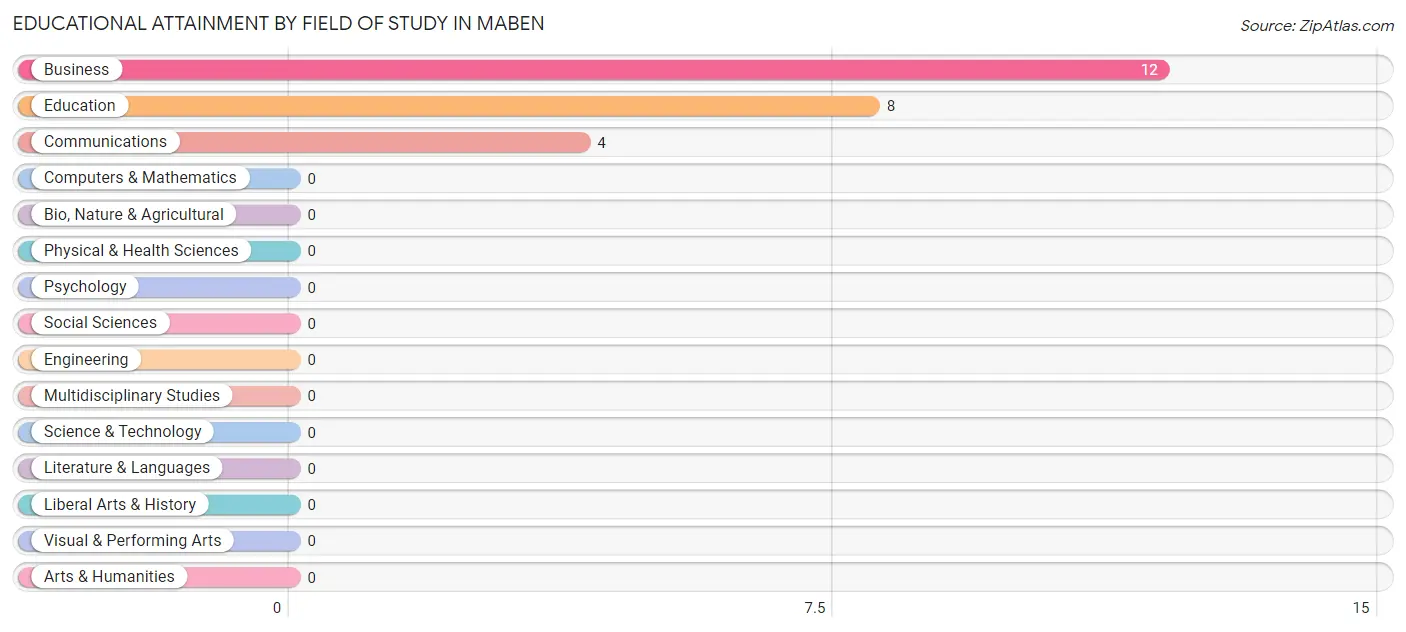
| Field of Study | # Graduates | % Graduates |
| Computers & Mathematics | 0 | 0.0% |
| Bio, Nature & Agricultural | 0 | 0.0% |
| Physical & Health Sciences | 0 | 0.0% |
| Psychology | 0 | 0.0% |
| Social Sciences | 0 | 0.0% |
| Engineering | 0 | 0.0% |
| Multidisciplinary Studies | 0 | 0.0% |
| Science & Technology | 0 | 0.0% |
| Business | 12 | 50.0% |
| Education | 8 | 33.3% |
| Literature & Languages | 0 | 0.0% |
| Liberal Arts & History | 0 | 0.0% |
| Visual & Performing Arts | 0 | 0.0% |
| Communications | 4 | 16.7% |
| Arts & Humanities | 0 | 0.0% |
| Total | 24 | 100.0% |
Transportation & Commute in Maben
Vehicle Availability by Sex in Maben
The most prevalent vehicle ownership categories in Maben are males with no vehicle (73, accounting for 39.7%) and females with no vehicle (9, making up 57.5%).
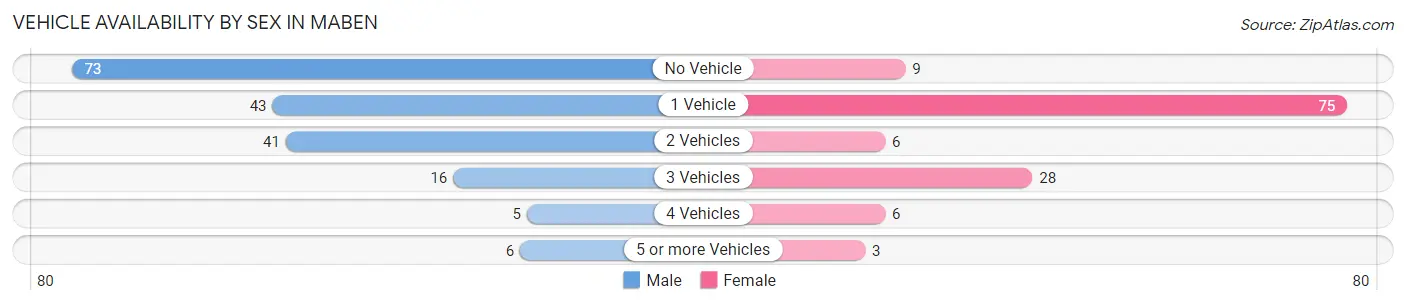
| Vehicles Available | Male | Female |
| No Vehicle | 73 (39.7%) | 9 (7.1%) |
| 1 Vehicle | 43 (23.4%) | 75 (59.1%) |
| 2 Vehicles | 41 (22.3%) | 6 (4.7%) |
| 3 Vehicles | 16 (8.7%) | 28 (22.1%) |
| 4 Vehicles | 5 (2.7%) | 6 (4.7%) |
| 5 or more Vehicles | 6 (3.3%) | 3 (2.4%) |
| Total | 184 (100.0%) | 127 (100.0%) |
Commute Time in Maben
The most frequently occuring commute durations in Maben are 5 to 9 minutes (43 commuters, 17.3%), 10 to 14 minutes (34 commuters, 13.7%), and 20 to 24 minutes (30 commuters, 12.1%).
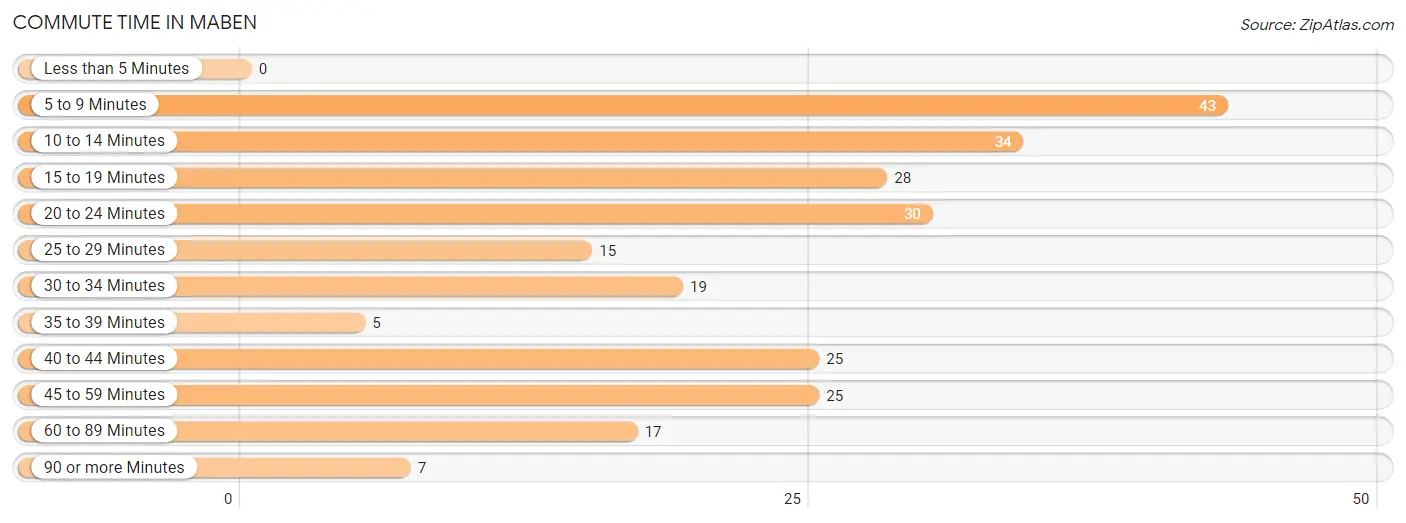
| Commute Time | # Commuters | % Commuters |
| Less than 5 Minutes | 0 | 0.0% |
| 5 to 9 Minutes | 43 | 17.3% |
| 10 to 14 Minutes | 34 | 13.7% |
| 15 to 19 Minutes | 28 | 11.3% |
| 20 to 24 Minutes | 30 | 12.1% |
| 25 to 29 Minutes | 15 | 6.0% |
| 30 to 34 Minutes | 19 | 7.7% |
| 35 to 39 Minutes | 5 | 2.0% |
| 40 to 44 Minutes | 25 | 10.1% |
| 45 to 59 Minutes | 25 | 10.1% |
| 60 to 89 Minutes | 17 | 6.9% |
| 90 or more Minutes | 7 | 2.8% |
Commute Time by Sex in Maben
The most common commute times in Maben are 10 to 14 minutes (31 commuters, 25.6%) for males and 5 to 9 minutes (43 commuters, 33.9%) for females.
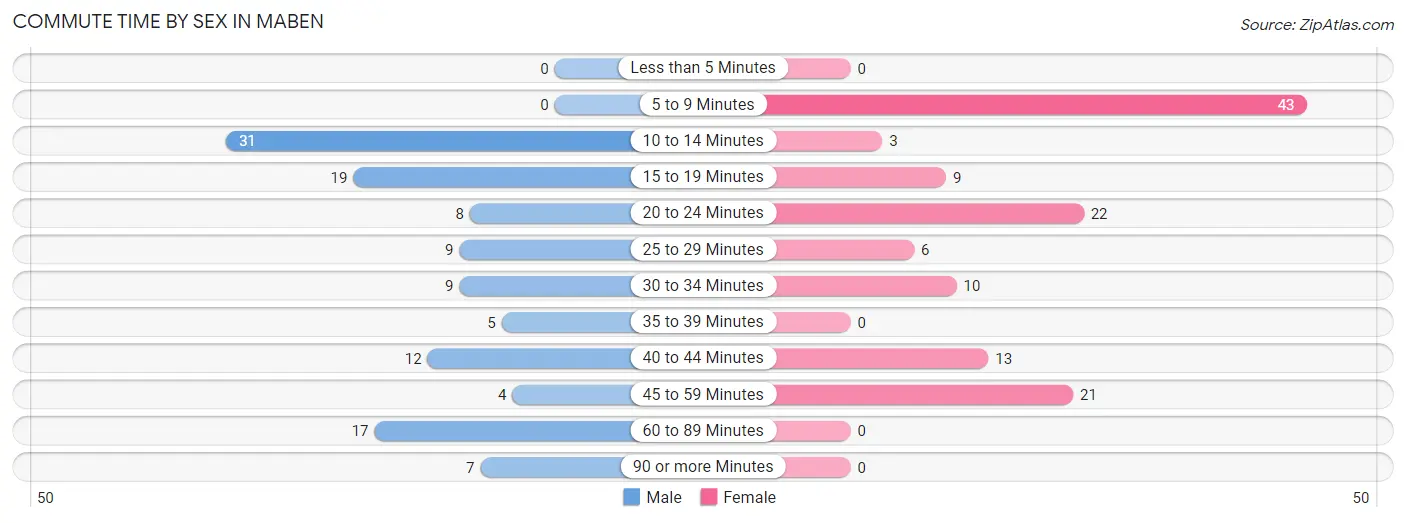
| Commute Time | Male | Female |
| Less than 5 Minutes | 0 (0.0%) | 0 (0.0%) |
| 5 to 9 Minutes | 0 (0.0%) | 43 (33.9%) |
| 10 to 14 Minutes | 31 (25.6%) | 3 (2.4%) |
| 15 to 19 Minutes | 19 (15.7%) | 9 (7.1%) |
| 20 to 24 Minutes | 8 (6.6%) | 22 (17.3%) |
| 25 to 29 Minutes | 9 (7.4%) | 6 (4.7%) |
| 30 to 34 Minutes | 9 (7.4%) | 10 (7.9%) |
| 35 to 39 Minutes | 5 (4.1%) | 0 (0.0%) |
| 40 to 44 Minutes | 12 (9.9%) | 13 (10.2%) |
| 45 to 59 Minutes | 4 (3.3%) | 21 (16.5%) |
| 60 to 89 Minutes | 17 (14.1%) | 0 (0.0%) |
| 90 or more Minutes | 7 (5.8%) | 0 (0.0%) |
Time of Departure to Work by Sex in Maben
The most frequent times of departure to work in Maben are 6:00 AM to 6:29 AM (46, 38.0%) for males and 8:00 AM to 8:29 AM (49, 38.6%) for females.
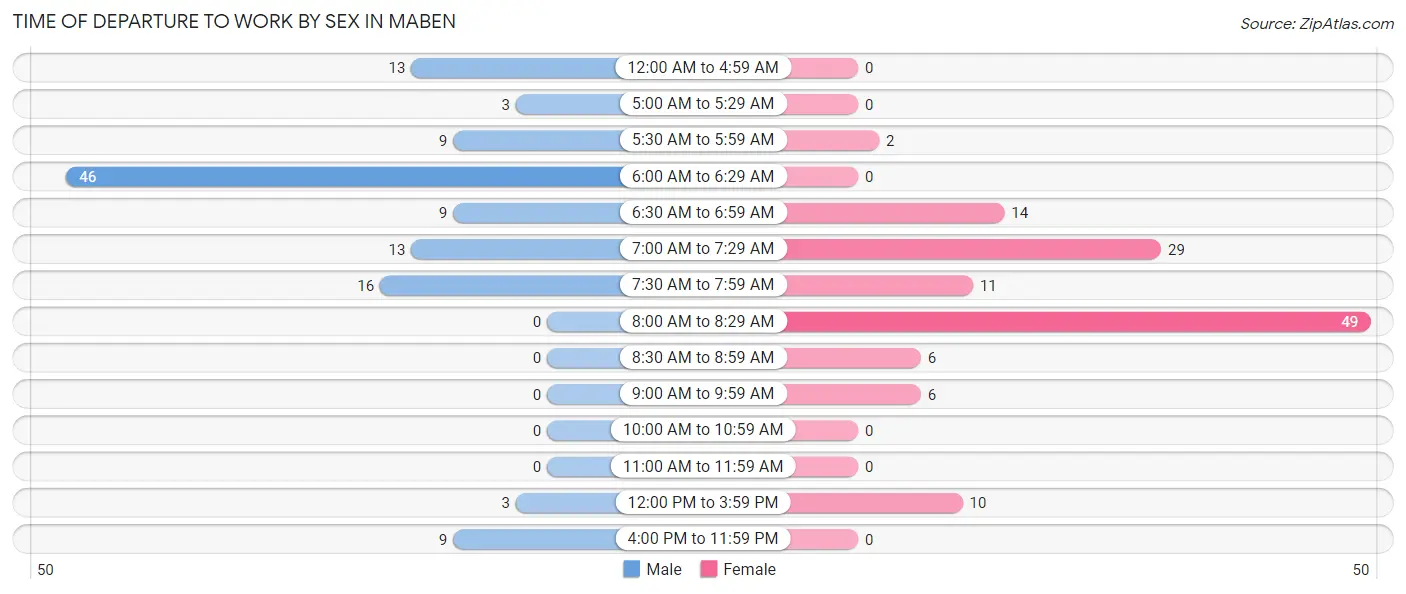
| Time of Departure | Male | Female |
| 12:00 AM to 4:59 AM | 13 (10.7%) | 0 (0.0%) |
| 5:00 AM to 5:29 AM | 3 (2.5%) | 0 (0.0%) |
| 5:30 AM to 5:59 AM | 9 (7.4%) | 2 (1.6%) |
| 6:00 AM to 6:29 AM | 46 (38.0%) | 0 (0.0%) |
| 6:30 AM to 6:59 AM | 9 (7.4%) | 14 (11.0%) |
| 7:00 AM to 7:29 AM | 13 (10.7%) | 29 (22.8%) |
| 7:30 AM to 7:59 AM | 16 (13.2%) | 11 (8.7%) |
| 8:00 AM to 8:29 AM | 0 (0.0%) | 49 (38.6%) |
| 8:30 AM to 8:59 AM | 0 (0.0%) | 6 (4.7%) |
| 9:00 AM to 9:59 AM | 0 (0.0%) | 6 (4.7%) |
| 10:00 AM to 10:59 AM | 0 (0.0%) | 0 (0.0%) |
| 11:00 AM to 11:59 AM | 0 (0.0%) | 0 (0.0%) |
| 12:00 PM to 3:59 PM | 3 (2.5%) | 10 (7.9%) |
| 4:00 PM to 11:59 PM | 9 (7.4%) | 0 (0.0%) |
| Total | 121 (100.0%) | 127 (100.0%) |
Housing Occupancy in Maben
Occupancy by Ownership in Maben
Of the total 360 dwellings in Maben, owner-occupied units account for 99 (27.5%), while renter-occupied units make up 261 (72.5%).
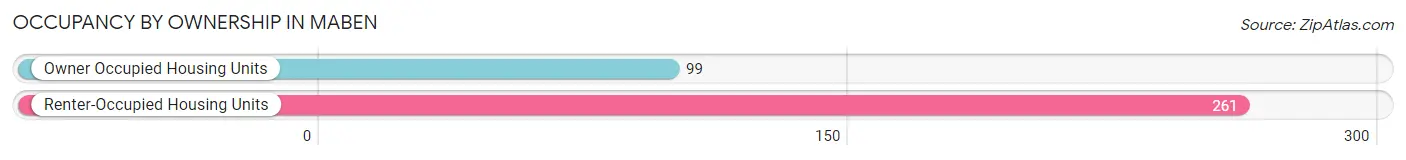
| Occupancy | # Housing Units | % Housing Units |
| Owner Occupied Housing Units | 99 | 27.5% |
| Renter-Occupied Housing Units | 261 | 72.5% |
| Total Occupied Housing Units | 360 | 100.0% |
Occupancy by Household Size in Maben
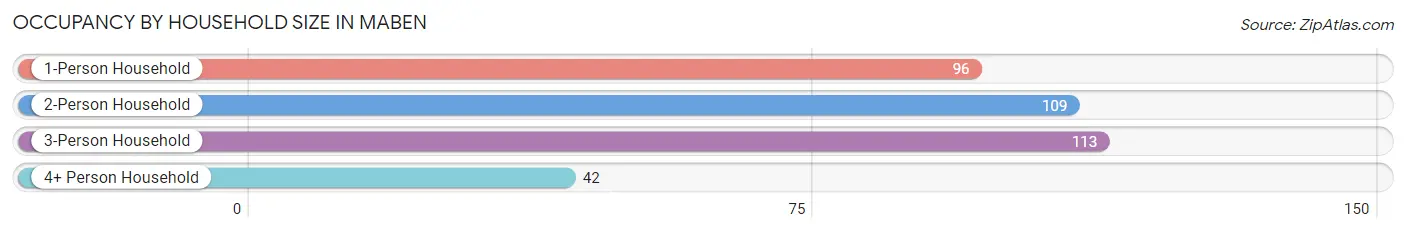
| Household Size | # Housing Units | % Housing Units |
| 1-Person Household | 96 | 26.7% |
| 2-Person Household | 109 | 30.3% |
| 3-Person Household | 113 | 31.4% |
| 4+ Person Household | 42 | 11.7% |
| Total Housing Units | 360 | 100.0% |
Occupancy by Ownership by Household Size in Maben
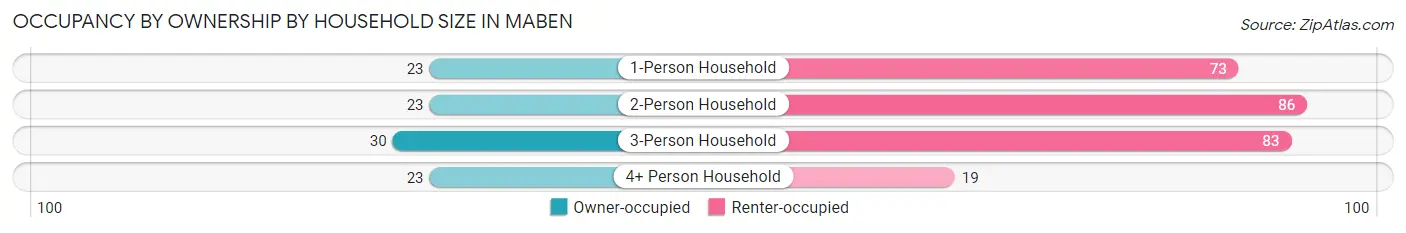
| Household Size | Owner-occupied | Renter-occupied |
| 1-Person Household | 23 (24.0%) | 73 (76.0%) |
| 2-Person Household | 23 (21.1%) | 86 (78.9%) |
| 3-Person Household | 30 (26.6%) | 83 (73.5%) |
| 4+ Person Household | 23 (54.8%) | 19 (45.2%) |
| Total Housing Units | 99 (27.5%) | 261 (72.5%) |
Occupancy by Educational Attainment in Maben
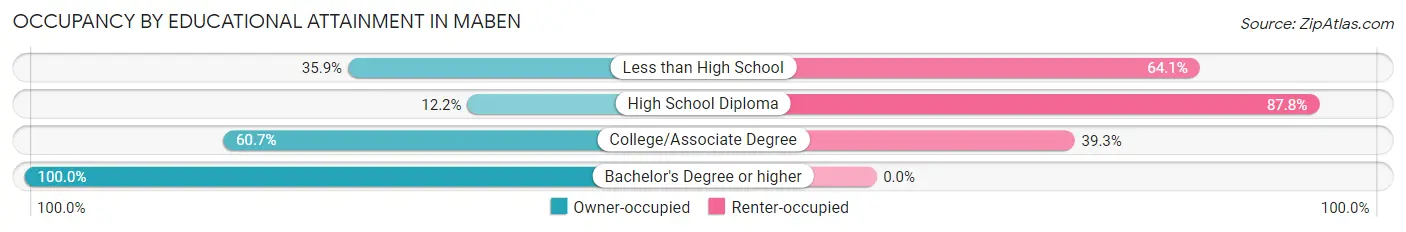
| Household Size | Owner-occupied | Renter-occupied |
| Less than High School | 28 (35.9%) | 50 (64.1%) |
| High School Diploma | 26 (12.2%) | 187 (87.8%) |
| College/Associate Degree | 37 (60.7%) | 24 (39.3%) |
| Bachelor's Degree or higher | 8 (100.0%) | 0 (0.0%) |
Occupancy by Age of Householder in Maben
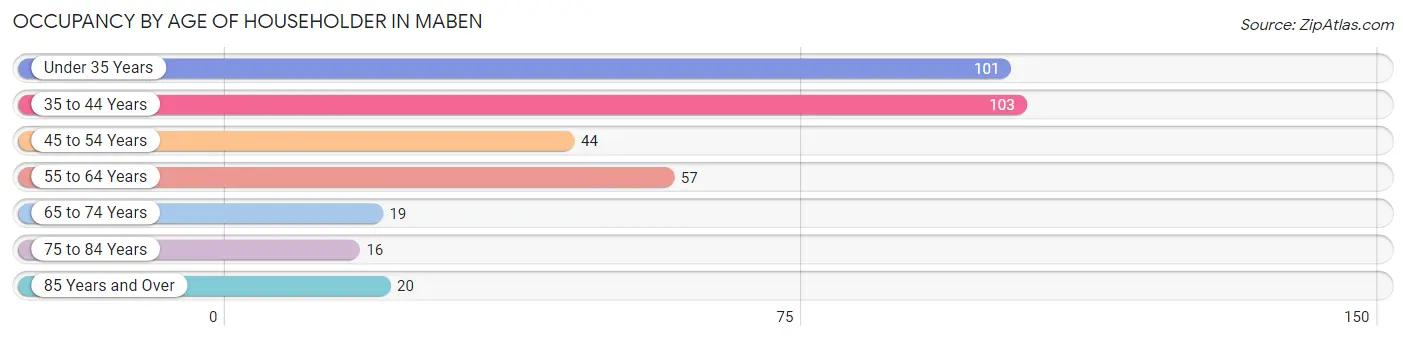
| Age Bracket | # Households | % Households |
| Under 35 Years | 101 | 28.1% |
| 35 to 44 Years | 103 | 28.6% |
| 45 to 54 Years | 44 | 12.2% |
| 55 to 64 Years | 57 | 15.8% |
| 65 to 74 Years | 19 | 5.3% |
| 75 to 84 Years | 16 | 4.4% |
| 85 Years and Over | 20 | 5.6% |
| Total | 360 | 100.0% |
Housing Finances in Maben
Median Income by Occupancy in Maben
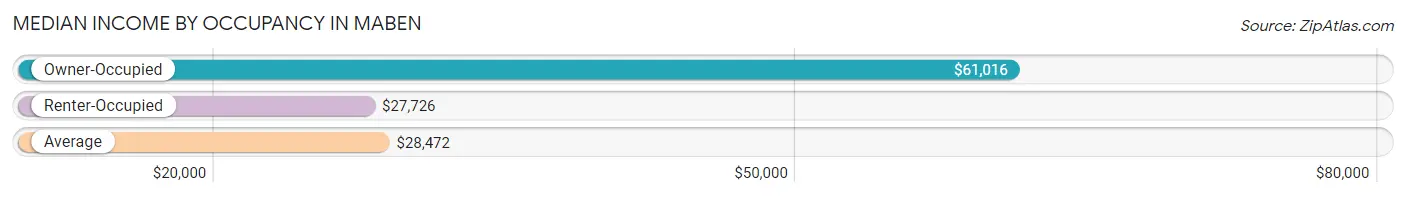
| Occupancy Type | # Households | Median Income |
| Owner-Occupied | 99 (27.5%) | $61,016 |
| Renter-Occupied | 261 (72.5%) | $27,726 |
| Average | 360 (100.0%) | $28,472 |
Occupancy by Householder Income Bracket in Maben
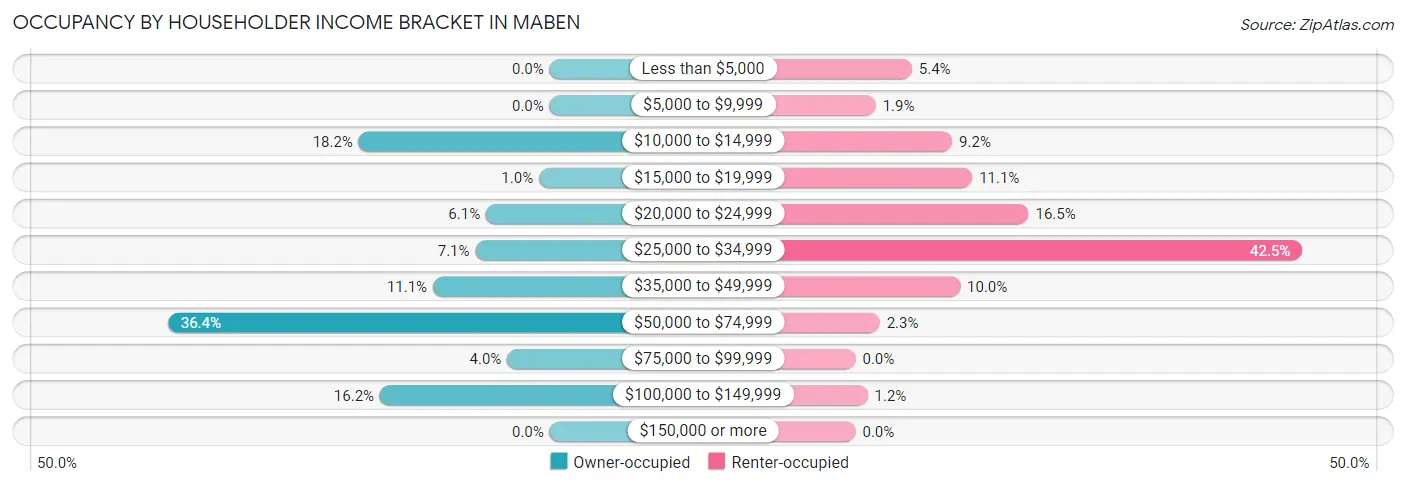
| Income Bracket | Owner-occupied | Renter-occupied |
| Less than $5,000 | 0 (0.0%) | 14 (5.4%) |
| $5,000 to $9,999 | 0 (0.0%) | 5 (1.9%) |
| $10,000 to $14,999 | 18 (18.2%) | 24 (9.2%) |
| $15,000 to $19,999 | 1 (1.0%) | 29 (11.1%) |
| $20,000 to $24,999 | 6 (6.1%) | 43 (16.5%) |
| $25,000 to $34,999 | 7 (7.1%) | 111 (42.5%) |
| $35,000 to $49,999 | 11 (11.1%) | 26 (10.0%) |
| $50,000 to $74,999 | 36 (36.4%) | 6 (2.3%) |
| $75,000 to $99,999 | 4 (4.0%) | 0 (0.0%) |
| $100,000 to $149,999 | 16 (16.2%) | 3 (1.1%) |
| $150,000 or more | 0 (0.0%) | 0 (0.0%) |
| Total | 99 (100.0%) | 261 (100.0%) |
Monthly Housing Cost Tiers in Maben
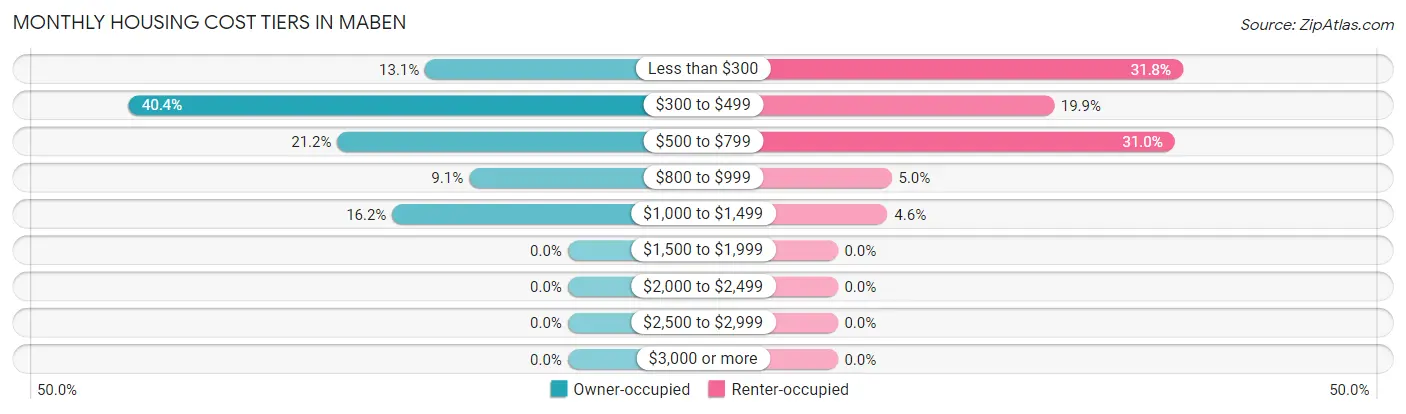
| Monthly Cost | Owner-occupied | Renter-occupied |
| Less than $300 | 13 (13.1%) | 83 (31.8%) |
| $300 to $499 | 40 (40.4%) | 52 (19.9%) |
| $500 to $799 | 21 (21.2%) | 81 (31.0%) |
| $800 to $999 | 9 (9.1%) | 13 (5.0%) |
| $1,000 to $1,499 | 16 (16.2%) | 12 (4.6%) |
| $1,500 to $1,999 | 0 (0.0%) | 0 (0.0%) |
| $2,000 to $2,499 | 0 (0.0%) | 0 (0.0%) |
| $2,500 to $2,999 | 0 (0.0%) | 0 (0.0%) |
| $3,000 or more | 0 (0.0%) | 0 (0.0%) |
| Total | 99 (100.0%) | 261 (100.0%) |
Physical Housing Characteristics in Maben
Housing Structures in Maben
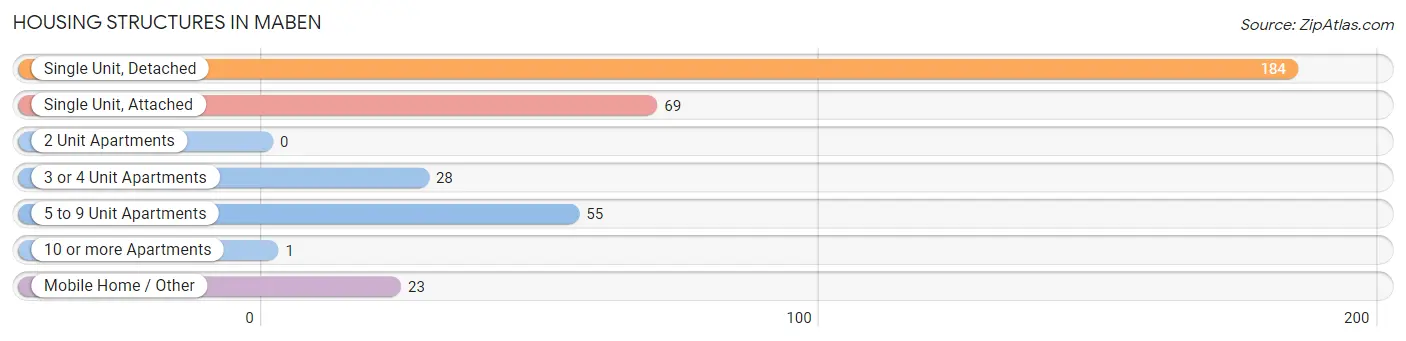
| Structure Type | # Housing Units | % Housing Units |
| Single Unit, Detached | 184 | 51.1% |
| Single Unit, Attached | 69 | 19.2% |
| 2 Unit Apartments | 0 | 0.0% |
| 3 or 4 Unit Apartments | 28 | 7.8% |
| 5 to 9 Unit Apartments | 55 | 15.3% |
| 10 or more Apartments | 1 | 0.3% |
| Mobile Home / Other | 23 | 6.4% |
| Total | 360 | 100.0% |
Housing Structures by Occupancy in Maben
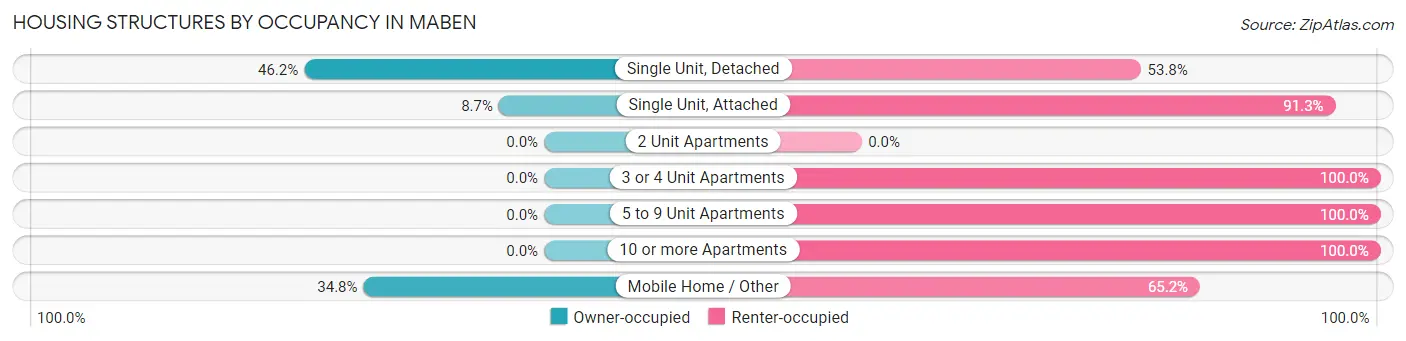
| Structure Type | Owner-occupied | Renter-occupied |
| Single Unit, Detached | 85 (46.2%) | 99 (53.8%) |
| Single Unit, Attached | 6 (8.7%) | 63 (91.3%) |
| 2 Unit Apartments | 0 (0.0%) | 0 (0.0%) |
| 3 or 4 Unit Apartments | 0 (0.0%) | 28 (100.0%) |
| 5 to 9 Unit Apartments | 0 (0.0%) | 55 (100.0%) |
| 10 or more Apartments | 0 (0.0%) | 1 (100.0%) |
| Mobile Home / Other | 8 (34.8%) | 15 (65.2%) |
| Total | 99 (27.5%) | 261 (72.5%) |
Housing Structures by Number of Rooms in Maben
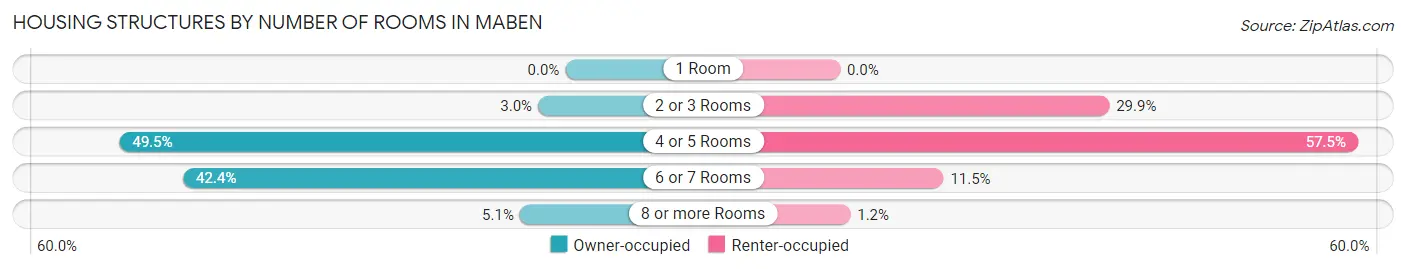
| Number of Rooms | Owner-occupied | Renter-occupied |
| 1 Room | 0 (0.0%) | 0 (0.0%) |
| 2 or 3 Rooms | 3 (3.0%) | 78 (29.9%) |
| 4 or 5 Rooms | 49 (49.5%) | 150 (57.5%) |
| 6 or 7 Rooms | 42 (42.4%) | 30 (11.5%) |
| 8 or more Rooms | 5 (5.1%) | 3 (1.1%) |
| Total | 99 (100.0%) | 261 (100.0%) |
Housing Structure by Heating Type in Maben
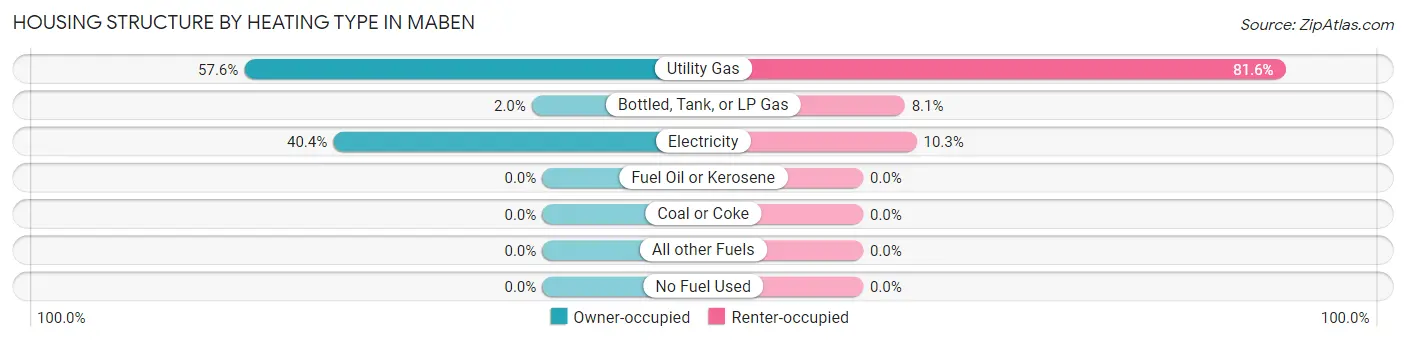
| Heating Type | Owner-occupied | Renter-occupied |
| Utility Gas | 57 (57.6%) | 213 (81.6%) |
| Bottled, Tank, or LP Gas | 2 (2.0%) | 21 (8.1%) |
| Electricity | 40 (40.4%) | 27 (10.3%) |
| Fuel Oil or Kerosene | 0 (0.0%) | 0 (0.0%) |
| Coal or Coke | 0 (0.0%) | 0 (0.0%) |
| All other Fuels | 0 (0.0%) | 0 (0.0%) |
| No Fuel Used | 0 (0.0%) | 0 (0.0%) |
| Total | 99 (100.0%) | 261 (100.0%) |
Household Vehicle Usage in Maben
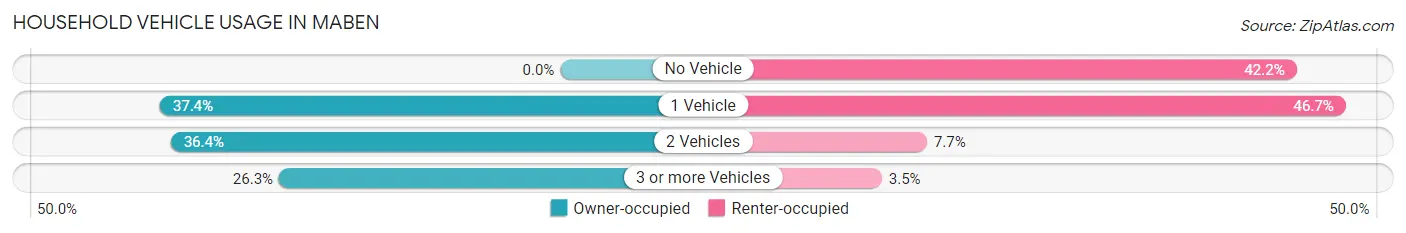
| Vehicles per Household | Owner-occupied | Renter-occupied |
| No Vehicle | 0 (0.0%) | 110 (42.1%) |
| 1 Vehicle | 37 (37.4%) | 122 (46.7%) |
| 2 Vehicles | 36 (36.4%) | 20 (7.7%) |
| 3 or more Vehicles | 26 (26.3%) | 9 (3.5%) |
| Total | 99 (100.0%) | 261 (100.0%) |
Real Estate & Mortgages in Maben
Real Estate and Mortgage Overview in Maben
| Characteristic | Without Mortgage | With Mortgage |
| Housing Units | 57 | 42 |
| Median Property Value | $72,200 | $75,000 |
| Median Household Income | $60,288 | $0 |
| Monthly Housing Costs | $381 | $0 |
| Real Estate Taxes | $850 | $7 |
Property Value by Mortgage Status in Maben
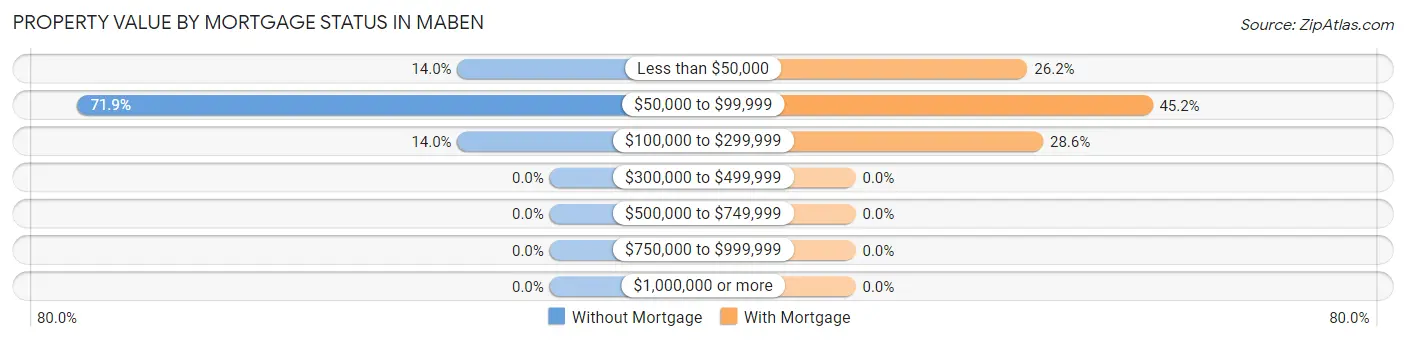
| Property Value | Without Mortgage | With Mortgage |
| Less than $50,000 | 8 (14.0%) | 11 (26.2%) |
| $50,000 to $99,999 | 41 (71.9%) | 19 (45.2%) |
| $100,000 to $299,999 | 8 (14.0%) | 12 (28.6%) |
| $300,000 to $499,999 | 0 (0.0%) | 0 (0.0%) |
| $500,000 to $749,999 | 0 (0.0%) | 0 (0.0%) |
| $750,000 to $999,999 | 0 (0.0%) | 0 (0.0%) |
| $1,000,000 or more | 0 (0.0%) | 0 (0.0%) |
| Total | 57 (100.0%) | 42 (100.0%) |
Household Income by Mortgage Status in Maben
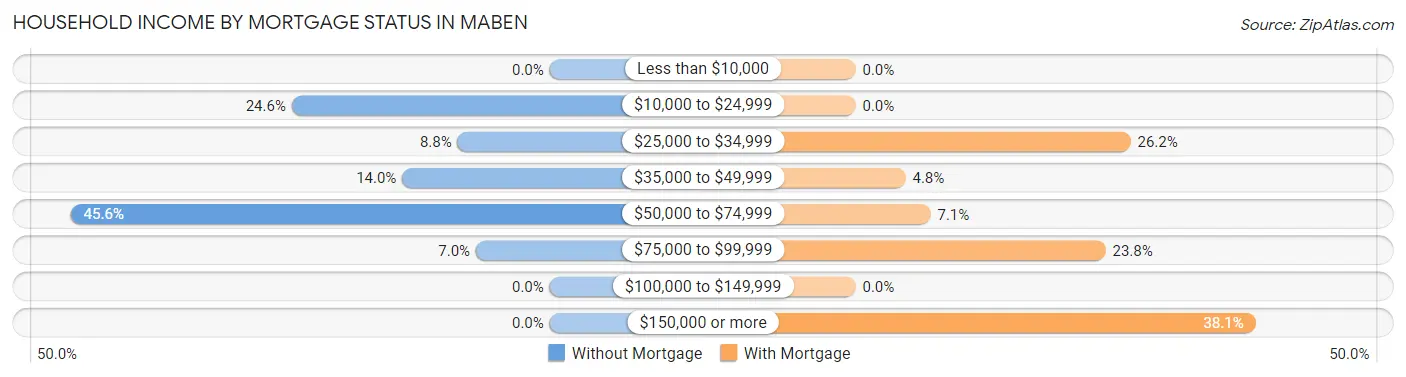
| Household Income | Without Mortgage | With Mortgage |
| Less than $10,000 | 0 (0.0%) | 0 (0.0%) |
| $10,000 to $24,999 | 14 (24.6%) | 0 (0.0%) |
| $25,000 to $34,999 | 5 (8.8%) | 11 (26.2%) |
| $35,000 to $49,999 | 8 (14.0%) | 2 (4.8%) |
| $50,000 to $74,999 | 26 (45.6%) | 3 (7.1%) |
| $75,000 to $99,999 | 4 (7.0%) | 10 (23.8%) |
| $100,000 to $149,999 | 0 (0.0%) | 0 (0.0%) |
| $150,000 or more | 0 (0.0%) | 16 (38.1%) |
| Total | 57 (100.0%) | 42 (100.0%) |
Property Value to Household Income Ratio in Maben
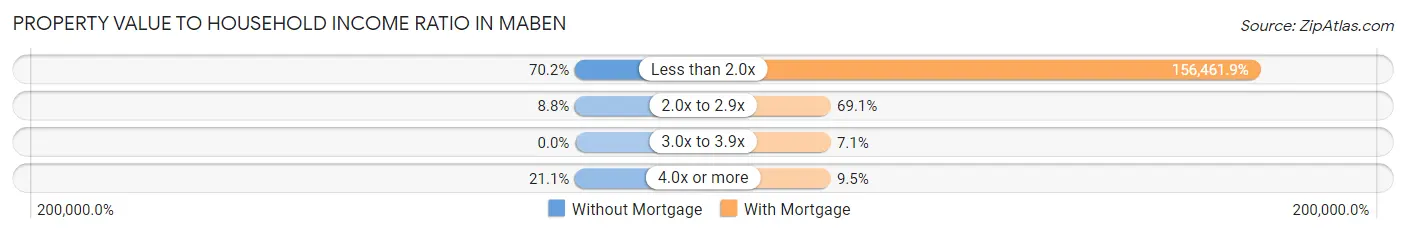
| Value-to-Income Ratio | Without Mortgage | With Mortgage |
| Less than 2.0x | 40 (70.2%) | 65,714 (156,461.9%) |
| 2.0x to 2.9x | 5 (8.8%) | 29 (69.1%) |
| 3.0x to 3.9x | 0 (0.0%) | 3 (7.1%) |
| 4.0x or more | 12 (21.0%) | 4 (9.5%) |
| Total | 57 (100.0%) | 42 (100.0%) |
Real Estate Taxes by Mortgage Status in Maben
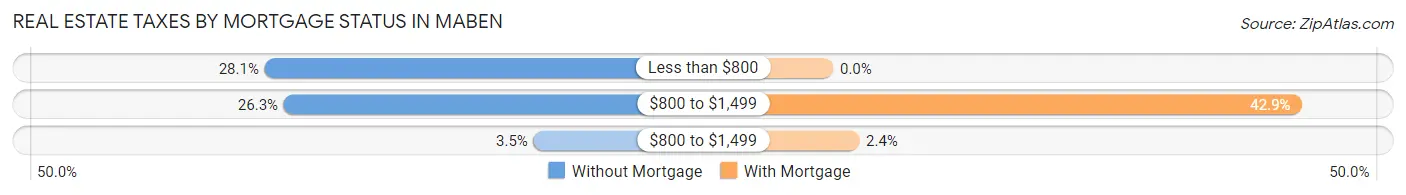
| Property Taxes | Without Mortgage | With Mortgage |
| Less than $800 | 16 (28.1%) | 0 (0.0%) |
| $800 to $1,499 | 15 (26.3%) | 18 (42.9%) |
| $800 to $1,499 | 2 (3.5%) | 1 (2.4%) |
| Total | 57 (100.0%) | 42 (100.0%) |
Health & Disability in Maben
Health Insurance Coverage by Age in Maben
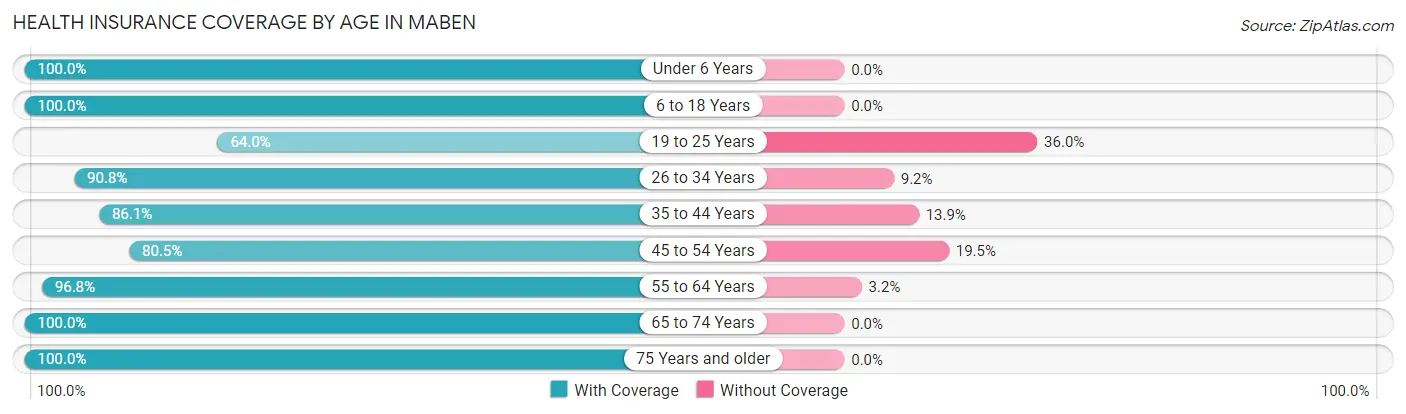
| Age Bracket | With Coverage | Without Coverage |
| Under 6 Years | 298 (100.0%) | 0 (0.0%) |
| 6 to 18 Years | 149 (100.0%) | 0 (0.0%) |
| 19 to 25 Years | 89 (64.0%) | 50 (36.0%) |
| 26 to 34 Years | 59 (90.8%) | 6 (9.2%) |
| 35 to 44 Years | 118 (86.1%) | 19 (13.9%) |
| 45 to 54 Years | 62 (80.5%) | 15 (19.5%) |
| 55 to 64 Years | 90 (96.8%) | 3 (3.2%) |
| 65 to 74 Years | 25 (100.0%) | 0 (0.0%) |
| 75 Years and older | 41 (100.0%) | 0 (0.0%) |
| Total | 931 (90.9%) | 93 (9.1%) |
Health Insurance Coverage by Citizenship Status in Maben
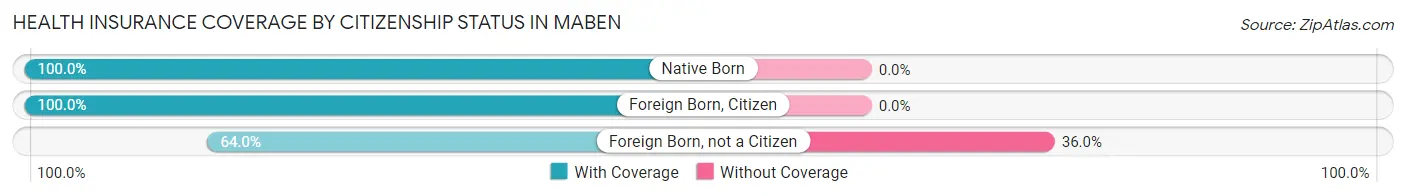
| Citizenship Status | With Coverage | Without Coverage |
| Native Born | 298 (100.0%) | 0 (0.0%) |
| Foreign Born, Citizen | 149 (100.0%) | 0 (0.0%) |
| Foreign Born, not a Citizen | 89 (64.0%) | 50 (36.0%) |
Health Insurance Coverage by Household Income in Maben
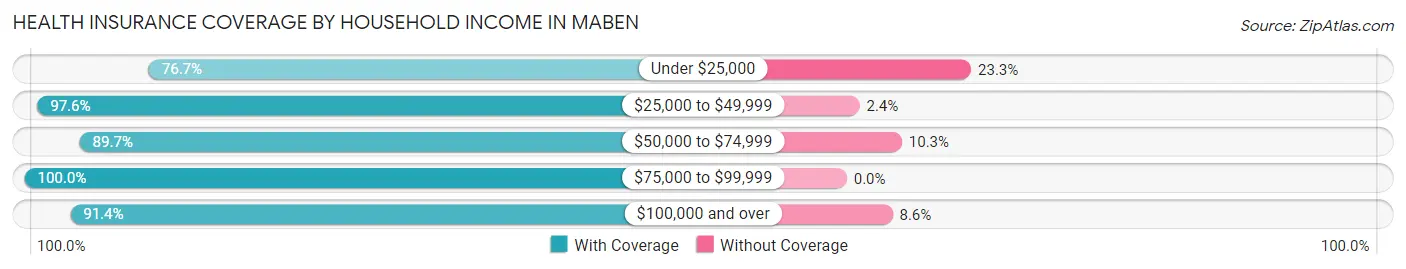
| Household Income | With Coverage | Without Coverage |
| Under $25,000 | 191 (76.7%) | 58 (23.3%) |
| $25,000 to $49,999 | 530 (97.6%) | 13 (2.4%) |
| $50,000 to $74,999 | 139 (89.7%) | 16 (10.3%) |
| $75,000 to $99,999 | 7 (100.0%) | 0 (0.0%) |
| $100,000 and over | 64 (91.4%) | 6 (8.6%) |
Public vs Private Health Insurance Coverage by Age in Maben
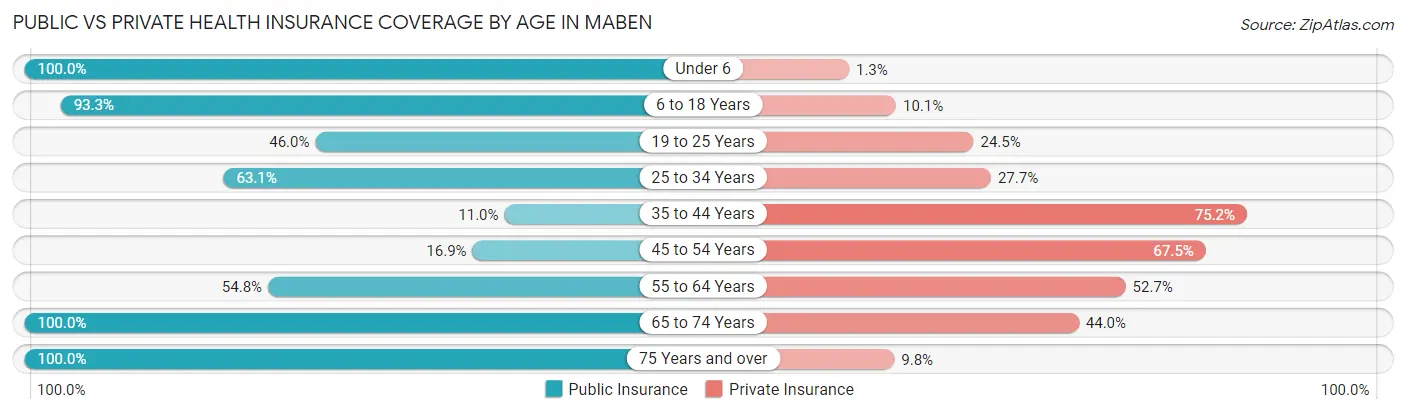
| Age Bracket | Public Insurance | Private Insurance |
| Under 6 | 298 (100.0%) | 4 (1.3%) |
| 6 to 18 Years | 139 (93.3%) | 15 (10.1%) |
| 19 to 25 Years | 64 (46.0%) | 34 (24.5%) |
| 25 to 34 Years | 41 (63.1%) | 18 (27.7%) |
| 35 to 44 Years | 15 (11.0%) | 103 (75.2%) |
| 45 to 54 Years | 13 (16.9%) | 52 (67.5%) |
| 55 to 64 Years | 51 (54.8%) | 49 (52.7%) |
| 65 to 74 Years | 25 (100.0%) | 11 (44.0%) |
| 75 Years and over | 41 (100.0%) | 4 (9.8%) |
| Total | 687 (67.1%) | 290 (28.3%) |
Disability Status by Sex by Age in Maben
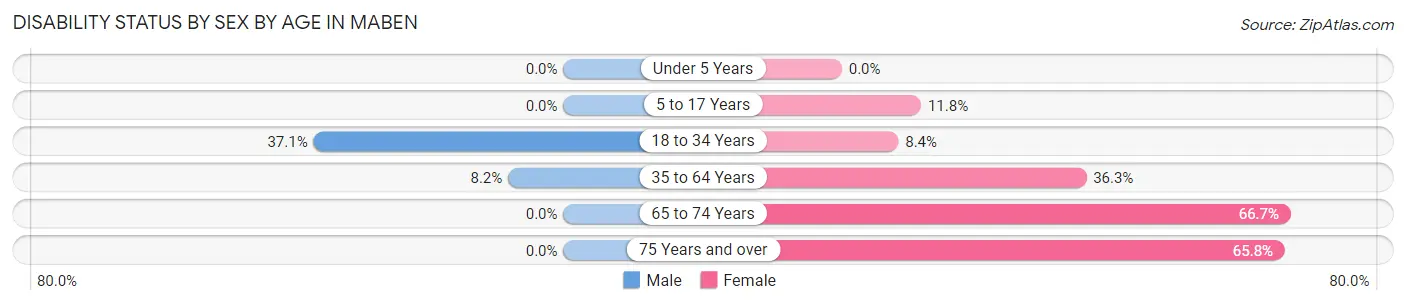
| Age Bracket | Male | Female |
| Under 5 Years | 0 (0.0%) | 0 (0.0%) |
| 5 to 17 Years | 0 (0.0%) | 12 (11.8%) |
| 18 to 34 Years | 23 (37.1%) | 12 (8.4%) |
| 35 to 64 Years | 15 (8.2%) | 45 (36.3%) |
| 65 to 74 Years | 0 (0.0%) | 12 (66.7%) |
| 75 Years and over | 0 (0.0%) | 25 (65.8%) |
Disability Class by Sex by Age in Maben
Disability Class: Hearing Difficulty
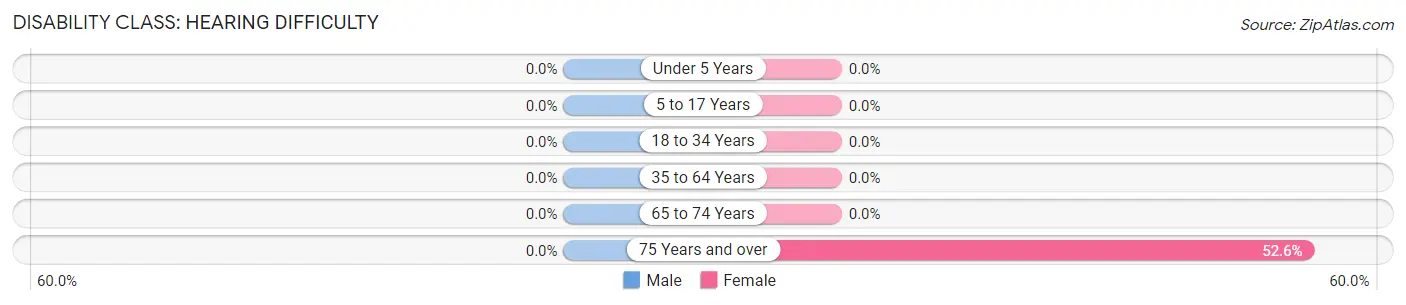
| Age Bracket | Male | Female |
| Under 5 Years | 0 (0.0%) | 0 (0.0%) |
| 5 to 17 Years | 0 (0.0%) | 0 (0.0%) |
| 18 to 34 Years | 0 (0.0%) | 0 (0.0%) |
| 35 to 64 Years | 0 (0.0%) | 0 (0.0%) |
| 65 to 74 Years | 0 (0.0%) | 0 (0.0%) |
| 75 Years and over | 0 (0.0%) | 20 (52.6%) |
Disability Class: Vision Difficulty
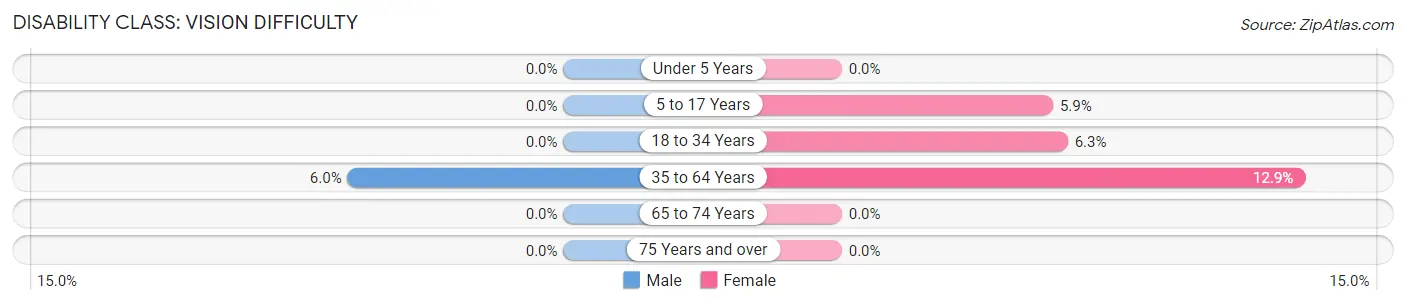
| Age Bracket | Male | Female |
| Under 5 Years | 0 (0.0%) | 0 (0.0%) |
| 5 to 17 Years | 0 (0.0%) | 6 (5.9%) |
| 18 to 34 Years | 0 (0.0%) | 9 (6.3%) |
| 35 to 64 Years | 11 (6.0%) | 16 (12.9%) |
| 65 to 74 Years | 0 (0.0%) | 0 (0.0%) |
| 75 Years and over | 0 (0.0%) | 0 (0.0%) |
Disability Class: Cognitive Difficulty
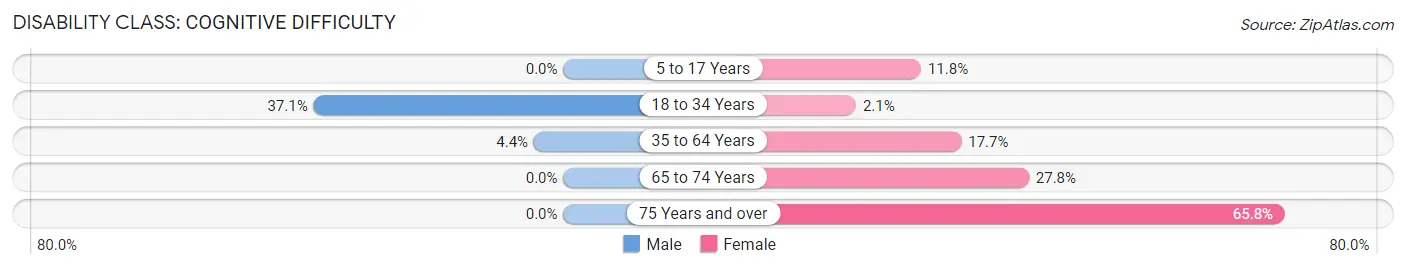
| Age Bracket | Male | Female |
| 5 to 17 Years | 0 (0.0%) | 12 (11.8%) |
| 18 to 34 Years | 23 (37.1%) | 3 (2.1%) |
| 35 to 64 Years | 8 (4.4%) | 22 (17.7%) |
| 65 to 74 Years | 0 (0.0%) | 5 (27.8%) |
| 75 Years and over | 0 (0.0%) | 25 (65.8%) |
Disability Class: Ambulatory Difficulty
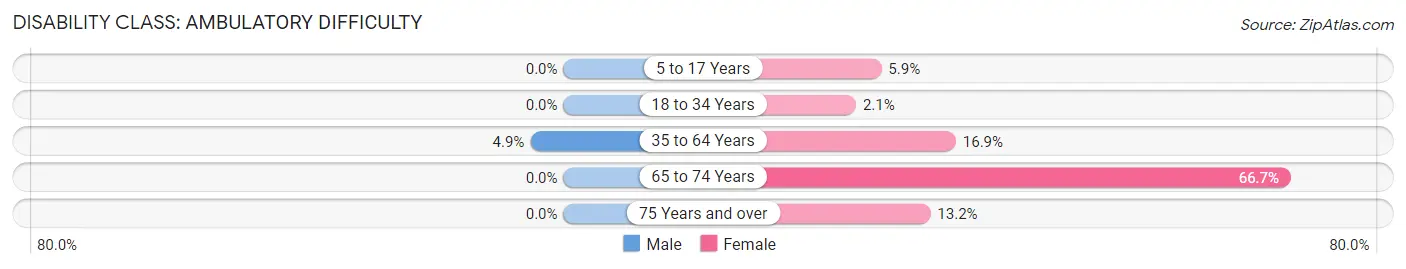
| Age Bracket | Male | Female |
| 5 to 17 Years | 0 (0.0%) | 6 (5.9%) |
| 18 to 34 Years | 0 (0.0%) | 3 (2.1%) |
| 35 to 64 Years | 9 (4.9%) | 21 (16.9%) |
| 65 to 74 Years | 0 (0.0%) | 12 (66.7%) |
| 75 Years and over | 0 (0.0%) | 5 (13.2%) |
Disability Class: Self-Care Difficulty
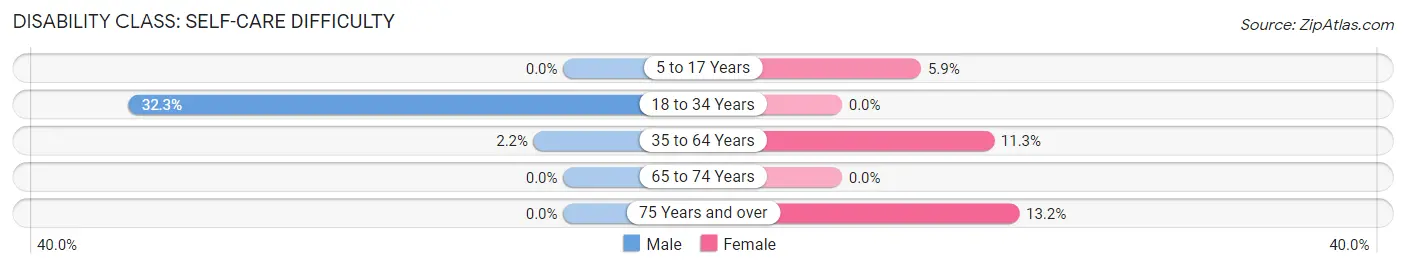
| Age Bracket | Male | Female |
| 5 to 17 Years | 0 (0.0%) | 6 (5.9%) |
| 18 to 34 Years | 20 (32.3%) | 0 (0.0%) |
| 35 to 64 Years | 4 (2.2%) | 14 (11.3%) |
| 65 to 74 Years | 0 (0.0%) | 0 (0.0%) |
| 75 Years and over | 0 (0.0%) | 5 (13.2%) |
Technology Access in Maben
Computing Device Access in Maben
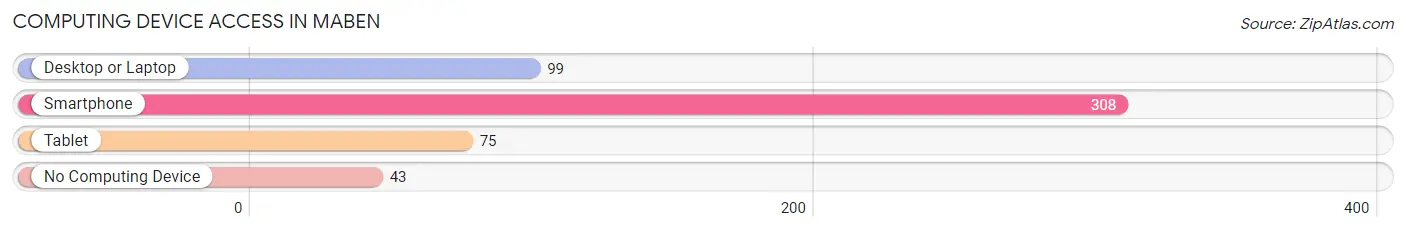
| Device Type | # Households | % Households |
| Desktop or Laptop | 99 | 27.5% |
| Smartphone | 308 | 85.6% |
| Tablet | 75 | 20.8% |
| No Computing Device | 43 | 11.9% |
| Total | 360 | 100.0% |
Internet Access in Maben
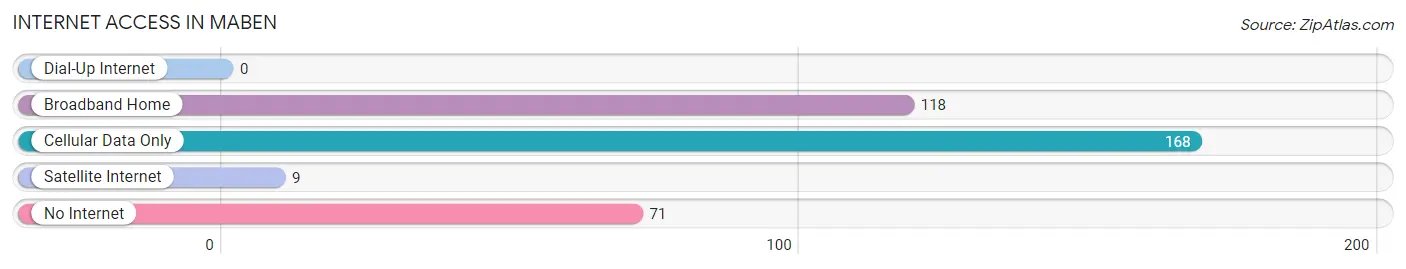
| Internet Type | # Households | % Households |
| Dial-Up Internet | 0 | 0.0% |
| Broadband Home | 118 | 32.8% |
| Cellular Data Only | 168 | 46.7% |
| Satellite Internet | 9 | 2.5% |
| No Internet | 71 | 19.7% |
| Total | 360 | 100.0% |
Maben Summary
Maben is a small town located in Webster County, Mississippi. It is situated in the northeastern part of the state, approximately 20 miles from the Alabama border. The town was founded in 1887 and has a population of approximately 1,000 people.
Geography
Maben is located in the northeastern part of Mississippi, in Webster County. It is situated in the foothills of the Appalachian Mountains, and is surrounded by rolling hills and forests. The town is located on the banks of the Tombigbee River, which provides a source of recreation for the locals. The climate in Maben is humid subtropical, with hot summers and mild winters.
Economy
Maben’s economy is largely based on agriculture and timber production. The town is home to several small businesses, including a grocery store, a hardware store, and a few restaurants. The town also has a small manufacturing sector, which produces furniture and other wood products.
Demographics
As of the 2010 census, Maben had a population of 1,000 people. The racial makeup of the town was 97.2% White, 0.7% African American, 0.3% Native American, 0.2% Asian, and 1.6% from other races. The median household income was $25,000, and the median family income was $30,000.
History
Maben was founded in 1887 by a group of settlers from Alabama. The town was named after a local Native American chief, Maben. The town grew slowly over the years, and by the early 1900s, it had become a thriving agricultural community. The town was also home to several sawmills and timber companies, which provided employment for many of the locals.
In the 1950s, Maben experienced a period of growth and prosperity. The town was home to several businesses, including a bank, a movie theater, and a hotel. The town also had a thriving school system, which included a high school and a junior college.
In the late 1960s, Maben began to decline. The timber industry began to decline, and many of the businesses in town closed. The population of the town began to decline as well, and by the 2000 census, the population had dropped to 1,000 people.
Today, Maben is a small, rural town. The town is home to several small businesses, and the local economy is largely based on agriculture and timber production. The town is also home to a few churches, and the local school system is still in operation. Despite its small size, Maben is a vibrant community, and its residents take pride in their town and its history.
Common Questions
What is Per Capita Income in Maben?
Per Capita income in Maben is $11,604.
What is the Median Family Income in Maben?
Median Family Income in Maben is $24,440.
What is the Median Household income in Maben?
Median Household Income in Maben is $28,472.
What is Inequality or Gini Index in Maben?
Inequality or Gini Index in Maben is 0.36.
What is the Total Population of Maben?
Total Population of Maben is 1,024.
What is the Total Male Population of Maben?
Total Male Population of Maben is 340.
What is the Total Female Population of Maben?
Total Female Population of Maben is 684.
What is the Ratio of Males per 100 Females in Maben?
There are 49.71 Males per 100 Females in Maben.
What is the Ratio of Females per 100 Males in Maben?
There are 201.18 Females per 100 Males in Maben.
What is the Median Population Age in Maben?
Median Population Age in Maben is 22.5 Years.
What is the Average Family Size in Maben
Average Family Size in Maben is 3.5 People.
What is the Average Household Size in Maben
Average Household Size in Maben is 2.8 People.
How Large is the Labor Force in Maben?
There are 380 People in the Labor Forcein in Maben.
What is the Percentage of People in the Labor Force in Maben?
64.3% of People are in the Labor Force in Maben.
What is the Unemployment Rate in Maben?
Unemployment Rate in Maben is 6.3%.