Rolling Fork, MS Map & Demographics
Rolling Fork Map
Rolling Fork Overview
$19,015
PER CAPITA INCOME
$46,429
AVG FAMILY INCOME
$41,208
AVG HOUSEHOLD INCOME
12.1%
WAGE / INCOME GAP [ % ]
87.9¢/ $1
WAGE / INCOME GAP [ $ ]
0.47
INEQUALITY / GINI INDEX
2,172
TOTAL POPULATION
1,020
MALE POPULATION
1,152
FEMALE POPULATION
88.54
MALES / 100 FEMALES
112.94
FEMALES / 100 MALES
34.9
MEDIAN AGE
3.7
AVG FAMILY SIZE
3.0
AVG HOUSEHOLD SIZE
960
LABOR FORCE [ PEOPLE ]
57.5%
PERCENT IN LABOR FORCE
18.4%
UNEMPLOYMENT RATE
Rolling Fork Zip Codes
Rolling Fork Area Codes
Income in Rolling Fork
Income Overview in Rolling Fork
Per Capita Income in Rolling Fork is $19,015, while median incomes of families and households are $46,429 and $41,208 respectively.
| Characteristic | Number | Measure |
| Per Capita Income | 2,172 | $19,015 |
| Median Family Income | 468 | $46,429 |
| Mean Family Income | 468 | $66,242 |
| Median Household Income | 671 | $41,208 |
| Mean Household Income | 671 | $58,492 |
| Income Deficit | 468 | $0 |
| Wage / Income Gap (%) | 2,172 | 12.08% |
| Wage / Income Gap ($) | 2,172 | 87.92¢ per $1 |
| Gini / Inequality Index | 2,172 | 0.47 |
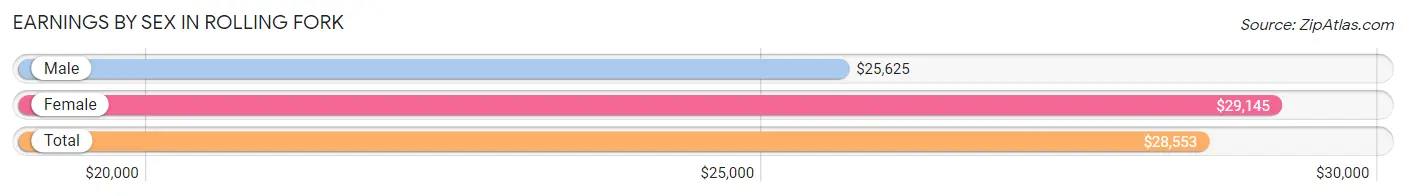
Earnings by Sex in Rolling Fork
Average Earnings in Rolling Fork are $28,553, $25,625 for men and $29,145 for women, a difference of 12.1%.
| Sex | Number | Average Earnings |
| Male | 407 (45.7%) | $25,625 |
| Female | 483 (54.3%) | $29,145 |
| Total | 890 (100.0%) | $28,553 |
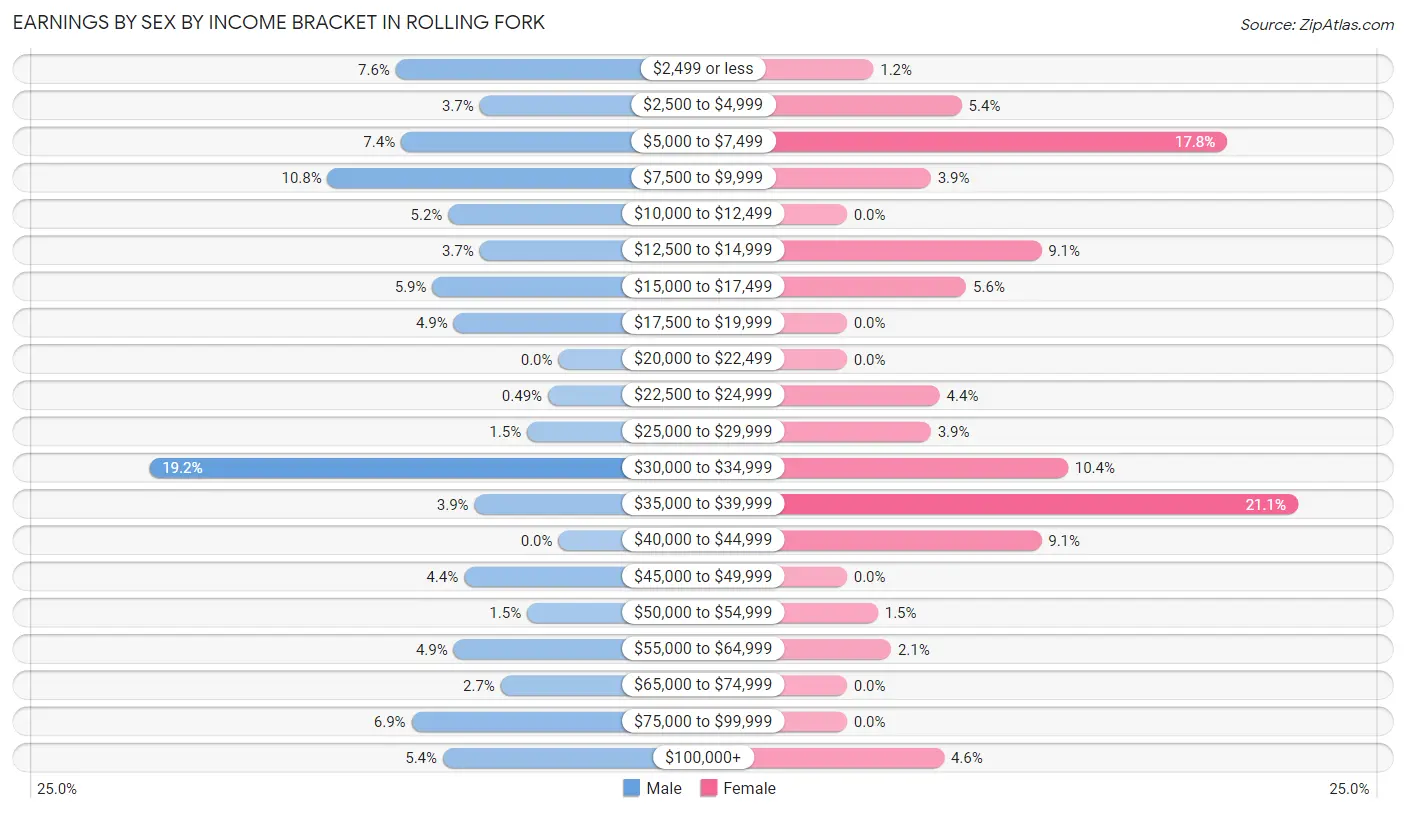
Earnings by Sex by Income Bracket in Rolling Fork
The most common earnings brackets in Rolling Fork are $30,000 to $34,999 for men (78 | 19.2%) and $35,000 to $39,999 for women (102 | 21.1%).
| Income | Male | Female |
| $2,499 or less | 31 (7.6%) | 6 (1.2%) |
| $2,500 to $4,999 | 15 (3.7%) | 26 (5.4%) |
| $5,000 to $7,499 | 30 (7.4%) | 86 (17.8%) |
| $7,500 to $9,999 | 44 (10.8%) | 19 (3.9%) |
| $10,000 to $12,499 | 21 (5.2%) | 0 (0.0%) |
| $12,500 to $14,999 | 15 (3.7%) | 44 (9.1%) |
| $15,000 to $17,499 | 24 (5.9%) | 27 (5.6%) |
| $17,500 to $19,999 | 20 (4.9%) | 0 (0.0%) |
| $20,000 to $22,499 | 0 (0.0%) | 0 (0.0%) |
| $22,500 to $24,999 | 2 (0.5%) | 21 (4.3%) |
| $25,000 to $29,999 | 6 (1.5%) | 19 (3.9%) |
| $30,000 to $34,999 | 78 (19.2%) | 50 (10.3%) |
| $35,000 to $39,999 | 16 (3.9%) | 102 (21.1%) |
| $40,000 to $44,999 | 0 (0.0%) | 44 (9.1%) |
| $45,000 to $49,999 | 18 (4.4%) | 0 (0.0%) |
| $50,000 to $54,999 | 6 (1.5%) | 7 (1.5%) |
| $55,000 to $64,999 | 20 (4.9%) | 10 (2.1%) |
| $65,000 to $74,999 | 11 (2.7%) | 0 (0.0%) |
| $75,000 to $99,999 | 28 (6.9%) | 0 (0.0%) |
| $100,000+ | 22 (5.4%) | 22 (4.5%) |
| Total | 407 (100.0%) | 483 (100.0%) |
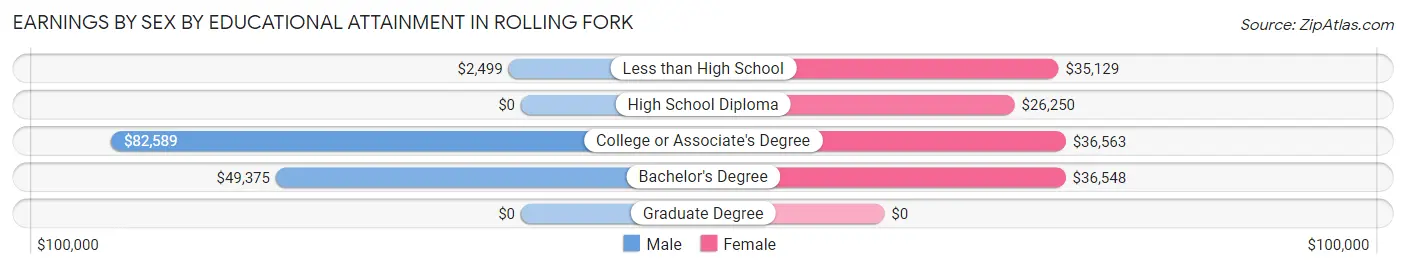
Earnings by Sex by Educational Attainment in Rolling Fork
Average earnings in Rolling Fork are $30,075 for men and $34,738 for women, a difference of 13.4%. Men with an educational attainment of college or associate's degree enjoy the highest average annual earnings of $82,589, while those with less than high school education earn the least with $2,499. Women with an educational attainment of college or associate's degree earn the most with the average annual earnings of $36,563, while those with high school diploma education have the smallest earnings of $26,250.
| Educational Attainment | Male Income | Female Income |
| Less than High School | $2,499 | $35,129 |
| High School Diploma | - | - |
| College or Associate's Degree | $82,589 | $36,563 |
| Bachelor's Degree | $49,375 | $36,548 |
| Graduate Degree | - | - |
| Total | $30,075 | $34,738 |
Family Income in Rolling Fork
Family Income Brackets in Rolling Fork
According to the Rolling Fork family income data, there are 93 families falling into the $50,000 to $74,999 income range, which is the most common income bracket and makes up 19.9% of all families. Conversely, the $150,000 to $199,999 income bracket is the least frequent group with only 2 families (0.4%) belonging to this category.
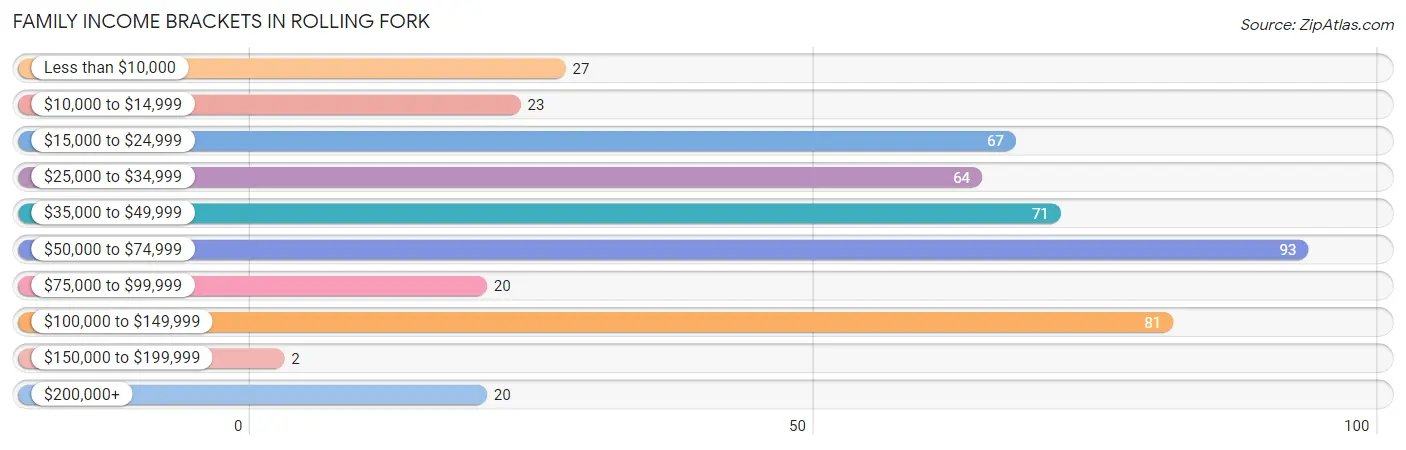
| Income Bracket | # Families | % Families |
| Less than $10,000 | 27 | 5.8% |
| $10,000 to $14,999 | 23 | 4.9% |
| $15,000 to $24,999 | 67 | 14.3% |
| $25,000 to $34,999 | 64 | 13.7% |
| $35,000 to $49,999 | 71 | 15.2% |
| $50,000 to $74,999 | 93 | 19.9% |
| $75,000 to $99,999 | 20 | 4.3% |
| $100,000 to $149,999 | 81 | 17.3% |
| $150,000 to $199,999 | 2 | 0.4% |
| $200,000+ | 20 | 4.3% |
Family Income by Famaliy Size in Rolling Fork
4-person families (79 | 16.9%) account for the highest median family income in Rolling Fork with $71,477 per family, while 4-person families (79 | 16.9%) have the highest median income of $17,869 per family member.
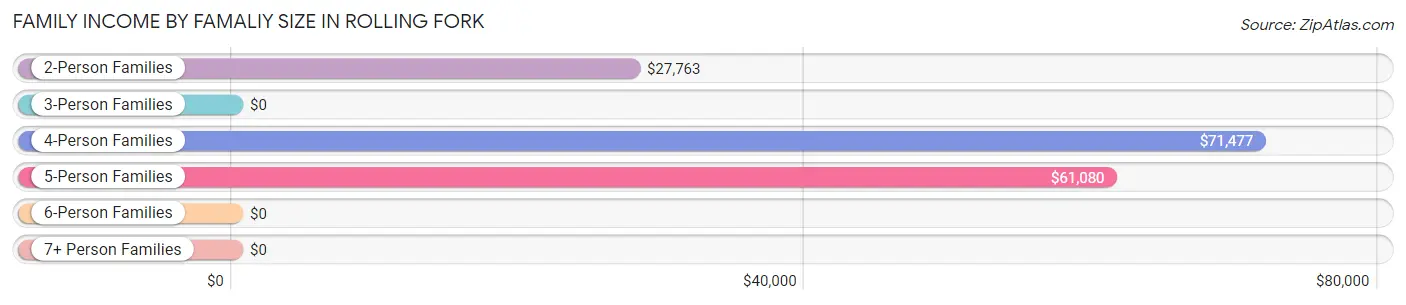
| Income Bracket | # Families | Median Income |
| 2-Person Families | 182 (38.9%) | $27,763 |
| 3-Person Families | 110 (23.5%) | $0 |
| 4-Person Families | 79 (16.9%) | $71,477 |
| 5-Person Families | 55 (11.7%) | $61,080 |
| 6-Person Families | 36 (7.7%) | $0 |
| 7+ Person Families | 6 (1.3%) | $0 |
| Total | 468 (100.0%) | $46,429 |
Family Income by Number of Earners in Rolling Fork
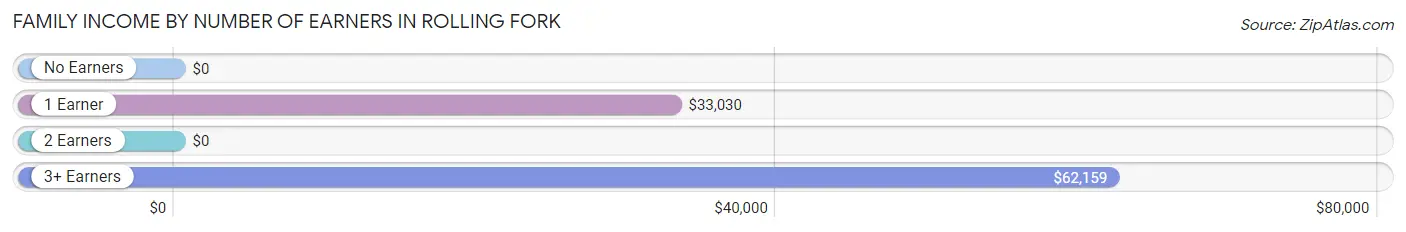
| Number of Earners | # Families | Median Income |
| No Earners | 62 (13.3%) | $0 |
| 1 Earner | 200 (42.7%) | $33,030 |
| 2 Earners | 168 (35.9%) | $0 |
| 3+ Earners | 38 (8.1%) | $62,159 |
| Total | 468 (100.0%) | $46,429 |
Household Income in Rolling Fork
Household Income Brackets in Rolling Fork
With 141 households falling in the category, the $15,000 to $24,999 income range is the most frequent in Rolling Fork, accounting for 21.0% of all households. In contrast, only 2 households (0.3%) fall into the $150,000 to $199,999 income bracket, making it the least populous group.
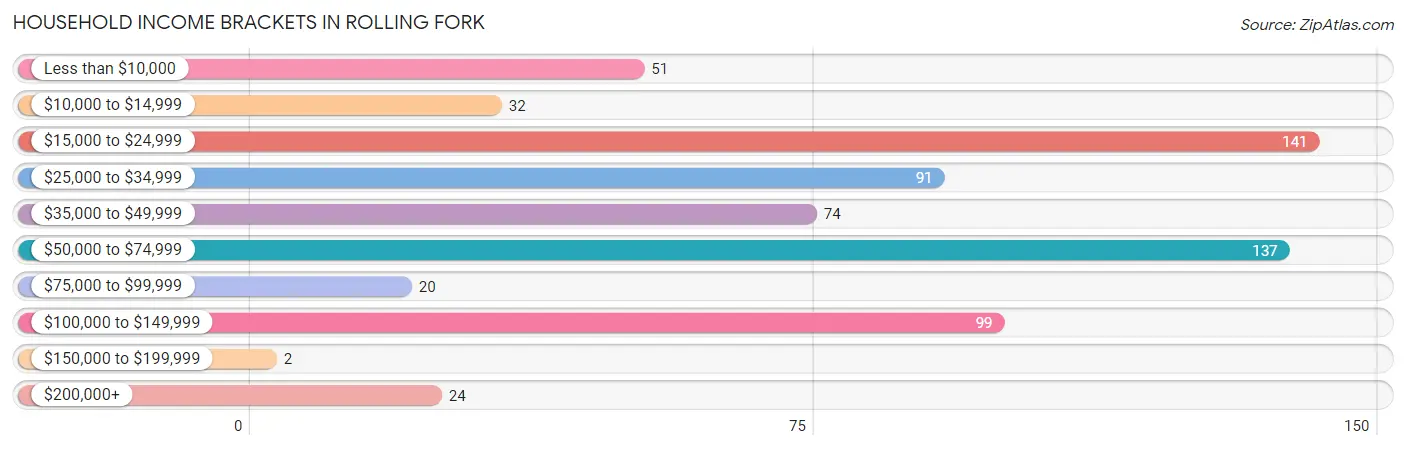
| Income Bracket | # Households | % Households |
| Less than $10,000 | 51 | 7.6% |
| $10,000 to $14,999 | 32 | 4.8% |
| $15,000 to $24,999 | 141 | 21.0% |
| $25,000 to $34,999 | 91 | 13.6% |
| $35,000 to $49,999 | 74 | 11.0% |
| $50,000 to $74,999 | 137 | 20.4% |
| $75,000 to $99,999 | 20 | 3.0% |
| $100,000 to $149,999 | 99 | 14.8% |
| $150,000 to $199,999 | 2 | 0.3% |
| $200,000+ | 24 | 3.6% |
Household Income by Householder Age in Rolling Fork
The median household income in Rolling Fork is $41,208, with the highest median household income of $65,606 found in the 25 to 44 years age bracket for the primary householder. A total of 216 households (32.2%) fall into this category. Meanwhile, the 15 to 24 years age bracket for the primary householder has the lowest median household income of $0, with 19 households (2.8%) in this group.
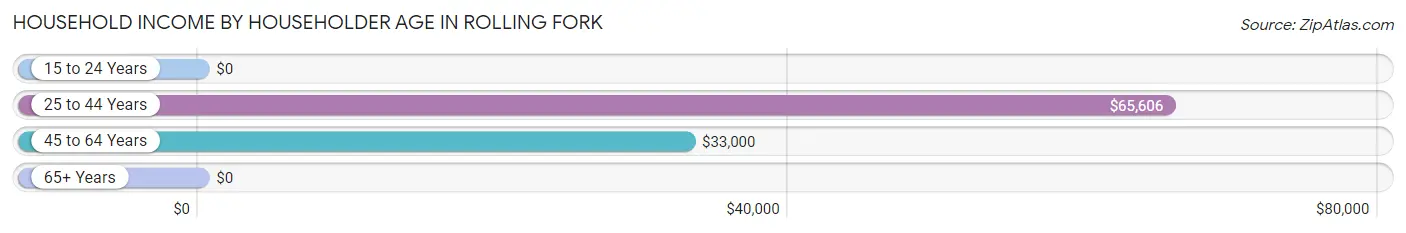
| Income Bracket | # Households | Median Income |
| 15 to 24 Years | 19 (2.8%) | $0 |
| 25 to 44 Years | 216 (32.2%) | $65,606 |
| 45 to 64 Years | 258 (38.5%) | $33,000 |
| 65+ Years | 178 (26.5%) | $0 |
| Total | 671 (100.0%) | $41,208 |
Poverty in Rolling Fork
Income Below Poverty by Sex and Age in Rolling Fork
With 17.6% poverty level for males and 20.1% for females among the residents of Rolling Fork, 35 to 44 year old males and 16 and 17 year old females are the most vulnerable to poverty, with 38 males (49.3%) and 16 females (100.0%) in their respective age groups living below the poverty level.
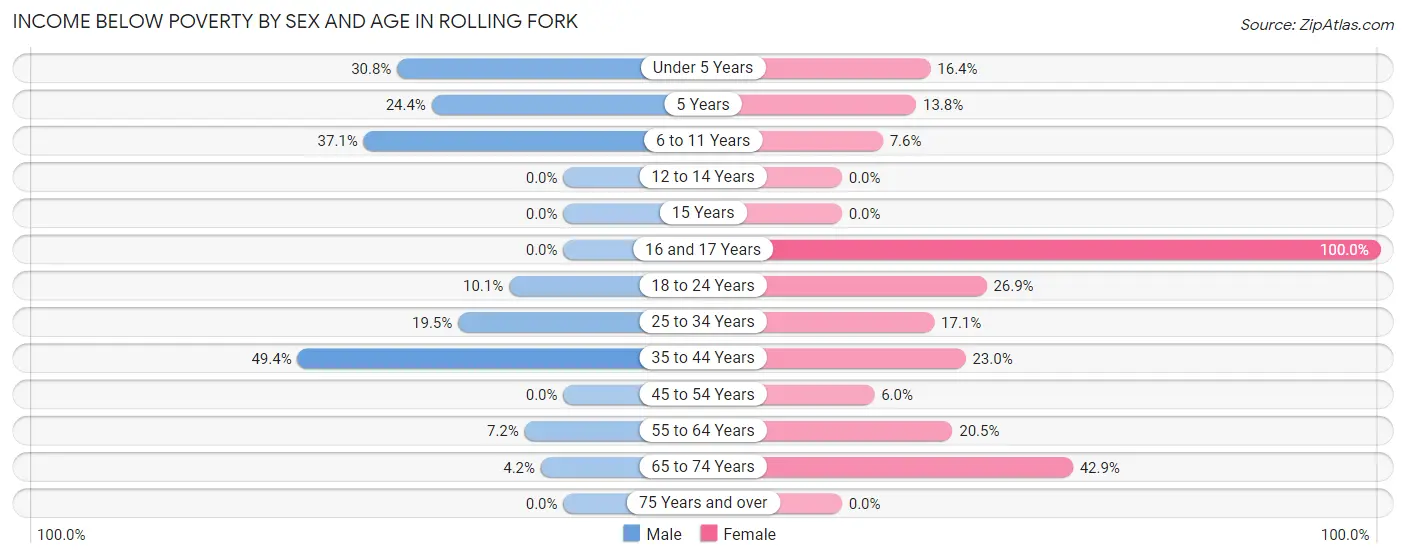
| Age Bracket | Male | Female |
| Under 5 Years | 33 (30.8%) | 12 (16.4%) |
| 5 Years | 11 (24.4%) | 4 (13.8%) |
| 6 to 11 Years | 43 (37.1%) | 6 (7.6%) |
| 12 to 14 Years | 0 (0.0%) | 0 (0.0%) |
| 15 Years | 0 (0.0%) | 0 (0.0%) |
| 16 and 17 Years | 0 (0.0%) | 16 (100.0%) |
| 18 to 24 Years | 13 (10.1%) | 29 (26.9%) |
| 25 to 34 Years | 25 (19.5%) | 24 (17.1%) |
| 35 to 44 Years | 38 (49.3%) | 31 (23.0%) |
| 45 to 54 Years | 0 (0.0%) | 5 (6.0%) |
| 55 to 64 Years | 10 (7.2%) | 40 (20.5%) |
| 65 to 74 Years | 3 (4.2%) | 48 (42.9%) |
| 75 Years and over | 0 (0.0%) | 0 (0.0%) |
| Total | 176 (17.6%) | 215 (20.1%) |
Income Above Poverty by Sex and Age in Rolling Fork
According to the poverty statistics in Rolling Fork, males aged 12 to 14 years and females aged 12 to 14 years are the age groups that are most secure financially, with 100.0% of males and 100.0% of females in these age groups living above the poverty line.
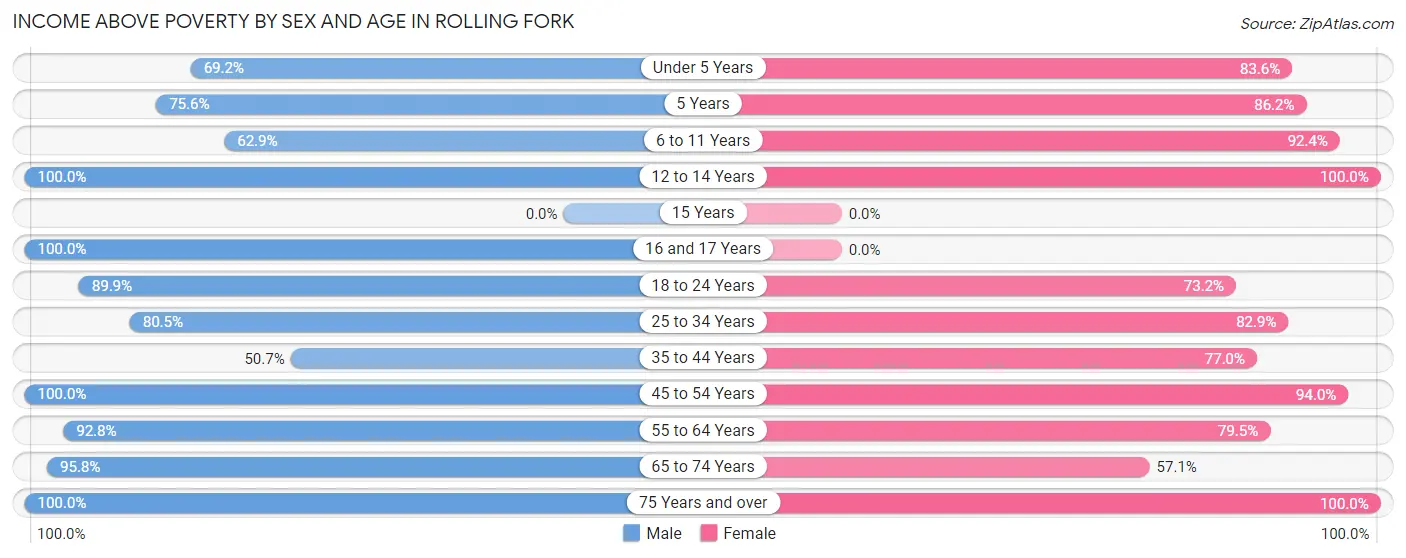
| Age Bracket | Male | Female |
| Under 5 Years | 74 (69.2%) | 61 (83.6%) |
| 5 Years | 34 (75.6%) | 25 (86.2%) |
| 6 to 11 Years | 73 (62.9%) | 73 (92.4%) |
| 12 to 14 Years | 6 (100.0%) | 44 (100.0%) |
| 15 Years | 0 (0.0%) | 0 (0.0%) |
| 16 and 17 Years | 42 (100.0%) | 0 (0.0%) |
| 18 to 24 Years | 116 (89.9%) | 79 (73.2%) |
| 25 to 34 Years | 103 (80.5%) | 116 (82.9%) |
| 35 to 44 Years | 39 (50.6%) | 104 (77.0%) |
| 45 to 54 Years | 41 (100.0%) | 78 (94.0%) |
| 55 to 64 Years | 129 (92.8%) | 155 (79.5%) |
| 65 to 74 Years | 69 (95.8%) | 64 (57.1%) |
| 75 Years and over | 97 (100.0%) | 58 (100.0%) |
| Total | 823 (82.4%) | 857 (79.9%) |
Income Below Poverty Among Married-Couple Families in Rolling Fork
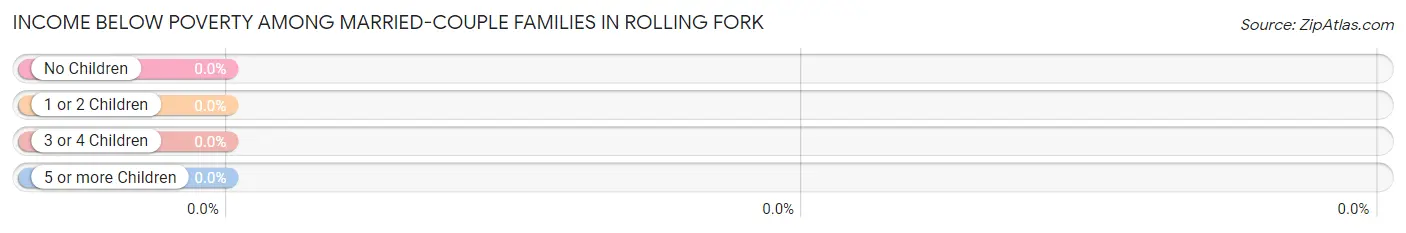
| Children | Above Poverty | Below Poverty |
| No Children | 111 (100.0%) | 0 (0.0%) |
| 1 or 2 Children | 111 (100.0%) | 0 (0.0%) |
| 3 or 4 Children | 15 (100.0%) | 0 (0.0%) |
| 5 or more Children | 0 (0.0%) | 0 (0.0%) |
| Total | 237 (100.0%) | 0 (0.0%) |
Income Below Poverty Among Single-Parent Households in Rolling Fork
According to the poverty data in Rolling Fork, 100.0% or 20 single-father households and 40.3% or 85 single-mother households are living below the poverty line. Among single-father households, those with 3 or 4 children have the highest poverty rate, with 20 households (100.0%) experiencing poverty. Likewise, among single-mother households, those with 5 or more children have the highest poverty rate, with 4 households (66.7%) falling below the poverty line.
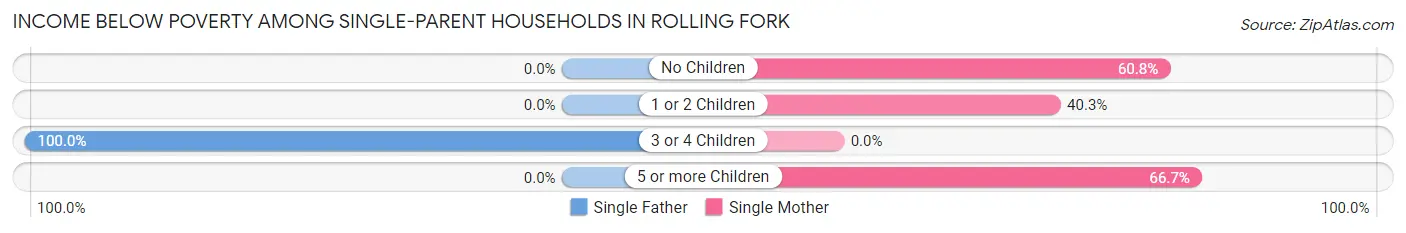
| Children | Single Father | Single Mother |
| No Children | 0 (0.0%) | 31 (60.8%) |
| 1 or 2 Children | 0 (0.0%) | 50 (40.3%) |
| 3 or 4 Children | 20 (100.0%) | 0 (0.0%) |
| 5 or more Children | 0 (0.0%) | 4 (66.7%) |
| Total | 20 (100.0%) | 85 (40.3%) |
Income Below Poverty Among Married-Couple vs Single-Parent Households in Rolling Fork
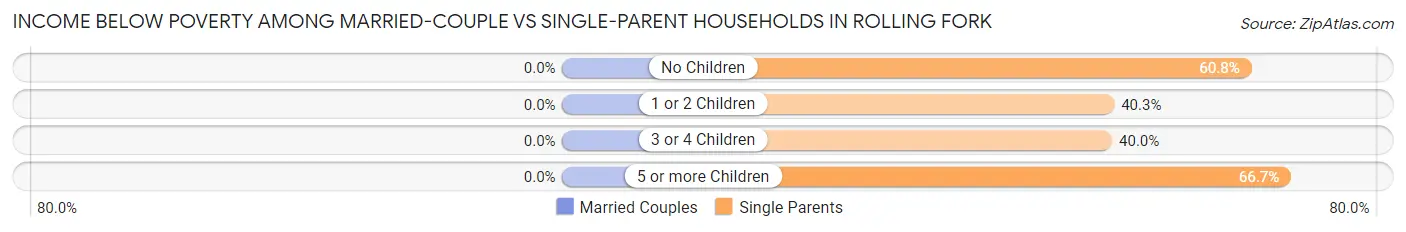
| Children | Married-Couple Families | Single-Parent Households |
| No Children | 0 (0.0%) | 31 (60.8%) |
| 1 or 2 Children | 0 (0.0%) | 50 (40.3%) |
| 3 or 4 Children | 0 (0.0%) | 20 (40.0%) |
| 5 or more Children | 0 (0.0%) | 4 (66.7%) |
| Total | 0 (0.0%) | 105 (45.5%) |
Race in Rolling Fork
The most populous races in Rolling Fork are Black / African American (1,721 | 79.2%), and White / Caucasian (451 | 20.8%).
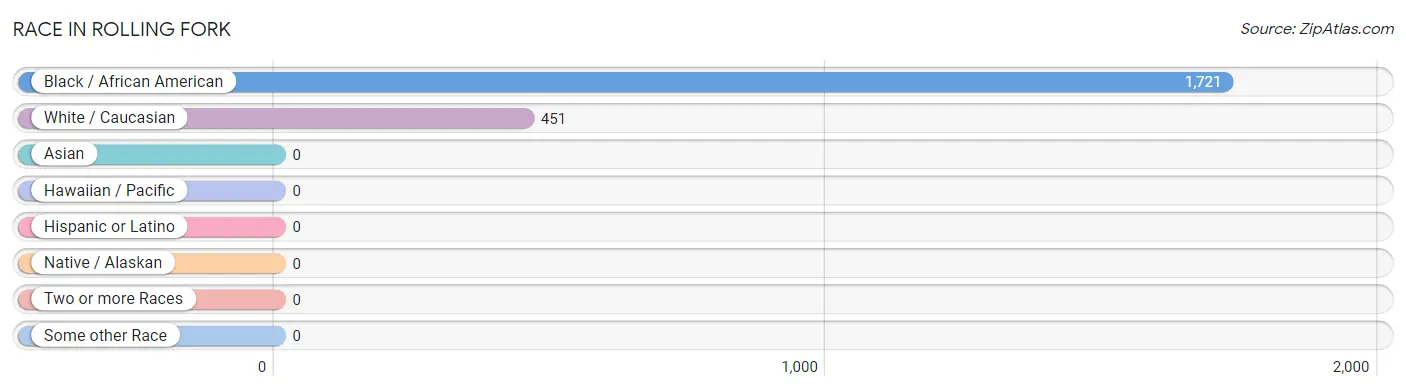
| Race | # Population | % Population |
| Asian | 0 | 0.0% |
| Black / African American | 1,721 | 79.2% |
| Hawaiian / Pacific | 0 | 0.0% |
| Hispanic or Latino | 0 | 0.0% |
| Native / Alaskan | 0 | 0.0% |
| White / Caucasian | 451 | 20.8% |
| Two or more Races | 0 | 0.0% |
| Some other Race | 0 | 0.0% |
| Total | 2,172 | 100.0% |
Ancestry in Rolling Fork
The most populous ancestries reported in Rolling Fork are American (227 | 10.4%), Irish (58 | 2.7%), English (30 | 1.4%), German (14 | 0.6%), and Italian (13 | 0.6%), together accounting for 15.7% of all Rolling Fork residents.
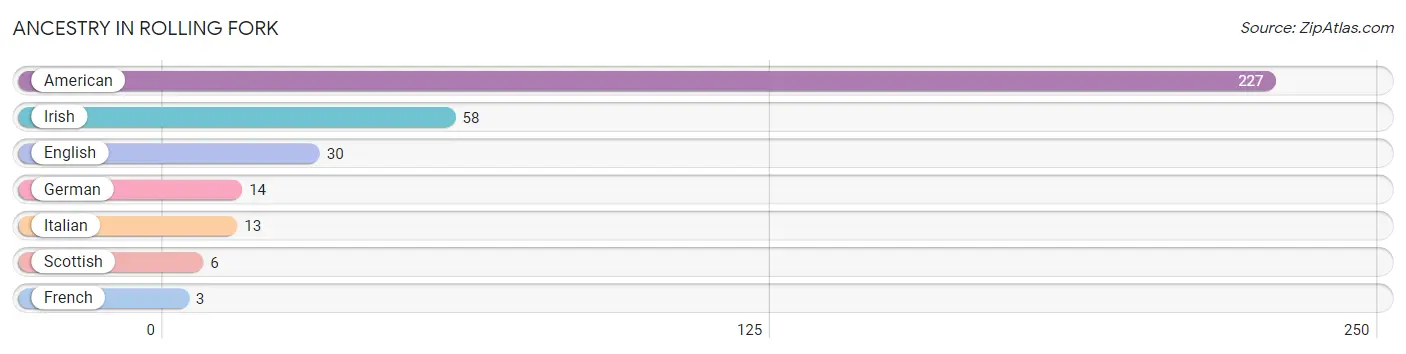
| Ancestry | # Population | % Population |
| American | 227 | 10.4% |
| English | 30 | 1.4% |
| French | 3 | 0.1% |
| German | 14 | 0.6% |
| Irish | 58 | 2.7% |
| Italian | 13 | 0.6% |
| Scottish | 6 | 0.3% | View All 7 Rows |
Immigrants in Rolling Fork

| Immigration Origin | # Population | % Population | View All 0 Rows |
Sex and Age in Rolling Fork
Sex and Age in Rolling Fork
The most populous age groups in Rolling Fork are 5 to 9 Years (135 | 13.2%) for men and 55 to 59 Years (108 | 9.4%) for women.
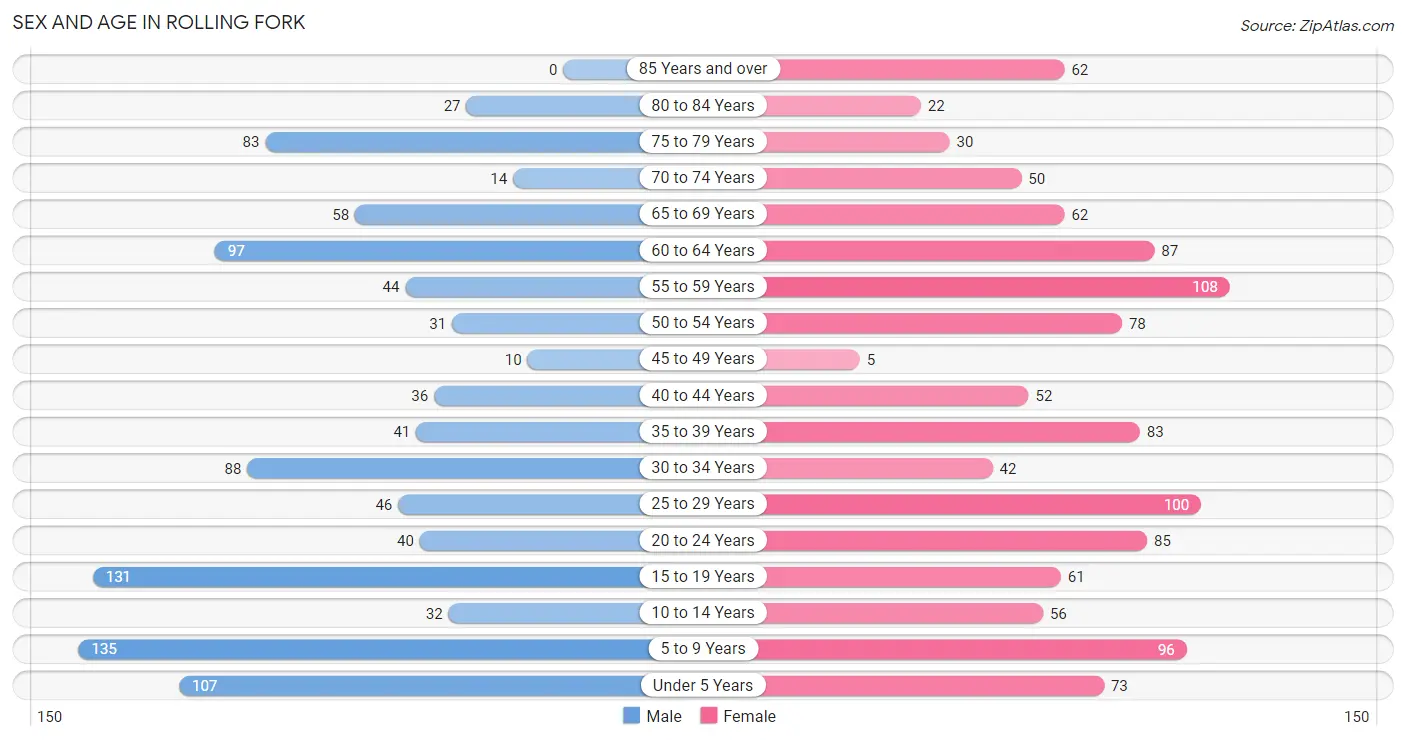
| Age Bracket | Male | Female |
| Under 5 Years | 107 (10.5%) | 73 (6.3%) |
| 5 to 9 Years | 135 (13.2%) | 96 (8.3%) |
| 10 to 14 Years | 32 (3.1%) | 56 (4.9%) |
| 15 to 19 Years | 131 (12.8%) | 61 (5.3%) |
| 20 to 24 Years | 40 (3.9%) | 85 (7.4%) |
| 25 to 29 Years | 46 (4.5%) | 100 (8.7%) |
| 30 to 34 Years | 88 (8.6%) | 42 (3.6%) |
| 35 to 39 Years | 41 (4.0%) | 83 (7.2%) |
| 40 to 44 Years | 36 (3.5%) | 52 (4.5%) |
| 45 to 49 Years | 10 (1.0%) | 5 (0.4%) |
| 50 to 54 Years | 31 (3.0%) | 78 (6.8%) |
| 55 to 59 Years | 44 (4.3%) | 108 (9.4%) |
| 60 to 64 Years | 97 (9.5%) | 87 (7.5%) |
| 65 to 69 Years | 58 (5.7%) | 62 (5.4%) |
| 70 to 74 Years | 14 (1.4%) | 50 (4.3%) |
| 75 to 79 Years | 83 (8.1%) | 30 (2.6%) |
| 80 to 84 Years | 27 (2.6%) | 22 (1.9%) |
| 85 Years and over | 0 (0.0%) | 62 (5.4%) |
| Total | 1,020 (100.0%) | 1,152 (100.0%) |
Families and Households in Rolling Fork
Median Family Size in Rolling Fork
The median family size in Rolling Fork is 3.72 persons per family, with single female/mother families (211 | 45.1%) accounting for the largest median family size of 4.41 persons per family. On the other hand, single male/father families (20 | 4.3%) represent the smallest median family size with 2.30 persons per family.
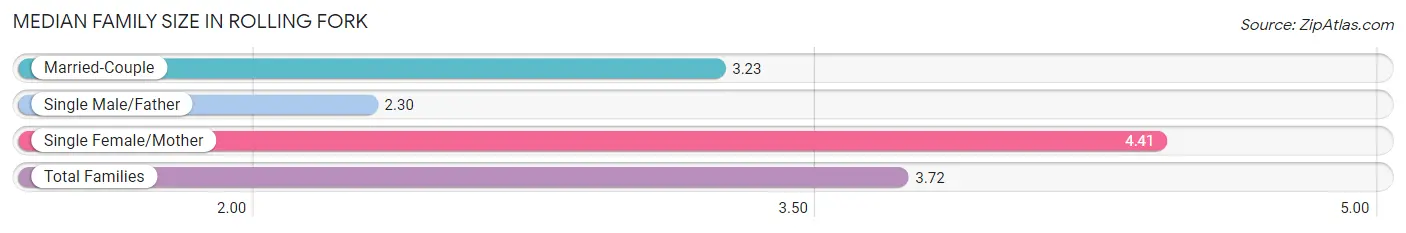
| Family Type | # Families | Family Size |
| Married-Couple | 237 (50.6%) | 3.23 |
| Single Male/Father | 20 (4.3%) | 2.30 |
| Single Female/Mother | 211 (45.1%) | 4.41 |
| Total Families | 468 (100.0%) | 3.72 |
Median Household Size in Rolling Fork
The median household size in Rolling Fork is 3.04 persons per household, with single female/mother households (211 | 31.5%) accounting for the largest median household size of 4.58 persons per household. non-family households (203 | 30.2%) represent the smallest median household size with 1.16 persons per household.
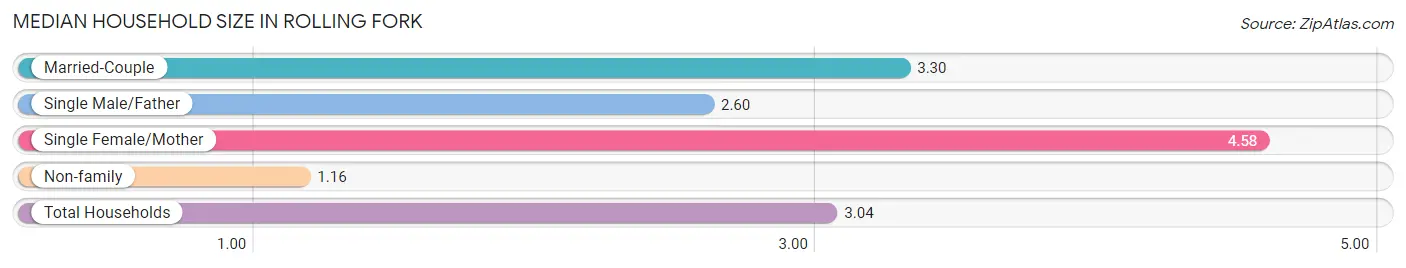
| Household Type | # Households | Household Size |
| Married-Couple | 237 (35.3%) | 3.30 |
| Single Male/Father | 20 (3.0%) | 2.60 |
| Single Female/Mother | 211 (31.5%) | 4.58 |
| Non-family | 203 (30.2%) | 1.16 |
| Total Households | 671 (100.0%) | 3.04 |
Household Size by Marriage Status in Rolling Fork
Out of a total of 671 households in Rolling Fork, 468 (69.8%) are family households, while 203 (30.2%) are nonfamily households. The most numerous type of family households are 2-person households, comprising 177, and the most common type of nonfamily households are 1-person households, comprising 166.
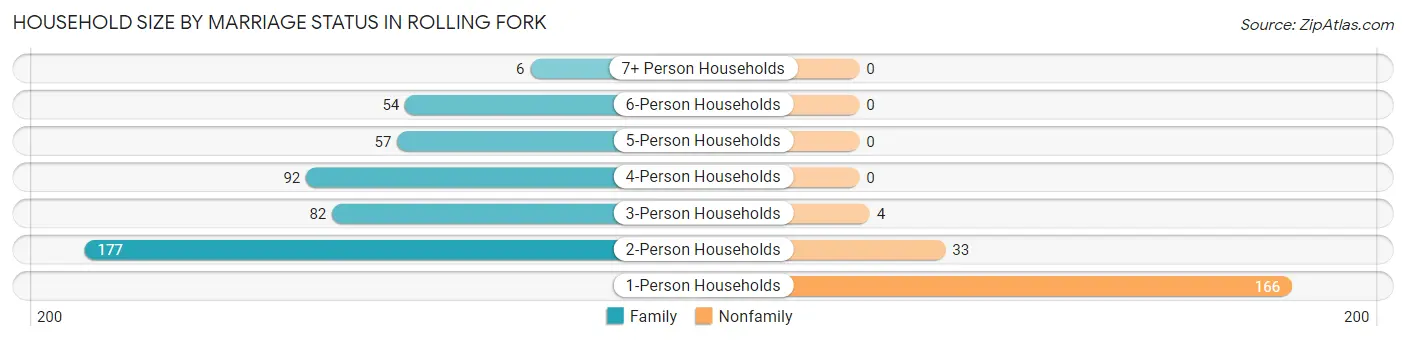
| Household Size | Family Households | Nonfamily Households |
| 1-Person Households | - | 166 (24.7%) |
| 2-Person Households | 177 (26.4%) | 33 (4.9%) |
| 3-Person Households | 82 (12.2%) | 4 (0.6%) |
| 4-Person Households | 92 (13.7%) | 0 (0.0%) |
| 5-Person Households | 57 (8.5%) | 0 (0.0%) |
| 6-Person Households | 54 (8.1%) | 0 (0.0%) |
| 7+ Person Households | 6 (0.9%) | 0 (0.0%) |
| Total | 468 (69.8%) | 203 (30.2%) |
Female Fertility in Rolling Fork
Fertility by Age in Rolling Fork
| Age Bracket | Women with Births | Births / 1,000 Women |
| 15 to 19 years | 0 (0.0%) | 0.0 |
| 20 to 34 years | 0 (0.0%) | 0.0 |
| 35 to 50 years | 0 (0.0%) | 0.0 |
| Total | 0 (0.0%) | 0.0 |
Fertility by Age by Marriage Status in Rolling Fork
| Age Bracket | Married | Unmarried |
| 15 to 19 years | 0 (0.0%) | 0 (0.0%) |
| 20 to 34 years | 0 (0.0%) | 0 (0.0%) |
| 35 to 50 years | 0 (0.0%) | 0 (0.0%) |
| Total | 0 (0.0%) | 0 (0.0%) |
Fertility by Education in Rolling Fork
| Educational Attainment | Women with Births | Births / 1,000 Women |
| Less than High School | 0 (0.0%) | 0.0 |
| High School Diploma | 0 (0.0%) | 0.0 |
| College or Associate's Degree | 0 (0.0%) | 0.0 |
| Bachelor's Degree | 0 (0.0%) | 0.0 |
| Graduate Degree | 0 (0.0%) | 0.0 |
| Total | 0 (0.0%) | 0.0 |
Fertility by Education by Marriage Status in Rolling Fork
| Educational Attainment | Married | Unmarried |
| Less than High School | 0 (0.0%) | 0 (0.0%) |
| High School Diploma | 0 (0.0%) | 0 (0.0%) |
| College or Associate's Degree | 0 (0.0%) | 0 (0.0%) |
| Bachelor's Degree | 0 (0.0%) | 0 (0.0%) |
| Graduate Degree | 0 (0.0%) | 0 (0.0%) |
| Total | 0 (0.0%) | 0 (0.0%) |
Employment Characteristics in Rolling Fork
Employment by Class of Employer in Rolling Fork
Among the 745 employed individuals in Rolling Fork, private company employees (430 | 57.7%), state government employees (123 | 16.5%), and local government employees (61 | 8.2%) make up the most common classes of employment.
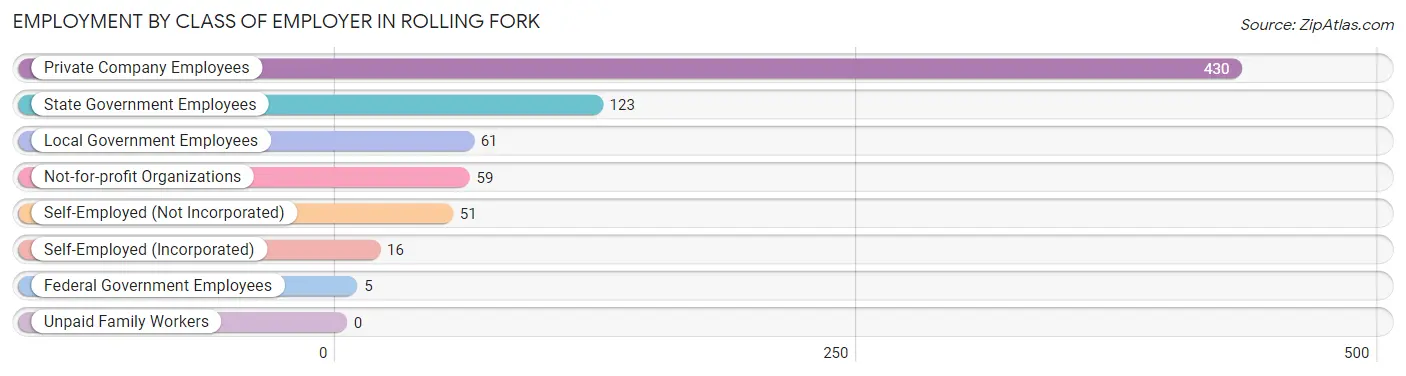
| Employer Class | # Employees | % Employees |
| Private Company Employees | 430 | 57.7% |
| Self-Employed (Incorporated) | 16 | 2.1% |
| Self-Employed (Not Incorporated) | 51 | 6.9% |
| Not-for-profit Organizations | 59 | 7.9% |
| Local Government Employees | 61 | 8.2% |
| State Government Employees | 123 | 16.5% |
| Federal Government Employees | 5 | 0.7% |
| Unpaid Family Workers | 0 | 0.0% |
| Total | 745 | 100.0% |
Employment Status by Age in Rolling Fork
According to the labor force statistics for Rolling Fork, out of the total population over 16 years of age (1,669), 57.5% or 960 individuals are in the labor force, with 18.4% or 177 of them unemployed. The age group with the highest labor force participation rate is 20 to 24 years, with 82.4% or 103 individuals in the labor force. Within the labor force, the 16 to 19 years age range has the highest percentage of unemployed individuals, with 86.4% or 114 of them being unemployed.
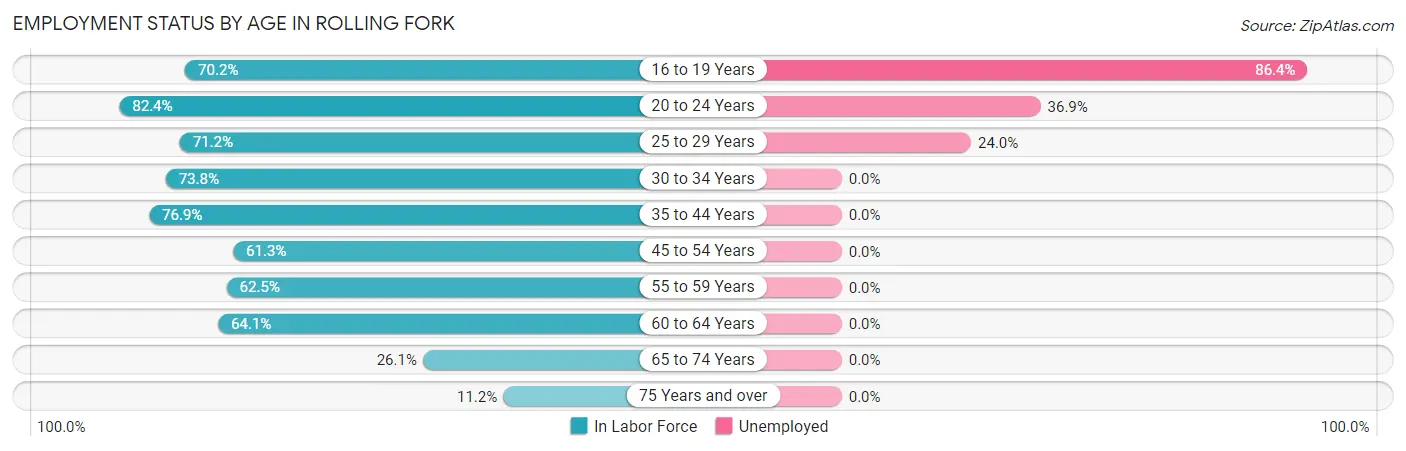
| Age Bracket | In Labor Force | Unemployed |
| 16 to 19 Years | 132 (70.2%) | 114 (86.4%) |
| 20 to 24 Years | 103 (82.4%) | 38 (36.9%) |
| 25 to 29 Years | 104 (71.2%) | 25 (24.0%) |
| 30 to 34 Years | 96 (73.8%) | 0 (0.0%) |
| 35 to 44 Years | 163 (76.9%) | 0 (0.0%) |
| 45 to 54 Years | 76 (61.3%) | 0 (0.0%) |
| 55 to 59 Years | 95 (62.5%) | 0 (0.0%) |
| 60 to 64 Years | 118 (64.1%) | 0 (0.0%) |
| 65 to 74 Years | 48 (26.1%) | 0 (0.0%) |
| 75 Years and over | 25 (11.2%) | 0 (0.0%) |
| Total | 960 (57.5%) | 177 (18.4%) |
Employment Status by Educational Attainment in Rolling Fork
According to labor force statistics for Rolling Fork, 68.8% of individuals (652) out of the total population between 25 and 64 years of age (948) are in the labor force, with 3.8% or 25 of them being unemployed. The group with the highest labor force participation rate are those with the educational attainment of high school diploma, with 78.0% or 393 individuals in the labor force. Within the labor force, individuals with high school diploma education have the highest percentage of unemployment, with 6.4% or 25 of them being unemployed.
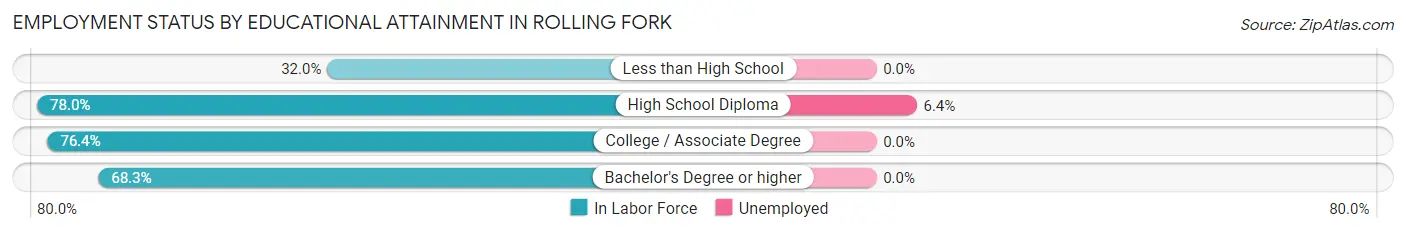
| Educational Attainment | In Labor Force | Unemployed |
| Less than High School | 54 (32.0%) | 0 (0.0%) |
| High School Diploma | 393 (78.0%) | 32 (6.4%) |
| College / Associate Degree | 162 (76.4%) | 0 (0.0%) |
| Bachelor's Degree or higher | 43 (68.3%) | 0 (0.0%) |
| Total | 652 (68.8%) | 36 (3.8%) |
Employment Occupations by Sex in Rolling Fork
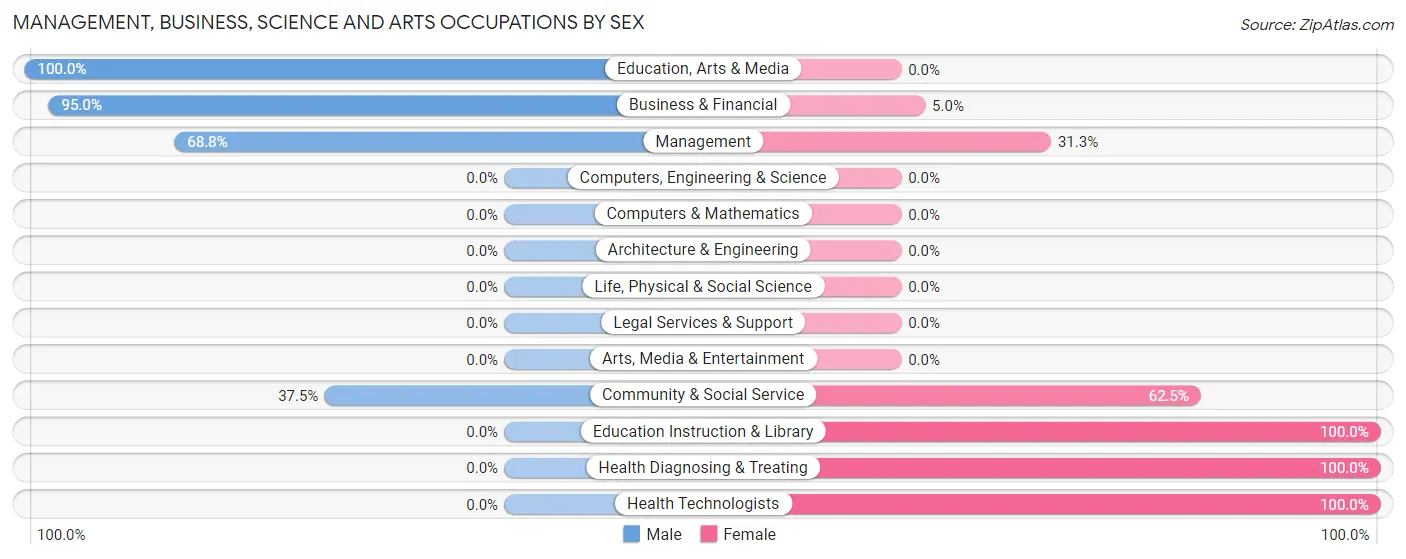
Management, Business, Science and Arts Occupations
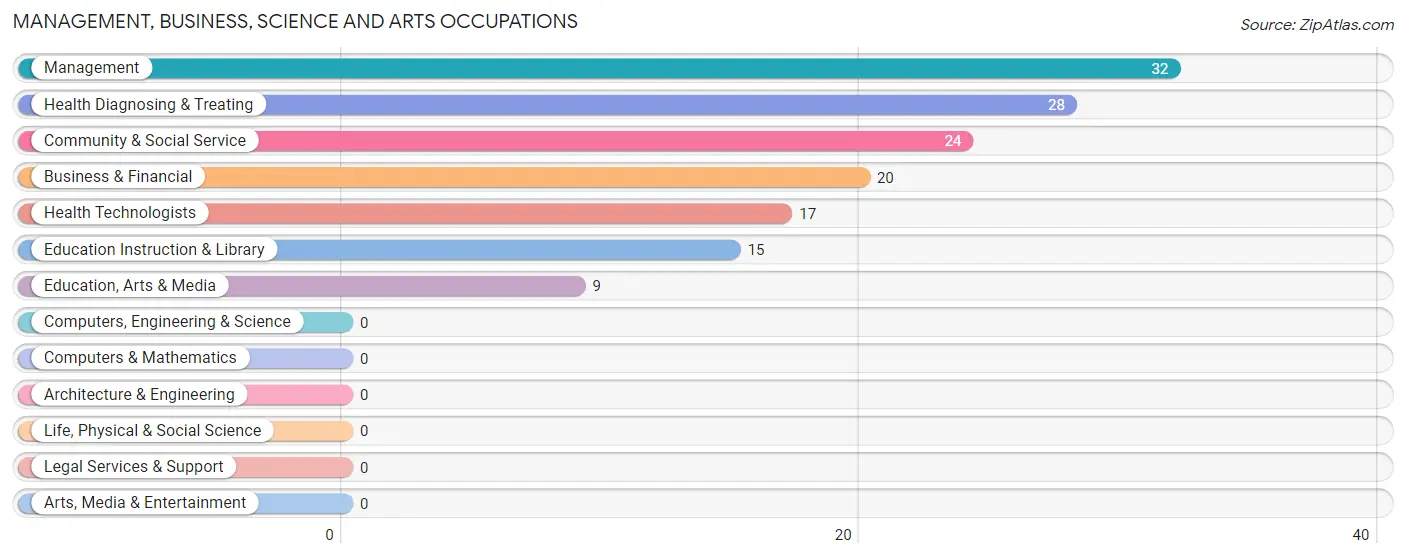
The most common Management, Business, Science and Arts occupations in Rolling Fork are Management (32 | 4.1%), Health Diagnosing & Treating (28 | 3.6%), Community & Social Service (24 | 3.1%), Business & Financial (20 | 2.5%), and Health Technologists (17 | 2.2%).
Management, Business, Science and Arts Occupations by Sex
Within the Management, Business, Science and Arts occupations in Rolling Fork, the most male-oriented occupations are Education, Arts & Media (100.0%), Business & Financial (95.0%), and Management (68.8%), while the most female-oriented occupations are Education Instruction & Library (100.0%), Health Diagnosing & Treating (100.0%), and Health Technologists (100.0%).
| Occupation | Male | Female |
| Management | 22 (68.8%) | 10 (31.2%) |
| Business & Financial | 19 (95.0%) | 1 (5.0%) |
| Computers, Engineering & Science | 0 (0.0%) | 0 (0.0%) |
| Computers & Mathematics | 0 (0.0%) | 0 (0.0%) |
| Architecture & Engineering | 0 (0.0%) | 0 (0.0%) |
| Life, Physical & Social Science | 0 (0.0%) | 0 (0.0%) |
| Community & Social Service | 9 (37.5%) | 15 (62.5%) |
| Education, Arts & Media | 9 (100.0%) | 0 (0.0%) |
| Legal Services & Support | 0 (0.0%) | 0 (0.0%) |
| Education Instruction & Library | 0 (0.0%) | 15 (100.0%) |
| Arts, Media & Entertainment | 0 (0.0%) | 0 (0.0%) |
| Health Diagnosing & Treating | 0 (0.0%) | 28 (100.0%) |
| Health Technologists | 0 (0.0%) | 17 (100.0%) |
| Total (Category) | 50 (48.1%) | 54 (51.9%) |
| Total (Overall) | 392 (50.1%) | 391 (49.9%) |
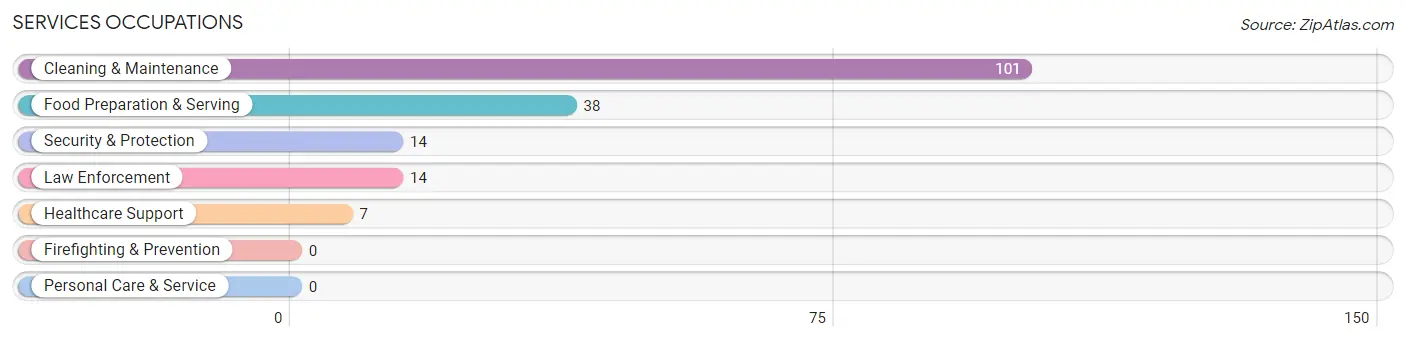
Services Occupations
The most common Services occupations in Rolling Fork are Cleaning & Maintenance (101 | 12.9%), Food Preparation & Serving (38 | 4.9%), Security & Protection (14 | 1.8%), Law Enforcement (14 | 1.8%), and Healthcare Support (7 | 0.9%).
Services Occupations by Sex
Within the Services occupations in Rolling Fork, the most male-oriented occupations are Security & Protection (100.0%), Law Enforcement (100.0%), and Cleaning & Maintenance (74.3%), while the most female-oriented occupations are Healthcare Support (100.0%), Food Preparation & Serving (100.0%), and Cleaning & Maintenance (25.7%).
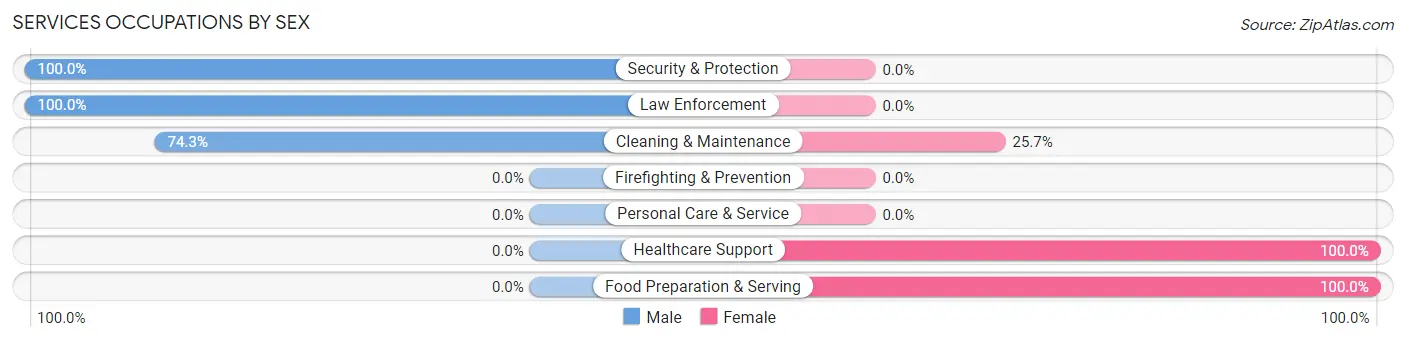
| Occupation | Male | Female |
| Healthcare Support | 0 (0.0%) | 7 (100.0%) |
| Security & Protection | 14 (100.0%) | 0 (0.0%) |
| Firefighting & Prevention | 0 (0.0%) | 0 (0.0%) |
| Law Enforcement | 14 (100.0%) | 0 (0.0%) |
| Food Preparation & Serving | 0 (0.0%) | 38 (100.0%) |
| Cleaning & Maintenance | 75 (74.3%) | 26 (25.7%) |
| Personal Care & Service | 0 (0.0%) | 0 (0.0%) |
| Total (Category) | 89 (55.6%) | 71 (44.4%) |
| Total (Overall) | 392 (50.1%) | 391 (49.9%) |
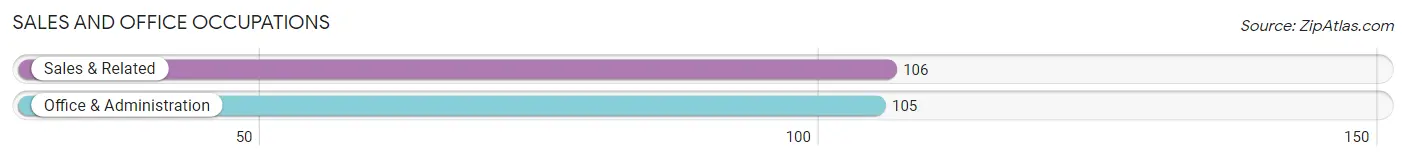
Sales and Office Occupations
The most common Sales and Office occupations in Rolling Fork are Sales & Related (106 | 13.5%), and Office & Administration (105 | 13.4%).
Sales and Office Occupations by Sex
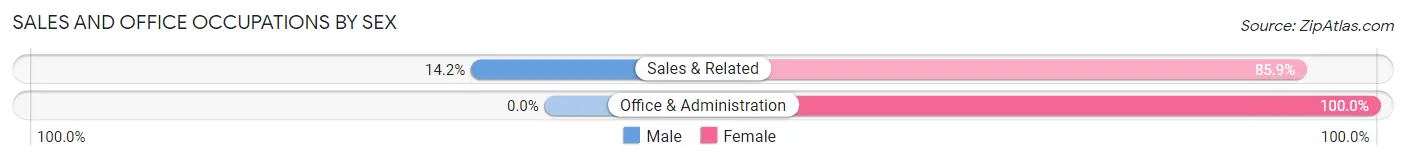
| Occupation | Male | Female |
| Sales & Related | 15 (14.1%) | 91 (85.9%) |
| Office & Administration | 0 (0.0%) | 105 (100.0%) |
| Total (Category) | 15 (7.1%) | 196 (92.9%) |
| Total (Overall) | 392 (50.1%) | 391 (49.9%) |
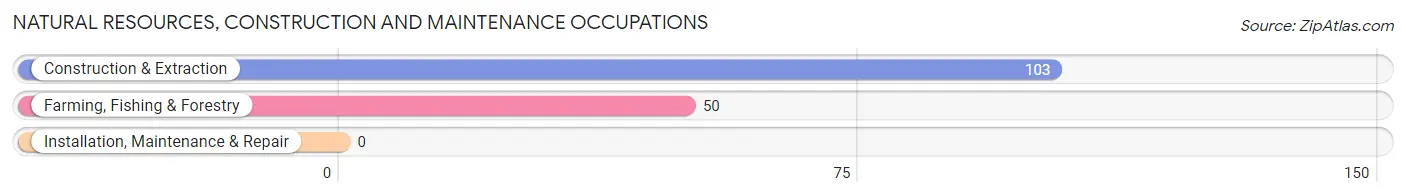
Natural Resources, Construction and Maintenance Occupations
The most common Natural Resources, Construction and Maintenance occupations in Rolling Fork are Construction & Extraction (103 | 13.2%), and Farming, Fishing & Forestry (50 | 6.4%).
Natural Resources, Construction and Maintenance Occupations by Sex
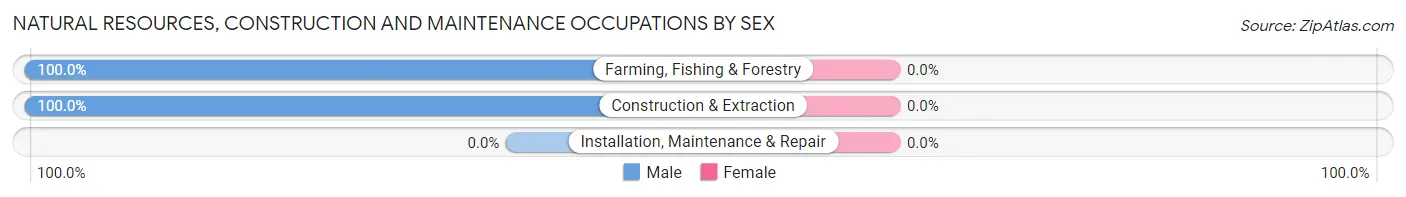
| Occupation | Male | Female |
| Farming, Fishing & Forestry | 50 (100.0%) | 0 (0.0%) |
| Construction & Extraction | 103 (100.0%) | 0 (0.0%) |
| Installation, Maintenance & Repair | 0 (0.0%) | 0 (0.0%) |
| Total (Category) | 153 (100.0%) | 0 (0.0%) |
| Total (Overall) | 392 (50.1%) | 391 (49.9%) |
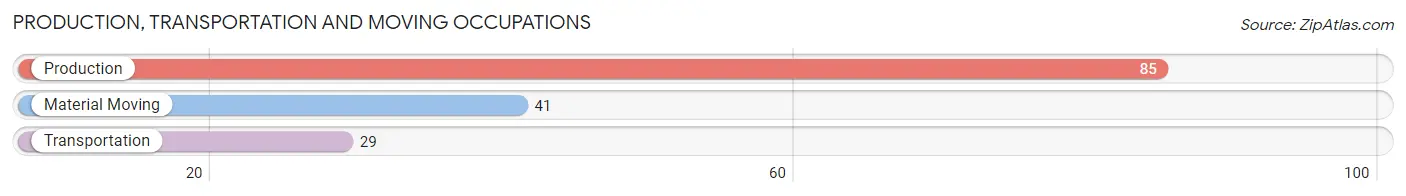
Production, Transportation and Moving Occupations
The most common Production, Transportation and Moving occupations in Rolling Fork are Production (85 | 10.9%), Material Moving (41 | 5.2%), and Transportation (29 | 3.7%).
Production, Transportation and Moving Occupations by Sex
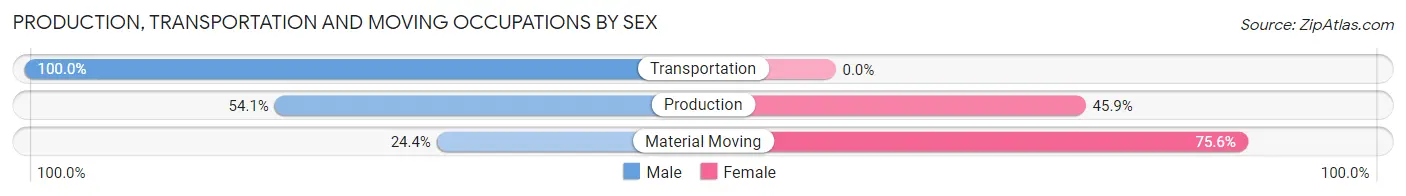
| Occupation | Male | Female |
| Production | 46 (54.1%) | 39 (45.9%) |
| Transportation | 29 (100.0%) | 0 (0.0%) |
| Material Moving | 10 (24.4%) | 31 (75.6%) |
| Total (Category) | 85 (54.8%) | 70 (45.2%) |
| Total (Overall) | 392 (50.1%) | 391 (49.9%) |
Employment Industries by Sex in Rolling Fork
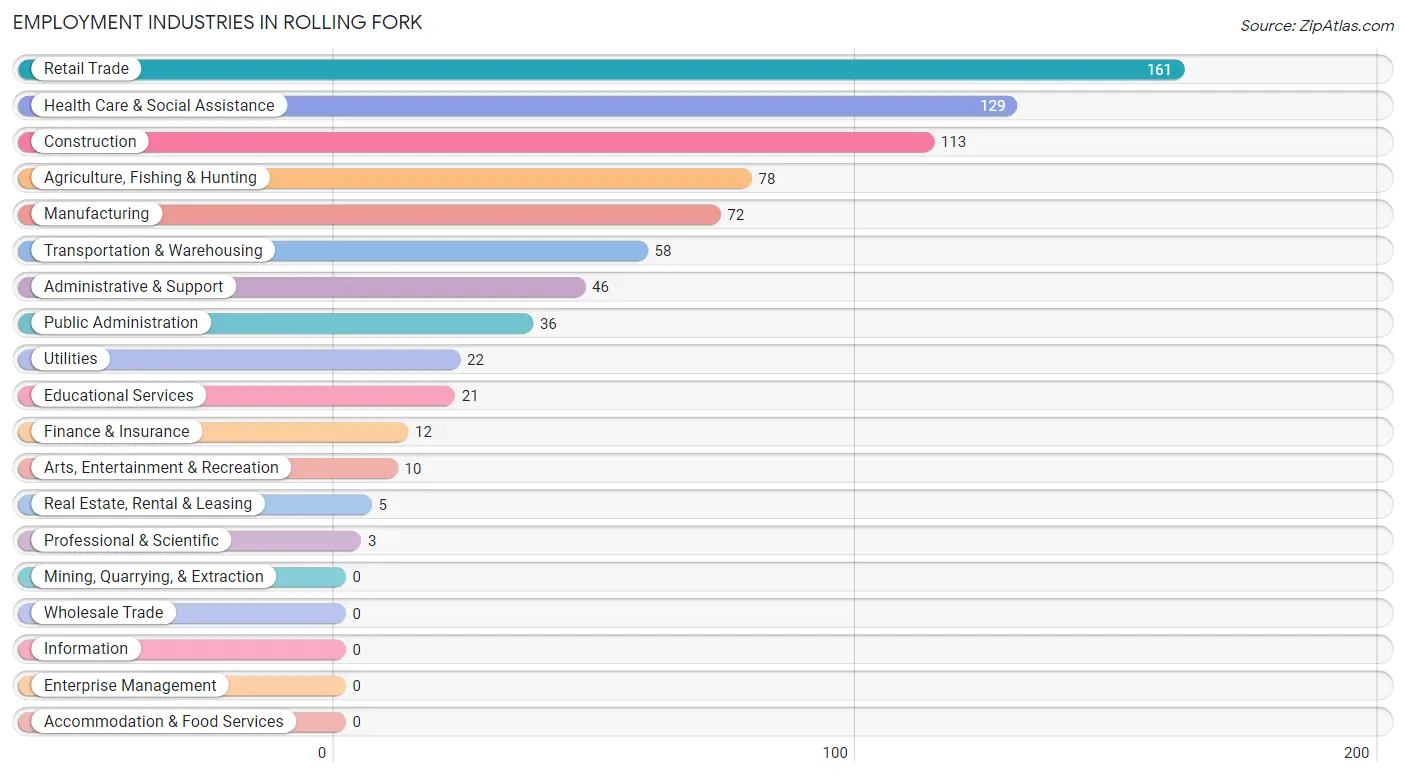
Employment Industries in Rolling Fork
The major employment industries in Rolling Fork include Retail Trade (161 | 20.6%), Health Care & Social Assistance (129 | 16.5%), Construction (113 | 14.4%), Agriculture, Fishing & Hunting (78 | 10.0%), and Manufacturing (72 | 9.2%).
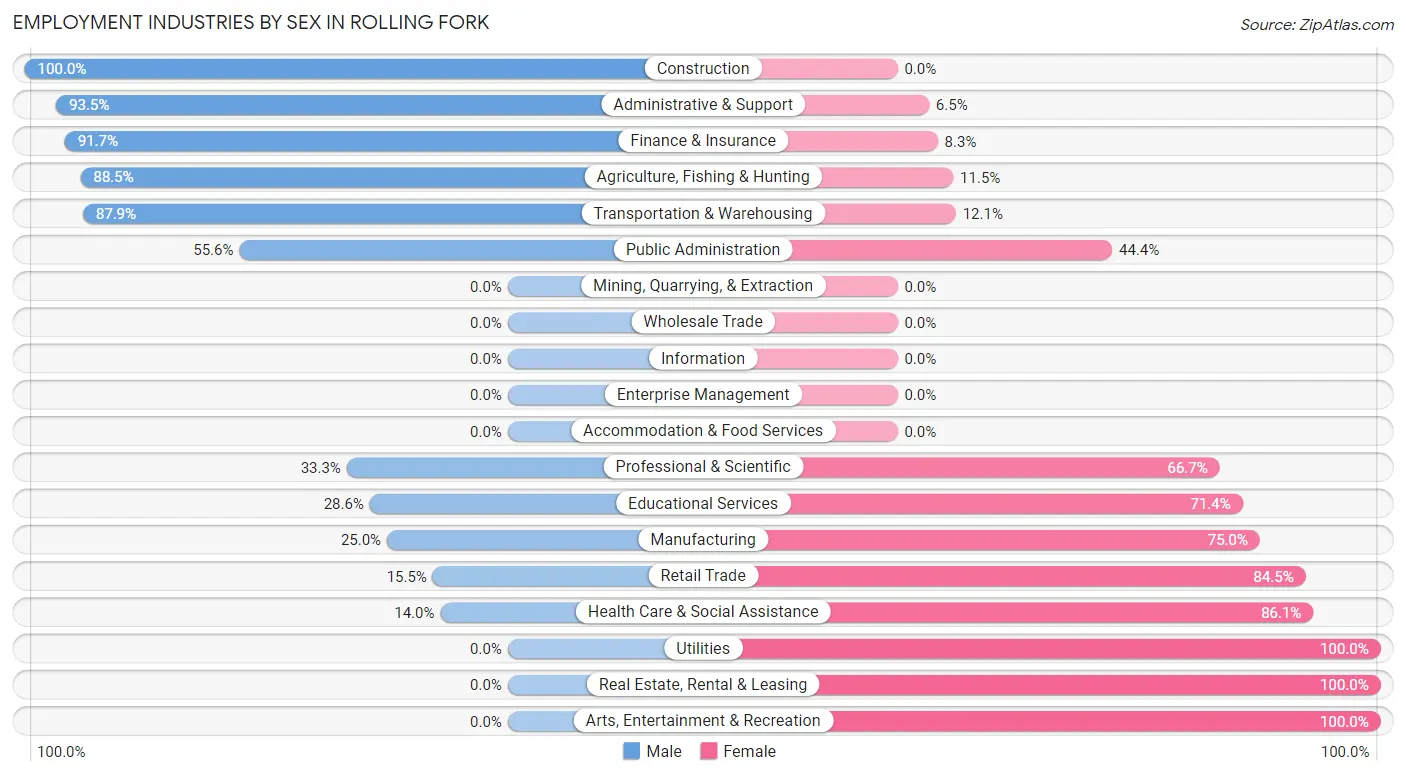
Employment Industries by Sex in Rolling Fork
The Rolling Fork industries that see more men than women are Construction (100.0%), Administrative & Support (93.5%), and Finance & Insurance (91.7%), whereas the industries that tend to have a higher number of women are Utilities (100.0%), Real Estate, Rental & Leasing (100.0%), and Arts, Entertainment & Recreation (100.0%).
| Industry | Male | Female |
| Agriculture, Fishing & Hunting | 69 (88.5%) | 9 (11.5%) |
| Mining, Quarrying, & Extraction | 0 (0.0%) | 0 (0.0%) |
| Construction | 113 (100.0%) | 0 (0.0%) |
| Manufacturing | 18 (25.0%) | 54 (75.0%) |
| Wholesale Trade | 0 (0.0%) | 0 (0.0%) |
| Retail Trade | 25 (15.5%) | 136 (84.5%) |
| Transportation & Warehousing | 51 (87.9%) | 7 (12.1%) |
| Utilities | 0 (0.0%) | 22 (100.0%) |
| Information | 0 (0.0%) | 0 (0.0%) |
| Finance & Insurance | 11 (91.7%) | 1 (8.3%) |
| Real Estate, Rental & Leasing | 0 (0.0%) | 5 (100.0%) |
| Professional & Scientific | 1 (33.3%) | 2 (66.7%) |
| Enterprise Management | 0 (0.0%) | 0 (0.0%) |
| Administrative & Support | 43 (93.5%) | 3 (6.5%) |
| Educational Services | 6 (28.6%) | 15 (71.4%) |
| Health Care & Social Assistance | 18 (14.0%) | 111 (86.1%) |
| Arts, Entertainment & Recreation | 0 (0.0%) | 10 (100.0%) |
| Accommodation & Food Services | 0 (0.0%) | 0 (0.0%) |
| Public Administration | 20 (55.6%) | 16 (44.4%) |
| Total | 392 (50.1%) | 391 (49.9%) |
Education in Rolling Fork
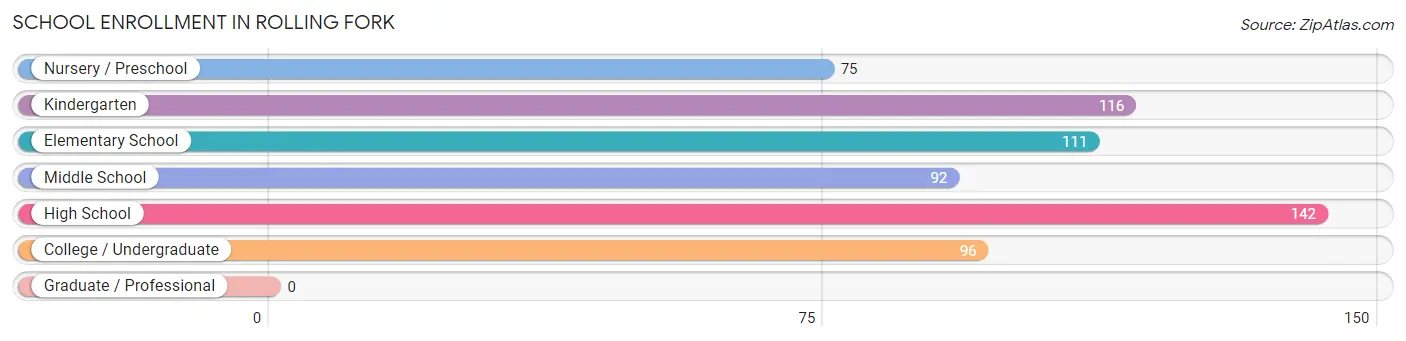
School Enrollment in Rolling Fork
The most common levels of schooling among the 632 students in Rolling Fork are high school (142 | 22.5%), kindergarten (116 | 18.3%), and elementary school (111 | 17.6%).
| School Level | # Students | % Students |
| Nursery / Preschool | 75 | 11.9% |
| Kindergarten | 116 | 18.3% |
| Elementary School | 111 | 17.6% |
| Middle School | 92 | 14.6% |
| High School | 142 | 22.5% |
| College / Undergraduate | 96 | 15.2% |
| Graduate / Professional | 0 | 0.0% |
| Total | 632 | 100.0% |
School Enrollment by Age by Funding Source in Rolling Fork
Out of a total of 632 students who are enrolled in schools in Rolling Fork, 61 (9.7%) attend a private institution, while the remaining 571 (90.3%) are enrolled in public schools. The age group of 20 to 24 year olds has the highest likelihood of being enrolled in private schools, with 38 (62.3% in the age bracket) enrolled. Conversely, the age group of 10 to 14 year olds has the lowest likelihood of being enrolled in a private school, with 88 (100.0% in the age bracket) attending a public institution.
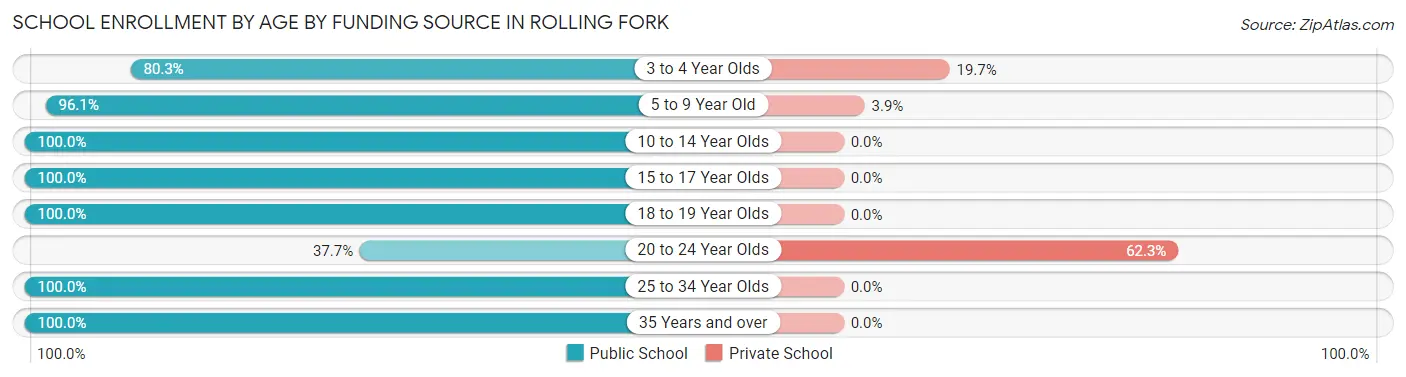
| Age Bracket | Public School | Private School |
| 3 to 4 Year Olds | 57 (80.3%) | 14 (19.7%) |
| 5 to 9 Year Old | 222 (96.1%) | 9 (3.9%) |
| 10 to 14 Year Olds | 88 (100.0%) | 0 (0.0%) |
| 15 to 17 Year Olds | 69 (100.0%) | 0 (0.0%) |
| 18 to 19 Year Olds | 94 (100.0%) | 0 (0.0%) |
| 20 to 24 Year Olds | 23 (37.7%) | 38 (62.3%) |
| 25 to 34 Year Olds | 15 (100.0%) | 0 (0.0%) |
| 35 Years and over | 3 (100.0%) | 0 (0.0%) |
| Total | 571 (90.3%) | 61 (9.7%) |
Educational Attainment by Field of Study in Rolling Fork
Bio, nature & agricultural (32 | 20.0%), science & technology (32 | 20.0%), education (30 | 18.8%), arts & humanities (26 | 16.3%), and literature & languages (20 | 12.5%) are the most common fields of study among 160 individuals in Rolling Fork who have obtained a bachelor's degree or higher.
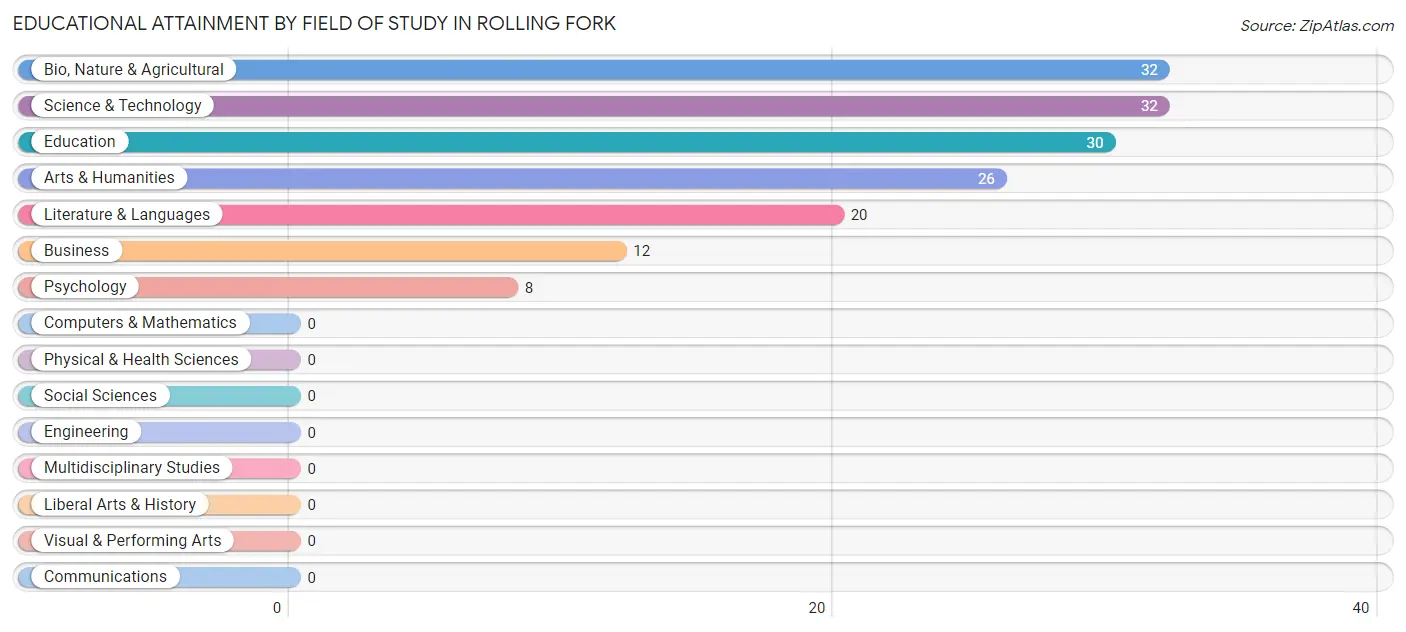
| Field of Study | # Graduates | % Graduates |
| Computers & Mathematics | 0 | 0.0% |
| Bio, Nature & Agricultural | 32 | 20.0% |
| Physical & Health Sciences | 0 | 0.0% |
| Psychology | 8 | 5.0% |
| Social Sciences | 0 | 0.0% |
| Engineering | 0 | 0.0% |
| Multidisciplinary Studies | 0 | 0.0% |
| Science & Technology | 32 | 20.0% |
| Business | 12 | 7.5% |
| Education | 30 | 18.8% |
| Literature & Languages | 20 | 12.5% |
| Liberal Arts & History | 0 | 0.0% |
| Visual & Performing Arts | 0 | 0.0% |
| Communications | 0 | 0.0% |
| Arts & Humanities | 26 | 16.3% |
| Total | 160 | 100.0% |
Transportation & Commute in Rolling Fork
Vehicle Availability by Sex in Rolling Fork
The most prevalent vehicle ownership categories in Rolling Fork are males with 2 vehicles (164, accounting for 46.3%) and females with 2 vehicles (131, making up 42.2%).
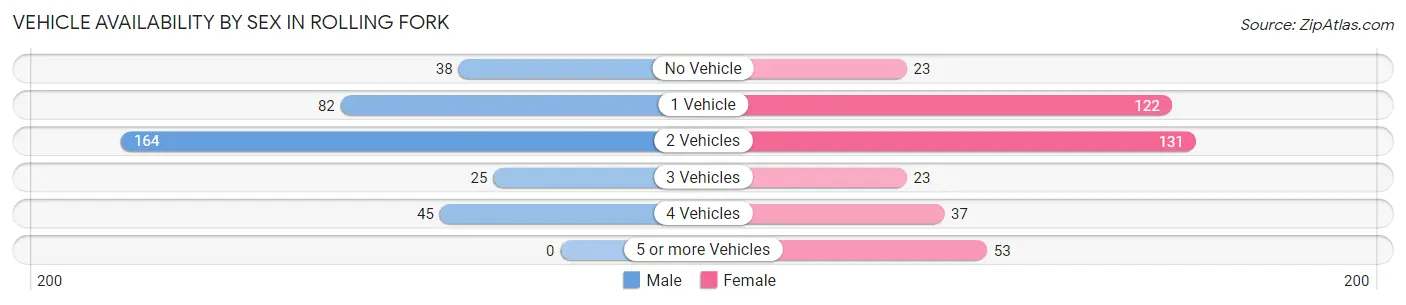
| Vehicles Available | Male | Female |
| No Vehicle | 38 (10.7%) | 23 (5.9%) |
| 1 Vehicle | 82 (23.2%) | 122 (31.4%) |
| 2 Vehicles | 164 (46.3%) | 131 (33.7%) |
| 3 Vehicles | 25 (7.1%) | 23 (5.9%) |
| 4 Vehicles | 45 (12.7%) | 37 (9.5%) |
| 5 or more Vehicles | 0 (0.0%) | 53 (13.6%) |
| Total | 354 (100.0%) | 389 (100.0%) |
Commute Time in Rolling Fork
The most frequently occuring commute durations in Rolling Fork are 45 to 59 minutes (175 commuters, 23.6%), 10 to 14 minutes (165 commuters, 22.3%), and 5 to 9 minutes (162 commuters, 21.9%).
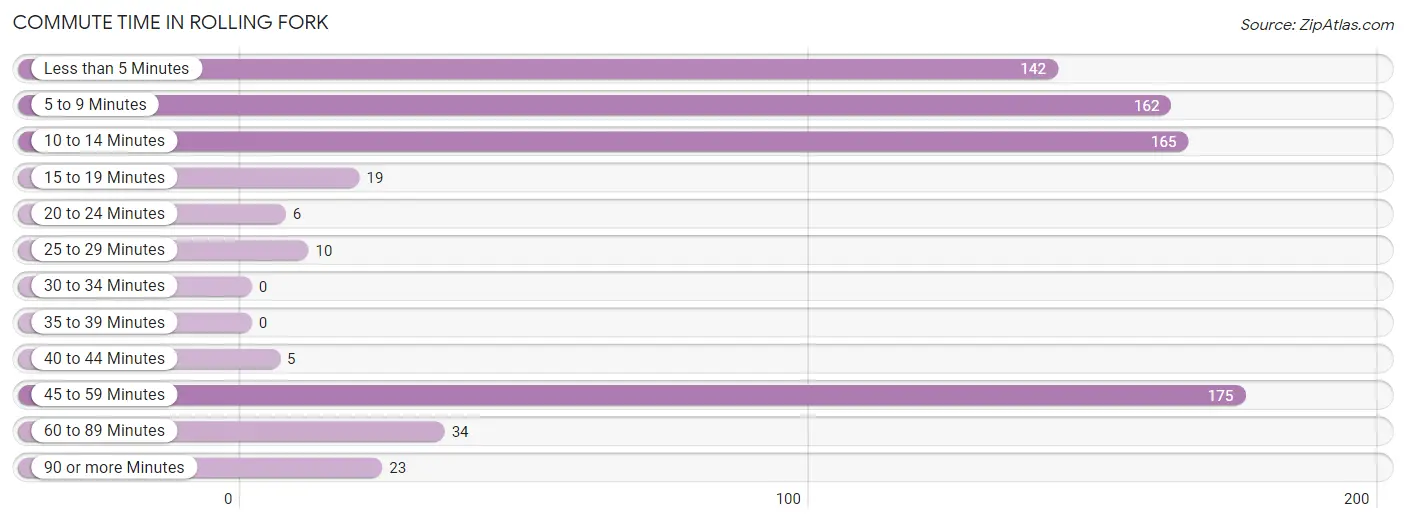
| Commute Time | # Commuters | % Commuters |
| Less than 5 Minutes | 142 | 19.2% |
| 5 to 9 Minutes | 162 | 21.9% |
| 10 to 14 Minutes | 165 | 22.3% |
| 15 to 19 Minutes | 19 | 2.6% |
| 20 to 24 Minutes | 6 | 0.8% |
| 25 to 29 Minutes | 10 | 1.3% |
| 30 to 34 Minutes | 0 | 0.0% |
| 35 to 39 Minutes | 0 | 0.0% |
| 40 to 44 Minutes | 5 | 0.7% |
| 45 to 59 Minutes | 175 | 23.6% |
| 60 to 89 Minutes | 34 | 4.6% |
| 90 or more Minutes | 23 | 3.1% |
Commute Time by Sex in Rolling Fork
The most common commute times in Rolling Fork are 45 to 59 minutes (121 commuters, 34.2%) for males and 5 to 9 minutes (140 commuters, 36.2%) for females.
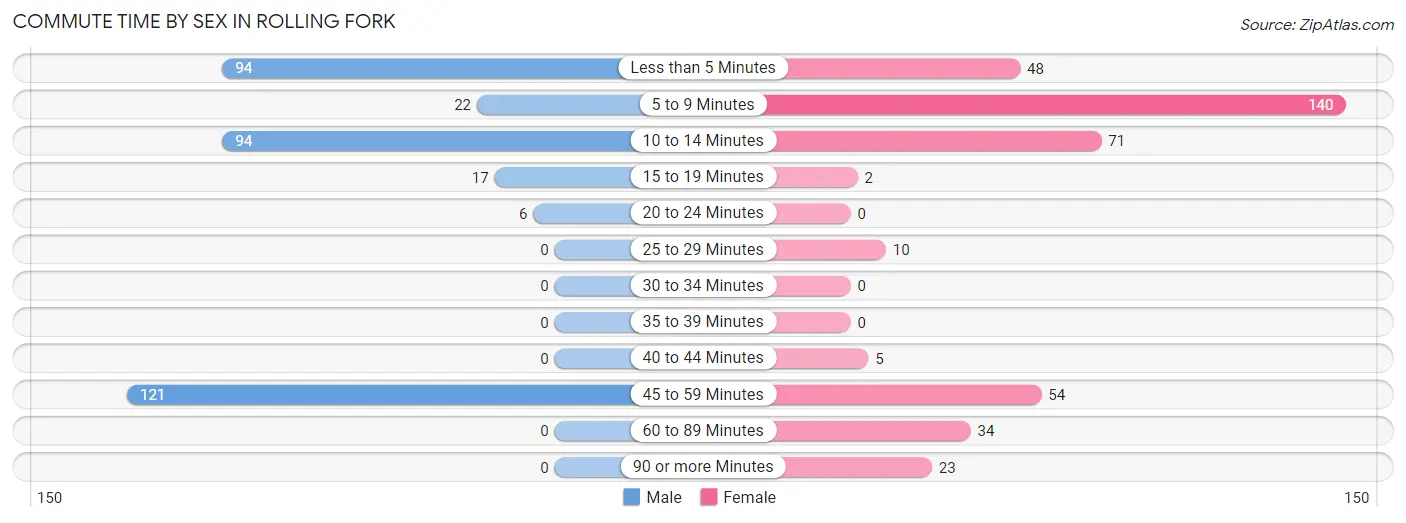
| Commute Time | Male | Female |
| Less than 5 Minutes | 94 (26.6%) | 48 (12.4%) |
| 5 to 9 Minutes | 22 (6.2%) | 140 (36.2%) |
| 10 to 14 Minutes | 94 (26.6%) | 71 (18.3%) |
| 15 to 19 Minutes | 17 (4.8%) | 2 (0.5%) |
| 20 to 24 Minutes | 6 (1.7%) | 0 (0.0%) |
| 25 to 29 Minutes | 0 (0.0%) | 10 (2.6%) |
| 30 to 34 Minutes | 0 (0.0%) | 0 (0.0%) |
| 35 to 39 Minutes | 0 (0.0%) | 0 (0.0%) |
| 40 to 44 Minutes | 0 (0.0%) | 5 (1.3%) |
| 45 to 59 Minutes | 121 (34.2%) | 54 (14.0%) |
| 60 to 89 Minutes | 0 (0.0%) | 34 (8.8%) |
| 90 or more Minutes | 0 (0.0%) | 23 (5.9%) |
Time of Departure to Work by Sex in Rolling Fork
The most frequent times of departure to work in Rolling Fork are 8:00 AM to 8:29 AM (93, 26.3%) for males and 7:00 AM to 7:29 AM (144, 37.2%) for females.
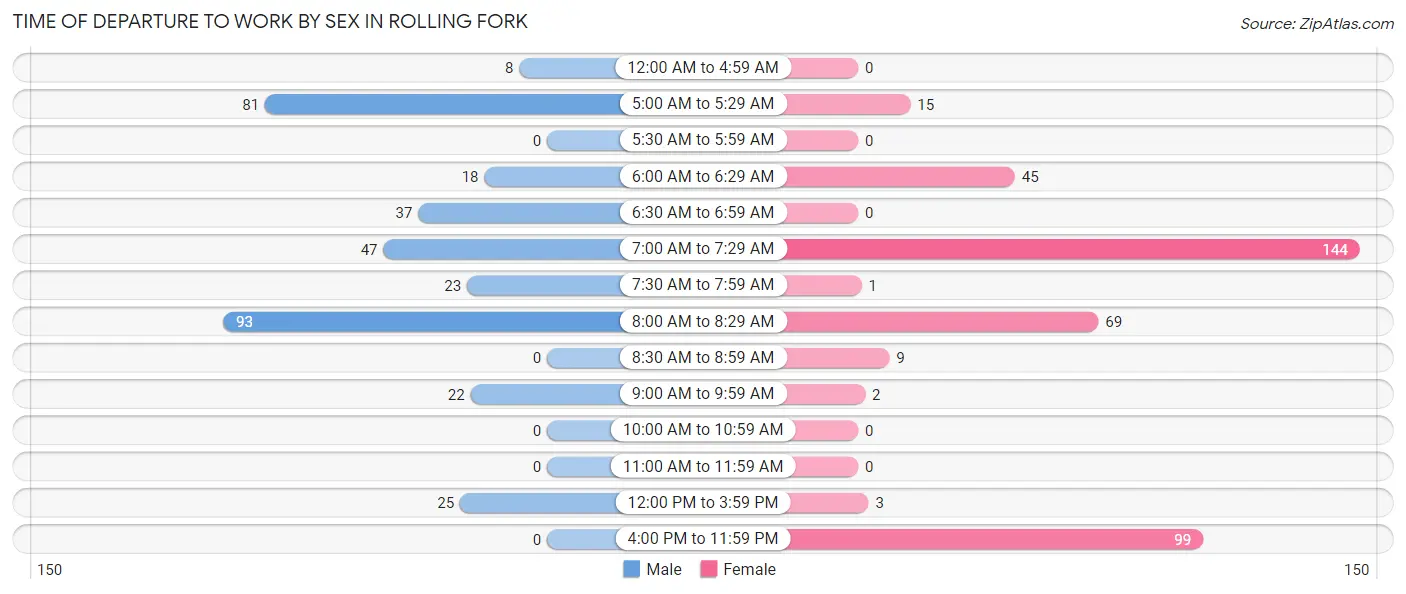
| Time of Departure | Male | Female |
| 12:00 AM to 4:59 AM | 8 (2.3%) | 0 (0.0%) |
| 5:00 AM to 5:29 AM | 81 (22.9%) | 15 (3.9%) |
| 5:30 AM to 5:59 AM | 0 (0.0%) | 0 (0.0%) |
| 6:00 AM to 6:29 AM | 18 (5.1%) | 45 (11.6%) |
| 6:30 AM to 6:59 AM | 37 (10.4%) | 0 (0.0%) |
| 7:00 AM to 7:29 AM | 47 (13.3%) | 144 (37.2%) |
| 7:30 AM to 7:59 AM | 23 (6.5%) | 1 (0.3%) |
| 8:00 AM to 8:29 AM | 93 (26.3%) | 69 (17.8%) |
| 8:30 AM to 8:59 AM | 0 (0.0%) | 9 (2.3%) |
| 9:00 AM to 9:59 AM | 22 (6.2%) | 2 (0.5%) |
| 10:00 AM to 10:59 AM | 0 (0.0%) | 0 (0.0%) |
| 11:00 AM to 11:59 AM | 0 (0.0%) | 0 (0.0%) |
| 12:00 PM to 3:59 PM | 25 (7.1%) | 3 (0.8%) |
| 4:00 PM to 11:59 PM | 0 (0.0%) | 99 (25.6%) |
| Total | 354 (100.0%) | 387 (100.0%) |
Housing Occupancy in Rolling Fork
Occupancy by Ownership in Rolling Fork
Of the total 671 dwellings in Rolling Fork, owner-occupied units account for 334 (49.8%), while renter-occupied units make up 337 (50.2%).
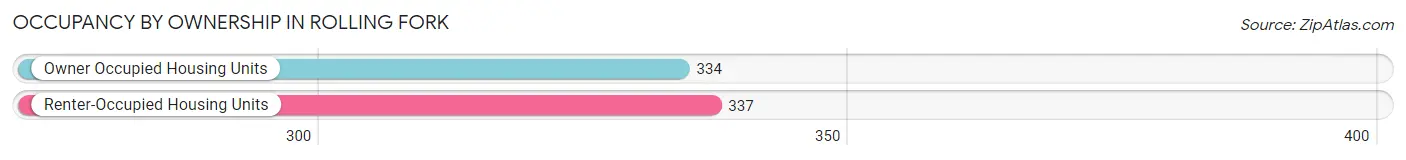
| Occupancy | # Housing Units | % Housing Units |
| Owner Occupied Housing Units | 334 | 49.8% |
| Renter-Occupied Housing Units | 337 | 50.2% |
| Total Occupied Housing Units | 671 | 100.0% |
Occupancy by Household Size in Rolling Fork
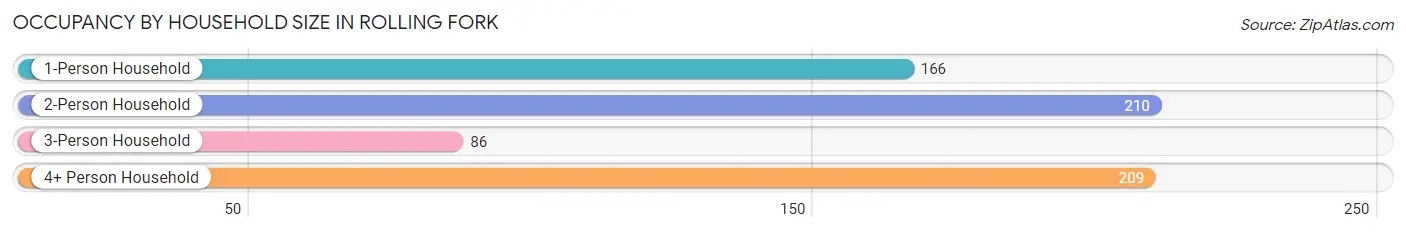
| Household Size | # Housing Units | % Housing Units |
| 1-Person Household | 166 | 24.7% |
| 2-Person Household | 210 | 31.3% |
| 3-Person Household | 86 | 12.8% |
| 4+ Person Household | 209 | 31.1% |
| Total Housing Units | 671 | 100.0% |
Occupancy by Ownership by Household Size in Rolling Fork
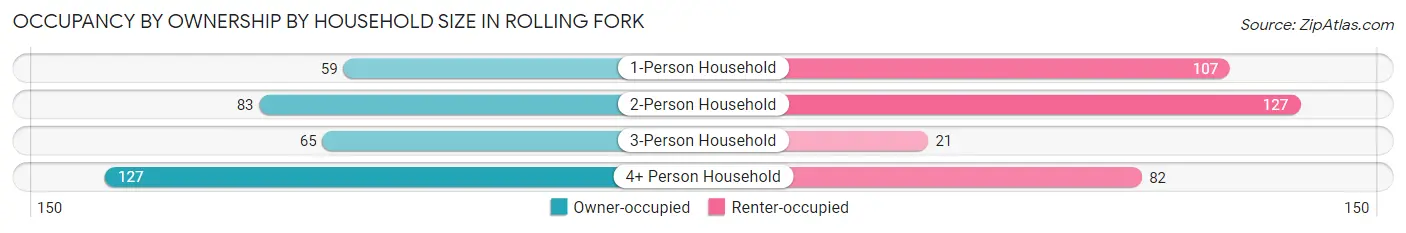
| Household Size | Owner-occupied | Renter-occupied |
| 1-Person Household | 59 (35.5%) | 107 (64.5%) |
| 2-Person Household | 83 (39.5%) | 127 (60.5%) |
| 3-Person Household | 65 (75.6%) | 21 (24.4%) |
| 4+ Person Household | 127 (60.8%) | 82 (39.2%) |
| Total Housing Units | 334 (49.8%) | 337 (50.2%) |
Occupancy by Educational Attainment in Rolling Fork
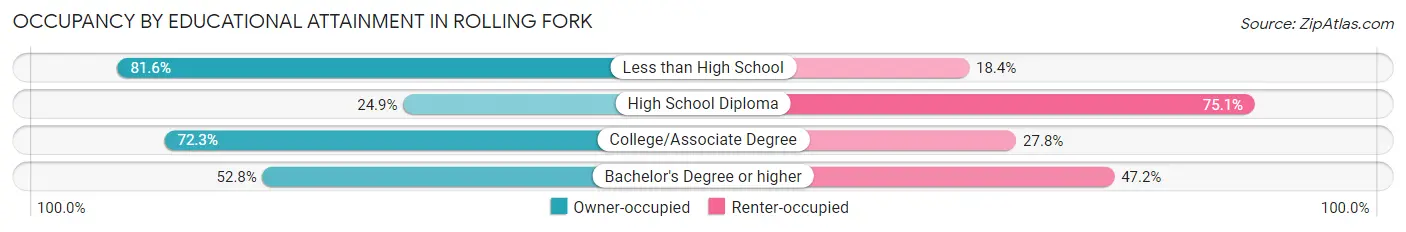
| Household Size | Owner-occupied | Renter-occupied |
| Less than High School | 62 (81.6%) | 14 (18.4%) |
| High School Diploma | 74 (24.9%) | 223 (75.1%) |
| College/Associate Degree | 151 (72.3%) | 58 (27.8%) |
| Bachelor's Degree or higher | 47 (52.8%) | 42 (47.2%) |
Occupancy by Age of Householder in Rolling Fork
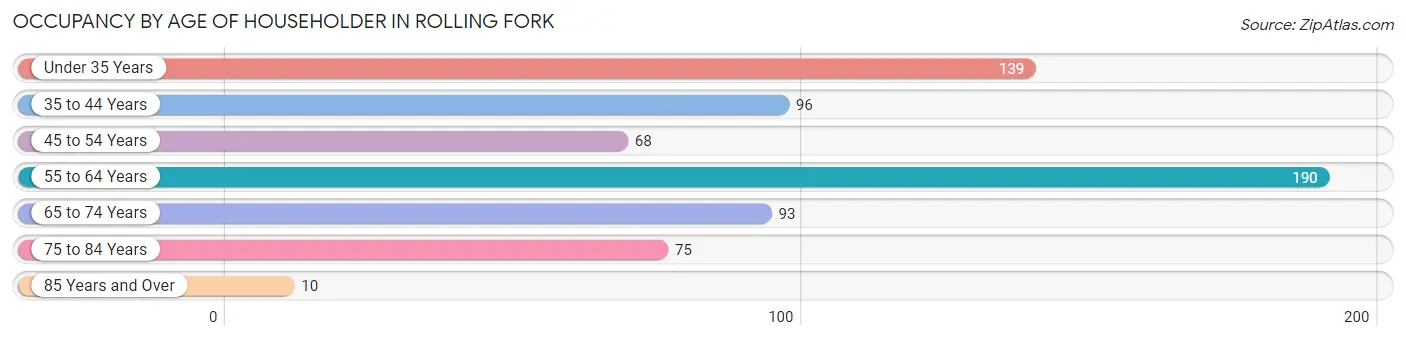
| Age Bracket | # Households | % Households |
| Under 35 Years | 139 | 20.7% |
| 35 to 44 Years | 96 | 14.3% |
| 45 to 54 Years | 68 | 10.1% |
| 55 to 64 Years | 190 | 28.3% |
| 65 to 74 Years | 93 | 13.9% |
| 75 to 84 Years | 75 | 11.2% |
| 85 Years and Over | 10 | 1.5% |
| Total | 671 | 100.0% |
Housing Finances in Rolling Fork
Median Income by Occupancy in Rolling Fork
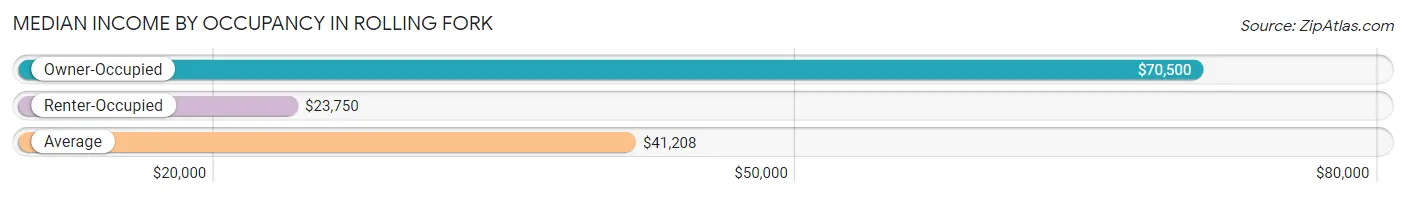
| Occupancy Type | # Households | Median Income |
| Owner-Occupied | 334 (49.8%) | $70,500 |
| Renter-Occupied | 337 (50.2%) | $23,750 |
| Average | 671 (100.0%) | $41,208 |
Occupancy by Householder Income Bracket in Rolling Fork
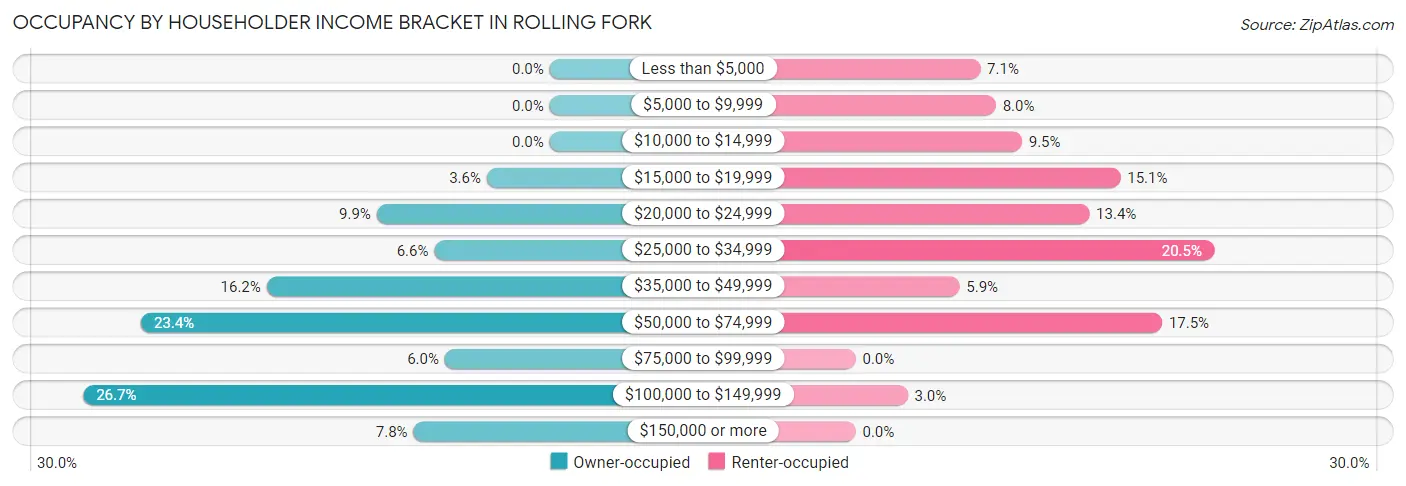
| Income Bracket | Owner-occupied | Renter-occupied |
| Less than $5,000 | 0 (0.0%) | 24 (7.1%) |
| $5,000 to $9,999 | 0 (0.0%) | 27 (8.0%) |
| $10,000 to $14,999 | 0 (0.0%) | 32 (9.5%) |
| $15,000 to $19,999 | 12 (3.6%) | 51 (15.1%) |
| $20,000 to $24,999 | 33 (9.9%) | 45 (13.4%) |
| $25,000 to $34,999 | 22 (6.6%) | 69 (20.5%) |
| $35,000 to $49,999 | 54 (16.2%) | 20 (5.9%) |
| $50,000 to $74,999 | 78 (23.4%) | 59 (17.5%) |
| $75,000 to $99,999 | 20 (6.0%) | 0 (0.0%) |
| $100,000 to $149,999 | 89 (26.7%) | 10 (3.0%) |
| $150,000 or more | 26 (7.8%) | 0 (0.0%) |
| Total | 334 (100.0%) | 337 (100.0%) |
Monthly Housing Cost Tiers in Rolling Fork
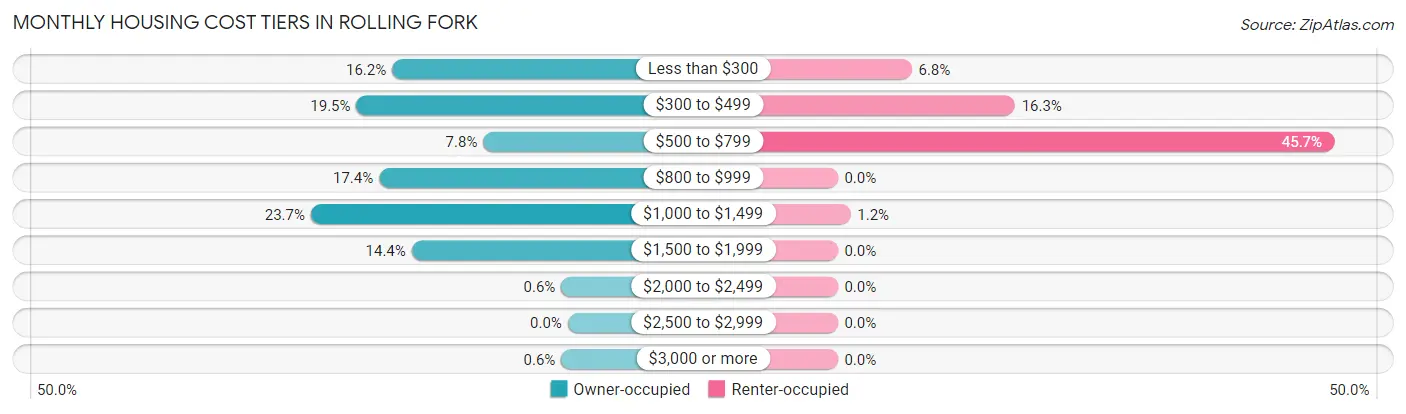
| Monthly Cost | Owner-occupied | Renter-occupied |
| Less than $300 | 54 (16.2%) | 23 (6.8%) |
| $300 to $499 | 65 (19.5%) | 55 (16.3%) |
| $500 to $799 | 26 (7.8%) | 154 (45.7%) |
| $800 to $999 | 58 (17.4%) | 0 (0.0%) |
| $1,000 to $1,499 | 79 (23.6%) | 4 (1.2%) |
| $1,500 to $1,999 | 48 (14.4%) | 0 (0.0%) |
| $2,000 to $2,499 | 2 (0.6%) | 0 (0.0%) |
| $2,500 to $2,999 | 0 (0.0%) | 0 (0.0%) |
| $3,000 or more | 2 (0.6%) | 0 (0.0%) |
| Total | 334 (100.0%) | 337 (100.0%) |
Physical Housing Characteristics in Rolling Fork
Housing Structures in Rolling Fork
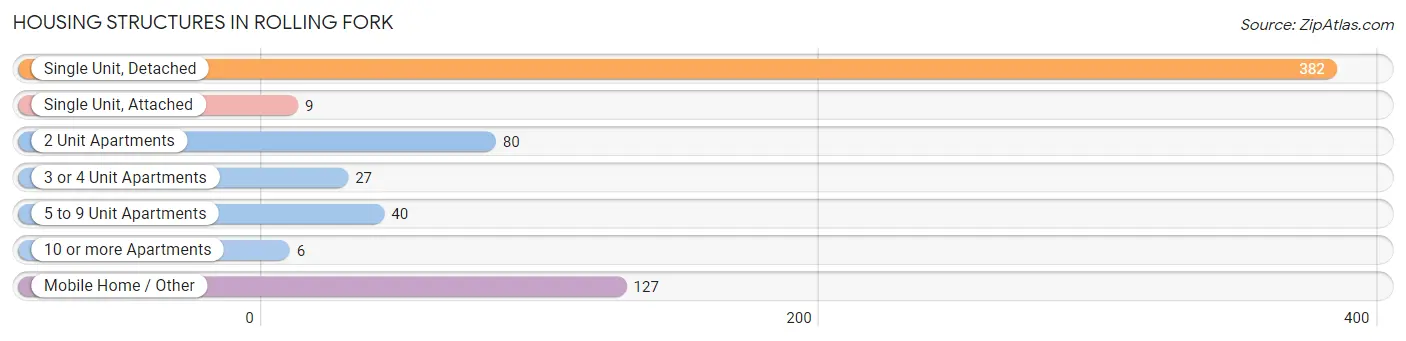
| Structure Type | # Housing Units | % Housing Units |
| Single Unit, Detached | 382 | 56.9% |
| Single Unit, Attached | 9 | 1.3% |
| 2 Unit Apartments | 80 | 11.9% |
| 3 or 4 Unit Apartments | 27 | 4.0% |
| 5 to 9 Unit Apartments | 40 | 6.0% |
| 10 or more Apartments | 6 | 0.9% |
| Mobile Home / Other | 127 | 18.9% |
| Total | 671 | 100.0% |
Housing Structures by Occupancy in Rolling Fork
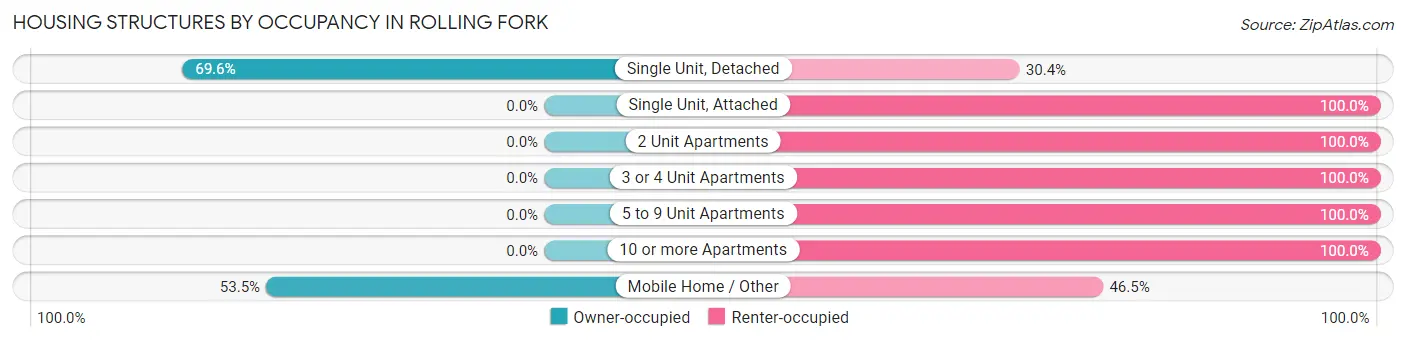
| Structure Type | Owner-occupied | Renter-occupied |
| Single Unit, Detached | 266 (69.6%) | 116 (30.4%) |
| Single Unit, Attached | 0 (0.0%) | 9 (100.0%) |
| 2 Unit Apartments | 0 (0.0%) | 80 (100.0%) |
| 3 or 4 Unit Apartments | 0 (0.0%) | 27 (100.0%) |
| 5 to 9 Unit Apartments | 0 (0.0%) | 40 (100.0%) |
| 10 or more Apartments | 0 (0.0%) | 6 (100.0%) |
| Mobile Home / Other | 68 (53.5%) | 59 (46.5%) |
| Total | 334 (49.8%) | 337 (50.2%) |
Housing Structures by Number of Rooms in Rolling Fork
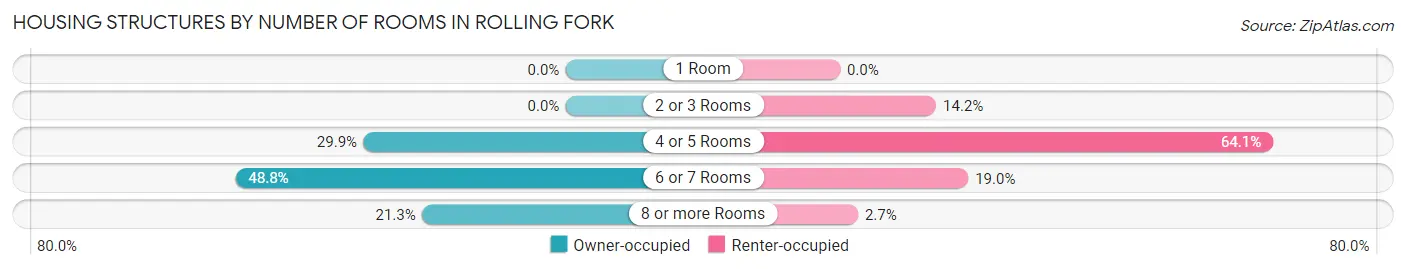
| Number of Rooms | Owner-occupied | Renter-occupied |
| 1 Room | 0 (0.0%) | 0 (0.0%) |
| 2 or 3 Rooms | 0 (0.0%) | 48 (14.2%) |
| 4 or 5 Rooms | 100 (29.9%) | 216 (64.1%) |
| 6 or 7 Rooms | 163 (48.8%) | 64 (19.0%) |
| 8 or more Rooms | 71 (21.3%) | 9 (2.7%) |
| Total | 334 (100.0%) | 337 (100.0%) |
Housing Structure by Heating Type in Rolling Fork
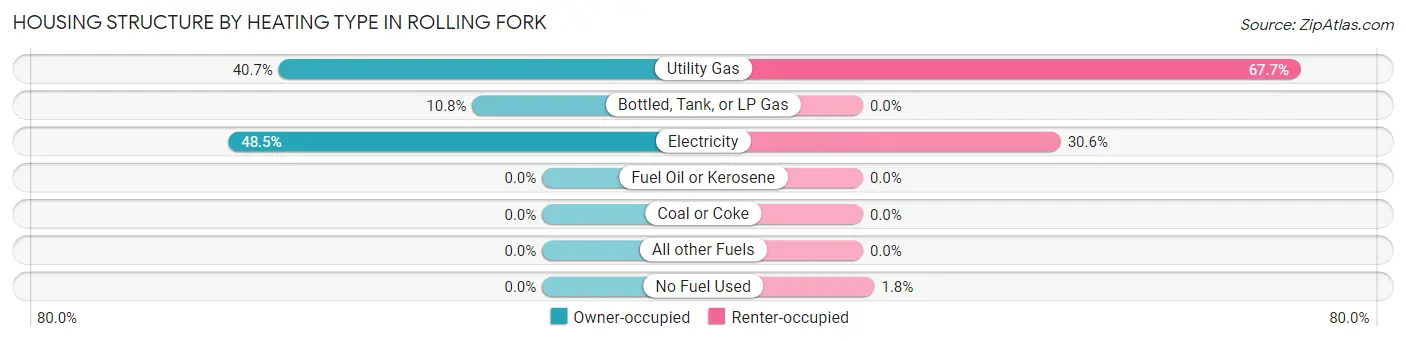
| Heating Type | Owner-occupied | Renter-occupied |
| Utility Gas | 136 (40.7%) | 228 (67.7%) |
| Bottled, Tank, or LP Gas | 36 (10.8%) | 0 (0.0%) |
| Electricity | 162 (48.5%) | 103 (30.6%) |
| Fuel Oil or Kerosene | 0 (0.0%) | 0 (0.0%) |
| Coal or Coke | 0 (0.0%) | 0 (0.0%) |
| All other Fuels | 0 (0.0%) | 0 (0.0%) |
| No Fuel Used | 0 (0.0%) | 6 (1.8%) |
| Total | 334 (100.0%) | 337 (100.0%) |
Household Vehicle Usage in Rolling Fork
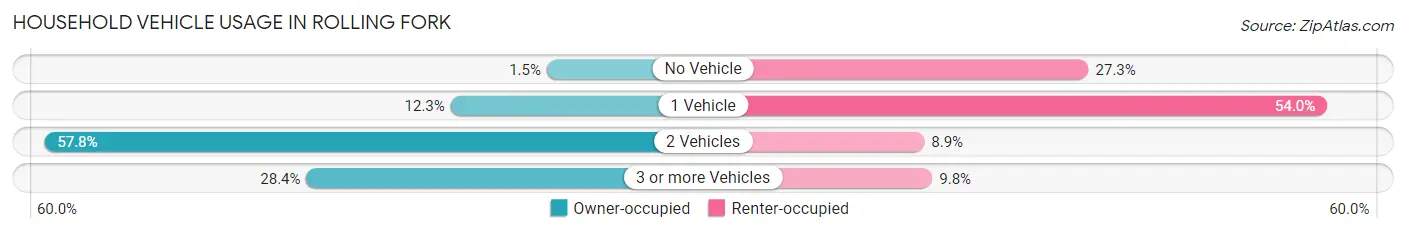
| Vehicles per Household | Owner-occupied | Renter-occupied |
| No Vehicle | 5 (1.5%) | 92 (27.3%) |
| 1 Vehicle | 41 (12.3%) | 182 (54.0%) |
| 2 Vehicles | 193 (57.8%) | 30 (8.9%) |
| 3 or more Vehicles | 95 (28.4%) | 33 (9.8%) |
| Total | 334 (100.0%) | 337 (100.0%) |
Real Estate & Mortgages in Rolling Fork
Real Estate and Mortgage Overview in Rolling Fork
| Characteristic | Without Mortgage | With Mortgage |
| Housing Units | 168 | 166 |
| Median Property Value | $79,700 | $113,400 |
| Median Household Income | $60,909 | $4 |
| Monthly Housing Costs | $361 | $2 |
| Real Estate Taxes | $932 | $46 |
Property Value by Mortgage Status in Rolling Fork
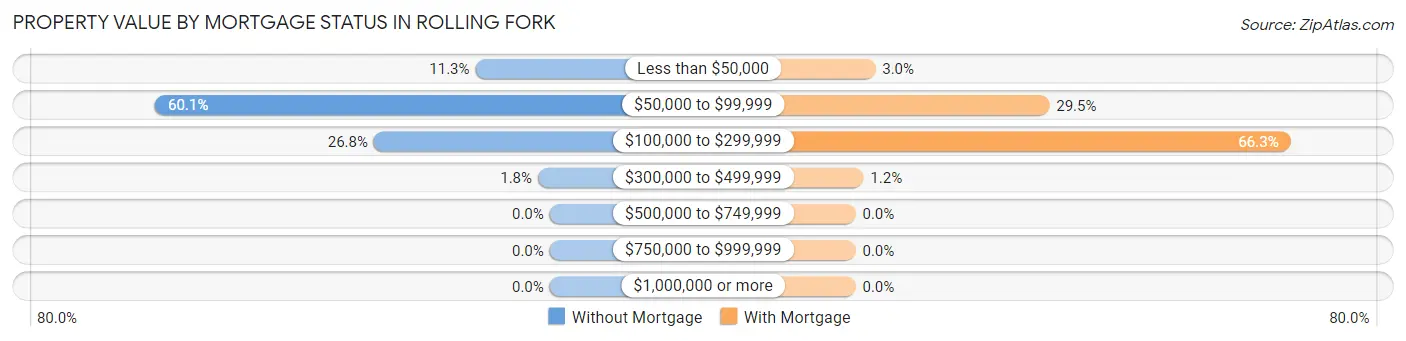
| Property Value | Without Mortgage | With Mortgage |
| Less than $50,000 | 19 (11.3%) | 5 (3.0%) |
| $50,000 to $99,999 | 101 (60.1%) | 49 (29.5%) |
| $100,000 to $299,999 | 45 (26.8%) | 110 (66.3%) |
| $300,000 to $499,999 | 3 (1.8%) | 2 (1.2%) |
| $500,000 to $749,999 | 0 (0.0%) | 0 (0.0%) |
| $750,000 to $999,999 | 0 (0.0%) | 0 (0.0%) |
| $1,000,000 or more | 0 (0.0%) | 0 (0.0%) |
| Total | 168 (100.0%) | 166 (100.0%) |
Household Income by Mortgage Status in Rolling Fork
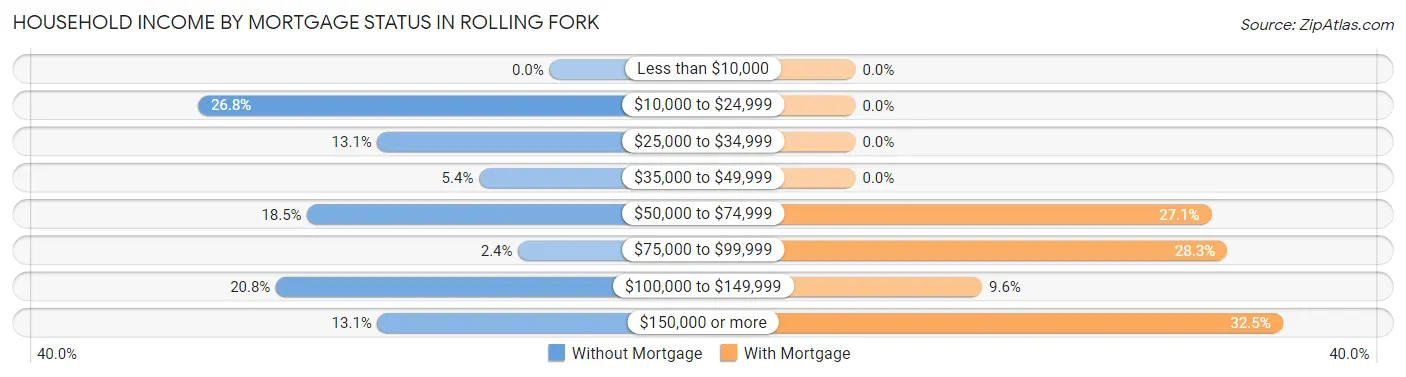
| Household Income | Without Mortgage | With Mortgage |
| Less than $10,000 | 0 (0.0%) | 0 (0.0%) |
| $10,000 to $24,999 | 45 (26.8%) | 0 (0.0%) |
| $25,000 to $34,999 | 22 (13.1%) | 0 (0.0%) |
| $35,000 to $49,999 | 9 (5.4%) | 0 (0.0%) |
| $50,000 to $74,999 | 31 (18.4%) | 45 (27.1%) |
| $75,000 to $99,999 | 4 (2.4%) | 47 (28.3%) |
| $100,000 to $149,999 | 35 (20.8%) | 16 (9.6%) |
| $150,000 or more | 22 (13.1%) | 54 (32.5%) |
| Total | 168 (100.0%) | 166 (100.0%) |
Property Value to Household Income Ratio in Rolling Fork
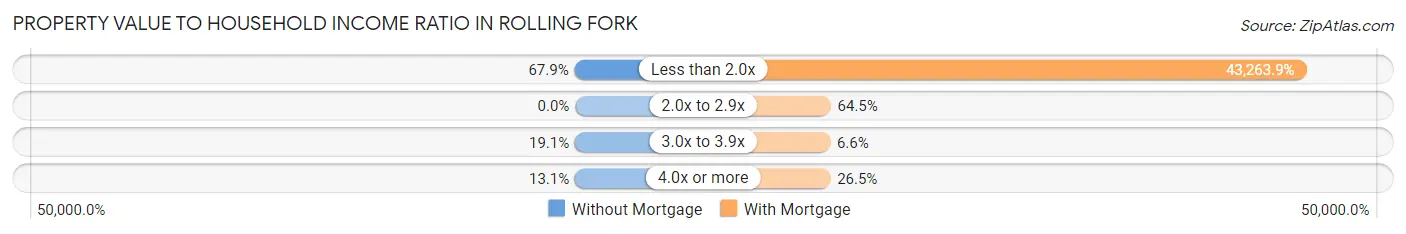
| Value-to-Income Ratio | Without Mortgage | With Mortgage |
| Less than 2.0x | 114 (67.9%) | 71,818 (43,263.9%) |
| 2.0x to 2.9x | 0 (0.0%) | 107 (64.5%) |
| 3.0x to 3.9x | 32 (19.1%) | 11 (6.6%) |
| 4.0x or more | 22 (13.1%) | 44 (26.5%) |
| Total | 168 (100.0%) | 166 (100.0%) |
Real Estate Taxes by Mortgage Status in Rolling Fork
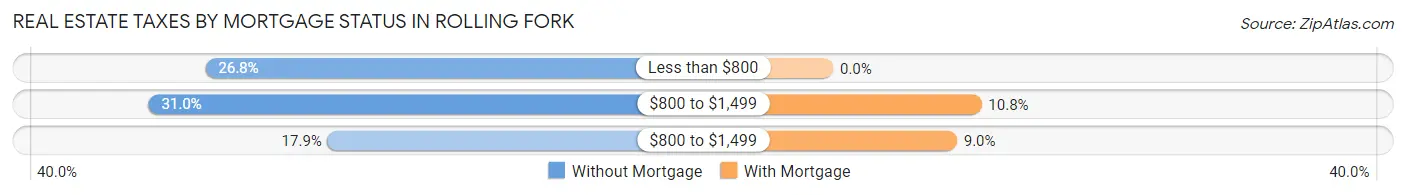
| Property Taxes | Without Mortgage | With Mortgage |
| Less than $800 | 45 (26.8%) | 0 (0.0%) |
| $800 to $1,499 | 52 (30.9%) | 18 (10.8%) |
| $800 to $1,499 | 30 (17.9%) | 15 (9.0%) |
| Total | 168 (100.0%) | 166 (100.0%) |
Health & Disability in Rolling Fork
Health Insurance Coverage by Age in Rolling Fork
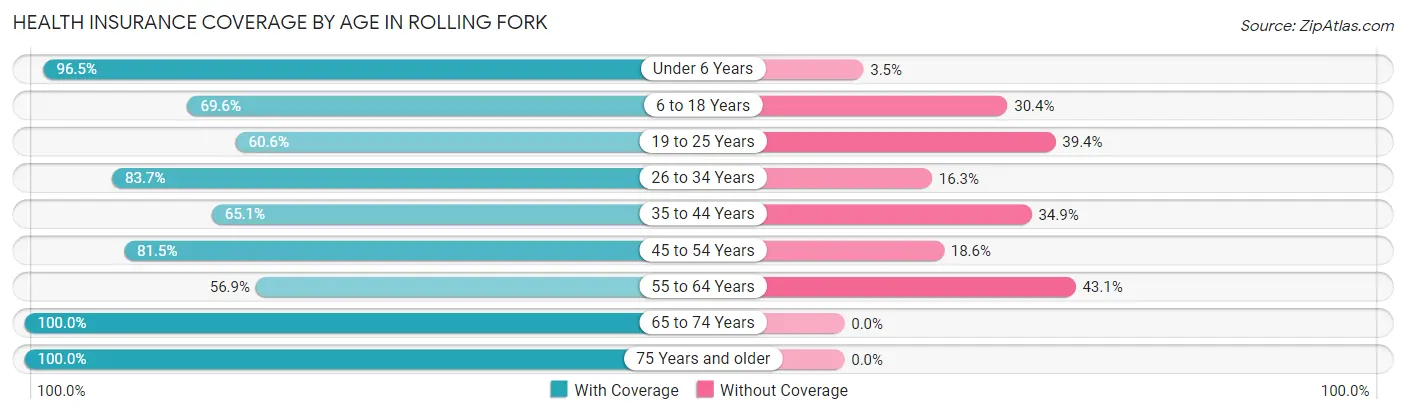
| Age Bracket | With Coverage | Without Coverage |
| Under 6 Years | 245 (96.5%) | 9 (3.5%) |
| 6 to 18 Years | 261 (69.6%) | 114 (30.4%) |
| 19 to 25 Years | 114 (60.6%) | 74 (39.4%) |
| 26 to 34 Years | 205 (83.7%) | 40 (16.3%) |
| 35 to 44 Years | 138 (65.1%) | 74 (34.9%) |
| 45 to 54 Years | 101 (81.5%) | 23 (18.5%) |
| 55 to 64 Years | 190 (56.9%) | 144 (43.1%) |
| 65 to 74 Years | 184 (100.0%) | 0 (0.0%) |
| 75 Years and older | 155 (100.0%) | 0 (0.0%) |
| Total | 1,593 (76.9%) | 478 (23.1%) |
Health Insurance Coverage by Citizenship Status in Rolling Fork
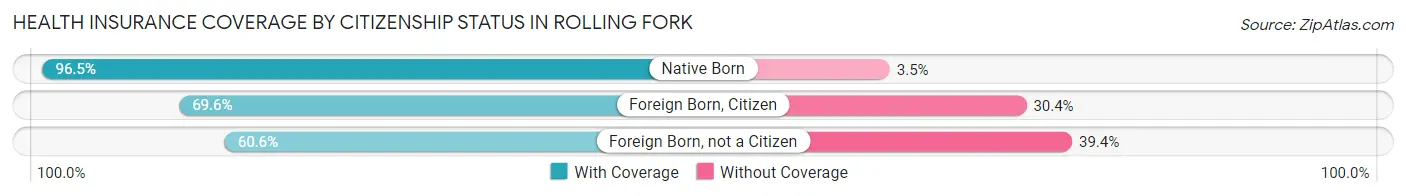
| Citizenship Status | With Coverage | Without Coverage |
| Native Born | 245 (96.5%) | 9 (3.5%) |
| Foreign Born, Citizen | 261 (69.6%) | 114 (30.4%) |
| Foreign Born, not a Citizen | 114 (60.6%) | 74 (39.4%) |
Health Insurance Coverage by Household Income in Rolling Fork
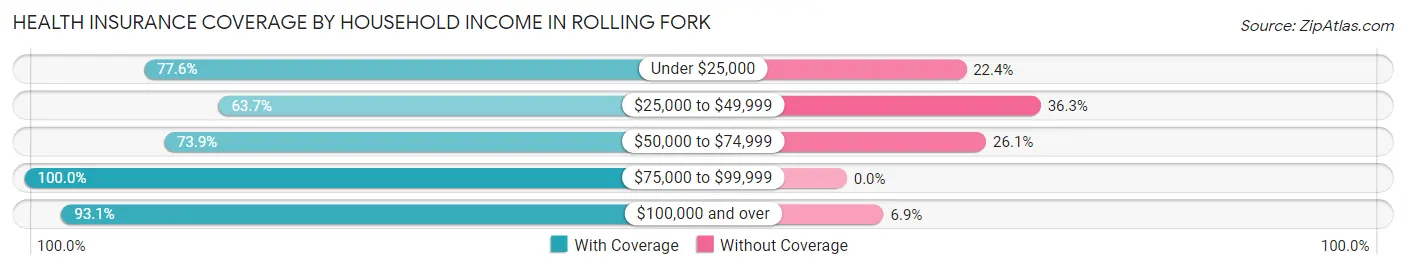
| Household Income | With Coverage | Without Coverage |
| Under $25,000 | 302 (77.6%) | 87 (22.4%) |
| $25,000 to $49,999 | 368 (63.7%) | 210 (36.3%) |
| $50,000 to $74,999 | 433 (73.9%) | 153 (26.1%) |
| $75,000 to $99,999 | 78 (100.0%) | 0 (0.0%) |
| $100,000 and over | 378 (93.1%) | 28 (6.9%) |
Public vs Private Health Insurance Coverage by Age in Rolling Fork
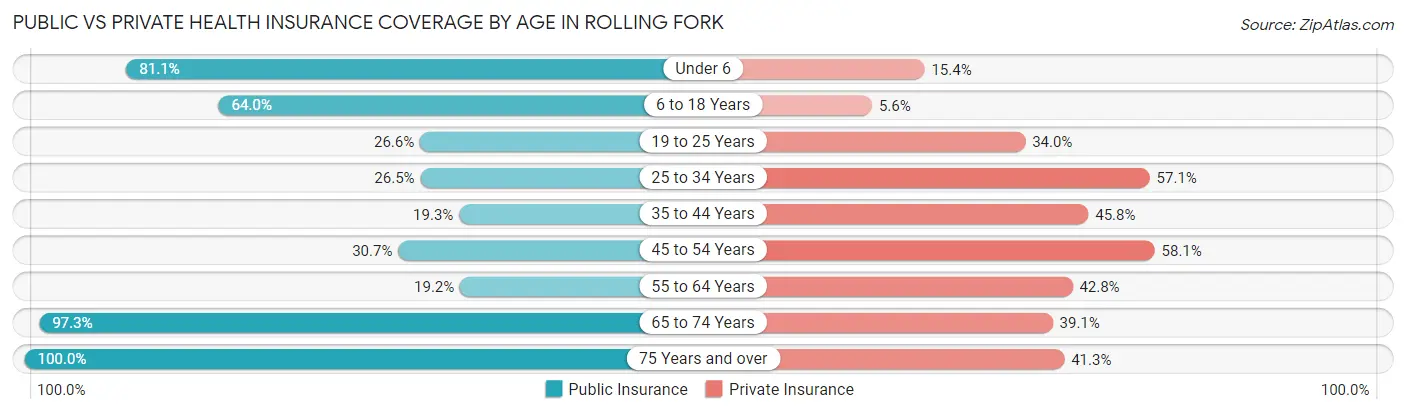
| Age Bracket | Public Insurance | Private Insurance |
| Under 6 | 206 (81.1%) | 39 (15.3%) |
| 6 to 18 Years | 240 (64.0%) | 21 (5.6%) |
| 19 to 25 Years | 50 (26.6%) | 64 (34.0%) |
| 25 to 34 Years | 65 (26.5%) | 140 (57.1%) |
| 35 to 44 Years | 41 (19.3%) | 97 (45.8%) |
| 45 to 54 Years | 38 (30.6%) | 72 (58.1%) |
| 55 to 64 Years | 64 (19.2%) | 143 (42.8%) |
| 65 to 74 Years | 179 (97.3%) | 72 (39.1%) |
| 75 Years and over | 155 (100.0%) | 64 (41.3%) |
| Total | 1,038 (50.1%) | 712 (34.4%) |
Disability Status by Sex by Age in Rolling Fork
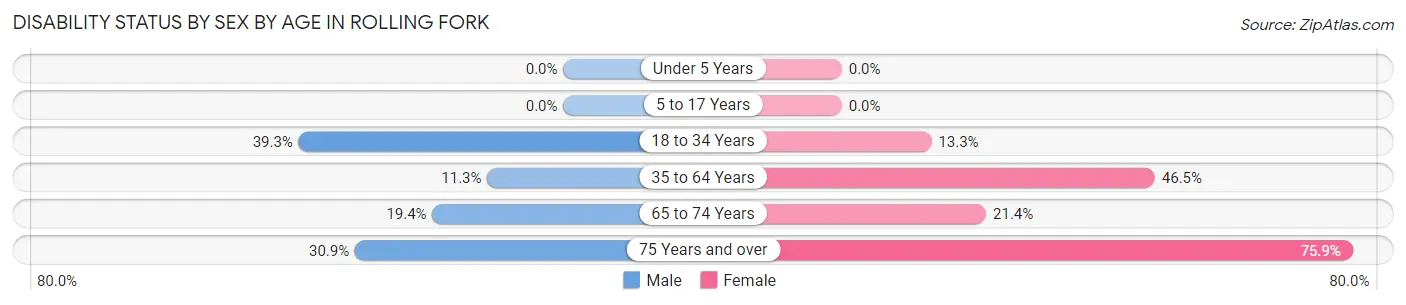
| Age Bracket | Male | Female |
| Under 5 Years | 0 (0.0%) | 0 (0.0%) |
| 5 to 17 Years | 0 (0.0%) | 0 (0.0%) |
| 18 to 34 Years | 101 (39.3%) | 33 (13.3%) |
| 35 to 64 Years | 29 (11.3%) | 192 (46.5%) |
| 65 to 74 Years | 14 (19.4%) | 24 (21.4%) |
| 75 Years and over | 30 (30.9%) | 44 (75.9%) |
Disability Class by Sex by Age in Rolling Fork
Disability Class: Hearing Difficulty
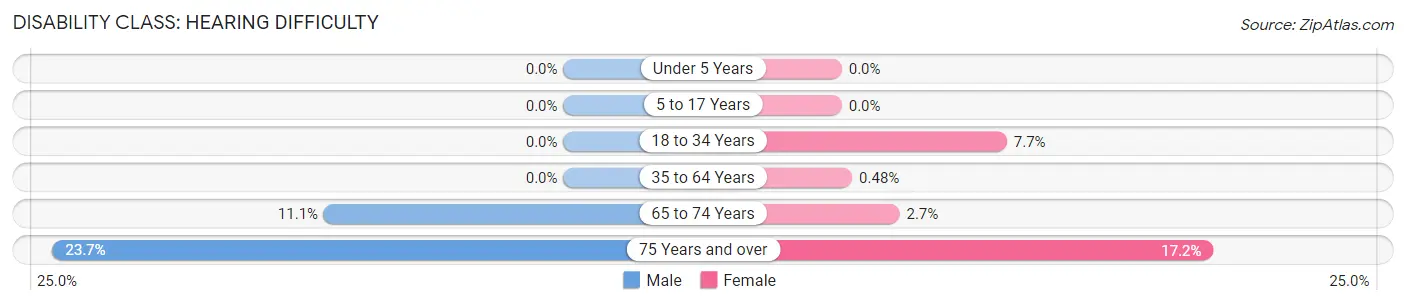
| Age Bracket | Male | Female |
| Under 5 Years | 0 (0.0%) | 0 (0.0%) |
| 5 to 17 Years | 0 (0.0%) | 0 (0.0%) |
| 18 to 34 Years | 0 (0.0%) | 19 (7.7%) |
| 35 to 64 Years | 0 (0.0%) | 2 (0.5%) |
| 65 to 74 Years | 8 (11.1%) | 3 (2.7%) |
| 75 Years and over | 23 (23.7%) | 10 (17.2%) |
Disability Class: Vision Difficulty
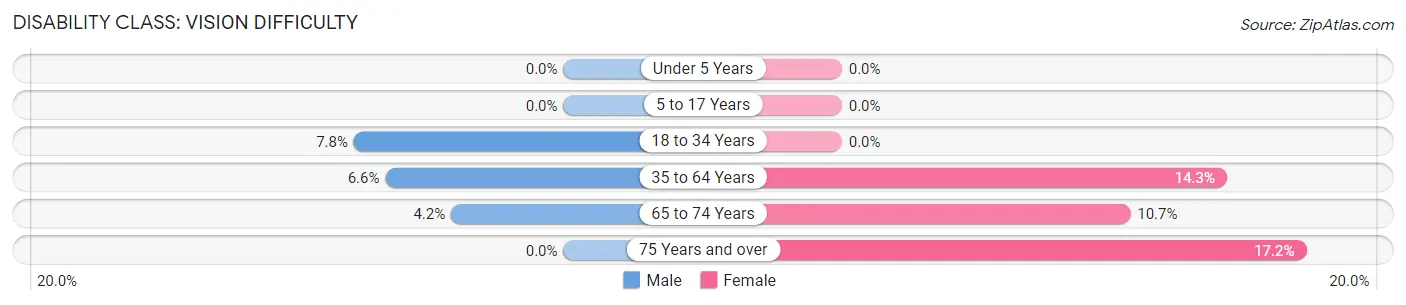
| Age Bracket | Male | Female |
| Under 5 Years | 0 (0.0%) | 0 (0.0%) |
| 5 to 17 Years | 0 (0.0%) | 0 (0.0%) |
| 18 to 34 Years | 20 (7.8%) | 0 (0.0%) |
| 35 to 64 Years | 17 (6.6%) | 59 (14.3%) |
| 65 to 74 Years | 3 (4.2%) | 12 (10.7%) |
| 75 Years and over | 0 (0.0%) | 10 (17.2%) |
Disability Class: Cognitive Difficulty
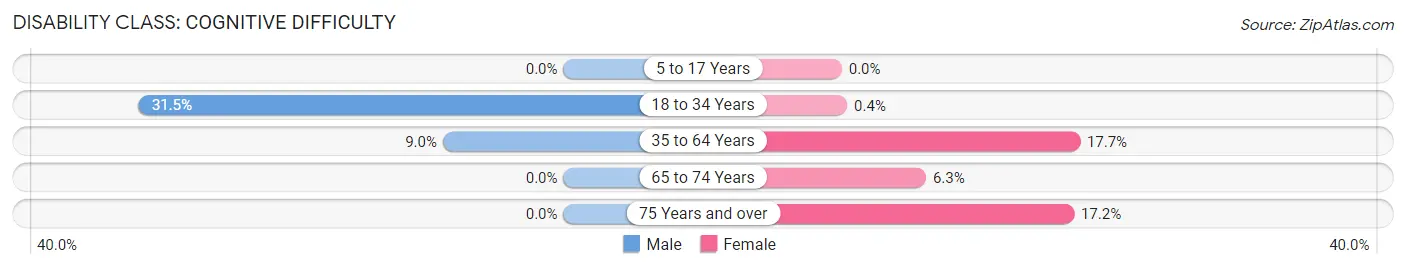
| Age Bracket | Male | Female |
| 5 to 17 Years | 0 (0.0%) | 0 (0.0%) |
| 18 to 34 Years | 81 (31.5%) | 1 (0.4%) |
| 35 to 64 Years | 23 (8.9%) | 73 (17.7%) |
| 65 to 74 Years | 0 (0.0%) | 7 (6.2%) |
| 75 Years and over | 0 (0.0%) | 10 (17.2%) |
Disability Class: Ambulatory Difficulty
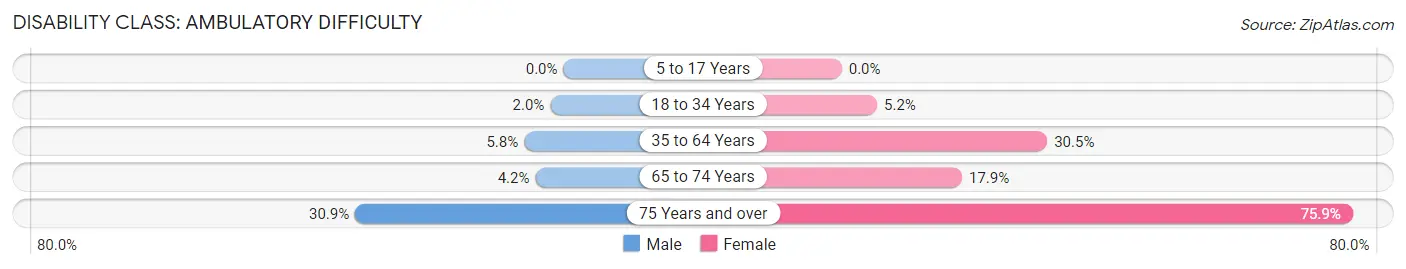
| Age Bracket | Male | Female |
| 5 to 17 Years | 0 (0.0%) | 0 (0.0%) |
| 18 to 34 Years | 5 (1.9%) | 13 (5.2%) |
| 35 to 64 Years | 15 (5.8%) | 126 (30.5%) |
| 65 to 74 Years | 3 (4.2%) | 20 (17.9%) |
| 75 Years and over | 30 (30.9%) | 44 (75.9%) |
Disability Class: Self-Care Difficulty
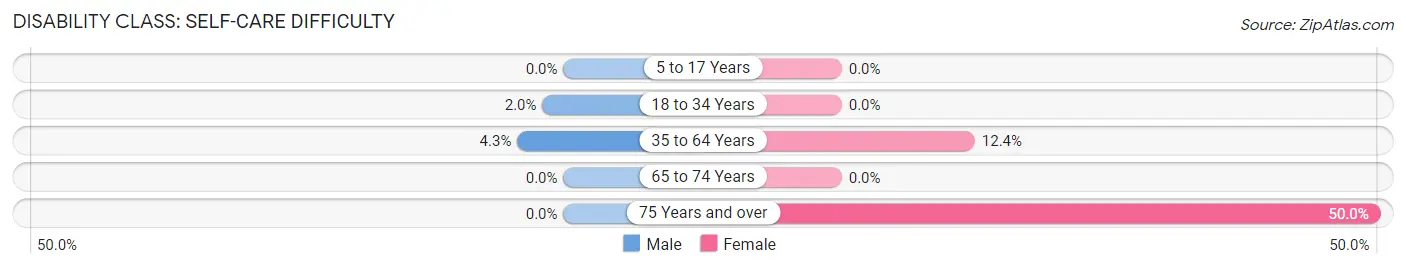
| Age Bracket | Male | Female |
| 5 to 17 Years | 0 (0.0%) | 0 (0.0%) |
| 18 to 34 Years | 5 (1.9%) | 0 (0.0%) |
| 35 to 64 Years | 11 (4.3%) | 51 (12.3%) |
| 65 to 74 Years | 0 (0.0%) | 0 (0.0%) |
| 75 Years and over | 0 (0.0%) | 29 (50.0%) |
Technology Access in Rolling Fork
Computing Device Access in Rolling Fork
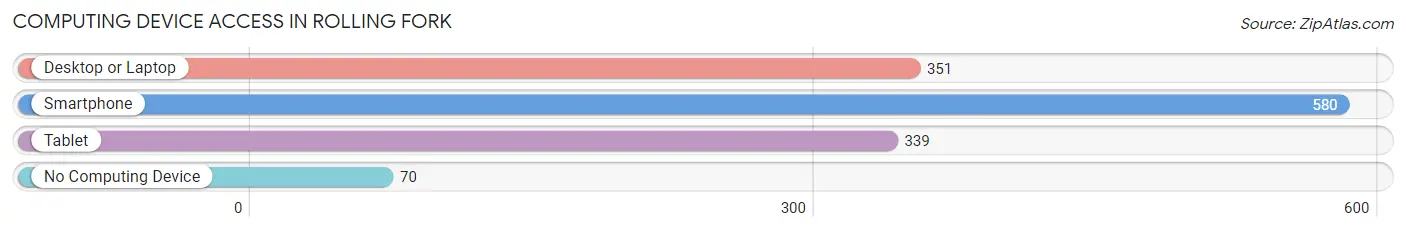
| Device Type | # Households | % Households |
| Desktop or Laptop | 351 | 52.3% |
| Smartphone | 580 | 86.4% |
| Tablet | 339 | 50.5% |
| No Computing Device | 70 | 10.4% |
| Total | 671 | 100.0% |
Internet Access in Rolling Fork
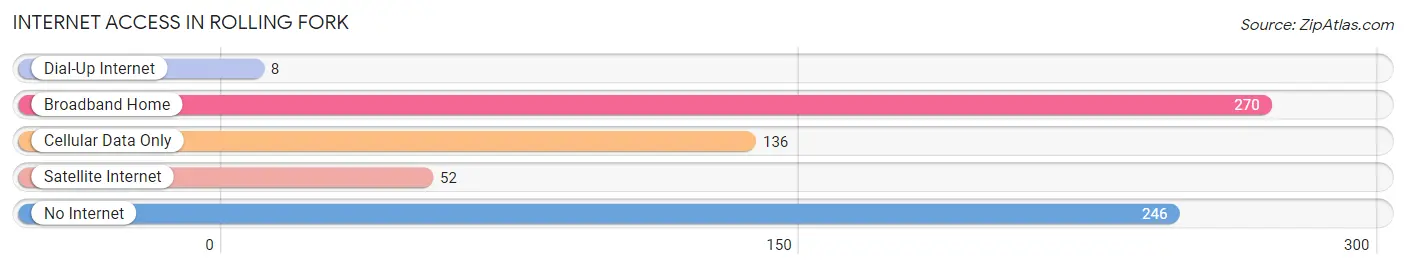
| Internet Type | # Households | % Households |
| Dial-Up Internet | 8 | 1.2% |
| Broadband Home | 270 | 40.2% |
| Cellular Data Only | 136 | 20.3% |
| Satellite Internet | 52 | 7.7% |
| No Internet | 246 | 36.7% |
| Total | 671 | 100.0% |
Rolling Fork Summary
Rolling Fork is a city located in Sharkey County, Mississippi. It is situated along the Mississippi River, approximately 40 miles south of Vicksburg. The city has a population of 2,845 as of the 2010 census, making it the largest city in Sharkey County.
History
Rolling Fork was founded in 1837 by a group of settlers from Kentucky and Tennessee. The city was named after the nearby Rolling Fork River, which was named for its rolling, meandering course. The city was incorporated in 1839 and quickly became a major trading center for the surrounding area.
In the late 19th century, Rolling Fork was a major cotton-producing center. The city was home to several cotton gins and warehouses, and the local economy was heavily dependent on the cotton industry.
In the early 20th century, the city began to diversify its economy. The lumber industry became a major employer, and the city also became a center for the production of furniture and other wood products.
Geography
Rolling Fork is located in the Mississippi Delta region, which is characterized by flat, fertile land. The city is situated along the Mississippi River, approximately 40 miles south of Vicksburg. The city has a total area of 4.2 square miles, all of which is land.
Economy
The economy of Rolling Fork is largely based on agriculture. The city is home to several large farms, which produce cotton, soybeans, corn, and other crops. The lumber industry is also an important part of the local economy, and the city is home to several furniture and wood product manufacturers.
The city is also home to several small businesses, including restaurants, retail stores, and service providers. The city is also home to a number of manufacturing plants, including a paper mill and a chemical plant.
Demographics
As of the 2010 census, Rolling Fork had a population of 2,845. The racial makeup of the city was 57.3% African American, 40.2% White, 0.3% Native American, 0.2% Asian, 0.1% Pacific Islander, and 1.9% from other races.
The median household income in Rolling Fork was $25,972, and the median family income was $31,944. The per capita income was $14,945. About 24.3% of the population was below the poverty line.
Conclusion
Rolling Fork is a city located in Sharkey County, Mississippi. It is situated along the Mississippi River, approximately 40 miles south of Vicksburg. The city has a population of 2,845 as of the 2010 census, making it the largest city in Sharkey County. The economy of Rolling Fork is largely based on agriculture, with the lumber industry also playing an important role. The racial makeup of the city is 57.3% African American, 40.2% White, 0.3% Native American, 0.2% Asian, 0.1% Pacific Islander, and 1.9% from other races. The median household income in Rolling Fork was $25,972, and the median family income was $31,944. About 24.3% of the population was below the poverty line.
Common Questions
What is Per Capita Income in Rolling Fork?
Per Capita income in Rolling Fork is $19,015.
What is the Median Family Income in Rolling Fork?
Median Family Income in Rolling Fork is $46,429.
What is the Median Household income in Rolling Fork?
Median Household Income in Rolling Fork is $41,208.
What is Income or Wage Gap in Rolling Fork?
Income or Wage Gap in Rolling Fork is 12.1%.
Women in Rolling Fork earn 87.9 cents for every dollar earned by a man.
What is Inequality or Gini Index in Rolling Fork?
Inequality or Gini Index in Rolling Fork is 0.47.
What is the Total Population of Rolling Fork?
Total Population of Rolling Fork is 2,172.
What is the Total Male Population of Rolling Fork?
Total Male Population of Rolling Fork is 1,020.
What is the Total Female Population of Rolling Fork?
Total Female Population of Rolling Fork is 1,152.
What is the Ratio of Males per 100 Females in Rolling Fork?
There are 88.54 Males per 100 Females in Rolling Fork.
What is the Ratio of Females per 100 Males in Rolling Fork?
There are 112.94 Females per 100 Males in Rolling Fork.
What is the Median Population Age in Rolling Fork?
Median Population Age in Rolling Fork is 34.9 Years.
What is the Average Family Size in Rolling Fork
Average Family Size in Rolling Fork is 3.7 People.
What is the Average Household Size in Rolling Fork
Average Household Size in Rolling Fork is 3.0 People.
How Large is the Labor Force in Rolling Fork?
There are 960 People in the Labor Forcein in Rolling Fork.
What is the Percentage of People in the Labor Force in Rolling Fork?
57.5% of People are in the Labor Force in Rolling Fork.
What is the Unemployment Rate in Rolling Fork?
Unemployment Rate in Rolling Fork is 18.4%.