Guntown, MS Map & Demographics
Guntown Map
Guntown Overview
$23,796
PER CAPITA INCOME
$82,833
AVG FAMILY INCOME
$66,058
AVG HOUSEHOLD INCOME
34.6%
WAGE / INCOME GAP [ % ]
65.4¢/ $1
WAGE / INCOME GAP [ $ ]
$12,603
FAMILY INCOME DEFICIT
0.38
INEQUALITY / GINI INDEX
2,279
TOTAL POPULATION
1,198
MALE POPULATION
1,081
FEMALE POPULATION
110.82
MALES / 100 FEMALES
90.23
FEMALES / 100 MALES
30.8
MEDIAN AGE
3.6
AVG FAMILY SIZE
3.2
AVG HOUSEHOLD SIZE
1,101
LABOR FORCE [ PEOPLE ]
69.9%
PERCENT IN LABOR FORCE
4.5%
UNEMPLOYMENT RATE
Guntown Zip Codes
Guntown Area Codes
Income in Guntown
Income Overview in Guntown
Per Capita Income in Guntown is $23,796, while median incomes of families and households are $82,833 and $66,058 respectively.
| Characteristic | Number | Measure |
| Per Capita Income | 2,279 | $23,796 |
| Median Family Income | 568 | $82,833 |
| Mean Family Income | 568 | $86,107 |
| Median Household Income | 713 | $66,058 |
| Mean Household Income | 713 | $76,334 |
| Income Deficit | 568 | $12,603 |
| Wage / Income Gap (%) | 2,279 | 34.63% |
| Wage / Income Gap ($) | 2,279 | 65.37¢ per $1 |
| Gini / Inequality Index | 2,279 | 0.38 |
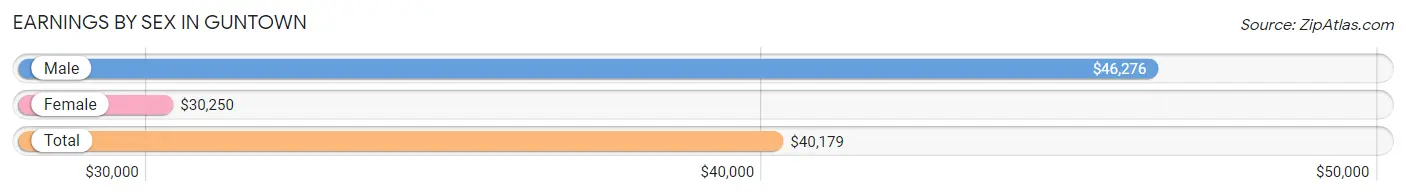
Earnings by Sex in Guntown
Average Earnings in Guntown are $40,179, $46,276 for men and $30,250 for women, a difference of 34.6%.
| Sex | Number | Average Earnings |
| Male | 550 (48.3%) | $46,276 |
| Female | 588 (51.7%) | $30,250 |
| Total | 1,138 (100.0%) | $40,179 |
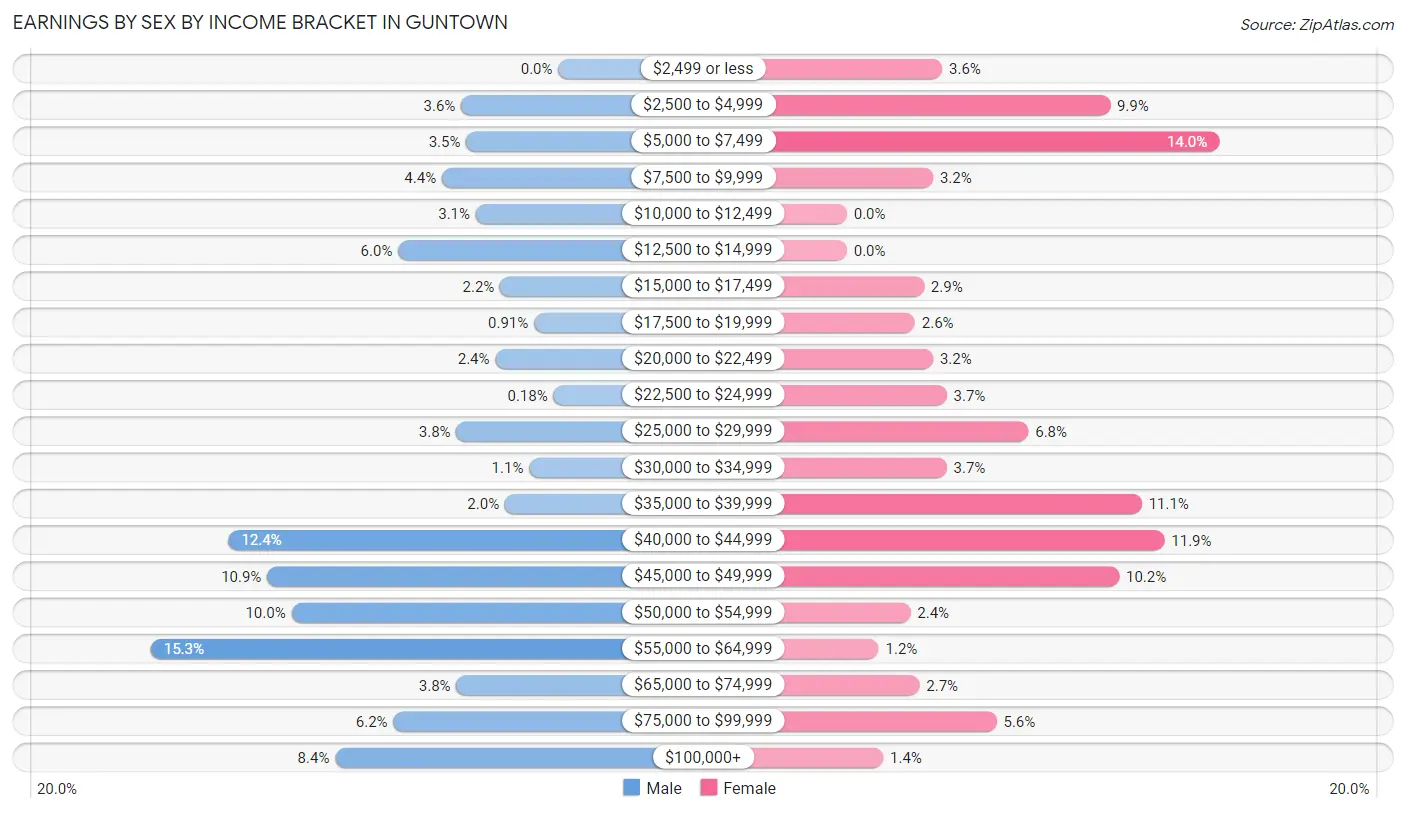
Earnings by Sex by Income Bracket in Guntown
The most common earnings brackets in Guntown are $55,000 to $64,999 for men (84 | 15.3%) and $5,000 to $7,499 for women (82 | 14.0%).
| Income | Male | Female |
| $2,499 or less | 0 (0.0%) | 21 (3.6%) |
| $2,500 to $4,999 | 20 (3.6%) | 58 (9.9%) |
| $5,000 to $7,499 | 19 (3.5%) | 82 (14.0%) |
| $7,500 to $9,999 | 24 (4.4%) | 19 (3.2%) |
| $10,000 to $12,499 | 17 (3.1%) | 0 (0.0%) |
| $12,500 to $14,999 | 33 (6.0%) | 0 (0.0%) |
| $15,000 to $17,499 | 12 (2.2%) | 17 (2.9%) |
| $17,500 to $19,999 | 5 (0.9%) | 15 (2.5%) |
| $20,000 to $22,499 | 13 (2.4%) | 19 (3.2%) |
| $22,500 to $24,999 | 1 (0.2%) | 22 (3.7%) |
| $25,000 to $29,999 | 21 (3.8%) | 40 (6.8%) |
| $30,000 to $34,999 | 6 (1.1%) | 22 (3.7%) |
| $35,000 to $39,999 | 11 (2.0%) | 65 (11.1%) |
| $40,000 to $44,999 | 68 (12.4%) | 70 (11.9%) |
| $45,000 to $49,999 | 60 (10.9%) | 60 (10.2%) |
| $50,000 to $54,999 | 55 (10.0%) | 14 (2.4%) |
| $55,000 to $64,999 | 84 (15.3%) | 7 (1.2%) |
| $65,000 to $74,999 | 21 (3.8%) | 16 (2.7%) |
| $75,000 to $99,999 | 34 (6.2%) | 33 (5.6%) |
| $100,000+ | 46 (8.4%) | 8 (1.4%) |
| Total | 550 (100.0%) | 588 (100.0%) |
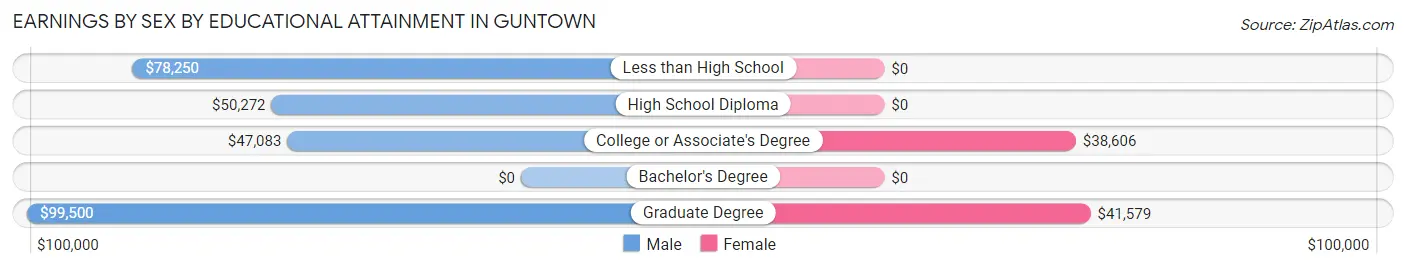
Earnings by Sex by Educational Attainment in Guntown
Average earnings in Guntown are $50,776 for men and $33,750 for women, a difference of 33.5%. Men with an educational attainment of graduate degree enjoy the highest average annual earnings of $99,500, while those with college or associate's degree education earn the least with $47,083. Women with an educational attainment of graduate degree earn the most with the average annual earnings of $41,579, while those with college or associate's degree education have the smallest earnings of $38,606.
| Educational Attainment | Male Income | Female Income |
| Less than High School | $78,250 | $0 |
| High School Diploma | $50,272 | $0 |
| College or Associate's Degree | $47,083 | $38,606 |
| Bachelor's Degree | - | - |
| Graduate Degree | $99,500 | $41,579 |
| Total | $50,776 | $33,750 |
Family Income in Guntown
Family Income Brackets in Guntown
According to the Guntown family income data, there are 123 families falling into the $100,000 to $149,999 income range, which is the most common income bracket and makes up 21.6% of all families.
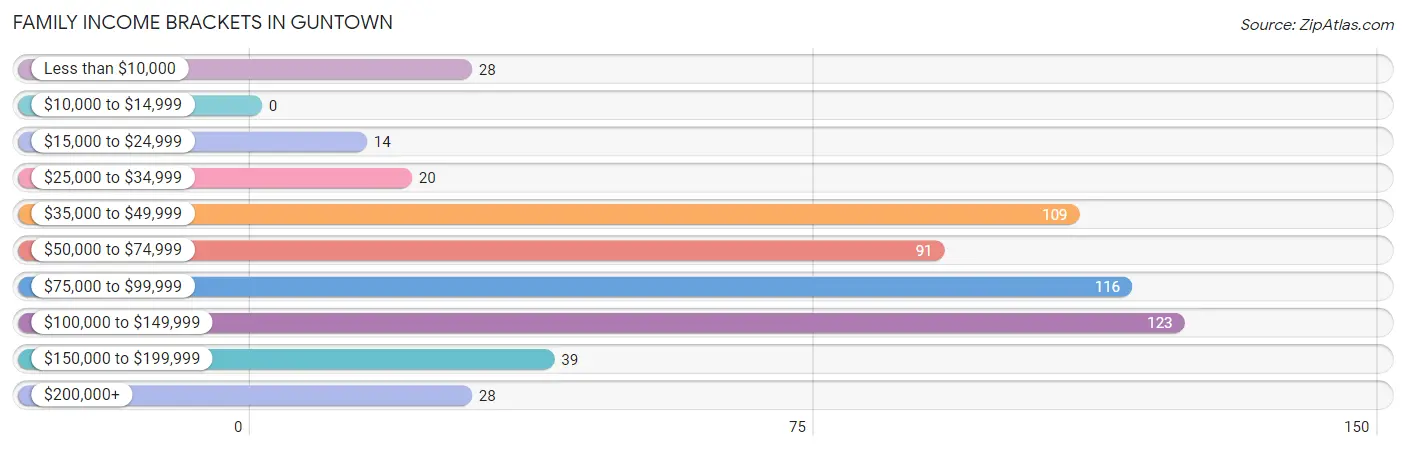
| Income Bracket | # Families | % Families |
| Less than $10,000 | 28 | 4.9% |
| $10,000 to $14,999 | 0 | 0.0% |
| $15,000 to $24,999 | 14 | 2.5% |
| $25,000 to $34,999 | 20 | 3.5% |
| $35,000 to $49,999 | 109 | 19.2% |
| $50,000 to $74,999 | 91 | 16.0% |
| $75,000 to $99,999 | 116 | 20.4% |
| $100,000 to $149,999 | 123 | 21.7% |
| $150,000 to $199,999 | 39 | 6.9% |
| $200,000+ | 28 | 4.9% |
Family Income by Famaliy Size in Guntown
5-person families (36 | 6.3%) account for the highest median family income in Guntown with $122,222 per family, while 2-person families (179 | 31.5%) have the highest median income of $26,375 per family member.
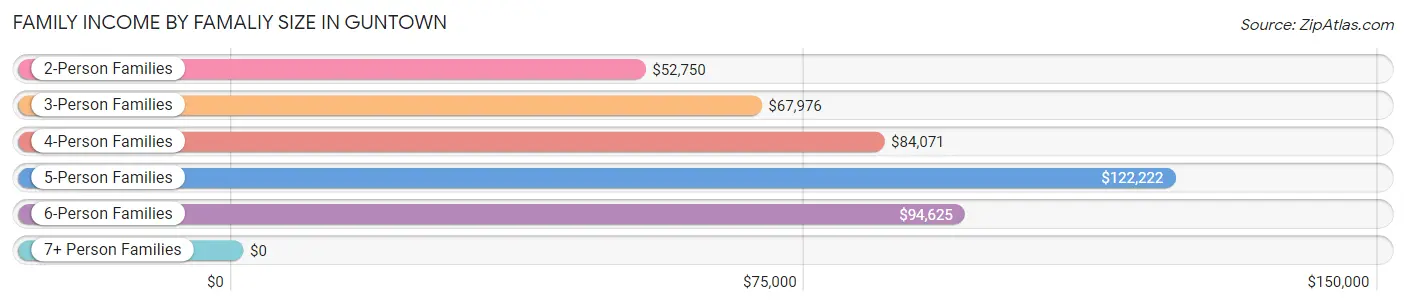
| Income Bracket | # Families | Median Income |
| 2-Person Families | 179 (31.5%) | $52,750 |
| 3-Person Families | 230 (40.5%) | $67,976 |
| 4-Person Families | 94 (16.6%) | $84,071 |
| 5-Person Families | 36 (6.3%) | $122,222 |
| 6-Person Families | 29 (5.1%) | $94,625 |
| 7+ Person Families | 0 (0.0%) | $0 |
| Total | 568 (100.0%) | $82,833 |
Family Income by Number of Earners in Guntown
The median family income in Guntown is $82,833, with families comprising 3+ earners (42) having the highest median family income of $107,500, while families with 1 earner (157) have the lowest median family income of $45,707, accounting for 7.4% and 27.6% of families, respectively.
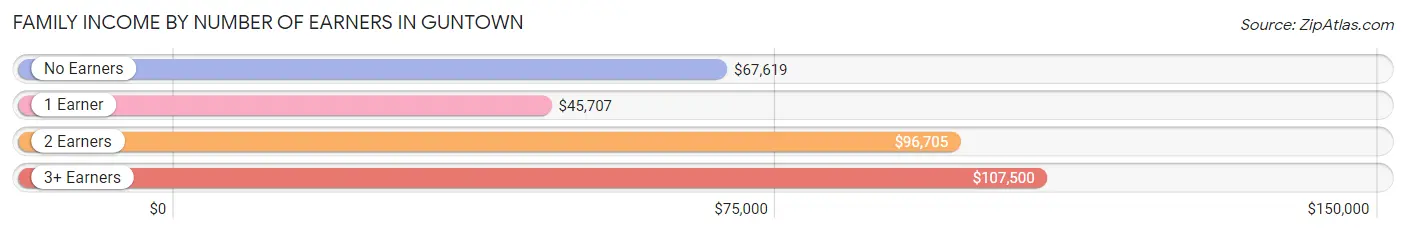
| Number of Earners | # Families | Median Income |
| No Earners | 58 (10.2%) | $67,619 |
| 1 Earner | 157 (27.6%) | $45,707 |
| 2 Earners | 311 (54.7%) | $96,705 |
| 3+ Earners | 42 (7.4%) | $107,500 |
| Total | 568 (100.0%) | $82,833 |
Household Income in Guntown
Household Income Brackets in Guntown
With 132 households falling in the category, the $50,000 to $74,999 income range is the most frequent in Guntown, accounting for 18.5% of all households. In contrast, only 28 households (3.9%) fall into the $200,000+ income bracket, making it the least populous group.
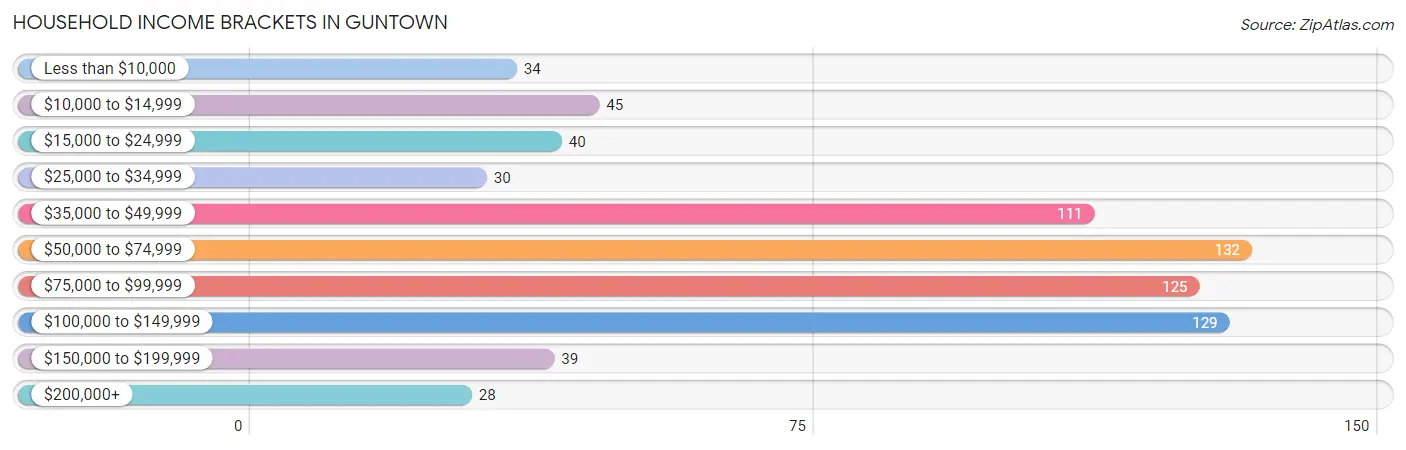
| Income Bracket | # Households | % Households |
| Less than $10,000 | 34 | 4.8% |
| $10,000 to $14,999 | 45 | 6.3% |
| $15,000 to $24,999 | 40 | 5.6% |
| $25,000 to $34,999 | 30 | 4.2% |
| $35,000 to $49,999 | 111 | 15.6% |
| $50,000 to $74,999 | 132 | 18.5% |
| $75,000 to $99,999 | 125 | 17.5% |
| $100,000 to $149,999 | 129 | 18.1% |
| $150,000 to $199,999 | 39 | 5.5% |
| $200,000+ | 28 | 3.9% |
Household Income by Householder Age in Guntown
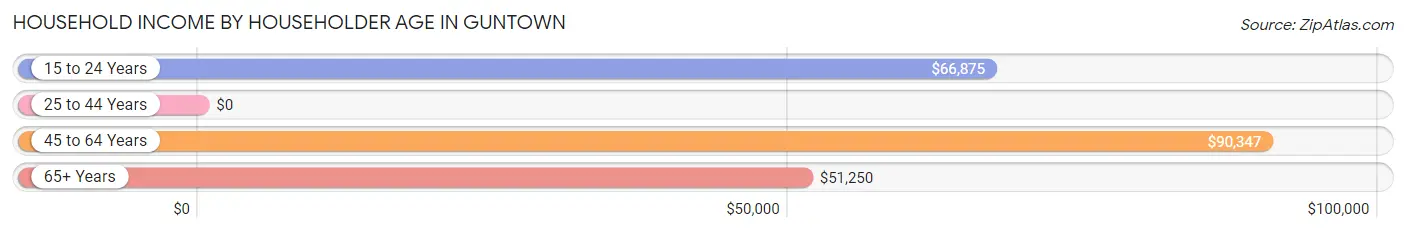
The median household income in Guntown is $66,058, with the highest median household income of $90,347 found in the 45 to 64 years age bracket for the primary householder. A total of 185 households (26.0%) fall into this category. Meanwhile, the 25 to 44 years age bracket for the primary householder has the lowest median household income of $0, with 367 households (51.5%) in this group.
| Income Bracket | # Households | Median Income |
| 15 to 24 Years | 24 (3.4%) | $66,875 |
| 25 to 44 Years | 367 (51.5%) | $0 |
| 45 to 64 Years | 185 (26.0%) | $90,347 |
| 65+ Years | 137 (19.2%) | $51,250 |
| Total | 713 (100.0%) | $66,058 |
Poverty in Guntown
Income Below Poverty by Sex and Age in Guntown
With 4.6% poverty level for males and 9.9% for females among the residents of Guntown, 5 year old males and 18 to 24 year old females are the most vulnerable to poverty, with 21 males (51.2%) and 12 females (27.3%) in their respective age groups living below the poverty level.
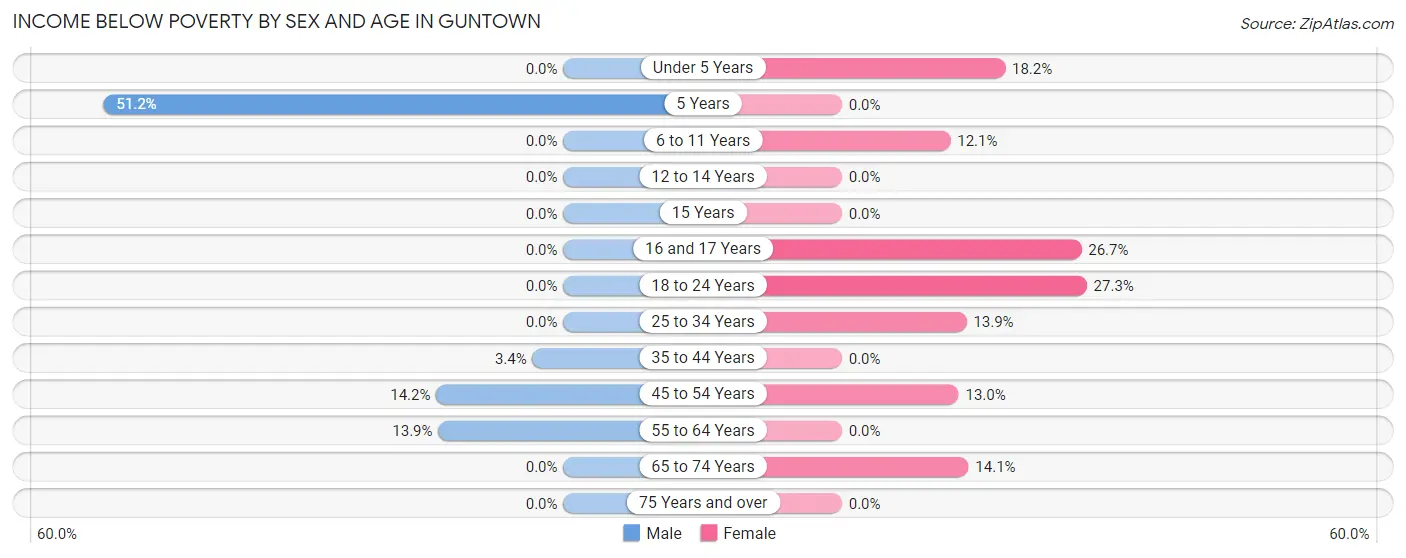
| Age Bracket | Male | Female |
| Under 5 Years | 0 (0.0%) | 8 (18.2%) |
| 5 Years | 21 (51.2%) | 0 (0.0%) |
| 6 to 11 Years | 0 (0.0%) | 25 (12.1%) |
| 12 to 14 Years | 0 (0.0%) | 0 (0.0%) |
| 15 Years | 0 (0.0%) | 0 (0.0%) |
| 16 and 17 Years | 0 (0.0%) | 4 (26.7%) |
| 18 to 24 Years | 0 (0.0%) | 12 (27.3%) |
| 25 to 34 Years | 0 (0.0%) | 34 (13.9%) |
| 35 to 44 Years | 8 (3.4%) | 0 (0.0%) |
| 45 to 54 Years | 15 (14.1%) | 13 (13.0%) |
| 55 to 64 Years | 11 (13.9%) | 0 (0.0%) |
| 65 to 74 Years | 0 (0.0%) | 11 (14.1%) |
| 75 Years and over | 0 (0.0%) | 0 (0.0%) |
| Total | 55 (4.6%) | 107 (9.9%) |
Income Above Poverty by Sex and Age in Guntown
According to the poverty statistics in Guntown, males aged under 5 years and females aged 5 years are the age groups that are most secure financially, with 100.0% of males and 100.0% of females in these age groups living above the poverty line.
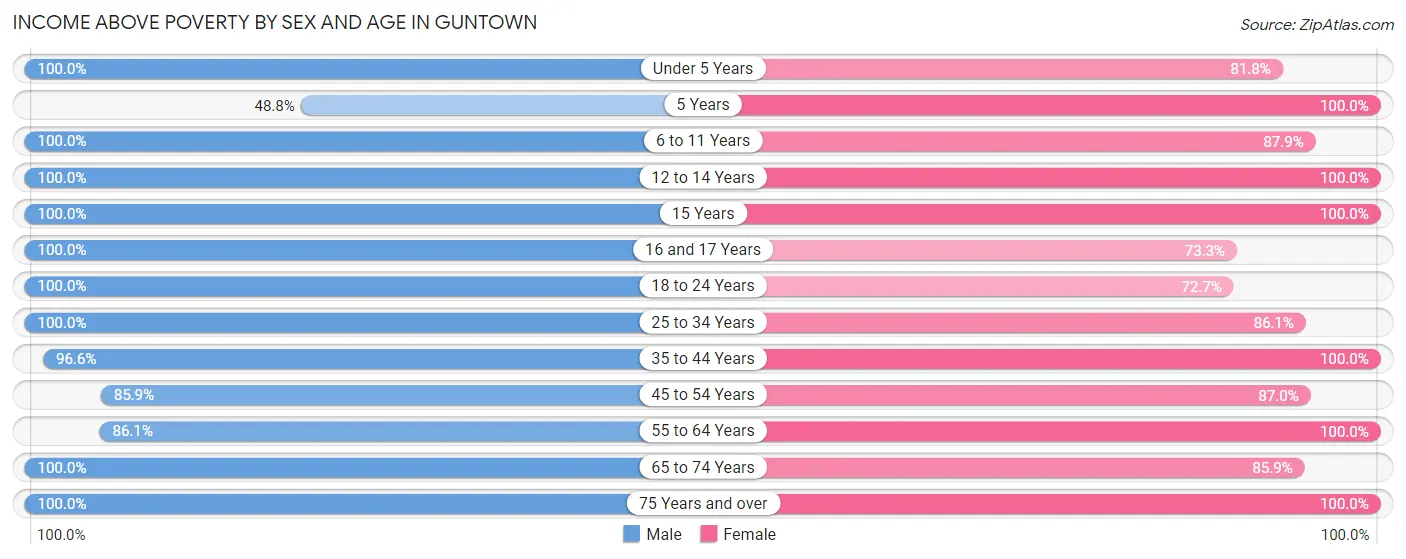
| Age Bracket | Male | Female |
| Under 5 Years | 95 (100.0%) | 36 (81.8%) |
| 5 Years | 20 (48.8%) | 11 (100.0%) |
| 6 to 11 Years | 124 (100.0%) | 182 (87.9%) |
| 12 to 14 Years | 85 (100.0%) | 43 (100.0%) |
| 15 Years | 29 (100.0%) | 9 (100.0%) |
| 16 and 17 Years | 70 (100.0%) | 11 (73.3%) |
| 18 to 24 Years | 99 (100.0%) | 32 (72.7%) |
| 25 to 34 Years | 146 (100.0%) | 211 (86.1%) |
| 35 to 44 Years | 225 (96.6%) | 168 (100.0%) |
| 45 to 54 Years | 91 (85.9%) | 87 (87.0%) |
| 55 to 64 Years | 68 (86.1%) | 89 (100.0%) |
| 65 to 74 Years | 41 (100.0%) | 67 (85.9%) |
| 75 Years and over | 34 (100.0%) | 28 (100.0%) |
| Total | 1,127 (95.4%) | 974 (90.1%) |
Income Below Poverty Among Married-Couple Families in Guntown
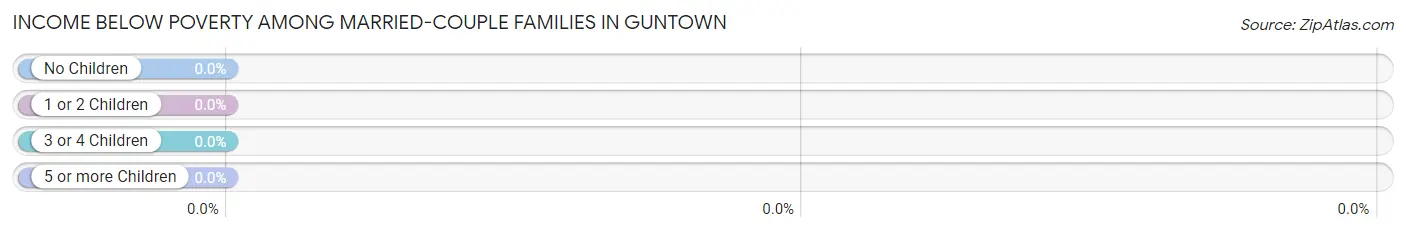
| Children | Above Poverty | Below Poverty |
| No Children | 157 (100.0%) | 0 (0.0%) |
| 1 or 2 Children | 207 (100.0%) | 0 (0.0%) |
| 3 or 4 Children | 44 (100.0%) | 0 (0.0%) |
| 5 or more Children | 0 (0.0%) | 0 (0.0%) |
| Total | 408 (100.0%) | 0 (0.0%) |
Income Below Poverty Among Single-Parent Households in Guntown
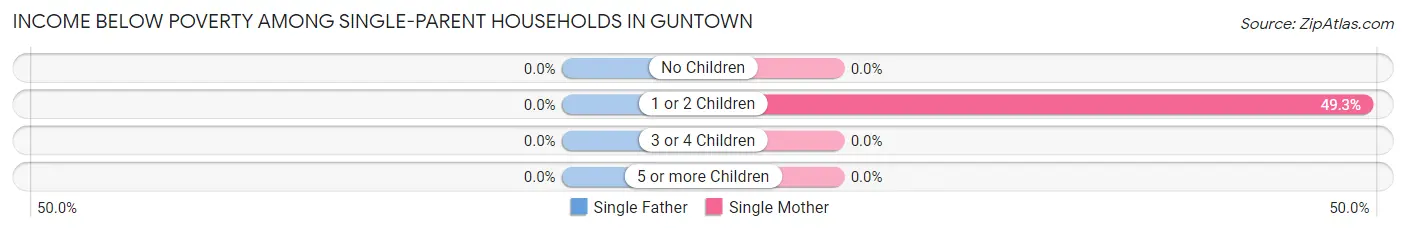
| Children | Single Father | Single Mother |
| No Children | 0 (0.0%) | 0 (0.0%) |
| 1 or 2 Children | 0 (0.0%) | 34 (49.3%) |
| 3 or 4 Children | 0 (0.0%) | 0 (0.0%) |
| 5 or more Children | 0 (0.0%) | 0 (0.0%) |
| Total | 0 (0.0%) | 34 (29.8%) |
Income Below Poverty Among Married-Couple vs Single-Parent Households in Guntown
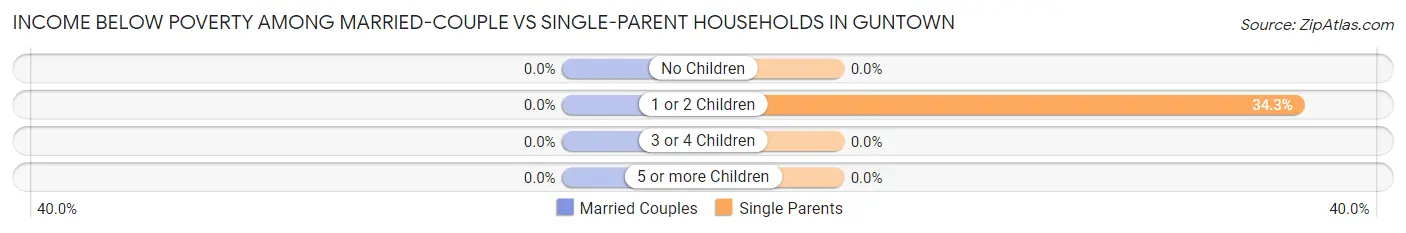
| Children | Married-Couple Families | Single-Parent Households |
| No Children | 0 (0.0%) | 0 (0.0%) |
| 1 or 2 Children | 0 (0.0%) | 34 (34.3%) |
| 3 or 4 Children | 0 (0.0%) | 0 (0.0%) |
| 5 or more Children | 0 (0.0%) | 0 (0.0%) |
| Total | 0 (0.0%) | 34 (21.2%) |
Race in Guntown
The most populous races in Guntown are White / Caucasian (1,594 | 69.9%), Black / African American (454 | 19.9%), and Two or more Races (202 | 8.9%).
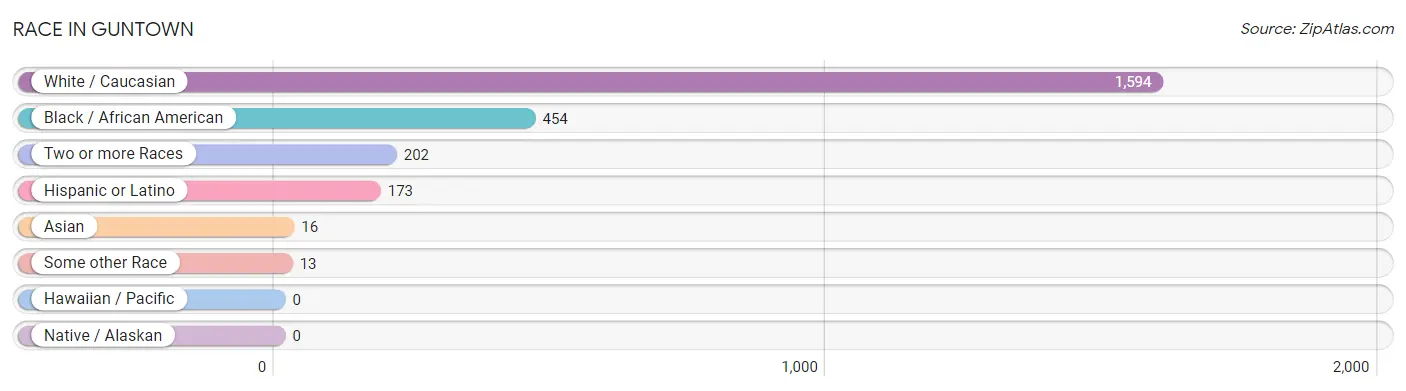
| Race | # Population | % Population |
| Asian | 16 | 0.7% |
| Black / African American | 454 | 19.9% |
| Hawaiian / Pacific | 0 | 0.0% |
| Hispanic or Latino | 173 | 7.6% |
| Native / Alaskan | 0 | 0.0% |
| White / Caucasian | 1,594 | 69.9% |
| Two or more Races | 202 | 8.9% |
| Some other Race | 13 | 0.6% |
| Total | 2,279 | 100.0% |
Ancestry in Guntown
The most populous ancestries reported in Guntown are American (262 | 11.5%), Irish (252 | 11.1%), English (231 | 10.1%), German (161 | 7.1%), and Mexican (99 | 4.3%), together accounting for 44.1% of all Guntown residents.
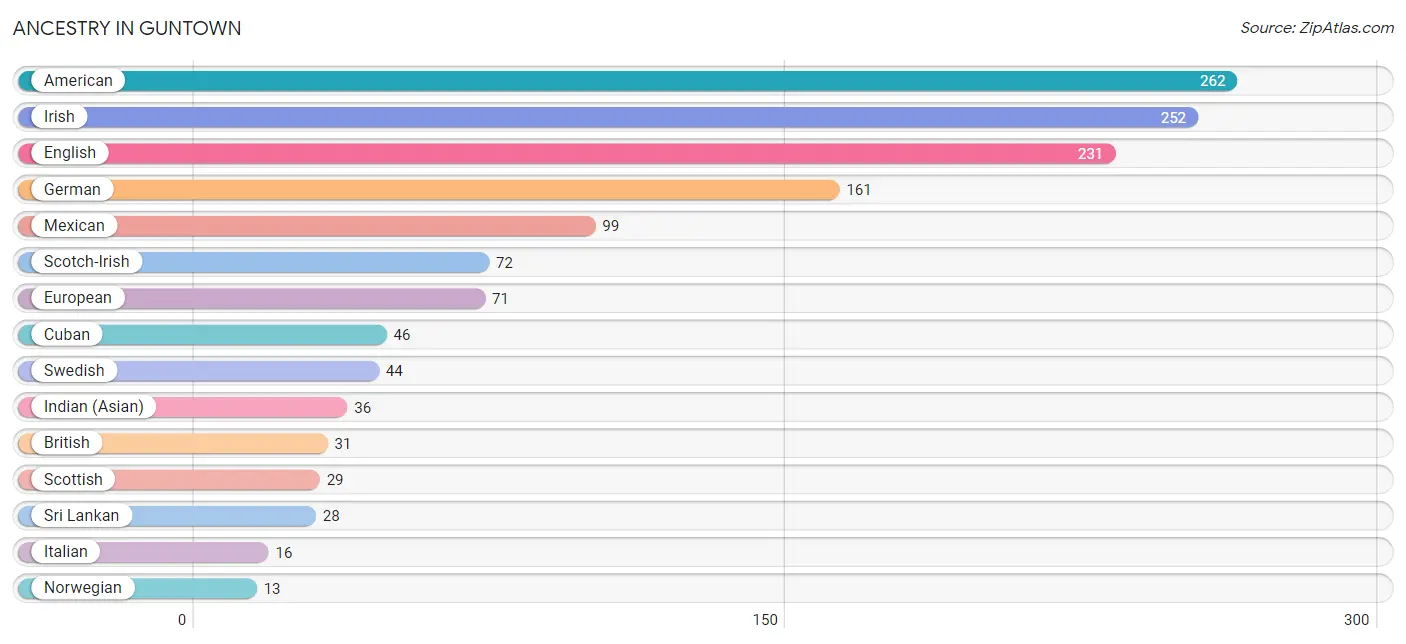
| Ancestry | # Population | % Population |
| African | 11 | 0.5% |
| American | 262 | 11.5% |
| British | 31 | 1.4% |
| Cuban | 46 | 2.0% |
| Dutch | 4 | 0.2% |
| English | 231 | 10.1% |
| European | 71 | 3.1% |
| French | 10 | 0.4% |
| German | 161 | 7.1% |
| Indian (Asian) | 36 | 1.6% |
| Irish | 252 | 11.1% |
| Italian | 16 | 0.7% |
| Laotian | 4 | 0.2% |
| Mexican | 99 | 4.3% |
| Norwegian | 13 | 0.6% |
| Polish | 5 | 0.2% |
| Scotch-Irish | 72 | 3.2% |
| Scottish | 29 | 1.3% |
| Spaniard | 9 | 0.4% |
| Sri Lankan | 28 | 1.2% |
| Subsaharan African | 11 | 0.5% |
| Swedish | 44 | 1.9% |
| Welsh | 9 | 0.4% | View All 23 Rows |
Immigrants in Guntown
The most numerous immigrant groups reported in Guntown came from Central America (16 | 0.7%), Latin America (16 | 0.7%), Mexico (16 | 0.7%), Asia (12 | 0.5%), and China (8 | 0.4%), together accounting for 3.0% of all Guntown residents.
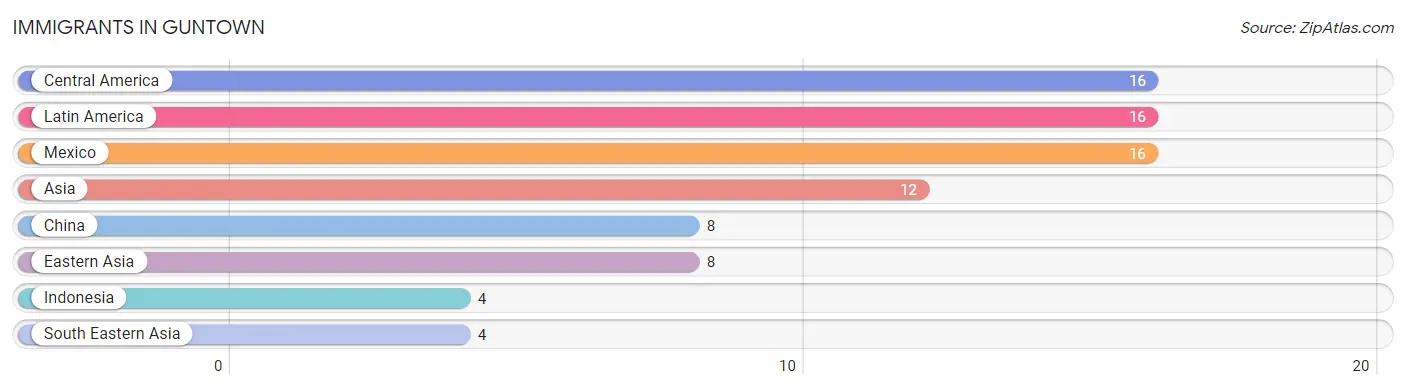
| Immigration Origin | # Population | % Population |
| Asia | 12 | 0.5% |
| Central America | 16 | 0.7% |
| China | 8 | 0.4% |
| Eastern Asia | 8 | 0.4% |
| Indonesia | 4 | 0.2% |
| Latin America | 16 | 0.7% |
| Mexico | 16 | 0.7% |
| South Eastern Asia | 4 | 0.2% | View All 8 Rows |
Sex and Age in Guntown
Sex and Age in Guntown
The most populous age groups in Guntown are 35 to 39 Years (185 | 15.4%) for men and 30 to 34 Years (173 | 16.0%) for women.
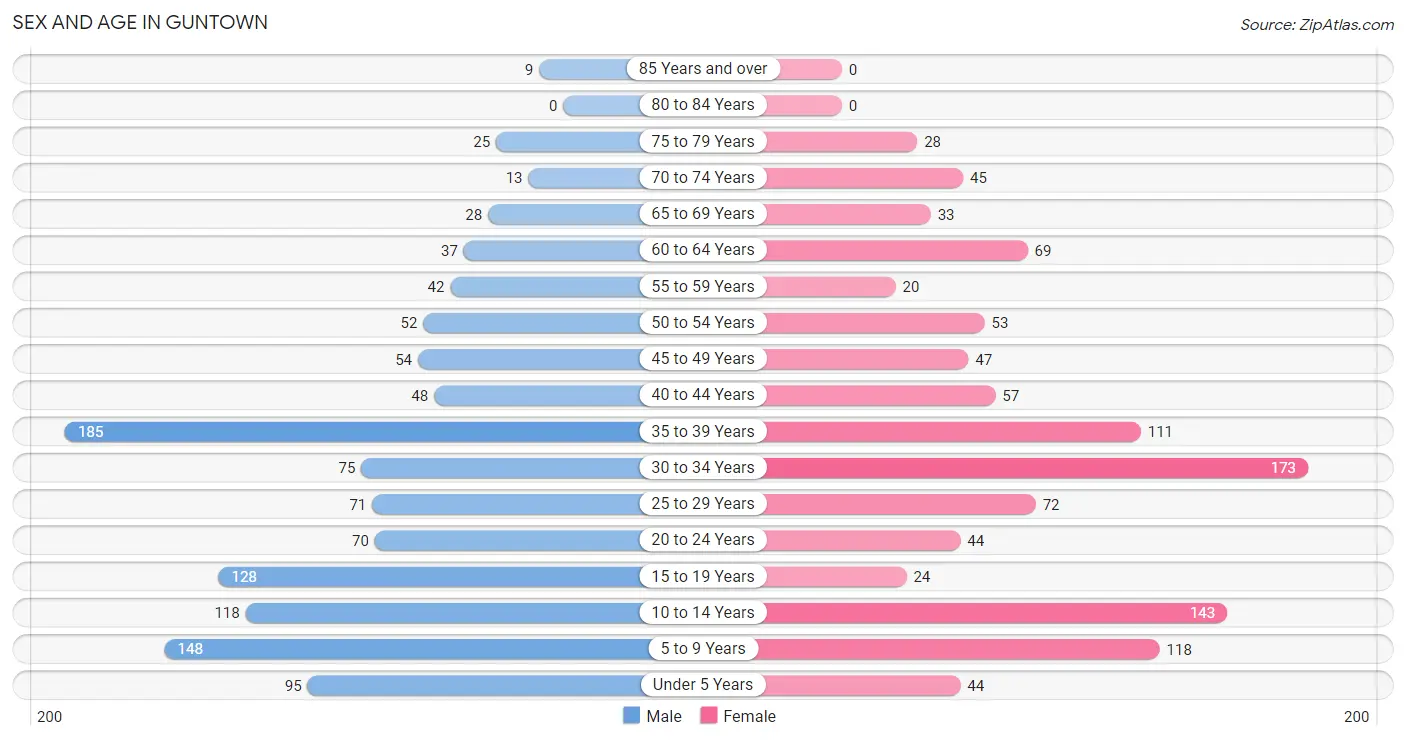
| Age Bracket | Male | Female |
| Under 5 Years | 95 (7.9%) | 44 (4.1%) |
| 5 to 9 Years | 148 (12.3%) | 118 (10.9%) |
| 10 to 14 Years | 118 (9.9%) | 143 (13.2%) |
| 15 to 19 Years | 128 (10.7%) | 24 (2.2%) |
| 20 to 24 Years | 70 (5.8%) | 44 (4.1%) |
| 25 to 29 Years | 71 (5.9%) | 72 (6.7%) |
| 30 to 34 Years | 75 (6.3%) | 173 (16.0%) |
| 35 to 39 Years | 185 (15.4%) | 111 (10.3%) |
| 40 to 44 Years | 48 (4.0%) | 57 (5.3%) |
| 45 to 49 Years | 54 (4.5%) | 47 (4.3%) |
| 50 to 54 Years | 52 (4.3%) | 53 (4.9%) |
| 55 to 59 Years | 42 (3.5%) | 20 (1.8%) |
| 60 to 64 Years | 37 (3.1%) | 69 (6.4%) |
| 65 to 69 Years | 28 (2.3%) | 33 (3.0%) |
| 70 to 74 Years | 13 (1.1%) | 45 (4.2%) |
| 75 to 79 Years | 25 (2.1%) | 28 (2.6%) |
| 80 to 84 Years | 0 (0.0%) | 0 (0.0%) |
| 85 Years and over | 9 (0.7%) | 0 (0.0%) |
| Total | 1,198 (100.0%) | 1,081 (100.0%) |
Families and Households in Guntown
Median Family Size in Guntown
The median family size in Guntown is 3.63 persons per family, with single male/father families (46 | 8.1%) accounting for the largest median family size of 4.22 persons per family. On the other hand, single female/mother families (114 | 20.1%) represent the smallest median family size with 2.89 persons per family.
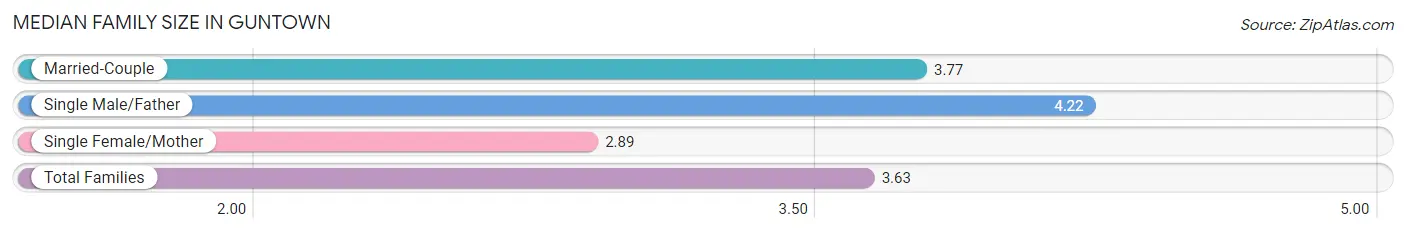
| Family Type | # Families | Family Size |
| Married-Couple | 408 (71.8%) | 3.77 |
| Single Male/Father | 46 (8.1%) | 4.22 |
| Single Female/Mother | 114 (20.1%) | 2.89 |
| Total Families | 568 (100.0%) | 3.63 |
Median Household Size in Guntown
The median household size in Guntown is 3.20 persons per household, with single male/father households (46 | 6.5%) accounting for the largest median household size of 4.5 persons per household. non-family households (145 | 20.3%) represent the smallest median household size with 1.34 persons per household.
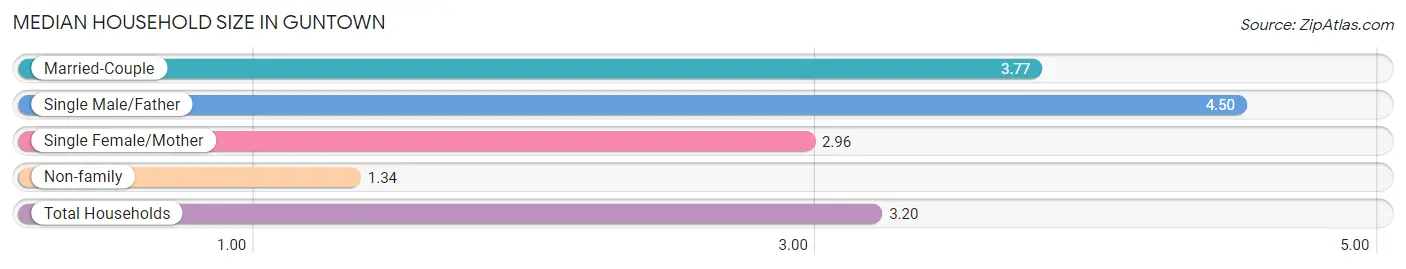
| Household Type | # Households | Household Size |
| Married-Couple | 408 (57.2%) | 3.77 |
| Single Male/Father | 46 (6.5%) | 4.50 |
| Single Female/Mother | 114 (16.0%) | 2.96 |
| Non-family | 145 (20.3%) | 1.34 |
| Total Households | 713 (100.0%) | 3.20 |
Household Size by Marriage Status in Guntown
Out of a total of 713 households in Guntown, 568 (79.7%) are family households, while 145 (20.3%) are nonfamily households. The most numerous type of family households are 3-person households, comprising 230, and the most common type of nonfamily households are 1-person households, comprising 126.
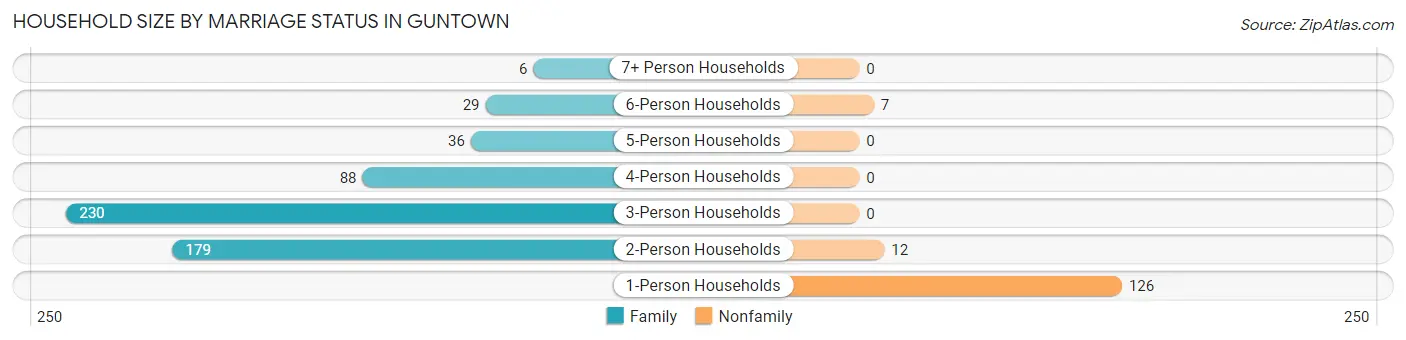
| Household Size | Family Households | Nonfamily Households |
| 1-Person Households | - | 126 (17.7%) |
| 2-Person Households | 179 (25.1%) | 12 (1.7%) |
| 3-Person Households | 230 (32.3%) | 0 (0.0%) |
| 4-Person Households | 88 (12.3%) | 0 (0.0%) |
| 5-Person Households | 36 (5.1%) | 0 (0.0%) |
| 6-Person Households | 29 (4.1%) | 7 (1.0%) |
| 7+ Person Households | 6 (0.8%) | 0 (0.0%) |
| Total | 568 (79.7%) | 145 (20.3%) |
Female Fertility in Guntown
Fertility by Age in Guntown
Average fertility rate in Guntown is 29.0 births per 1,000 women. Women in the age bracket of 20 to 34 years have the highest fertility rate with 38.0 births per 1,000 women. Women in the age bracket of 20 to 34 years acount for 68.8% of all women with births.
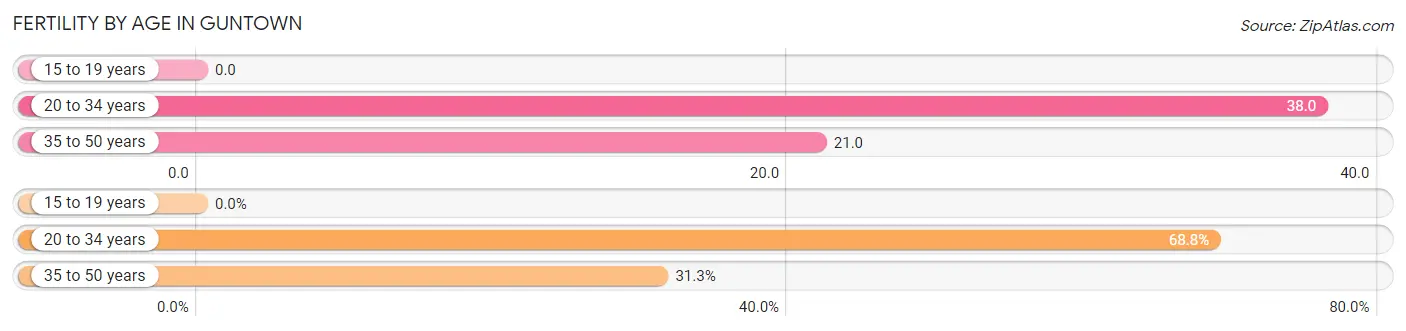
| Age Bracket | Women with Births | Births / 1,000 Women |
| 15 to 19 years | 0 (0.0%) | 0.0 |
| 20 to 34 years | 11 (68.8%) | 38.0 |
| 35 to 50 years | 5 (31.2%) | 21.0 |
| Total | 16 (100.0%) | 29.0 |
Fertility by Age by Marriage Status in Guntown
37.5% of women with births (16) in Guntown are married. The highest percentage of unmarried women with births falls into 35 to 50 years age bracket with 100.0% of them unmarried at the time of birth, while the lowest percentage of unmarried women with births belong to 20 to 34 years age bracket with 45.5% of them unmarried.
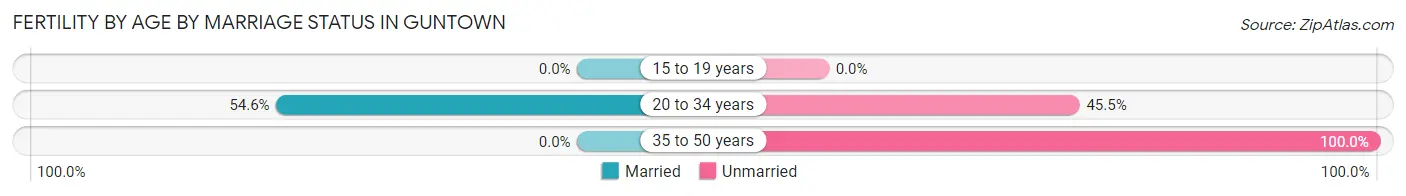
| Age Bracket | Married | Unmarried |
| 15 to 19 years | 0 (0.0%) | 0 (0.0%) |
| 20 to 34 years | 6 (54.5%) | 5 (45.5%) |
| 35 to 50 years | 0 (0.0%) | 5 (100.0%) |
| Total | 6 (37.5%) | 10 (62.5%) |
Fertility by Education in Guntown
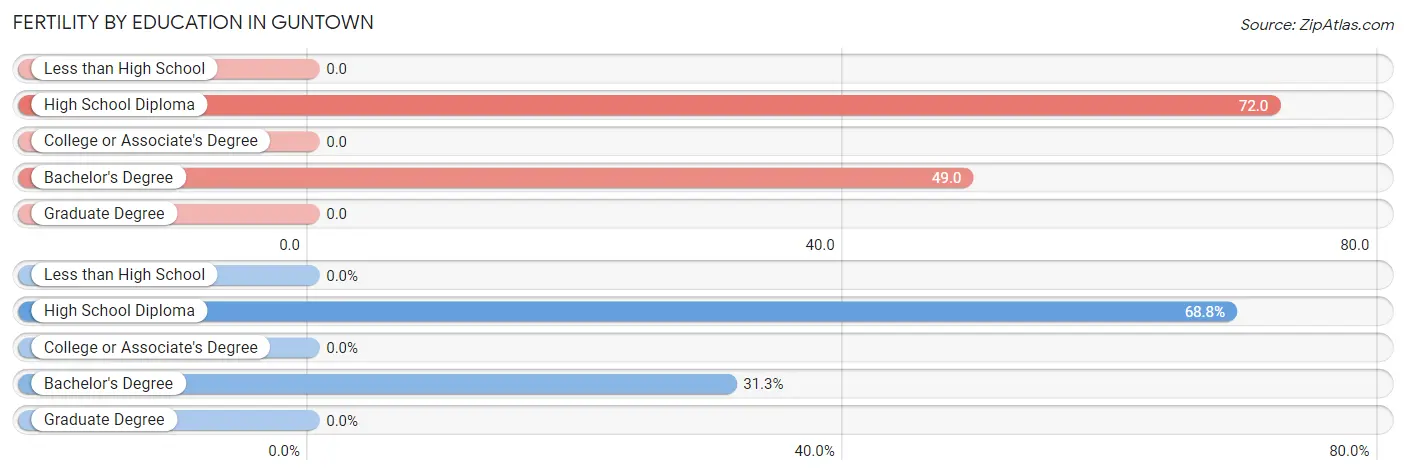
| Educational Attainment | Women with Births | Births / 1,000 Women |
| Less than High School | 0 (0.0%) | 0.0 |
| High School Diploma | 11 (68.8%) | 72.0 |
| College or Associate's Degree | 0 (0.0%) | 0.0 |
| Bachelor's Degree | 5 (31.2%) | 49.0 |
| Graduate Degree | 0 (0.0%) | 0.0 |
| Total | 16 (100.0%) | 29.0 |
Fertility by Education by Marriage Status in Guntown
62.5% of women with births in Guntown are unmarried. Women with the educational attainment of high school diploma are most likely to be married with 54.5% of them married at childbirth, while women with the educational attainment of bachelor's degree are least likely to be married with 100.0% of them unmarried at childbirth.
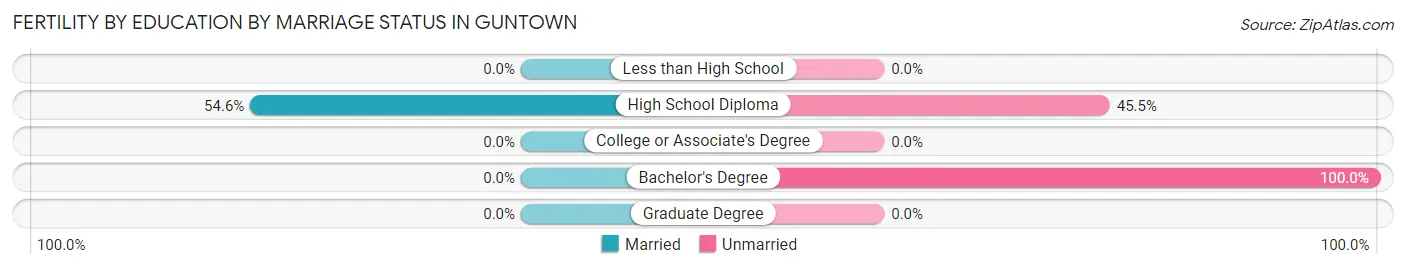
| Educational Attainment | Married | Unmarried |
| Less than High School | 0 (0.0%) | 0 (0.0%) |
| High School Diploma | 6 (54.5%) | 5 (45.5%) |
| College or Associate's Degree | 0 (0.0%) | 0 (0.0%) |
| Bachelor's Degree | 0 (0.0%) | 5 (100.0%) |
| Graduate Degree | 0 (0.0%) | 0 (0.0%) |
| Total | 6 (37.5%) | 10 (62.5%) |
Employment Characteristics in Guntown
Employment by Class of Employer in Guntown
Among the 1,047 employed individuals in Guntown, private company employees (774 | 73.9%), self-employed (not incorporated) (92 | 8.8%), and local government employees (63 | 6.0%) make up the most common classes of employment.
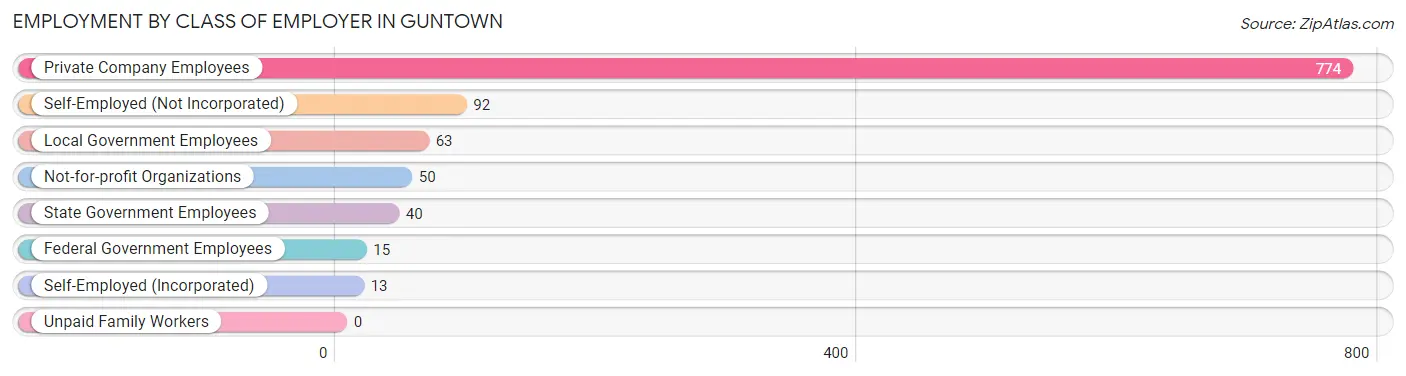
| Employer Class | # Employees | % Employees |
| Private Company Employees | 774 | 73.9% |
| Self-Employed (Incorporated) | 13 | 1.2% |
| Self-Employed (Not Incorporated) | 92 | 8.8% |
| Not-for-profit Organizations | 50 | 4.8% |
| Local Government Employees | 63 | 6.0% |
| State Government Employees | 40 | 3.8% |
| Federal Government Employees | 15 | 1.4% |
| Unpaid Family Workers | 0 | 0.0% |
| Total | 1,047 | 100.0% |
Employment Status by Age in Guntown
According to the labor force statistics for Guntown, out of the total population over 16 years of age (1,575), 69.9% or 1,101 individuals are in the labor force, with 4.5% or 50 of them unemployed. The age group with the highest labor force participation rate is 30 to 34 years, with 92.7% or 230 individuals in the labor force. Within the labor force, the 30 to 34 years age range has the highest percentage of unemployed individuals, with 10.0% or 23 of them being unemployed.
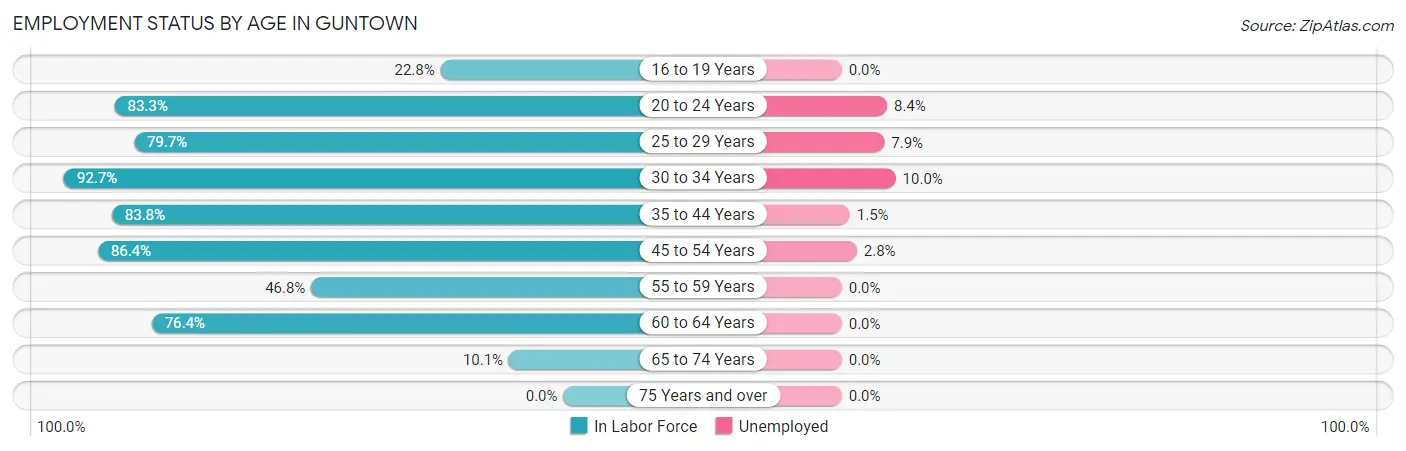
| Age Bracket | In Labor Force | Unemployed |
| 16 to 19 Years | 26 (22.8%) | 0 (0.0%) |
| 20 to 24 Years | 95 (83.3%) | 8 (8.4%) |
| 25 to 29 Years | 114 (79.7%) | 9 (7.9%) |
| 30 to 34 Years | 230 (92.7%) | 23 (10.0%) |
| 35 to 44 Years | 336 (83.8%) | 5 (1.5%) |
| 45 to 54 Years | 178 (86.4%) | 5 (2.8%) |
| 55 to 59 Years | 29 (46.8%) | 0 (0.0%) |
| 60 to 64 Years | 81 (76.4%) | 0 (0.0%) |
| 65 to 74 Years | 12 (10.1%) | 0 (0.0%) |
| 75 Years and over | 0 (0.0%) | 0 (0.0%) |
| Total | 1,101 (69.9%) | 50 (4.5%) |
Employment Status by Educational Attainment in Guntown
According to labor force statistics for Guntown, 83.0% of individuals (968) out of the total population between 25 and 64 years of age (1,166) are in the labor force, with 4.3% or 42 of them being unemployed. The group with the highest labor force participation rate are those with the educational attainment of bachelor's degree or higher, with 96.3% or 289 individuals in the labor force. Within the labor force, individuals with bachelor's degree or higher education have the highest percentage of unemployment, with 9.7% or 28 of them being unemployed.
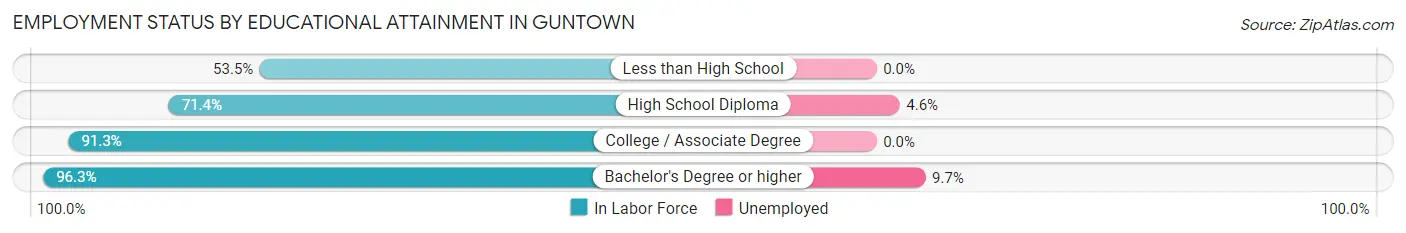
| Educational Attainment | In Labor Force | Unemployed |
| Less than High School | 38 (53.5%) | 0 (0.0%) |
| High School Diploma | 305 (71.4%) | 20 (4.6%) |
| College / Associate Degree | 336 (91.3%) | 0 (0.0%) |
| Bachelor's Degree or higher | 289 (96.3%) | 29 (9.7%) |
| Total | 968 (83.0%) | 50 (4.3%) |
Employment Occupations by Sex in Guntown
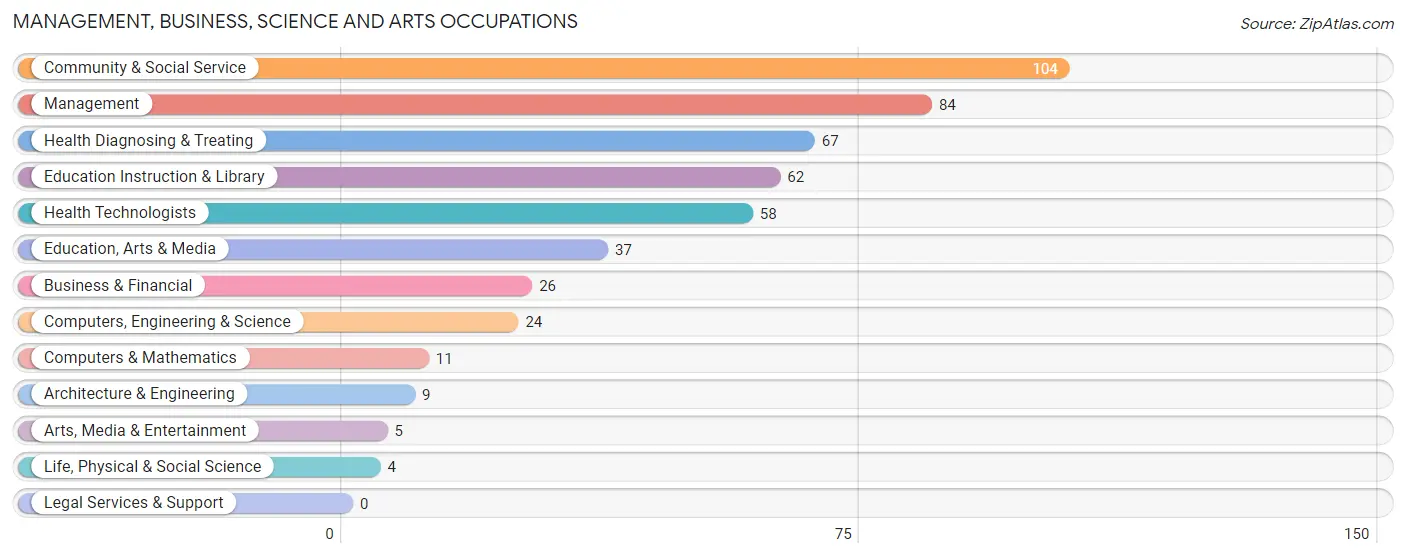
Management, Business, Science and Arts Occupations
The most common Management, Business, Science and Arts occupations in Guntown are Community & Social Service (104 | 9.9%), Management (84 | 8.0%), Health Diagnosing & Treating (67 | 6.4%), Education Instruction & Library (62 | 5.9%), and Health Technologists (58 | 5.5%).
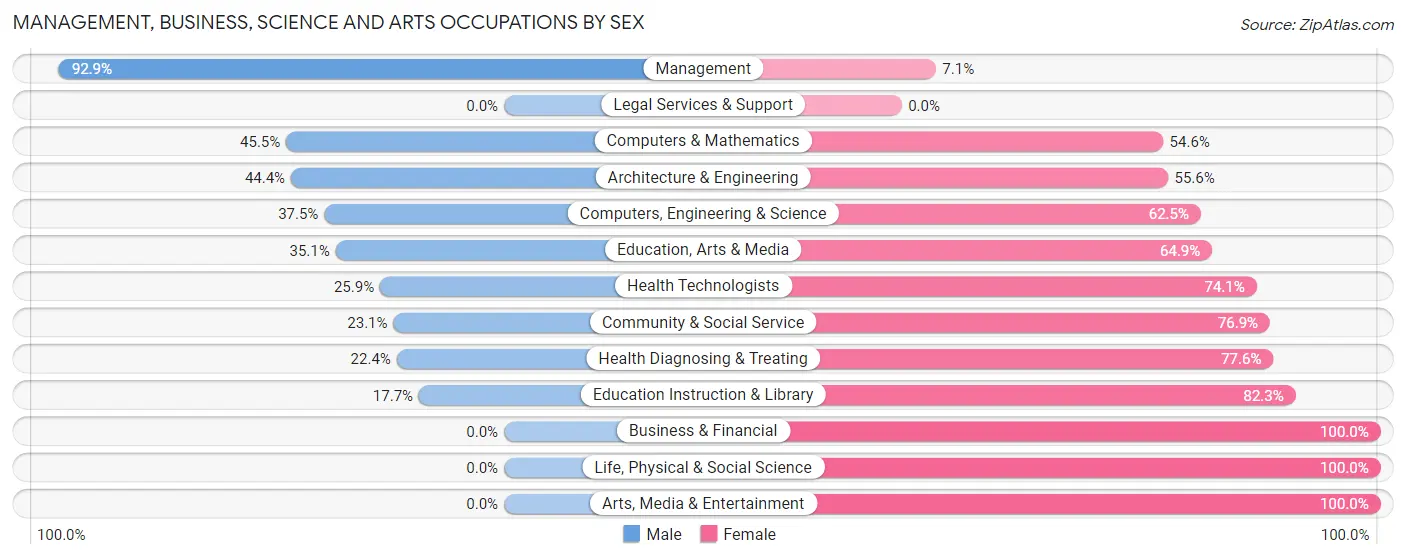
Management, Business, Science and Arts Occupations by Sex
Within the Management, Business, Science and Arts occupations in Guntown, the most male-oriented occupations are Management (92.9%), Computers & Mathematics (45.5%), and Architecture & Engineering (44.4%), while the most female-oriented occupations are Business & Financial (100.0%), Life, Physical & Social Science (100.0%), and Arts, Media & Entertainment (100.0%).
| Occupation | Male | Female |
| Management | 78 (92.9%) | 6 (7.1%) |
| Business & Financial | 0 (0.0%) | 26 (100.0%) |
| Computers, Engineering & Science | 9 (37.5%) | 15 (62.5%) |
| Computers & Mathematics | 5 (45.5%) | 6 (54.5%) |
| Architecture & Engineering | 4 (44.4%) | 5 (55.6%) |
| Life, Physical & Social Science | 0 (0.0%) | 4 (100.0%) |
| Community & Social Service | 24 (23.1%) | 80 (76.9%) |
| Education, Arts & Media | 13 (35.1%) | 24 (64.9%) |
| Legal Services & Support | 0 (0.0%) | 0 (0.0%) |
| Education Instruction & Library | 11 (17.7%) | 51 (82.3%) |
| Arts, Media & Entertainment | 0 (0.0%) | 5 (100.0%) |
| Health Diagnosing & Treating | 15 (22.4%) | 52 (77.6%) |
| Health Technologists | 15 (25.9%) | 43 (74.1%) |
| Total (Category) | 126 (41.3%) | 179 (58.7%) |
| Total (Overall) | 514 (48.9%) | 537 (51.1%) |
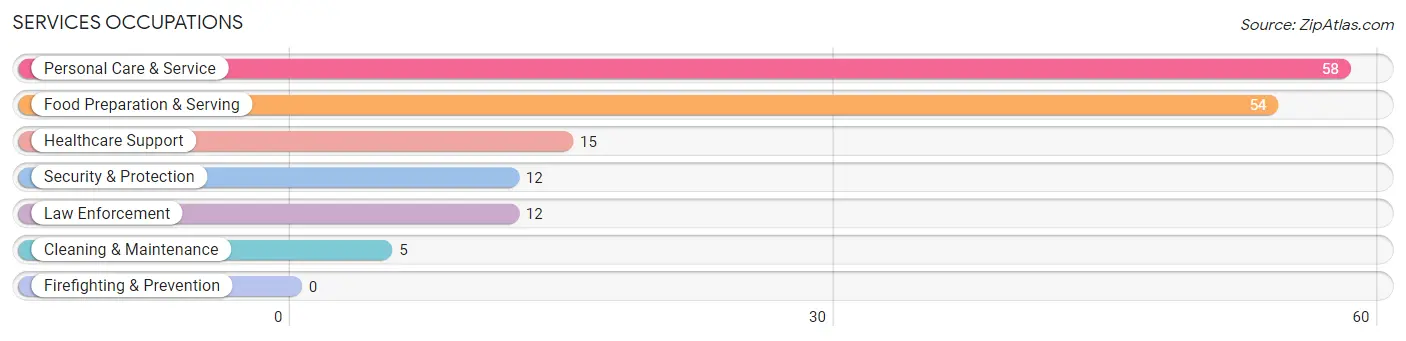
Services Occupations
The most common Services occupations in Guntown are Personal Care & Service (58 | 5.5%), Food Preparation & Serving (54 | 5.1%), Healthcare Support (15 | 1.4%), Security & Protection (12 | 1.1%), and Law Enforcement (12 | 1.1%).
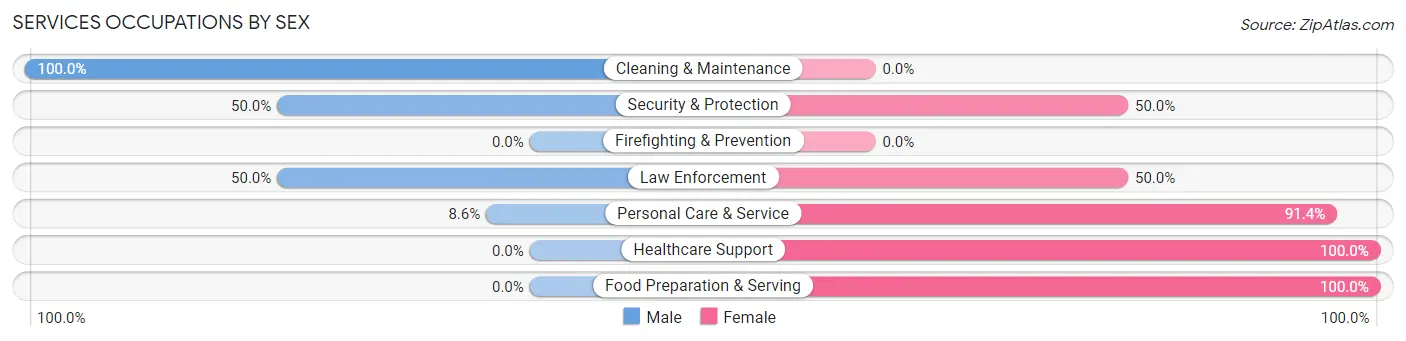
Services Occupations by Sex
Within the Services occupations in Guntown, the most male-oriented occupations are Cleaning & Maintenance (100.0%), Security & Protection (50.0%), and Law Enforcement (50.0%), while the most female-oriented occupations are Healthcare Support (100.0%), Food Preparation & Serving (100.0%), and Personal Care & Service (91.4%).
| Occupation | Male | Female |
| Healthcare Support | 0 (0.0%) | 15 (100.0%) |
| Security & Protection | 6 (50.0%) | 6 (50.0%) |
| Firefighting & Prevention | 0 (0.0%) | 0 (0.0%) |
| Law Enforcement | 6 (50.0%) | 6 (50.0%) |
| Food Preparation & Serving | 0 (0.0%) | 54 (100.0%) |
| Cleaning & Maintenance | 5 (100.0%) | 0 (0.0%) |
| Personal Care & Service | 5 (8.6%) | 53 (91.4%) |
| Total (Category) | 16 (11.1%) | 128 (88.9%) |
| Total (Overall) | 514 (48.9%) | 537 (51.1%) |
Sales and Office Occupations
The most common Sales and Office occupations in Guntown are Sales & Related (159 | 15.1%), and Office & Administration (91 | 8.7%).
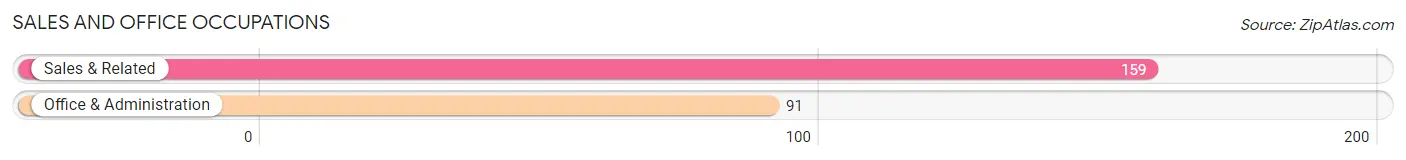
Sales and Office Occupations by Sex
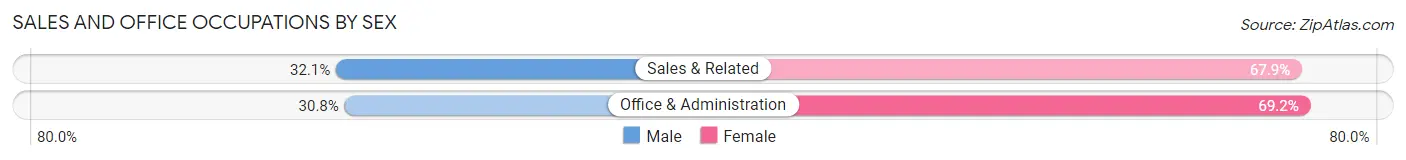
| Occupation | Male | Female |
| Sales & Related | 51 (32.1%) | 108 (67.9%) |
| Office & Administration | 28 (30.8%) | 63 (69.2%) |
| Total (Category) | 79 (31.6%) | 171 (68.4%) |
| Total (Overall) | 514 (48.9%) | 537 (51.1%) |
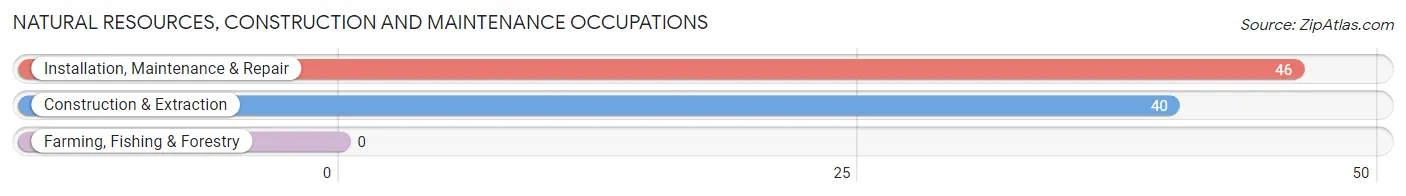
Natural Resources, Construction and Maintenance Occupations
The most common Natural Resources, Construction and Maintenance occupations in Guntown are Installation, Maintenance & Repair (46 | 4.4%), and Construction & Extraction (40 | 3.8%).
Natural Resources, Construction and Maintenance Occupations by Sex
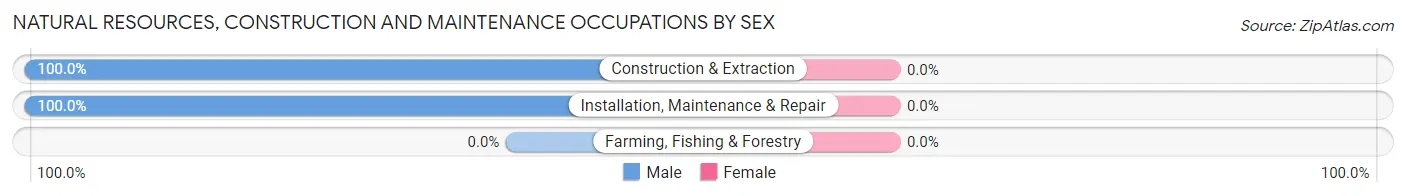
| Occupation | Male | Female |
| Farming, Fishing & Forestry | 0 (0.0%) | 0 (0.0%) |
| Construction & Extraction | 40 (100.0%) | 0 (0.0%) |
| Installation, Maintenance & Repair | 46 (100.0%) | 0 (0.0%) |
| Total (Category) | 86 (100.0%) | 0 (0.0%) |
| Total (Overall) | 514 (48.9%) | 537 (51.1%) |
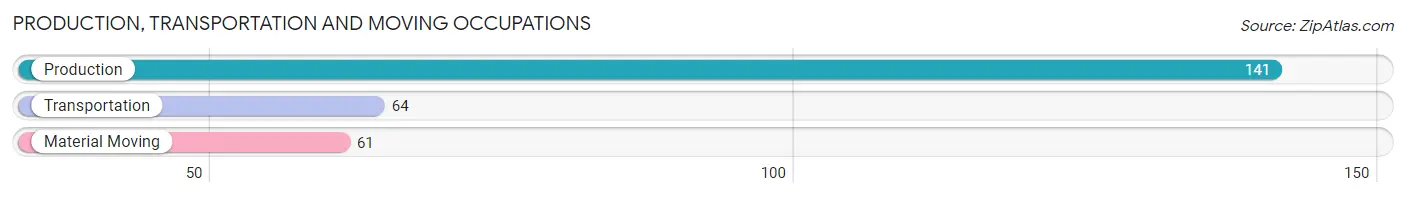
Production, Transportation and Moving Occupations
The most common Production, Transportation and Moving occupations in Guntown are Production (141 | 13.4%), Transportation (64 | 6.1%), and Material Moving (61 | 5.8%).
Production, Transportation and Moving Occupations by Sex
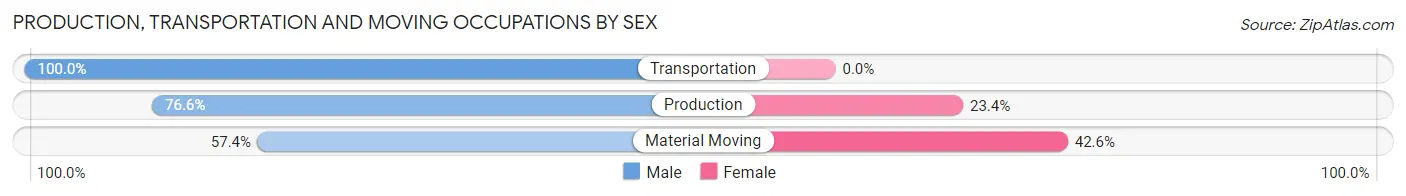
| Occupation | Male | Female |
| Production | 108 (76.6%) | 33 (23.4%) |
| Transportation | 64 (100.0%) | 0 (0.0%) |
| Material Moving | 35 (57.4%) | 26 (42.6%) |
| Total (Category) | 207 (77.8%) | 59 (22.2%) |
| Total (Overall) | 514 (48.9%) | 537 (51.1%) |
Employment Industries by Sex in Guntown
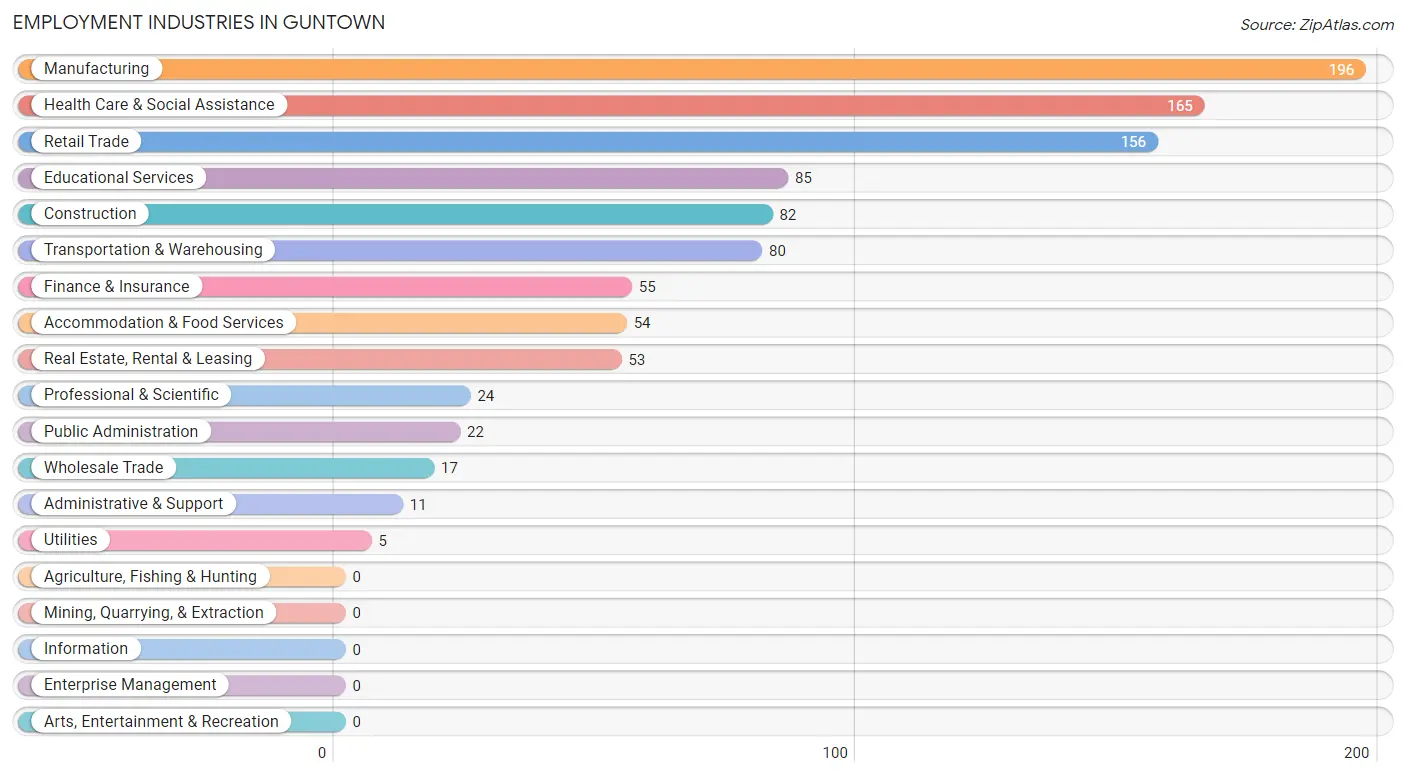
Employment Industries in Guntown
The major employment industries in Guntown include Manufacturing (196 | 18.6%), Health Care & Social Assistance (165 | 15.7%), Retail Trade (156 | 14.8%), Educational Services (85 | 8.1%), and Construction (82 | 7.8%).
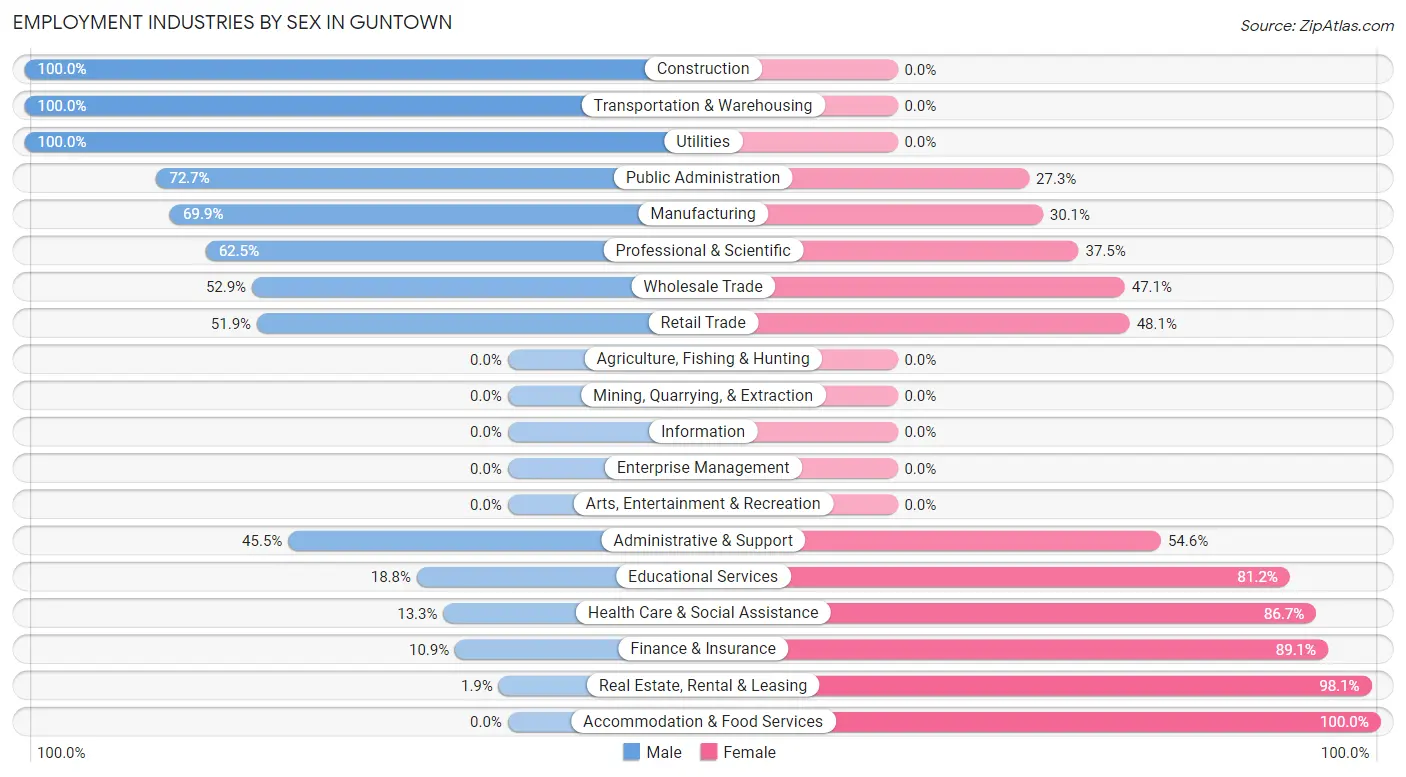
Employment Industries by Sex in Guntown
The Guntown industries that see more men than women are Construction (100.0%), Transportation & Warehousing (100.0%), and Utilities (100.0%), whereas the industries that tend to have a higher number of women are Accommodation & Food Services (100.0%), Real Estate, Rental & Leasing (98.1%), and Finance & Insurance (89.1%).
| Industry | Male | Female |
| Agriculture, Fishing & Hunting | 0 (0.0%) | 0 (0.0%) |
| Mining, Quarrying, & Extraction | 0 (0.0%) | 0 (0.0%) |
| Construction | 82 (100.0%) | 0 (0.0%) |
| Manufacturing | 137 (69.9%) | 59 (30.1%) |
| Wholesale Trade | 9 (52.9%) | 8 (47.1%) |
| Retail Trade | 81 (51.9%) | 75 (48.1%) |
| Transportation & Warehousing | 80 (100.0%) | 0 (0.0%) |
| Utilities | 5 (100.0%) | 0 (0.0%) |
| Information | 0 (0.0%) | 0 (0.0%) |
| Finance & Insurance | 6 (10.9%) | 49 (89.1%) |
| Real Estate, Rental & Leasing | 1 (1.9%) | 52 (98.1%) |
| Professional & Scientific | 15 (62.5%) | 9 (37.5%) |
| Enterprise Management | 0 (0.0%) | 0 (0.0%) |
| Administrative & Support | 5 (45.5%) | 6 (54.5%) |
| Educational Services | 16 (18.8%) | 69 (81.2%) |
| Health Care & Social Assistance | 22 (13.3%) | 143 (86.7%) |
| Arts, Entertainment & Recreation | 0 (0.0%) | 0 (0.0%) |
| Accommodation & Food Services | 0 (0.0%) | 54 (100.0%) |
| Public Administration | 16 (72.7%) | 6 (27.3%) |
| Total | 514 (48.9%) | 537 (51.1%) |
Education in Guntown
School Enrollment in Guntown
The most common levels of schooling among the 733 students in Guntown are elementary school (247 | 33.7%), middle school (158 | 21.6%), and high school (148 | 20.2%).
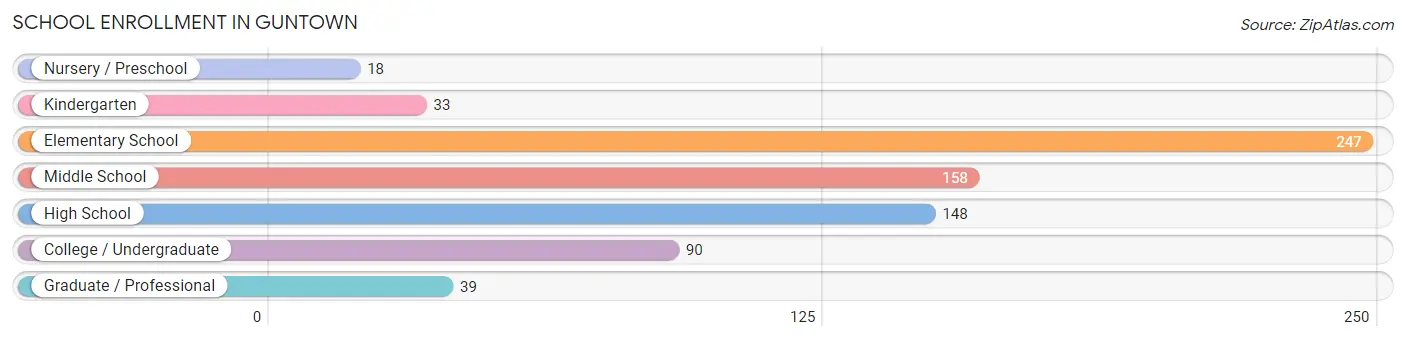
| School Level | # Students | % Students |
| Nursery / Preschool | 18 | 2.5% |
| Kindergarten | 33 | 4.5% |
| Elementary School | 247 | 33.7% |
| Middle School | 158 | 21.6% |
| High School | 148 | 20.2% |
| College / Undergraduate | 90 | 12.3% |
| Graduate / Professional | 39 | 5.3% |
| Total | 733 | 100.0% |
School Enrollment by Age by Funding Source in Guntown
Out of a total of 733 students who are enrolled in schools in Guntown, 50 (6.8%) attend a private institution, while the remaining 683 (93.2%) are enrolled in public schools. The age group of 18 to 19 year olds has the highest likelihood of being enrolled in private schools, with 5 (21.7% in the age bracket) enrolled. Conversely, the age group of 10 to 14 year olds has the lowest likelihood of being enrolled in a private school, with 212 (100.0% in the age bracket) attending a public institution.
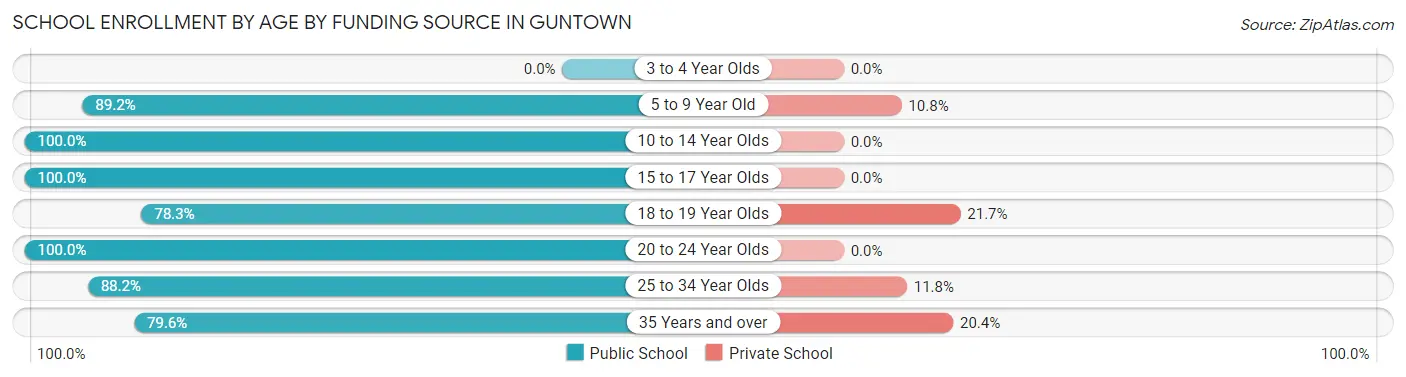
| Age Bracket | Public School | Private School |
| 3 to 4 Year Olds | 0 (0.0%) | 0 (0.0%) |
| 5 to 9 Year Old | 232 (89.2%) | 28 (10.8%) |
| 10 to 14 Year Olds | 212 (100.0%) | 0 (0.0%) |
| 15 to 17 Year Olds | 123 (100.0%) | 0 (0.0%) |
| 18 to 19 Year Olds | 18 (78.3%) | 5 (21.7%) |
| 20 to 24 Year Olds | 10 (100.0%) | 0 (0.0%) |
| 25 to 34 Year Olds | 45 (88.2%) | 6 (11.8%) |
| 35 Years and over | 43 (79.6%) | 11 (20.4%) |
| Total | 683 (93.2%) | 50 (6.8%) |
Educational Attainment by Field of Study in Guntown
Science & technology (87 | 23.2%), education (80 | 21.3%), business (66 | 17.6%), liberal arts & history (28 | 7.5%), and psychology (27 | 7.2%) are the most common fields of study among 375 individuals in Guntown who have obtained a bachelor's degree or higher.
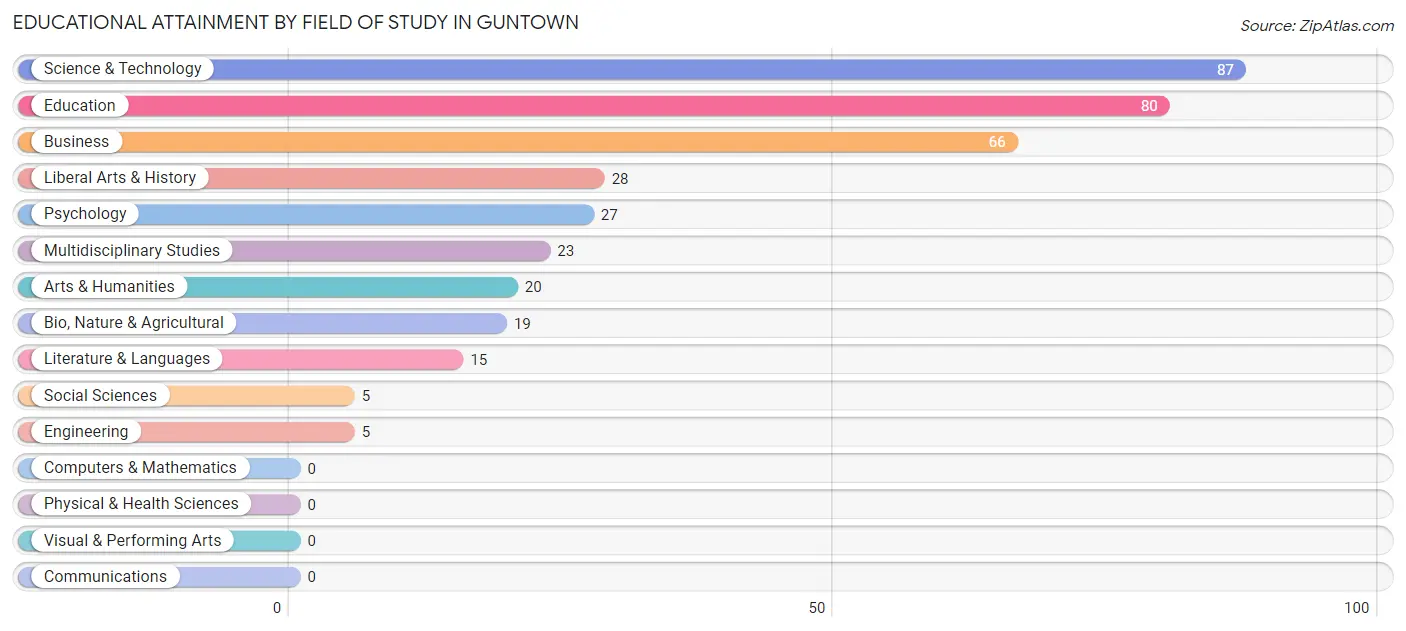
| Field of Study | # Graduates | % Graduates |
| Computers & Mathematics | 0 | 0.0% |
| Bio, Nature & Agricultural | 19 | 5.1% |
| Physical & Health Sciences | 0 | 0.0% |
| Psychology | 27 | 7.2% |
| Social Sciences | 5 | 1.3% |
| Engineering | 5 | 1.3% |
| Multidisciplinary Studies | 23 | 6.1% |
| Science & Technology | 87 | 23.2% |
| Business | 66 | 17.6% |
| Education | 80 | 21.3% |
| Literature & Languages | 15 | 4.0% |
| Liberal Arts & History | 28 | 7.5% |
| Visual & Performing Arts | 0 | 0.0% |
| Communications | 0 | 0.0% |
| Arts & Humanities | 20 | 5.3% |
| Total | 375 | 100.0% |
Transportation & Commute in Guntown
Vehicle Availability by Sex in Guntown
The most prevalent vehicle ownership categories in Guntown are males with 2 vehicles (342, accounting for 67.1%) and females with 2 vehicles (380, making up 63.7%).
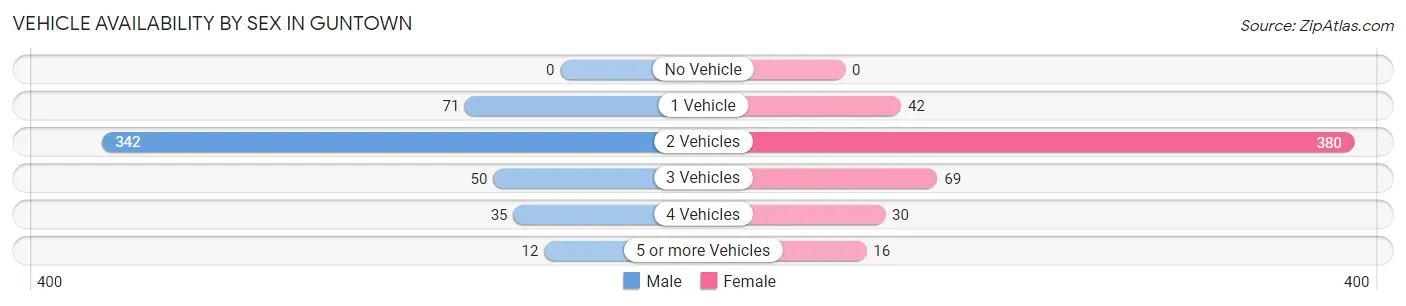
| Vehicles Available | Male | Female |
| No Vehicle | 0 (0.0%) | 0 (0.0%) |
| 1 Vehicle | 71 (13.9%) | 42 (7.8%) |
| 2 Vehicles | 342 (67.1%) | 380 (70.8%) |
| 3 Vehicles | 50 (9.8%) | 69 (12.9%) |
| 4 Vehicles | 35 (6.9%) | 30 (5.6%) |
| 5 or more Vehicles | 12 (2.4%) | 16 (3.0%) |
| Total | 510 (100.0%) | 537 (100.0%) |
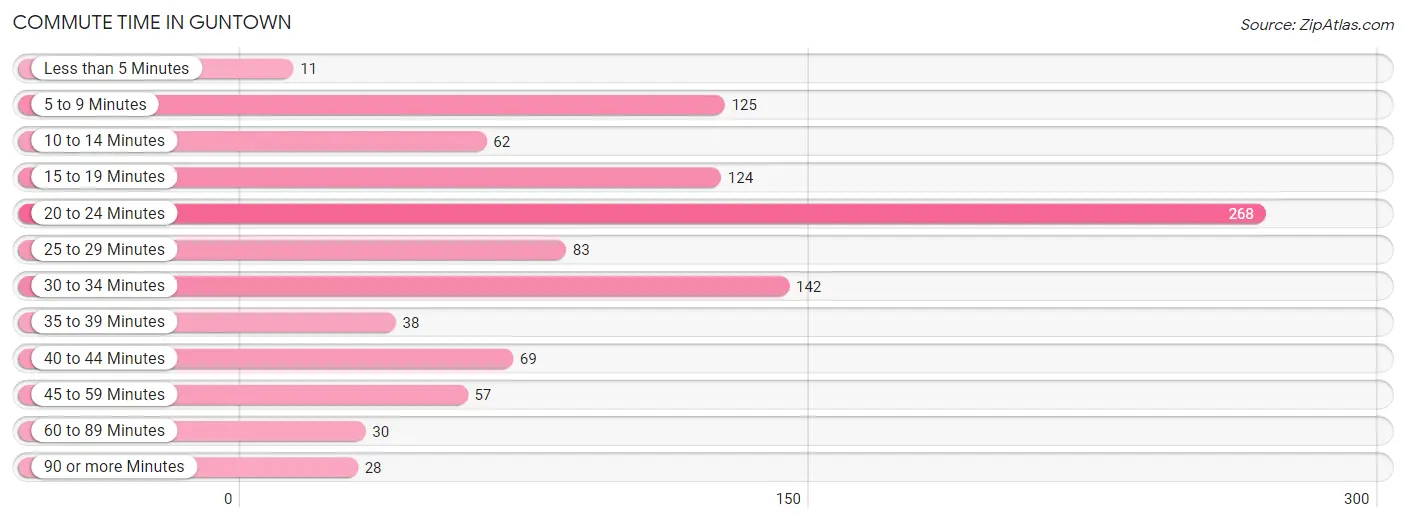
Commute Time in Guntown
The most frequently occuring commute durations in Guntown are 20 to 24 minutes (268 commuters, 25.8%), 30 to 34 minutes (142 commuters, 13.7%), and 5 to 9 minutes (125 commuters, 12.0%).
| Commute Time | # Commuters | % Commuters |
| Less than 5 Minutes | 11 | 1.1% |
| 5 to 9 Minutes | 125 | 12.0% |
| 10 to 14 Minutes | 62 | 6.0% |
| 15 to 19 Minutes | 124 | 12.0% |
| 20 to 24 Minutes | 268 | 25.8% |
| 25 to 29 Minutes | 83 | 8.0% |
| 30 to 34 Minutes | 142 | 13.7% |
| 35 to 39 Minutes | 38 | 3.7% |
| 40 to 44 Minutes | 69 | 6.7% |
| 45 to 59 Minutes | 57 | 5.5% |
| 60 to 89 Minutes | 30 | 2.9% |
| 90 or more Minutes | 28 | 2.7% |
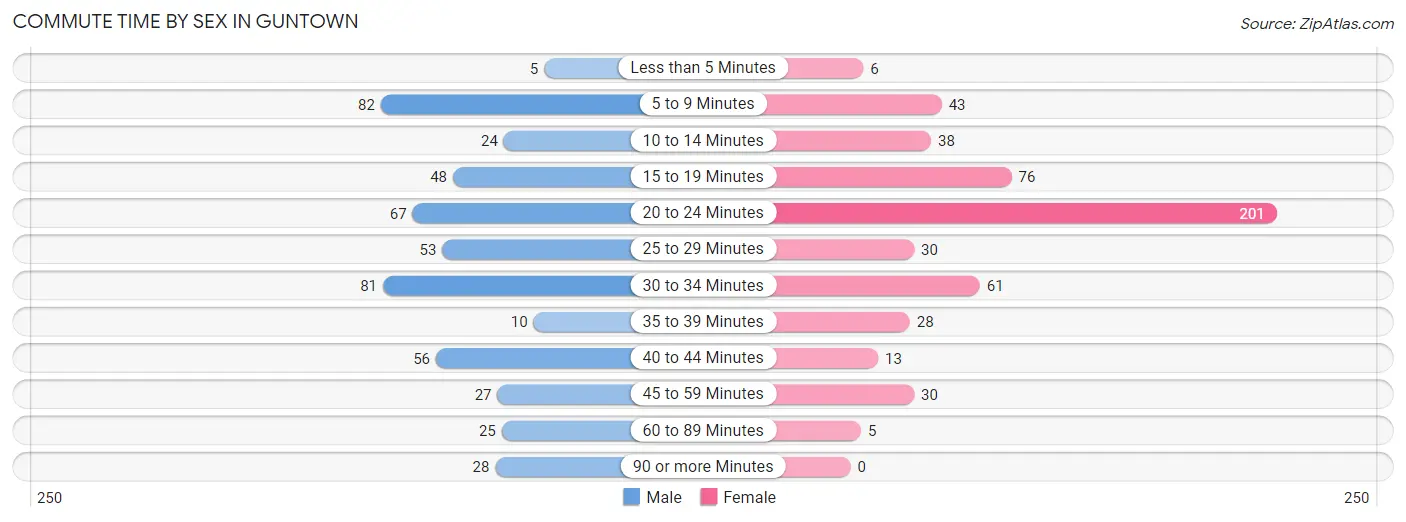
Commute Time by Sex in Guntown
The most common commute times in Guntown are 5 to 9 minutes (82 commuters, 16.2%) for males and 20 to 24 minutes (201 commuters, 37.9%) for females.
| Commute Time | Male | Female |
| Less than 5 Minutes | 5 (1.0%) | 6 (1.1%) |
| 5 to 9 Minutes | 82 (16.2%) | 43 (8.1%) |
| 10 to 14 Minutes | 24 (4.7%) | 38 (7.2%) |
| 15 to 19 Minutes | 48 (9.5%) | 76 (14.3%) |
| 20 to 24 Minutes | 67 (13.2%) | 201 (37.9%) |
| 25 to 29 Minutes | 53 (10.5%) | 30 (5.7%) |
| 30 to 34 Minutes | 81 (16.0%) | 61 (11.5%) |
| 35 to 39 Minutes | 10 (2.0%) | 28 (5.3%) |
| 40 to 44 Minutes | 56 (11.1%) | 13 (2.5%) |
| 45 to 59 Minutes | 27 (5.3%) | 30 (5.7%) |
| 60 to 89 Minutes | 25 (4.9%) | 5 (0.9%) |
| 90 or more Minutes | 28 (5.5%) | 0 (0.0%) |
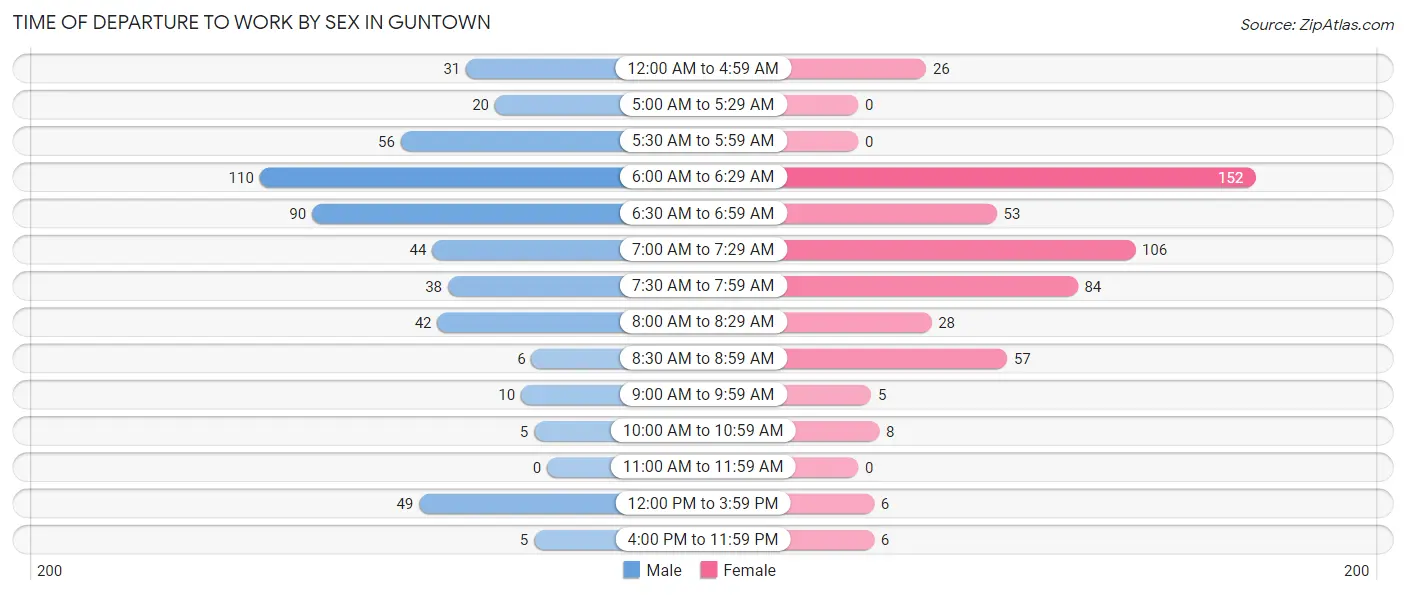
Time of Departure to Work by Sex in Guntown
The most frequent times of departure to work in Guntown are 6:00 AM to 6:29 AM (110, 21.7%) for males and 6:00 AM to 6:29 AM (152, 28.6%) for females.
| Time of Departure | Male | Female |
| 12:00 AM to 4:59 AM | 31 (6.1%) | 26 (4.9%) |
| 5:00 AM to 5:29 AM | 20 (4.0%) | 0 (0.0%) |
| 5:30 AM to 5:59 AM | 56 (11.1%) | 0 (0.0%) |
| 6:00 AM to 6:29 AM | 110 (21.7%) | 152 (28.6%) |
| 6:30 AM to 6:59 AM | 90 (17.8%) | 53 (10.0%) |
| 7:00 AM to 7:29 AM | 44 (8.7%) | 106 (20.0%) |
| 7:30 AM to 7:59 AM | 38 (7.5%) | 84 (15.8%) |
| 8:00 AM to 8:29 AM | 42 (8.3%) | 28 (5.3%) |
| 8:30 AM to 8:59 AM | 6 (1.2%) | 57 (10.7%) |
| 9:00 AM to 9:59 AM | 10 (2.0%) | 5 (0.9%) |
| 10:00 AM to 10:59 AM | 5 (1.0%) | 8 (1.5%) |
| 11:00 AM to 11:59 AM | 0 (0.0%) | 0 (0.0%) |
| 12:00 PM to 3:59 PM | 49 (9.7%) | 6 (1.1%) |
| 4:00 PM to 11:59 PM | 5 (1.0%) | 6 (1.1%) |
| Total | 506 (100.0%) | 531 (100.0%) |
Housing Occupancy in Guntown
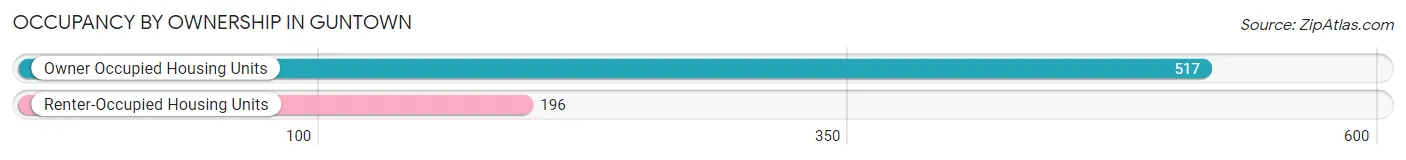
Occupancy by Ownership in Guntown
Of the total 713 dwellings in Guntown, owner-occupied units account for 517 (72.5%), while renter-occupied units make up 196 (27.5%).
| Occupancy | # Housing Units | % Housing Units |
| Owner Occupied Housing Units | 517 | 72.5% |
| Renter-Occupied Housing Units | 196 | 27.5% |
| Total Occupied Housing Units | 713 | 100.0% |
Occupancy by Household Size in Guntown
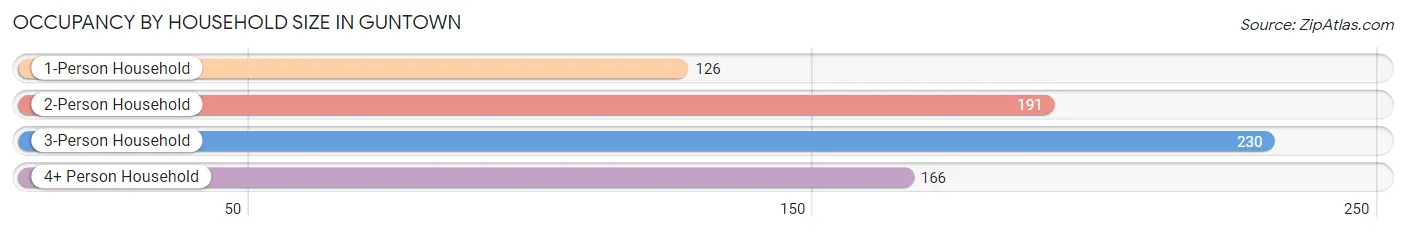
| Household Size | # Housing Units | % Housing Units |
| 1-Person Household | 126 | 17.7% |
| 2-Person Household | 191 | 26.8% |
| 3-Person Household | 230 | 32.3% |
| 4+ Person Household | 166 | 23.3% |
| Total Housing Units | 713 | 100.0% |
Occupancy by Ownership by Household Size in Guntown
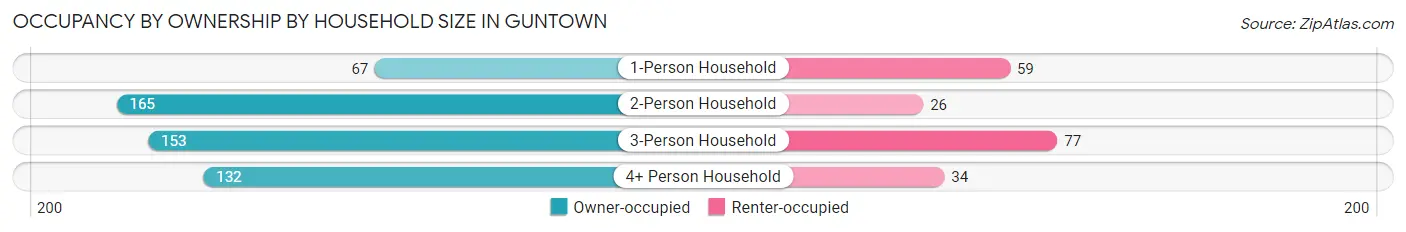
| Household Size | Owner-occupied | Renter-occupied |
| 1-Person Household | 67 (53.2%) | 59 (46.8%) |
| 2-Person Household | 165 (86.4%) | 26 (13.6%) |
| 3-Person Household | 153 (66.5%) | 77 (33.5%) |
| 4+ Person Household | 132 (79.5%) | 34 (20.5%) |
| Total Housing Units | 517 (72.5%) | 196 (27.5%) |
Occupancy by Educational Attainment in Guntown
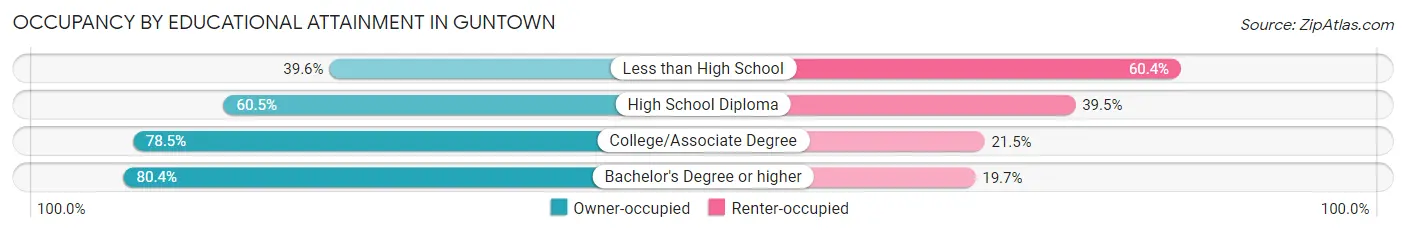
| Household Size | Owner-occupied | Renter-occupied |
| Less than High School | 19 (39.6%) | 29 (60.4%) |
| High School Diploma | 92 (60.5%) | 60 (39.5%) |
| College/Associate Degree | 267 (78.5%) | 73 (21.5%) |
| Bachelor's Degree or higher | 139 (80.3%) | 34 (19.7%) |
Occupancy by Age of Householder in Guntown
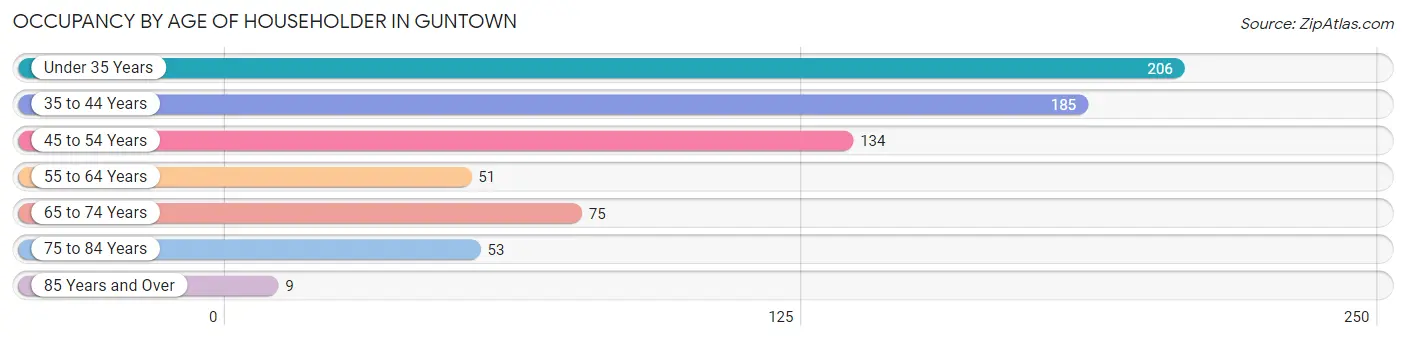
| Age Bracket | # Households | % Households |
| Under 35 Years | 206 | 28.9% |
| 35 to 44 Years | 185 | 26.0% |
| 45 to 54 Years | 134 | 18.8% |
| 55 to 64 Years | 51 | 7.1% |
| 65 to 74 Years | 75 | 10.5% |
| 75 to 84 Years | 53 | 7.4% |
| 85 Years and Over | 9 | 1.3% |
| Total | 713 | 100.0% |
Housing Finances in Guntown
Median Income by Occupancy in Guntown
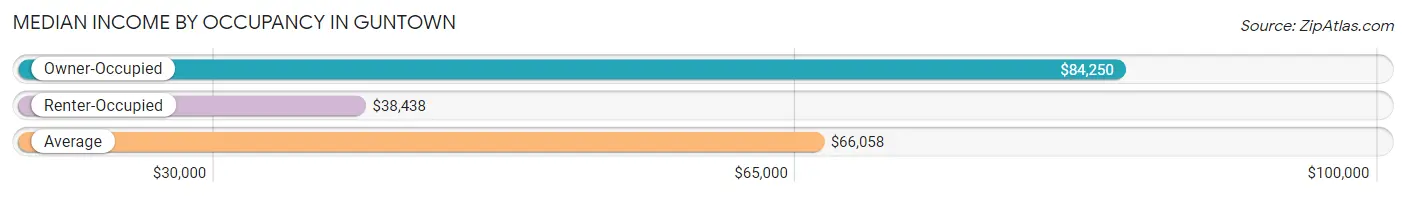
| Occupancy Type | # Households | Median Income |
| Owner-Occupied | 517 (72.5%) | $84,250 |
| Renter-Occupied | 196 (27.5%) | $38,438 |
| Average | 713 (100.0%) | $66,058 |
Occupancy by Householder Income Bracket in Guntown
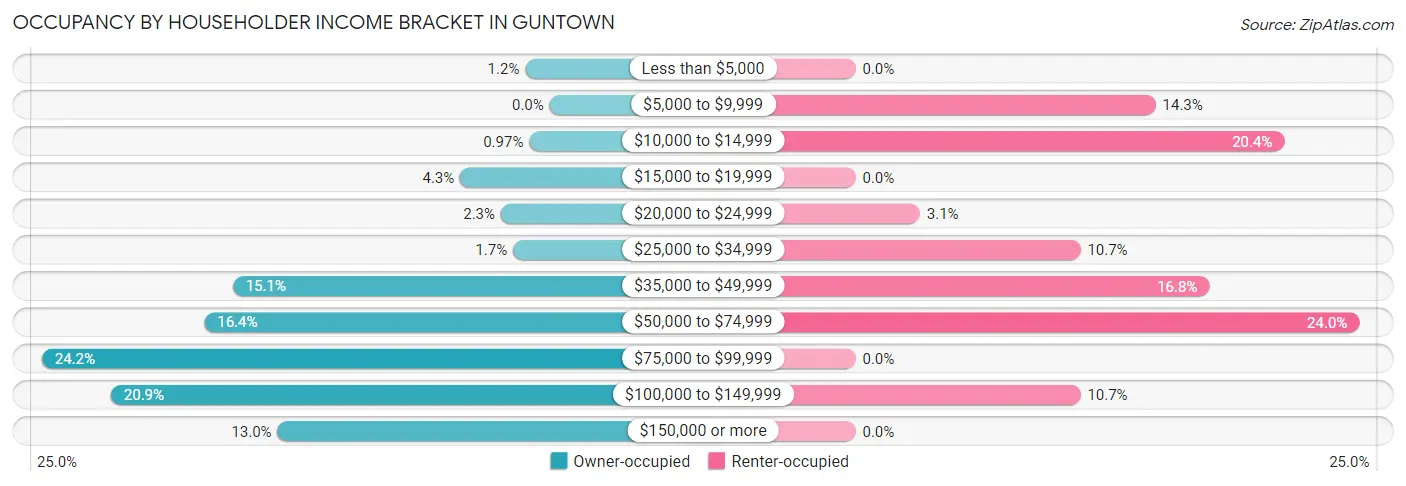
| Income Bracket | Owner-occupied | Renter-occupied |
| Less than $5,000 | 6 (1.2%) | 0 (0.0%) |
| $5,000 to $9,999 | 0 (0.0%) | 28 (14.3%) |
| $10,000 to $14,999 | 5 (1.0%) | 40 (20.4%) |
| $15,000 to $19,999 | 22 (4.3%) | 0 (0.0%) |
| $20,000 to $24,999 | 12 (2.3%) | 6 (3.1%) |
| $25,000 to $34,999 | 9 (1.7%) | 21 (10.7%) |
| $35,000 to $49,999 | 78 (15.1%) | 33 (16.8%) |
| $50,000 to $74,999 | 85 (16.4%) | 47 (24.0%) |
| $75,000 to $99,999 | 125 (24.2%) | 0 (0.0%) |
| $100,000 to $149,999 | 108 (20.9%) | 21 (10.7%) |
| $150,000 or more | 67 (13.0%) | 0 (0.0%) |
| Total | 517 (100.0%) | 196 (100.0%) |
Monthly Housing Cost Tiers in Guntown
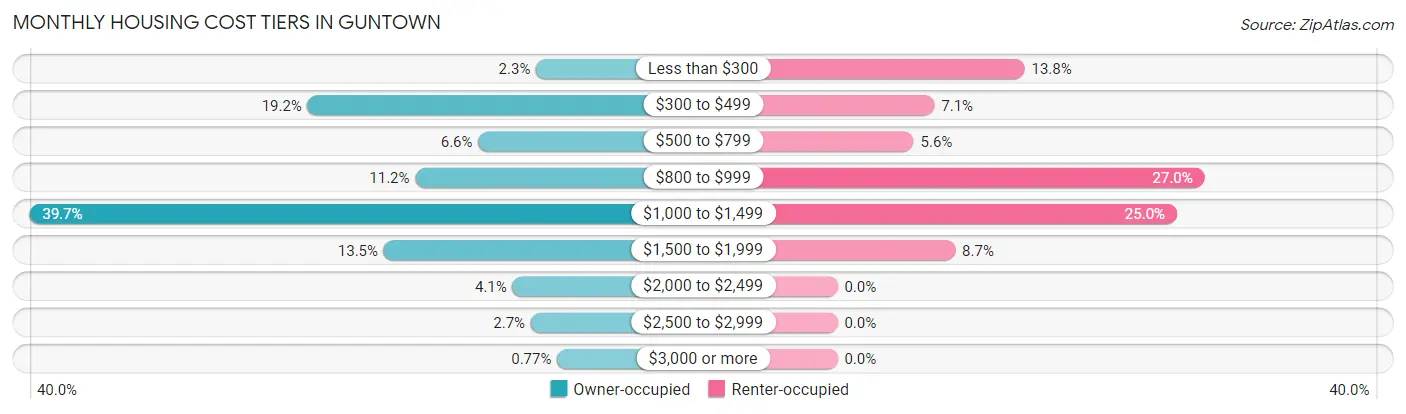
| Monthly Cost | Owner-occupied | Renter-occupied |
| Less than $300 | 12 (2.3%) | 27 (13.8%) |
| $300 to $499 | 99 (19.2%) | 14 (7.1%) |
| $500 to $799 | 34 (6.6%) | 11 (5.6%) |
| $800 to $999 | 58 (11.2%) | 53 (27.0%) |
| $1,000 to $1,499 | 205 (39.7%) | 49 (25.0%) |
| $1,500 to $1,999 | 70 (13.5%) | 17 (8.7%) |
| $2,000 to $2,499 | 21 (4.1%) | 0 (0.0%) |
| $2,500 to $2,999 | 14 (2.7%) | 0 (0.0%) |
| $3,000 or more | 4 (0.8%) | 0 (0.0%) |
| Total | 517 (100.0%) | 196 (100.0%) |
Physical Housing Characteristics in Guntown
Housing Structures in Guntown
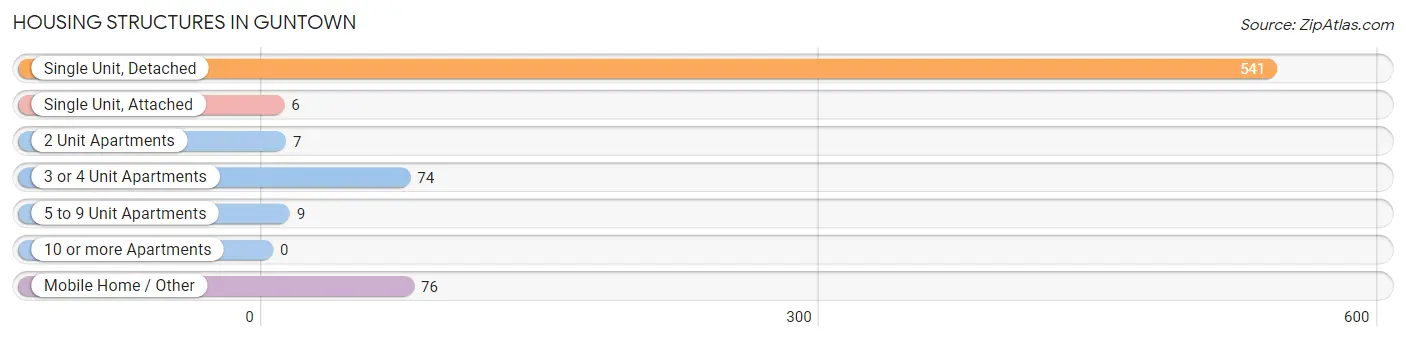
| Structure Type | # Housing Units | % Housing Units |
| Single Unit, Detached | 541 | 75.9% |
| Single Unit, Attached | 6 | 0.8% |
| 2 Unit Apartments | 7 | 1.0% |
| 3 or 4 Unit Apartments | 74 | 10.4% |
| 5 to 9 Unit Apartments | 9 | 1.3% |
| 10 or more Apartments | 0 | 0.0% |
| Mobile Home / Other | 76 | 10.7% |
| Total | 713 | 100.0% |
Housing Structures by Occupancy in Guntown
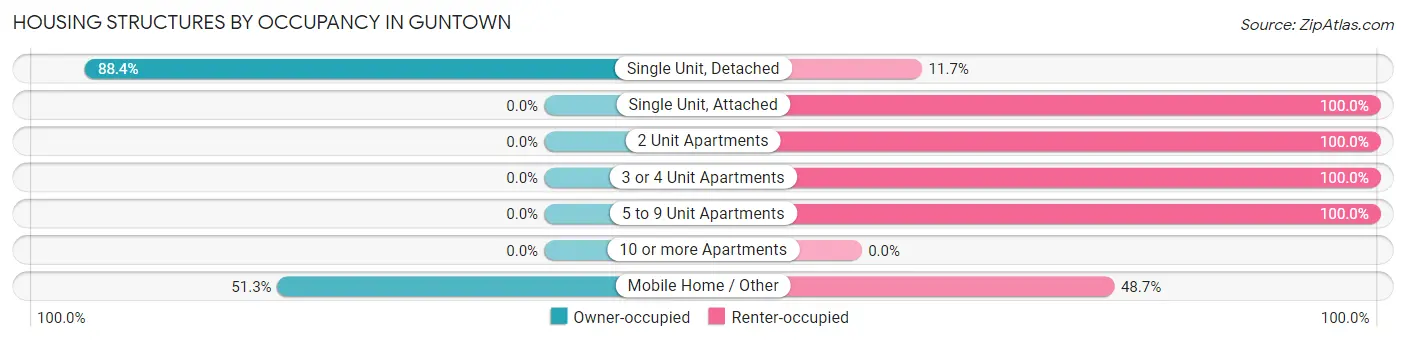
| Structure Type | Owner-occupied | Renter-occupied |
| Single Unit, Detached | 478 (88.3%) | 63 (11.7%) |
| Single Unit, Attached | 0 (0.0%) | 6 (100.0%) |
| 2 Unit Apartments | 0 (0.0%) | 7 (100.0%) |
| 3 or 4 Unit Apartments | 0 (0.0%) | 74 (100.0%) |
| 5 to 9 Unit Apartments | 0 (0.0%) | 9 (100.0%) |
| 10 or more Apartments | 0 (0.0%) | 0 (0.0%) |
| Mobile Home / Other | 39 (51.3%) | 37 (48.7%) |
| Total | 517 (72.5%) | 196 (27.5%) |
Housing Structures by Number of Rooms in Guntown
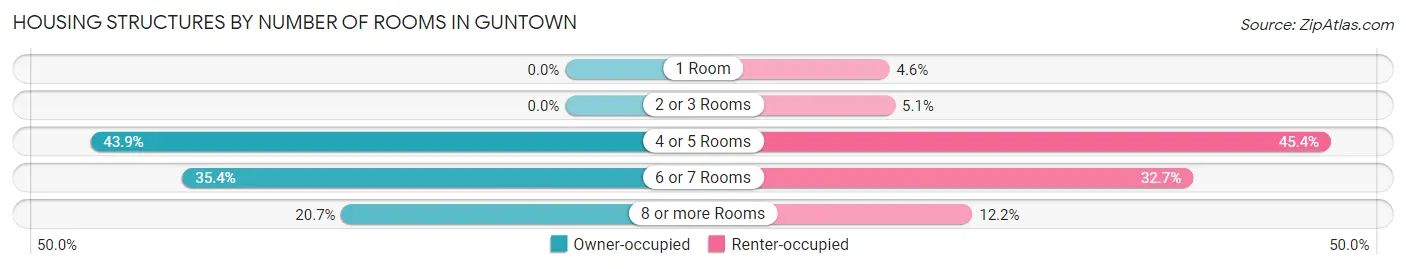
| Number of Rooms | Owner-occupied | Renter-occupied |
| 1 Room | 0 (0.0%) | 9 (4.6%) |
| 2 or 3 Rooms | 0 (0.0%) | 10 (5.1%) |
| 4 or 5 Rooms | 227 (43.9%) | 89 (45.4%) |
| 6 or 7 Rooms | 183 (35.4%) | 64 (32.7%) |
| 8 or more Rooms | 107 (20.7%) | 24 (12.2%) |
| Total | 517 (100.0%) | 196 (100.0%) |
Housing Structure by Heating Type in Guntown
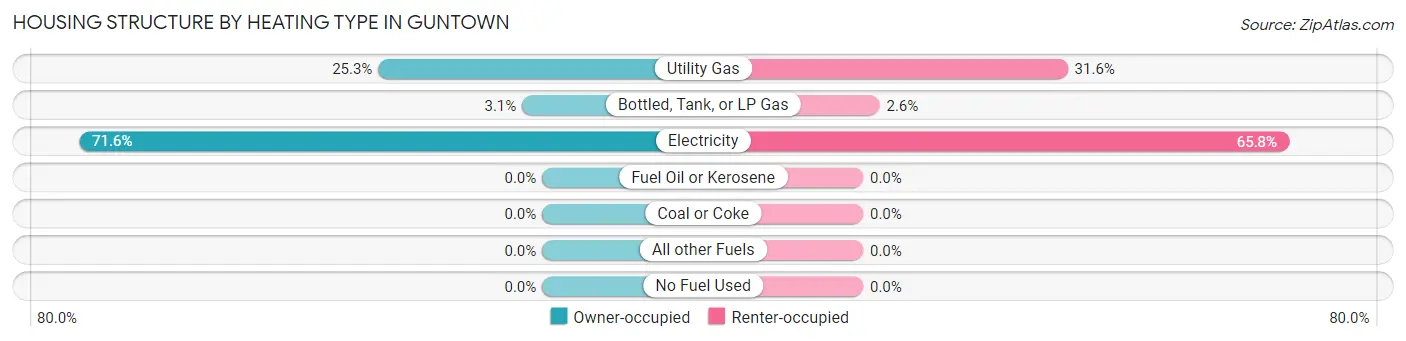
| Heating Type | Owner-occupied | Renter-occupied |
| Utility Gas | 131 (25.3%) | 62 (31.6%) |
| Bottled, Tank, or LP Gas | 16 (3.1%) | 5 (2.5%) |
| Electricity | 370 (71.6%) | 129 (65.8%) |
| Fuel Oil or Kerosene | 0 (0.0%) | 0 (0.0%) |
| Coal or Coke | 0 (0.0%) | 0 (0.0%) |
| All other Fuels | 0 (0.0%) | 0 (0.0%) |
| No Fuel Used | 0 (0.0%) | 0 (0.0%) |
| Total | 517 (100.0%) | 196 (100.0%) |
Household Vehicle Usage in Guntown
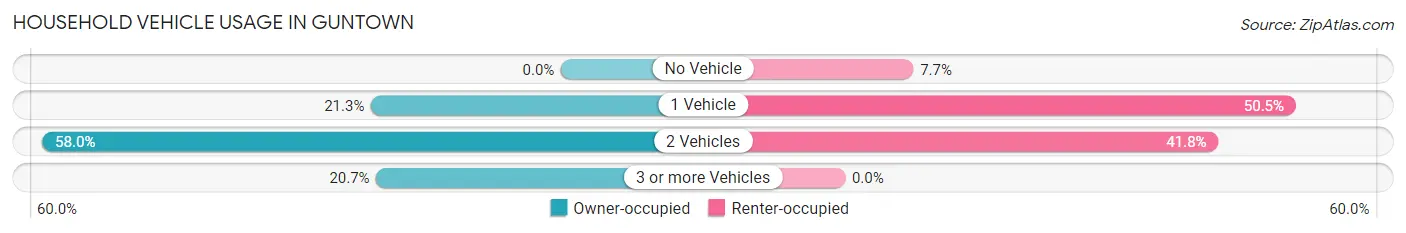
| Vehicles per Household | Owner-occupied | Renter-occupied |
| No Vehicle | 0 (0.0%) | 15 (7.6%) |
| 1 Vehicle | 110 (21.3%) | 99 (50.5%) |
| 2 Vehicles | 300 (58.0%) | 82 (41.8%) |
| 3 or more Vehicles | 107 (20.7%) | 0 (0.0%) |
| Total | 517 (100.0%) | 196 (100.0%) |
Real Estate & Mortgages in Guntown
Real Estate and Mortgage Overview in Guntown
| Characteristic | Without Mortgage | With Mortgage |
| Housing Units | 141 | 376 |
| Median Property Value | $126,900 | $169,900 |
| Median Household Income | $99,688 | $63 |
| Monthly Housing Costs | $395 | $4 |
| Real Estate Taxes | $784 | $23 |
Property Value by Mortgage Status in Guntown
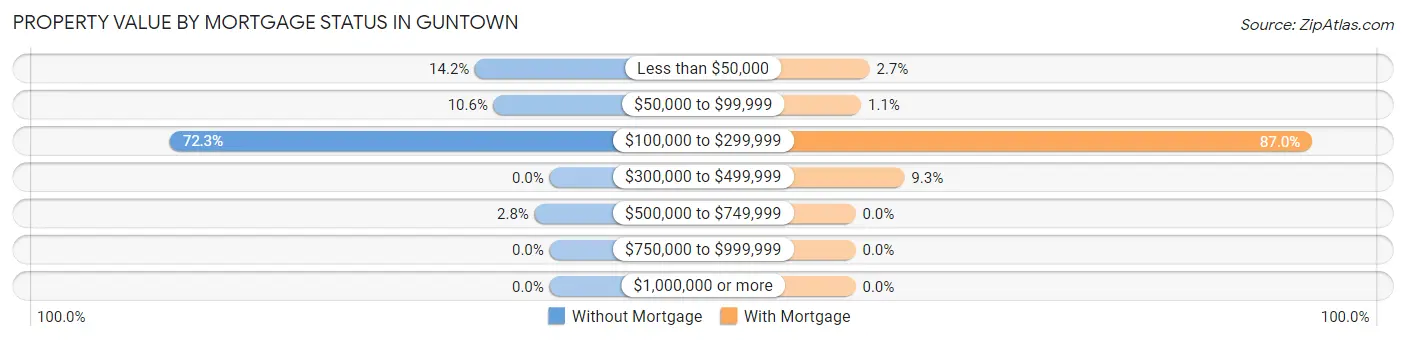
| Property Value | Without Mortgage | With Mortgage |
| Less than $50,000 | 20 (14.2%) | 10 (2.7%) |
| $50,000 to $99,999 | 15 (10.6%) | 4 (1.1%) |
| $100,000 to $299,999 | 102 (72.3%) | 327 (87.0%) |
| $300,000 to $499,999 | 0 (0.0%) | 35 (9.3%) |
| $500,000 to $749,999 | 4 (2.8%) | 0 (0.0%) |
| $750,000 to $999,999 | 0 (0.0%) | 0 (0.0%) |
| $1,000,000 or more | 0 (0.0%) | 0 (0.0%) |
| Total | 141 (100.0%) | 376 (100.0%) |
Household Income by Mortgage Status in Guntown
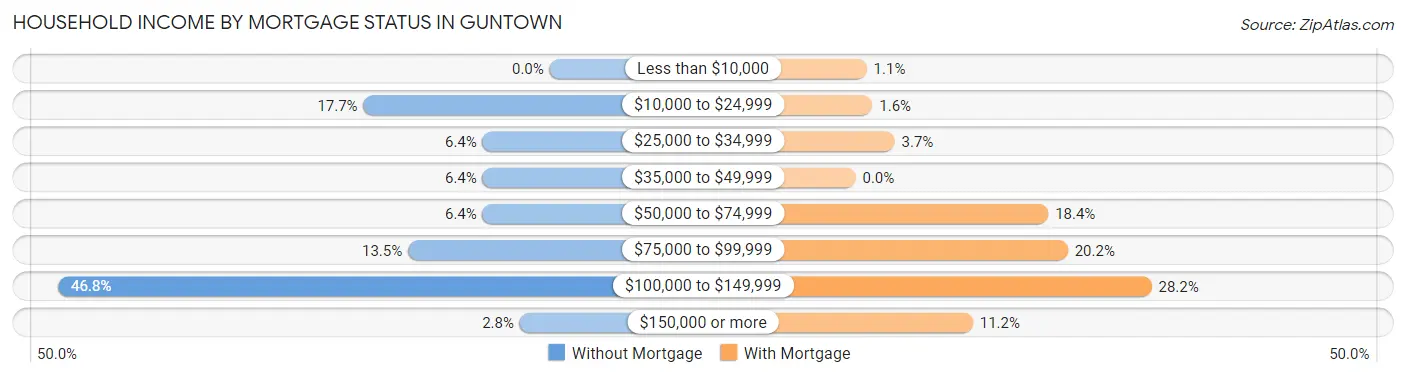
| Household Income | Without Mortgage | With Mortgage |
| Less than $10,000 | 0 (0.0%) | 4 (1.1%) |
| $10,000 to $24,999 | 25 (17.7%) | 6 (1.6%) |
| $25,000 to $34,999 | 9 (6.4%) | 14 (3.7%) |
| $35,000 to $49,999 | 9 (6.4%) | 0 (0.0%) |
| $50,000 to $74,999 | 9 (6.4%) | 69 (18.3%) |
| $75,000 to $99,999 | 19 (13.5%) | 76 (20.2%) |
| $100,000 to $149,999 | 66 (46.8%) | 106 (28.2%) |
| $150,000 or more | 4 (2.8%) | 42 (11.2%) |
| Total | 141 (100.0%) | 376 (100.0%) |
Property Value to Household Income Ratio in Guntown
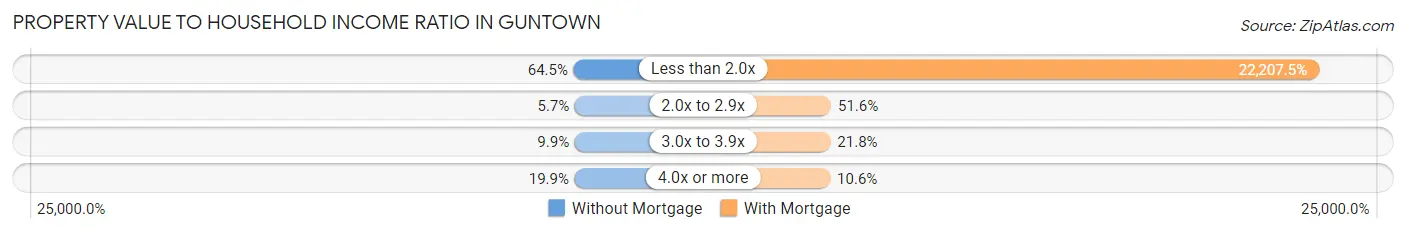
| Value-to-Income Ratio | Without Mortgage | With Mortgage |
| Less than 2.0x | 91 (64.5%) | 83,500 (22,207.5%) |
| 2.0x to 2.9x | 8 (5.7%) | 194 (51.6%) |
| 3.0x to 3.9x | 14 (9.9%) | 82 (21.8%) |
| 4.0x or more | 28 (19.9%) | 40 (10.6%) |
| Total | 141 (100.0%) | 376 (100.0%) |
Real Estate Taxes by Mortgage Status in Guntown
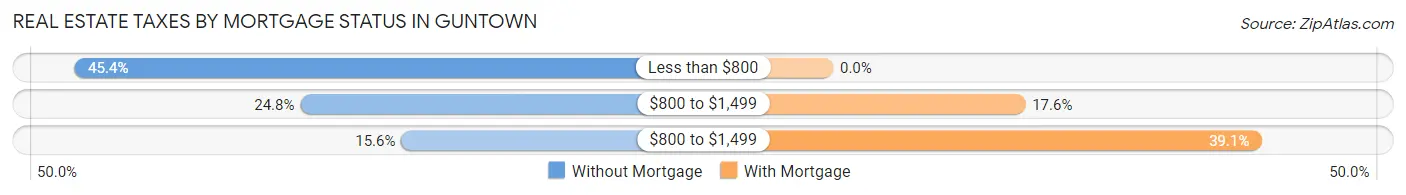
| Property Taxes | Without Mortgage | With Mortgage |
| Less than $800 | 64 (45.4%) | 0 (0.0%) |
| $800 to $1,499 | 35 (24.8%) | 66 (17.5%) |
| $800 to $1,499 | 22 (15.6%) | 147 (39.1%) |
| Total | 141 (100.0%) | 376 (100.0%) |
Health & Disability in Guntown
Health Insurance Coverage by Age in Guntown
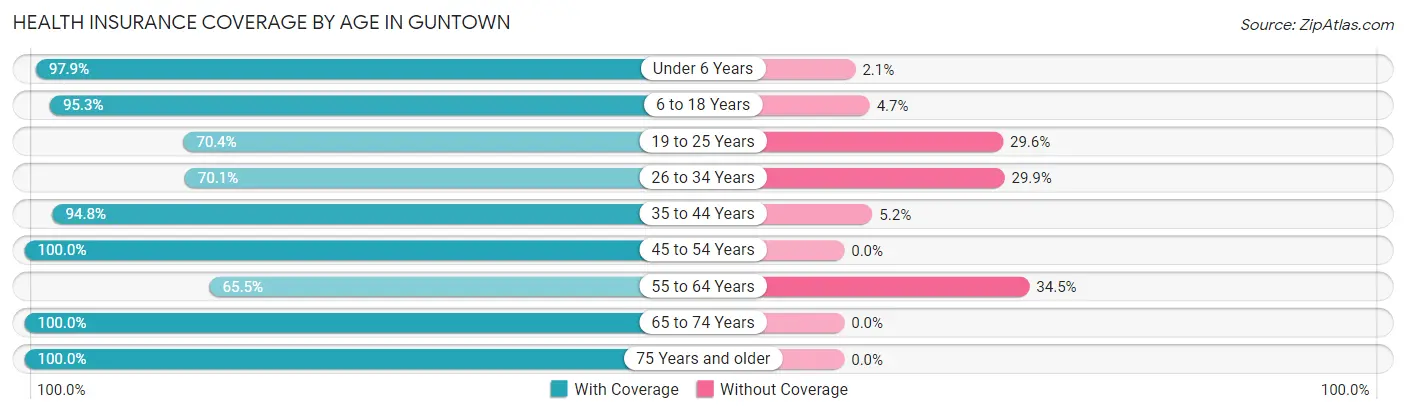
| Age Bracket | With Coverage | Without Coverage |
| Under 6 Years | 187 (97.9%) | 4 (2.1%) |
| 6 to 18 Years | 583 (95.3%) | 29 (4.7%) |
| 19 to 25 Years | 107 (70.4%) | 45 (29.6%) |
| 26 to 34 Years | 258 (70.1%) | 110 (29.9%) |
| 35 to 44 Years | 380 (94.8%) | 21 (5.2%) |
| 45 to 54 Years | 206 (100.0%) | 0 (0.0%) |
| 55 to 64 Years | 110 (65.5%) | 58 (34.5%) |
| 65 to 74 Years | 119 (100.0%) | 0 (0.0%) |
| 75 Years and older | 62 (100.0%) | 0 (0.0%) |
| Total | 2,012 (88.3%) | 267 (11.7%) |
Health Insurance Coverage by Citizenship Status in Guntown
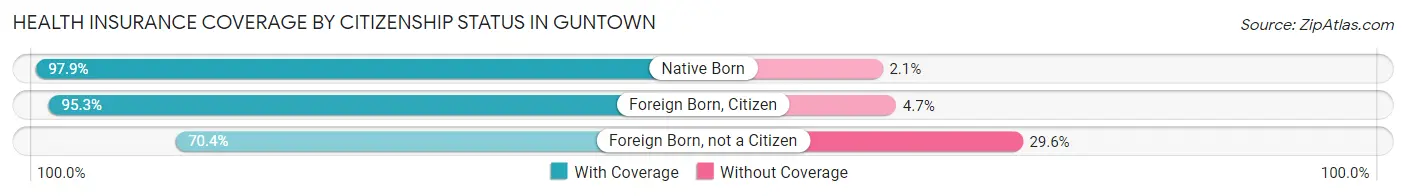
| Citizenship Status | With Coverage | Without Coverage |
| Native Born | 187 (97.9%) | 4 (2.1%) |
| Foreign Born, Citizen | 583 (95.3%) | 29 (4.7%) |
| Foreign Born, not a Citizen | 107 (70.4%) | 45 (29.6%) |
Health Insurance Coverage by Household Income in Guntown
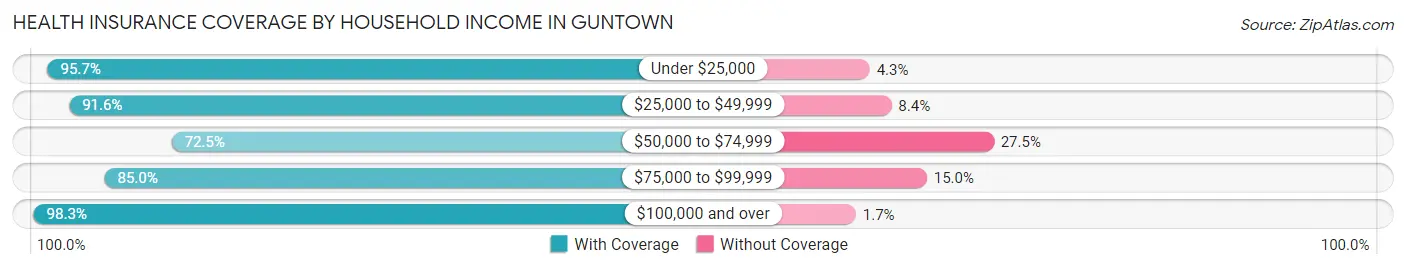
| Household Income | With Coverage | Without Coverage |
| Under $25,000 | 178 (95.7%) | 8 (4.3%) |
| $25,000 to $49,999 | 329 (91.6%) | 30 (8.4%) |
| $50,000 to $74,999 | 408 (72.5%) | 155 (27.5%) |
| $75,000 to $99,999 | 346 (85.0%) | 61 (15.0%) |
| $100,000 and over | 751 (98.3%) | 13 (1.7%) |
Public vs Private Health Insurance Coverage by Age in Guntown
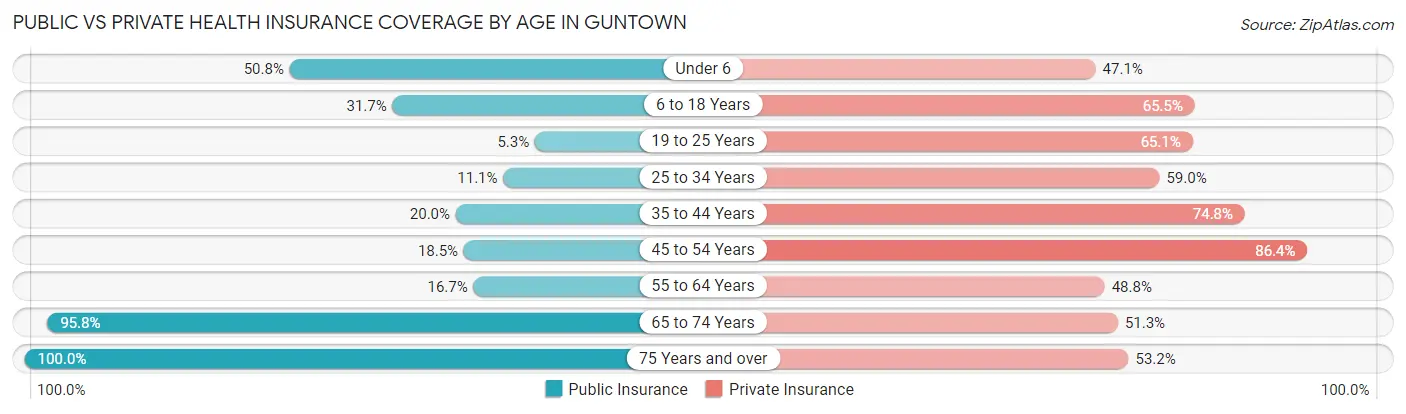
| Age Bracket | Public Insurance | Private Insurance |
| Under 6 | 97 (50.8%) | 90 (47.1%) |
| 6 to 18 Years | 194 (31.7%) | 401 (65.5%) |
| 19 to 25 Years | 8 (5.3%) | 99 (65.1%) |
| 25 to 34 Years | 41 (11.1%) | 217 (59.0%) |
| 35 to 44 Years | 80 (20.0%) | 300 (74.8%) |
| 45 to 54 Years | 38 (18.4%) | 178 (86.4%) |
| 55 to 64 Years | 28 (16.7%) | 82 (48.8%) |
| 65 to 74 Years | 114 (95.8%) | 61 (51.3%) |
| 75 Years and over | 62 (100.0%) | 33 (53.2%) |
| Total | 662 (29.0%) | 1,461 (64.1%) |
Disability Status by Sex by Age in Guntown
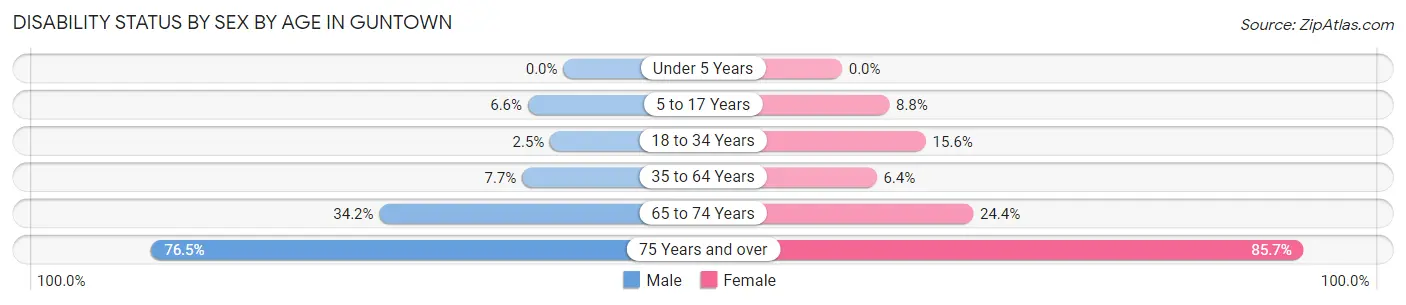
| Age Bracket | Male | Female |
| Under 5 Years | 0 (0.0%) | 0 (0.0%) |
| 5 to 17 Years | 24 (6.6%) | 25 (8.8%) |
| 18 to 34 Years | 6 (2.5%) | 45 (15.6%) |
| 35 to 64 Years | 32 (7.7%) | 23 (6.4%) |
| 65 to 74 Years | 14 (34.2%) | 19 (24.4%) |
| 75 Years and over | 26 (76.5%) | 24 (85.7%) |
Disability Class by Sex by Age in Guntown
Disability Class: Hearing Difficulty
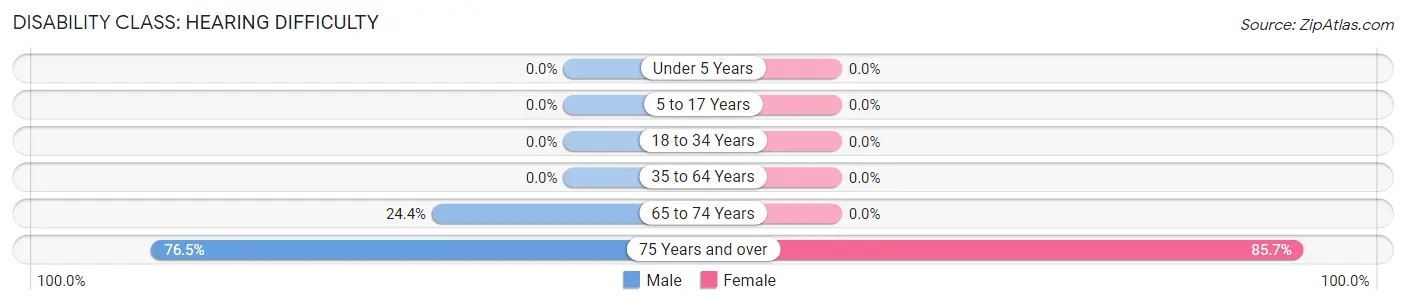
| Age Bracket | Male | Female |
| Under 5 Years | 0 (0.0%) | 0 (0.0%) |
| 5 to 17 Years | 0 (0.0%) | 0 (0.0%) |
| 18 to 34 Years | 0 (0.0%) | 0 (0.0%) |
| 35 to 64 Years | 0 (0.0%) | 0 (0.0%) |
| 65 to 74 Years | 10 (24.4%) | 0 (0.0%) |
| 75 Years and over | 26 (76.5%) | 24 (85.7%) |
Disability Class: Vision Difficulty
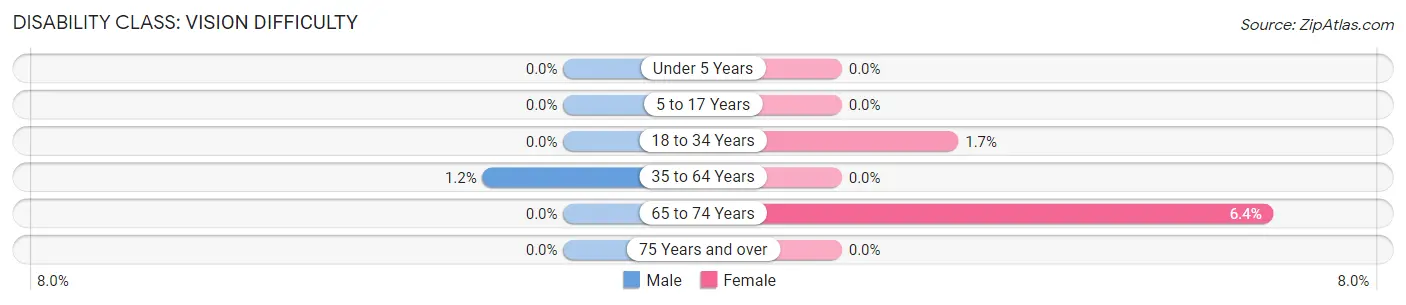
| Age Bracket | Male | Female |
| Under 5 Years | 0 (0.0%) | 0 (0.0%) |
| 5 to 17 Years | 0 (0.0%) | 0 (0.0%) |
| 18 to 34 Years | 0 (0.0%) | 5 (1.7%) |
| 35 to 64 Years | 5 (1.2%) | 0 (0.0%) |
| 65 to 74 Years | 0 (0.0%) | 5 (6.4%) |
| 75 Years and over | 0 (0.0%) | 0 (0.0%) |
Disability Class: Cognitive Difficulty
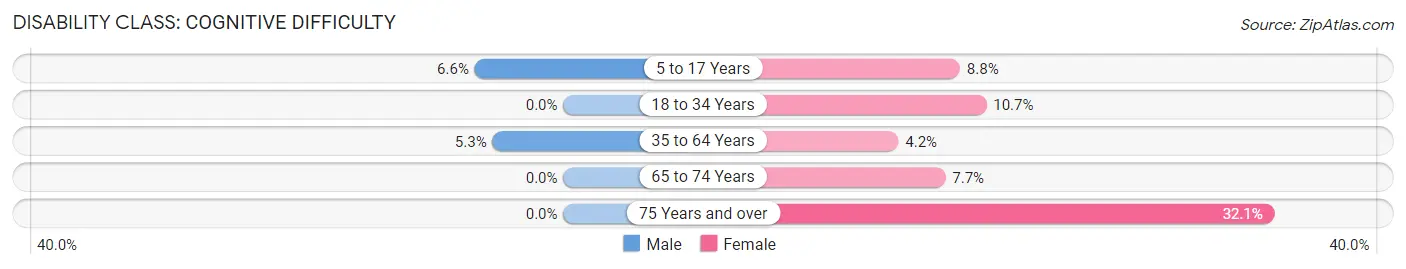
| Age Bracket | Male | Female |
| 5 to 17 Years | 24 (6.6%) | 25 (8.8%) |
| 18 to 34 Years | 0 (0.0%) | 31 (10.7%) |
| 35 to 64 Years | 22 (5.3%) | 15 (4.2%) |
| 65 to 74 Years | 0 (0.0%) | 6 (7.7%) |
| 75 Years and over | 0 (0.0%) | 9 (32.1%) |
Disability Class: Ambulatory Difficulty
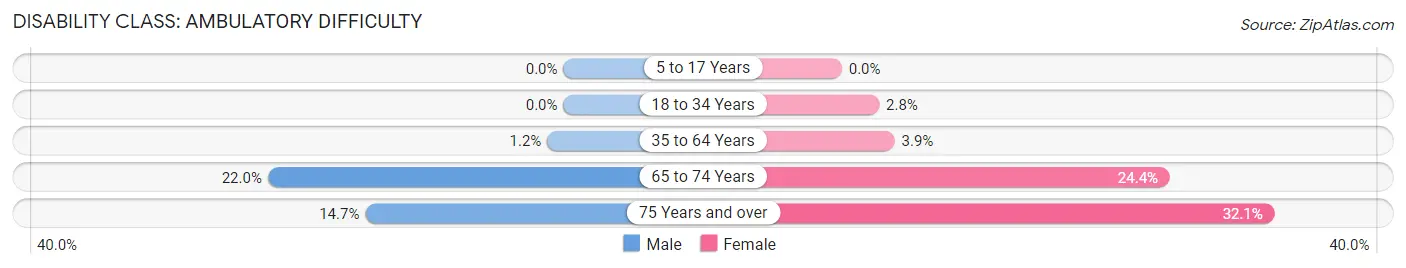
| Age Bracket | Male | Female |
| 5 to 17 Years | 0 (0.0%) | 0 (0.0%) |
| 18 to 34 Years | 0 (0.0%) | 8 (2.8%) |
| 35 to 64 Years | 5 (1.2%) | 14 (3.9%) |
| 65 to 74 Years | 9 (22.0%) | 19 (24.4%) |
| 75 Years and over | 5 (14.7%) | 9 (32.1%) |
Disability Class: Self-Care Difficulty
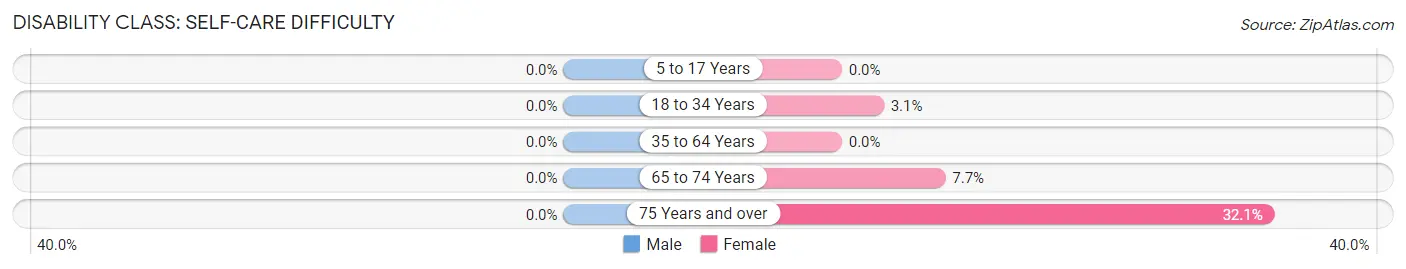
| Age Bracket | Male | Female |
| 5 to 17 Years | 0 (0.0%) | 0 (0.0%) |
| 18 to 34 Years | 0 (0.0%) | 9 (3.1%) |
| 35 to 64 Years | 0 (0.0%) | 0 (0.0%) |
| 65 to 74 Years | 0 (0.0%) | 6 (7.7%) |
| 75 Years and over | 0 (0.0%) | 9 (32.1%) |
Technology Access in Guntown
Computing Device Access in Guntown
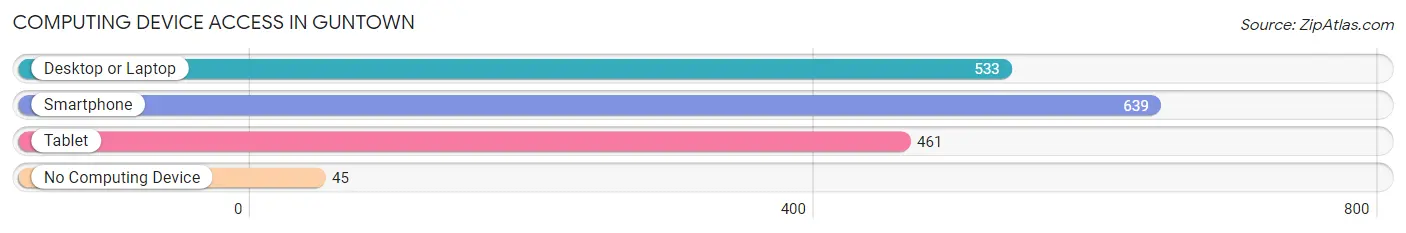
| Device Type | # Households | % Households |
| Desktop or Laptop | 533 | 74.8% |
| Smartphone | 639 | 89.6% |
| Tablet | 461 | 64.7% |
| No Computing Device | 45 | 6.3% |
| Total | 713 | 100.0% |
Internet Access in Guntown
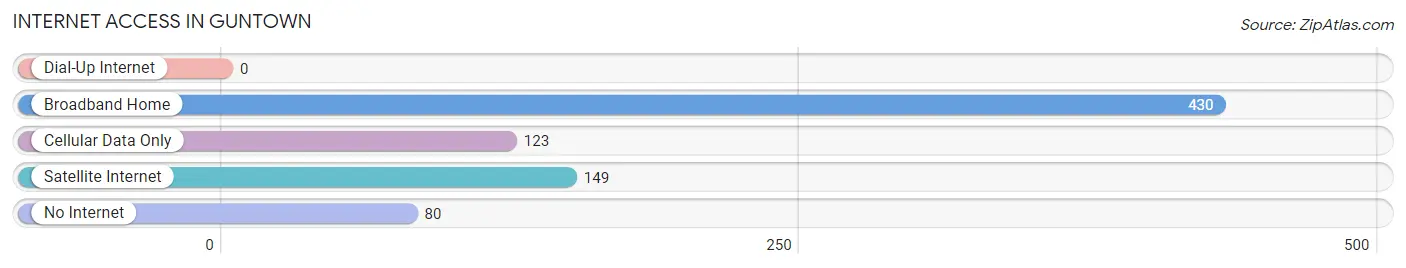
| Internet Type | # Households | % Households |
| Dial-Up Internet | 0 | 0.0% |
| Broadband Home | 430 | 60.3% |
| Cellular Data Only | 123 | 17.2% |
| Satellite Internet | 149 | 20.9% |
| No Internet | 80 | 11.2% |
| Total | 713 | 100.0% |
Guntown Summary
Guntown is a small town located in Lee County, Mississippi. It is situated in the northeast corner of the state, about 20 miles east of Tupelo. The town was founded in 1837 and named after the local Gun family. It is home to a population of approximately 1,500 people.
Geography
Guntown is located in the northeast corner of Lee County, Mississippi. It is situated in the foothills of the Appalachian Mountains, and is surrounded by rolling hills and forests. The town is located on the banks of the Tombigbee River, which provides a source of recreation for the locals. The climate in Guntown is humid subtropical, with hot summers and mild winters.
Economy
Guntown’s economy is largely based on agriculture. The town is home to several farms, which produce a variety of crops, including cotton, corn, soybeans, and wheat. The town also has a few small businesses, including a grocery store, a hardware store, and a few restaurants.
Demographics
As of the 2010 census, Guntown had a population of 1,500 people. The racial makeup of the town was 97.3% White, 0.7% African American, 0.3% Native American, 0.3% Asian, and 1.3% from other races. The median household income was $31,250, and the median family income was $37,500.
History
Guntown was founded in 1837 by the Gun family, who were among the first settlers in the area. The town was named after the family, and the Gun family still owns much of the land in the area. The town was originally a farming community, and the local economy was largely based on agriculture.
In the late 19th century, Guntown began to experience a period of growth. The town was connected to the railroad in 1887, and the local economy began to diversify. The town also became a popular destination for tourists, who came to enjoy the natural beauty of the area.
In the early 20th century, Guntown experienced a period of decline. The Great Depression hit the town hard, and many of the businesses closed. The town was also affected by the decline of the railroad industry, and the population began to decline.
In recent years, Guntown has experienced a period of revitalization. The town has seen an influx of new businesses, and the population has begun to grow again. The town is now home to a variety of shops, restaurants, and other businesses, and is a popular destination for tourists.
Guntown is a small town with a rich history and a bright future. The town is home to a diverse population, and the local economy is thriving. The town is a great place to live, work, and visit, and is sure to continue to grow and prosper in the years to come.
Common Questions
What is Per Capita Income in Guntown?
Per Capita income in Guntown is $23,796.
What is the Median Family Income in Guntown?
Median Family Income in Guntown is $82,833.
What is the Median Household income in Guntown?
Median Household Income in Guntown is $66,058.
What is Income or Wage Gap in Guntown?
Income or Wage Gap in Guntown is 34.6%.
Women in Guntown earn 65.4 cents for every dollar earned by a man.
What is Family Income Deficit in Guntown?
Family Income Deficit in Guntown is $12,603.
Families that are below poverty line in Guntown earn $12,603 less on average than the poverty threshold level.
What is Inequality or Gini Index in Guntown?
Inequality or Gini Index in Guntown is 0.38.
What is the Total Population of Guntown?
Total Population of Guntown is 2,279.
What is the Total Male Population of Guntown?
Total Male Population of Guntown is 1,198.
What is the Total Female Population of Guntown?
Total Female Population of Guntown is 1,081.
What is the Ratio of Males per 100 Females in Guntown?
There are 110.82 Males per 100 Females in Guntown.
What is the Ratio of Females per 100 Males in Guntown?
There are 90.23 Females per 100 Males in Guntown.
What is the Median Population Age in Guntown?
Median Population Age in Guntown is 30.8 Years.
What is the Average Family Size in Guntown
Average Family Size in Guntown is 3.6 People.
What is the Average Household Size in Guntown
Average Household Size in Guntown is 3.2 People.
How Large is the Labor Force in Guntown?
There are 1,101 People in the Labor Forcein in Guntown.
What is the Percentage of People in the Labor Force in Guntown?
69.9% of People are in the Labor Force in Guntown.
What is the Unemployment Rate in Guntown?
Unemployment Rate in Guntown is 4.5%.