Sunflower, MS Map & Demographics
Sunflower Map
Sunflower Overview
$20,558
PER CAPITA INCOME
$44,750
AVG FAMILY INCOME
$23,295
AVG HOUSEHOLD INCOME
41.4%
WAGE / INCOME GAP [ % ]
58.6¢/ $1
WAGE / INCOME GAP [ $ ]
0.55
INEQUALITY / GINI INDEX
1,144
TOTAL POPULATION
575
MALE POPULATION
569
FEMALE POPULATION
101.05
MALES / 100 FEMALES
98.96
FEMALES / 100 MALES
33.4
MEDIAN AGE
3.6
AVG FAMILY SIZE
2.6
AVG HOUSEHOLD SIZE
460
LABOR FORCE [ PEOPLE ]
54.8%
PERCENT IN LABOR FORCE
4.6%
UNEMPLOYMENT RATE
Sunflower Zip Codes
Sunflower Area Codes
Income in Sunflower
Income Overview in Sunflower
Per Capita Income in Sunflower is $20,558, while median incomes of families and households are $44,750 and $23,295 respectively.
| Characteristic | Number | Measure |
| Per Capita Income | 1,144 | $20,558 |
| Median Family Income | 267 | $44,750 |
| Mean Family Income | 267 | $62,175 |
| Median Household Income | 439 | $23,295 |
| Mean Household Income | 439 | $48,902 |
| Income Deficit | 267 | $0 |
| Wage / Income Gap (%) | 1,144 | 41.43% |
| Wage / Income Gap ($) | 1,144 | 58.57¢ per $1 |
| Gini / Inequality Index | 1,144 | 0.55 |
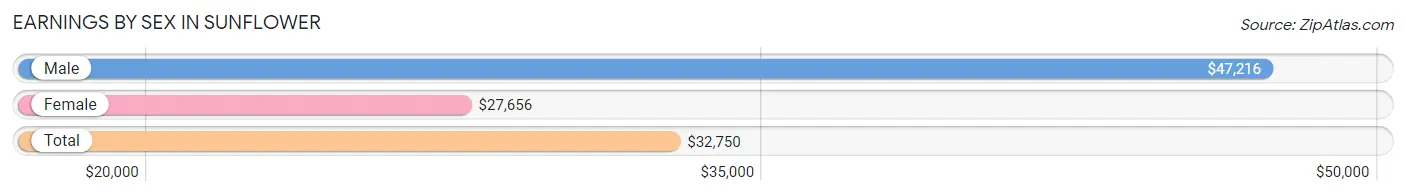
Earnings by Sex in Sunflower
Average Earnings in Sunflower are $32,750, $47,216 for men and $27,656 for women, a difference of 41.4%.
| Sex | Number | Average Earnings |
| Male | 213 (47.3%) | $47,216 |
| Female | 237 (52.7%) | $27,656 |
| Total | 450 (100.0%) | $32,750 |
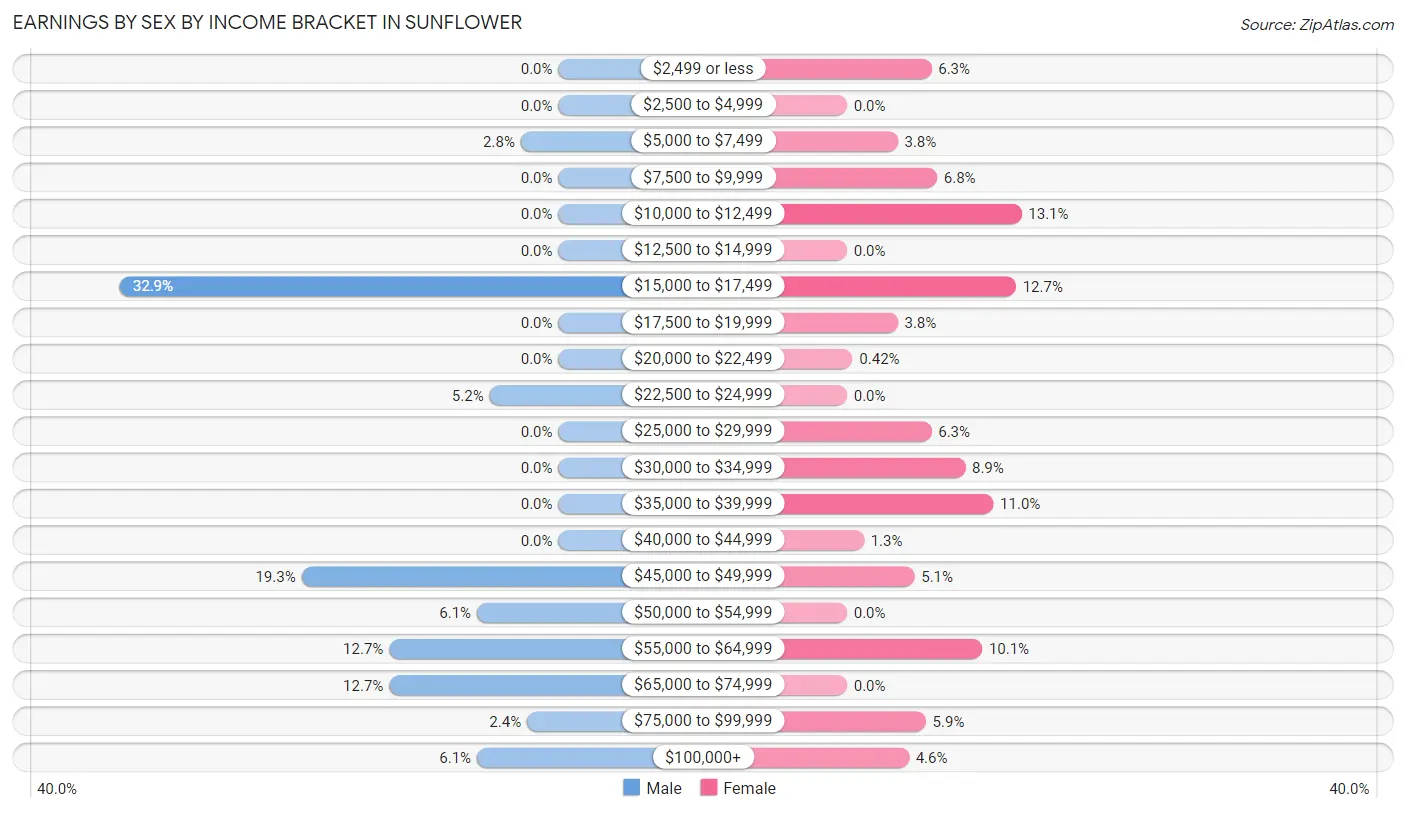
Earnings by Sex by Income Bracket in Sunflower
The most common earnings brackets in Sunflower are $15,000 to $17,499 for men (70 | 32.9%) and $10,000 to $12,499 for women (31 | 13.1%).
| Income | Male | Female |
| $2,499 or less | 0 (0.0%) | 15 (6.3%) |
| $2,500 to $4,999 | 0 (0.0%) | 0 (0.0%) |
| $5,000 to $7,499 | 6 (2.8%) | 9 (3.8%) |
| $7,500 to $9,999 | 0 (0.0%) | 16 (6.8%) |
| $10,000 to $12,499 | 0 (0.0%) | 31 (13.1%) |
| $12,500 to $14,999 | 0 (0.0%) | 0 (0.0%) |
| $15,000 to $17,499 | 70 (32.9%) | 30 (12.7%) |
| $17,500 to $19,999 | 0 (0.0%) | 9 (3.8%) |
| $20,000 to $22,499 | 0 (0.0%) | 1 (0.4%) |
| $22,500 to $24,999 | 11 (5.2%) | 0 (0.0%) |
| $25,000 to $29,999 | 0 (0.0%) | 15 (6.3%) |
| $30,000 to $34,999 | 0 (0.0%) | 21 (8.9%) |
| $35,000 to $39,999 | 0 (0.0%) | 26 (11.0%) |
| $40,000 to $44,999 | 0 (0.0%) | 3 (1.3%) |
| $45,000 to $49,999 | 41 (19.3%) | 12 (5.1%) |
| $50,000 to $54,999 | 13 (6.1%) | 0 (0.0%) |
| $55,000 to $64,999 | 27 (12.7%) | 24 (10.1%) |
| $65,000 to $74,999 | 27 (12.7%) | 0 (0.0%) |
| $75,000 to $99,999 | 5 (2.4%) | 14 (5.9%) |
| $100,000+ | 13 (6.1%) | 11 (4.6%) |
| Total | 213 (100.0%) | 237 (100.0%) |
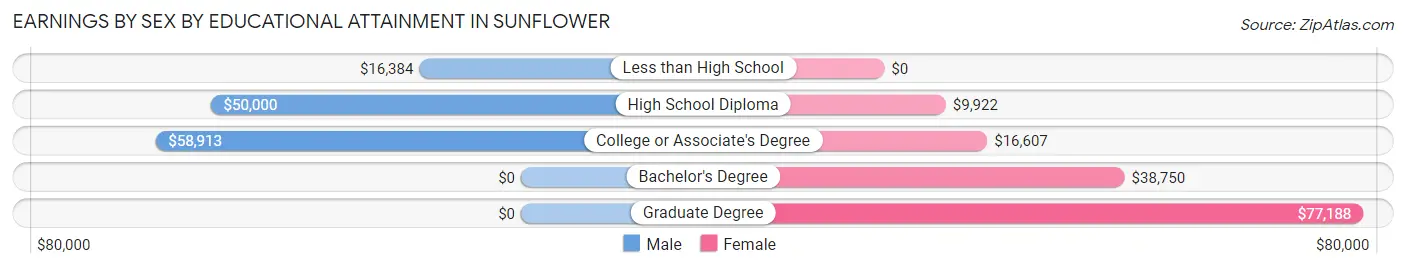
Earnings by Sex by Educational Attainment in Sunflower
Average earnings in Sunflower are $46,136 for men and $32,045 for women, a difference of 30.5%. Men with an educational attainment of college or associate's degree enjoy the highest average annual earnings of $58,913, while those with less than high school education earn the least with $16,384. Women with an educational attainment of graduate degree earn the most with the average annual earnings of $77,188, while those with high school diploma education have the smallest earnings of $9,922.
| Educational Attainment | Male Income | Female Income |
| Less than High School | $16,384 | $0 |
| High School Diploma | $50,000 | $9,922 |
| College or Associate's Degree | $58,913 | $16,607 |
| Bachelor's Degree | - | - |
| Graduate Degree | - | - |
| Total | $46,136 | $32,045 |
Family Income in Sunflower
Family Income Brackets in Sunflower
According to the Sunflower family income data, there are 51 families falling into the $35,000 to $49,999 income range, which is the most common income bracket and makes up 19.1% of all families. Conversely, the $150,000 to $199,999 income bracket is the least frequent group with only 10 families (3.7%) belonging to this category.
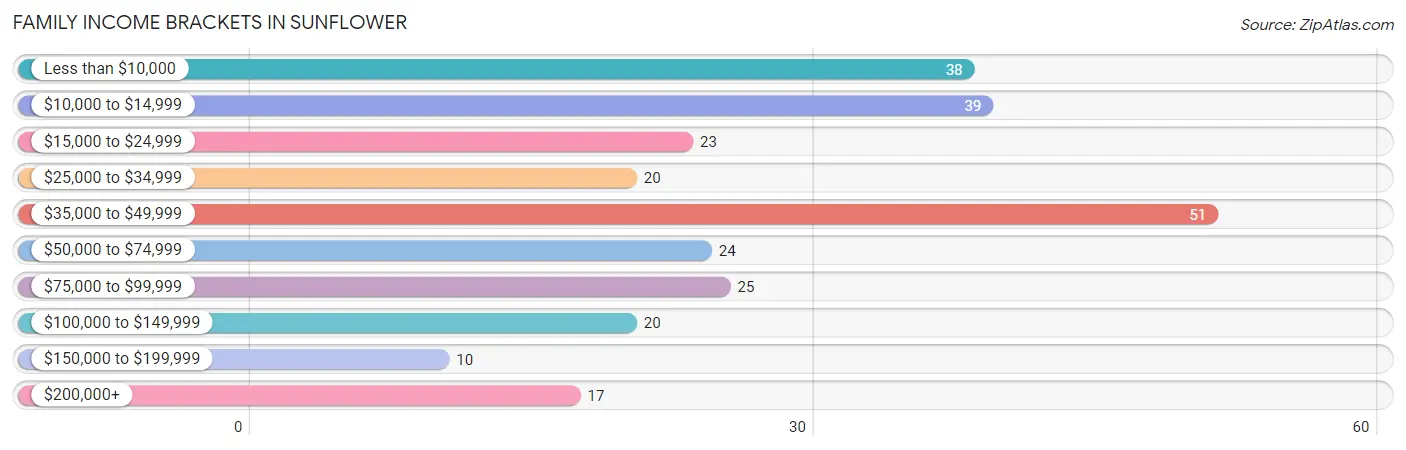
| Income Bracket | # Families | % Families |
| Less than $10,000 | 38 | 14.2% |
| $10,000 to $14,999 | 39 | 14.6% |
| $15,000 to $24,999 | 23 | 8.6% |
| $25,000 to $34,999 | 20 | 7.5% |
| $35,000 to $49,999 | 51 | 19.1% |
| $50,000 to $74,999 | 24 | 9.0% |
| $75,000 to $99,999 | 25 | 9.4% |
| $100,000 to $149,999 | 20 | 7.5% |
| $150,000 to $199,999 | 10 | 3.7% |
| $200,000+ | 17 | 6.4% |
Family Income by Famaliy Size in Sunflower
2-person families (145 | 54.3%) account for the highest median family income in Sunflower with $47,102 per family, while 2-person families (145 | 54.3%) have the highest median income of $23,551 per family member.
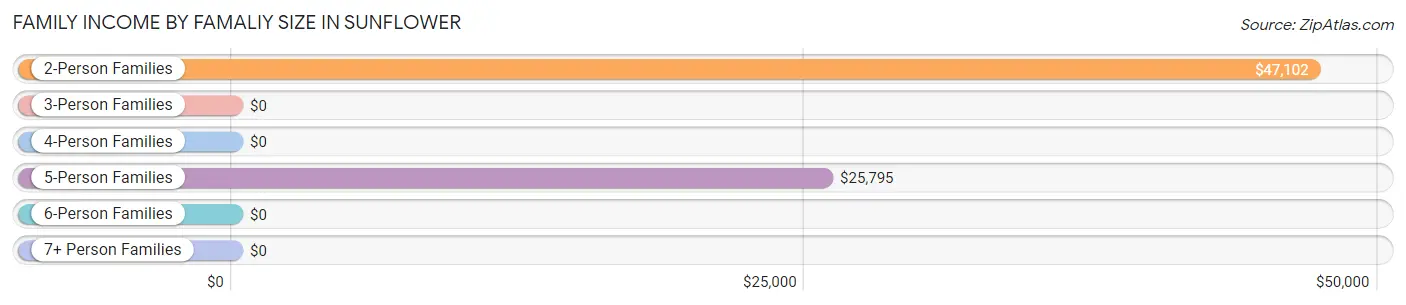
| Income Bracket | # Families | Median Income |
| 2-Person Families | 145 (54.3%) | $47,102 |
| 3-Person Families | 43 (16.1%) | $0 |
| 4-Person Families | 60 (22.5%) | $0 |
| 5-Person Families | 19 (7.1%) | $25,795 |
| 6-Person Families | 0 (0.0%) | $0 |
| 7+ Person Families | 0 (0.0%) | $0 |
| Total | 267 (100.0%) | $44,750 |
Family Income by Number of Earners in Sunflower
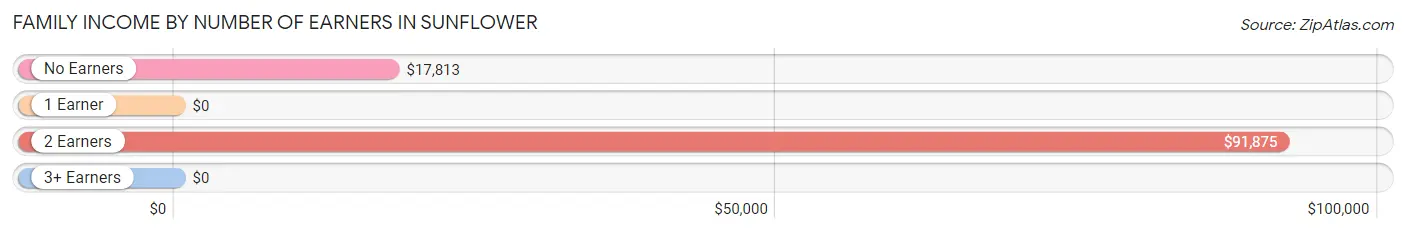
| Number of Earners | # Families | Median Income |
| No Earners | 82 (30.7%) | $17,813 |
| 1 Earner | 98 (36.7%) | $0 |
| 2 Earners | 81 (30.3%) | $91,875 |
| 3+ Earners | 6 (2.2%) | $0 |
| Total | 267 (100.0%) | $44,750 |
Household Income in Sunflower
Household Income Brackets in Sunflower
With 90 households falling in the category, the $15,000 to $24,999 income range is the most frequent in Sunflower, accounting for 20.5% of all households. In contrast, only 10 households (2.3%) fall into the $150,000 to $199,999 income bracket, making it the least populous group.
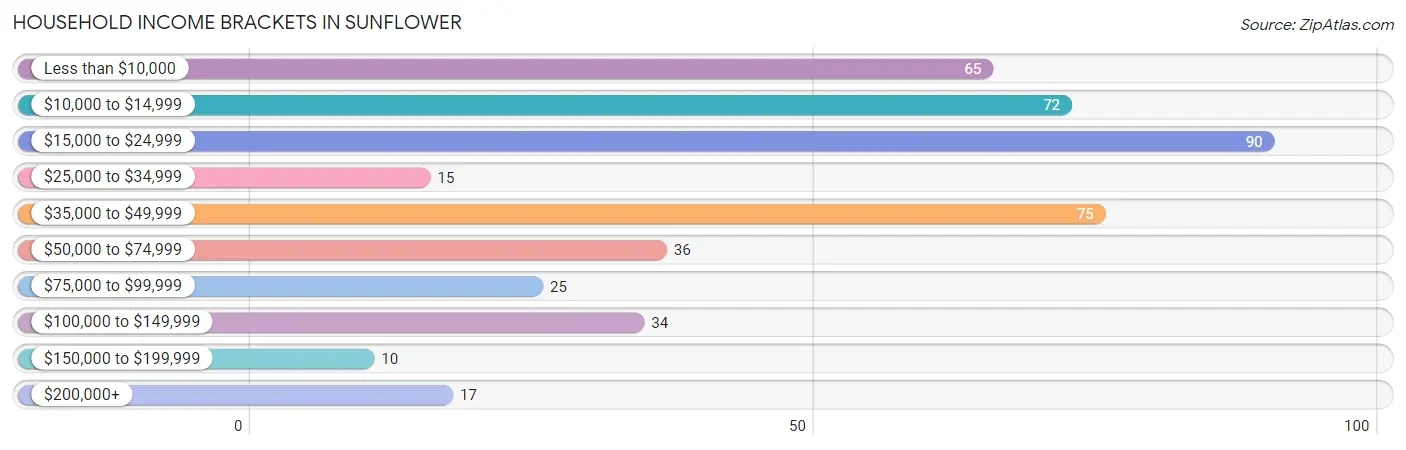
| Income Bracket | # Households | % Households |
| Less than $10,000 | 65 | 14.8% |
| $10,000 to $14,999 | 72 | 16.4% |
| $15,000 to $24,999 | 90 | 20.5% |
| $25,000 to $34,999 | 15 | 3.4% |
| $35,000 to $49,999 | 75 | 17.1% |
| $50,000 to $74,999 | 36 | 8.2% |
| $75,000 to $99,999 | 25 | 5.7% |
| $100,000 to $149,999 | 34 | 7.7% |
| $150,000 to $199,999 | 10 | 2.3% |
| $200,000+ | 17 | 3.9% |
Household Income by Householder Age in Sunflower
The median household income in Sunflower is $23,295, with the highest median household income of $26,932 found in the 45 to 64 years age bracket for the primary householder. A total of 239 households (54.4%) fall into this category. Meanwhile, the 15 to 24 years age bracket for the primary householder has the lowest median household income of $0, with 9 households (2.1%) in this group.
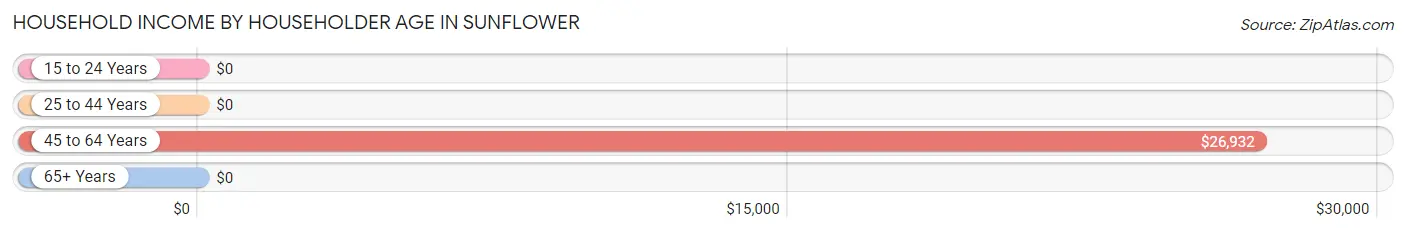
| Income Bracket | # Households | Median Income |
| 15 to 24 Years | 9 (2.1%) | $0 |
| 25 to 44 Years | 122 (27.8%) | $0 |
| 45 to 64 Years | 239 (54.4%) | $26,932 |
| 65+ Years | 69 (15.7%) | $0 |
| Total | 439 (100.0%) | $23,295 |
Poverty in Sunflower
Income Below Poverty by Sex and Age in Sunflower
With 45.9% poverty level for males and 50.8% for females among the residents of Sunflower, under 5 year old males and 5 year old females are the most vulnerable to poverty, with 60 males (100.0%) and 2 females (100.0%) in their respective age groups living below the poverty level.
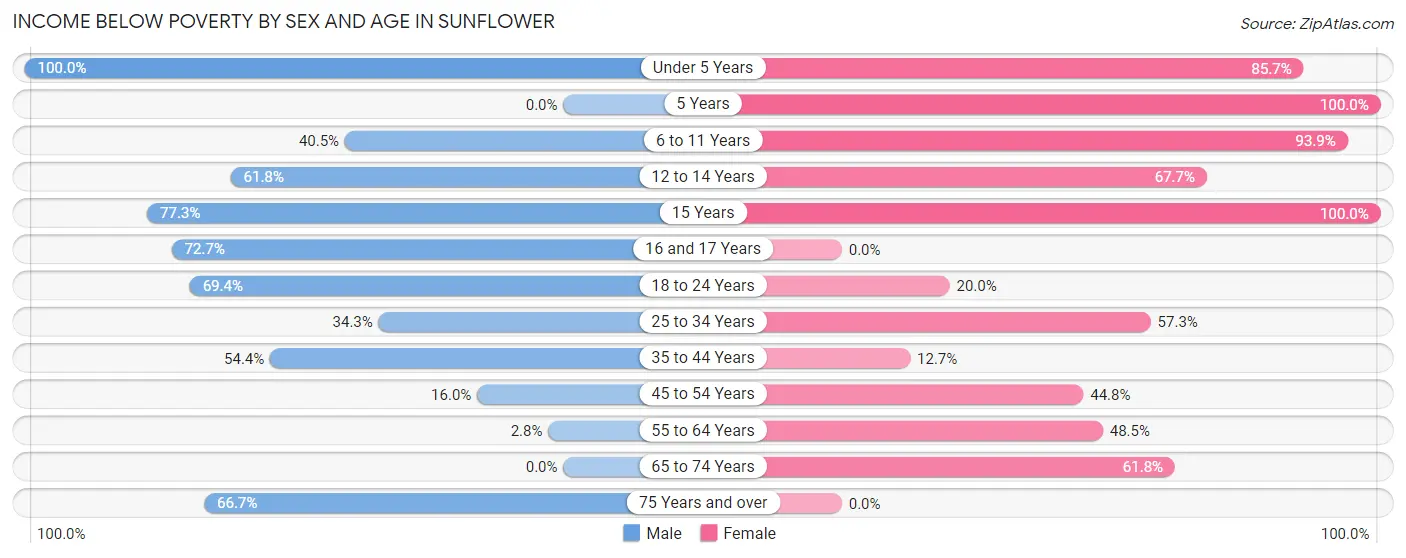
| Age Bracket | Male | Female |
| Under 5 Years | 60 (100.0%) | 18 (85.7%) |
| 5 Years | 0 (0.0%) | 2 (100.0%) |
| 6 to 11 Years | 15 (40.5%) | 46 (93.9%) |
| 12 to 14 Years | 21 (61.8%) | 42 (67.7%) |
| 15 Years | 17 (77.3%) | 7 (100.0%) |
| 16 and 17 Years | 16 (72.7%) | 0 (0.0%) |
| 18 to 24 Years | 43 (69.4%) | 10 (20.0%) |
| 25 to 34 Years | 36 (34.3%) | 43 (57.3%) |
| 35 to 44 Years | 43 (54.4%) | 9 (12.7%) |
| 45 to 54 Years | 4 (16.0%) | 26 (44.8%) |
| 55 to 64 Years | 3 (2.8%) | 47 (48.4%) |
| 65 to 74 Years | 0 (0.0%) | 34 (61.8%) |
| 75 Years and over | 6 (66.7%) | 0 (0.0%) |
| Total | 264 (45.9%) | 284 (50.8%) |
Income Above Poverty by Sex and Age in Sunflower
According to the poverty statistics in Sunflower, males aged 65 to 74 years and females aged 75 years and over are the age groups that are most secure financially, with 100.0% of males and 100.0% of females in these age groups living above the poverty line.
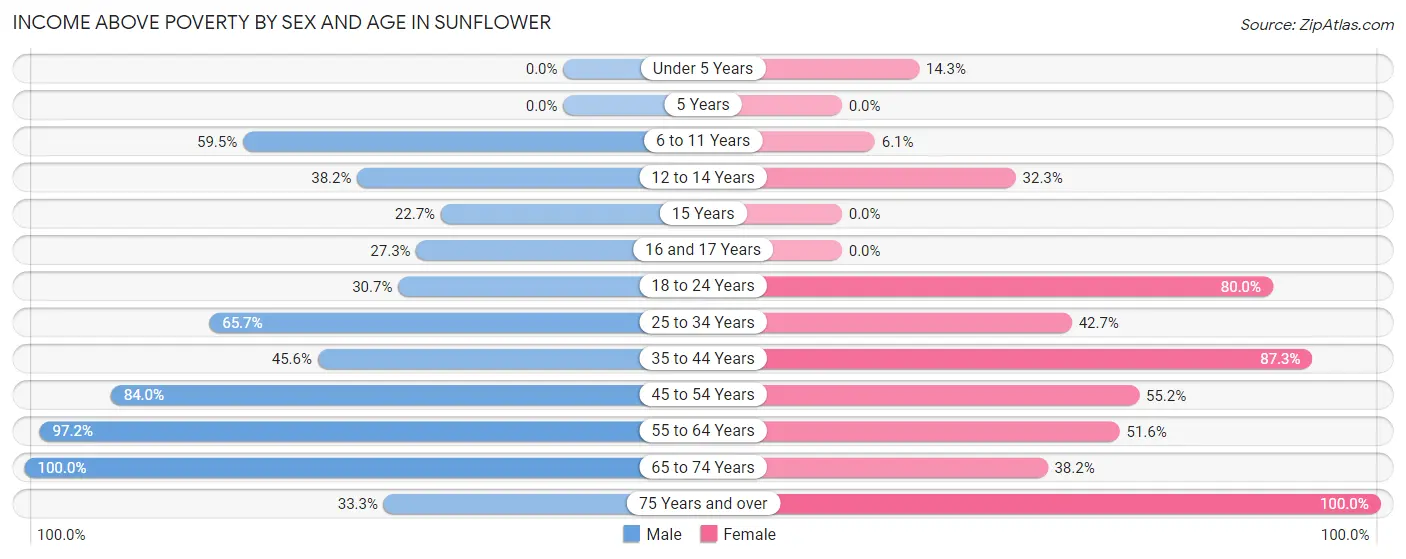
| Age Bracket | Male | Female |
| Under 5 Years | 0 (0.0%) | 3 (14.3%) |
| 5 Years | 0 (0.0%) | 0 (0.0%) |
| 6 to 11 Years | 22 (59.5%) | 3 (6.1%) |
| 12 to 14 Years | 13 (38.2%) | 20 (32.3%) |
| 15 Years | 5 (22.7%) | 0 (0.0%) |
| 16 and 17 Years | 6 (27.3%) | 0 (0.0%) |
| 18 to 24 Years | 19 (30.6%) | 40 (80.0%) |
| 25 to 34 Years | 69 (65.7%) | 32 (42.7%) |
| 35 to 44 Years | 36 (45.6%) | 62 (87.3%) |
| 45 to 54 Years | 21 (84.0%) | 32 (55.2%) |
| 55 to 64 Years | 104 (97.2%) | 50 (51.5%) |
| 65 to 74 Years | 13 (100.0%) | 21 (38.2%) |
| 75 Years and over | 3 (33.3%) | 12 (100.0%) |
| Total | 311 (54.1%) | 275 (49.2%) |
Income Below Poverty Among Married-Couple Families in Sunflower
The poverty statistics for married-couple families in Sunflower show that 3.8% or 3 of the total 78 families live below the poverty line. Families with no children have the highest poverty rate of 5.1%, comprising of 3 families. On the other hand, families with 1 or 2 children have the lowest poverty rate of 0.0%, which includes 0 families.
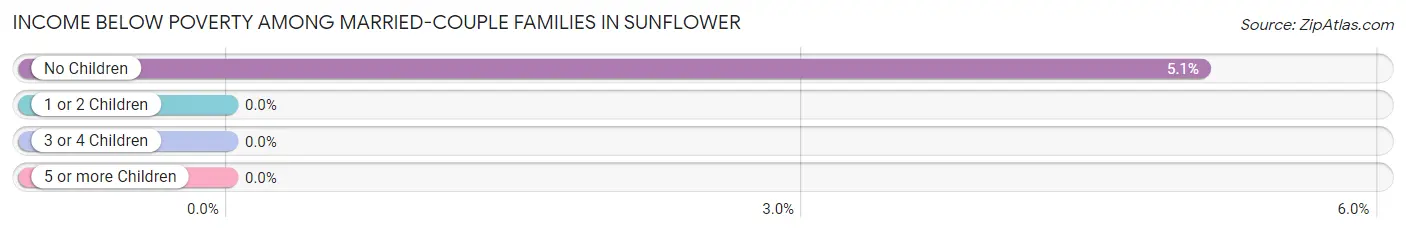
| Children | Above Poverty | Below Poverty |
| No Children | 56 (94.9%) | 3 (5.1%) |
| 1 or 2 Children | 19 (100.0%) | 0 (0.0%) |
| 3 or 4 Children | 0 (0.0%) | 0 (0.0%) |
| 5 or more Children | 0 (0.0%) | 0 (0.0%) |
| Total | 75 (96.2%) | 3 (3.8%) |
Income Below Poverty Among Single-Parent Households in Sunflower
According to the poverty data in Sunflower, 10.7% or 3 single-father households and 65.2% or 105 single-mother households are living below the poverty line. Among single-father households, those with 1 or 2 children have the highest poverty rate, with 3 households (15.0%) experiencing poverty. Likewise, among single-mother households, those with 3 or 4 children have the highest poverty rate, with 35 households (100.0%) falling below the poverty line.
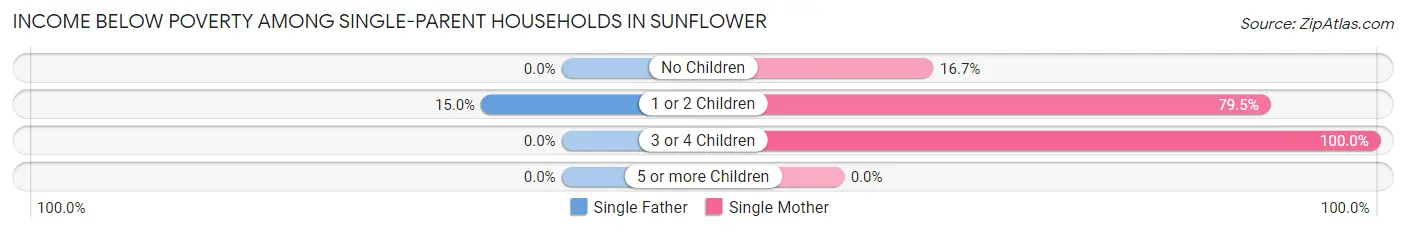
| Children | Single Father | Single Mother |
| No Children | 0 (0.0%) | 8 (16.7%) |
| 1 or 2 Children | 3 (15.0%) | 62 (79.5%) |
| 3 or 4 Children | 0 (0.0%) | 35 (100.0%) |
| 5 or more Children | 0 (0.0%) | 0 (0.0%) |
| Total | 3 (10.7%) | 105 (65.2%) |
Income Below Poverty Among Married-Couple vs Single-Parent Households in Sunflower
The poverty data for Sunflower shows that 3 of the married-couple family households (3.8%) and 108 of the single-parent households (57.1%) are living below the poverty level. Within the married-couple family households, those with no children have the highest poverty rate, with 3 households (5.1%) falling below the poverty line. Among the single-parent households, those with 3 or 4 children have the highest poverty rate, with 35 household (100.0%) living below poverty.
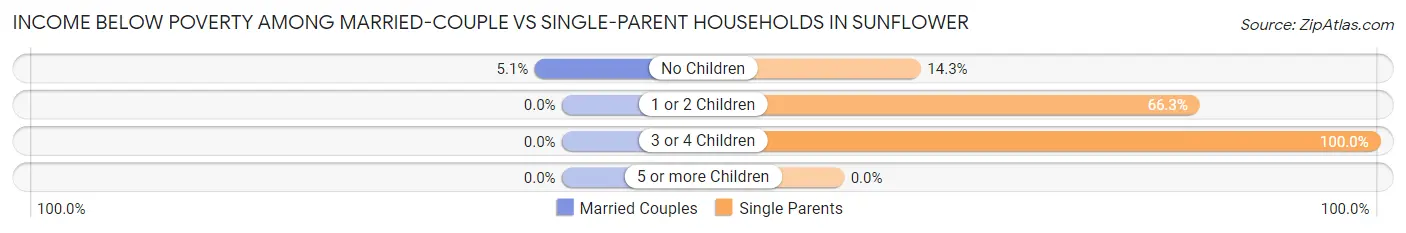
| Children | Married-Couple Families | Single-Parent Households |
| No Children | 3 (5.1%) | 8 (14.3%) |
| 1 or 2 Children | 0 (0.0%) | 65 (66.3%) |
| 3 or 4 Children | 0 (0.0%) | 35 (100.0%) |
| 5 or more Children | 0 (0.0%) | 0 (0.0%) |
| Total | 3 (3.8%) | 108 (57.1%) |
Race in Sunflower
The most populous races in Sunflower are Black / African American (954 | 83.4%), White / Caucasian (174 | 15.2%), and Two or more Races (16 | 1.4%).
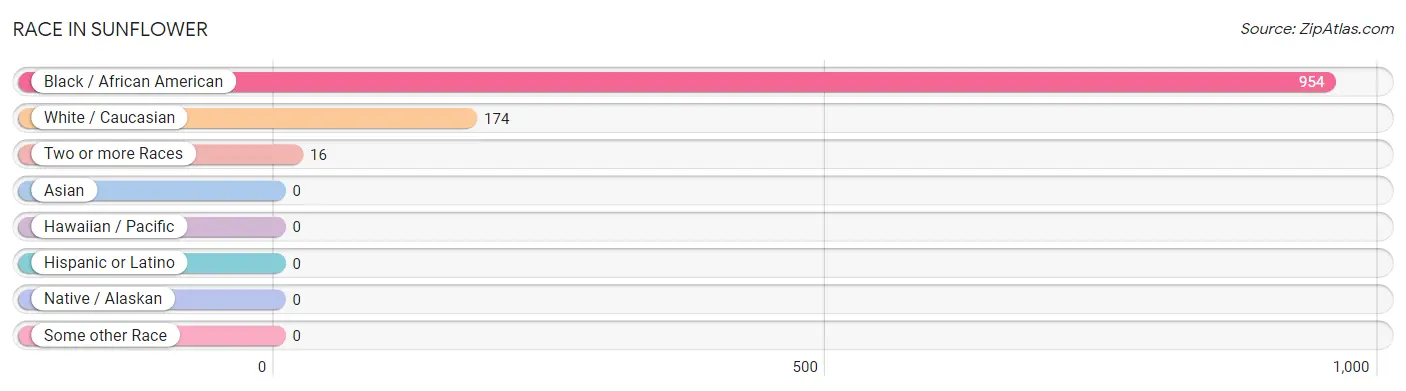
| Race | # Population | % Population |
| Asian | 0 | 0.0% |
| Black / African American | 954 | 83.4% |
| Hawaiian / Pacific | 0 | 0.0% |
| Hispanic or Latino | 0 | 0.0% |
| Native / Alaskan | 0 | 0.0% |
| White / Caucasian | 174 | 15.2% |
| Two or more Races | 16 | 1.4% |
| Some other Race | 0 | 0.0% |
| Total | 1,144 | 100.0% |
Ancestry in Sunflower
The most populous ancestries reported in Sunflower are American (154 | 13.5%), English (88 | 7.7%), Irish (19 | 1.7%), and French (12 | 1.1%), together accounting for 23.9% of all Sunflower residents.
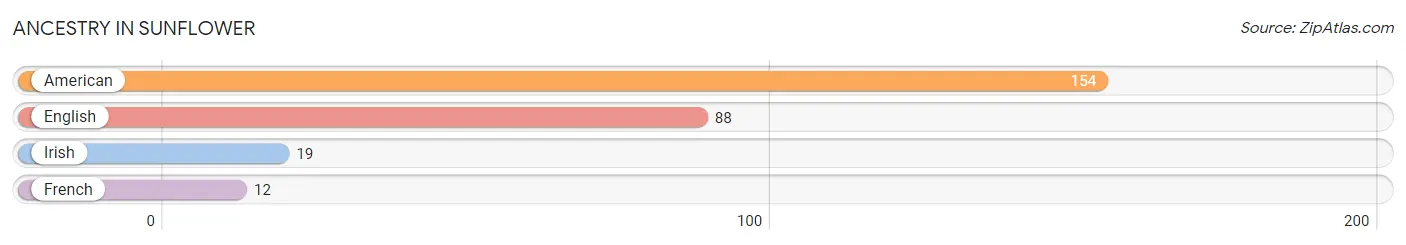
| Ancestry | # Population | % Population |
| American | 154 | 13.5% |
| English | 88 | 7.7% |
| French | 12 | 1.1% |
| Irish | 19 | 1.7% | View All 4 Rows |
Immigrants in Sunflower
The most numerous immigrant groups reported in Sunflower came from Africa (3 | 0.3%), Ghana (3 | 0.3%), and Western Africa (3 | 0.3%), together accounting for 0.8% of all Sunflower residents.
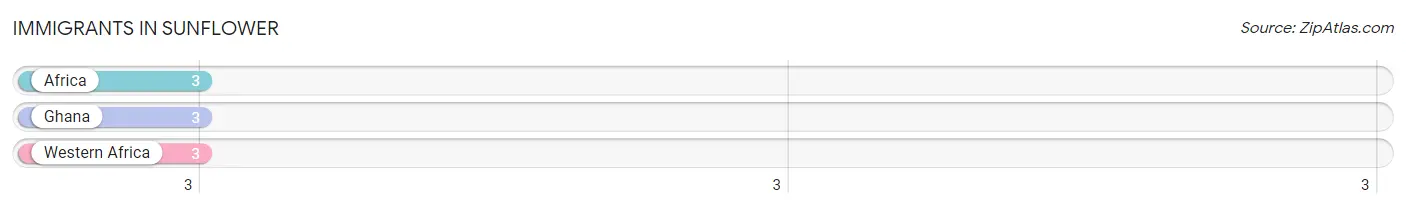
| Immigration Origin | # Population | % Population |
| Africa | 3 | 0.3% |
| Ghana | 3 | 0.3% |
| Western Africa | 3 | 0.3% | View All 3 Rows |
Sex and Age in Sunflower
Sex and Age in Sunflower
The most populous age groups in Sunflower are 30 to 34 Years (91 | 15.8%) for men and 10 to 14 Years (90 | 15.8%) for women.
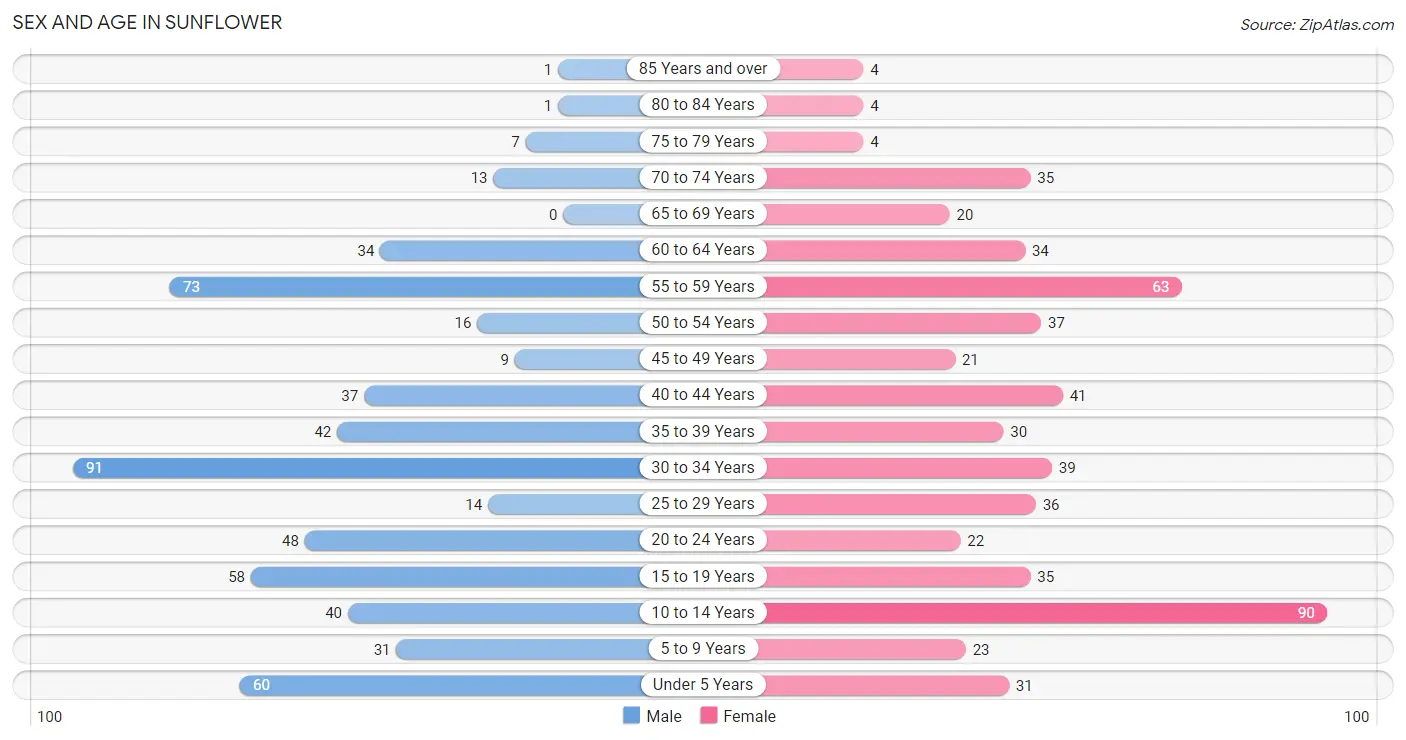
| Age Bracket | Male | Female |
| Under 5 Years | 60 (10.4%) | 31 (5.4%) |
| 5 to 9 Years | 31 (5.4%) | 23 (4.0%) |
| 10 to 14 Years | 40 (7.0%) | 90 (15.8%) |
| 15 to 19 Years | 58 (10.1%) | 35 (6.1%) |
| 20 to 24 Years | 48 (8.4%) | 22 (3.9%) |
| 25 to 29 Years | 14 (2.4%) | 36 (6.3%) |
| 30 to 34 Years | 91 (15.8%) | 39 (6.9%) |
| 35 to 39 Years | 42 (7.3%) | 30 (5.3%) |
| 40 to 44 Years | 37 (6.4%) | 41 (7.2%) |
| 45 to 49 Years | 9 (1.6%) | 21 (3.7%) |
| 50 to 54 Years | 16 (2.8%) | 37 (6.5%) |
| 55 to 59 Years | 73 (12.7%) | 63 (11.1%) |
| 60 to 64 Years | 34 (5.9%) | 34 (6.0%) |
| 65 to 69 Years | 0 (0.0%) | 20 (3.5%) |
| 70 to 74 Years | 13 (2.3%) | 35 (6.1%) |
| 75 to 79 Years | 7 (1.2%) | 4 (0.7%) |
| 80 to 84 Years | 1 (0.2%) | 4 (0.7%) |
| 85 Years and over | 1 (0.2%) | 4 (0.7%) |
| Total | 575 (100.0%) | 569 (100.0%) |
Families and Households in Sunflower
Median Family Size in Sunflower
The median family size in Sunflower is 3.56 persons per family, with single female/mother families (161 | 60.3%) accounting for the largest median family size of 4.18 persons per family. On the other hand, married-couple families (78 | 29.2%) represent the smallest median family size with 2.22 persons per family.
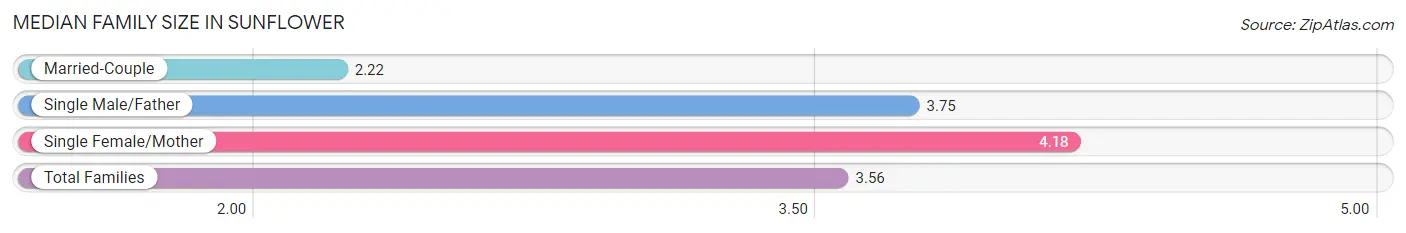
| Family Type | # Families | Family Size |
| Married-Couple | 78 (29.2%) | 2.22 |
| Single Male/Father | 28 (10.5%) | 3.75 |
| Single Female/Mother | 161 (60.3%) | 4.18 |
| Total Families | 267 (100.0%) | 3.56 |
Median Household Size in Sunflower
The median household size in Sunflower is 2.61 persons per household, with single female/mother households (161 | 36.7%) accounting for the largest median household size of 4.27 persons per household. non-family households (172 | 39.2%) represent the smallest median household size with 1.03 persons per household.
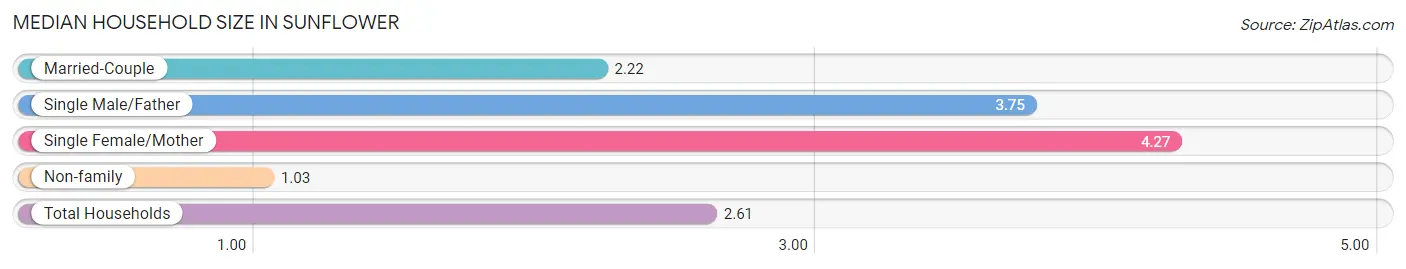
| Household Type | # Households | Household Size |
| Married-Couple | 78 (17.8%) | 2.22 |
| Single Male/Father | 28 (6.4%) | 3.75 |
| Single Female/Mother | 161 (36.7%) | 4.27 |
| Non-family | 172 (39.2%) | 1.03 |
| Total Households | 439 (100.0%) | 2.61 |
Household Size by Marriage Status in Sunflower
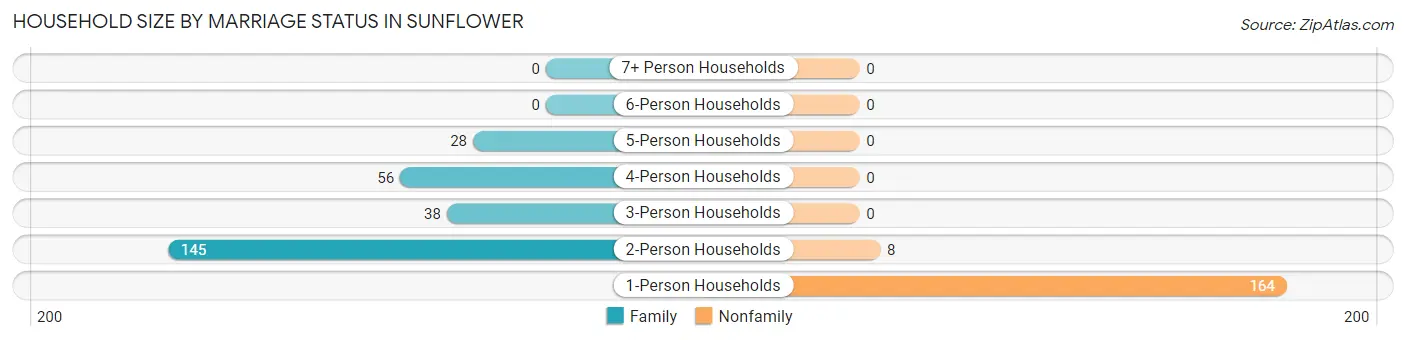
Out of a total of 439 households in Sunflower, 267 (60.8%) are family households, while 172 (39.2%) are nonfamily households. The most numerous type of family households are 2-person households, comprising 145, and the most common type of nonfamily households are 1-person households, comprising 164.
| Household Size | Family Households | Nonfamily Households |
| 1-Person Households | - | 164 (37.4%) |
| 2-Person Households | 145 (33.0%) | 8 (1.8%) |
| 3-Person Households | 38 (8.7%) | 0 (0.0%) |
| 4-Person Households | 56 (12.8%) | 0 (0.0%) |
| 5-Person Households | 28 (6.4%) | 0 (0.0%) |
| 6-Person Households | 0 (0.0%) | 0 (0.0%) |
| 7+ Person Households | 0 (0.0%) | 0 (0.0%) |
| Total | 267 (60.8%) | 172 (39.2%) |
Female Fertility in Sunflower
Fertility by Age in Sunflower
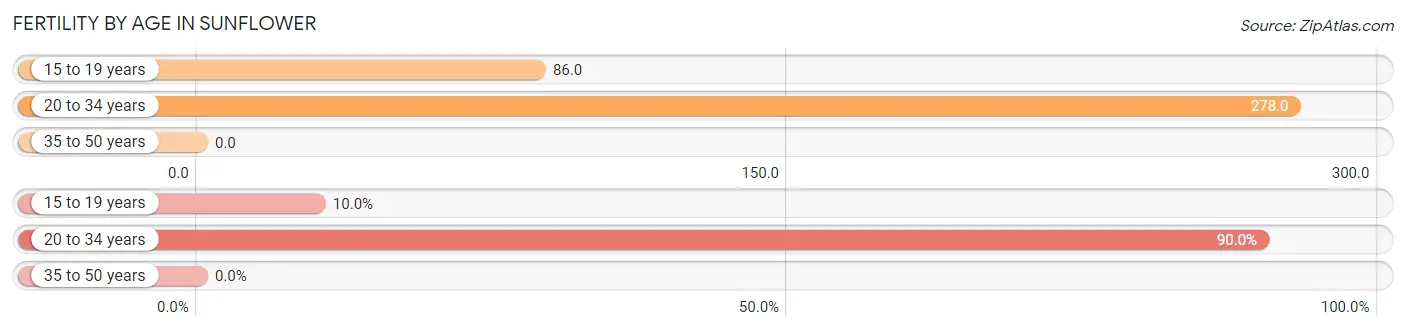
Average fertility rate in Sunflower is 125.0 births per 1,000 women. Women in the age bracket of 20 to 34 years have the highest fertility rate with 278.0 births per 1,000 women. Women in the age bracket of 20 to 34 years acount for 90.0% of all women with births.
| Age Bracket | Women with Births | Births / 1,000 Women |
| 15 to 19 years | 3 (10.0%) | 86.0 |
| 20 to 34 years | 27 (90.0%) | 278.0 |
| 35 to 50 years | 0 (0.0%) | 0.0 |
| Total | 30 (100.0%) | 125.0 |
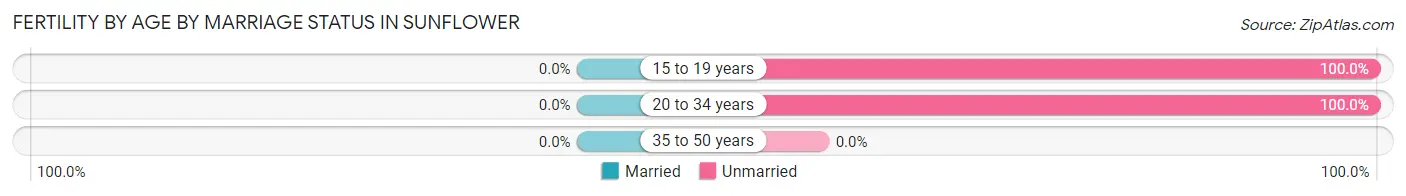
Fertility by Age by Marriage Status in Sunflower
| Age Bracket | Married | Unmarried |
| 15 to 19 years | 0 (0.0%) | 3 (100.0%) |
| 20 to 34 years | 0 (0.0%) | 27 (100.0%) |
| 35 to 50 years | 0 (0.0%) | 0 (0.0%) |
| Total | 0 (0.0%) | 30 (100.0%) |
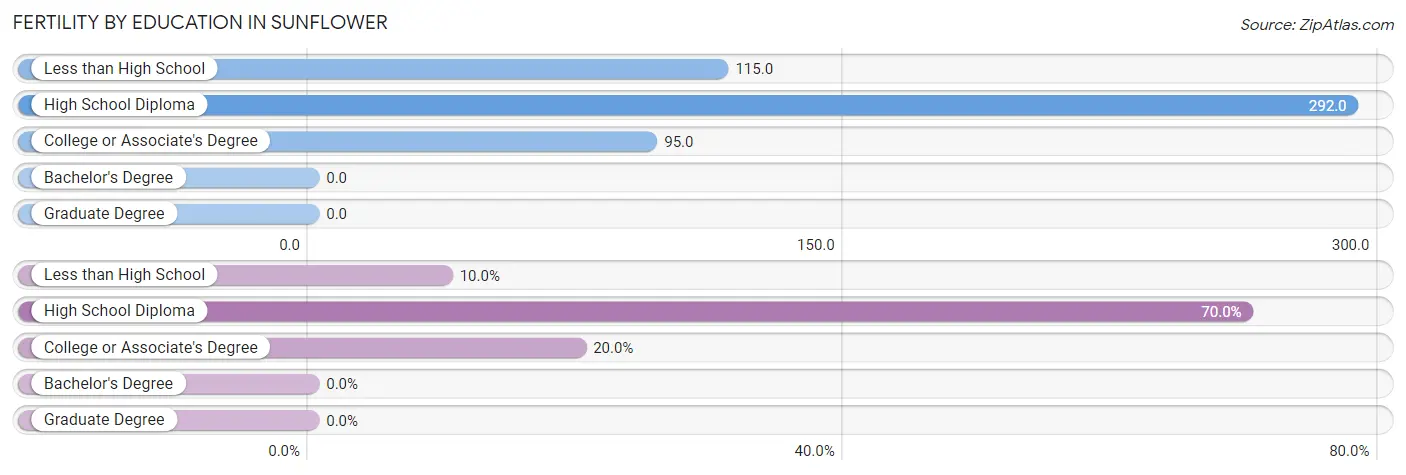
Fertility by Education in Sunflower
| Educational Attainment | Women with Births | Births / 1,000 Women |
| Less than High School | 3 (10.0%) | 115.0 |
| High School Diploma | 21 (70.0%) | 292.0 |
| College or Associate's Degree | 6 (20.0%) | 95.0 |
| Bachelor's Degree | 0 (0.0%) | 0.0 |
| Graduate Degree | 0 (0.0%) | 0.0 |
| Total | 30 (100.0%) | 125.0 |
Fertility by Education by Marriage Status in Sunflower
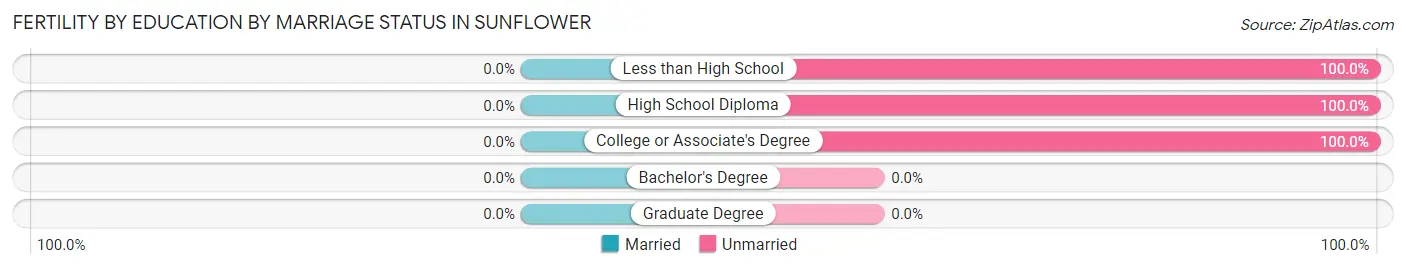
| Educational Attainment | Married | Unmarried |
| Less than High School | 0 (0.0%) | 3 (100.0%) |
| High School Diploma | 0 (0.0%) | 21 (100.0%) |
| College or Associate's Degree | 0 (0.0%) | 6 (100.0%) |
| Bachelor's Degree | 0 (0.0%) | 0 (0.0%) |
| Graduate Degree | 0 (0.0%) | 0 (0.0%) |
| Total | 0 (0.0%) | 30 (100.0%) |
Employment Characteristics in Sunflower
Employment by Class of Employer in Sunflower
Among the 421 employed individuals in Sunflower, private company employees (261 | 62.0%), state government employees (74 | 17.6%), and self-employed (incorporated) (35 | 8.3%) make up the most common classes of employment.
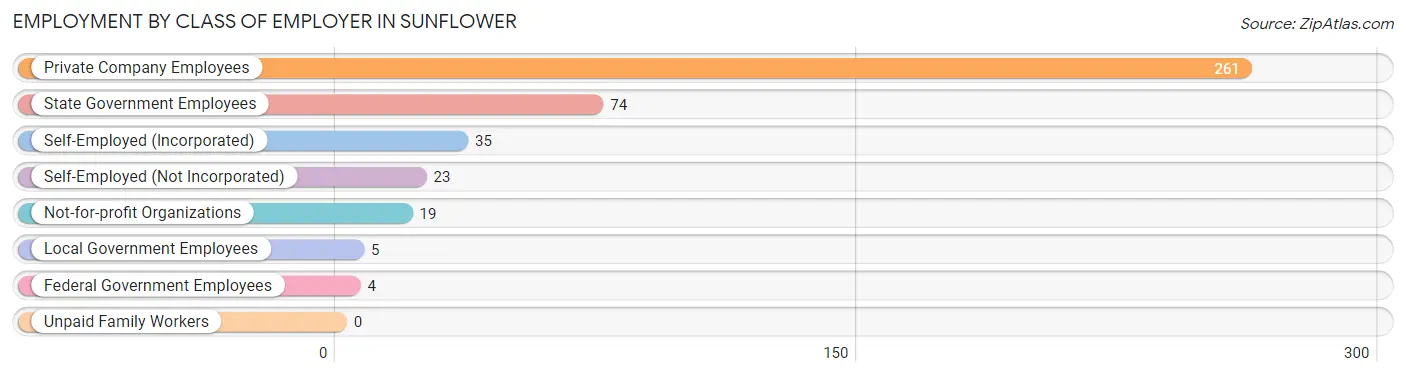
| Employer Class | # Employees | % Employees |
| Private Company Employees | 261 | 62.0% |
| Self-Employed (Incorporated) | 35 | 8.3% |
| Self-Employed (Not Incorporated) | 23 | 5.5% |
| Not-for-profit Organizations | 19 | 4.5% |
| Local Government Employees | 5 | 1.2% |
| State Government Employees | 74 | 17.6% |
| Federal Government Employees | 4 | 0.9% |
| Unpaid Family Workers | 0 | 0.0% |
| Total | 421 | 100.0% |
Employment Status by Age in Sunflower
According to the labor force statistics for Sunflower, out of the total population over 16 years of age (840), 54.8% or 460 individuals are in the labor force, with 4.6% or 21 of them unemployed. The age group with the highest labor force participation rate is 25 to 29 years, with 100.0% or 50 individuals in the labor force. Within the labor force, the 16 to 19 years age range has the highest percentage of unemployed individuals, with 47.6% or 10 of them being unemployed.
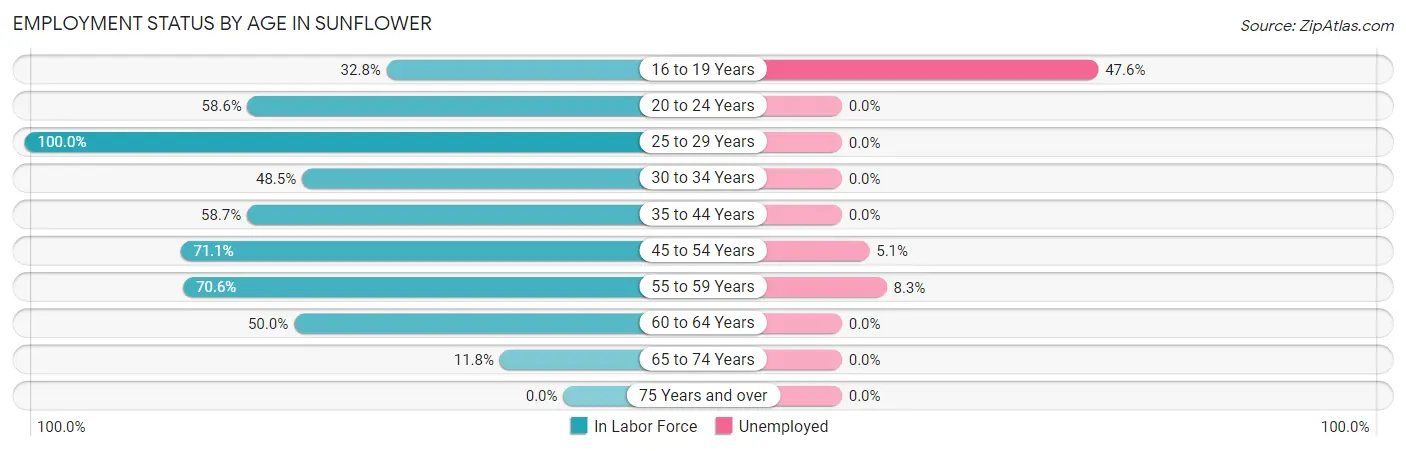
| Age Bracket | In Labor Force | Unemployed |
| 16 to 19 Years | 21 (32.8%) | 10 (47.6%) |
| 20 to 24 Years | 41 (58.6%) | 0 (0.0%) |
| 25 to 29 Years | 50 (100.0%) | 0 (0.0%) |
| 30 to 34 Years | 63 (48.5%) | 0 (0.0%) |
| 35 to 44 Years | 88 (58.7%) | 0 (0.0%) |
| 45 to 54 Years | 59 (71.1%) | 3 (5.1%) |
| 55 to 59 Years | 96 (70.6%) | 8 (8.3%) |
| 60 to 64 Years | 34 (50.0%) | 0 (0.0%) |
| 65 to 74 Years | 8 (11.8%) | 0 (0.0%) |
| 75 Years and over | 0 (0.0%) | 0 (0.0%) |
| Total | 460 (54.8%) | 21 (4.6%) |
Employment Status by Educational Attainment in Sunflower
According to labor force statistics for Sunflower, 63.2% of individuals (390) out of the total population between 25 and 64 years of age (617) are in the labor force, with 2.8% or 11 of them being unemployed. The group with the highest labor force participation rate are those with the educational attainment of bachelor's degree or higher, with 81.8% or 99 individuals in the labor force. Within the labor force, individuals with less than high school education have the highest percentage of unemployment, with 10.5% or 8 of them being unemployed.
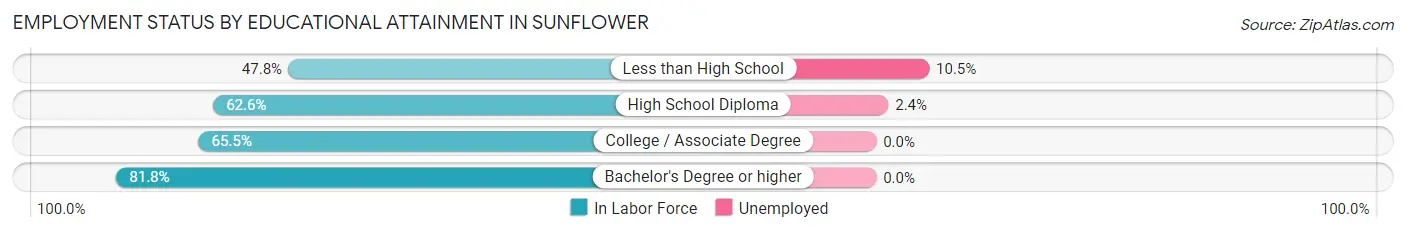
| Educational Attainment | In Labor Force | Unemployed |
| Less than High School | 76 (47.8%) | 17 (10.5%) |
| High School Diploma | 124 (62.6%) | 5 (2.4%) |
| College / Associate Degree | 91 (65.5%) | 0 (0.0%) |
| Bachelor's Degree or higher | 99 (81.8%) | 0 (0.0%) |
| Total | 390 (63.2%) | 17 (2.8%) |
Employment Occupations by Sex in Sunflower
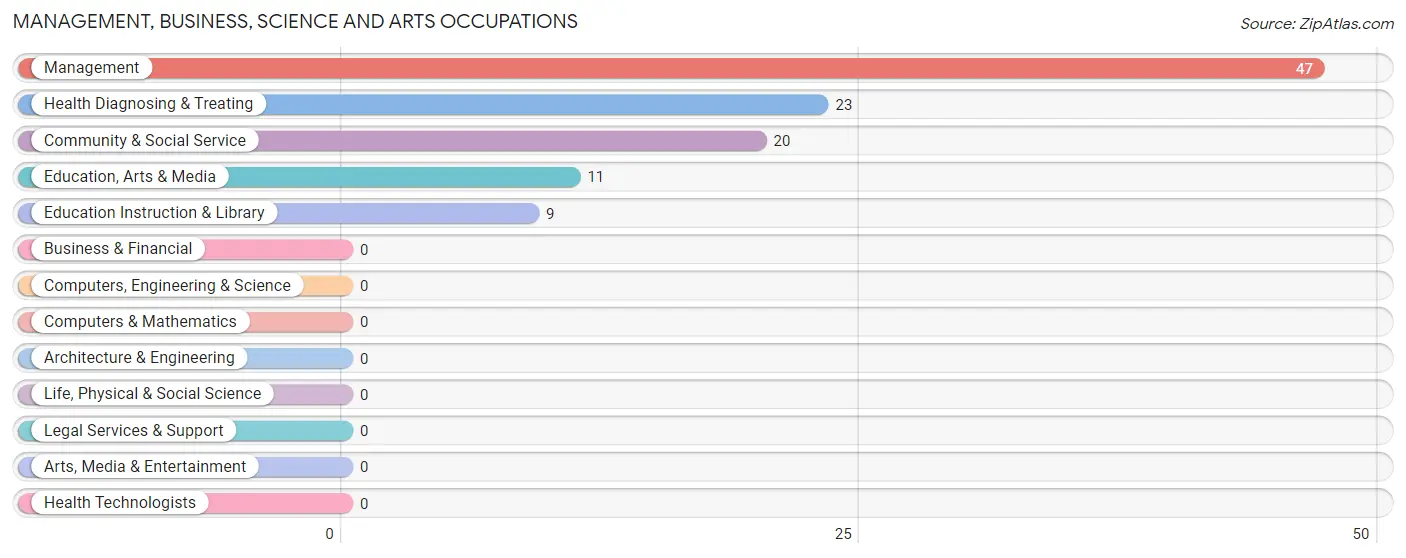
Management, Business, Science and Arts Occupations
The most common Management, Business, Science and Arts occupations in Sunflower are Management (47 | 10.7%), Health Diagnosing & Treating (23 | 5.2%), Community & Social Service (20 | 4.6%), Education, Arts & Media (11 | 2.5%), and Education Instruction & Library (9 | 2.1%).
Management, Business, Science and Arts Occupations by Sex
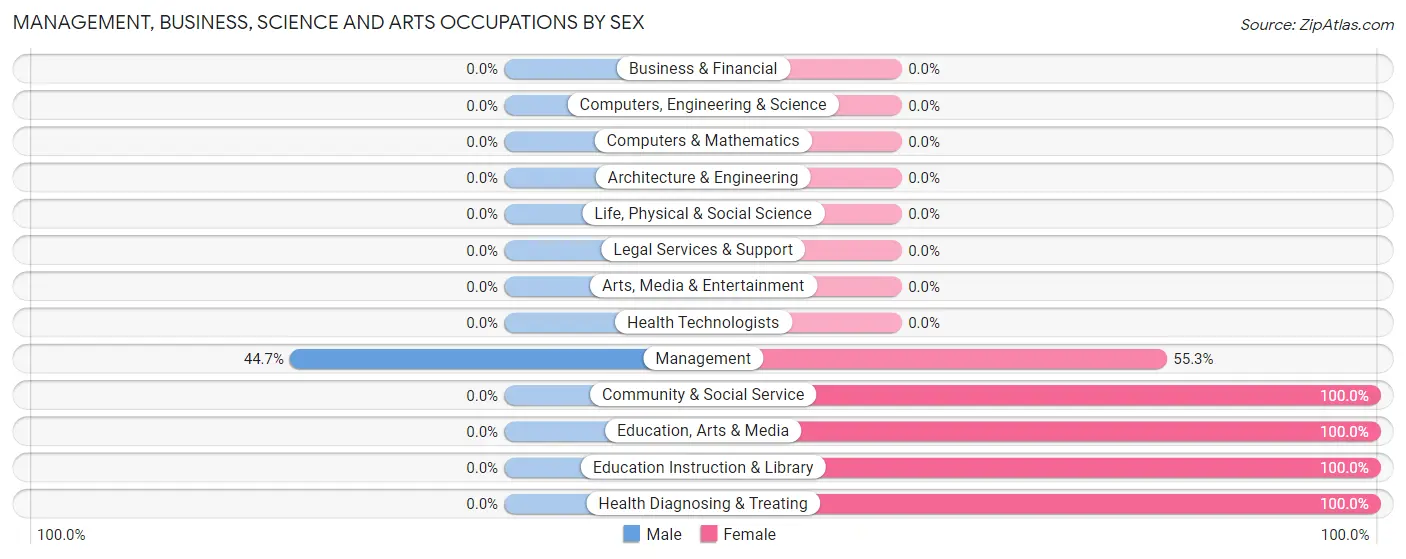
| Occupation | Male | Female |
| Management | 21 (44.7%) | 26 (55.3%) |
| Business & Financial | 0 (0.0%) | 0 (0.0%) |
| Computers, Engineering & Science | 0 (0.0%) | 0 (0.0%) |
| Computers & Mathematics | 0 (0.0%) | 0 (0.0%) |
| Architecture & Engineering | 0 (0.0%) | 0 (0.0%) |
| Life, Physical & Social Science | 0 (0.0%) | 0 (0.0%) |
| Community & Social Service | 0 (0.0%) | 20 (100.0%) |
| Education, Arts & Media | 0 (0.0%) | 11 (100.0%) |
| Legal Services & Support | 0 (0.0%) | 0 (0.0%) |
| Education Instruction & Library | 0 (0.0%) | 9 (100.0%) |
| Arts, Media & Entertainment | 0 (0.0%) | 0 (0.0%) |
| Health Diagnosing & Treating | 0 (0.0%) | 23 (100.0%) |
| Health Technologists | 0 (0.0%) | 0 (0.0%) |
| Total (Category) | 21 (23.3%) | 69 (76.7%) |
| Total (Overall) | 213 (48.5%) | 226 (51.5%) |
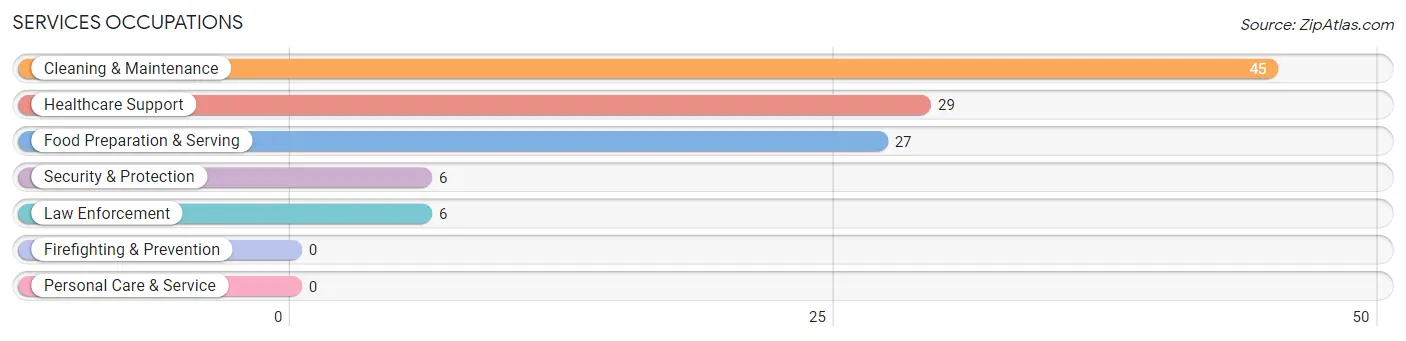
Services Occupations
The most common Services occupations in Sunflower are Cleaning & Maintenance (45 | 10.2%), Healthcare Support (29 | 6.6%), Food Preparation & Serving (27 | 6.1%), Security & Protection (6 | 1.4%), and Law Enforcement (6 | 1.4%).
Services Occupations by Sex
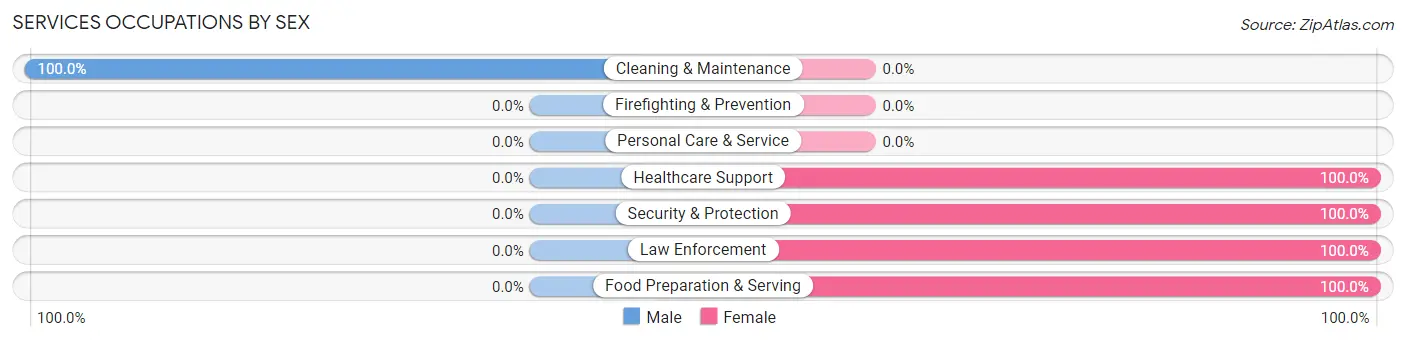
| Occupation | Male | Female |
| Healthcare Support | 0 (0.0%) | 29 (100.0%) |
| Security & Protection | 0 (0.0%) | 6 (100.0%) |
| Firefighting & Prevention | 0 (0.0%) | 0 (0.0%) |
| Law Enforcement | 0 (0.0%) | 6 (100.0%) |
| Food Preparation & Serving | 0 (0.0%) | 27 (100.0%) |
| Cleaning & Maintenance | 45 (100.0%) | 0 (0.0%) |
| Personal Care & Service | 0 (0.0%) | 0 (0.0%) |
| Total (Category) | 45 (42.1%) | 62 (57.9%) |
| Total (Overall) | 213 (48.5%) | 226 (51.5%) |
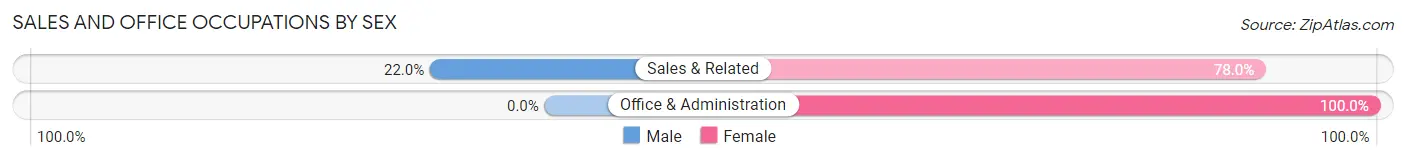
Sales and Office Occupations
The most common Sales and Office occupations in Sunflower are Sales & Related (59 | 13.4%), and Office & Administration (28 | 6.4%).
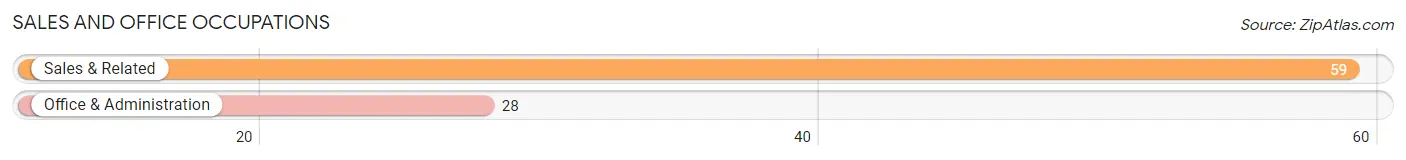
Sales and Office Occupations by Sex
| Occupation | Male | Female |
| Sales & Related | 13 (22.0%) | 46 (78.0%) |
| Office & Administration | 0 (0.0%) | 28 (100.0%) |
| Total (Category) | 13 (14.9%) | 74 (85.1%) |
| Total (Overall) | 213 (48.5%) | 226 (51.5%) |
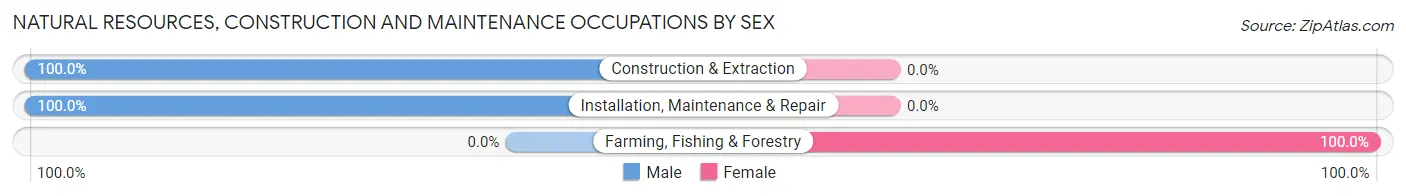
Natural Resources, Construction and Maintenance Occupations
The most common Natural Resources, Construction and Maintenance occupations in Sunflower are Construction & Extraction (37 | 8.4%), Installation, Maintenance & Repair (4 | 0.9%), and Farming, Fishing & Forestry (2 | 0.5%).
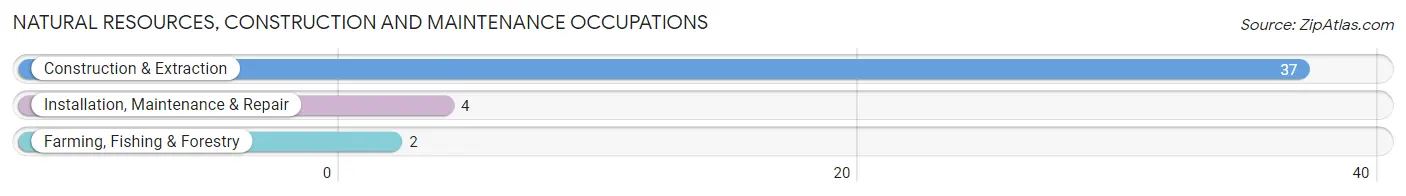
Natural Resources, Construction and Maintenance Occupations by Sex
| Occupation | Male | Female |
| Farming, Fishing & Forestry | 0 (0.0%) | 2 (100.0%) |
| Construction & Extraction | 37 (100.0%) | 0 (0.0%) |
| Installation, Maintenance & Repair | 4 (100.0%) | 0 (0.0%) |
| Total (Category) | 41 (95.4%) | 2 (4.6%) |
| Total (Overall) | 213 (48.5%) | 226 (51.5%) |
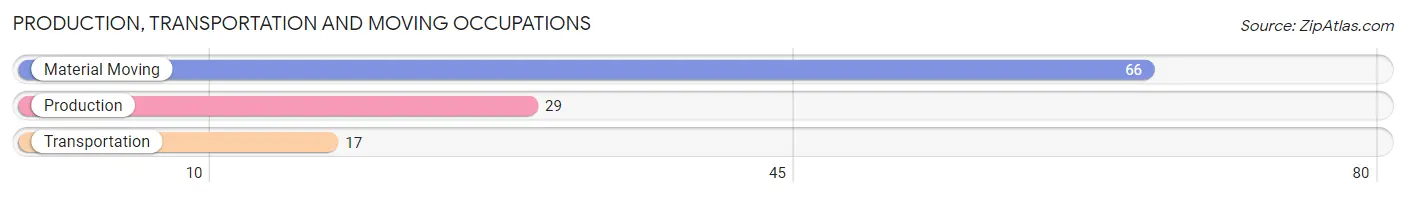
Production, Transportation and Moving Occupations
The most common Production, Transportation and Moving occupations in Sunflower are Material Moving (66 | 15.0%), Production (29 | 6.6%), and Transportation (17 | 3.9%).
Production, Transportation and Moving Occupations by Sex
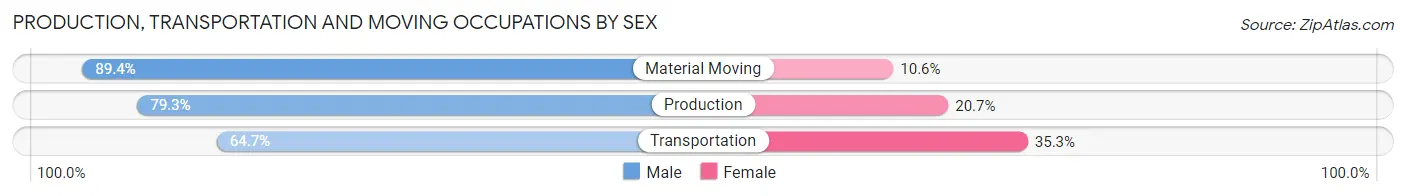
| Occupation | Male | Female |
| Production | 23 (79.3%) | 6 (20.7%) |
| Transportation | 11 (64.7%) | 6 (35.3%) |
| Material Moving | 59 (89.4%) | 7 (10.6%) |
| Total (Category) | 93 (83.0%) | 19 (17.0%) |
| Total (Overall) | 213 (48.5%) | 226 (51.5%) |
Employment Industries by Sex in Sunflower
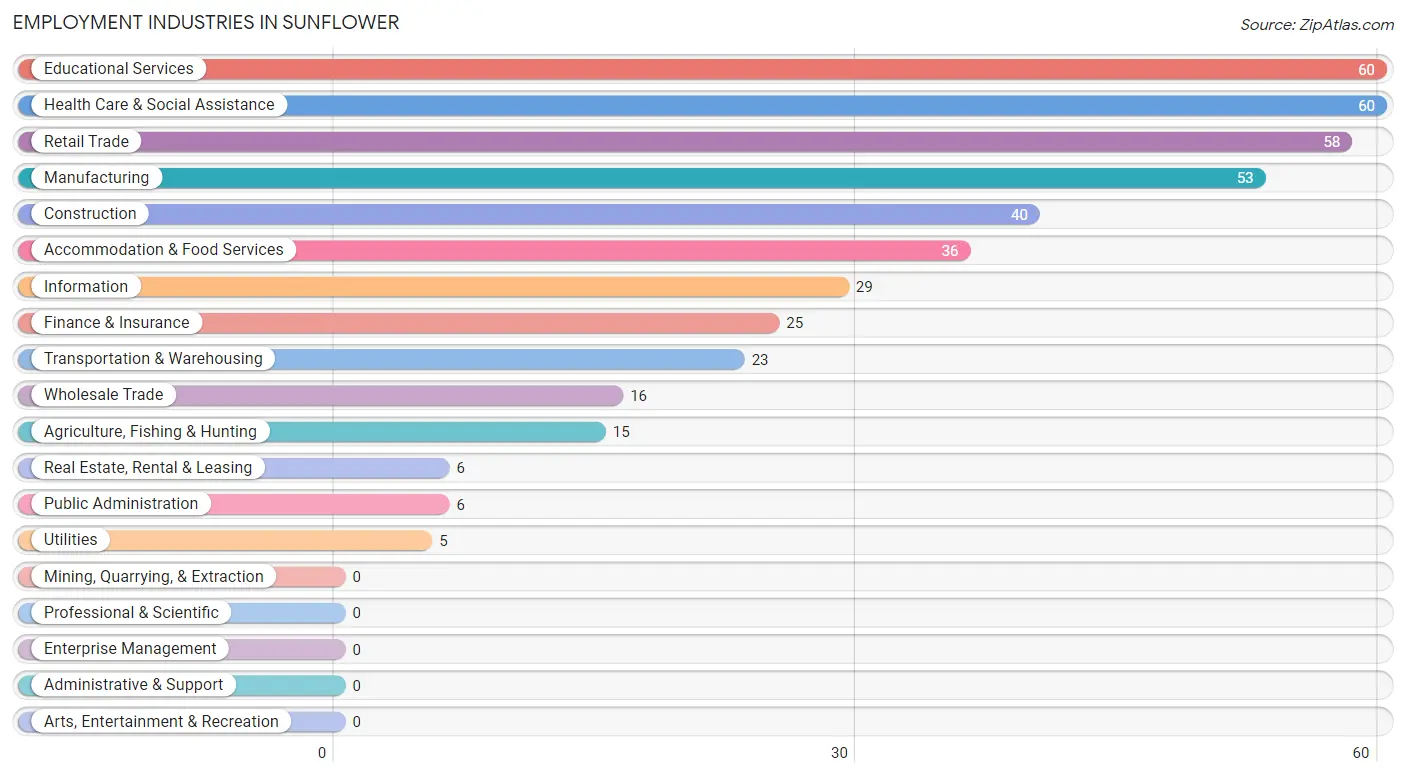
Employment Industries in Sunflower
The major employment industries in Sunflower include Educational Services (60 | 13.7%), Health Care & Social Assistance (60 | 13.7%), Retail Trade (58 | 13.2%), Manufacturing (53 | 12.1%), and Construction (40 | 9.1%).
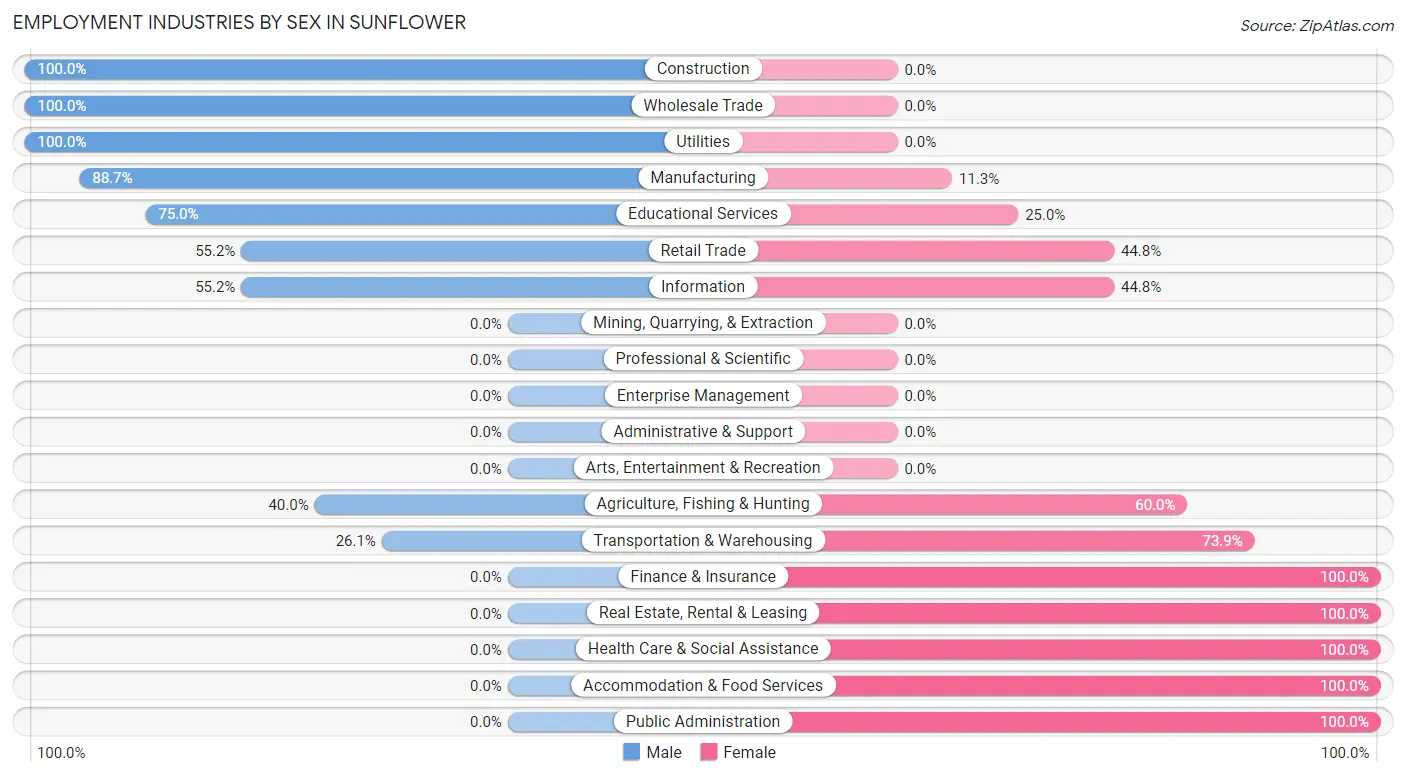
Employment Industries by Sex in Sunflower
The Sunflower industries that see more men than women are Construction (100.0%), Wholesale Trade (100.0%), and Utilities (100.0%), whereas the industries that tend to have a higher number of women are Finance & Insurance (100.0%), Real Estate, Rental & Leasing (100.0%), and Health Care & Social Assistance (100.0%).
| Industry | Male | Female |
| Agriculture, Fishing & Hunting | 6 (40.0%) | 9 (60.0%) |
| Mining, Quarrying, & Extraction | 0 (0.0%) | 0 (0.0%) |
| Construction | 40 (100.0%) | 0 (0.0%) |
| Manufacturing | 47 (88.7%) | 6 (11.3%) |
| Wholesale Trade | 16 (100.0%) | 0 (0.0%) |
| Retail Trade | 32 (55.2%) | 26 (44.8%) |
| Transportation & Warehousing | 6 (26.1%) | 17 (73.9%) |
| Utilities | 5 (100.0%) | 0 (0.0%) |
| Information | 16 (55.2%) | 13 (44.8%) |
| Finance & Insurance | 0 (0.0%) | 25 (100.0%) |
| Real Estate, Rental & Leasing | 0 (0.0%) | 6 (100.0%) |
| Professional & Scientific | 0 (0.0%) | 0 (0.0%) |
| Enterprise Management | 0 (0.0%) | 0 (0.0%) |
| Administrative & Support | 0 (0.0%) | 0 (0.0%) |
| Educational Services | 45 (75.0%) | 15 (25.0%) |
| Health Care & Social Assistance | 0 (0.0%) | 60 (100.0%) |
| Arts, Entertainment & Recreation | 0 (0.0%) | 0 (0.0%) |
| Accommodation & Food Services | 0 (0.0%) | 36 (100.0%) |
| Public Administration | 0 (0.0%) | 6 (100.0%) |
| Total | 213 (48.5%) | 226 (51.5%) |
Education in Sunflower
School Enrollment in Sunflower
The most common levels of schooling among the 313 students in Sunflower are high school (129 | 41.2%), middle school (96 | 30.7%), and elementary school (50 | 16.0%).
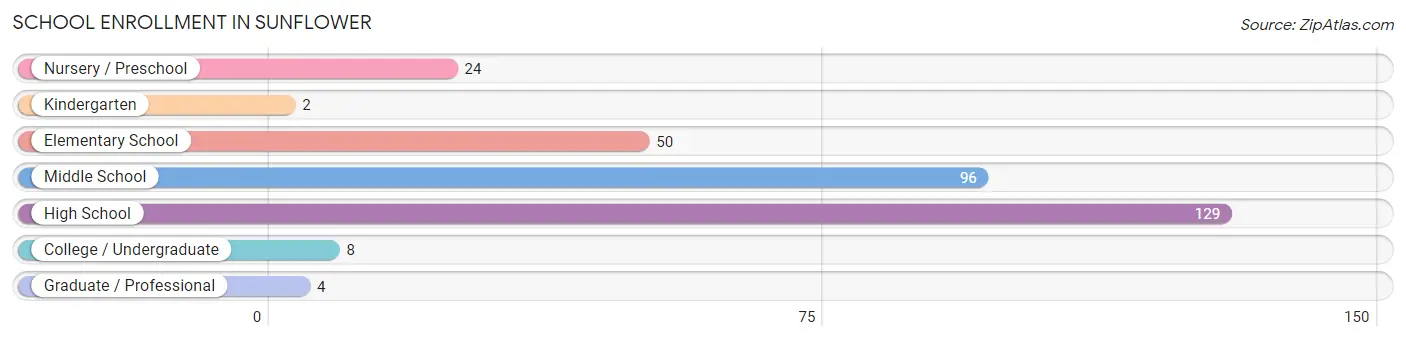
| School Level | # Students | % Students |
| Nursery / Preschool | 24 | 7.7% |
| Kindergarten | 2 | 0.6% |
| Elementary School | 50 | 16.0% |
| Middle School | 96 | 30.7% |
| High School | 129 | 41.2% |
| College / Undergraduate | 8 | 2.6% |
| Graduate / Professional | 4 | 1.3% |
| Total | 313 | 100.0% |
School Enrollment by Age by Funding Source in Sunflower
Out of a total of 313 students who are enrolled in schools in Sunflower, 18 (5.8%) attend a private institution, while the remaining 295 (94.2%) are enrolled in public schools. The age group of 10 to 14 year olds has the highest likelihood of being enrolled in private schools, with 15 (12.1% in the age bracket) enrolled. Conversely, the age group of 3 to 4 year olds has the lowest likelihood of being enrolled in a private school, with 22 (100.0% in the age bracket) attending a public institution.
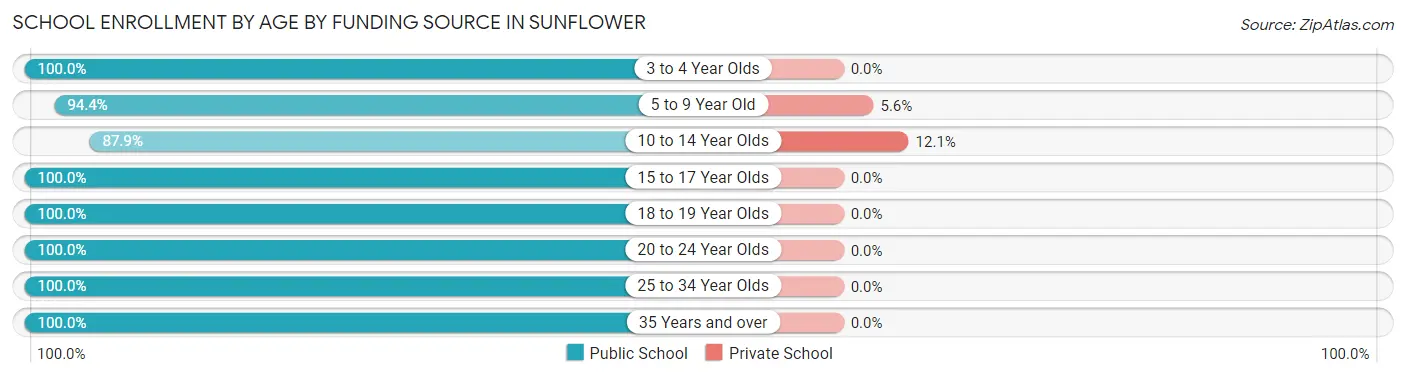
| Age Bracket | Public School | Private School |
| 3 to 4 Year Olds | 22 (100.0%) | 0 (0.0%) |
| 5 to 9 Year Old | 51 (94.4%) | 3 (5.6%) |
| 10 to 14 Year Olds | 109 (87.9%) | 15 (12.1%) |
| 15 to 17 Year Olds | 51 (100.0%) | 0 (0.0%) |
| 18 to 19 Year Olds | 21 (100.0%) | 0 (0.0%) |
| 20 to 24 Year Olds | 29 (100.0%) | 0 (0.0%) |
| 25 to 34 Year Olds | 8 (100.0%) | 0 (0.0%) |
| 35 Years and over | 4 (100.0%) | 0 (0.0%) |
| Total | 295 (94.2%) | 18 (5.8%) |
Educational Attainment by Field of Study in Sunflower
Education (42 | 28.8%), science & technology (27 | 18.5%), arts & humanities (19 | 13.0%), literature & languages (14 | 9.6%), and engineering (12 | 8.2%) are the most common fields of study among 146 individuals in Sunflower who have obtained a bachelor's degree or higher.
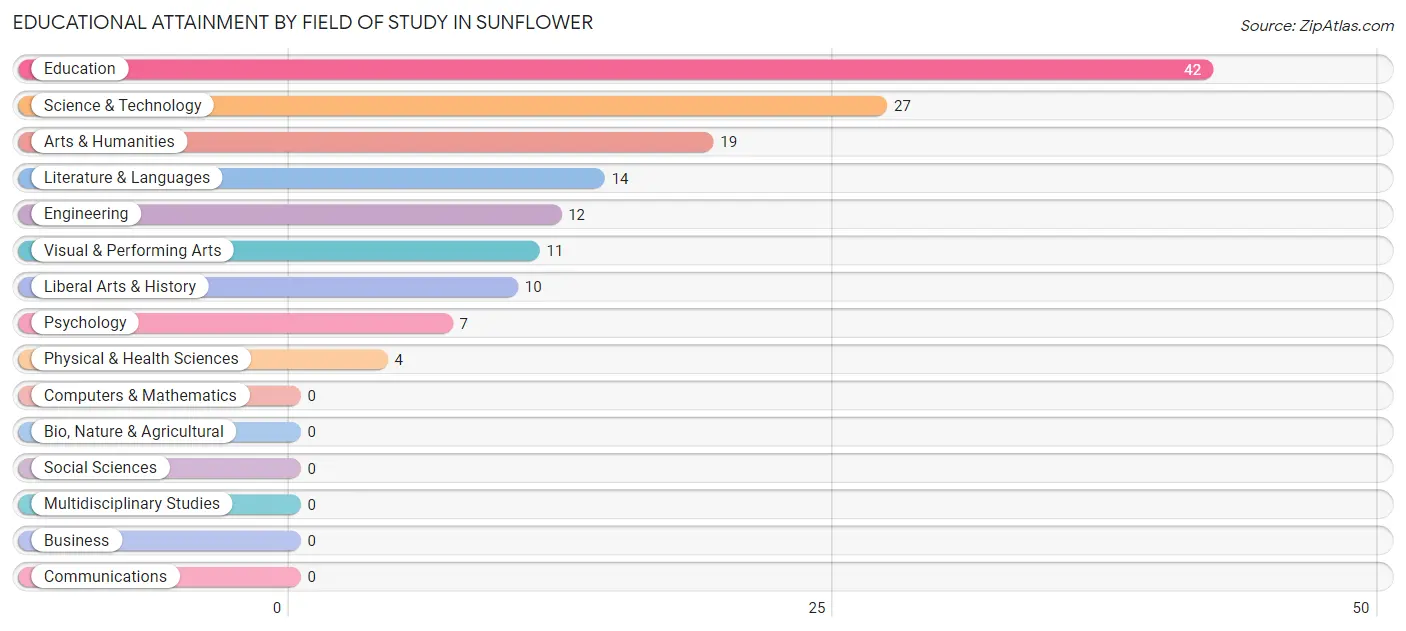
| Field of Study | # Graduates | % Graduates |
| Computers & Mathematics | 0 | 0.0% |
| Bio, Nature & Agricultural | 0 | 0.0% |
| Physical & Health Sciences | 4 | 2.7% |
| Psychology | 7 | 4.8% |
| Social Sciences | 0 | 0.0% |
| Engineering | 12 | 8.2% |
| Multidisciplinary Studies | 0 | 0.0% |
| Science & Technology | 27 | 18.5% |
| Business | 0 | 0.0% |
| Education | 42 | 28.8% |
| Literature & Languages | 14 | 9.6% |
| Liberal Arts & History | 10 | 6.9% |
| Visual & Performing Arts | 11 | 7.5% |
| Communications | 0 | 0.0% |
| Arts & Humanities | 19 | 13.0% |
| Total | 146 | 100.0% |
Transportation & Commute in Sunflower
Vehicle Availability by Sex in Sunflower
The most prevalent vehicle ownership categories in Sunflower are males with 2 vehicles (104, accounting for 48.8%) and females with 2 vehicles (99, making up 50.0%).
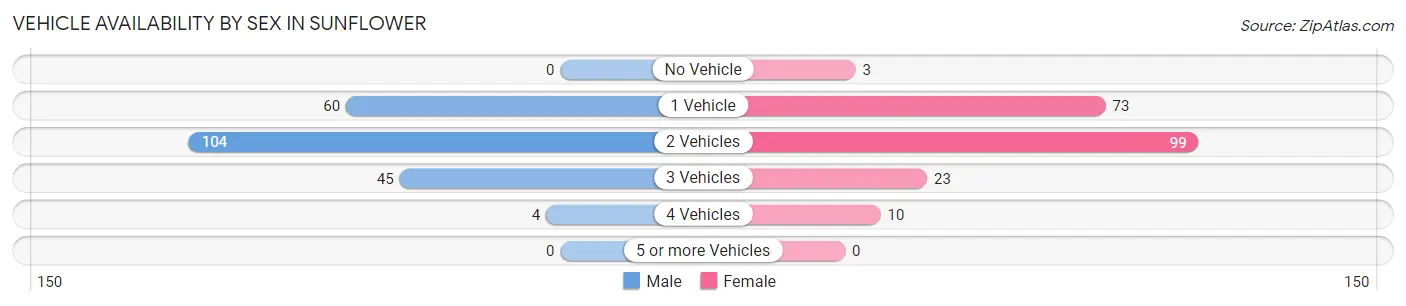
| Vehicles Available | Male | Female |
| No Vehicle | 0 (0.0%) | 3 (1.4%) |
| 1 Vehicle | 60 (28.2%) | 73 (35.1%) |
| 2 Vehicles | 104 (48.8%) | 99 (47.6%) |
| 3 Vehicles | 45 (21.1%) | 23 (11.1%) |
| 4 Vehicles | 4 (1.9%) | 10 (4.8%) |
| 5 or more Vehicles | 0 (0.0%) | 0 (0.0%) |
| Total | 213 (100.0%) | 208 (100.0%) |
Commute Time in Sunflower
The most frequently occuring commute durations in Sunflower are 15 to 19 minutes (141 commuters, 36.9%), 5 to 9 minutes (53 commuters, 13.9%), and 10 to 14 minutes (50 commuters, 13.1%).
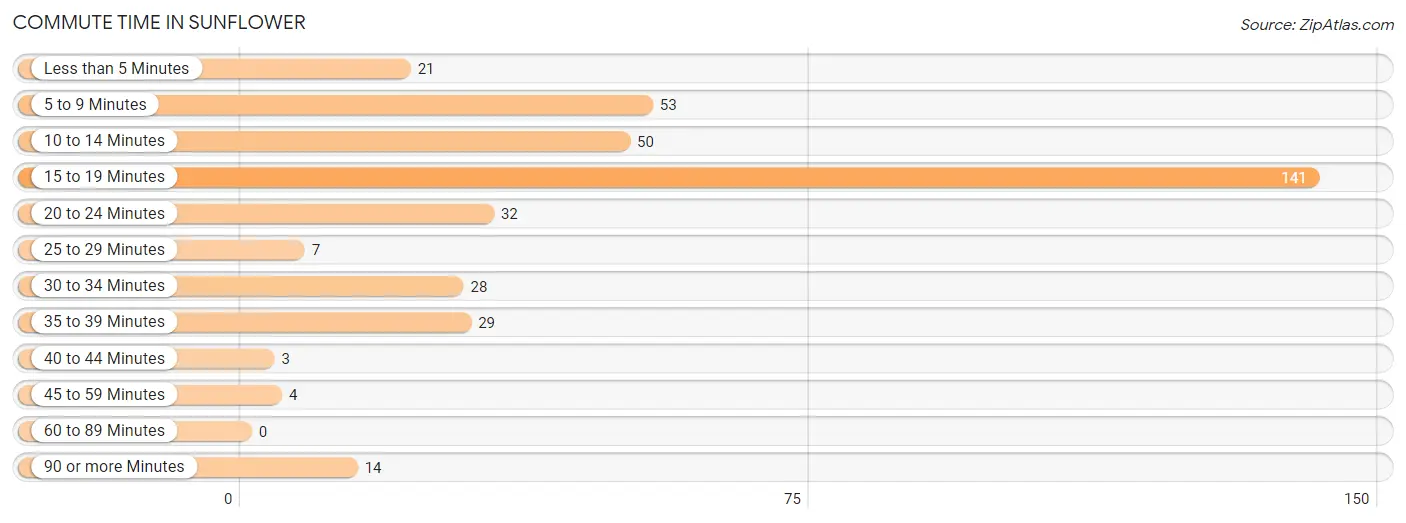
| Commute Time | # Commuters | % Commuters |
| Less than 5 Minutes | 21 | 5.5% |
| 5 to 9 Minutes | 53 | 13.9% |
| 10 to 14 Minutes | 50 | 13.1% |
| 15 to 19 Minutes | 141 | 36.9% |
| 20 to 24 Minutes | 32 | 8.4% |
| 25 to 29 Minutes | 7 | 1.8% |
| 30 to 34 Minutes | 28 | 7.3% |
| 35 to 39 Minutes | 29 | 7.6% |
| 40 to 44 Minutes | 3 | 0.8% |
| 45 to 59 Minutes | 4 | 1.1% |
| 60 to 89 Minutes | 0 | 0.0% |
| 90 or more Minutes | 14 | 3.7% |
Commute Time by Sex in Sunflower
The most common commute times in Sunflower are 15 to 19 minutes (83 commuters, 44.4%) for males and 15 to 19 minutes (58 commuters, 29.7%) for females.
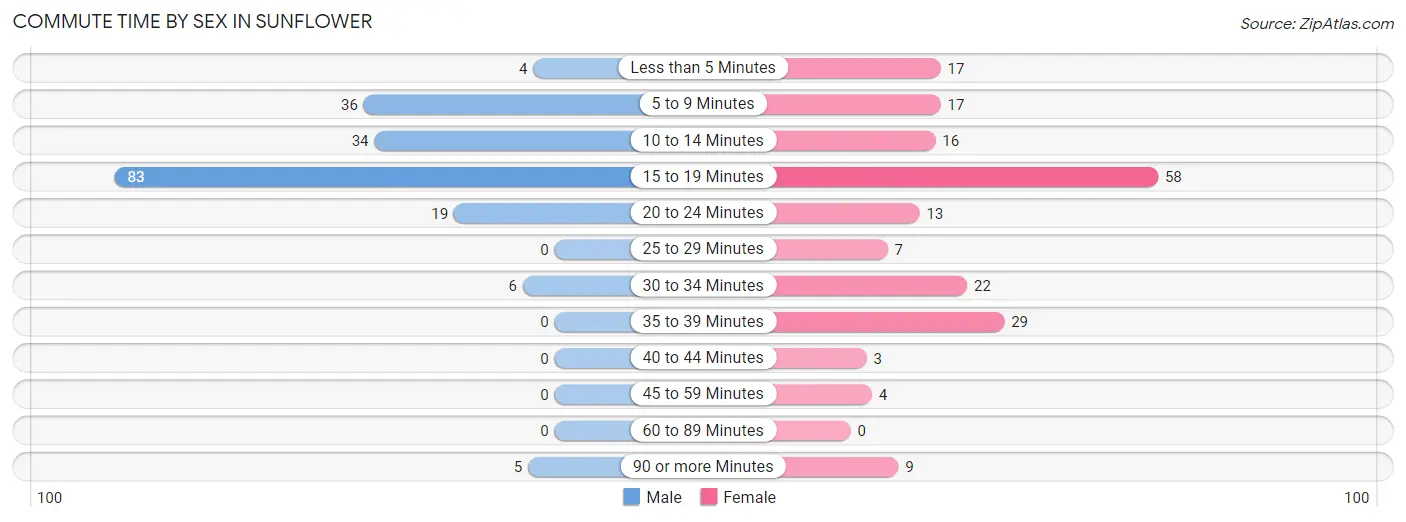
| Commute Time | Male | Female |
| Less than 5 Minutes | 4 (2.1%) | 17 (8.7%) |
| 5 to 9 Minutes | 36 (19.3%) | 17 (8.7%) |
| 10 to 14 Minutes | 34 (18.2%) | 16 (8.2%) |
| 15 to 19 Minutes | 83 (44.4%) | 58 (29.7%) |
| 20 to 24 Minutes | 19 (10.2%) | 13 (6.7%) |
| 25 to 29 Minutes | 0 (0.0%) | 7 (3.6%) |
| 30 to 34 Minutes | 6 (3.2%) | 22 (11.3%) |
| 35 to 39 Minutes | 0 (0.0%) | 29 (14.9%) |
| 40 to 44 Minutes | 0 (0.0%) | 3 (1.5%) |
| 45 to 59 Minutes | 0 (0.0%) | 4 (2.1%) |
| 60 to 89 Minutes | 0 (0.0%) | 0 (0.0%) |
| 90 or more Minutes | 5 (2.7%) | 9 (4.6%) |
Time of Departure to Work by Sex in Sunflower
The most frequent times of departure to work in Sunflower are 5:30 AM to 5:59 AM (64, 34.2%) for males and 7:30 AM to 7:59 AM (45, 23.1%) for females.
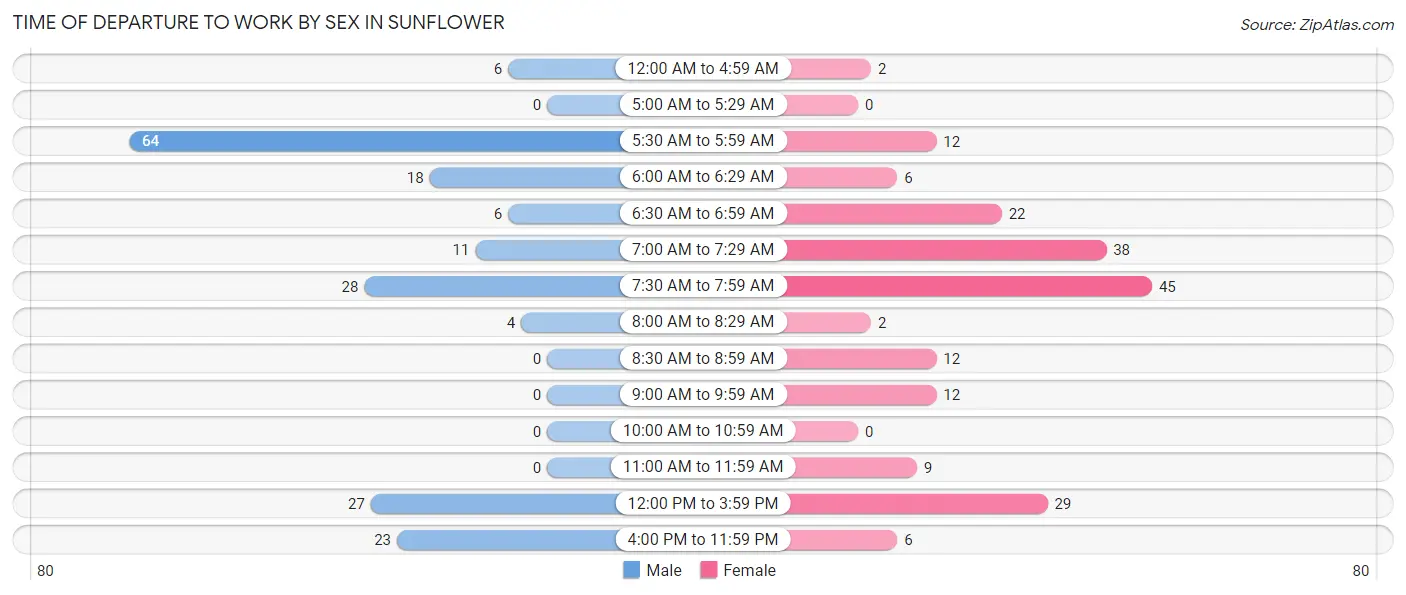
| Time of Departure | Male | Female |
| 12:00 AM to 4:59 AM | 6 (3.2%) | 2 (1.0%) |
| 5:00 AM to 5:29 AM | 0 (0.0%) | 0 (0.0%) |
| 5:30 AM to 5:59 AM | 64 (34.2%) | 12 (6.1%) |
| 6:00 AM to 6:29 AM | 18 (9.6%) | 6 (3.1%) |
| 6:30 AM to 6:59 AM | 6 (3.2%) | 22 (11.3%) |
| 7:00 AM to 7:29 AM | 11 (5.9%) | 38 (19.5%) |
| 7:30 AM to 7:59 AM | 28 (15.0%) | 45 (23.1%) |
| 8:00 AM to 8:29 AM | 4 (2.1%) | 2 (1.0%) |
| 8:30 AM to 8:59 AM | 0 (0.0%) | 12 (6.1%) |
| 9:00 AM to 9:59 AM | 0 (0.0%) | 12 (6.1%) |
| 10:00 AM to 10:59 AM | 0 (0.0%) | 0 (0.0%) |
| 11:00 AM to 11:59 AM | 0 (0.0%) | 9 (4.6%) |
| 12:00 PM to 3:59 PM | 27 (14.4%) | 29 (14.9%) |
| 4:00 PM to 11:59 PM | 23 (12.3%) | 6 (3.1%) |
| Total | 187 (100.0%) | 195 (100.0%) |
Housing Occupancy in Sunflower
Occupancy by Ownership in Sunflower
Of the total 439 dwellings in Sunflower, owner-occupied units account for 204 (46.5%), while renter-occupied units make up 235 (53.5%).
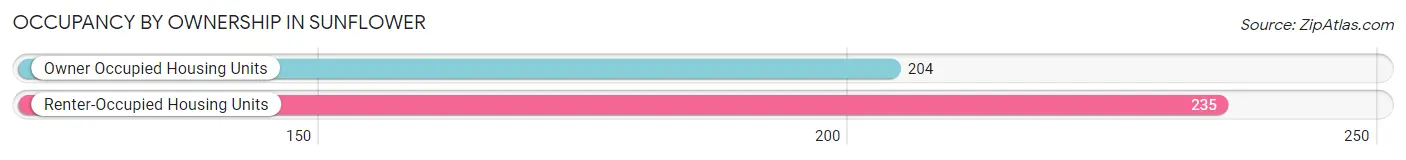
| Occupancy | # Housing Units | % Housing Units |
| Owner Occupied Housing Units | 204 | 46.5% |
| Renter-Occupied Housing Units | 235 | 53.5% |
| Total Occupied Housing Units | 439 | 100.0% |
Occupancy by Household Size in Sunflower
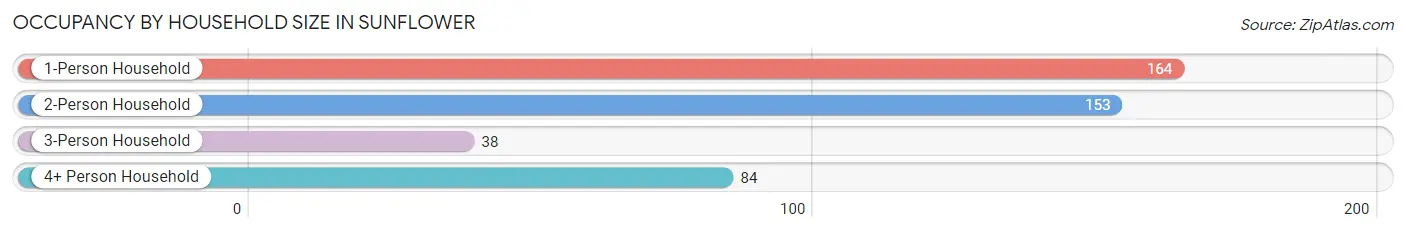
| Household Size | # Housing Units | % Housing Units |
| 1-Person Household | 164 | 37.4% |
| 2-Person Household | 153 | 34.8% |
| 3-Person Household | 38 | 8.7% |
| 4+ Person Household | 84 | 19.1% |
| Total Housing Units | 439 | 100.0% |
Occupancy by Ownership by Household Size in Sunflower
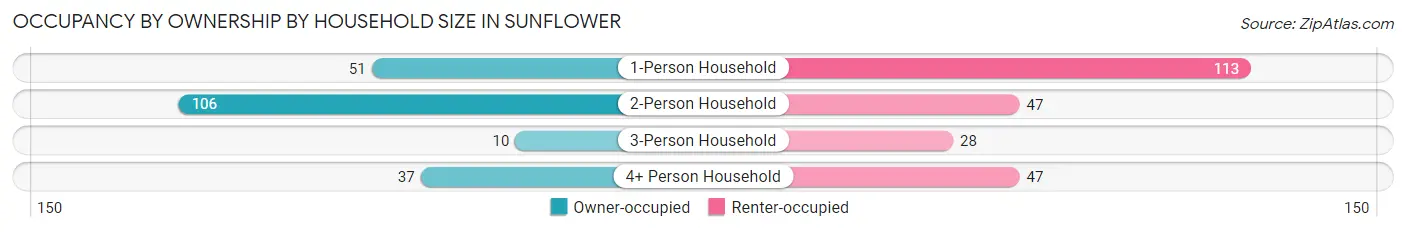
| Household Size | Owner-occupied | Renter-occupied |
| 1-Person Household | 51 (31.1%) | 113 (68.9%) |
| 2-Person Household | 106 (69.3%) | 47 (30.7%) |
| 3-Person Household | 10 (26.3%) | 28 (73.7%) |
| 4+ Person Household | 37 (44.1%) | 47 (55.9%) |
| Total Housing Units | 204 (46.5%) | 235 (53.5%) |
Occupancy by Educational Attainment in Sunflower
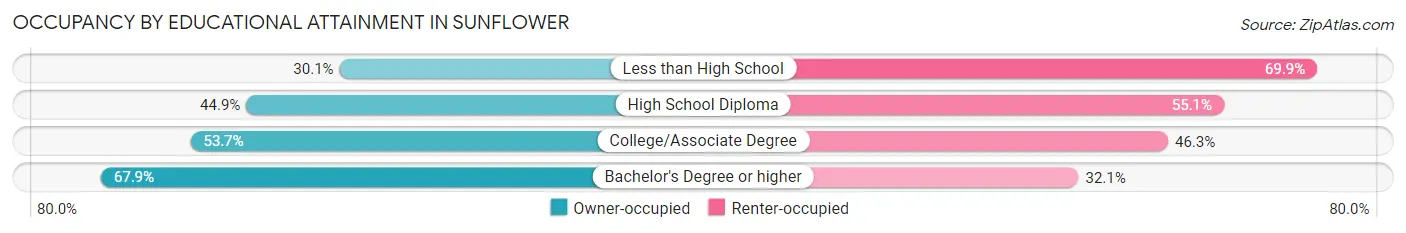
| Household Size | Owner-occupied | Renter-occupied |
| Less than High School | 43 (30.1%) | 100 (69.9%) |
| High School Diploma | 48 (44.9%) | 59 (55.1%) |
| College/Associate Degree | 58 (53.7%) | 50 (46.3%) |
| Bachelor's Degree or higher | 55 (67.9%) | 26 (32.1%) |
Occupancy by Age of Householder in Sunflower
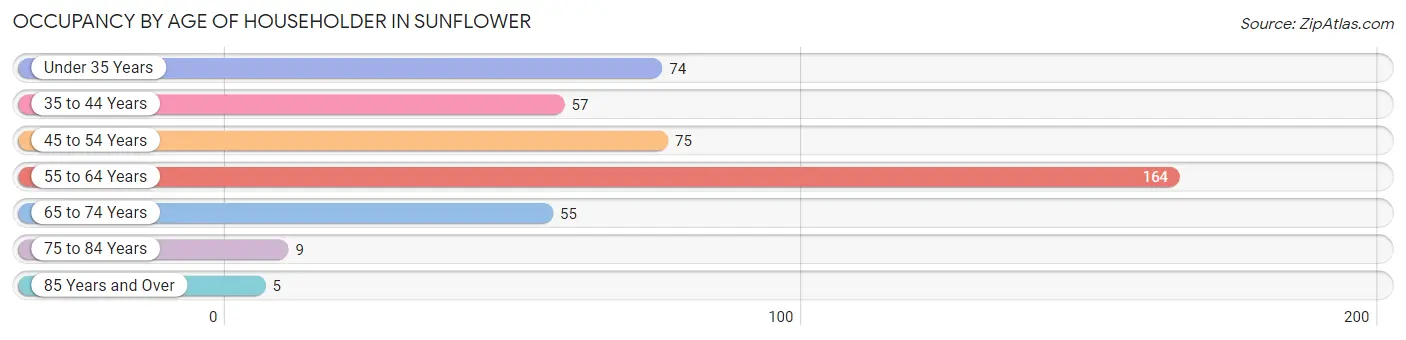
| Age Bracket | # Households | % Households |
| Under 35 Years | 74 | 16.9% |
| 35 to 44 Years | 57 | 13.0% |
| 45 to 54 Years | 75 | 17.1% |
| 55 to 64 Years | 164 | 37.4% |
| 65 to 74 Years | 55 | 12.5% |
| 75 to 84 Years | 9 | 2.1% |
| 85 Years and Over | 5 | 1.1% |
| Total | 439 | 100.0% |
Housing Finances in Sunflower
Median Income by Occupancy in Sunflower
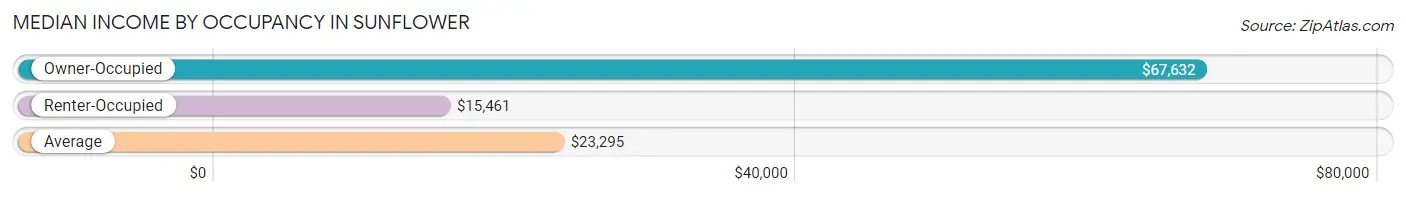
| Occupancy Type | # Households | Median Income |
| Owner-Occupied | 204 (46.5%) | $67,632 |
| Renter-Occupied | 235 (53.5%) | $15,461 |
| Average | 439 (100.0%) | $23,295 |
Occupancy by Householder Income Bracket in Sunflower
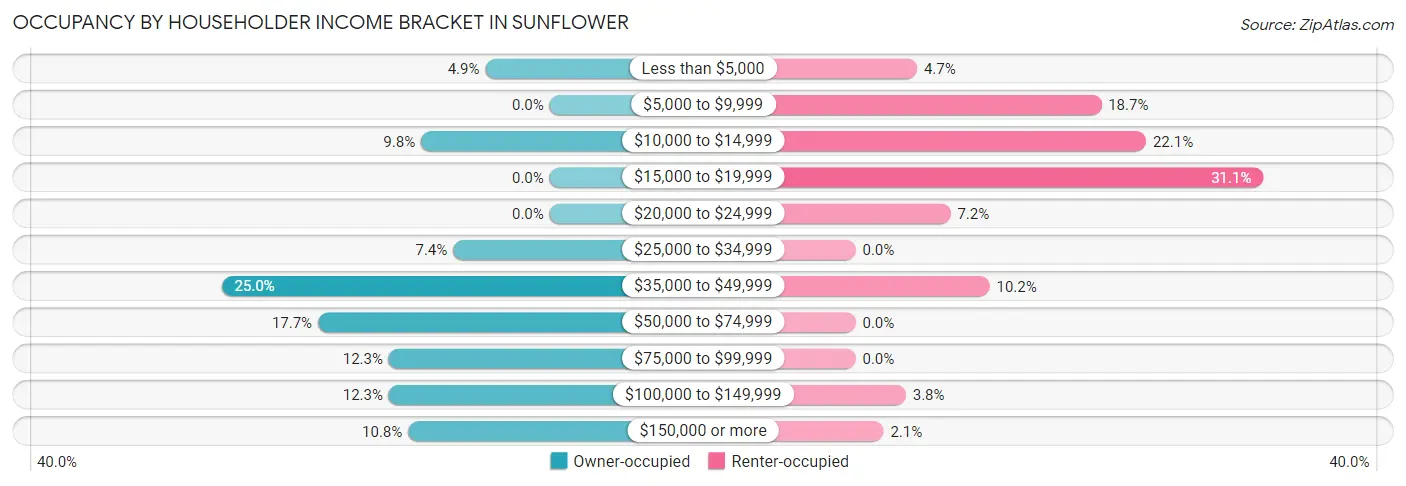
| Income Bracket | Owner-occupied | Renter-occupied |
| Less than $5,000 | 10 (4.9%) | 11 (4.7%) |
| $5,000 to $9,999 | 0 (0.0%) | 44 (18.7%) |
| $10,000 to $14,999 | 20 (9.8%) | 52 (22.1%) |
| $15,000 to $19,999 | 0 (0.0%) | 73 (31.1%) |
| $20,000 to $24,999 | 0 (0.0%) | 17 (7.2%) |
| $25,000 to $34,999 | 15 (7.3%) | 0 (0.0%) |
| $35,000 to $49,999 | 51 (25.0%) | 24 (10.2%) |
| $50,000 to $74,999 | 36 (17.6%) | 0 (0.0%) |
| $75,000 to $99,999 | 25 (12.2%) | 0 (0.0%) |
| $100,000 to $149,999 | 25 (12.2%) | 9 (3.8%) |
| $150,000 or more | 22 (10.8%) | 5 (2.1%) |
| Total | 204 (100.0%) | 235 (100.0%) |
Monthly Housing Cost Tiers in Sunflower
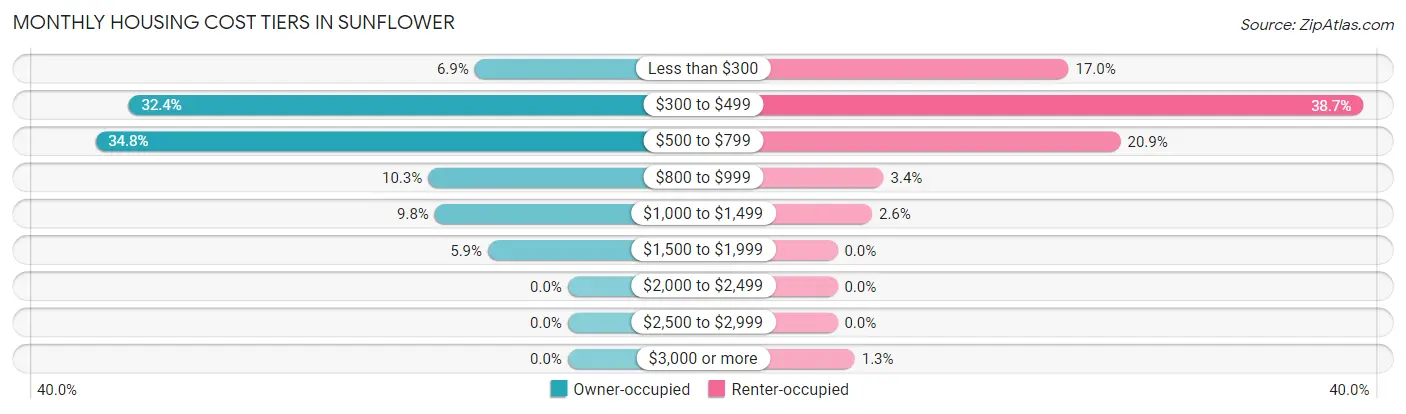
| Monthly Cost | Owner-occupied | Renter-occupied |
| Less than $300 | 14 (6.9%) | 40 (17.0%) |
| $300 to $499 | 66 (32.4%) | 91 (38.7%) |
| $500 to $799 | 71 (34.8%) | 49 (20.8%) |
| $800 to $999 | 21 (10.3%) | 8 (3.4%) |
| $1,000 to $1,499 | 20 (9.8%) | 6 (2.5%) |
| $1,500 to $1,999 | 12 (5.9%) | 0 (0.0%) |
| $2,000 to $2,499 | 0 (0.0%) | 0 (0.0%) |
| $2,500 to $2,999 | 0 (0.0%) | 0 (0.0%) |
| $3,000 or more | 0 (0.0%) | 3 (1.3%) |
| Total | 204 (100.0%) | 235 (100.0%) |
Physical Housing Characteristics in Sunflower
Housing Structures in Sunflower
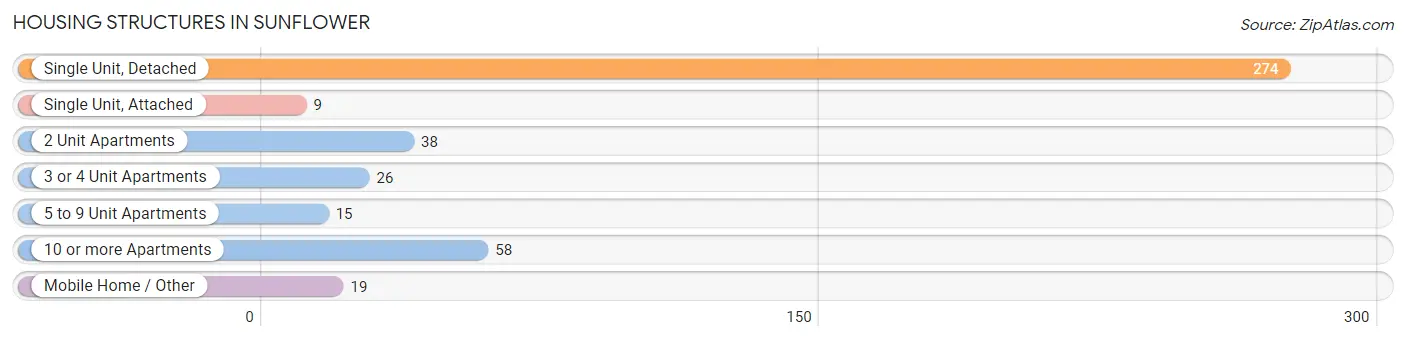
| Structure Type | # Housing Units | % Housing Units |
| Single Unit, Detached | 274 | 62.4% |
| Single Unit, Attached | 9 | 2.1% |
| 2 Unit Apartments | 38 | 8.7% |
| 3 or 4 Unit Apartments | 26 | 5.9% |
| 5 to 9 Unit Apartments | 15 | 3.4% |
| 10 or more Apartments | 58 | 13.2% |
| Mobile Home / Other | 19 | 4.3% |
| Total | 439 | 100.0% |
Housing Structures by Occupancy in Sunflower
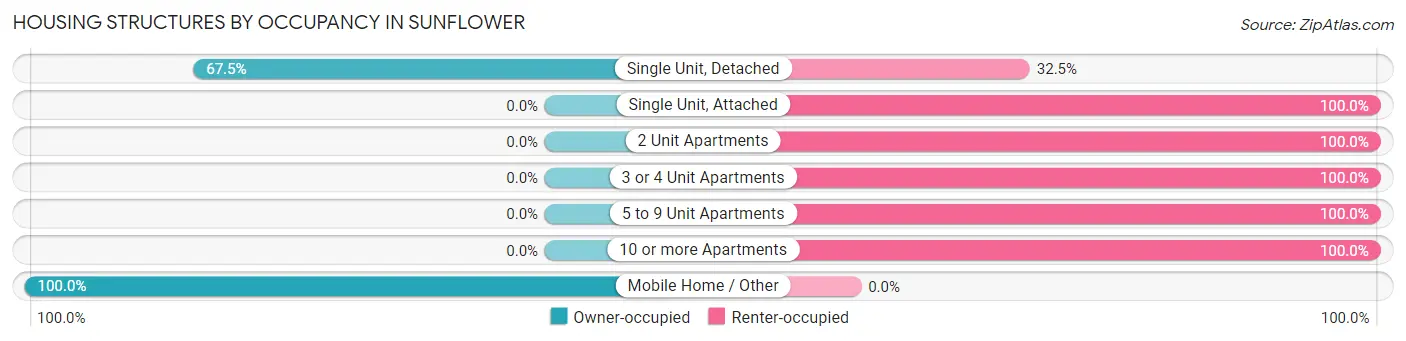
| Structure Type | Owner-occupied | Renter-occupied |
| Single Unit, Detached | 185 (67.5%) | 89 (32.5%) |
| Single Unit, Attached | 0 (0.0%) | 9 (100.0%) |
| 2 Unit Apartments | 0 (0.0%) | 38 (100.0%) |
| 3 or 4 Unit Apartments | 0 (0.0%) | 26 (100.0%) |
| 5 to 9 Unit Apartments | 0 (0.0%) | 15 (100.0%) |
| 10 or more Apartments | 0 (0.0%) | 58 (100.0%) |
| Mobile Home / Other | 19 (100.0%) | 0 (0.0%) |
| Total | 204 (46.5%) | 235 (53.5%) |
Housing Structures by Number of Rooms in Sunflower
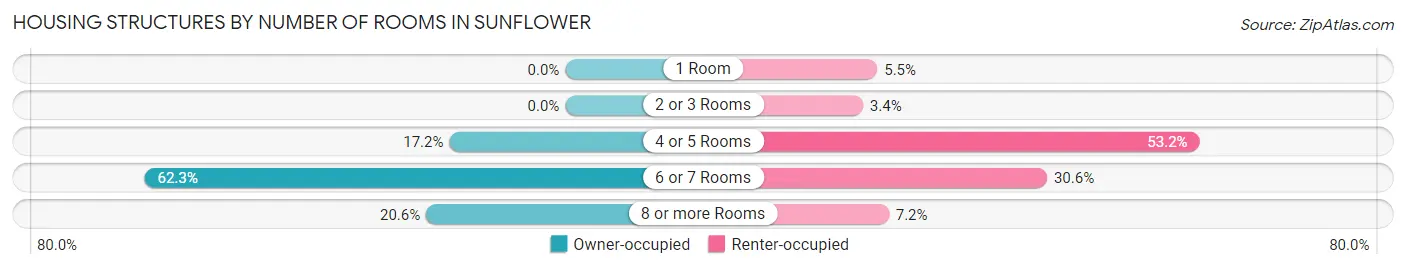
| Number of Rooms | Owner-occupied | Renter-occupied |
| 1 Room | 0 (0.0%) | 13 (5.5%) |
| 2 or 3 Rooms | 0 (0.0%) | 8 (3.4%) |
| 4 or 5 Rooms | 35 (17.2%) | 125 (53.2%) |
| 6 or 7 Rooms | 127 (62.3%) | 72 (30.6%) |
| 8 or more Rooms | 42 (20.6%) | 17 (7.2%) |
| Total | 204 (100.0%) | 235 (100.0%) |
Housing Structure by Heating Type in Sunflower
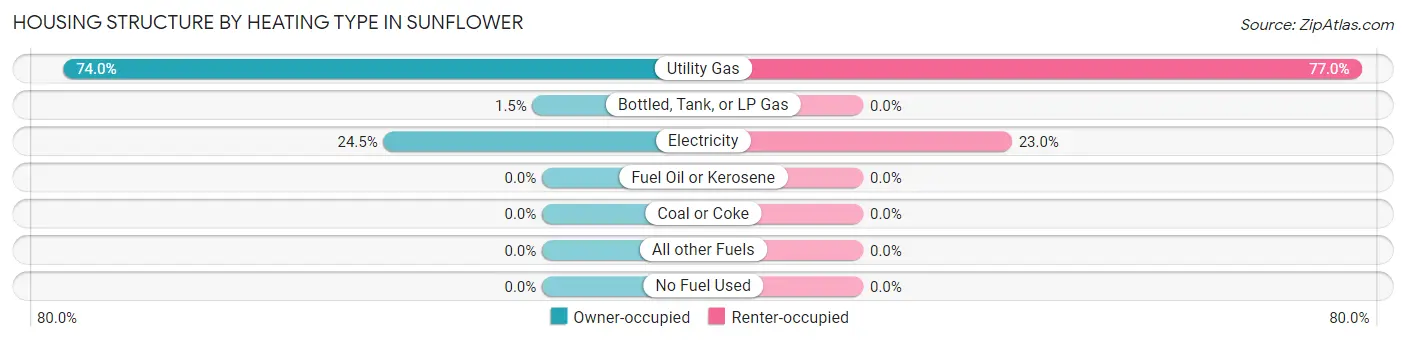
| Heating Type | Owner-occupied | Renter-occupied |
| Utility Gas | 151 (74.0%) | 181 (77.0%) |
| Bottled, Tank, or LP Gas | 3 (1.5%) | 0 (0.0%) |
| Electricity | 50 (24.5%) | 54 (23.0%) |
| Fuel Oil or Kerosene | 0 (0.0%) | 0 (0.0%) |
| Coal or Coke | 0 (0.0%) | 0 (0.0%) |
| All other Fuels | 0 (0.0%) | 0 (0.0%) |
| No Fuel Used | 0 (0.0%) | 0 (0.0%) |
| Total | 204 (100.0%) | 235 (100.0%) |
Household Vehicle Usage in Sunflower
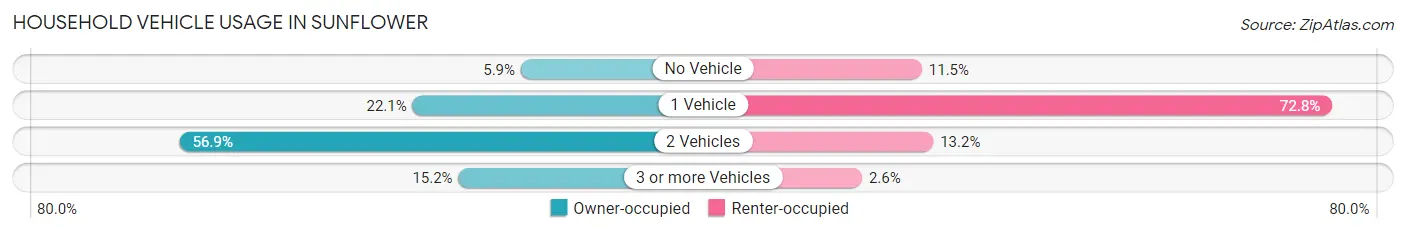
| Vehicles per Household | Owner-occupied | Renter-occupied |
| No Vehicle | 12 (5.9%) | 27 (11.5%) |
| 1 Vehicle | 45 (22.1%) | 171 (72.8%) |
| 2 Vehicles | 116 (56.9%) | 31 (13.2%) |
| 3 or more Vehicles | 31 (15.2%) | 6 (2.5%) |
| Total | 204 (100.0%) | 235 (100.0%) |
Real Estate & Mortgages in Sunflower
Real Estate and Mortgage Overview in Sunflower
| Characteristic | Without Mortgage | With Mortgage |
| Housing Units | 145 | 59 |
| Median Property Value | $82,700 | $75,200 |
| Median Household Income | $69,013 | $0 |
| Monthly Housing Costs | $477 | $0 |
| Real Estate Taxes | $948 | $25 |
Property Value by Mortgage Status in Sunflower
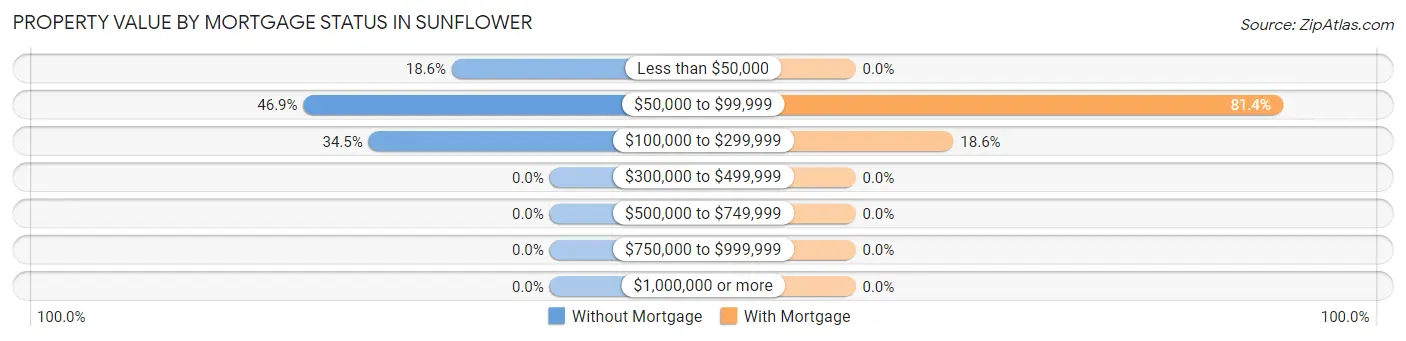
| Property Value | Without Mortgage | With Mortgage |
| Less than $50,000 | 27 (18.6%) | 0 (0.0%) |
| $50,000 to $99,999 | 68 (46.9%) | 48 (81.4%) |
| $100,000 to $299,999 | 50 (34.5%) | 11 (18.6%) |
| $300,000 to $499,999 | 0 (0.0%) | 0 (0.0%) |
| $500,000 to $749,999 | 0 (0.0%) | 0 (0.0%) |
| $750,000 to $999,999 | 0 (0.0%) | 0 (0.0%) |
| $1,000,000 or more | 0 (0.0%) | 0 (0.0%) |
| Total | 145 (100.0%) | 59 (100.0%) |
Household Income by Mortgage Status in Sunflower
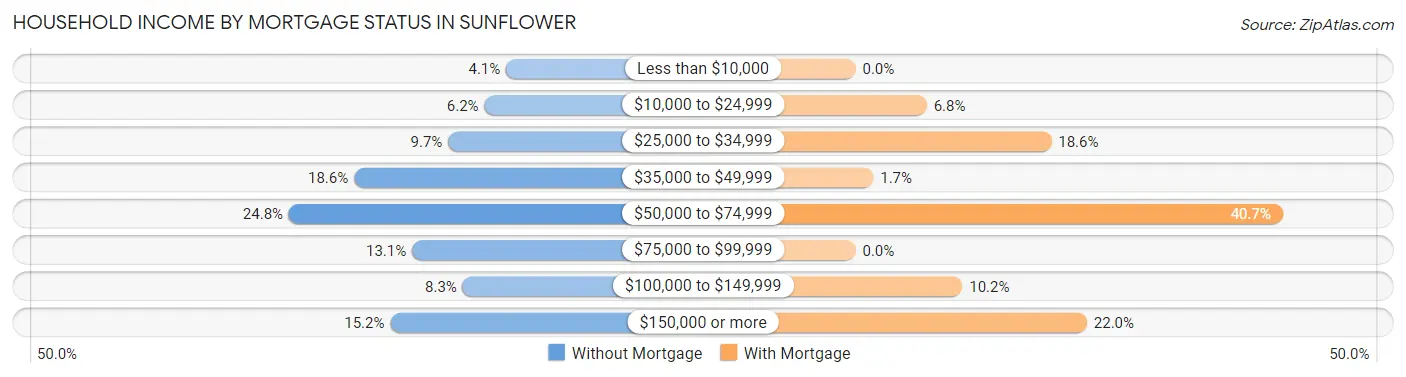
| Household Income | Without Mortgage | With Mortgage |
| Less than $10,000 | 6 (4.1%) | 0 (0.0%) |
| $10,000 to $24,999 | 9 (6.2%) | 4 (6.8%) |
| $25,000 to $34,999 | 14 (9.7%) | 11 (18.6%) |
| $35,000 to $49,999 | 27 (18.6%) | 1 (1.7%) |
| $50,000 to $74,999 | 36 (24.8%) | 24 (40.7%) |
| $75,000 to $99,999 | 19 (13.1%) | 0 (0.0%) |
| $100,000 to $149,999 | 12 (8.3%) | 6 (10.2%) |
| $150,000 or more | 22 (15.2%) | 13 (22.0%) |
| Total | 145 (100.0%) | 59 (100.0%) |
Property Value to Household Income Ratio in Sunflower
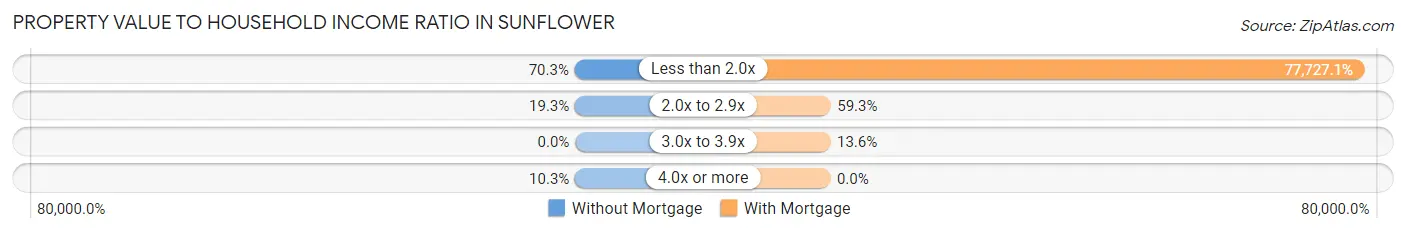
| Value-to-Income Ratio | Without Mortgage | With Mortgage |
| Less than 2.0x | 102 (70.3%) | 45,859 (77,727.1%) |
| 2.0x to 2.9x | 28 (19.3%) | 35 (59.3%) |
| 3.0x to 3.9x | 0 (0.0%) | 8 (13.6%) |
| 4.0x or more | 15 (10.3%) | 0 (0.0%) |
| Total | 145 (100.0%) | 59 (100.0%) |
Real Estate Taxes by Mortgage Status in Sunflower
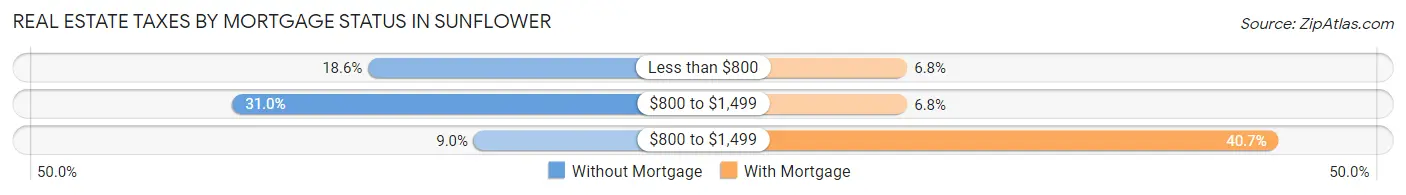
| Property Taxes | Without Mortgage | With Mortgage |
| Less than $800 | 27 (18.6%) | 4 (6.8%) |
| $800 to $1,499 | 45 (31.0%) | 4 (6.8%) |
| $800 to $1,499 | 13 (9.0%) | 24 (40.7%) |
| Total | 145 (100.0%) | 59 (100.0%) |
Health & Disability in Sunflower
Health Insurance Coverage by Age in Sunflower
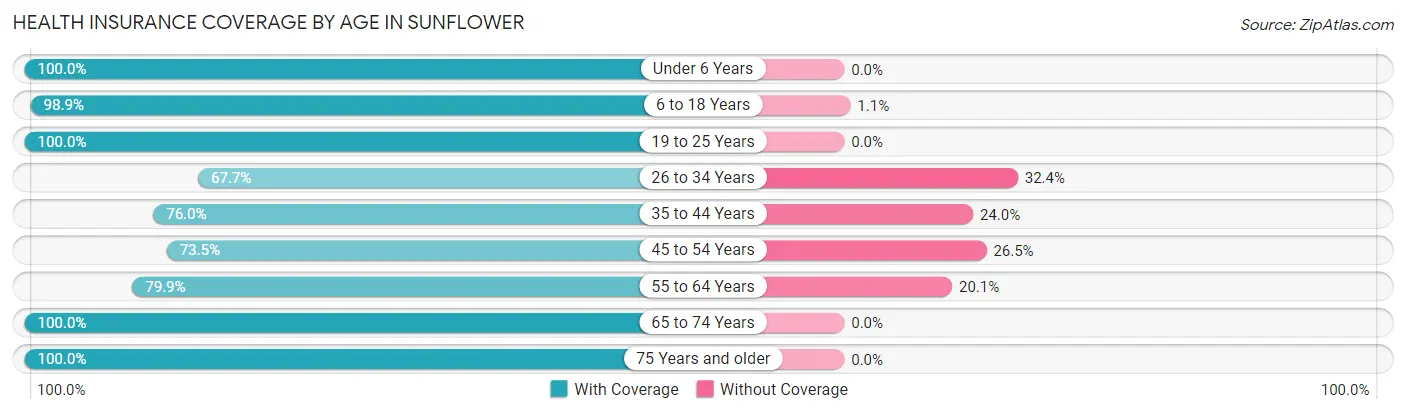
| Age Bracket | With Coverage | Without Coverage |
| Under 6 Years | 93 (100.0%) | 0 (0.0%) |
| 6 to 18 Years | 261 (98.9%) | 3 (1.1%) |
| 19 to 25 Years | 91 (100.0%) | 0 (0.0%) |
| 26 to 34 Years | 115 (67.6%) | 55 (32.4%) |
| 35 to 44 Years | 114 (76.0%) | 36 (24.0%) |
| 45 to 54 Years | 61 (73.5%) | 22 (26.5%) |
| 55 to 64 Years | 163 (79.9%) | 41 (20.1%) |
| 65 to 74 Years | 68 (100.0%) | 0 (0.0%) |
| 75 Years and older | 21 (100.0%) | 0 (0.0%) |
| Total | 987 (86.3%) | 157 (13.7%) |
Health Insurance Coverage by Citizenship Status in Sunflower
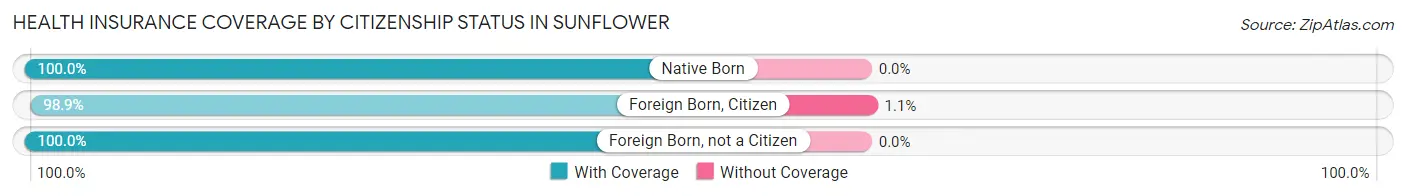
| Citizenship Status | With Coverage | Without Coverage |
| Native Born | 93 (100.0%) | 0 (0.0%) |
| Foreign Born, Citizen | 261 (98.9%) | 3 (1.1%) |
| Foreign Born, not a Citizen | 91 (100.0%) | 0 (0.0%) |
Health Insurance Coverage by Household Income in Sunflower
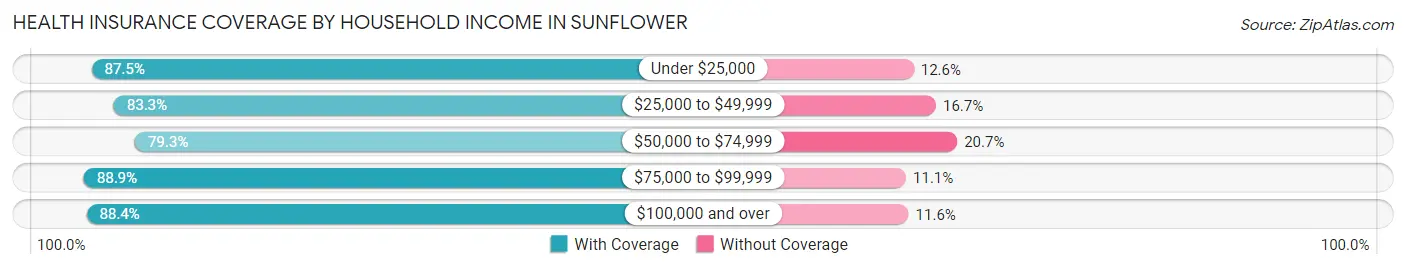
| Household Income | With Coverage | Without Coverage |
| Under $25,000 | 460 (87.5%) | 66 (12.6%) |
| $25,000 to $49,999 | 234 (83.3%) | 47 (16.7%) |
| $50,000 to $74,999 | 46 (79.3%) | 12 (20.7%) |
| $75,000 to $99,999 | 64 (88.9%) | 8 (11.1%) |
| $100,000 and over | 183 (88.4%) | 24 (11.6%) |
Public vs Private Health Insurance Coverage by Age in Sunflower
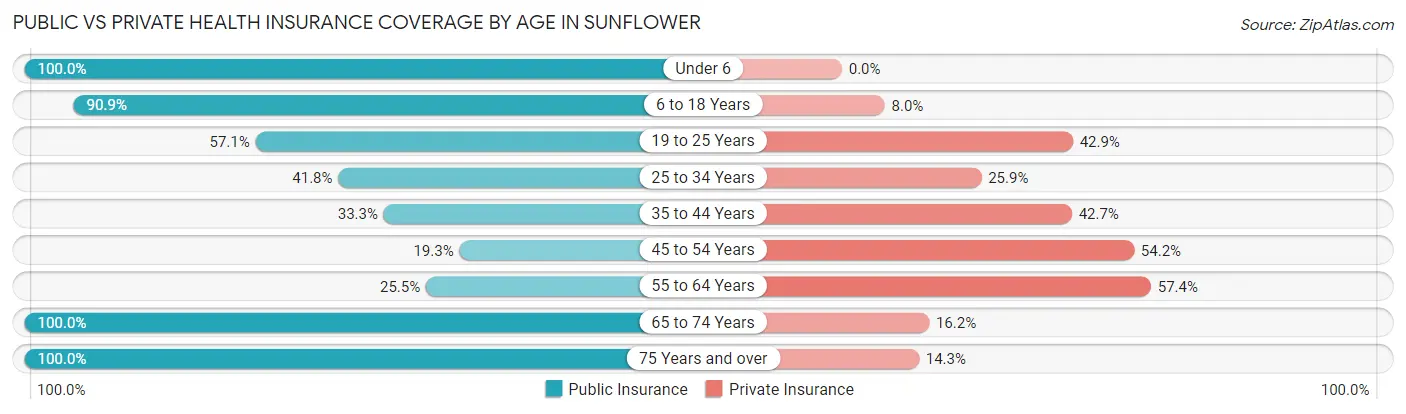
| Age Bracket | Public Insurance | Private Insurance |
| Under 6 | 93 (100.0%) | 0 (0.0%) |
| 6 to 18 Years | 240 (90.9%) | 21 (8.0%) |
| 19 to 25 Years | 52 (57.1%) | 39 (42.9%) |
| 25 to 34 Years | 71 (41.8%) | 44 (25.9%) |
| 35 to 44 Years | 50 (33.3%) | 64 (42.7%) |
| 45 to 54 Years | 16 (19.3%) | 45 (54.2%) |
| 55 to 64 Years | 52 (25.5%) | 117 (57.4%) |
| 65 to 74 Years | 68 (100.0%) | 11 (16.2%) |
| 75 Years and over | 21 (100.0%) | 3 (14.3%) |
| Total | 663 (58.0%) | 344 (30.1%) |
Disability Status by Sex by Age in Sunflower
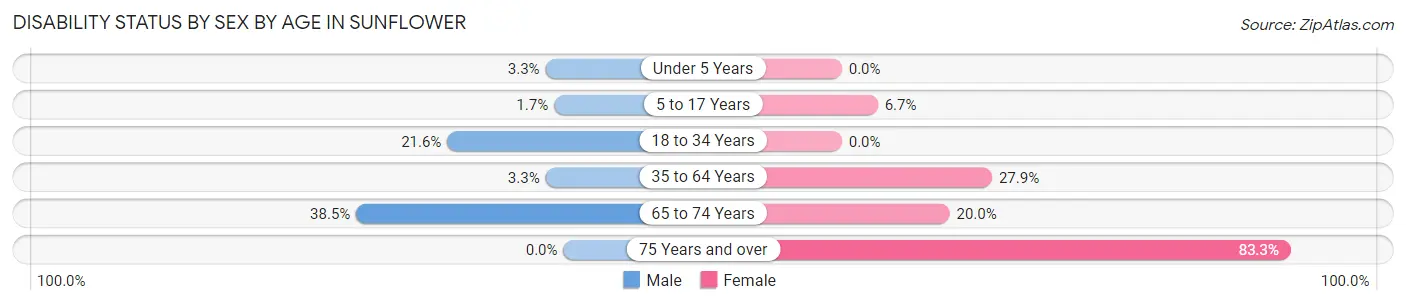
| Age Bracket | Male | Female |
| Under 5 Years | 2 (3.3%) | 0 (0.0%) |
| 5 to 17 Years | 2 (1.7%) | 8 (6.7%) |
| 18 to 34 Years | 36 (21.6%) | 0 (0.0%) |
| 35 to 64 Years | 7 (3.3%) | 63 (27.9%) |
| 65 to 74 Years | 5 (38.5%) | 11 (20.0%) |
| 75 Years and over | 0 (0.0%) | 10 (83.3%) |
Disability Class by Sex by Age in Sunflower
Disability Class: Hearing Difficulty
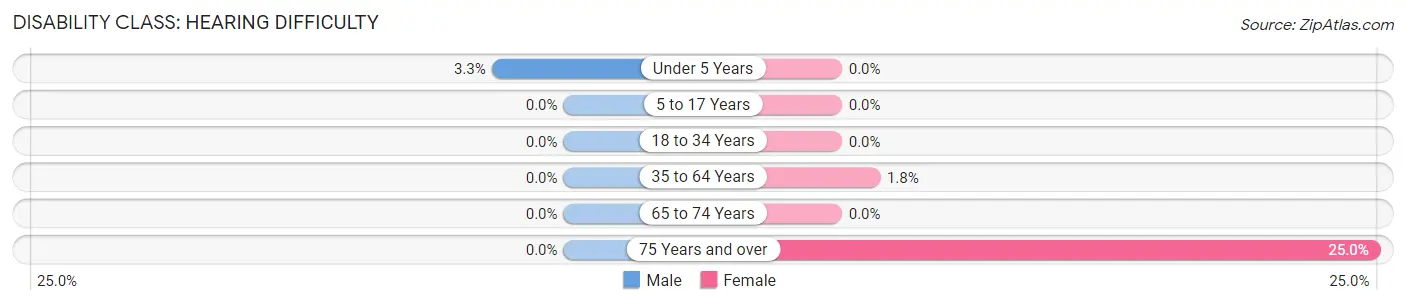
| Age Bracket | Male | Female |
| Under 5 Years | 2 (3.3%) | 0 (0.0%) |
| 5 to 17 Years | 0 (0.0%) | 0 (0.0%) |
| 18 to 34 Years | 0 (0.0%) | 0 (0.0%) |
| 35 to 64 Years | 0 (0.0%) | 4 (1.8%) |
| 65 to 74 Years | 0 (0.0%) | 0 (0.0%) |
| 75 Years and over | 0 (0.0%) | 3 (25.0%) |
Disability Class: Vision Difficulty
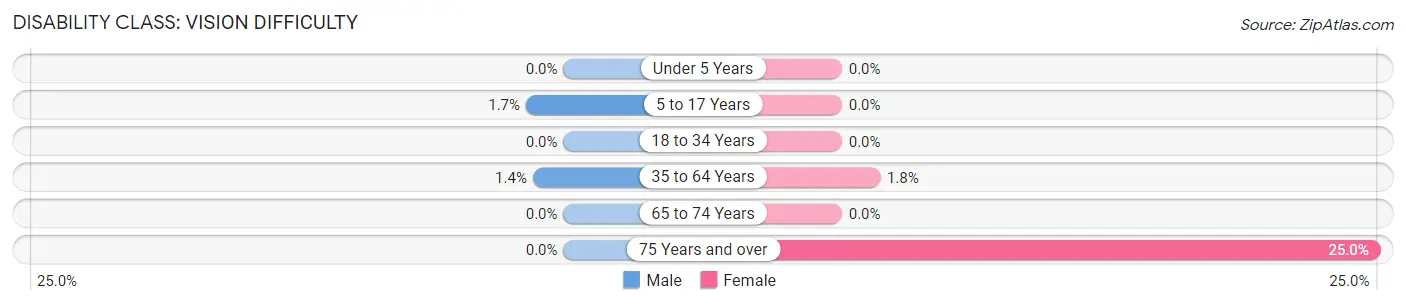
| Age Bracket | Male | Female |
| Under 5 Years | 0 (0.0%) | 0 (0.0%) |
| 5 to 17 Years | 2 (1.7%) | 0 (0.0%) |
| 18 to 34 Years | 0 (0.0%) | 0 (0.0%) |
| 35 to 64 Years | 3 (1.4%) | 4 (1.8%) |
| 65 to 74 Years | 0 (0.0%) | 0 (0.0%) |
| 75 Years and over | 0 (0.0%) | 3 (25.0%) |
Disability Class: Cognitive Difficulty
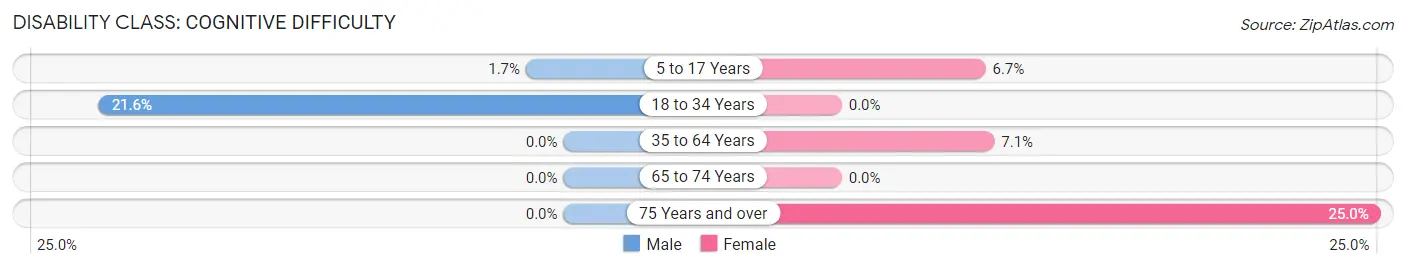
| Age Bracket | Male | Female |
| 5 to 17 Years | 2 (1.7%) | 8 (6.7%) |
| 18 to 34 Years | 36 (21.6%) | 0 (0.0%) |
| 35 to 64 Years | 0 (0.0%) | 16 (7.1%) |
| 65 to 74 Years | 0 (0.0%) | 0 (0.0%) |
| 75 Years and over | 0 (0.0%) | 3 (25.0%) |
Disability Class: Ambulatory Difficulty
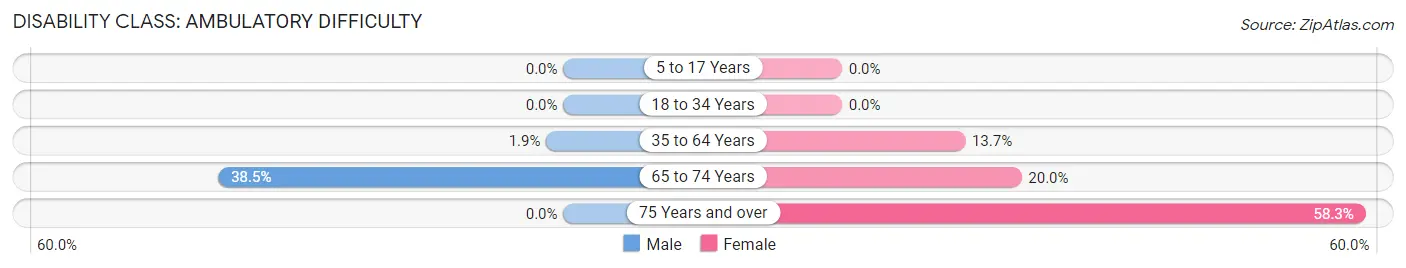
| Age Bracket | Male | Female |
| 5 to 17 Years | 0 (0.0%) | 0 (0.0%) |
| 18 to 34 Years | 0 (0.0%) | 0 (0.0%) |
| 35 to 64 Years | 4 (1.9%) | 31 (13.7%) |
| 65 to 74 Years | 5 (38.5%) | 11 (20.0%) |
| 75 Years and over | 0 (0.0%) | 7 (58.3%) |
Disability Class: Self-Care Difficulty
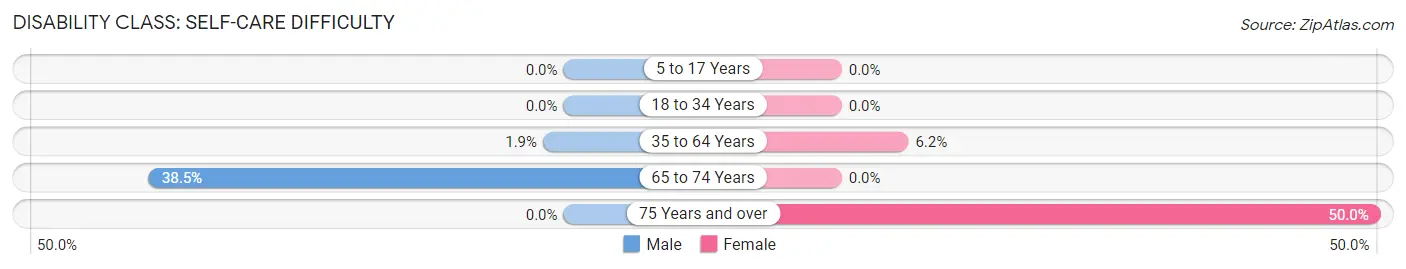
| Age Bracket | Male | Female |
| 5 to 17 Years | 0 (0.0%) | 0 (0.0%) |
| 18 to 34 Years | 0 (0.0%) | 0 (0.0%) |
| 35 to 64 Years | 4 (1.9%) | 14 (6.2%) |
| 65 to 74 Years | 5 (38.5%) | 0 (0.0%) |
| 75 Years and over | 0 (0.0%) | 6 (50.0%) |
Technology Access in Sunflower
Computing Device Access in Sunflower
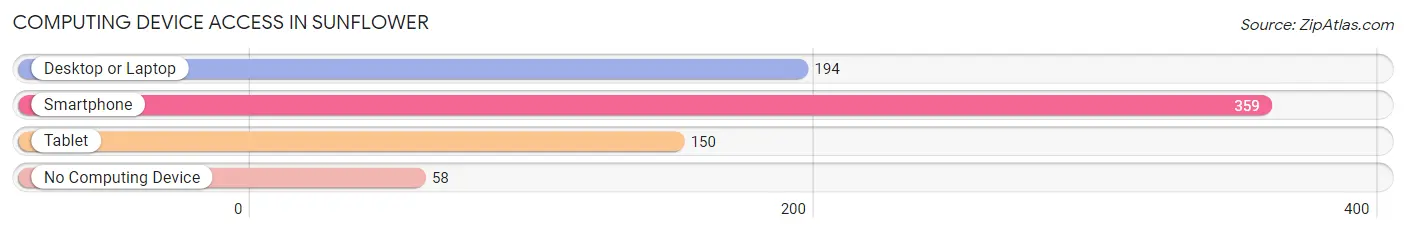
| Device Type | # Households | % Households |
| Desktop or Laptop | 194 | 44.2% |
| Smartphone | 359 | 81.8% |
| Tablet | 150 | 34.2% |
| No Computing Device | 58 | 13.2% |
| Total | 439 | 100.0% |
Internet Access in Sunflower
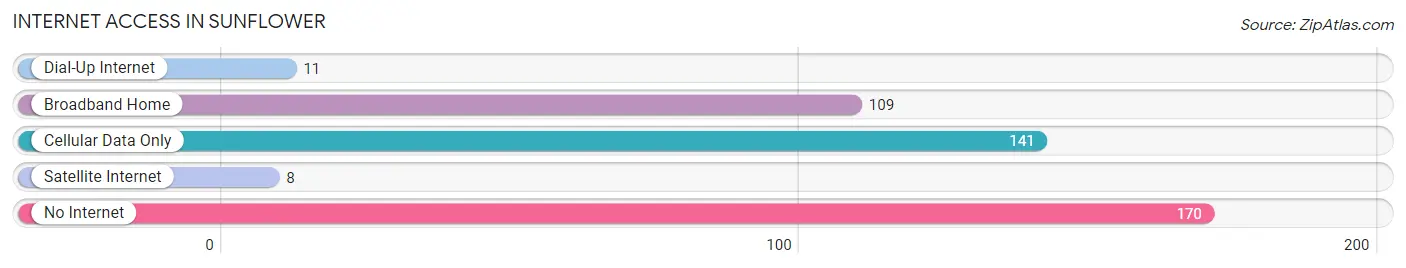
| Internet Type | # Households | % Households |
| Dial-Up Internet | 11 | 2.5% |
| Broadband Home | 109 | 24.8% |
| Cellular Data Only | 141 | 32.1% |
| Satellite Internet | 8 | 1.8% |
| No Internet | 170 | 38.7% |
| Total | 439 | 100.0% |
Sunflower Summary
Sunflower, Mississippi is a small town located in the Mississippi Delta region of the state. It is situated in the northwestern corner of Sunflower County, approximately 20 miles south of the state capital of Jackson. The town has a population of approximately 1,500 people and is the county seat of Sunflower County.
Geography
Sunflower is located in the Mississippi Delta region of the state, which is characterized by flat, fertile land and a humid subtropical climate. The town is situated on the banks of the Sunflower River, which flows through the county and provides a source of irrigation for the area’s agricultural industry. The town is surrounded by cotton fields and is located near the Mississippi River.
Economy
Sunflower’s economy is largely based on agriculture. The town is home to several cotton gins, which process the cotton grown in the surrounding fields. The town also has a number of small businesses, including a grocery store, a hardware store, and a few restaurants.
Demographics
As of the 2010 census, Sunflower had a population of 1,500 people. The racial makeup of the town was 79.2% African American, 19.3% White, 0.7% Native American, and 0.8% from other races. The median household income was $20,938, and the median family income was $25,000.
History
Sunflower was founded in 1871 and was named after the Sunflower River, which flows through the county. The town was originally a trading post for the local Native American tribes, and it quickly grew into a small farming community. In the early 1900s, the town began to experience a population boom as African Americans moved to the area to work in the cotton fields. The town was incorporated in 1912 and has remained a small, rural community ever since.
Sunflower has a rich history and culture, and it is home to several historic sites, including the Sunflower County Courthouse, the Sunflower County Jail, and the Sunflower County Museum. The town is also home to the Sunflower County Fair, which is held every year in October.
Sunflower is a small town with a rich history and culture. It is home to a diverse population and is a hub for the local agricultural industry. The town has experienced a population decline in recent years, but it remains an important part of the Mississippi Delta region.
Common Questions
What is Per Capita Income in Sunflower?
Per Capita income in Sunflower is $20,558.
What is the Median Family Income in Sunflower?
Median Family Income in Sunflower is $44,750.
What is the Median Household income in Sunflower?
Median Household Income in Sunflower is $23,295.
What is Income or Wage Gap in Sunflower?
Income or Wage Gap in Sunflower is 41.4%.
Women in Sunflower earn 58.6 cents for every dollar earned by a man.
What is Inequality or Gini Index in Sunflower?
Inequality or Gini Index in Sunflower is 0.55.
What is the Total Population of Sunflower?
Total Population of Sunflower is 1,144.
What is the Total Male Population of Sunflower?
Total Male Population of Sunflower is 575.
What is the Total Female Population of Sunflower?
Total Female Population of Sunflower is 569.
What is the Ratio of Males per 100 Females in Sunflower?
There are 101.05 Males per 100 Females in Sunflower.
What is the Ratio of Females per 100 Males in Sunflower?
There are 98.96 Females per 100 Males in Sunflower.
What is the Median Population Age in Sunflower?
Median Population Age in Sunflower is 33.4 Years.
What is the Average Family Size in Sunflower
Average Family Size in Sunflower is 3.6 People.
What is the Average Household Size in Sunflower
Average Household Size in Sunflower is 2.6 People.
How Large is the Labor Force in Sunflower?
There are 460 People in the Labor Forcein in Sunflower.
What is the Percentage of People in the Labor Force in Sunflower?
54.8% of People are in the Labor Force in Sunflower.
What is the Unemployment Rate in Sunflower?
Unemployment Rate in Sunflower is 4.6%.