West Hattiesburg, MS Map & Demographics
West Hattiesburg Map
West Hattiesburg Overview
$22,531
PER CAPITA INCOME
$50,645
AVG FAMILY INCOME
$41,181
AVG HOUSEHOLD INCOME
49.3%
WAGE / INCOME GAP [ % ]
50.7¢/ $1
WAGE / INCOME GAP [ $ ]
0.48
INEQUALITY / GINI INDEX
6,234
TOTAL POPULATION
2,476
MALE POPULATION
3,758
FEMALE POPULATION
65.89
MALES / 100 FEMALES
151.78
FEMALES / 100 MALES
31.3
MEDIAN AGE
3.4
AVG FAMILY SIZE
2.8
AVG HOUSEHOLD SIZE
2,969
LABOR FORCE [ PEOPLE ]
64.8%
PERCENT IN LABOR FORCE
14.3%
UNEMPLOYMENT RATE
Income in West Hattiesburg
Income Overview in West Hattiesburg
Per Capita Income in West Hattiesburg is $22,531, while median incomes of families and households are $50,645 and $41,181 respectively.
| Characteristic | Number | Measure |
| Per Capita Income | 6,234 | $22,531 |
| Median Family Income | 1,460 | $50,645 |
| Mean Family Income | 1,460 | $65,848 |
| Median Household Income | 2,238 | $41,181 |
| Mean Household Income | 2,238 | $59,540 |
| Income Deficit | 1,460 | $0 |
| Wage / Income Gap (%) | 6,234 | 49.31% |
| Wage / Income Gap ($) | 6,234 | 50.69¢ per $1 |
| Gini / Inequality Index | 6,234 | 0.48 |
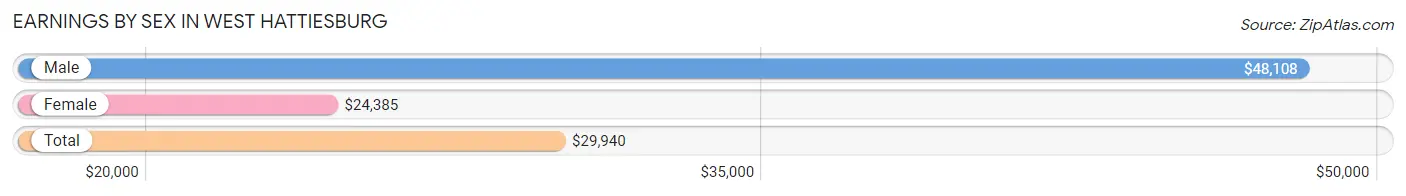
Earnings by Sex in West Hattiesburg
Average Earnings in West Hattiesburg are $29,940, $48,108 for men and $24,385 for women, a difference of 49.3%.
| Sex | Number | Average Earnings |
| Male | 1,255 (43.2%) | $48,108 |
| Female | 1,649 (56.8%) | $24,385 |
| Total | 2,904 (100.0%) | $29,940 |
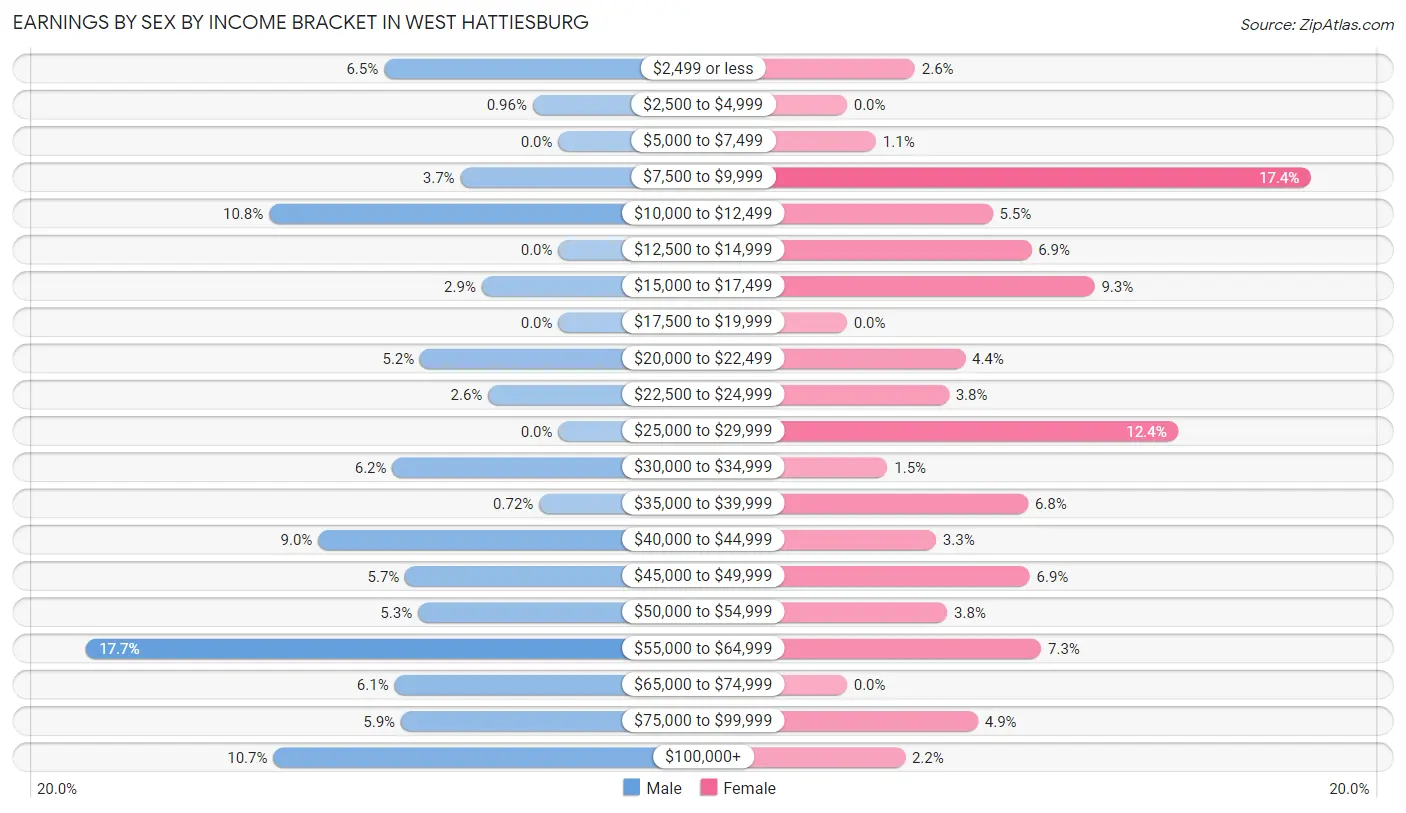
Earnings by Sex by Income Bracket in West Hattiesburg
The most common earnings brackets in West Hattiesburg are $55,000 to $64,999 for men (222 | 17.7%) and $7,500 to $9,999 for women (287 | 17.4%).
| Income | Male | Female |
| $2,499 or less | 82 (6.5%) | 42 (2.5%) |
| $2,500 to $4,999 | 12 (1.0%) | 0 (0.0%) |
| $5,000 to $7,499 | 0 (0.0%) | 18 (1.1%) |
| $7,500 to $9,999 | 46 (3.7%) | 287 (17.4%) |
| $10,000 to $12,499 | 136 (10.8%) | 90 (5.5%) |
| $12,500 to $14,999 | 0 (0.0%) | 114 (6.9%) |
| $15,000 to $17,499 | 36 (2.9%) | 153 (9.3%) |
| $17,500 to $19,999 | 0 (0.0%) | 0 (0.0%) |
| $20,000 to $22,499 | 65 (5.2%) | 73 (4.4%) |
| $22,500 to $24,999 | 33 (2.6%) | 63 (3.8%) |
| $25,000 to $29,999 | 0 (0.0%) | 205 (12.4%) |
| $30,000 to $34,999 | 78 (6.2%) | 25 (1.5%) |
| $35,000 to $39,999 | 9 (0.7%) | 112 (6.8%) |
| $40,000 to $44,999 | 113 (9.0%) | 55 (3.3%) |
| $45,000 to $49,999 | 72 (5.7%) | 113 (6.9%) |
| $50,000 to $54,999 | 66 (5.3%) | 62 (3.8%) |
| $55,000 to $64,999 | 222 (17.7%) | 120 (7.3%) |
| $65,000 to $74,999 | 77 (6.1%) | 0 (0.0%) |
| $75,000 to $99,999 | 74 (5.9%) | 81 (4.9%) |
| $100,000+ | 134 (10.7%) | 36 (2.2%) |
| Total | 1,255 (100.0%) | 1,649 (100.0%) |
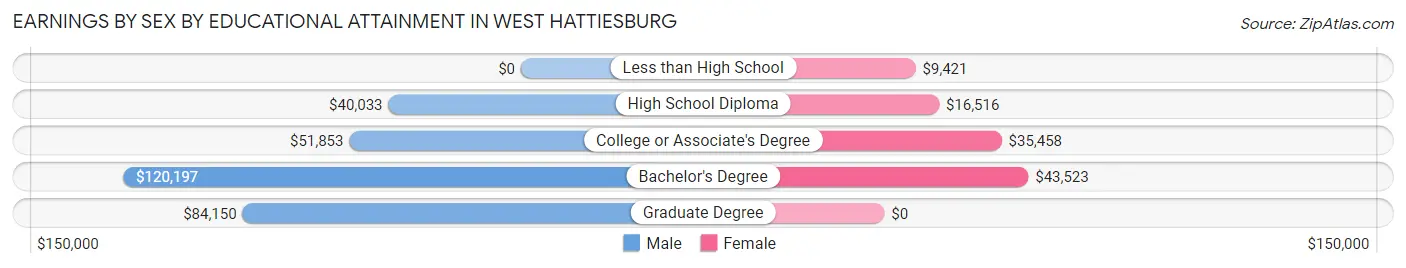
Earnings by Sex by Educational Attainment in West Hattiesburg
Average earnings in West Hattiesburg are $47,778 for men and $25,750 for women, a difference of 46.1%. Men with an educational attainment of bachelor's degree enjoy the highest average annual earnings of $120,197, while those with high school diploma education earn the least with $40,033. Women with an educational attainment of bachelor's degree earn the most with the average annual earnings of $43,523, while those with less than high school education have the smallest earnings of $9,421.
| Educational Attainment | Male Income | Female Income |
| Less than High School | - | - |
| High School Diploma | $40,033 | $16,516 |
| College or Associate's Degree | $51,853 | $35,458 |
| Bachelor's Degree | $120,197 | $43,523 |
| Graduate Degree | $84,150 | $0 |
| Total | $47,778 | $25,750 |
Family Income in West Hattiesburg
Family Income Brackets in West Hattiesburg
According to the West Hattiesburg family income data, there are 264 families falling into the $100,000 to $149,999 income range, which is the most common income bracket and makes up 18.1% of all families. Conversely, the $10,000 to $14,999 income bracket is the least frequent group with only 36 families (2.5%) belonging to this category.
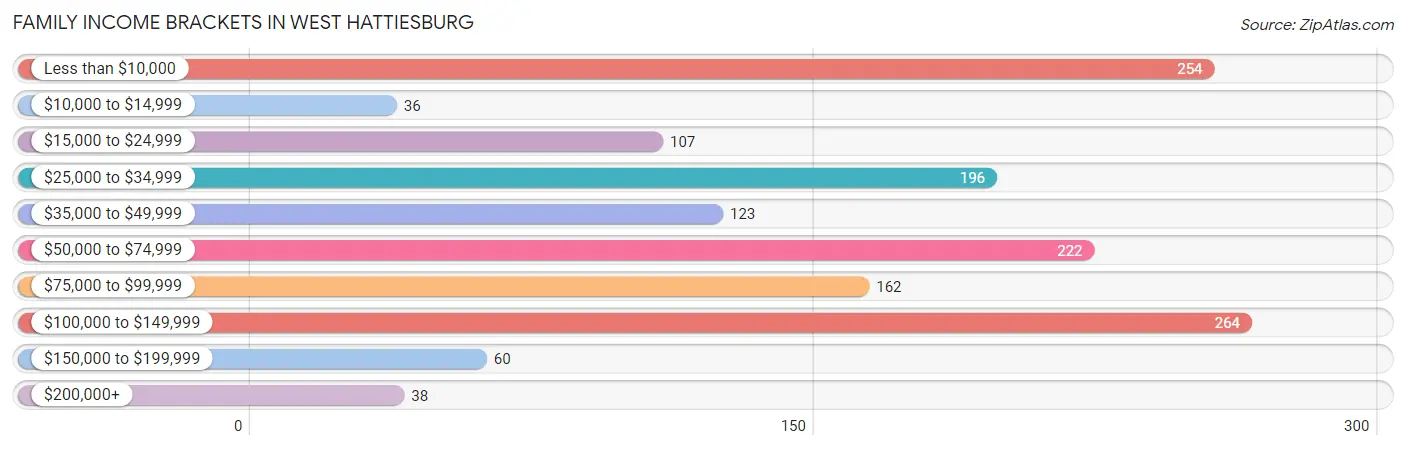
| Income Bracket | # Families | % Families |
| Less than $10,000 | 254 | 17.4% |
| $10,000 to $14,999 | 36 | 2.5% |
| $15,000 to $24,999 | 107 | 7.3% |
| $25,000 to $34,999 | 196 | 13.4% |
| $35,000 to $49,999 | 123 | 8.4% |
| $50,000 to $74,999 | 222 | 15.2% |
| $75,000 to $99,999 | 162 | 11.1% |
| $100,000 to $149,999 | 264 | 18.1% |
| $150,000 to $199,999 | 60 | 4.1% |
| $200,000+ | 38 | 2.6% |
Family Income by Famaliy Size in West Hattiesburg
4-person families (333 | 22.8%) account for the highest median family income in West Hattiesburg with $29,844 per family, while 4-person families (333 | 22.8%) have the highest median income of $7,461 per family member.
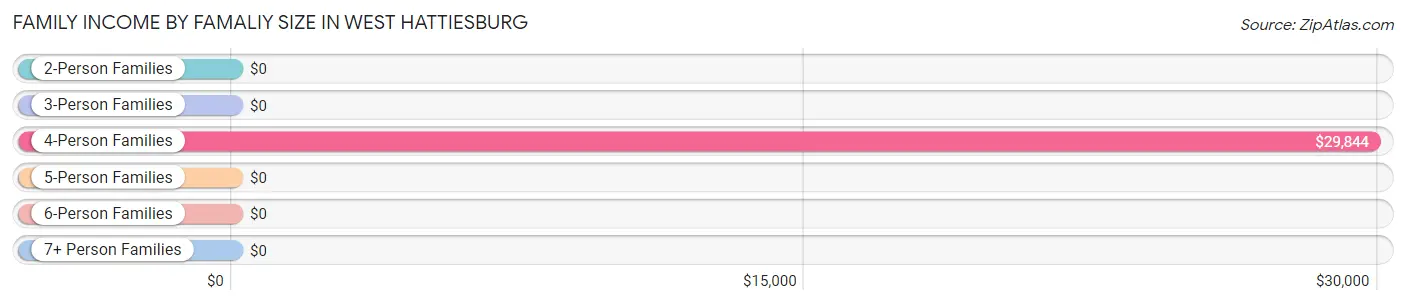
| Income Bracket | # Families | Median Income |
| 2-Person Families | 376 (25.8%) | $0 |
| 3-Person Families | 295 (20.2%) | $0 |
| 4-Person Families | 333 (22.8%) | $29,844 |
| 5-Person Families | 380 (26.0%) | $0 |
| 6-Person Families | 76 (5.2%) | $0 |
| 7+ Person Families | 0 (0.0%) | $0 |
| Total | 1,460 (100.0%) | $50,645 |
Family Income by Number of Earners in West Hattiesburg
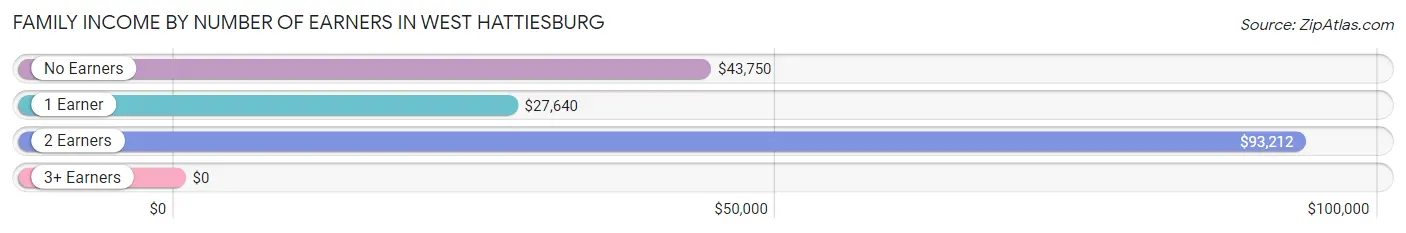
| Number of Earners | # Families | Median Income |
| No Earners | 177 (12.1%) | $43,750 |
| 1 Earner | 613 (42.0%) | $27,640 |
| 2 Earners | 597 (40.9%) | $93,212 |
| 3+ Earners | 73 (5.0%) | $0 |
| Total | 1,460 (100.0%) | $50,645 |
Household Income in West Hattiesburg
Household Income Brackets in West Hattiesburg
With 477 households falling in the category, the less than $10,000 income range is the most frequent in West Hattiesburg, accounting for 21.3% of all households. In contrast, only 54 households (2.4%) fall into the $200,000+ income bracket, making it the least populous group.
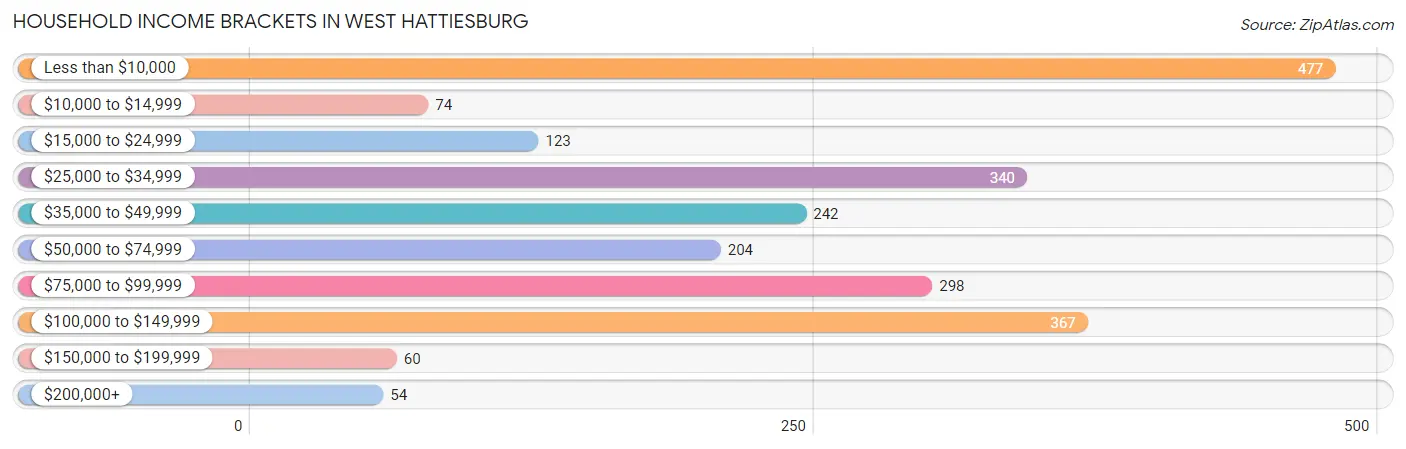
| Income Bracket | # Households | % Households |
| Less than $10,000 | 477 | 21.3% |
| $10,000 to $14,999 | 74 | 3.3% |
| $15,000 to $24,999 | 123 | 5.5% |
| $25,000 to $34,999 | 340 | 15.2% |
| $35,000 to $49,999 | 242 | 10.8% |
| $50,000 to $74,999 | 204 | 9.1% |
| $75,000 to $99,999 | 298 | 13.3% |
| $100,000 to $149,999 | 367 | 16.4% |
| $150,000 to $199,999 | 60 | 2.7% |
| $200,000+ | 54 | 2.4% |
Household Income by Householder Age in West Hattiesburg
The median household income in West Hattiesburg is $41,181, with the highest median household income of $44,939 found in the 65+ years age bracket for the primary householder. A total of 288 households (12.9%) fall into this category. Meanwhile, the 45 to 64 years age bracket for the primary householder has the lowest median household income of $0, with 501 households (22.4%) in this group.
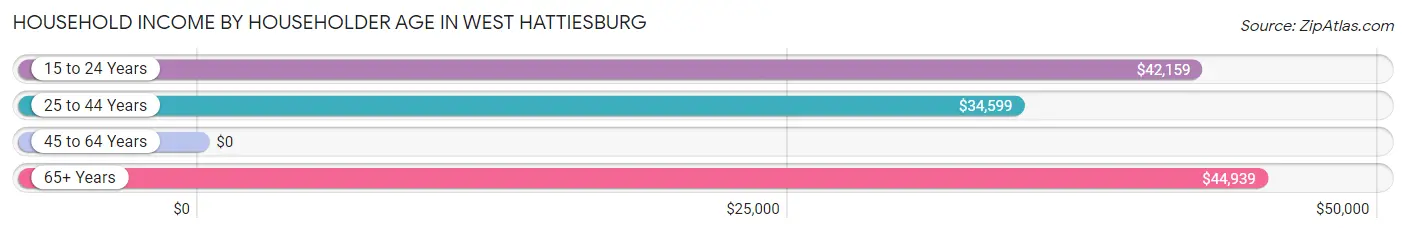
| Income Bracket | # Households | Median Income |
| 15 to 24 Years | 211 (9.4%) | $42,159 |
| 25 to 44 Years | 1,238 (55.3%) | $34,599 |
| 45 to 64 Years | 501 (22.4%) | $0 |
| 65+ Years | 288 (12.9%) | $44,939 |
| Total | 2,238 (100.0%) | $41,181 |
Poverty in West Hattiesburg
Income Below Poverty by Sex and Age in West Hattiesburg
With 24.7% poverty level for males and 35.5% for females among the residents of West Hattiesburg, under 5 year old males and 16 and 17 year old females are the most vulnerable to poverty, with 87 males (77.7%) and 216 females (93.1%) in their respective age groups living below the poverty level.
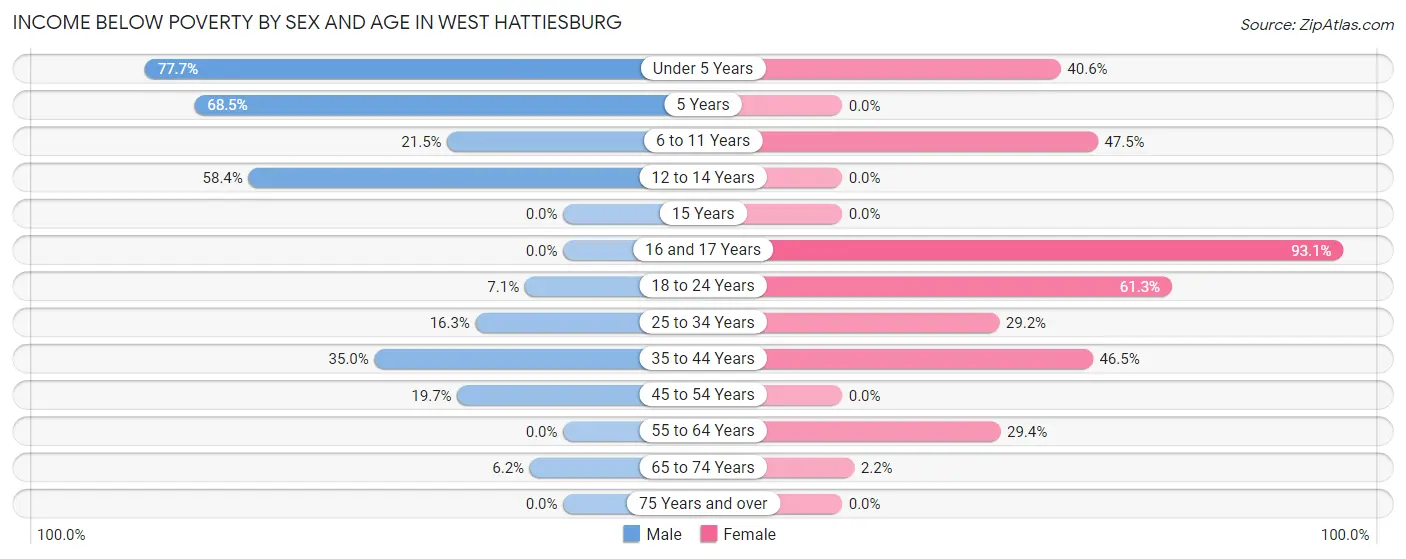
| Age Bracket | Male | Female |
| Under 5 Years | 87 (77.7%) | 155 (40.6%) |
| 5 Years | 113 (68.5%) | 0 (0.0%) |
| 6 to 11 Years | 34 (21.5%) | 205 (47.4%) |
| 12 to 14 Years | 59 (58.4%) | 0 (0.0%) |
| 15 Years | 0 (0.0%) | 0 (0.0%) |
| 16 and 17 Years | 0 (0.0%) | 216 (93.1%) |
| 18 to 24 Years | 23 (7.1%) | 231 (61.3%) |
| 25 to 34 Years | 41 (16.3%) | 163 (29.2%) |
| 35 to 44 Years | 193 (35.0%) | 302 (46.5%) |
| 45 to 54 Years | 46 (19.7%) | 0 (0.0%) |
| 55 to 64 Years | 0 (0.0%) | 42 (29.4%) |
| 65 to 74 Years | 9 (6.2%) | 7 (2.2%) |
| 75 Years and over | 0 (0.0%) | 0 (0.0%) |
| Total | 605 (24.7%) | 1,321 (35.5%) |
Income Above Poverty by Sex and Age in West Hattiesburg
According to the poverty statistics in West Hattiesburg, males aged 16 and 17 years and females aged 5 years are the age groups that are most secure financially, with 100.0% of males and 100.0% of females in these age groups living above the poverty line.
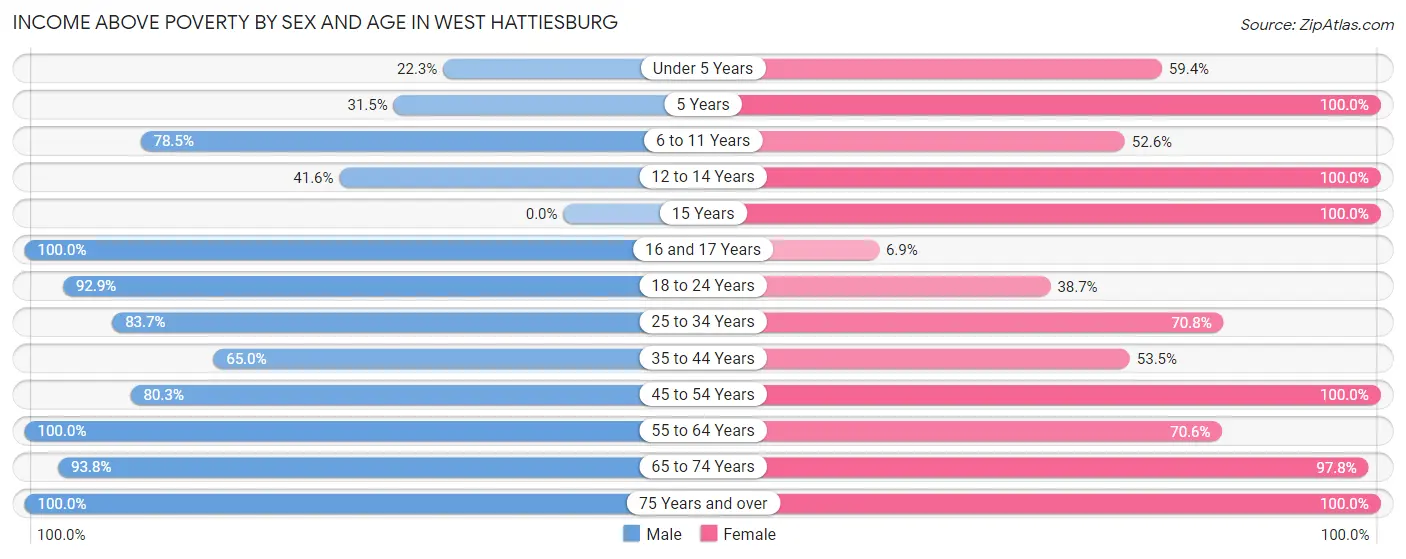
| Age Bracket | Male | Female |
| Under 5 Years | 25 (22.3%) | 227 (59.4%) |
| 5 Years | 52 (31.5%) | 26 (100.0%) |
| 6 to 11 Years | 124 (78.5%) | 227 (52.5%) |
| 12 to 14 Years | 42 (41.6%) | 226 (100.0%) |
| 15 Years | 0 (0.0%) | 50 (100.0%) |
| 16 and 17 Years | 128 (100.0%) | 16 (6.9%) |
| 18 to 24 Years | 300 (92.9%) | 146 (38.7%) |
| 25 to 34 Years | 211 (83.7%) | 396 (70.8%) |
| 35 to 44 Years | 358 (65.0%) | 347 (53.5%) |
| 45 to 54 Years | 188 (80.3%) | 225 (100.0%) |
| 55 to 64 Years | 220 (100.0%) | 101 (70.6%) |
| 65 to 74 Years | 136 (93.8%) | 306 (97.8%) |
| 75 Years and over | 57 (100.0%) | 102 (100.0%) |
| Total | 1,841 (75.3%) | 2,395 (64.4%) |
Income Below Poverty Among Married-Couple Families in West Hattiesburg
The poverty statistics for married-couple families in West Hattiesburg show that 7.3% or 58 of the total 795 families live below the poverty line. Families with 1 or 2 children have the highest poverty rate of 11.6%, comprising of 34 families. On the other hand, families with no children have the lowest poverty rate of 2.6%, which includes 7 families.
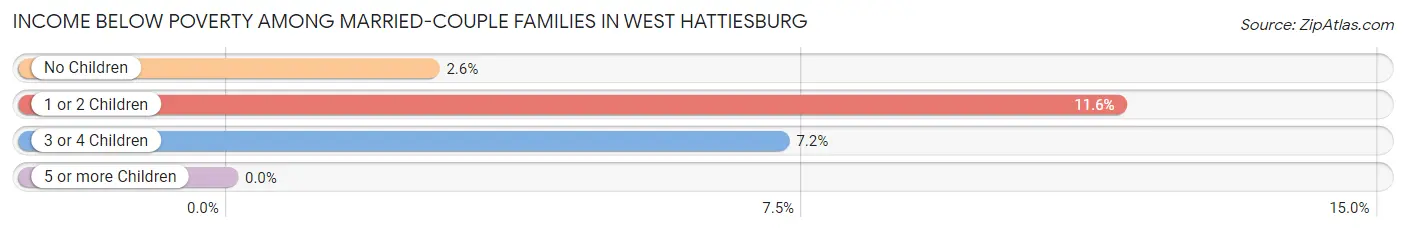
| Children | Above Poverty | Below Poverty |
| No Children | 259 (97.4%) | 7 (2.6%) |
| 1 or 2 Children | 259 (88.4%) | 34 (11.6%) |
| 3 or 4 Children | 219 (92.8%) | 17 (7.2%) |
| 5 or more Children | 0 (0.0%) | 0 (0.0%) |
| Total | 737 (92.7%) | 58 (7.3%) |
Income Below Poverty Among Single-Parent Households in West Hattiesburg
According to the poverty data in West Hattiesburg, 48.0% or 36 single-father households and 60.5% or 357 single-mother households are living below the poverty line. Among single-father households, those with 1 or 2 children have the highest poverty rate, with 36 households (48.0%) experiencing poverty. Likewise, among single-mother households, those with 3 or 4 children have the highest poverty rate, with 99 households (100.0%) falling below the poverty line.
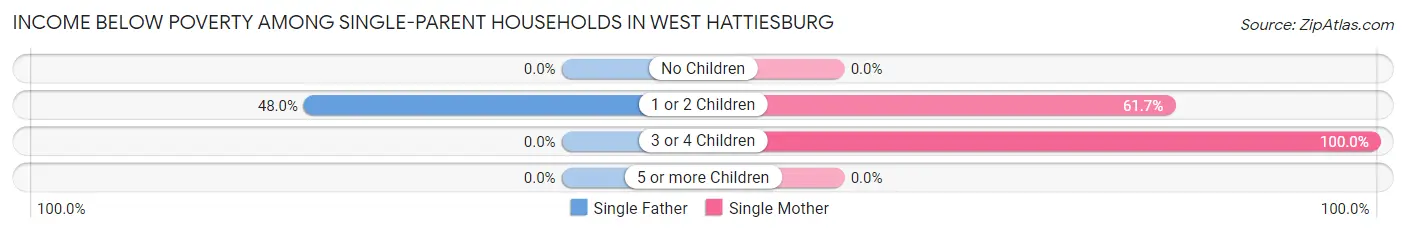
| Children | Single Father | Single Mother |
| No Children | 0 (0.0%) | 0 (0.0%) |
| 1 or 2 Children | 36 (48.0%) | 258 (61.7%) |
| 3 or 4 Children | 0 (0.0%) | 99 (100.0%) |
| 5 or more Children | 0 (0.0%) | 0 (0.0%) |
| Total | 36 (48.0%) | 357 (60.5%) |
Income Below Poverty Among Married-Couple vs Single-Parent Households in West Hattiesburg
The poverty data for West Hattiesburg shows that 58 of the married-couple family households (7.3%) and 393 of the single-parent households (59.1%) are living below the poverty level. Within the married-couple family households, those with 1 or 2 children have the highest poverty rate, with 34 households (11.6%) falling below the poverty line. Among the single-parent households, those with 3 or 4 children have the highest poverty rate, with 99 household (100.0%) living below poverty.
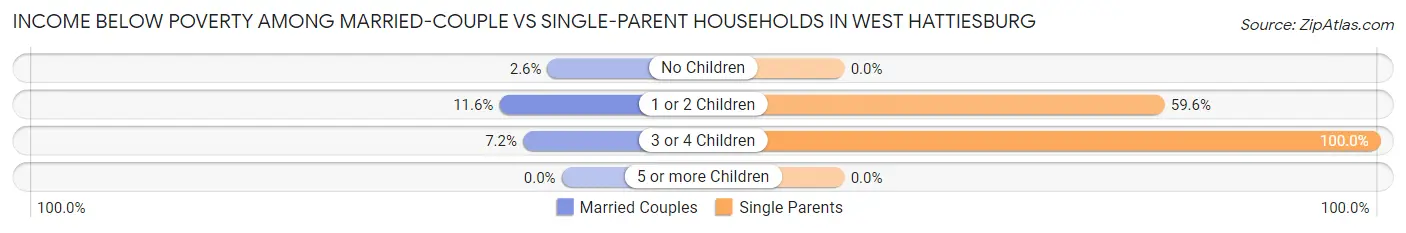
| Children | Married-Couple Families | Single-Parent Households |
| No Children | 7 (2.6%) | 0 (0.0%) |
| 1 or 2 Children | 34 (11.6%) | 294 (59.6%) |
| 3 or 4 Children | 17 (7.2%) | 99 (100.0%) |
| 5 or more Children | 0 (0.0%) | 0 (0.0%) |
| Total | 58 (7.3%) | 393 (59.1%) |
Race in West Hattiesburg
The most populous races in West Hattiesburg are Black / African American (3,254 | 52.2%), White / Caucasian (2,433 | 39.0%), and Hispanic or Latino (673 | 10.8%).
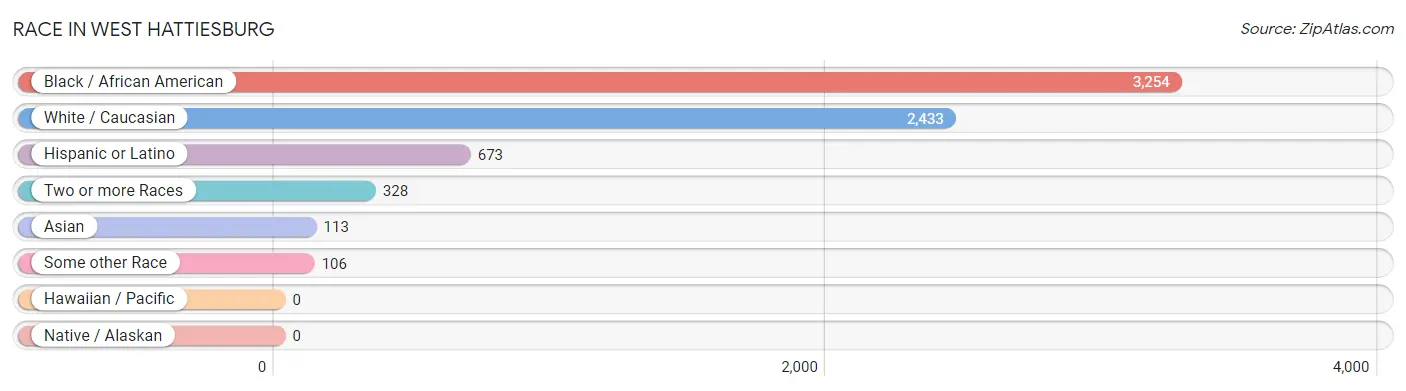
| Race | # Population | % Population |
| Asian | 113 | 1.8% |
| Black / African American | 3,254 | 52.2% |
| Hawaiian / Pacific | 0 | 0.0% |
| Hispanic or Latino | 673 | 10.8% |
| Native / Alaskan | 0 | 0.0% |
| White / Caucasian | 2,433 | 39.0% |
| Two or more Races | 328 | 5.3% |
| Some other Race | 106 | 1.7% |
| Total | 6,234 | 100.0% |
Ancestry in West Hattiesburg
The most populous ancestries reported in West Hattiesburg are German (371 | 5.9%), Irish (347 | 5.6%), Central American (328 | 5.3%), Guatemalan (328 | 5.3%), and English (276 | 4.4%), together accounting for 26.5% of all West Hattiesburg residents.
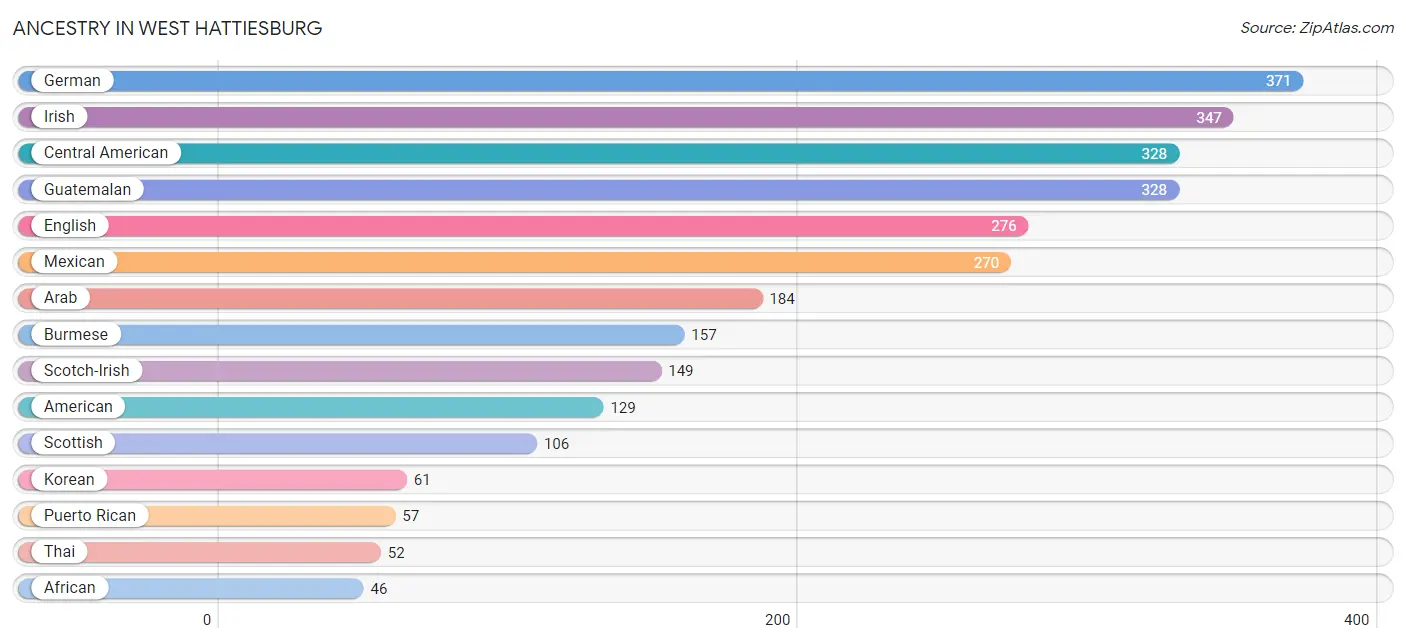
| Ancestry | # Population | % Population |
| African | 46 | 0.7% |
| American | 129 | 2.1% |
| Arab | 184 | 2.9% |
| Burmese | 157 | 2.5% |
| Cajun | 9 | 0.1% |
| Central American | 328 | 5.3% |
| Colombian | 18 | 0.3% |
| Dutch | 12 | 0.2% |
| English | 276 | 4.4% |
| European | 13 | 0.2% |
| French | 35 | 0.6% |
| French Canadian | 38 | 0.6% |
| German | 371 | 5.9% |
| Guatemalan | 328 | 5.3% |
| Irish | 347 | 5.6% |
| Italian | 18 | 0.3% |
| Korean | 61 | 1.0% |
| Mexican | 270 | 4.3% |
| Polish | 35 | 0.6% |
| Puerto Rican | 57 | 0.9% |
| Scotch-Irish | 149 | 2.4% |
| Scottish | 106 | 1.7% |
| South American | 18 | 0.3% |
| Subsaharan African | 46 | 0.7% |
| Swedish | 39 | 0.6% |
| Thai | 52 | 0.8% | View All 26 Rows |
Immigrants in West Hattiesburg
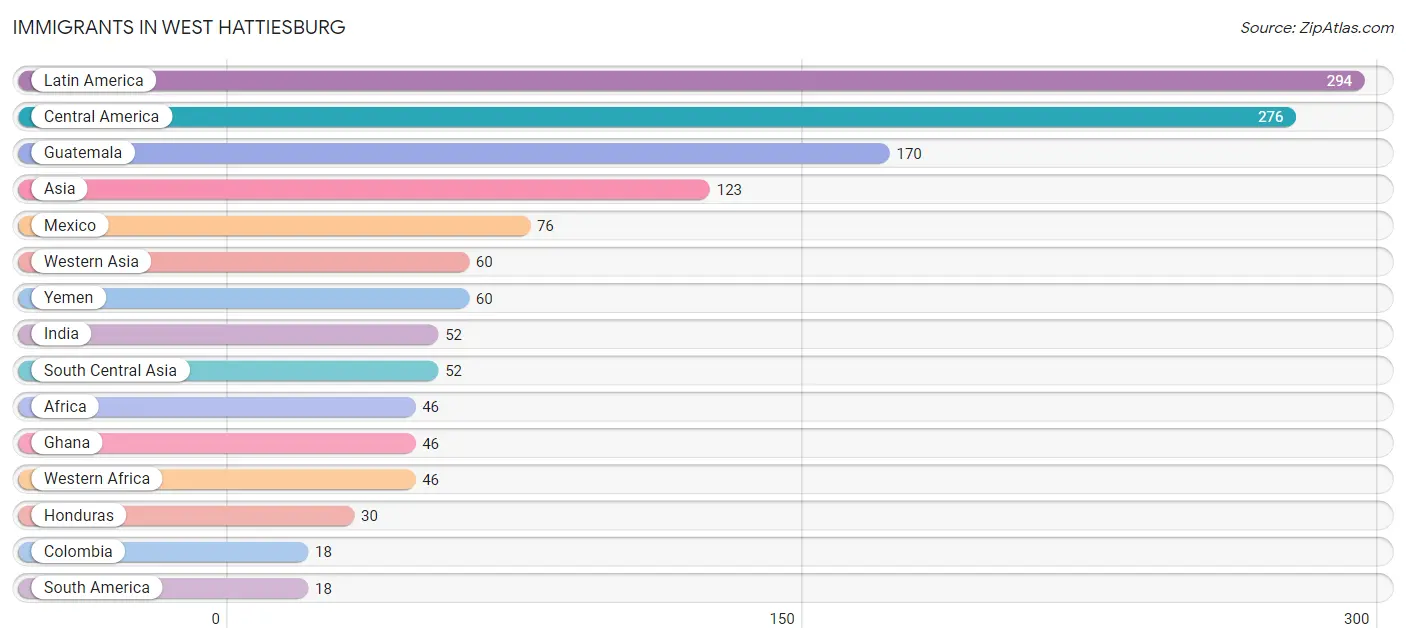
The most numerous immigrant groups reported in West Hattiesburg came from Latin America (294 | 4.7%), Central America (276 | 4.4%), Guatemala (170 | 2.7%), Asia (123 | 2.0%), and Mexico (76 | 1.2%), together accounting for 15.1% of all West Hattiesburg residents.
| Immigration Origin | # Population | % Population |
| Africa | 46 | 0.7% |
| Asia | 123 | 2.0% |
| Central America | 276 | 4.4% |
| Colombia | 18 | 0.3% |
| Europe | 3 | 0.1% |
| France | 3 | 0.1% |
| Ghana | 46 | 0.7% |
| Guatemala | 170 | 2.7% |
| Honduras | 30 | 0.5% |
| India | 52 | 0.8% |
| Latin America | 294 | 4.7% |
| Mexico | 76 | 1.2% |
| Philippines | 11 | 0.2% |
| South America | 18 | 0.3% |
| South Central Asia | 52 | 0.8% |
| South Eastern Asia | 11 | 0.2% |
| Western Africa | 46 | 0.7% |
| Western Asia | 60 | 1.0% |
| Western Europe | 3 | 0.1% |
| Yemen | 60 | 1.0% | View All 20 Rows |
Sex and Age in West Hattiesburg
Sex and Age in West Hattiesburg
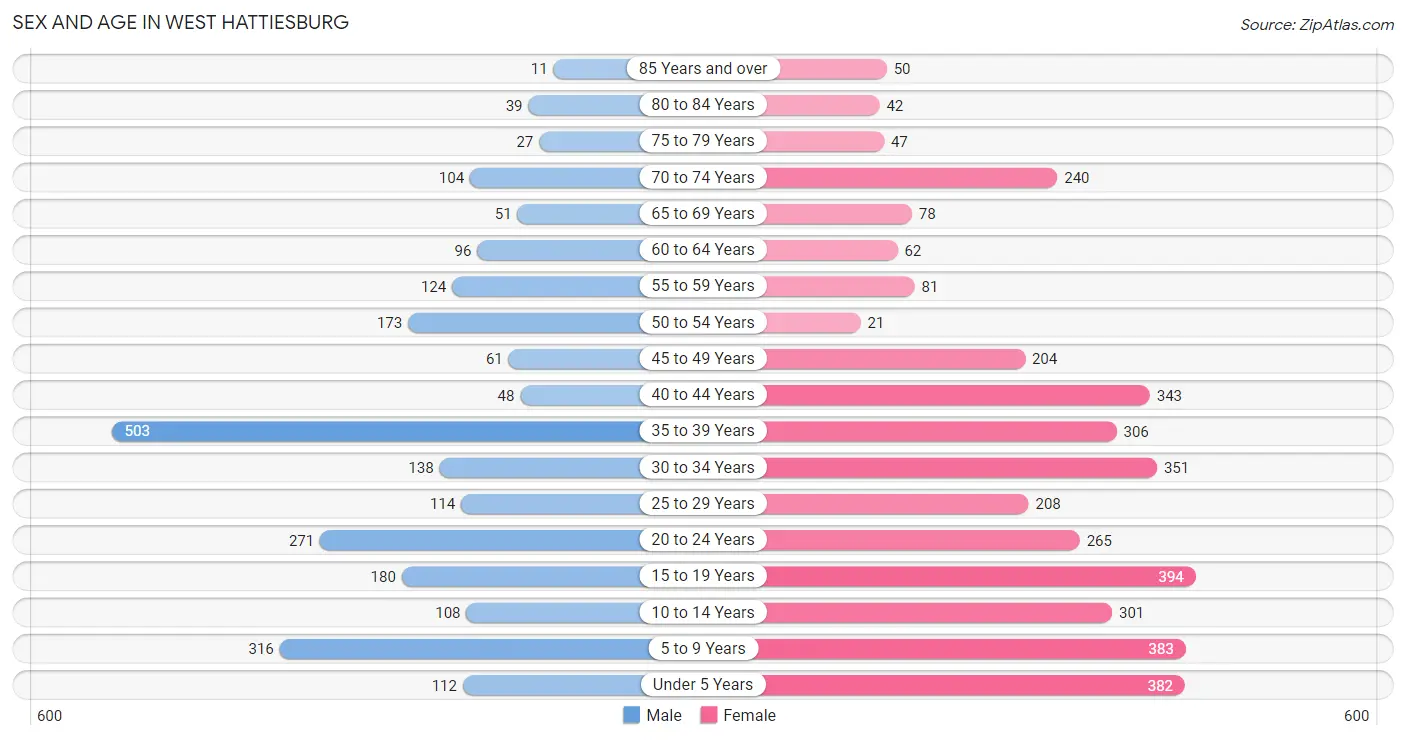
The most populous age groups in West Hattiesburg are 35 to 39 Years (503 | 20.3%) for men and 15 to 19 Years (394 | 10.5%) for women.
| Age Bracket | Male | Female |
| Under 5 Years | 112 (4.5%) | 382 (10.2%) |
| 5 to 9 Years | 316 (12.8%) | 383 (10.2%) |
| 10 to 14 Years | 108 (4.4%) | 301 (8.0%) |
| 15 to 19 Years | 180 (7.3%) | 394 (10.5%) |
| 20 to 24 Years | 271 (11.0%) | 265 (7.0%) |
| 25 to 29 Years | 114 (4.6%) | 208 (5.5%) |
| 30 to 34 Years | 138 (5.6%) | 351 (9.3%) |
| 35 to 39 Years | 503 (20.3%) | 306 (8.1%) |
| 40 to 44 Years | 48 (1.9%) | 343 (9.1%) |
| 45 to 49 Years | 61 (2.5%) | 204 (5.4%) |
| 50 to 54 Years | 173 (7.0%) | 21 (0.6%) |
| 55 to 59 Years | 124 (5.0%) | 81 (2.2%) |
| 60 to 64 Years | 96 (3.9%) | 62 (1.7%) |
| 65 to 69 Years | 51 (2.1%) | 78 (2.1%) |
| 70 to 74 Years | 104 (4.2%) | 240 (6.4%) |
| 75 to 79 Years | 27 (1.1%) | 47 (1.3%) |
| 80 to 84 Years | 39 (1.6%) | 42 (1.1%) |
| 85 Years and over | 11 (0.4%) | 50 (1.3%) |
| Total | 2,476 (100.0%) | 3,758 (100.0%) |
Families and Households in West Hattiesburg
Median Family Size in West Hattiesburg
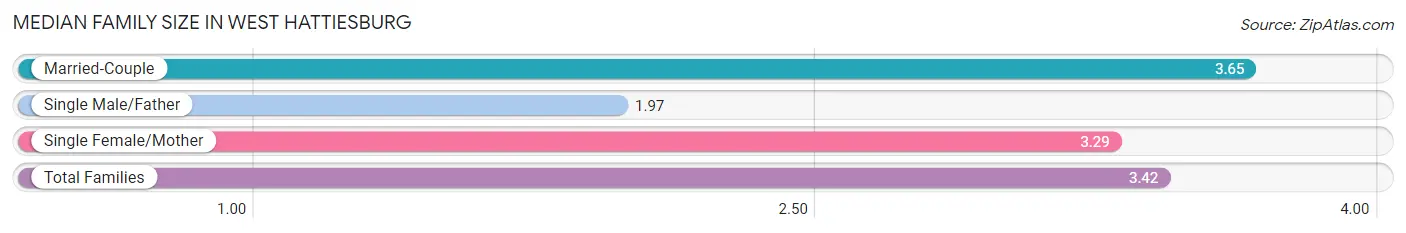
The median family size in West Hattiesburg is 3.42 persons per family, with married-couple families (795 | 54.4%) accounting for the largest median family size of 3.65 persons per family. On the other hand, single male/father families (75 | 5.1%) represent the smallest median family size with 1.97 persons per family.
| Family Type | # Families | Family Size |
| Married-Couple | 795 (54.4%) | 3.65 |
| Single Male/Father | 75 (5.1%) | 1.97 |
| Single Female/Mother | 590 (40.4%) | 3.29 |
| Total Families | 1,460 (100.0%) | 3.42 |
Median Household Size in West Hattiesburg
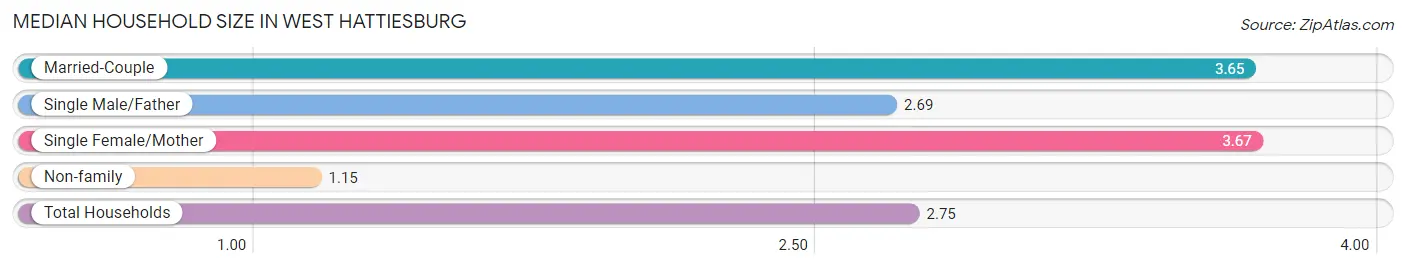
The median household size in West Hattiesburg is 2.75 persons per household, with single female/mother households (590 | 26.4%) accounting for the largest median household size of 3.67 persons per household. non-family households (778 | 34.8%) represent the smallest median household size with 1.15 persons per household.
| Household Type | # Households | Household Size |
| Married-Couple | 795 (35.5%) | 3.65 |
| Single Male/Father | 75 (3.4%) | 2.69 |
| Single Female/Mother | 590 (26.4%) | 3.67 |
| Non-family | 778 (34.8%) | 1.15 |
| Total Households | 2,238 (100.0%) | 2.75 |
Household Size by Marriage Status in West Hattiesburg
Out of a total of 2,238 households in West Hattiesburg, 1,460 (65.2%) are family households, while 778 (34.8%) are nonfamily households. The most numerous type of family households are 4-person households, comprising 461, and the most common type of nonfamily households are 1-person households, comprising 732.
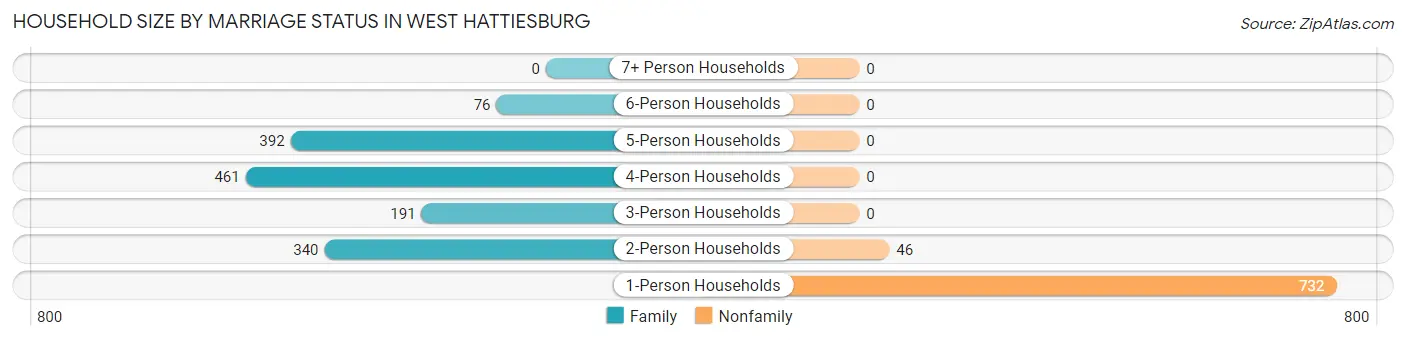
| Household Size | Family Households | Nonfamily Households |
| 1-Person Households | - | 732 (32.7%) |
| 2-Person Households | 340 (15.2%) | 46 (2.1%) |
| 3-Person Households | 191 (8.5%) | 0 (0.0%) |
| 4-Person Households | 461 (20.6%) | 0 (0.0%) |
| 5-Person Households | 392 (17.5%) | 0 (0.0%) |
| 6-Person Households | 76 (3.4%) | 0 (0.0%) |
| 7+ Person Households | 0 (0.0%) | 0 (0.0%) |
| Total | 1,460 (65.2%) | 778 (34.8%) |
Female Fertility in West Hattiesburg
Fertility by Age in West Hattiesburg
Average fertility rate in West Hattiesburg is 128.0 births per 1,000 women. Women in the age bracket of 20 to 34 years have the highest fertility rate with 204.0 births per 1,000 women. Women in the age bracket of 20 to 34 years acount for 62.7% of all women with births.
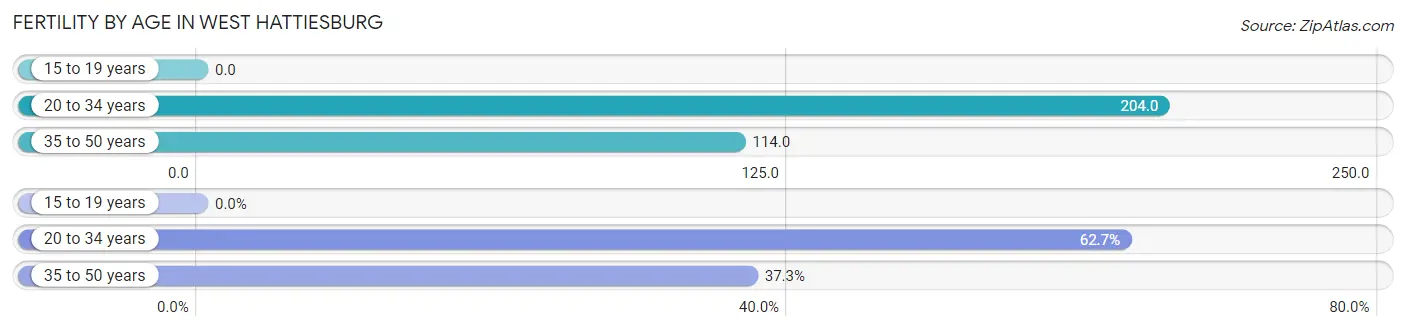
| Age Bracket | Women with Births | Births / 1,000 Women |
| 15 to 19 years | 0 (0.0%) | 0.0 |
| 20 to 34 years | 168 (62.7%) | 204.0 |
| 35 to 50 years | 100 (37.3%) | 114.0 |
| Total | 268 (100.0%) | 128.0 |
Fertility by Age by Marriage Status in West Hattiesburg
95.5% of women with births (268) in West Hattiesburg are married. The highest percentage of unmarried women with births falls into 20 to 34 years age bracket with 7.1% of them unmarried at the time of birth, while the lowest percentage of unmarried women with births belong to 35 to 50 years age bracket with 0.0% of them unmarried.
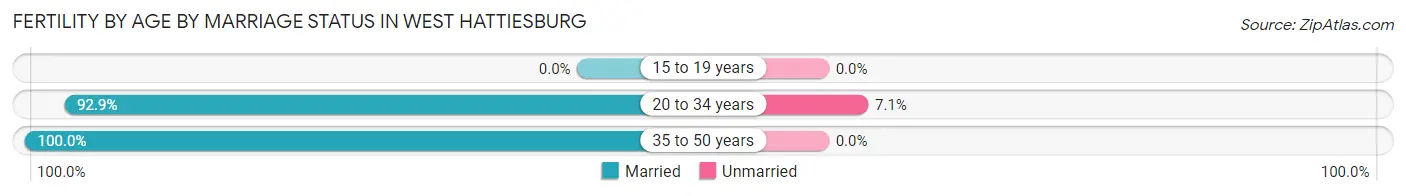
| Age Bracket | Married | Unmarried |
| 15 to 19 years | 0 (0.0%) | 0 (0.0%) |
| 20 to 34 years | 156 (92.9%) | 12 (7.1%) |
| 35 to 50 years | 100 (100.0%) | 0 (0.0%) |
| Total | 256 (95.5%) | 12 (4.5%) |
Fertility by Education in West Hattiesburg
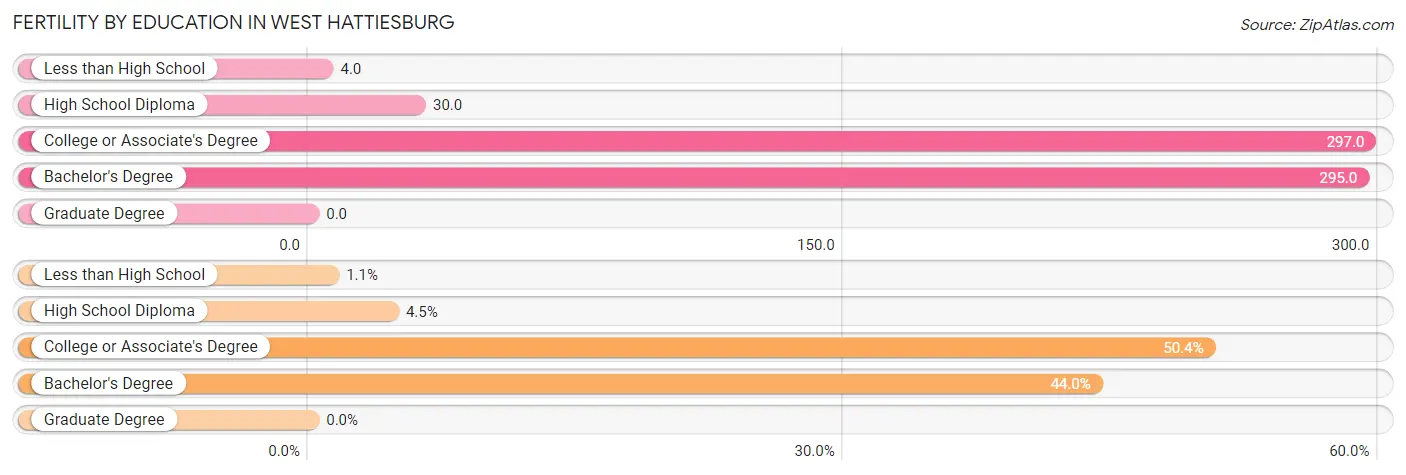
| Educational Attainment | Women with Births | Births / 1,000 Women |
| Less than High School | 3 (1.1%) | 4.0 |
| High School Diploma | 12 (4.5%) | 30.0 |
| College or Associate's Degree | 135 (50.4%) | 297.0 |
| Bachelor's Degree | 118 (44.0%) | 295.0 |
| Graduate Degree | 0 (0.0%) | 0.0 |
| Total | 268 (100.0%) | 128.0 |
Fertility by Education by Marriage Status in West Hattiesburg
4.5% of women with births in West Hattiesburg are unmarried. Women with the educational attainment of less than high school are most likely to be married with 100.0% of them married at childbirth, while women with the educational attainment of high school diploma are least likely to be married with 100.0% of them unmarried at childbirth.
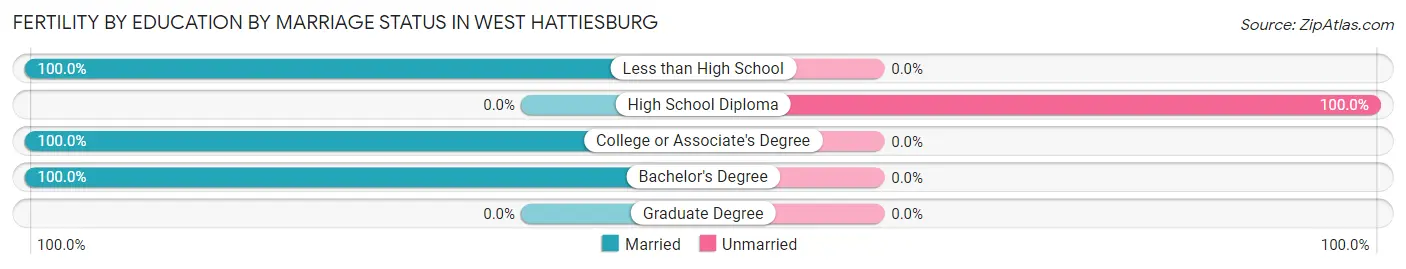
| Educational Attainment | Married | Unmarried |
| Less than High School | 3 (100.0%) | 0 (0.0%) |
| High School Diploma | 0 (0.0%) | 12 (100.0%) |
| College or Associate's Degree | 135 (100.0%) | 0 (0.0%) |
| Bachelor's Degree | 118 (100.0%) | 0 (0.0%) |
| Graduate Degree | 0 (0.0%) | 0 (0.0%) |
| Total | 256 (95.5%) | 12 (4.5%) |
Employment Characteristics in West Hattiesburg
Employment by Class of Employer in West Hattiesburg
Among the 2,277 employed individuals in West Hattiesburg, private company employees (1,700 | 74.7%), local government employees (179 | 7.9%), and state government employees (156 | 6.9%) make up the most common classes of employment.
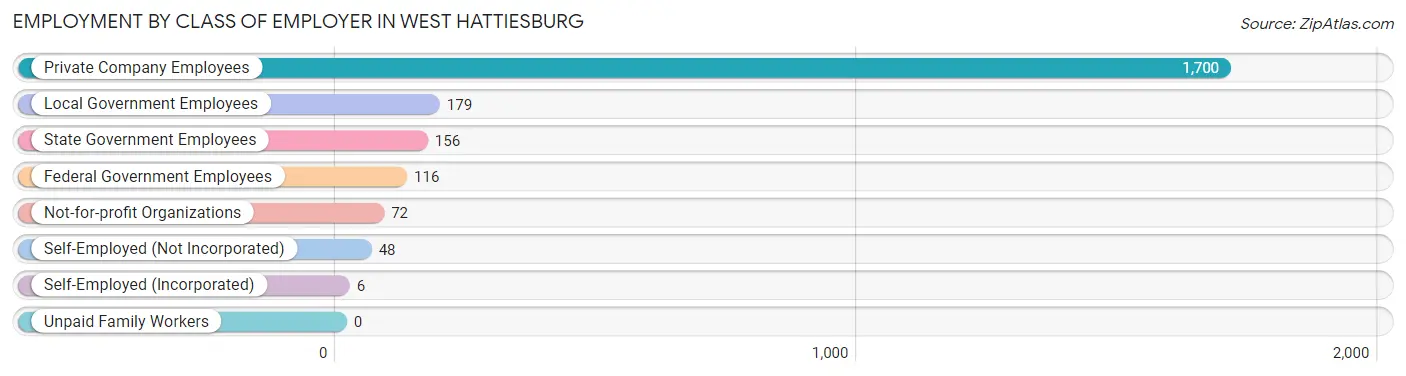
| Employer Class | # Employees | % Employees |
| Private Company Employees | 1,700 | 74.7% |
| Self-Employed (Incorporated) | 6 | 0.3% |
| Self-Employed (Not Incorporated) | 48 | 2.1% |
| Not-for-profit Organizations | 72 | 3.2% |
| Local Government Employees | 179 | 7.9% |
| State Government Employees | 156 | 6.9% |
| Federal Government Employees | 116 | 5.1% |
| Unpaid Family Workers | 0 | 0.0% |
| Total | 2,277 | 100.0% |
Employment Status by Age in West Hattiesburg
According to the labor force statistics for West Hattiesburg, out of the total population over 16 years of age (4,582), 64.8% or 2,969 individuals are in the labor force, with 14.3% or 425 of them unemployed. The age group with the highest labor force participation rate is 20 to 24 years, with 96.6% or 518 individuals in the labor force. Within the labor force, the 16 to 19 years age range has the highest percentage of unemployed individuals, with 72.0% or 59 of them being unemployed.
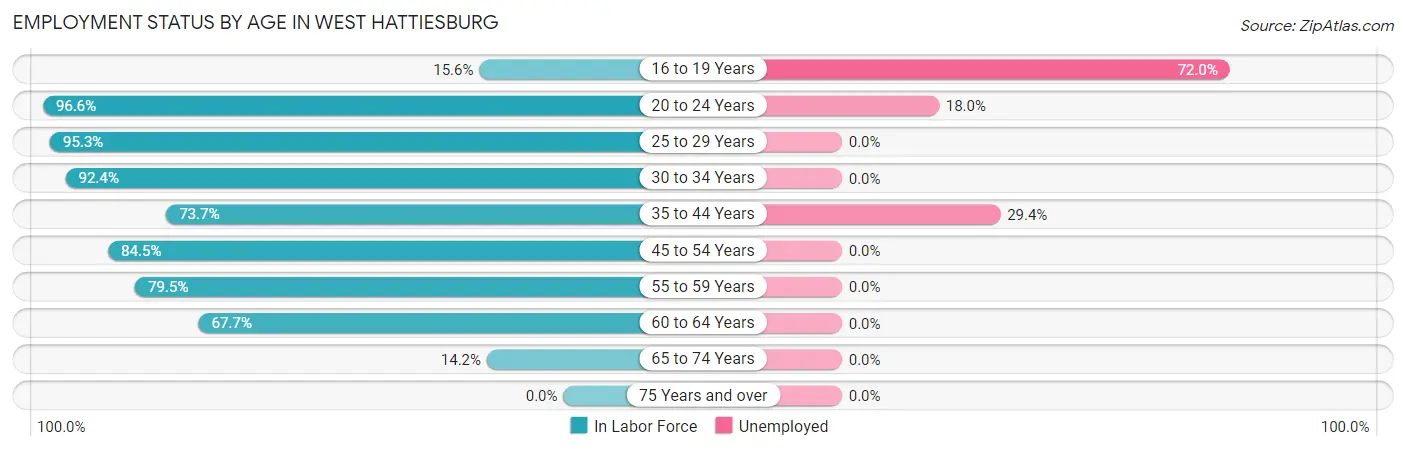
| Age Bracket | In Labor Force | Unemployed |
| 16 to 19 Years | 82 (15.6%) | 59 (72.0%) |
| 20 to 24 Years | 518 (96.6%) | 93 (18.0%) |
| 25 to 29 Years | 307 (95.3%) | 0 (0.0%) |
| 30 to 34 Years | 452 (92.4%) | 0 (0.0%) |
| 35 to 44 Years | 884 (73.7%) | 260 (29.4%) |
| 45 to 54 Years | 388 (84.5%) | 0 (0.0%) |
| 55 to 59 Years | 163 (79.5%) | 0 (0.0%) |
| 60 to 64 Years | 107 (67.7%) | 0 (0.0%) |
| 65 to 74 Years | 67 (14.2%) | 0 (0.0%) |
| 75 Years and over | 0 (0.0%) | 0 (0.0%) |
| Total | 2,969 (64.8%) | 425 (14.3%) |
Employment Status by Educational Attainment in West Hattiesburg
According to labor force statistics for West Hattiesburg, 81.2% of individuals (2,300) out of the total population between 25 and 64 years of age (2,833) are in the labor force, with 11.8% or 271 of them being unemployed. The group with the highest labor force participation rate are those with the educational attainment of high school diploma, with 87.8% or 713 individuals in the labor force. Within the labor force, individuals with high school diploma education have the highest percentage of unemployment, with 27.1% or 193 of them being unemployed.
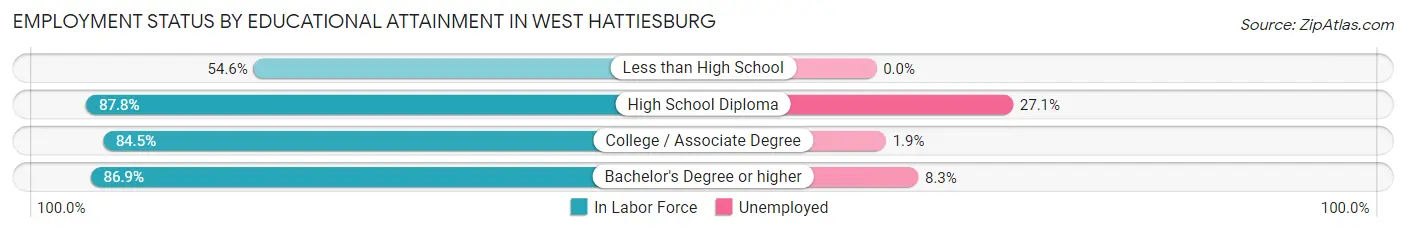
| Educational Attainment | In Labor Force | Unemployed |
| Less than High School | 253 (54.6%) | 0 (0.0%) |
| High School Diploma | 713 (87.8%) | 220 (27.1%) |
| College / Associate Degree | 663 (84.5%) | 15 (1.9%) |
| Bachelor's Degree or higher | 672 (86.9%) | 64 (8.3%) |
| Total | 2,300 (81.2%) | 334 (11.8%) |
Employment Occupations by Sex in West Hattiesburg
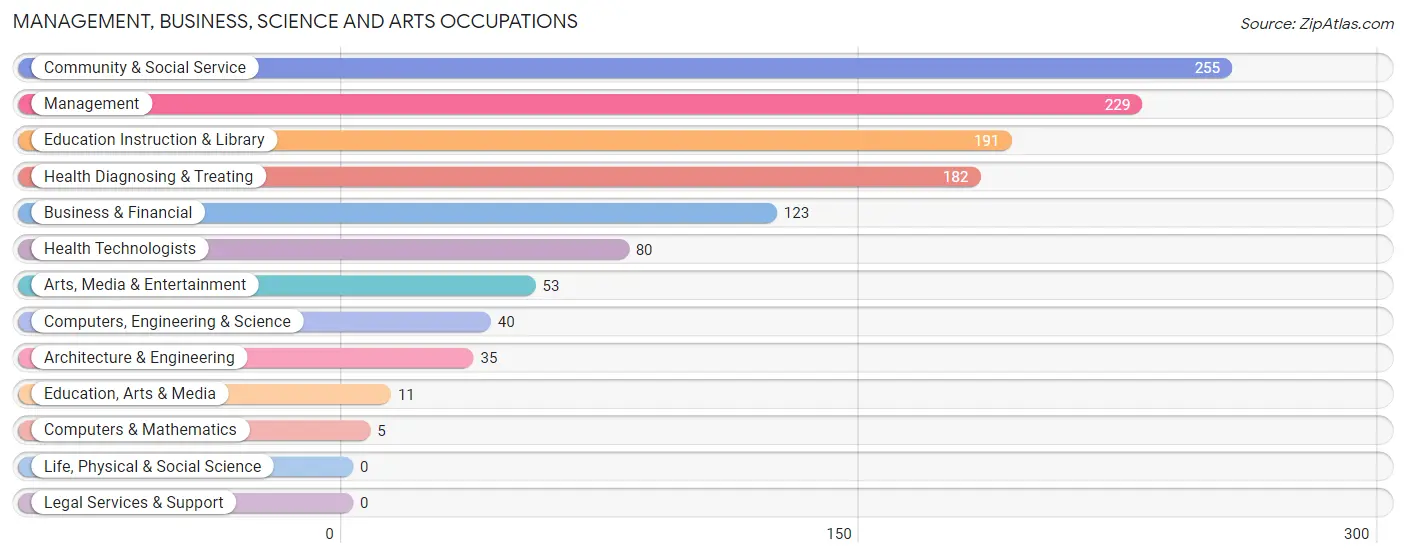
Management, Business, Science and Arts Occupations
The most common Management, Business, Science and Arts occupations in West Hattiesburg are Community & Social Service (255 | 10.3%), Management (229 | 9.3%), Education Instruction & Library (191 | 7.7%), Health Diagnosing & Treating (182 | 7.4%), and Business & Financial (123 | 5.0%).
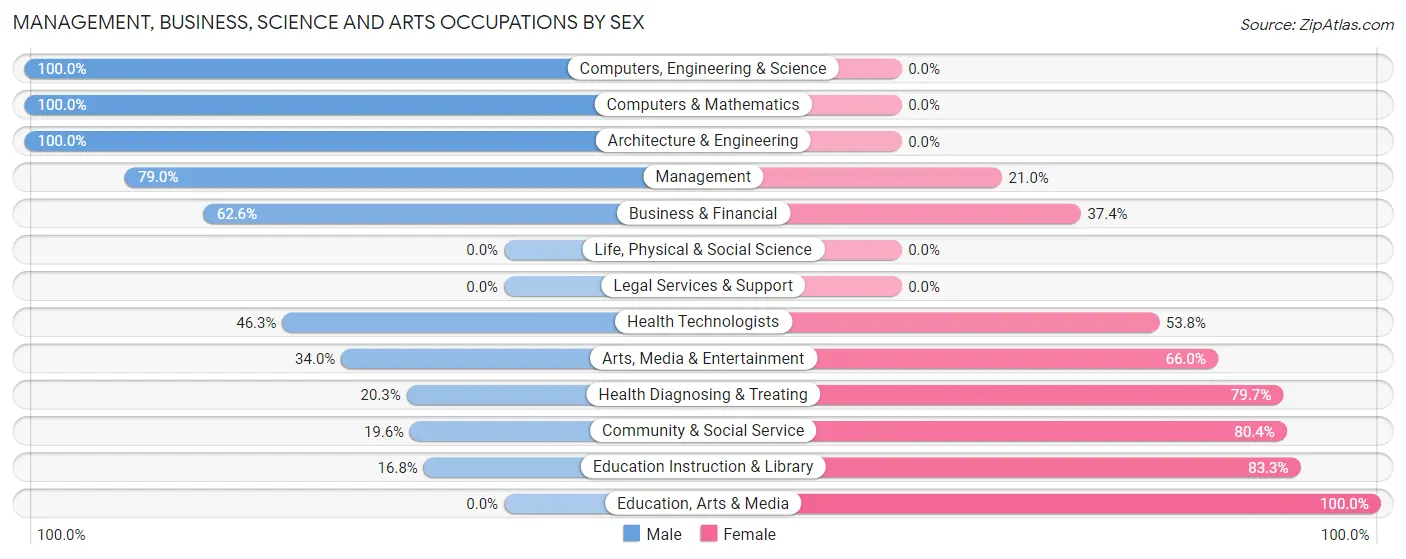
Management, Business, Science and Arts Occupations by Sex
Within the Management, Business, Science and Arts occupations in West Hattiesburg, the most male-oriented occupations are Computers, Engineering & Science (100.0%), Computers & Mathematics (100.0%), and Architecture & Engineering (100.0%), while the most female-oriented occupations are Education, Arts & Media (100.0%), Education Instruction & Library (83.3%), and Community & Social Service (80.4%).
| Occupation | Male | Female |
| Management | 181 (79.0%) | 48 (21.0%) |
| Business & Financial | 77 (62.6%) | 46 (37.4%) |
| Computers, Engineering & Science | 40 (100.0%) | 0 (0.0%) |
| Computers & Mathematics | 5 (100.0%) | 0 (0.0%) |
| Architecture & Engineering | 35 (100.0%) | 0 (0.0%) |
| Life, Physical & Social Science | 0 (0.0%) | 0 (0.0%) |
| Community & Social Service | 50 (19.6%) | 205 (80.4%) |
| Education, Arts & Media | 0 (0.0%) | 11 (100.0%) |
| Legal Services & Support | 0 (0.0%) | 0 (0.0%) |
| Education Instruction & Library | 32 (16.8%) | 159 (83.3%) |
| Arts, Media & Entertainment | 18 (34.0%) | 35 (66.0%) |
| Health Diagnosing & Treating | 37 (20.3%) | 145 (79.7%) |
| Health Technologists | 37 (46.3%) | 43 (53.7%) |
| Total (Category) | 385 (46.4%) | 444 (53.6%) |
| Total (Overall) | 1,029 (41.8%) | 1,435 (58.2%) |
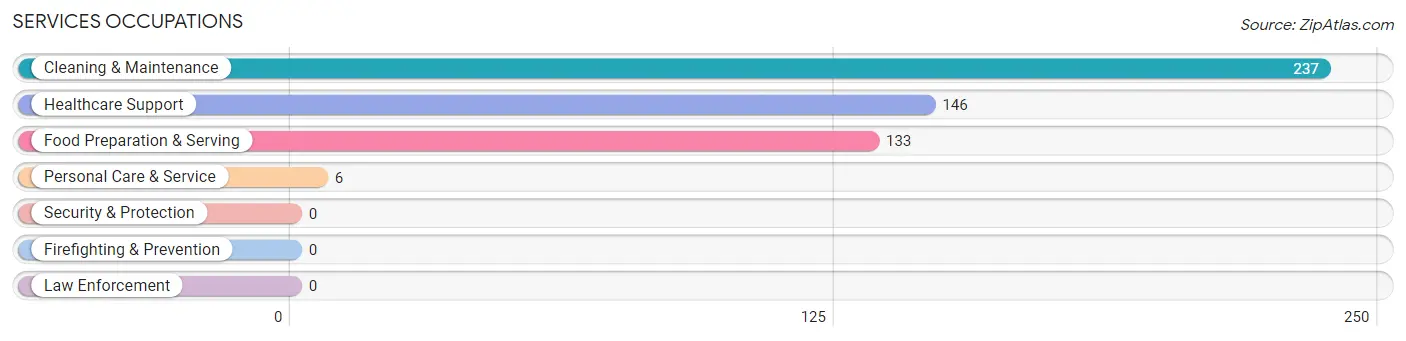
Services Occupations
The most common Services occupations in West Hattiesburg are Cleaning & Maintenance (237 | 9.6%), Healthcare Support (146 | 5.9%), Food Preparation & Serving (133 | 5.4%), and Personal Care & Service (6 | 0.2%).
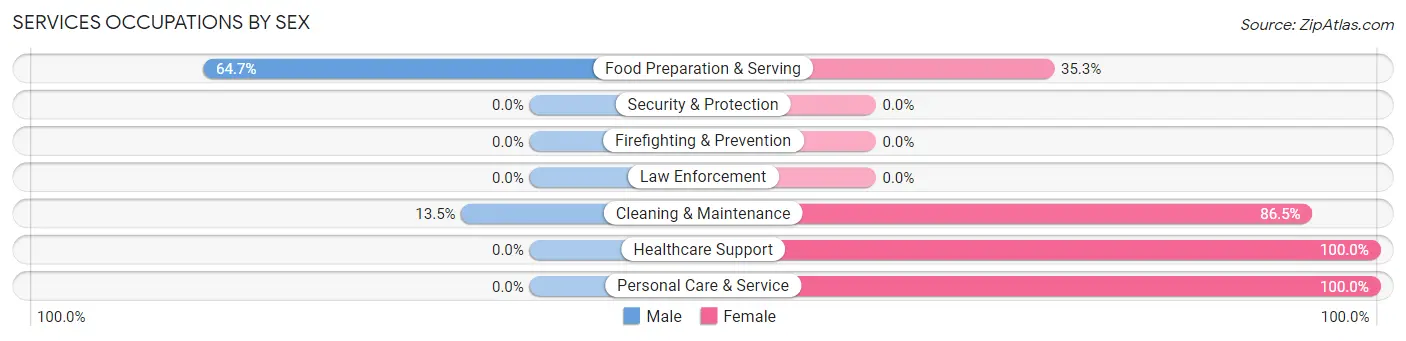
Services Occupations by Sex
Within the Services occupations in West Hattiesburg, the most male-oriented occupations are Food Preparation & Serving (64.7%), and Cleaning & Maintenance (13.5%), while the most female-oriented occupations are Healthcare Support (100.0%), Personal Care & Service (100.0%), and Cleaning & Maintenance (86.5%).
| Occupation | Male | Female |
| Healthcare Support | 0 (0.0%) | 146 (100.0%) |
| Security & Protection | 0 (0.0%) | 0 (0.0%) |
| Firefighting & Prevention | 0 (0.0%) | 0 (0.0%) |
| Law Enforcement | 0 (0.0%) | 0 (0.0%) |
| Food Preparation & Serving | 86 (64.7%) | 47 (35.3%) |
| Cleaning & Maintenance | 32 (13.5%) | 205 (86.5%) |
| Personal Care & Service | 0 (0.0%) | 6 (100.0%) |
| Total (Category) | 118 (22.6%) | 404 (77.4%) |
| Total (Overall) | 1,029 (41.8%) | 1,435 (58.2%) |
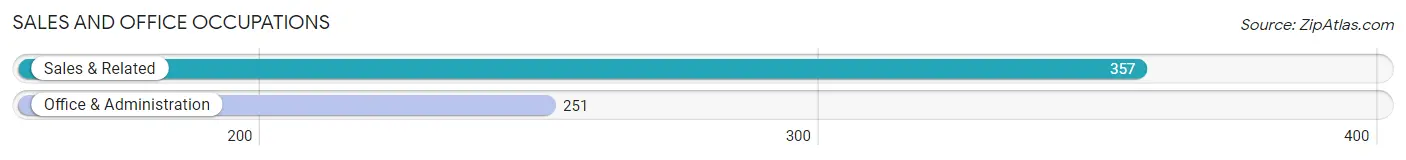
Sales and Office Occupations
The most common Sales and Office occupations in West Hattiesburg are Sales & Related (357 | 14.5%), and Office & Administration (251 | 10.2%).
Sales and Office Occupations by Sex
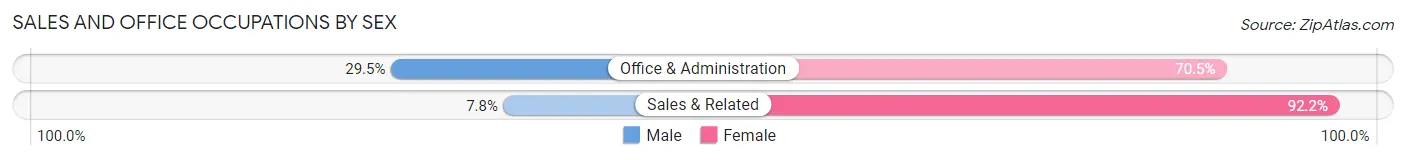
| Occupation | Male | Female |
| Sales & Related | 28 (7.8%) | 329 (92.2%) |
| Office & Administration | 74 (29.5%) | 177 (70.5%) |
| Total (Category) | 102 (16.8%) | 506 (83.2%) |
| Total (Overall) | 1,029 (41.8%) | 1,435 (58.2%) |
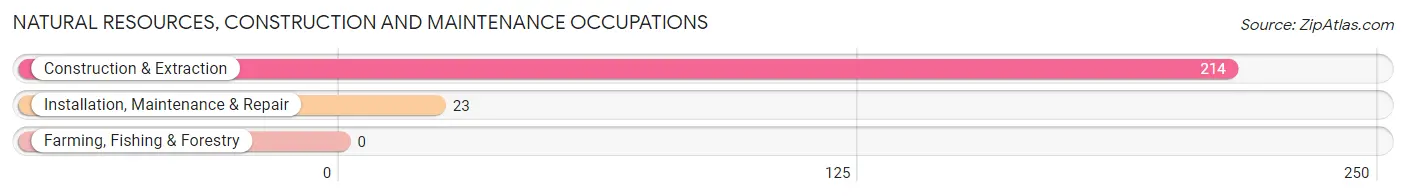
Natural Resources, Construction and Maintenance Occupations
The most common Natural Resources, Construction and Maintenance occupations in West Hattiesburg are Construction & Extraction (214 | 8.7%), and Installation, Maintenance & Repair (23 | 0.9%).
Natural Resources, Construction and Maintenance Occupations by Sex
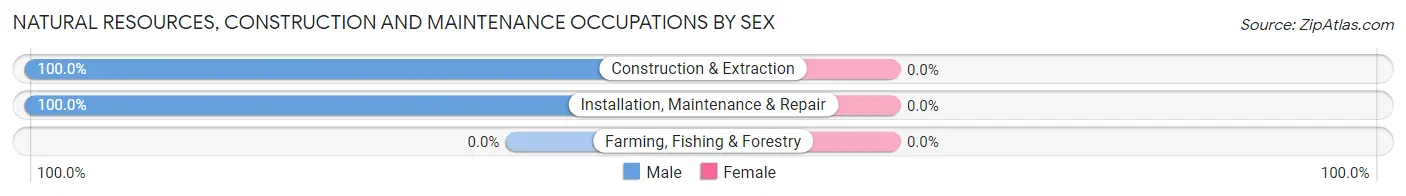
| Occupation | Male | Female |
| Farming, Fishing & Forestry | 0 (0.0%) | 0 (0.0%) |
| Construction & Extraction | 214 (100.0%) | 0 (0.0%) |
| Installation, Maintenance & Repair | 23 (100.0%) | 0 (0.0%) |
| Total (Category) | 237 (100.0%) | 0 (0.0%) |
| Total (Overall) | 1,029 (41.8%) | 1,435 (58.2%) |
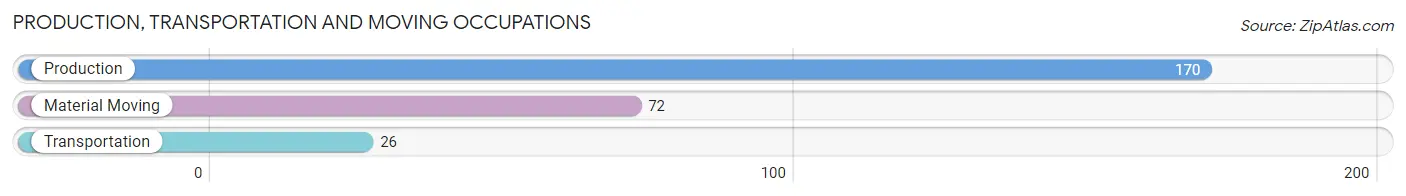
Production, Transportation and Moving Occupations
The most common Production, Transportation and Moving occupations in West Hattiesburg are Production (170 | 6.9%), Material Moving (72 | 2.9%), and Transportation (26 | 1.1%).
Production, Transportation and Moving Occupations by Sex
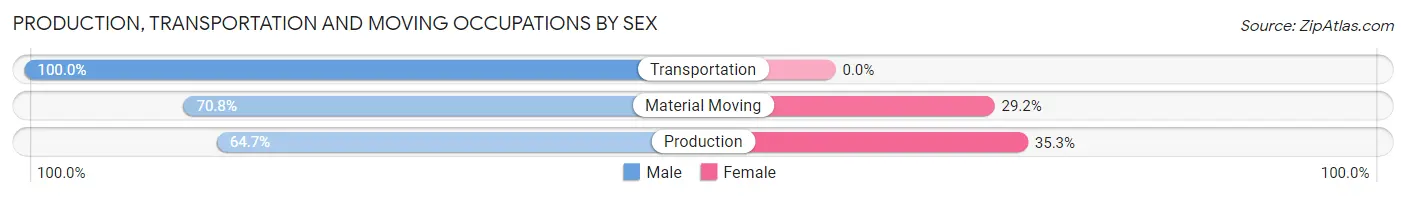
| Occupation | Male | Female |
| Production | 110 (64.7%) | 60 (35.3%) |
| Transportation | 26 (100.0%) | 0 (0.0%) |
| Material Moving | 51 (70.8%) | 21 (29.2%) |
| Total (Category) | 187 (69.8%) | 81 (30.2%) |
| Total (Overall) | 1,029 (41.8%) | 1,435 (58.2%) |
Employment Industries by Sex in West Hattiesburg
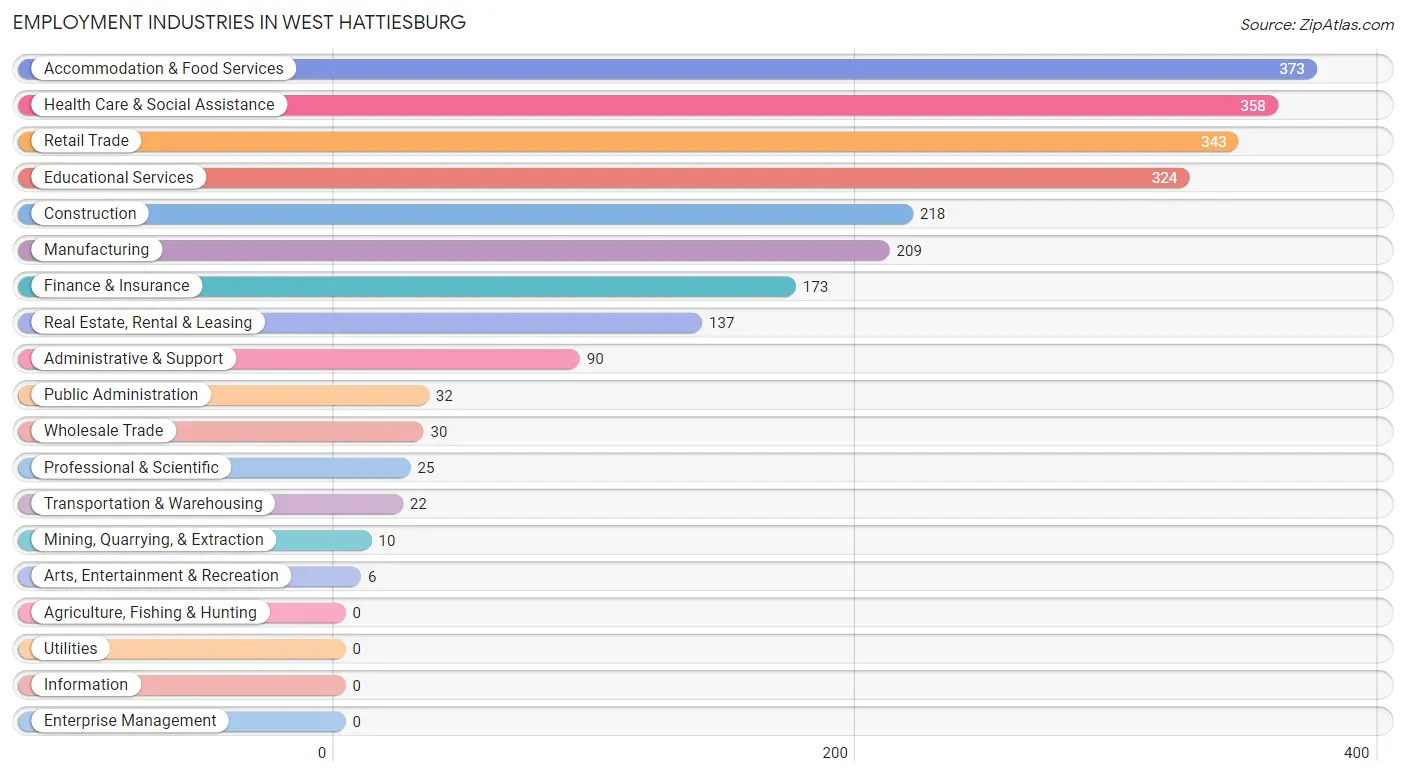
Employment Industries in West Hattiesburg
The major employment industries in West Hattiesburg include Accommodation & Food Services (373 | 15.1%), Health Care & Social Assistance (358 | 14.5%), Retail Trade (343 | 13.9%), Educational Services (324 | 13.2%), and Construction (218 | 8.8%).
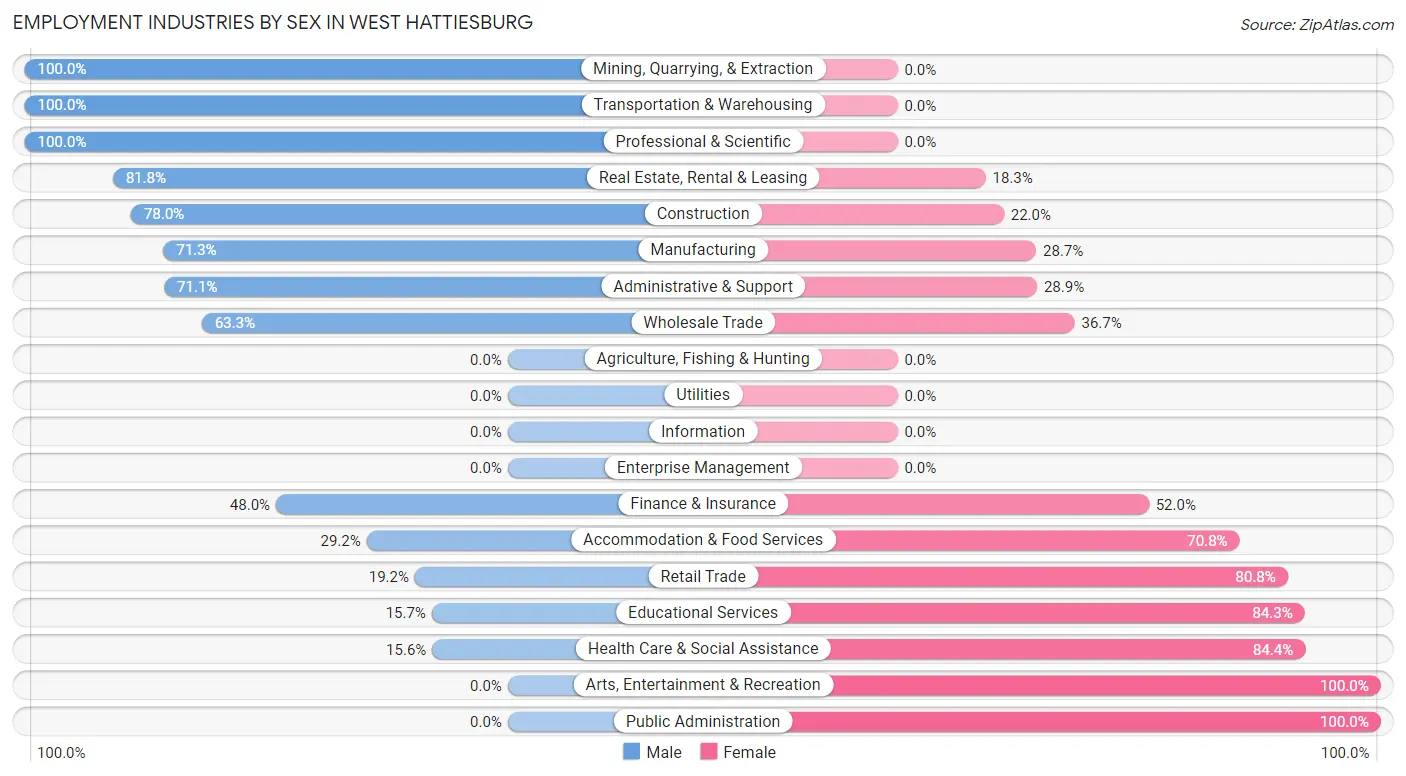
Employment Industries by Sex in West Hattiesburg
The West Hattiesburg industries that see more men than women are Mining, Quarrying, & Extraction (100.0%), Transportation & Warehousing (100.0%), and Professional & Scientific (100.0%), whereas the industries that tend to have a higher number of women are Arts, Entertainment & Recreation (100.0%), Public Administration (100.0%), and Health Care & Social Assistance (84.4%).
| Industry | Male | Female |
| Agriculture, Fishing & Hunting | 0 (0.0%) | 0 (0.0%) |
| Mining, Quarrying, & Extraction | 10 (100.0%) | 0 (0.0%) |
| Construction | 170 (78.0%) | 48 (22.0%) |
| Manufacturing | 149 (71.3%) | 60 (28.7%) |
| Wholesale Trade | 19 (63.3%) | 11 (36.7%) |
| Retail Trade | 66 (19.2%) | 277 (80.8%) |
| Transportation & Warehousing | 22 (100.0%) | 0 (0.0%) |
| Utilities | 0 (0.0%) | 0 (0.0%) |
| Information | 0 (0.0%) | 0 (0.0%) |
| Finance & Insurance | 83 (48.0%) | 90 (52.0%) |
| Real Estate, Rental & Leasing | 112 (81.8%) | 25 (18.2%) |
| Professional & Scientific | 25 (100.0%) | 0 (0.0%) |
| Enterprise Management | 0 (0.0%) | 0 (0.0%) |
| Administrative & Support | 64 (71.1%) | 26 (28.9%) |
| Educational Services | 51 (15.7%) | 273 (84.3%) |
| Health Care & Social Assistance | 56 (15.6%) | 302 (84.4%) |
| Arts, Entertainment & Recreation | 0 (0.0%) | 6 (100.0%) |
| Accommodation & Food Services | 109 (29.2%) | 264 (70.8%) |
| Public Administration | 0 (0.0%) | 32 (100.0%) |
| Total | 1,029 (41.8%) | 1,435 (58.2%) |
Education in West Hattiesburg
School Enrollment in West Hattiesburg
The most common levels of schooling among the 1,738 students in West Hattiesburg are elementary school (465 | 26.8%), high school (390 | 22.4%), and middle school (287 | 16.5%).
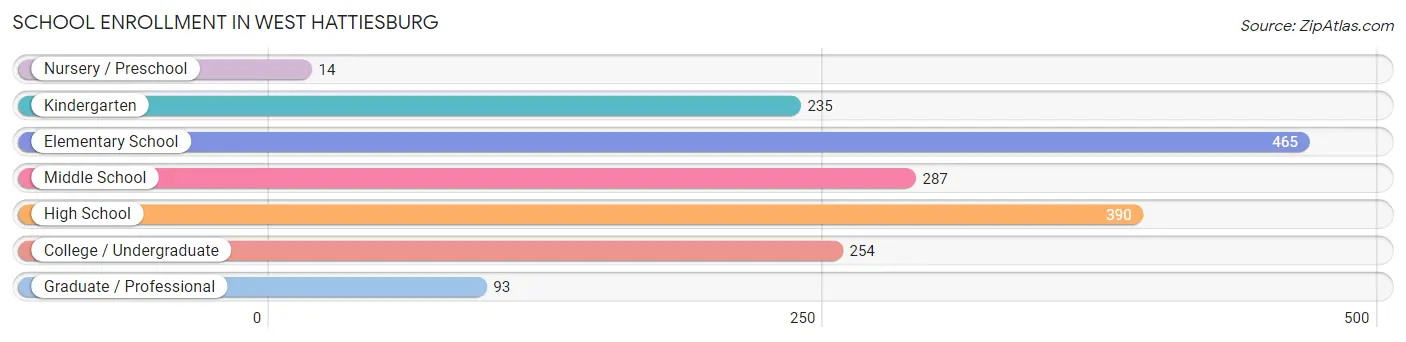
| School Level | # Students | % Students |
| Nursery / Preschool | 14 | 0.8% |
| Kindergarten | 235 | 13.5% |
| Elementary School | 465 | 26.8% |
| Middle School | 287 | 16.5% |
| High School | 390 | 22.4% |
| College / Undergraduate | 254 | 14.6% |
| Graduate / Professional | 93 | 5.3% |
| Total | 1,738 | 100.0% |
School Enrollment by Age by Funding Source in West Hattiesburg
Out of a total of 1,738 students who are enrolled in schools in West Hattiesburg, 111 (6.4%) attend a private institution, while the remaining 1,627 (93.6%) are enrolled in public schools. The age group of 3 to 4 year olds has the highest likelihood of being enrolled in private schools, with 8 (57.1% in the age bracket) enrolled. Conversely, the age group of 15 to 17 year olds has the lowest likelihood of being enrolled in a private school, with 194 (100.0% in the age bracket) attending a public institution.
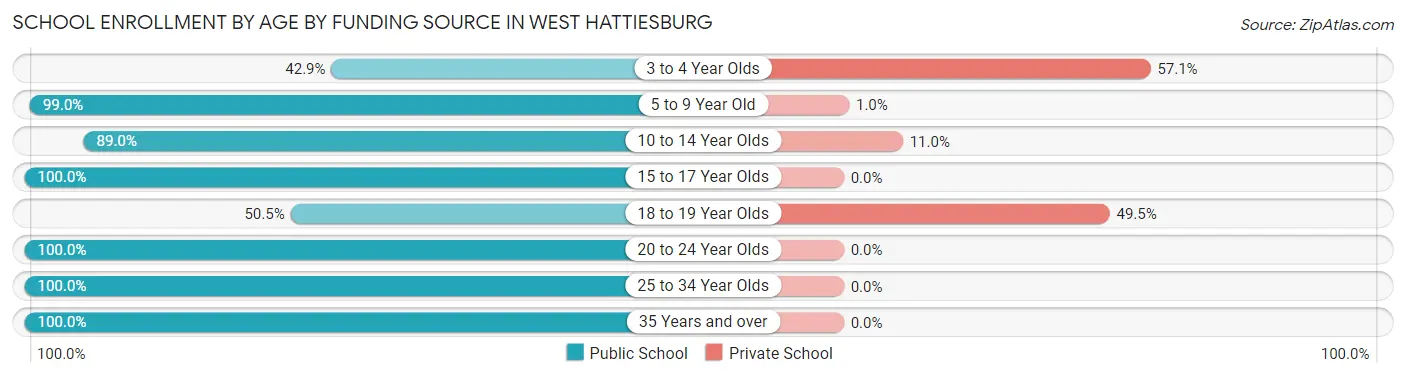
| Age Bracket | Public School | Private School |
| 3 to 4 Year Olds | 6 (42.9%) | 8 (57.1%) |
| 5 to 9 Year Old | 692 (99.0%) | 7 (1.0%) |
| 10 to 14 Year Olds | 364 (89.0%) | 45 (11.0%) |
| 15 to 17 Year Olds | 194 (100.0%) | 0 (0.0%) |
| 18 to 19 Year Olds | 53 (50.5%) | 52 (49.5%) |
| 20 to 24 Year Olds | 192 (100.0%) | 0 (0.0%) |
| 25 to 34 Year Olds | 63 (100.0%) | 0 (0.0%) |
| 35 Years and over | 62 (100.0%) | 0 (0.0%) |
| Total | 1,627 (93.6%) | 111 (6.4%) |
Educational Attainment by Field of Study in West Hattiesburg
Business (260 | 24.2%), education (238 | 22.2%), physical & health sciences (142 | 13.2%), science & technology (122 | 11.4%), and arts & humanities (93 | 8.7%) are the most common fields of study among 1,074 individuals in West Hattiesburg who have obtained a bachelor's degree or higher.
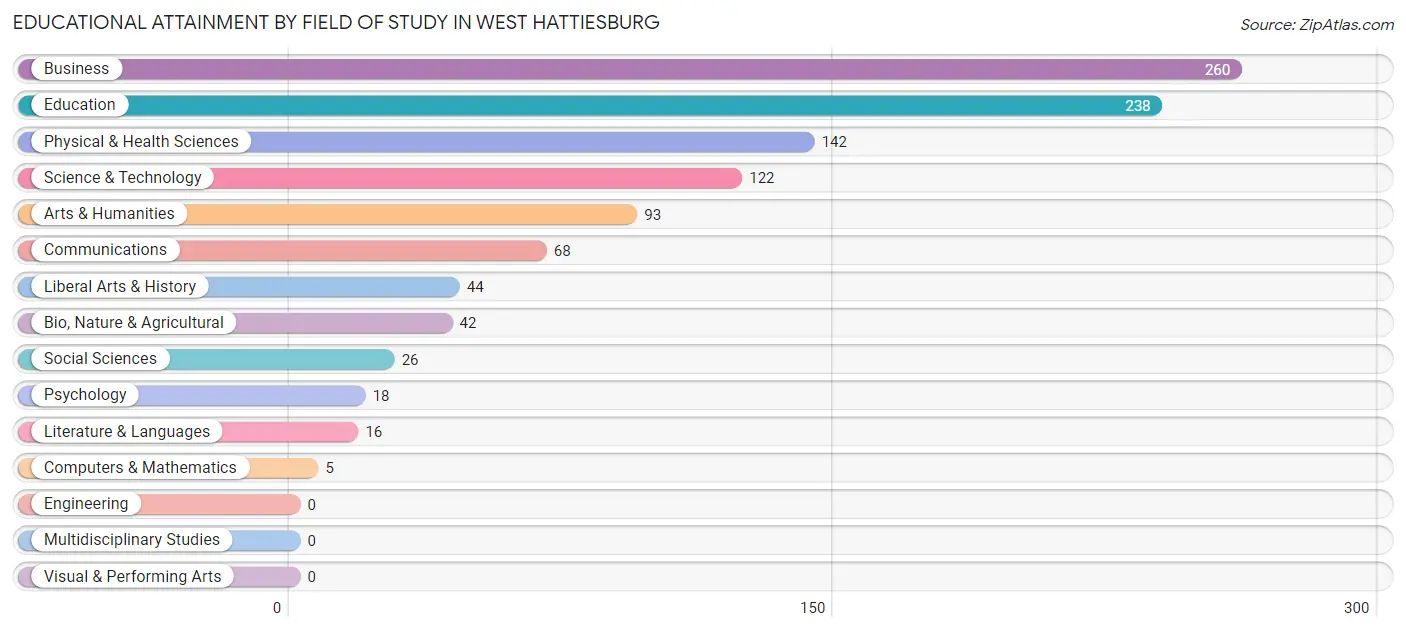
| Field of Study | # Graduates | % Graduates |
| Computers & Mathematics | 5 | 0.5% |
| Bio, Nature & Agricultural | 42 | 3.9% |
| Physical & Health Sciences | 142 | 13.2% |
| Psychology | 18 | 1.7% |
| Social Sciences | 26 | 2.4% |
| Engineering | 0 | 0.0% |
| Multidisciplinary Studies | 0 | 0.0% |
| Science & Technology | 122 | 11.4% |
| Business | 260 | 24.2% |
| Education | 238 | 22.2% |
| Literature & Languages | 16 | 1.5% |
| Liberal Arts & History | 44 | 4.1% |
| Visual & Performing Arts | 0 | 0.0% |
| Communications | 68 | 6.3% |
| Arts & Humanities | 93 | 8.7% |
| Total | 1,074 | 100.0% |
Transportation & Commute in West Hattiesburg
Vehicle Availability by Sex in West Hattiesburg
The most prevalent vehicle ownership categories in West Hattiesburg are males with 2 vehicles (338, accounting for 33.7%) and females with 2 vehicles (437, making up 26.5%).
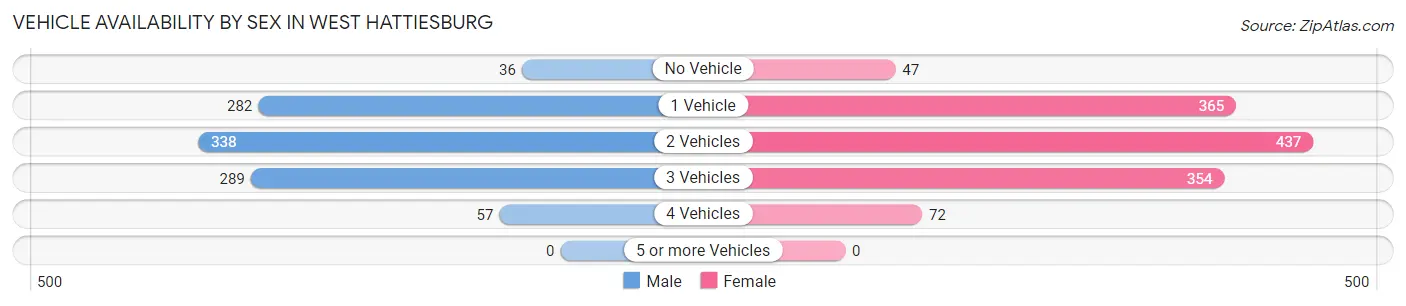
| Vehicles Available | Male | Female |
| No Vehicle | 36 (3.6%) | 47 (3.7%) |
| 1 Vehicle | 282 (28.1%) | 365 (28.6%) |
| 2 Vehicles | 338 (33.7%) | 437 (34.3%) |
| 3 Vehicles | 289 (28.8%) | 354 (27.8%) |
| 4 Vehicles | 57 (5.7%) | 72 (5.7%) |
| 5 or more Vehicles | 0 (0.0%) | 0 (0.0%) |
| Total | 1,002 (100.0%) | 1,275 (100.0%) |
Commute Time in West Hattiesburg
The most frequently occuring commute durations in West Hattiesburg are 15 to 19 minutes (617 commuters, 28.1%), 90 or more minutes (328 commuters, 14.9%), and 10 to 14 minutes (245 commuters, 11.2%).
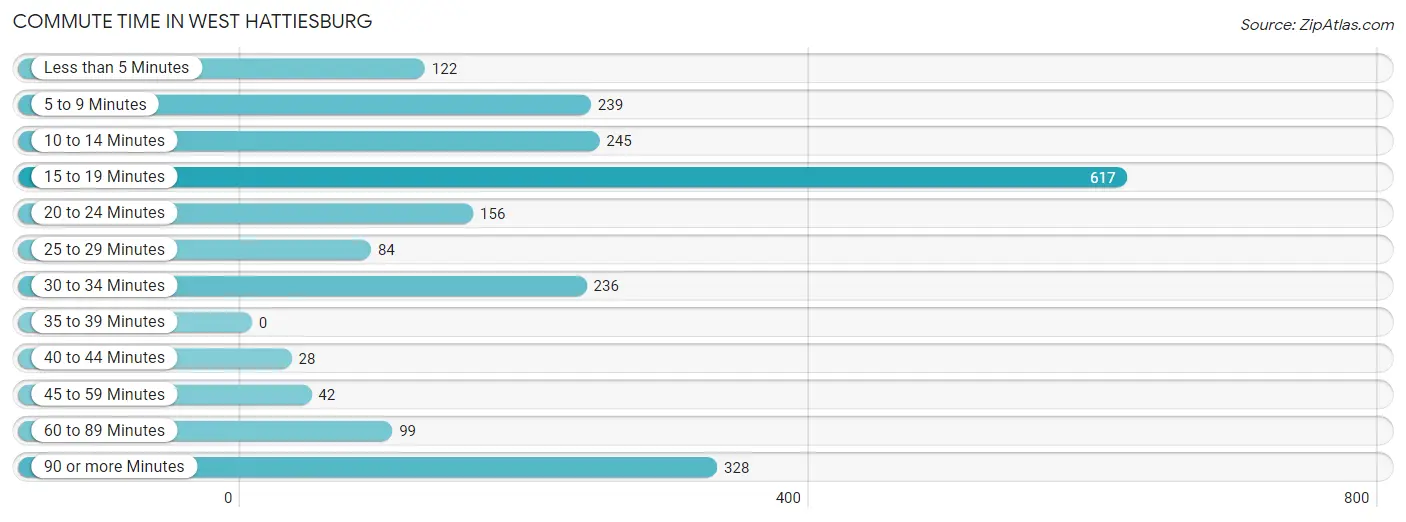
| Commute Time | # Commuters | % Commuters |
| Less than 5 Minutes | 122 | 5.6% |
| 5 to 9 Minutes | 239 | 10.9% |
| 10 to 14 Minutes | 245 | 11.2% |
| 15 to 19 Minutes | 617 | 28.1% |
| 20 to 24 Minutes | 156 | 7.1% |
| 25 to 29 Minutes | 84 | 3.8% |
| 30 to 34 Minutes | 236 | 10.7% |
| 35 to 39 Minutes | 0 | 0.0% |
| 40 to 44 Minutes | 28 | 1.3% |
| 45 to 59 Minutes | 42 | 1.9% |
| 60 to 89 Minutes | 99 | 4.5% |
| 90 or more Minutes | 328 | 14.9% |
Commute Time by Sex in West Hattiesburg
The most common commute times in West Hattiesburg are 15 to 19 minutes (227 commuters, 24.0%) for males and 15 to 19 minutes (390 commuters, 31.2%) for females.
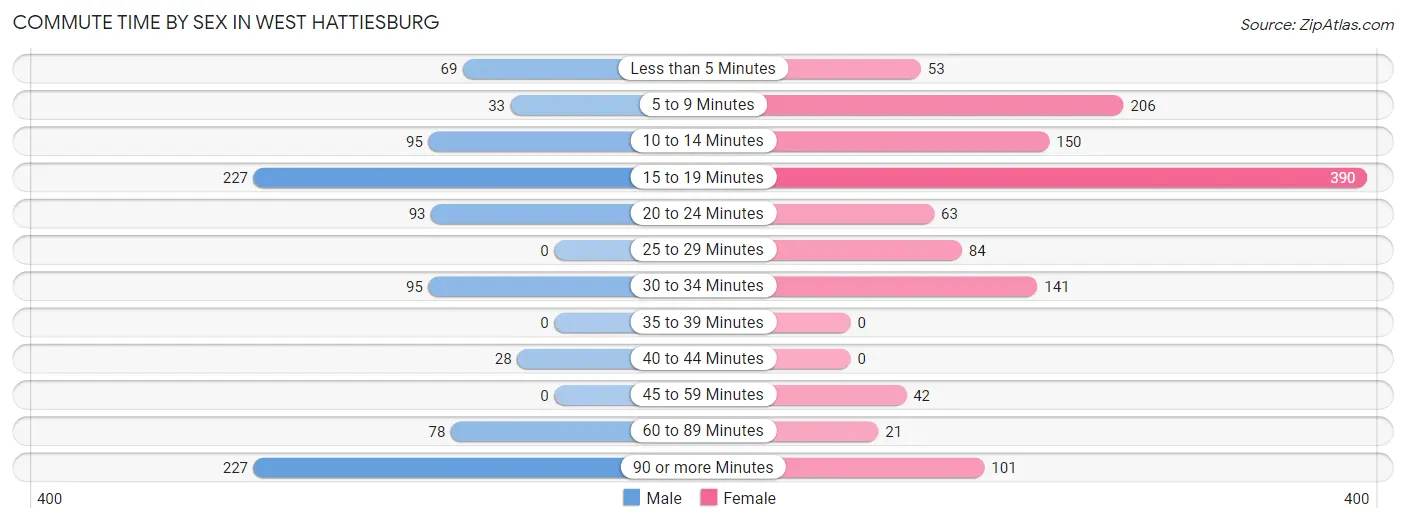
| Commute Time | Male | Female |
| Less than 5 Minutes | 69 (7.3%) | 53 (4.2%) |
| 5 to 9 Minutes | 33 (3.5%) | 206 (16.5%) |
| 10 to 14 Minutes | 95 (10.1%) | 150 (12.0%) |
| 15 to 19 Minutes | 227 (24.0%) | 390 (31.2%) |
| 20 to 24 Minutes | 93 (9.8%) | 63 (5.0%) |
| 25 to 29 Minutes | 0 (0.0%) | 84 (6.7%) |
| 30 to 34 Minutes | 95 (10.1%) | 141 (11.3%) |
| 35 to 39 Minutes | 0 (0.0%) | 0 (0.0%) |
| 40 to 44 Minutes | 28 (3.0%) | 0 (0.0%) |
| 45 to 59 Minutes | 0 (0.0%) | 42 (3.4%) |
| 60 to 89 Minutes | 78 (8.3%) | 21 (1.7%) |
| 90 or more Minutes | 227 (24.0%) | 101 (8.1%) |
Time of Departure to Work by Sex in West Hattiesburg
The most frequent times of departure to work in West Hattiesburg are 12:00 AM to 4:59 AM (250, 26.5%) for males and 7:00 AM to 7:29 AM (208, 16.6%) for females.
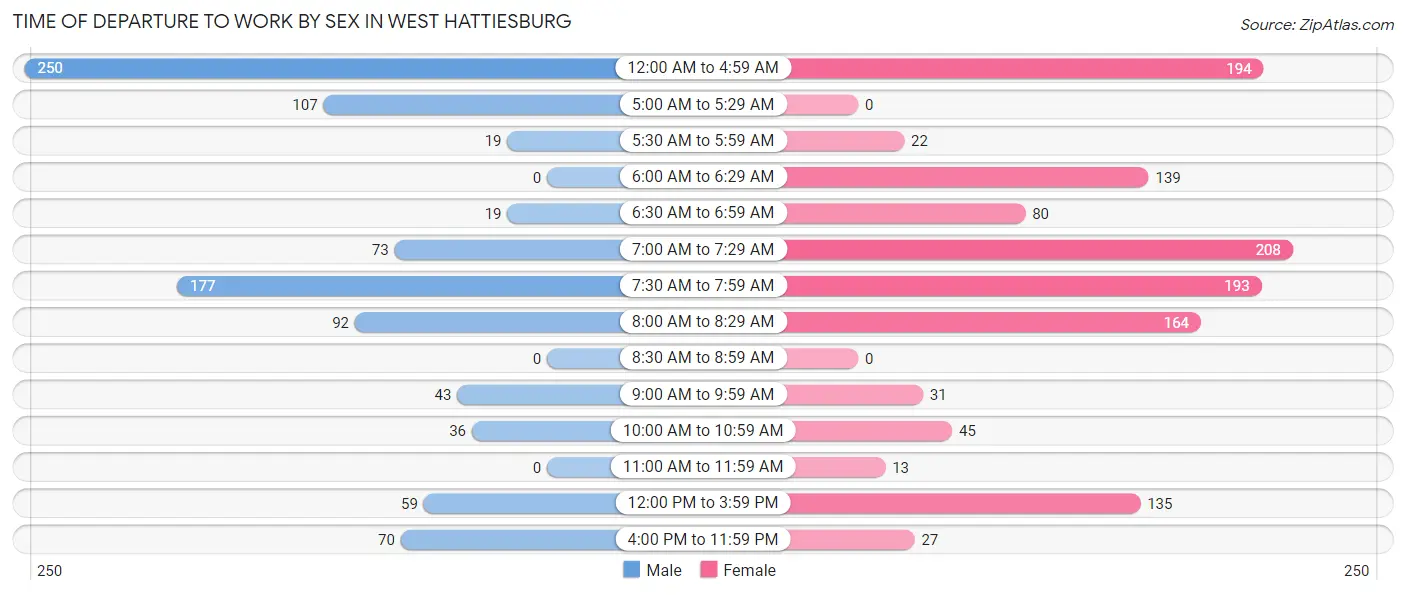
| Time of Departure | Male | Female |
| 12:00 AM to 4:59 AM | 250 (26.5%) | 194 (15.5%) |
| 5:00 AM to 5:29 AM | 107 (11.3%) | 0 (0.0%) |
| 5:30 AM to 5:59 AM | 19 (2.0%) | 22 (1.8%) |
| 6:00 AM to 6:29 AM | 0 (0.0%) | 139 (11.1%) |
| 6:30 AM to 6:59 AM | 19 (2.0%) | 80 (6.4%) |
| 7:00 AM to 7:29 AM | 73 (7.7%) | 208 (16.6%) |
| 7:30 AM to 7:59 AM | 177 (18.7%) | 193 (15.4%) |
| 8:00 AM to 8:29 AM | 92 (9.7%) | 164 (13.1%) |
| 8:30 AM to 8:59 AM | 0 (0.0%) | 0 (0.0%) |
| 9:00 AM to 9:59 AM | 43 (4.5%) | 31 (2.5%) |
| 10:00 AM to 10:59 AM | 36 (3.8%) | 45 (3.6%) |
| 11:00 AM to 11:59 AM | 0 (0.0%) | 13 (1.0%) |
| 12:00 PM to 3:59 PM | 59 (6.2%) | 135 (10.8%) |
| 4:00 PM to 11:59 PM | 70 (7.4%) | 27 (2.2%) |
| Total | 945 (100.0%) | 1,251 (100.0%) |
Housing Occupancy in West Hattiesburg
Occupancy by Ownership in West Hattiesburg
Of the total 2,238 dwellings in West Hattiesburg, owner-occupied units account for 912 (40.7%), while renter-occupied units make up 1,326 (59.3%).
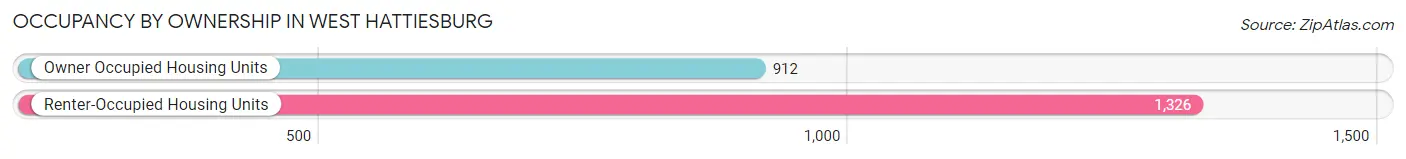
| Occupancy | # Housing Units | % Housing Units |
| Owner Occupied Housing Units | 912 | 40.7% |
| Renter-Occupied Housing Units | 1,326 | 59.3% |
| Total Occupied Housing Units | 2,238 | 100.0% |
Occupancy by Household Size in West Hattiesburg
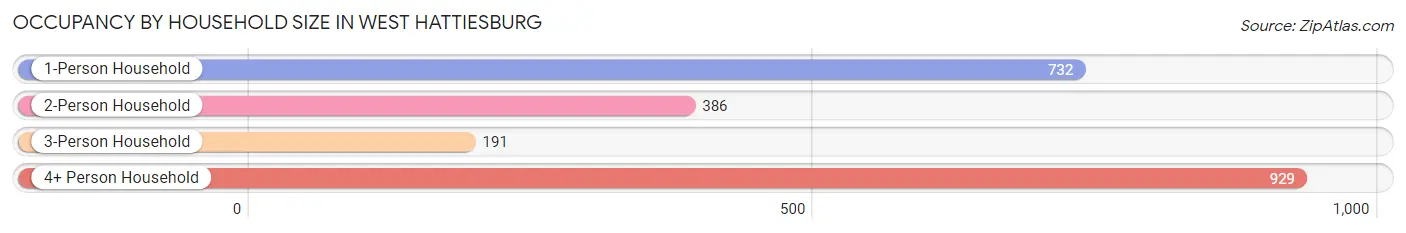
| Household Size | # Housing Units | % Housing Units |
| 1-Person Household | 732 | 32.7% |
| 2-Person Household | 386 | 17.2% |
| 3-Person Household | 191 | 8.5% |
| 4+ Person Household | 929 | 41.5% |
| Total Housing Units | 2,238 | 100.0% |
Occupancy by Ownership by Household Size in West Hattiesburg
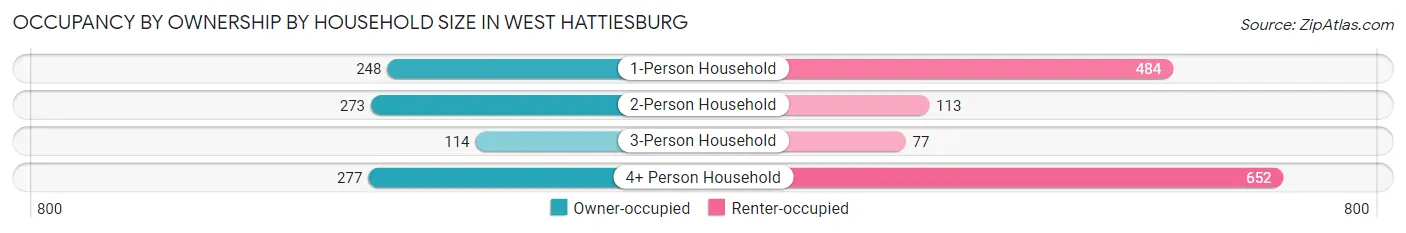
| Household Size | Owner-occupied | Renter-occupied |
| 1-Person Household | 248 (33.9%) | 484 (66.1%) |
| 2-Person Household | 273 (70.7%) | 113 (29.3%) |
| 3-Person Household | 114 (59.7%) | 77 (40.3%) |
| 4+ Person Household | 277 (29.8%) | 652 (70.2%) |
| Total Housing Units | 912 (40.7%) | 1,326 (59.3%) |
Occupancy by Educational Attainment in West Hattiesburg
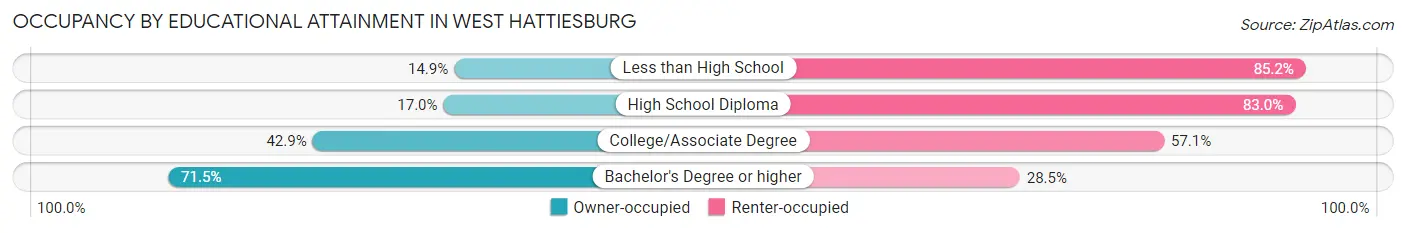
| Household Size | Owner-occupied | Renter-occupied |
| Less than High School | 45 (14.8%) | 258 (85.2%) |
| High School Diploma | 103 (17.0%) | 504 (83.0%) |
| College/Associate Degree | 279 (42.9%) | 371 (57.1%) |
| Bachelor's Degree or higher | 485 (71.5%) | 193 (28.5%) |
Occupancy by Age of Householder in West Hattiesburg
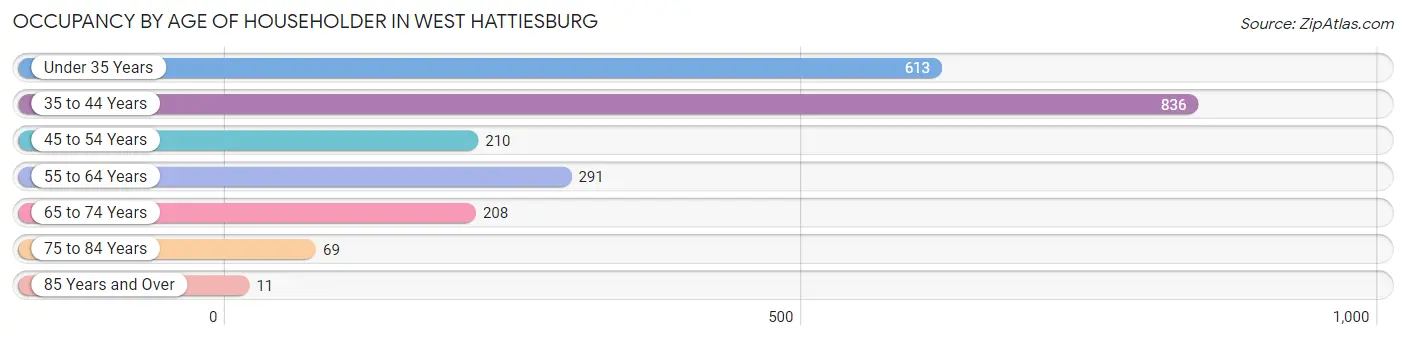
| Age Bracket | # Households | % Households |
| Under 35 Years | 613 | 27.4% |
| 35 to 44 Years | 836 | 37.3% |
| 45 to 54 Years | 210 | 9.4% |
| 55 to 64 Years | 291 | 13.0% |
| 65 to 74 Years | 208 | 9.3% |
| 75 to 84 Years | 69 | 3.1% |
| 85 Years and Over | 11 | 0.5% |
| Total | 2,238 | 100.0% |
Housing Finances in West Hattiesburg
Median Income by Occupancy in West Hattiesburg
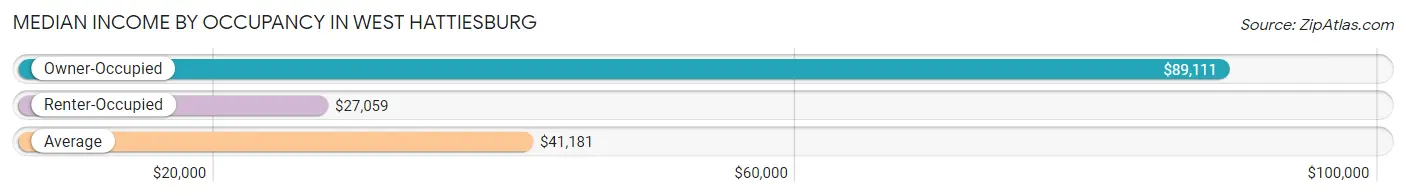
| Occupancy Type | # Households | Median Income |
| Owner-Occupied | 912 (40.7%) | $89,111 |
| Renter-Occupied | 1,326 (59.3%) | $27,059 |
| Average | 2,238 (100.0%) | $41,181 |
Occupancy by Householder Income Bracket in West Hattiesburg
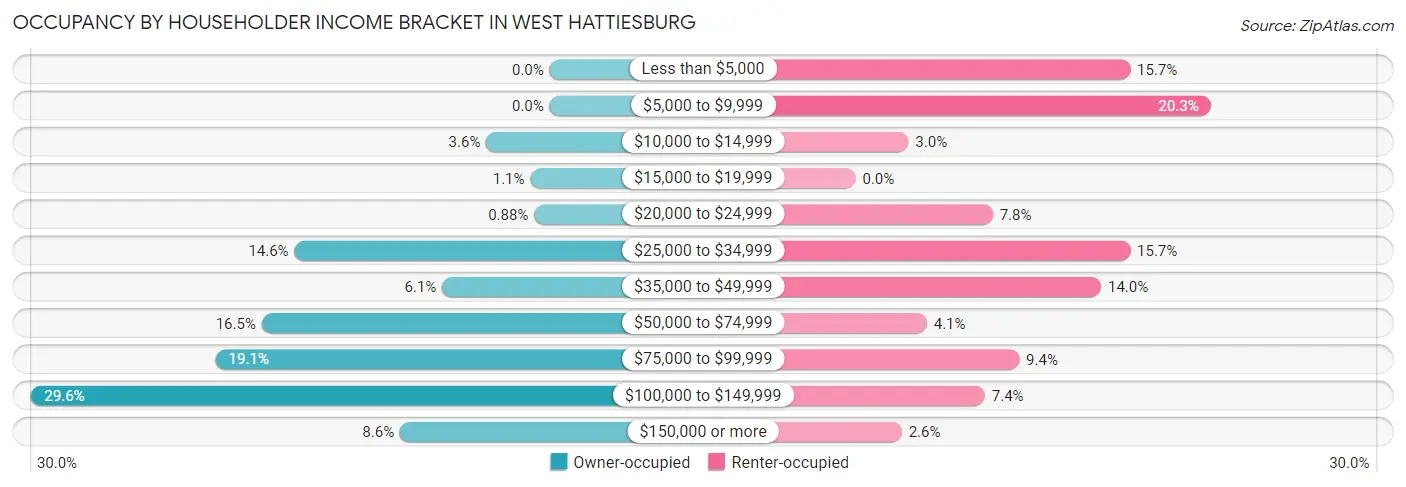
| Income Bracket | Owner-occupied | Renter-occupied |
| Less than $5,000 | 0 (0.0%) | 208 (15.7%) |
| $5,000 to $9,999 | 0 (0.0%) | 269 (20.3%) |
| $10,000 to $14,999 | 33 (3.6%) | 40 (3.0%) |
| $15,000 to $19,999 | 10 (1.1%) | 0 (0.0%) |
| $20,000 to $24,999 | 8 (0.9%) | 104 (7.8%) |
| $25,000 to $34,999 | 133 (14.6%) | 208 (15.7%) |
| $35,000 to $49,999 | 56 (6.1%) | 186 (14.0%) |
| $50,000 to $74,999 | 150 (16.5%) | 54 (4.1%) |
| $75,000 to $99,999 | 174 (19.1%) | 124 (9.3%) |
| $100,000 to $149,999 | 270 (29.6%) | 98 (7.4%) |
| $150,000 or more | 78 (8.6%) | 35 (2.6%) |
| Total | 912 (100.0%) | 1,326 (100.0%) |
Monthly Housing Cost Tiers in West Hattiesburg
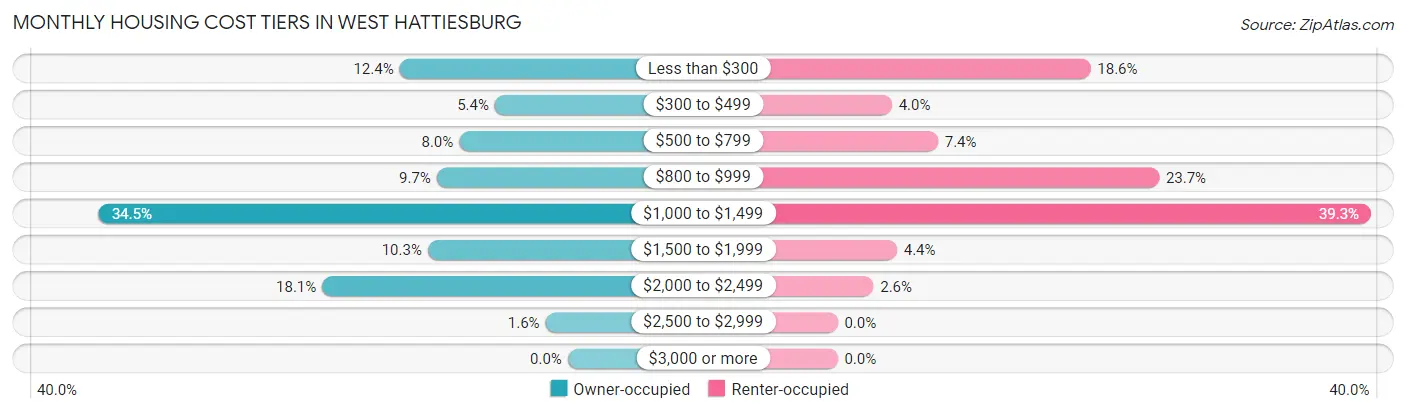
| Monthly Cost | Owner-occupied | Renter-occupied |
| Less than $300 | 113 (12.4%) | 247 (18.6%) |
| $300 to $499 | 49 (5.4%) | 53 (4.0%) |
| $500 to $799 | 73 (8.0%) | 98 (7.4%) |
| $800 to $999 | 88 (9.7%) | 314 (23.7%) |
| $1,000 to $1,499 | 315 (34.5%) | 521 (39.3%) |
| $1,500 to $1,999 | 94 (10.3%) | 58 (4.4%) |
| $2,000 to $2,499 | 165 (18.1%) | 35 (2.6%) |
| $2,500 to $2,999 | 15 (1.6%) | 0 (0.0%) |
| $3,000 or more | 0 (0.0%) | 0 (0.0%) |
| Total | 912 (100.0%) | 1,326 (100.0%) |
Physical Housing Characteristics in West Hattiesburg
Housing Structures in West Hattiesburg
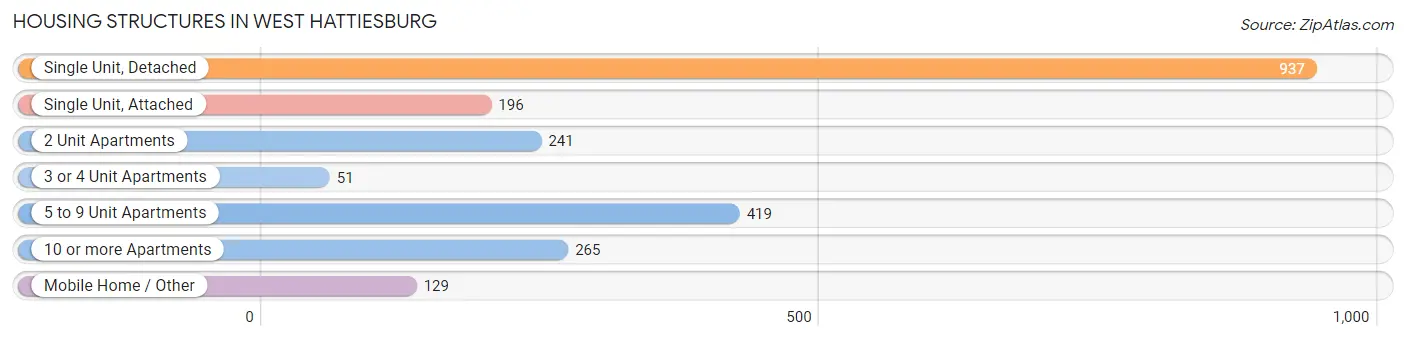
| Structure Type | # Housing Units | % Housing Units |
| Single Unit, Detached | 937 | 41.9% |
| Single Unit, Attached | 196 | 8.8% |
| 2 Unit Apartments | 241 | 10.8% |
| 3 or 4 Unit Apartments | 51 | 2.3% |
| 5 to 9 Unit Apartments | 419 | 18.7% |
| 10 or more Apartments | 265 | 11.8% |
| Mobile Home / Other | 129 | 5.8% |
| Total | 2,238 | 100.0% |
Housing Structures by Occupancy in West Hattiesburg
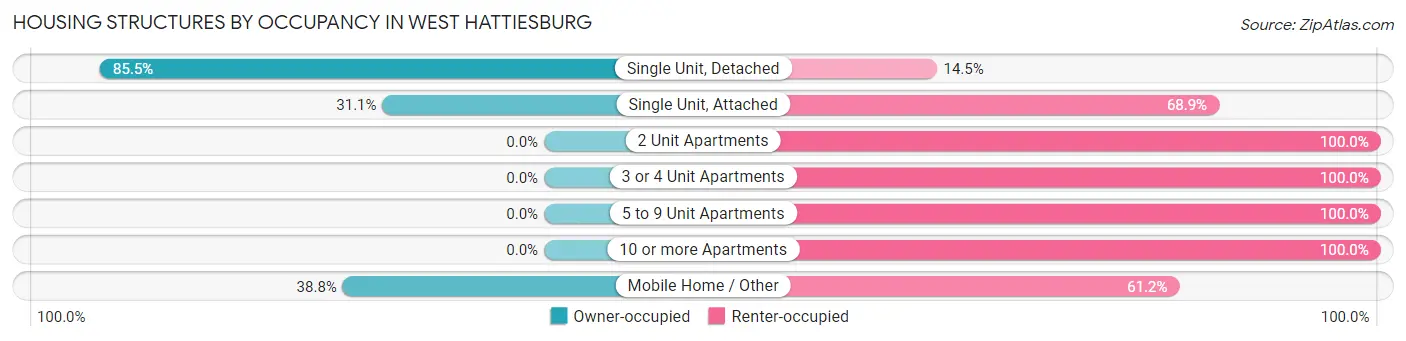
| Structure Type | Owner-occupied | Renter-occupied |
| Single Unit, Detached | 801 (85.5%) | 136 (14.5%) |
| Single Unit, Attached | 61 (31.1%) | 135 (68.9%) |
| 2 Unit Apartments | 0 (0.0%) | 241 (100.0%) |
| 3 or 4 Unit Apartments | 0 (0.0%) | 51 (100.0%) |
| 5 to 9 Unit Apartments | 0 (0.0%) | 419 (100.0%) |
| 10 or more Apartments | 0 (0.0%) | 265 (100.0%) |
| Mobile Home / Other | 50 (38.8%) | 79 (61.2%) |
| Total | 912 (40.7%) | 1,326 (59.3%) |
Housing Structures by Number of Rooms in West Hattiesburg
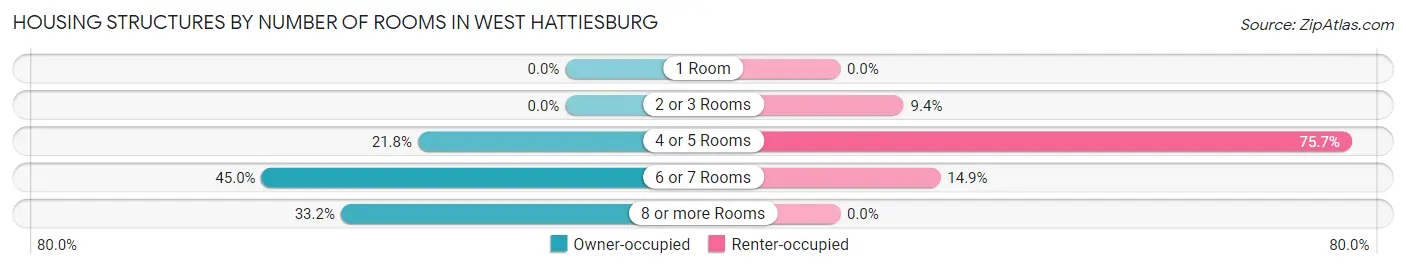
| Number of Rooms | Owner-occupied | Renter-occupied |
| 1 Room | 0 (0.0%) | 0 (0.0%) |
| 2 or 3 Rooms | 0 (0.0%) | 125 (9.4%) |
| 4 or 5 Rooms | 199 (21.8%) | 1,004 (75.7%) |
| 6 or 7 Rooms | 410 (45.0%) | 197 (14.9%) |
| 8 or more Rooms | 303 (33.2%) | 0 (0.0%) |
| Total | 912 (100.0%) | 1,326 (100.0%) |
Housing Structure by Heating Type in West Hattiesburg
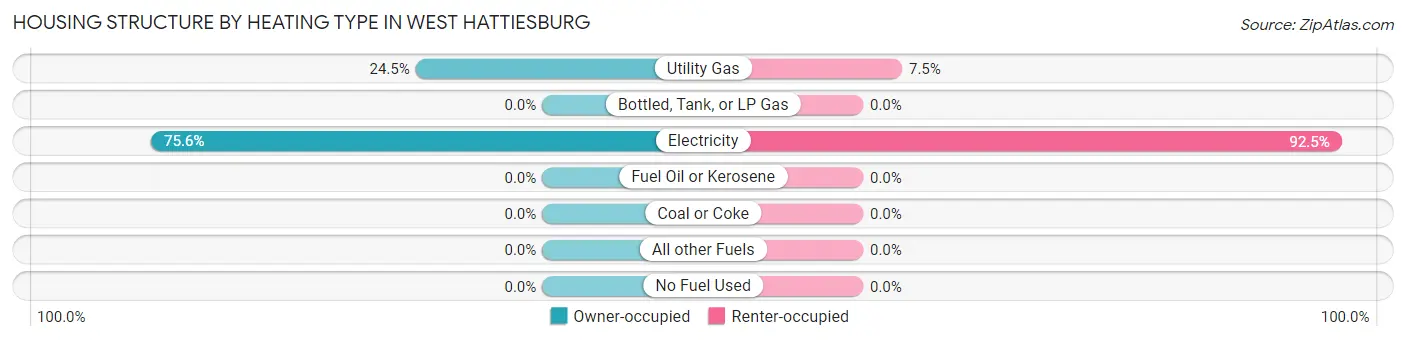
| Heating Type | Owner-occupied | Renter-occupied |
| Utility Gas | 223 (24.4%) | 100 (7.5%) |
| Bottled, Tank, or LP Gas | 0 (0.0%) | 0 (0.0%) |
| Electricity | 689 (75.5%) | 1,226 (92.5%) |
| Fuel Oil or Kerosene | 0 (0.0%) | 0 (0.0%) |
| Coal or Coke | 0 (0.0%) | 0 (0.0%) |
| All other Fuels | 0 (0.0%) | 0 (0.0%) |
| No Fuel Used | 0 (0.0%) | 0 (0.0%) |
| Total | 912 (100.0%) | 1,326 (100.0%) |
Household Vehicle Usage in West Hattiesburg
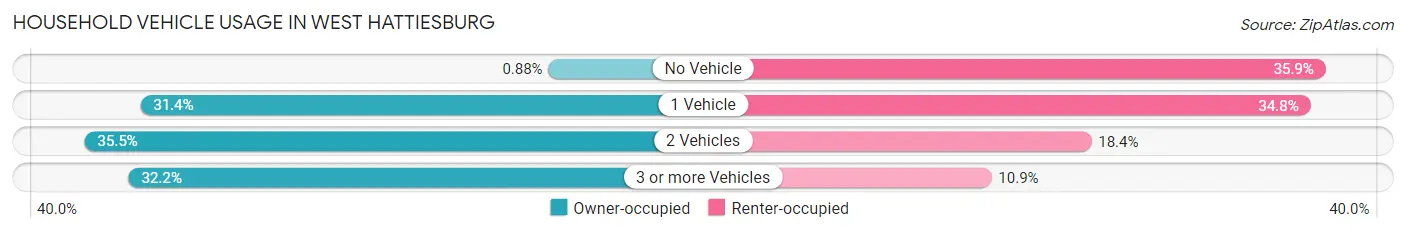
| Vehicles per Household | Owner-occupied | Renter-occupied |
| No Vehicle | 8 (0.9%) | 476 (35.9%) |
| 1 Vehicle | 286 (31.4%) | 461 (34.8%) |
| 2 Vehicles | 324 (35.5%) | 244 (18.4%) |
| 3 or more Vehicles | 294 (32.2%) | 145 (10.9%) |
| Total | 912 (100.0%) | 1,326 (100.0%) |
Real Estate & Mortgages in West Hattiesburg
Real Estate and Mortgage Overview in West Hattiesburg
| Characteristic | Without Mortgage | With Mortgage |
| Housing Units | 261 | 651 |
| Median Property Value | $176,200 | $213,000 |
| Median Household Income | - | - |
| Monthly Housing Costs | $363 | $0 |
| Real Estate Taxes | $935 | $59 |
Property Value by Mortgage Status in West Hattiesburg
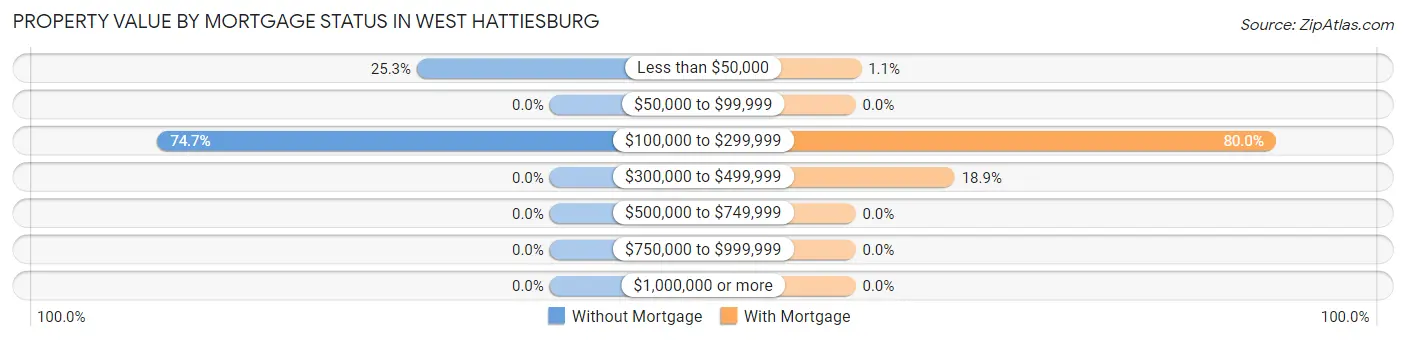
| Property Value | Without Mortgage | With Mortgage |
| Less than $50,000 | 66 (25.3%) | 7 (1.1%) |
| $50,000 to $99,999 | 0 (0.0%) | 0 (0.0%) |
| $100,000 to $299,999 | 195 (74.7%) | 521 (80.0%) |
| $300,000 to $499,999 | 0 (0.0%) | 123 (18.9%) |
| $500,000 to $749,999 | 0 (0.0%) | 0 (0.0%) |
| $750,000 to $999,999 | 0 (0.0%) | 0 (0.0%) |
| $1,000,000 or more | 0 (0.0%) | 0 (0.0%) |
| Total | 261 (100.0%) | 651 (100.0%) |
Household Income by Mortgage Status in West Hattiesburg
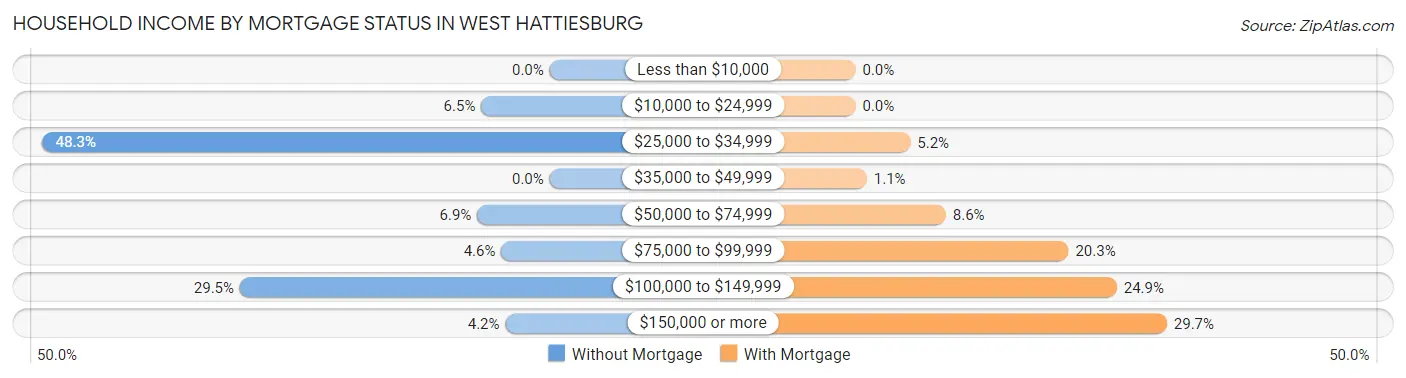
| Household Income | Without Mortgage | With Mortgage |
| Less than $10,000 | 0 (0.0%) | 0 (0.0%) |
| $10,000 to $24,999 | 17 (6.5%) | 0 (0.0%) |
| $25,000 to $34,999 | 126 (48.3%) | 34 (5.2%) |
| $35,000 to $49,999 | 0 (0.0%) | 7 (1.1%) |
| $50,000 to $74,999 | 18 (6.9%) | 56 (8.6%) |
| $75,000 to $99,999 | 12 (4.6%) | 132 (20.3%) |
| $100,000 to $149,999 | 77 (29.5%) | 162 (24.9%) |
| $150,000 or more | 11 (4.2%) | 193 (29.6%) |
| Total | 261 (100.0%) | 651 (100.0%) |
Property Value to Household Income Ratio in West Hattiesburg
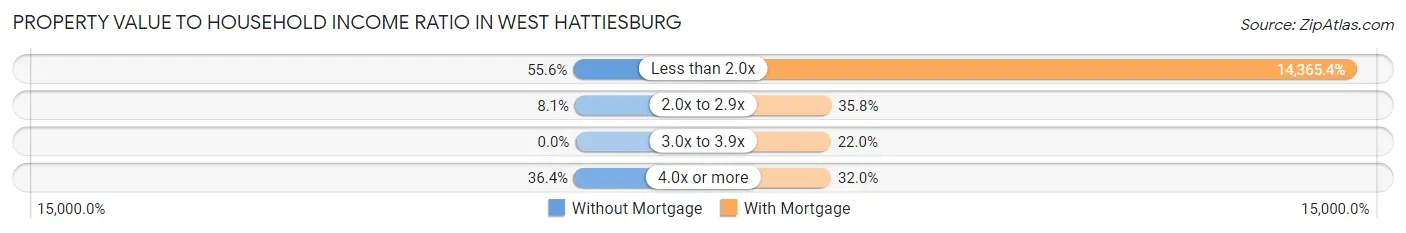
| Value-to-Income Ratio | Without Mortgage | With Mortgage |
| Less than 2.0x | 145 (55.6%) | 93,519 (14,365.4%) |
| 2.0x to 2.9x | 21 (8.1%) | 233 (35.8%) |
| 3.0x to 3.9x | 0 (0.0%) | 143 (22.0%) |
| 4.0x or more | 95 (36.4%) | 208 (32.0%) |
| Total | 261 (100.0%) | 651 (100.0%) |
Real Estate Taxes by Mortgage Status in West Hattiesburg
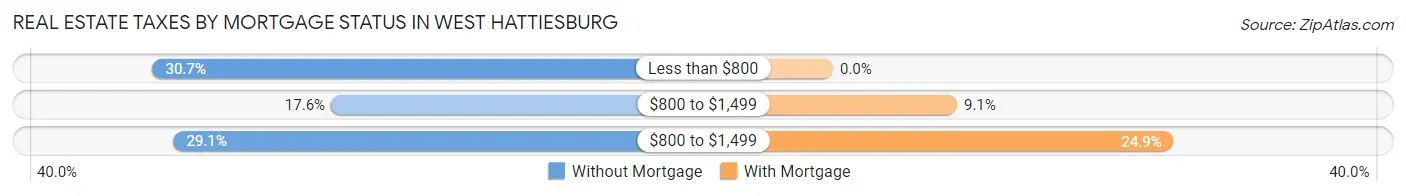
| Property Taxes | Without Mortgage | With Mortgage |
| Less than $800 | 80 (30.6%) | 0 (0.0%) |
| $800 to $1,499 | 46 (17.6%) | 59 (9.1%) |
| $800 to $1,499 | 76 (29.1%) | 162 (24.9%) |
| Total | 261 (100.0%) | 651 (100.0%) |
Health & Disability in West Hattiesburg
Health Insurance Coverage by Age in West Hattiesburg
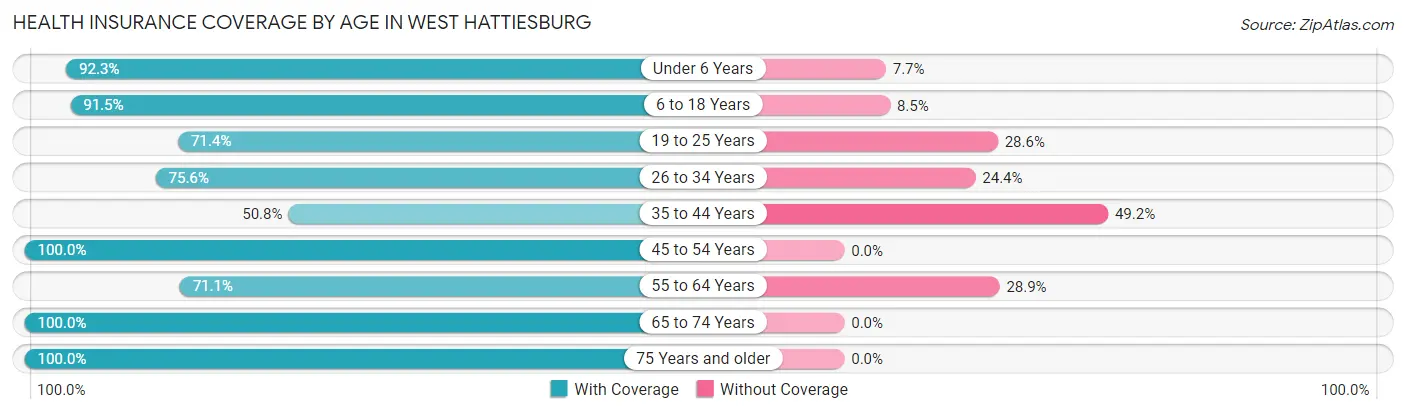
| Age Bracket | With Coverage | Without Coverage |
| Under 6 Years | 632 (92.3%) | 53 (7.7%) |
| 6 to 18 Years | 1,310 (91.5%) | 122 (8.5%) |
| 19 to 25 Years | 494 (71.4%) | 198 (28.6%) |
| 26 to 34 Years | 470 (75.6%) | 152 (24.4%) |
| 35 to 44 Years | 610 (50.8%) | 590 (49.2%) |
| 45 to 54 Years | 459 (100.0%) | 0 (0.0%) |
| 55 to 64 Years | 258 (71.1%) | 105 (28.9%) |
| 65 to 74 Years | 458 (100.0%) | 0 (0.0%) |
| 75 Years and older | 159 (100.0%) | 0 (0.0%) |
| Total | 4,850 (79.9%) | 1,220 (20.1%) |
Health Insurance Coverage by Citizenship Status in West Hattiesburg
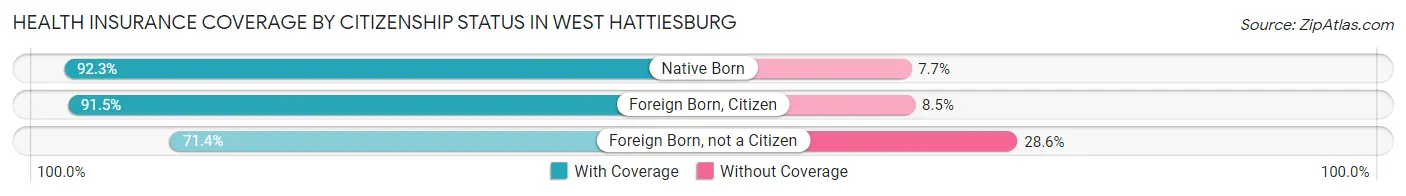
| Citizenship Status | With Coverage | Without Coverage |
| Native Born | 632 (92.3%) | 53 (7.7%) |
| Foreign Born, Citizen | 1,310 (91.5%) | 122 (8.5%) |
| Foreign Born, not a Citizen | 494 (71.4%) | 198 (28.6%) |
Health Insurance Coverage by Household Income in West Hattiesburg
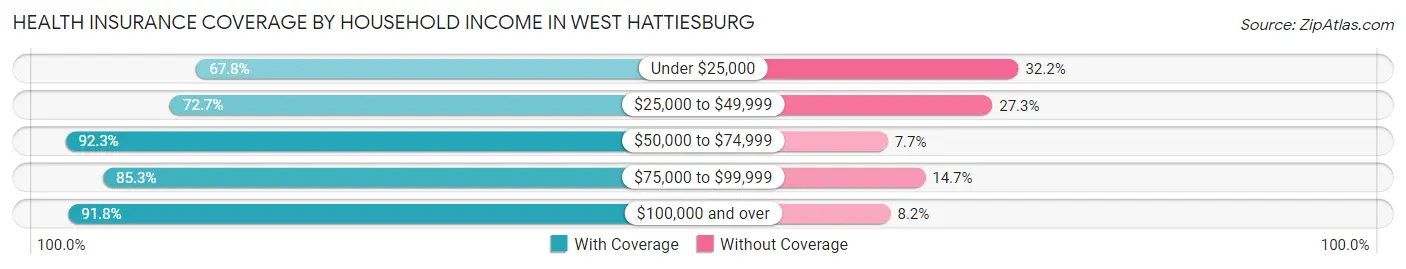
| Household Income | With Coverage | Without Coverage |
| Under $25,000 | 1,090 (67.8%) | 517 (32.2%) |
| $25,000 to $49,999 | 1,062 (72.7%) | 398 (27.3%) |
| $50,000 to $74,999 | 675 (92.3%) | 56 (7.7%) |
| $75,000 to $99,999 | 824 (85.3%) | 142 (14.7%) |
| $100,000 and over | 1,199 (91.8%) | 107 (8.2%) |
Public vs Private Health Insurance Coverage by Age in West Hattiesburg
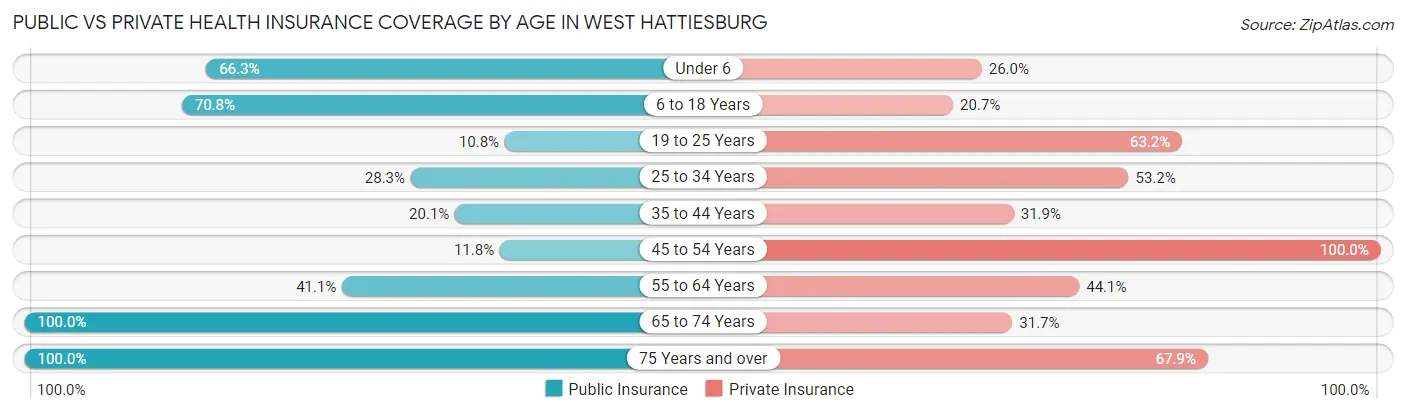
| Age Bracket | Public Insurance | Private Insurance |
| Under 6 | 454 (66.3%) | 178 (26.0%) |
| 6 to 18 Years | 1,014 (70.8%) | 296 (20.7%) |
| 19 to 25 Years | 75 (10.8%) | 437 (63.1%) |
| 25 to 34 Years | 176 (28.3%) | 331 (53.2%) |
| 35 to 44 Years | 241 (20.1%) | 383 (31.9%) |
| 45 to 54 Years | 54 (11.8%) | 459 (100.0%) |
| 55 to 64 Years | 149 (41.0%) | 160 (44.1%) |
| 65 to 74 Years | 458 (100.0%) | 145 (31.7%) |
| 75 Years and over | 159 (100.0%) | 108 (67.9%) |
| Total | 2,780 (45.8%) | 2,497 (41.1%) |
Disability Status by Sex by Age in West Hattiesburg
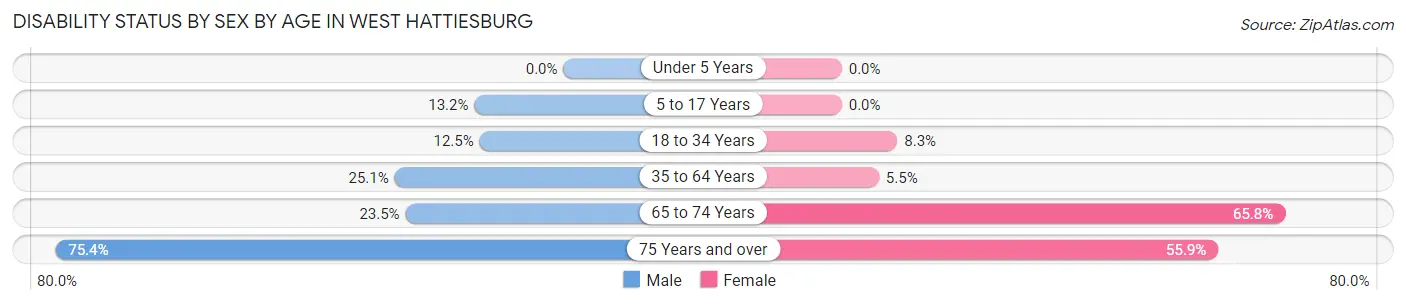
| Age Bracket | Male | Female |
| Under 5 Years | 0 (0.0%) | 0 (0.0%) |
| 5 to 17 Years | 73 (13.2%) | 0 (0.0%) |
| 18 to 34 Years | 68 (12.4%) | 72 (8.3%) |
| 35 to 64 Years | 252 (25.1%) | 56 (5.5%) |
| 65 to 74 Years | 34 (23.4%) | 206 (65.8%) |
| 75 Years and over | 43 (75.4%) | 57 (55.9%) |
Disability Class by Sex by Age in West Hattiesburg
Disability Class: Hearing Difficulty
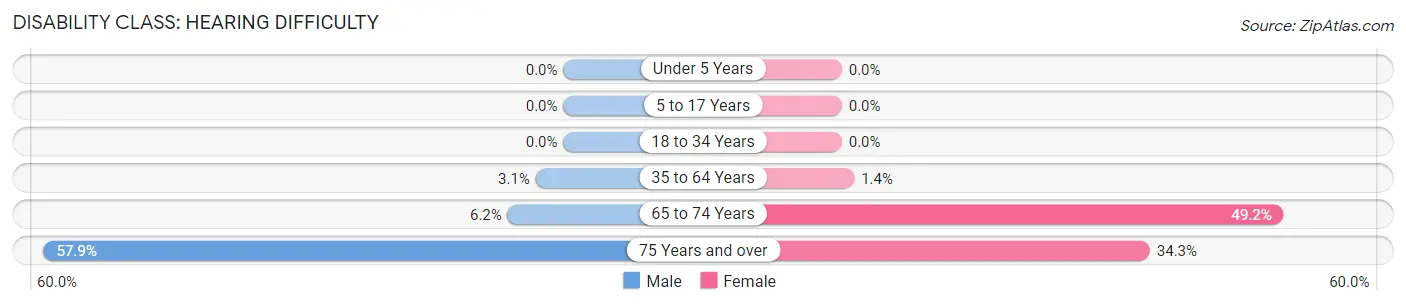
| Age Bracket | Male | Female |
| Under 5 Years | 0 (0.0%) | 0 (0.0%) |
| 5 to 17 Years | 0 (0.0%) | 0 (0.0%) |
| 18 to 34 Years | 0 (0.0%) | 0 (0.0%) |
| 35 to 64 Years | 31 (3.1%) | 14 (1.4%) |
| 65 to 74 Years | 9 (6.2%) | 154 (49.2%) |
| 75 Years and over | 33 (57.9%) | 35 (34.3%) |
Disability Class: Vision Difficulty
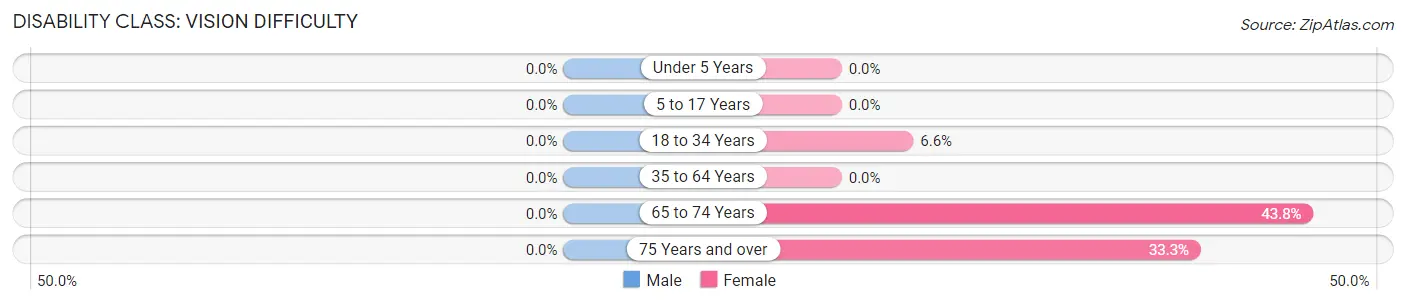
| Age Bracket | Male | Female |
| Under 5 Years | 0 (0.0%) | 0 (0.0%) |
| 5 to 17 Years | 0 (0.0%) | 0 (0.0%) |
| 18 to 34 Years | 0 (0.0%) | 58 (6.6%) |
| 35 to 64 Years | 0 (0.0%) | 0 (0.0%) |
| 65 to 74 Years | 0 (0.0%) | 137 (43.8%) |
| 75 Years and over | 0 (0.0%) | 34 (33.3%) |
Disability Class: Cognitive Difficulty
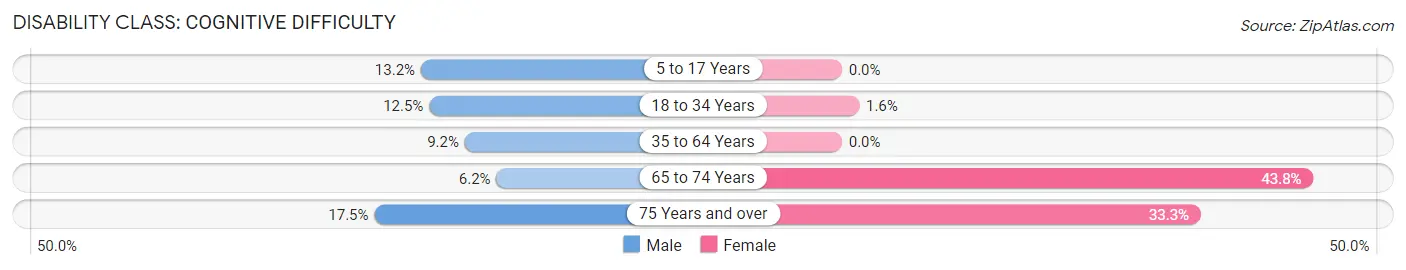
| Age Bracket | Male | Female |
| 5 to 17 Years | 73 (13.2%) | 0 (0.0%) |
| 18 to 34 Years | 68 (12.4%) | 14 (1.6%) |
| 35 to 64 Years | 92 (9.1%) | 0 (0.0%) |
| 65 to 74 Years | 9 (6.2%) | 137 (43.8%) |
| 75 Years and over | 10 (17.5%) | 34 (33.3%) |
Disability Class: Ambulatory Difficulty
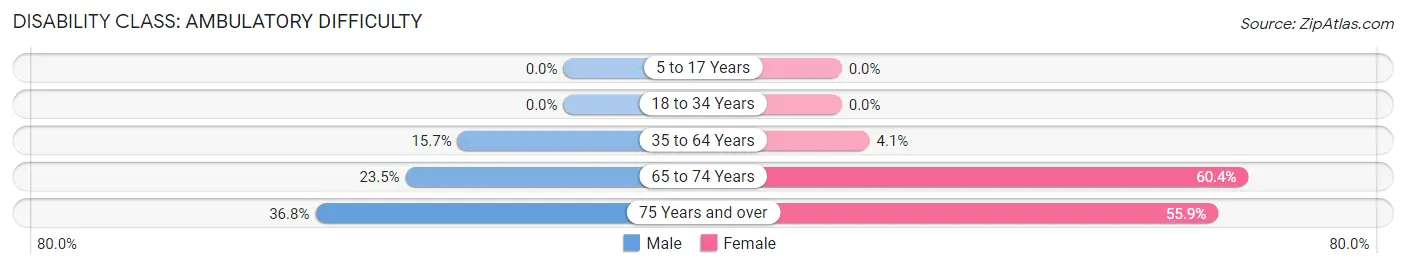
| Age Bracket | Male | Female |
| 5 to 17 Years | 0 (0.0%) | 0 (0.0%) |
| 18 to 34 Years | 0 (0.0%) | 0 (0.0%) |
| 35 to 64 Years | 158 (15.7%) | 42 (4.1%) |
| 65 to 74 Years | 34 (23.4%) | 189 (60.4%) |
| 75 Years and over | 21 (36.8%) | 57 (55.9%) |
Disability Class: Self-Care Difficulty
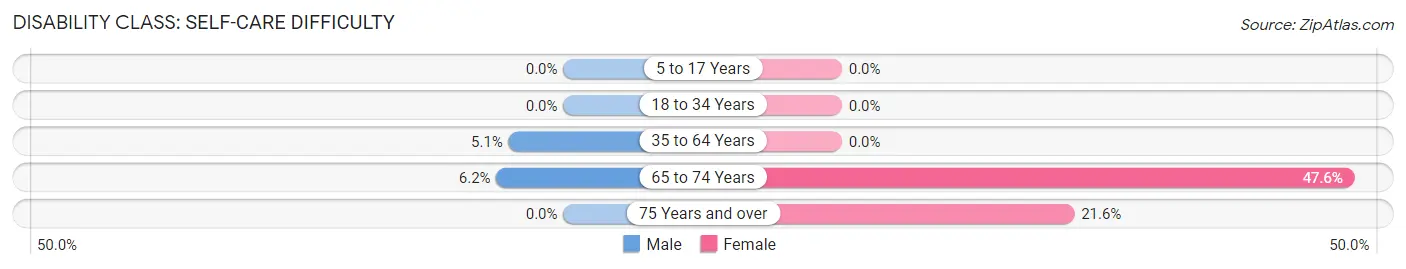
| Age Bracket | Male | Female |
| 5 to 17 Years | 0 (0.0%) | 0 (0.0%) |
| 18 to 34 Years | 0 (0.0%) | 0 (0.0%) |
| 35 to 64 Years | 51 (5.1%) | 0 (0.0%) |
| 65 to 74 Years | 9 (6.2%) | 149 (47.6%) |
| 75 Years and over | 0 (0.0%) | 22 (21.6%) |
Technology Access in West Hattiesburg
Computing Device Access in West Hattiesburg
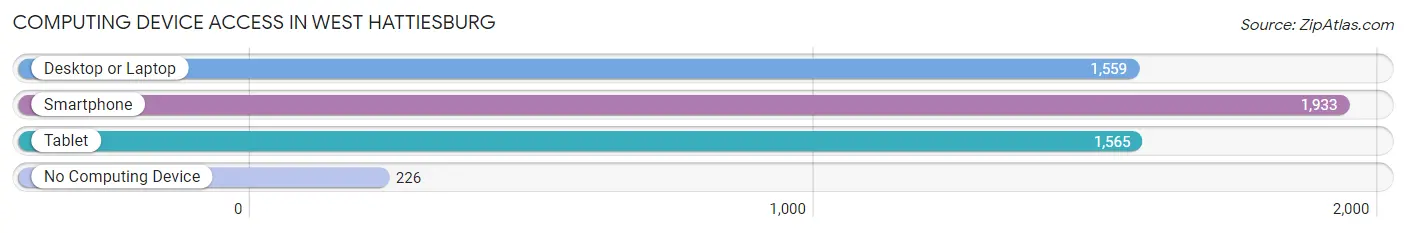
| Device Type | # Households | % Households |
| Desktop or Laptop | 1,559 | 69.7% |
| Smartphone | 1,933 | 86.4% |
| Tablet | 1,565 | 69.9% |
| No Computing Device | 226 | 10.1% |
| Total | 2,238 | 100.0% |
Internet Access in West Hattiesburg
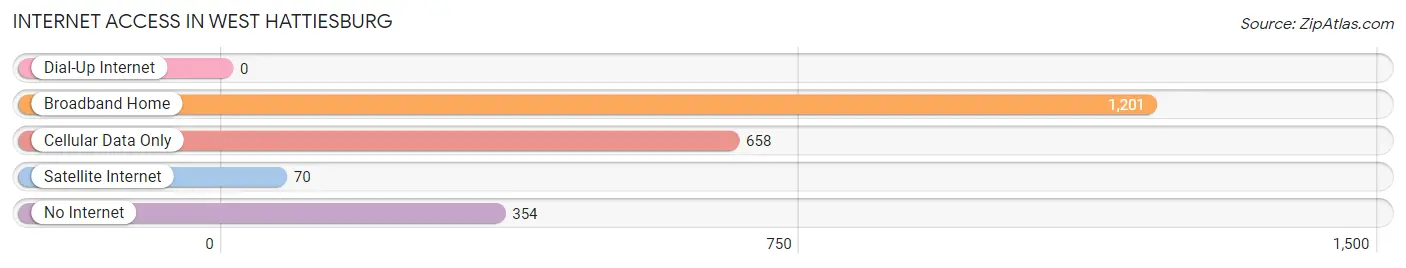
| Internet Type | # Households | % Households |
| Dial-Up Internet | 0 | 0.0% |
| Broadband Home | 1,201 | 53.7% |
| Cellular Data Only | 658 | 29.4% |
| Satellite Internet | 70 | 3.1% |
| No Internet | 354 | 15.8% |
| Total | 2,238 | 100.0% |
West Hattiesburg Summary
Hattiesburg, Mississippi is a city located in Forrest County, in the southern part of the state. It is the county seat and the largest city in the county. The city is located approximately 80 miles north of the Gulf of Mexico and is part of the Gulfport-Biloxi-Pascagoula metropolitan area. The city is home to the University of Southern Mississippi and William Carey University.
History
Hattiesburg was founded in 1882 by William H. Hardy, a lumberman from New Orleans. The city was named after Hardy's wife, Hattie. The city was incorporated in 1884 and was the first city in Forrest County. The city quickly grew and by the early 1900s, it was the largest city in the county.
In the early 1900s, Hattiesburg was a major center for the lumber industry. The city was also home to several large sawmills and other wood-related industries. The city was also home to several large cotton mills.
In the 1920s, the city began to diversify its economy. The city was home to several large manufacturing plants, including a paper mill, a canning factory, and a furniture factory. The city also became a major center for the oil and gas industry.
In the 1950s, the city began to experience a population boom. The city's population grew from around 10,000 in 1950 to over 30,000 in 1960. The city's economy also diversified, with the addition of several new industries, including a chemical plant, a tire plant, and a steel mill.
Geography
Hattiesburg is located in the southern part of Mississippi, in Forrest County. The city is located approximately 80 miles north of the Gulf of Mexico and is part of the Gulfport-Biloxi-Pascagoula metropolitan area. The city is located at the intersection of Interstate 59 and U.S. Highway 49.
The city is located in a hilly region of the state, with an elevation of around 300 feet. The city is located in a humid subtropical climate zone, with hot, humid summers and mild winters. The average annual temperature is around 70 degrees Fahrenheit.
Economy
Hattiesburg's economy is largely based on the service industry. The city is home to several large hospitals, including Forrest General Hospital and Wesley Medical Center. The city is also home to several large retail stores, including Walmart, Target, and Lowe's.
The city is also home to several large manufacturing plants, including a paper mill, a canning factory, and a furniture factory. The city is also home to several large oil and gas companies, including Chevron and ExxonMobil.
The city is also home to several large educational institutions, including the University of Southern Mississippi and William Carey University. The city is also home to several large research and development centers, including the National Center for Physical Acoustics and the Institute for Marine Mammal Studies.
Demographics
As of the 2010 census, the population of Hattiesburg was 45,989. The city has a population density of 1,092 people per square mile. The racial makeup of the city is 57.3% White, 37.3% African American, 0.7% Native American, 1.3% Asian, 0.1% Pacific Islander, 1.2% from other races, and 2.3% from two or more races.
The median household income in the city is $33,945, and the median family income is $41,945. The per capita income in the city is $20,845. The poverty rate in the city is 28.3%.
Conclusion
Hattiesburg, Mississippi is a city located in Forrest County, in the southern part of the state. The city was founded in 1882 and has grown to become the largest city in the county. The city is home to several large hospitals, retail stores, manufacturing plants, and educational institutions. The city has a population of 45,989 and a median household income of $33,945. The city is part of the Gulfport-Biloxi-Pascagoula metropolitan area and is located in a humid subtropical climate zone.
Common Questions
What is Per Capita Income in West Hattiesburg?
Per Capita income in West Hattiesburg is $22,531.
What is the Median Family Income in West Hattiesburg?
Median Family Income in West Hattiesburg is $50,645.
What is the Median Household income in West Hattiesburg?
Median Household Income in West Hattiesburg is $41,181.
What is Income or Wage Gap in West Hattiesburg?
Income or Wage Gap in West Hattiesburg is 49.3%.
Women in West Hattiesburg earn 50.7 cents for every dollar earned by a man.
What is Inequality or Gini Index in West Hattiesburg?
Inequality or Gini Index in West Hattiesburg is 0.48.
What is the Total Population of West Hattiesburg?
Total Population of West Hattiesburg is 6,234.
What is the Total Male Population of West Hattiesburg?
Total Male Population of West Hattiesburg is 2,476.
What is the Total Female Population of West Hattiesburg?
Total Female Population of West Hattiesburg is 3,758.
What is the Ratio of Males per 100 Females in West Hattiesburg?
There are 65.89 Males per 100 Females in West Hattiesburg.
What is the Ratio of Females per 100 Males in West Hattiesburg?
There are 151.78 Females per 100 Males in West Hattiesburg.
What is the Median Population Age in West Hattiesburg?
Median Population Age in West Hattiesburg is 31.3 Years.
What is the Average Family Size in West Hattiesburg
Average Family Size in West Hattiesburg is 3.4 People.
What is the Average Household Size in West Hattiesburg
Average Household Size in West Hattiesburg is 2.8 People.
How Large is the Labor Force in West Hattiesburg?
There are 2,969 People in the Labor Forcein in West Hattiesburg.
What is the Percentage of People in the Labor Force in West Hattiesburg?
64.8% of People are in the Labor Force in West Hattiesburg.
What is the Unemployment Rate in West Hattiesburg?
Unemployment Rate in West Hattiesburg is 14.3%.