Bay Springs, MS Map & Demographics
Bay Springs Map
Bay Springs Overview
$26,481
PER CAPITA INCOME
$79,375
AVG FAMILY INCOME
$48,031
AVG HOUSEHOLD INCOME
12.9%
WAGE / INCOME GAP [ % ]
87.1¢/ $1
WAGE / INCOME GAP [ $ ]
0.46
INEQUALITY / GINI INDEX
1,789
TOTAL POPULATION
805
MALE POPULATION
984
FEMALE POPULATION
81.81
MALES / 100 FEMALES
122.24
FEMALES / 100 MALES
42.5
MEDIAN AGE
3.0
AVG FAMILY SIZE
2.2
AVG HOUSEHOLD SIZE
668
LABOR FORCE [ PEOPLE ]
46.8%
PERCENT IN LABOR FORCE
2.5%
UNEMPLOYMENT RATE
Bay Springs Zip Codes
Income in Bay Springs
Income Overview in Bay Springs
Per Capita Income in Bay Springs is $26,481, while median incomes of families and households are $79,375 and $48,031 respectively.
| Characteristic | Number | Measure |
| Per Capita Income | 1,789 | $26,481 |
| Median Family Income | 452 | $79,375 |
| Mean Family Income | 452 | $82,896 |
| Median Household Income | 761 | $48,031 |
| Mean Household Income | 761 | $61,075 |
| Income Deficit | 452 | $0 |
| Wage / Income Gap (%) | 1,789 | 12.86% |
| Wage / Income Gap ($) | 1,789 | 87.14¢ per $1 |
| Gini / Inequality Index | 1,789 | 0.46 |
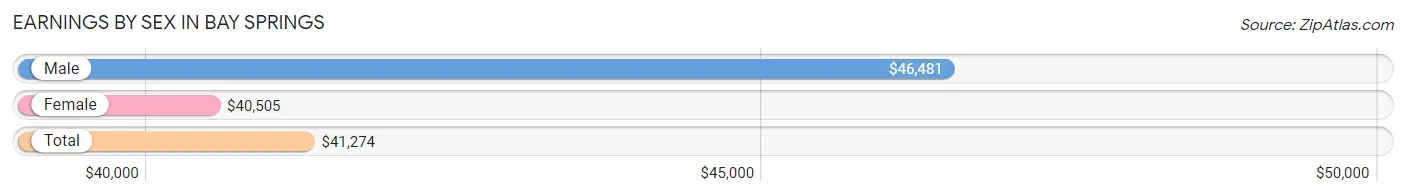
Earnings by Sex in Bay Springs
Average Earnings in Bay Springs are $41,274, $46,481 for men and $40,505 for women, a difference of 12.9%.
| Sex | Number | Average Earnings |
| Male | 274 (40.5%) | $46,481 |
| Female | 403 (59.5%) | $40,505 |
| Total | 677 (100.0%) | $41,274 |
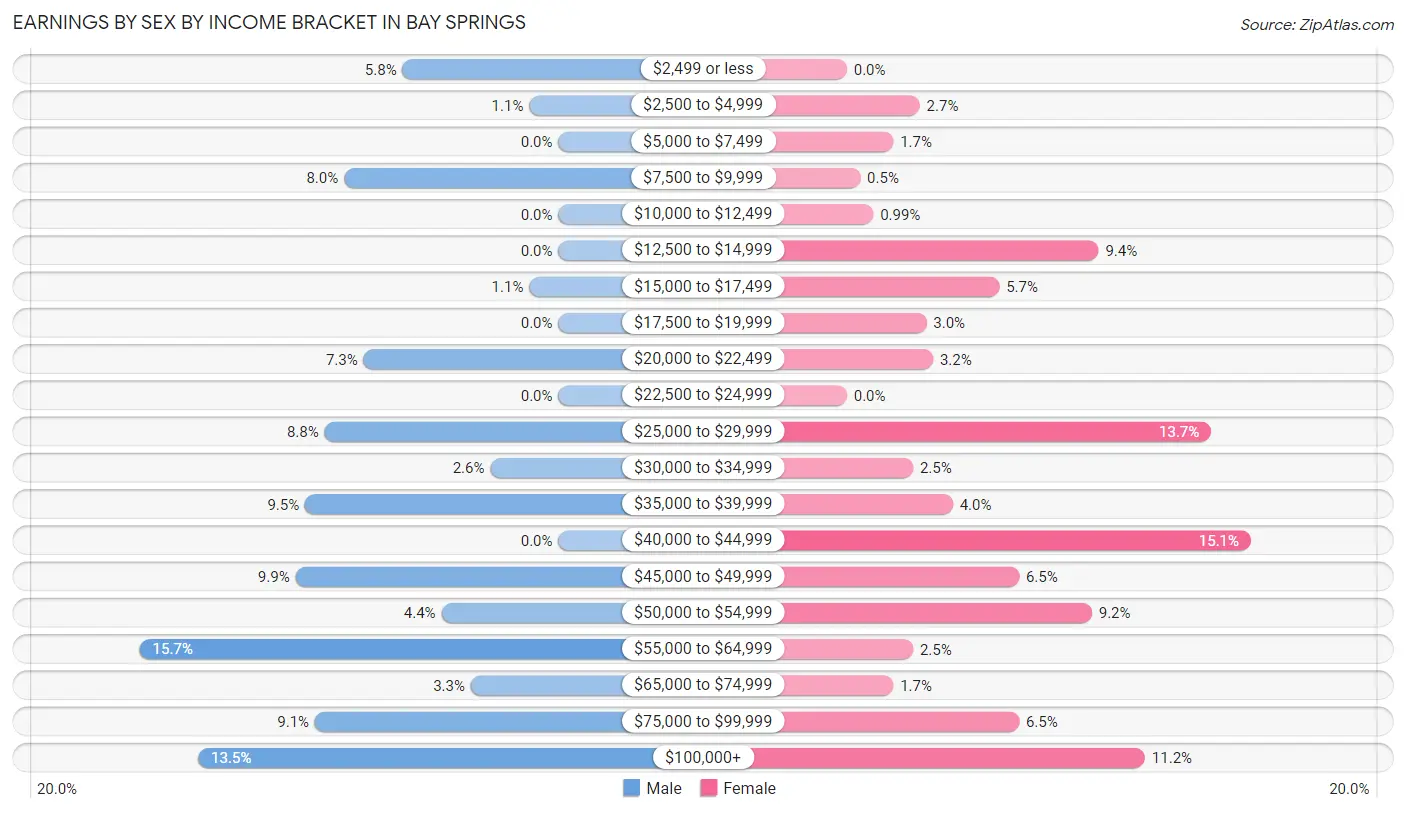
Earnings by Sex by Income Bracket in Bay Springs
The most common earnings brackets in Bay Springs are $55,000 to $64,999 for men (43 | 15.7%) and $40,000 to $44,999 for women (61 | 15.1%).
| Income | Male | Female |
| $2,499 or less | 16 (5.8%) | 0 (0.0%) |
| $2,500 to $4,999 | 3 (1.1%) | 11 (2.7%) |
| $5,000 to $7,499 | 0 (0.0%) | 7 (1.7%) |
| $7,500 to $9,999 | 22 (8.0%) | 2 (0.5%) |
| $10,000 to $12,499 | 0 (0.0%) | 4 (1.0%) |
| $12,500 to $14,999 | 0 (0.0%) | 38 (9.4%) |
| $15,000 to $17,499 | 3 (1.1%) | 23 (5.7%) |
| $17,500 to $19,999 | 0 (0.0%) | 12 (3.0%) |
| $20,000 to $22,499 | 20 (7.3%) | 13 (3.2%) |
| $22,500 to $24,999 | 0 (0.0%) | 0 (0.0%) |
| $25,000 to $29,999 | 24 (8.8%) | 55 (13.7%) |
| $30,000 to $34,999 | 7 (2.5%) | 10 (2.5%) |
| $35,000 to $39,999 | 26 (9.5%) | 16 (4.0%) |
| $40,000 to $44,999 | 0 (0.0%) | 61 (15.1%) |
| $45,000 to $49,999 | 27 (9.9%) | 26 (6.5%) |
| $50,000 to $54,999 | 12 (4.4%) | 37 (9.2%) |
| $55,000 to $64,999 | 43 (15.7%) | 10 (2.5%) |
| $65,000 to $74,999 | 9 (3.3%) | 7 (1.7%) |
| $75,000 to $99,999 | 25 (9.1%) | 26 (6.5%) |
| $100,000+ | 37 (13.5%) | 45 (11.2%) |
| Total | 274 (100.0%) | 403 (100.0%) |
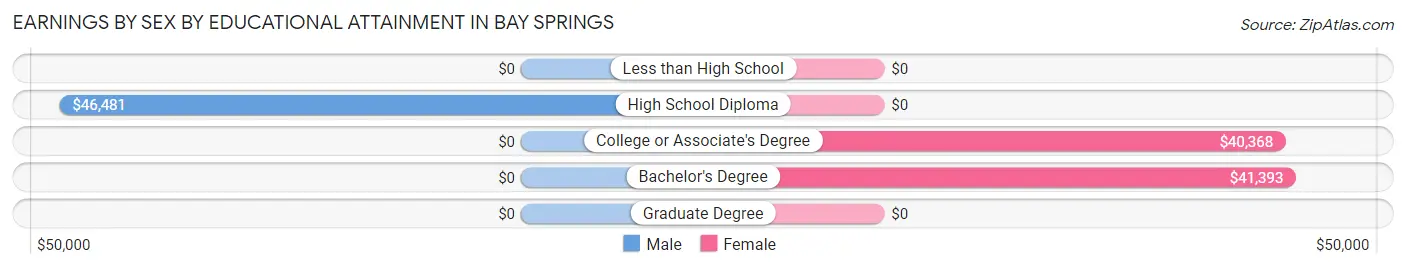
Earnings by Sex by Educational Attainment in Bay Springs
Average earnings in Bay Springs are $47,361 for men and $40,505 for women, a difference of 14.5%. Men with an educational attainment of high school diploma enjoy the highest average annual earnings of $46,481, while those with high school diploma education earn the least with $46,481. Women with an educational attainment of bachelor's degree earn the most with the average annual earnings of $41,393, while those with college or associate's degree education have the smallest earnings of $40,368.
| Educational Attainment | Male Income | Female Income |
| Less than High School | - | - |
| High School Diploma | $46,481 | $0 |
| College or Associate's Degree | - | - |
| Bachelor's Degree | - | - |
| Graduate Degree | - | - |
| Total | $47,361 | $40,505 |
Family Income in Bay Springs
Family Income Brackets in Bay Springs
According to the Bay Springs family income data, there are 104 families falling into the $75,000 to $99,999 income range, which is the most common income bracket and makes up 23.0% of all families. Conversely, the less than $10,000 income bracket is the least frequent group with only 5 families (1.1%) belonging to this category.
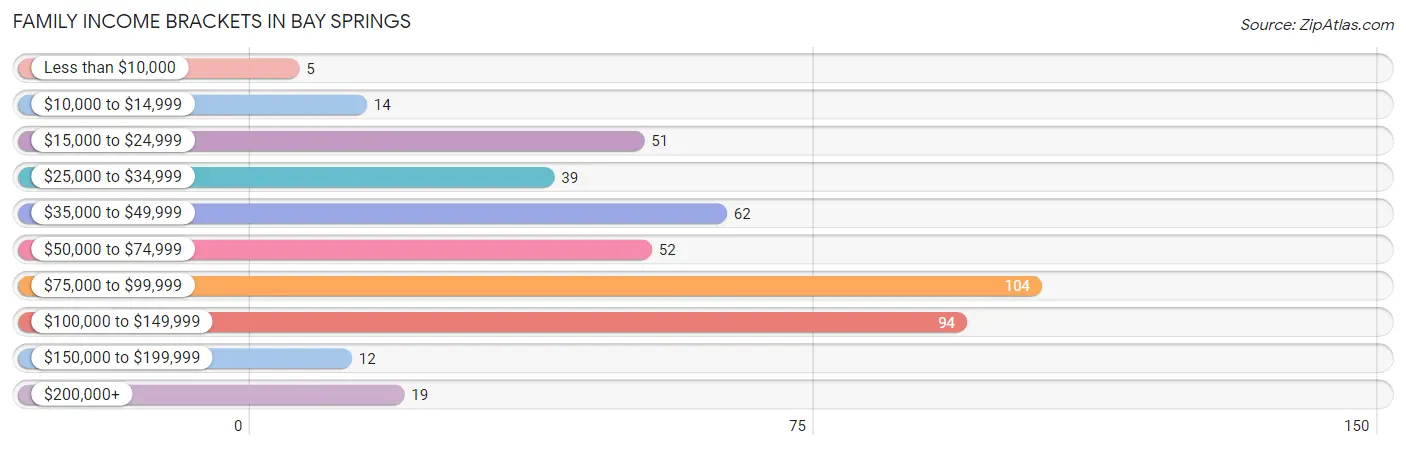
| Income Bracket | # Families | % Families |
| Less than $10,000 | 5 | 1.1% |
| $10,000 to $14,999 | 14 | 3.1% |
| $15,000 to $24,999 | 51 | 11.3% |
| $25,000 to $34,999 | 39 | 8.6% |
| $35,000 to $49,999 | 62 | 13.7% |
| $50,000 to $74,999 | 52 | 11.5% |
| $75,000 to $99,999 | 104 | 23.0% |
| $100,000 to $149,999 | 94 | 20.8% |
| $150,000 to $199,999 | 12 | 2.7% |
| $200,000+ | 19 | 4.2% |
Family Income by Famaliy Size in Bay Springs
4-person families (70 | 15.5%) account for the highest median family income in Bay Springs with $93,333 per family, while 3-person families (133 | 29.4%) have the highest median income of $27,708 per family member.
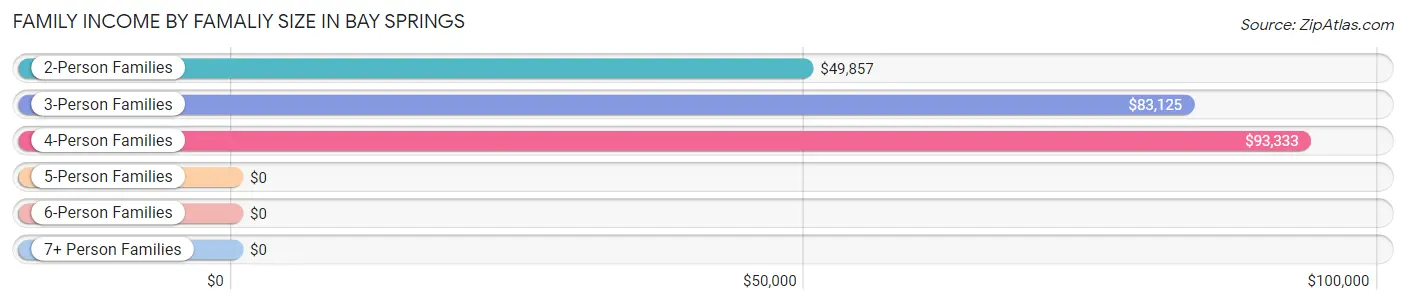
| Income Bracket | # Families | Median Income |
| 2-Person Families | 218 (48.2%) | $49,857 |
| 3-Person Families | 133 (29.4%) | $83,125 |
| 4-Person Families | 70 (15.5%) | $93,333 |
| 5-Person Families | 14 (3.1%) | $0 |
| 6-Person Families | 10 (2.2%) | $0 |
| 7+ Person Families | 7 (1.5%) | $0 |
| Total | 452 (100.0%) | $79,375 |
Family Income by Number of Earners in Bay Springs
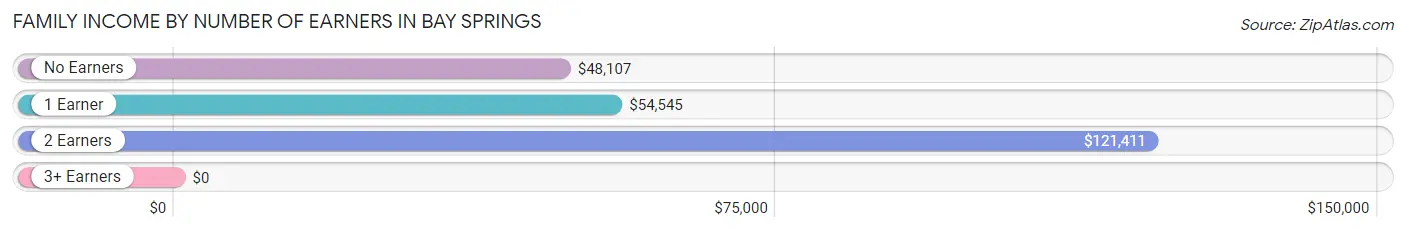
| Number of Earners | # Families | Median Income |
| No Earners | 91 (20.1%) | $48,107 |
| 1 Earner | 210 (46.5%) | $54,545 |
| 2 Earners | 149 (33.0%) | $121,411 |
| 3+ Earners | 2 (0.4%) | $0 |
| Total | 452 (100.0%) | $79,375 |
Household Income in Bay Springs
Household Income Brackets in Bay Springs
With 109 households falling in the category, the $75,000 to $99,999 income range is the most frequent in Bay Springs, accounting for 14.3% of all households. In contrast, only 12 households (1.6%) fall into the $150,000 to $199,999 income bracket, making it the least populous group.
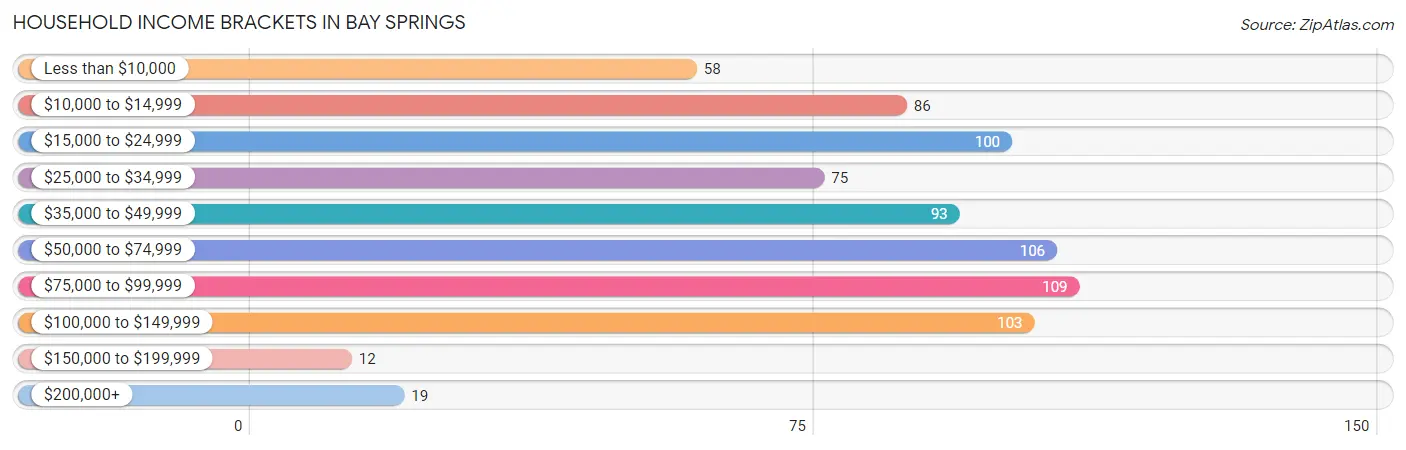
| Income Bracket | # Households | % Households |
| Less than $10,000 | 58 | 7.6% |
| $10,000 to $14,999 | 86 | 11.3% |
| $15,000 to $24,999 | 100 | 13.1% |
| $25,000 to $34,999 | 75 | 9.9% |
| $35,000 to $49,999 | 93 | 12.2% |
| $50,000 to $74,999 | 106 | 13.9% |
| $75,000 to $99,999 | 109 | 14.3% |
| $100,000 to $149,999 | 103 | 13.5% |
| $150,000 to $199,999 | 12 | 1.6% |
| $200,000+ | 19 | 2.5% |
Household Income by Householder Age in Bay Springs
The median household income in Bay Springs is $48,031, with the highest median household income of $62,500 found in the 45 to 64 years age bracket for the primary householder. A total of 282 households (37.1%) fall into this category. Meanwhile, the 15 to 24 years age bracket for the primary householder has the lowest median household income of $0, with 17 households (2.2%) in this group.
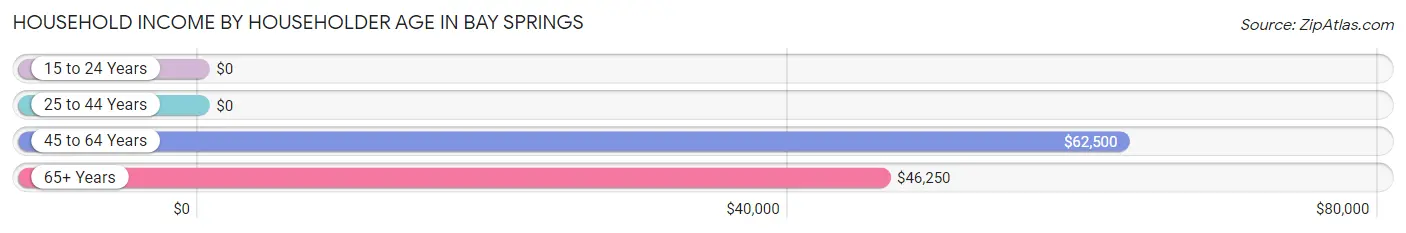
| Income Bracket | # Households | Median Income |
| 15 to 24 Years | 17 (2.2%) | $0 |
| 25 to 44 Years | 228 (30.0%) | $0 |
| 45 to 64 Years | 282 (37.1%) | $62,500 |
| 65+ Years | 234 (30.7%) | $46,250 |
| Total | 761 (100.0%) | $48,031 |
Poverty in Bay Springs
Income Below Poverty by Sex and Age in Bay Springs
With 20.7% poverty level for males and 32.2% for females among the residents of Bay Springs, 16 and 17 year old males and under 5 year old females are the most vulnerable to poverty, with 7 males (70.0%) and 55 females (94.8%) in their respective age groups living below the poverty level.
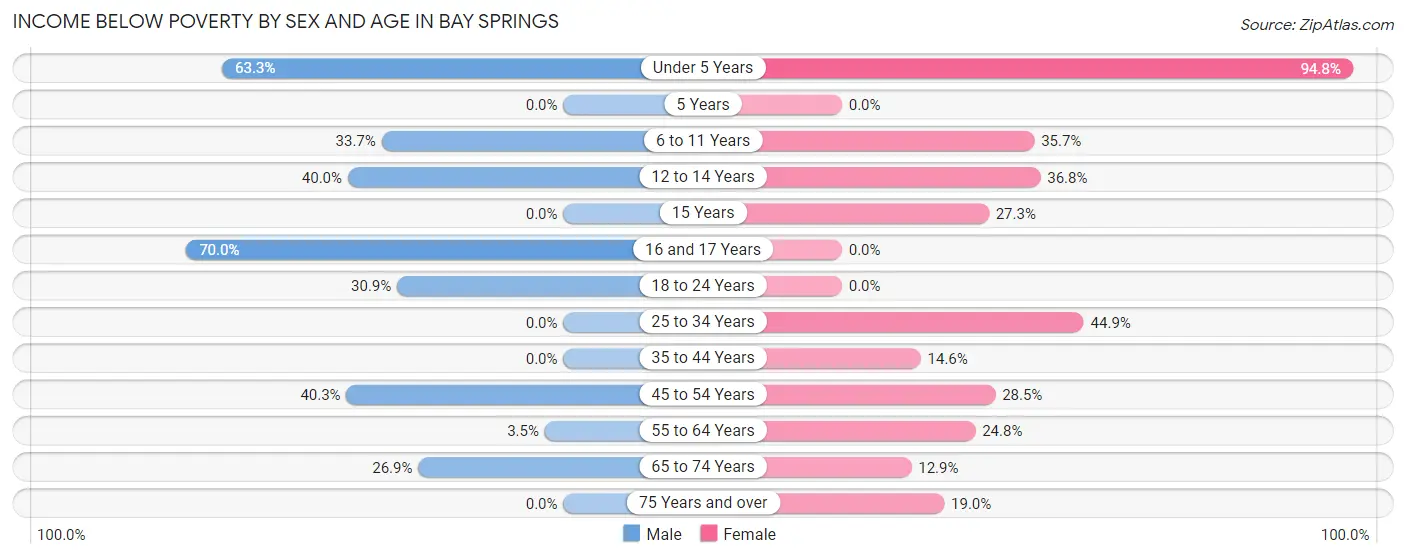
| Age Bracket | Male | Female |
| Under 5 Years | 19 (63.3%) | 55 (94.8%) |
| 5 Years | 0 (0.0%) | 0 (0.0%) |
| 6 to 11 Years | 28 (33.7%) | 15 (35.7%) |
| 12 to 14 Years | 28 (40.0%) | 21 (36.8%) |
| 15 Years | 0 (0.0%) | 3 (27.3%) |
| 16 and 17 Years | 7 (70.0%) | 0 (0.0%) |
| 18 to 24 Years | 25 (30.9%) | 0 (0.0%) |
| 25 to 34 Years | 0 (0.0%) | 101 (44.9%) |
| 35 to 44 Years | 0 (0.0%) | 12 (14.6%) |
| 45 to 54 Years | 31 (40.3%) | 41 (28.5%) |
| 55 to 64 Years | 5 (3.5%) | 27 (24.8%) |
| 65 to 74 Years | 14 (26.9%) | 8 (12.9%) |
| 75 Years and over | 0 (0.0%) | 30 (19.0%) |
| Total | 157 (20.7%) | 313 (32.2%) |
Income Above Poverty by Sex and Age in Bay Springs
According to the poverty statistics in Bay Springs, males aged 25 to 34 years and females aged 5 years are the age groups that are most secure financially, with 100.0% of males and 100.0% of females in these age groups living above the poverty line.
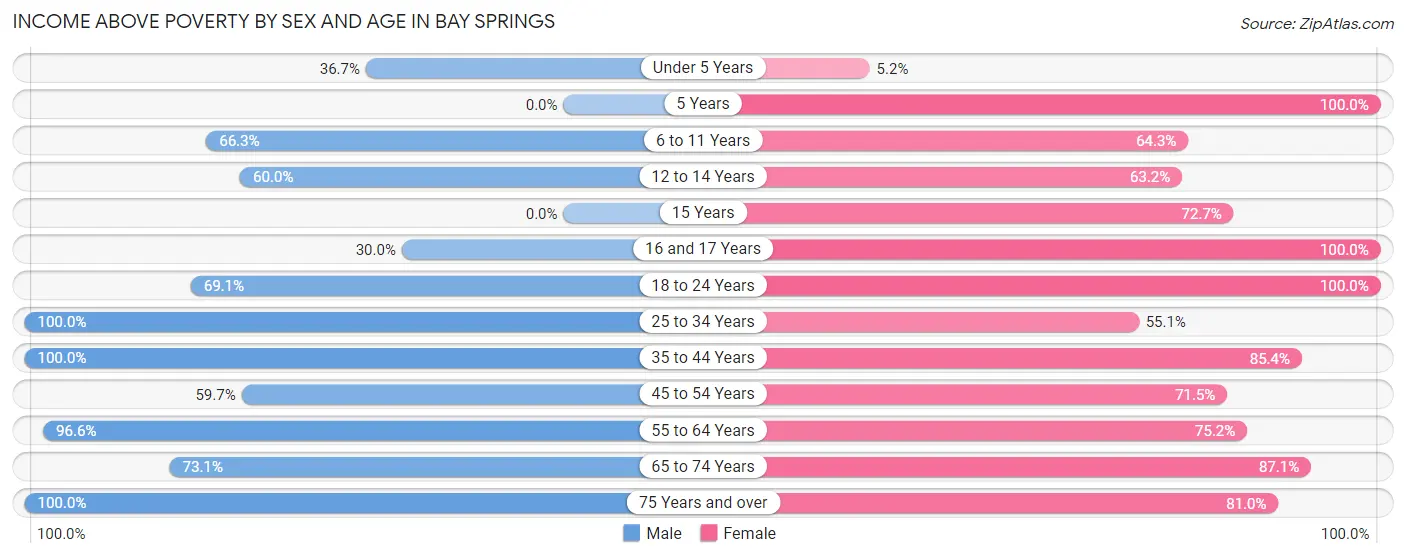
| Age Bracket | Male | Female |
| Under 5 Years | 11 (36.7%) | 3 (5.2%) |
| 5 Years | 0 (0.0%) | 4 (100.0%) |
| 6 to 11 Years | 55 (66.3%) | 27 (64.3%) |
| 12 to 14 Years | 42 (60.0%) | 36 (63.2%) |
| 15 Years | 0 (0.0%) | 8 (72.7%) |
| 16 and 17 Years | 3 (30.0%) | 14 (100.0%) |
| 18 to 24 Years | 56 (69.1%) | 6 (100.0%) |
| 25 to 34 Years | 58 (100.0%) | 124 (55.1%) |
| 35 to 44 Years | 63 (100.0%) | 70 (85.4%) |
| 45 to 54 Years | 46 (59.7%) | 103 (71.5%) |
| 55 to 64 Years | 140 (96.6%) | 82 (75.2%) |
| 65 to 74 Years | 38 (73.1%) | 54 (87.1%) |
| 75 Years and over | 88 (100.0%) | 128 (81.0%) |
| Total | 600 (79.3%) | 659 (67.8%) |
Income Below Poverty Among Married-Couple Families in Bay Springs
The poverty statistics for married-couple families in Bay Springs show that 3.5% or 8 of the total 229 families live below the poverty line. Families with 3 or 4 children have the highest poverty rate of 57.1%, comprising of 8 families. On the other hand, families with no children have the lowest poverty rate of 0.0%, which includes 0 families.
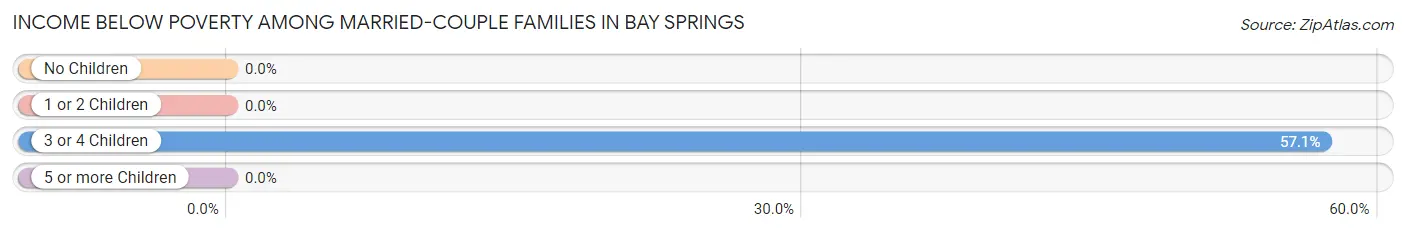
| Children | Above Poverty | Below Poverty |
| No Children | 148 (100.0%) | 0 (0.0%) |
| 1 or 2 Children | 67 (100.0%) | 0 (0.0%) |
| 3 or 4 Children | 6 (42.9%) | 8 (57.1%) |
| 5 or more Children | 0 (0.0%) | 0 (0.0%) |
| Total | 221 (96.5%) | 8 (3.5%) |
Income Below Poverty Among Single-Parent Households in Bay Springs
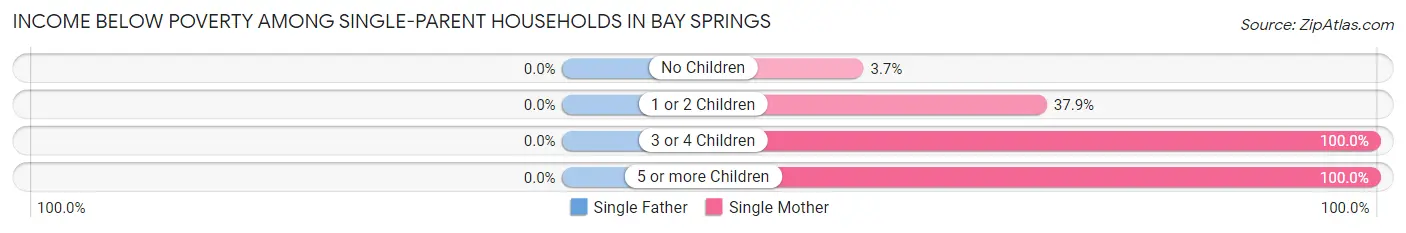
| Children | Single Father | Single Mother |
| No Children | 0 (0.0%) | 2 (3.7%) |
| 1 or 2 Children | 0 (0.0%) | 53 (37.9%) |
| 3 or 4 Children | 0 (0.0%) | 14 (100.0%) |
| 5 or more Children | 0 (0.0%) | 5 (100.0%) |
| Total | 0 (0.0%) | 74 (34.7%) |
Income Below Poverty Among Married-Couple vs Single-Parent Households in Bay Springs
The poverty data for Bay Springs shows that 8 of the married-couple family households (3.5%) and 74 of the single-parent households (33.2%) are living below the poverty level. Within the married-couple family households, those with 3 or 4 children have the highest poverty rate, with 8 households (57.1%) falling below the poverty line. Among the single-parent households, those with 3 or 4 children have the highest poverty rate, with 14 household (100.0%) living below poverty.
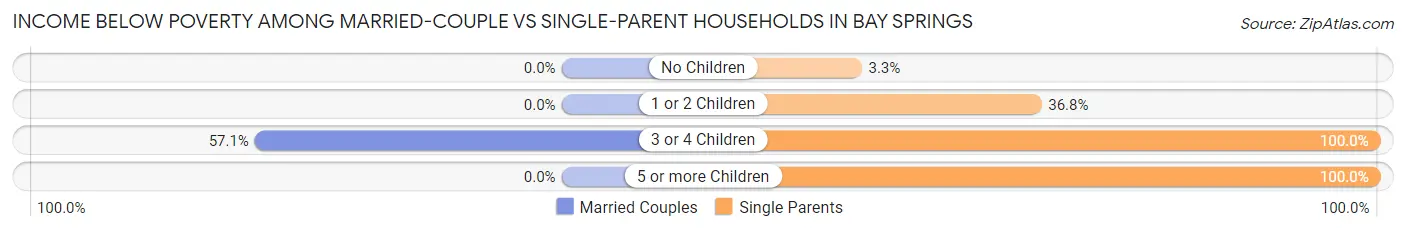
| Children | Married-Couple Families | Single-Parent Households |
| No Children | 0 (0.0%) | 2 (3.3%) |
| 1 or 2 Children | 0 (0.0%) | 53 (36.8%) |
| 3 or 4 Children | 8 (57.1%) | 14 (100.0%) |
| 5 or more Children | 0 (0.0%) | 5 (100.0%) |
| Total | 8 (3.5%) | 74 (33.2%) |
Race in Bay Springs
The most populous races in Bay Springs are Black / African American (1,032 | 57.7%), White / Caucasian (752 | 42.0%), and Two or more Races (5 | 0.3%).
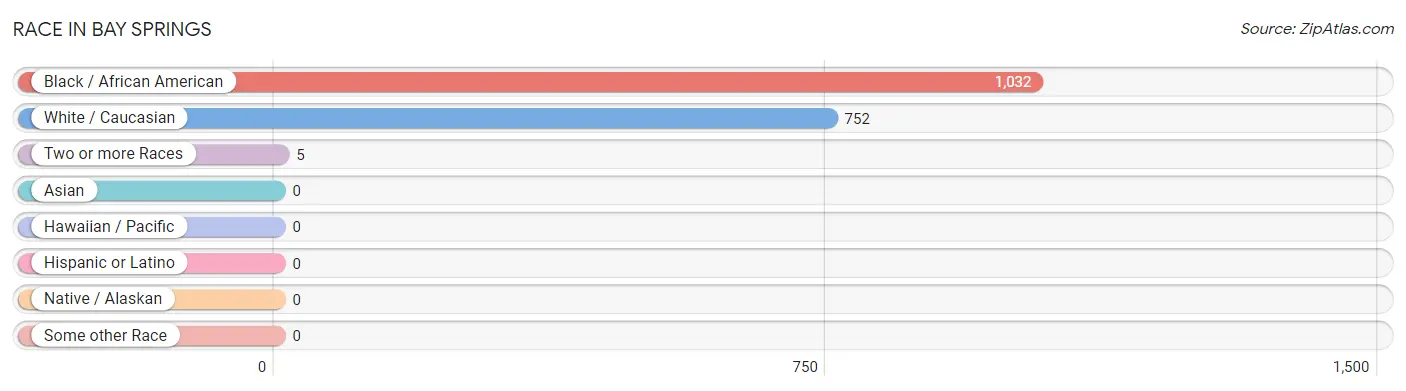
| Race | # Population | % Population |
| Asian | 0 | 0.0% |
| Black / African American | 1,032 | 57.7% |
| Hawaiian / Pacific | 0 | 0.0% |
| Hispanic or Latino | 0 | 0.0% |
| Native / Alaskan | 0 | 0.0% |
| White / Caucasian | 752 | 42.0% |
| Two or more Races | 5 | 0.3% |
| Some other Race | 0 | 0.0% |
| Total | 1,789 | 100.0% |
Ancestry in Bay Springs
The most populous ancestries reported in Bay Springs are American (1,048 | 58.6%), English (34 | 1.9%), Irish (27 | 1.5%), German (16 | 0.9%), and French (9 | 0.5%), together accounting for 63.4% of all Bay Springs residents.
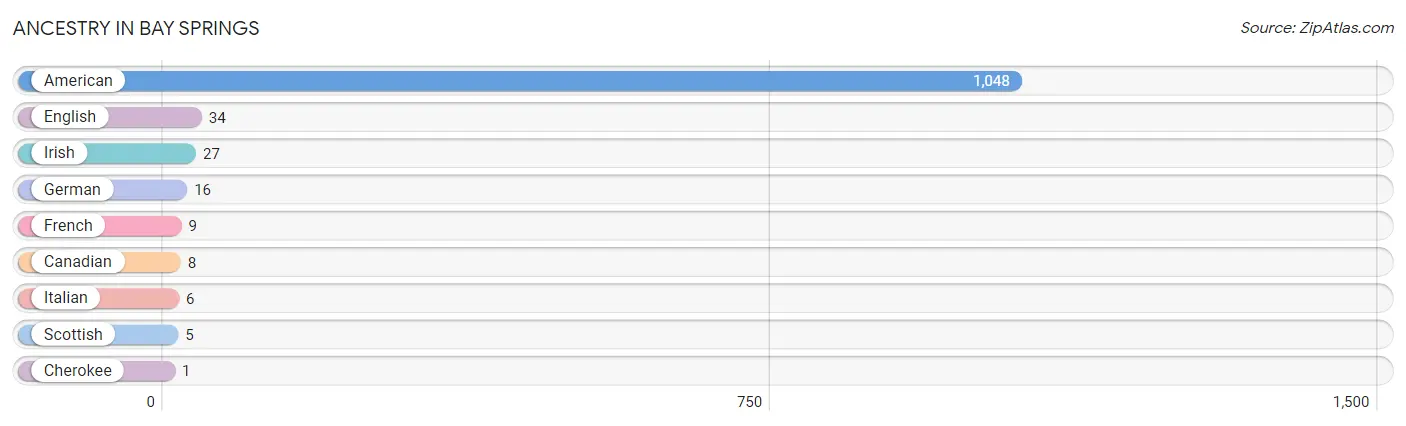
| Ancestry | # Population | % Population |
| American | 1,048 | 58.6% |
| Canadian | 8 | 0.4% |
| Cherokee | 1 | 0.1% |
| English | 34 | 1.9% |
| French | 9 | 0.5% |
| German | 16 | 0.9% |
| Irish | 27 | 1.5% |
| Italian | 6 | 0.3% |
| Scottish | 5 | 0.3% | View All 9 Rows |
Immigrants in Bay Springs
The most numerous immigrant groups reported in Bay Springs came from Canada (8 | 0.4%), Africa (4 | 0.2%), Eastern Africa (4 | 0.2%), Ethiopia (4 | 0.2%), and Europe (3 | 0.2%), together accounting for 1.3% of all Bay Springs residents.
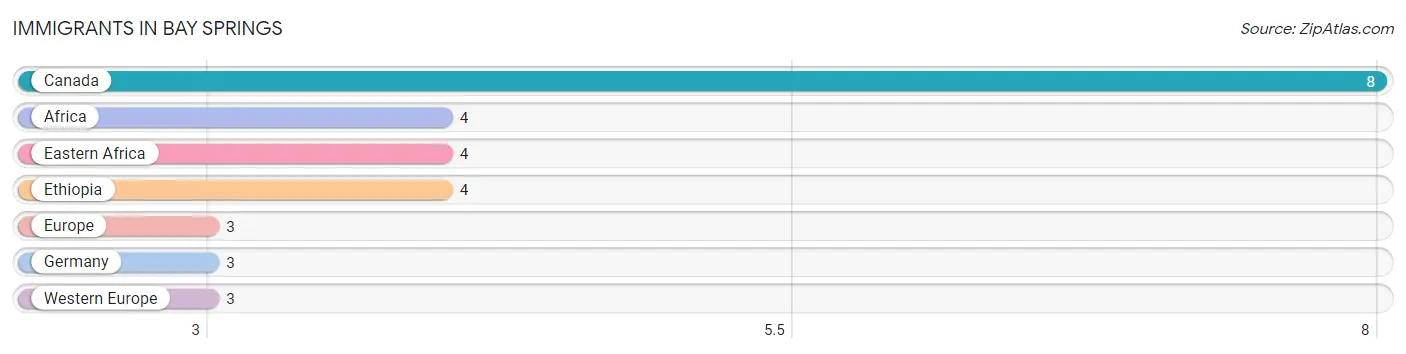
| Immigration Origin | # Population | % Population |
| Africa | 4 | 0.2% |
| Canada | 8 | 0.4% |
| Eastern Africa | 4 | 0.2% |
| Ethiopia | 4 | 0.2% |
| Europe | 3 | 0.2% |
| Germany | 3 | 0.2% |
| Western Europe | 3 | 0.2% | View All 7 Rows |
Sex and Age in Bay Springs
Sex and Age in Bay Springs
The most populous age groups in Bay Springs are 60 to 64 Years (88 | 10.9%) for men and 25 to 29 Years (149 | 15.1%) for women.
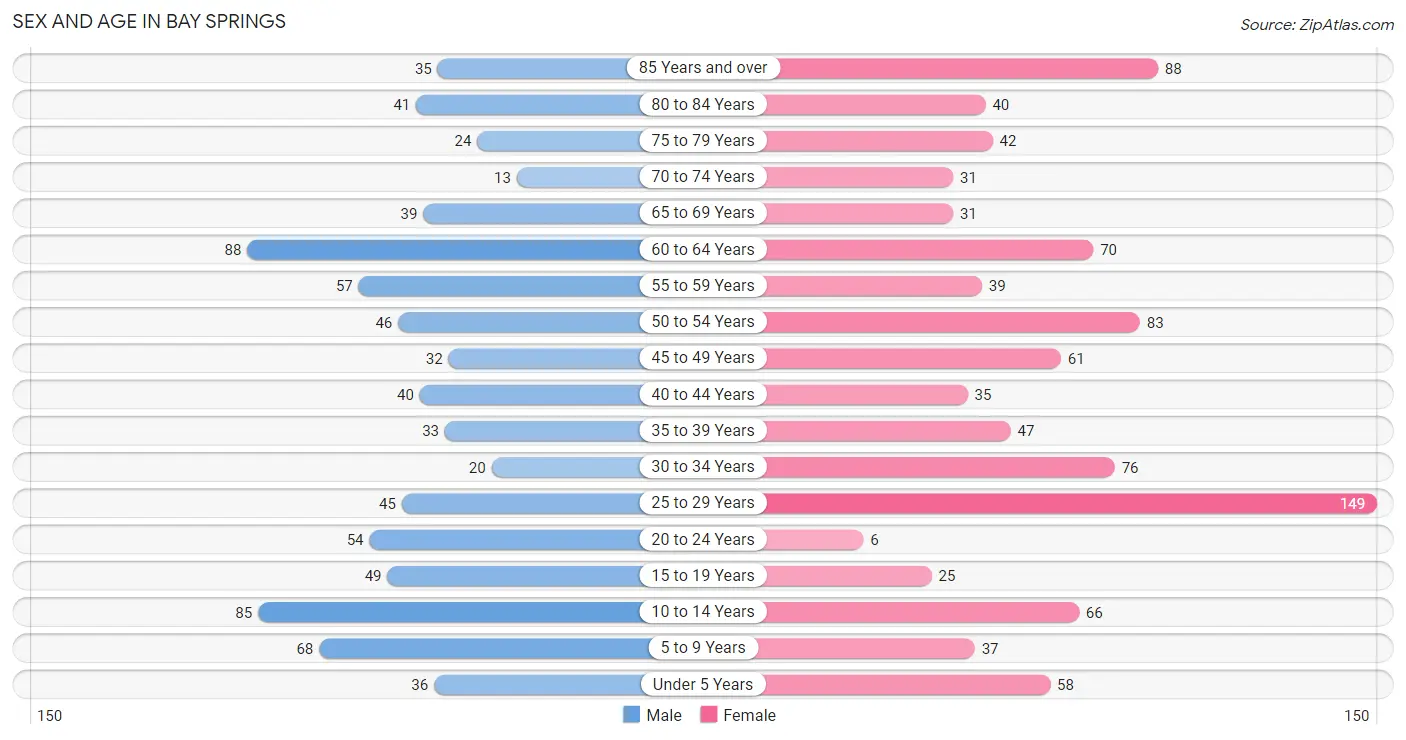
| Age Bracket | Male | Female |
| Under 5 Years | 36 (4.5%) | 58 (5.9%) |
| 5 to 9 Years | 68 (8.5%) | 37 (3.8%) |
| 10 to 14 Years | 85 (10.6%) | 66 (6.7%) |
| 15 to 19 Years | 49 (6.1%) | 25 (2.5%) |
| 20 to 24 Years | 54 (6.7%) | 6 (0.6%) |
| 25 to 29 Years | 45 (5.6%) | 149 (15.1%) |
| 30 to 34 Years | 20 (2.5%) | 76 (7.7%) |
| 35 to 39 Years | 33 (4.1%) | 47 (4.8%) |
| 40 to 44 Years | 40 (5.0%) | 35 (3.6%) |
| 45 to 49 Years | 32 (4.0%) | 61 (6.2%) |
| 50 to 54 Years | 46 (5.7%) | 83 (8.4%) |
| 55 to 59 Years | 57 (7.1%) | 39 (4.0%) |
| 60 to 64 Years | 88 (10.9%) | 70 (7.1%) |
| 65 to 69 Years | 39 (4.8%) | 31 (3.2%) |
| 70 to 74 Years | 13 (1.6%) | 31 (3.2%) |
| 75 to 79 Years | 24 (3.0%) | 42 (4.3%) |
| 80 to 84 Years | 41 (5.1%) | 40 (4.1%) |
| 85 Years and over | 35 (4.3%) | 88 (8.9%) |
| Total | 805 (100.0%) | 984 (100.0%) |
Families and Households in Bay Springs
Median Family Size in Bay Springs
The median family size in Bay Springs is 2.96 persons per family, with single male/father families (10 | 2.2%) accounting for the largest median family size of 9.4 persons per family. On the other hand, married-couple families (229 | 50.7%) represent the smallest median family size with 2.50 persons per family.
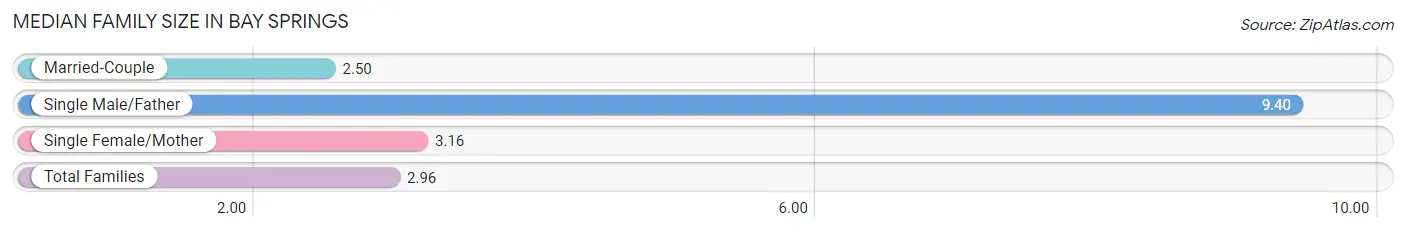
| Family Type | # Families | Family Size |
| Married-Couple | 229 (50.7%) | 2.50 |
| Single Male/Father | 10 (2.2%) | 9.40 |
| Single Female/Mother | 213 (47.1%) | 3.16 |
| Total Families | 452 (100.0%) | 2.96 |
Median Household Size in Bay Springs
The median household size in Bay Springs is 2.25 persons per household, with single male/father households (10 | 1.3%) accounting for the largest median household size of 10.4 persons per household. non-family households (309 | 40.6%) represent the smallest median household size with 1.16 persons per household.
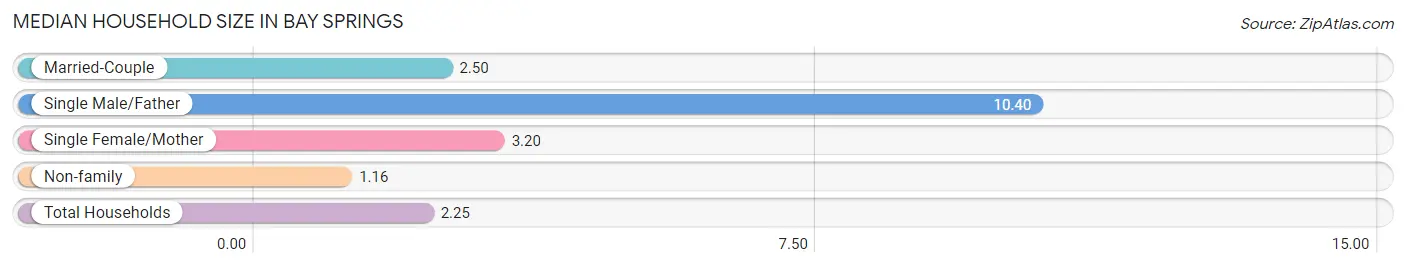
| Household Type | # Households | Household Size |
| Married-Couple | 229 (30.1%) | 2.50 |
| Single Male/Father | 10 (1.3%) | 10.40 |
| Single Female/Mother | 213 (28.0%) | 3.20 |
| Non-family | 309 (40.6%) | 1.16 |
| Total Households | 761 (100.0%) | 2.25 |
Household Size by Marriage Status in Bay Springs
Out of a total of 761 households in Bay Springs, 452 (59.4%) are family households, while 309 (40.6%) are nonfamily households. The most numerous type of family households are 2-person households, comprising 216, and the most common type of nonfamily households are 1-person households, comprising 273.
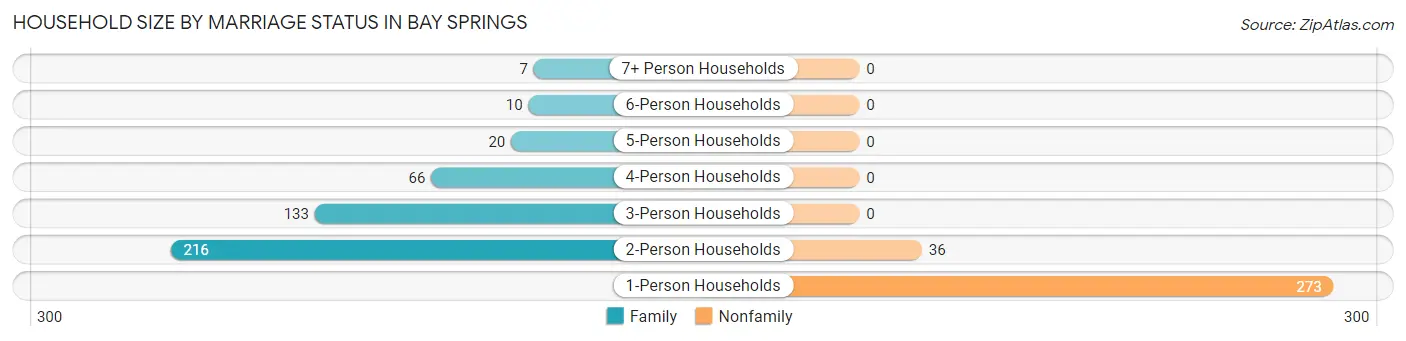
| Household Size | Family Households | Nonfamily Households |
| 1-Person Households | - | 273 (35.9%) |
| 2-Person Households | 216 (28.4%) | 36 (4.7%) |
| 3-Person Households | 133 (17.5%) | 0 (0.0%) |
| 4-Person Households | 66 (8.7%) | 0 (0.0%) |
| 5-Person Households | 20 (2.6%) | 0 (0.0%) |
| 6-Person Households | 10 (1.3%) | 0 (0.0%) |
| 7+ Person Households | 7 (0.9%) | 0 (0.0%) |
| Total | 452 (59.4%) | 309 (40.6%) |
Female Fertility in Bay Springs
Fertility by Age in Bay Springs
Average fertility rate in Bay Springs is 137.0 births per 1,000 women. Women in the age bracket of 20 to 34 years have the highest fertility rate with 160.0 births per 1,000 women. Women in the age bracket of 20 to 34 years acount for 63.8% of all women with births.
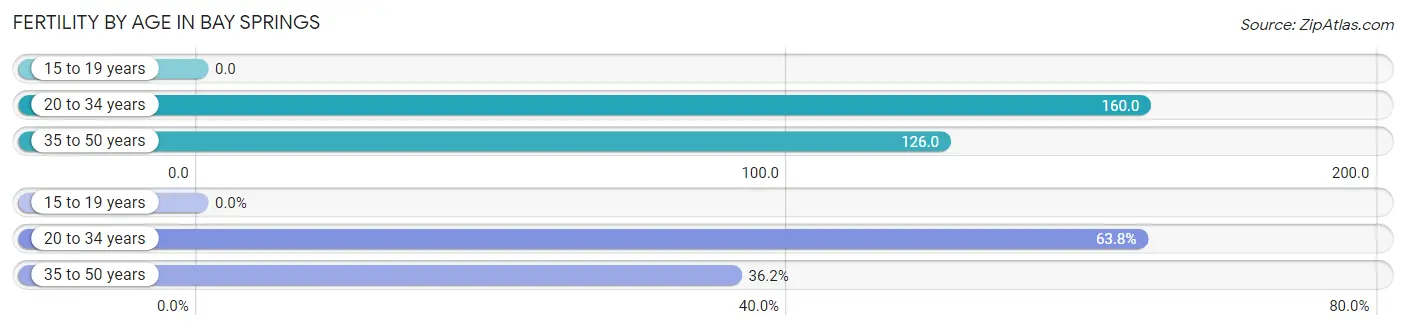
| Age Bracket | Women with Births | Births / 1,000 Women |
| 15 to 19 years | 0 (0.0%) | 0.0 |
| 20 to 34 years | 37 (63.8%) | 160.0 |
| 35 to 50 years | 21 (36.2%) | 126.0 |
| Total | 58 (100.0%) | 137.0 |
Fertility by Age by Marriage Status in Bay Springs
12.1% of women with births (58) in Bay Springs are married. The highest percentage of unmarried women with births falls into 20 to 34 years age bracket with 100.0% of them unmarried at the time of birth, while the lowest percentage of unmarried women with births belong to 35 to 50 years age bracket with 66.7% of them unmarried.
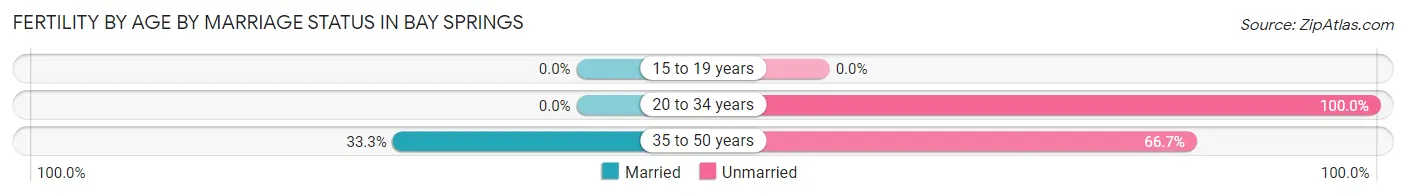
| Age Bracket | Married | Unmarried |
| 15 to 19 years | 0 (0.0%) | 0 (0.0%) |
| 20 to 34 years | 0 (0.0%) | 37 (100.0%) |
| 35 to 50 years | 7 (33.3%) | 14 (66.7%) |
| Total | 7 (12.1%) | 51 (87.9%) |
Fertility by Education in Bay Springs
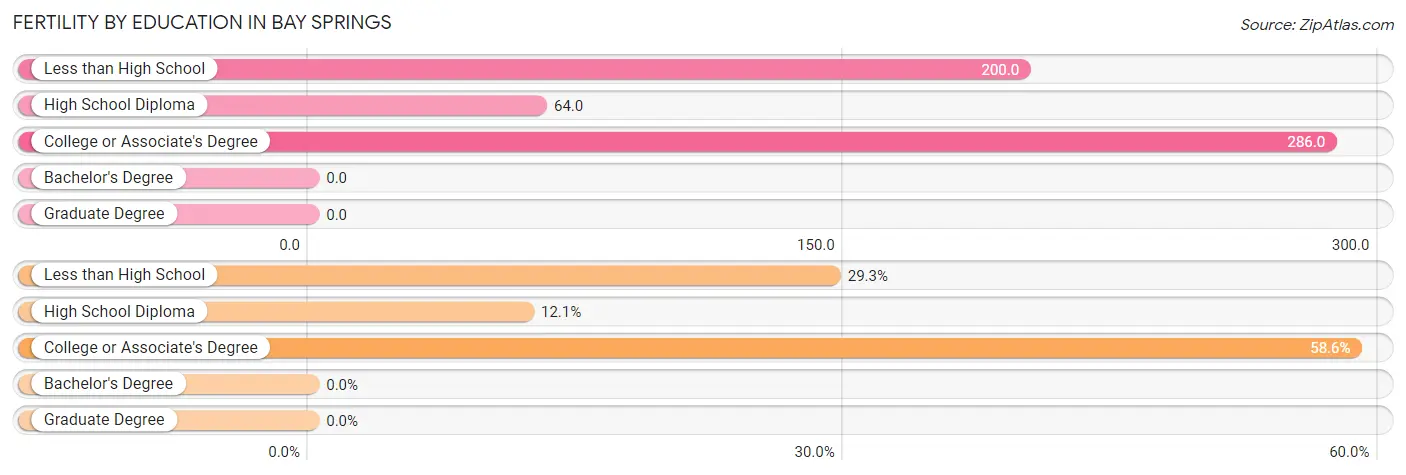
| Educational Attainment | Women with Births | Births / 1,000 Women |
| Less than High School | 17 (29.3%) | 200.0 |
| High School Diploma | 7 (12.1%) | 64.0 |
| College or Associate's Degree | 34 (58.6%) | 286.0 |
| Bachelor's Degree | 0 (0.0%) | 0.0 |
| Graduate Degree | 0 (0.0%) | 0.0 |
| Total | 58 (100.0%) | 137.0 |
Fertility by Education by Marriage Status in Bay Springs
87.9% of women with births in Bay Springs are unmarried. Women with the educational attainment of high school diploma are most likely to be married with 100.0% of them married at childbirth, while women with the educational attainment of less than high school are least likely to be married with 100.0% of them unmarried at childbirth.
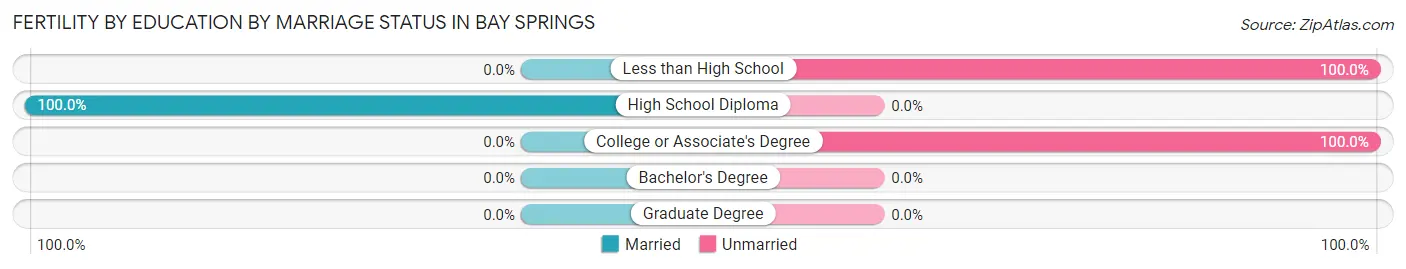
| Educational Attainment | Married | Unmarried |
| Less than High School | 0 (0.0%) | 17 (100.0%) |
| High School Diploma | 7 (100.0%) | 0 (0.0%) |
| College or Associate's Degree | 0 (0.0%) | 34 (100.0%) |
| Bachelor's Degree | 0 (0.0%) | 0 (0.0%) |
| Graduate Degree | 0 (0.0%) | 0 (0.0%) |
| Total | 7 (12.1%) | 51 (87.9%) |
Employment Characteristics in Bay Springs
Employment by Class of Employer in Bay Springs
Among the 650 employed individuals in Bay Springs, private company employees (542 | 83.4%), self-employed (not incorporated) (55 | 8.5%), and local government employees (28 | 4.3%) make up the most common classes of employment.
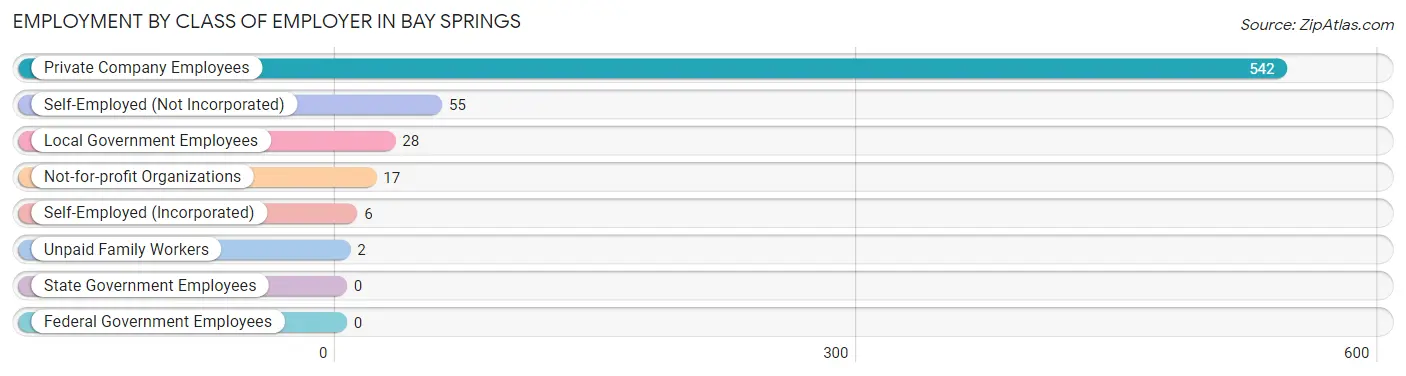
| Employer Class | # Employees | % Employees |
| Private Company Employees | 542 | 83.4% |
| Self-Employed (Incorporated) | 6 | 0.9% |
| Self-Employed (Not Incorporated) | 55 | 8.5% |
| Not-for-profit Organizations | 17 | 2.6% |
| Local Government Employees | 28 | 4.3% |
| State Government Employees | 0 | 0.0% |
| Federal Government Employees | 0 | 0.0% |
| Unpaid Family Workers | 2 | 0.3% |
| Total | 650 | 100.0% |
Employment Status by Age in Bay Springs
According to the labor force statistics for Bay Springs, out of the total population over 16 years of age (1,428), 46.8% or 668 individuals are in the labor force, with 2.5% or 17 of them unemployed. The age group with the highest labor force participation rate is 25 to 29 years, with 86.6% or 168 individuals in the labor force. Within the labor force, the 25 to 29 years age range has the highest percentage of unemployed individuals, with 8.3% or 14 of them being unemployed.
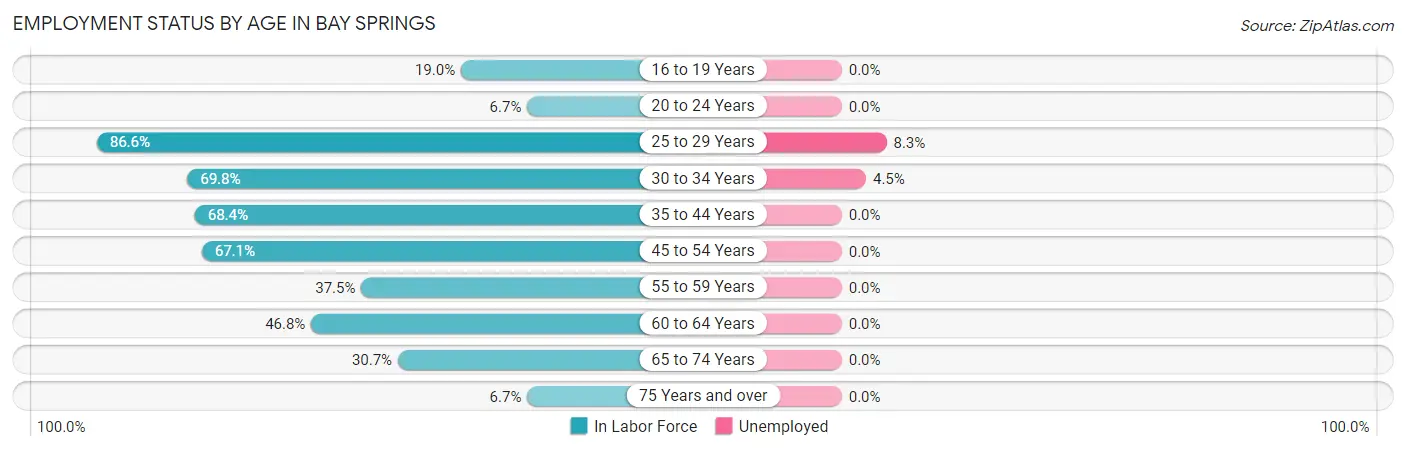
| Age Bracket | In Labor Force | Unemployed |
| 16 to 19 Years | 12 (19.0%) | 0 (0.0%) |
| 20 to 24 Years | 4 (6.7%) | 0 (0.0%) |
| 25 to 29 Years | 168 (86.6%) | 14 (8.3%) |
| 30 to 34 Years | 67 (69.8%) | 3 (4.5%) |
| 35 to 44 Years | 106 (68.4%) | 0 (0.0%) |
| 45 to 54 Years | 149 (67.1%) | 0 (0.0%) |
| 55 to 59 Years | 36 (37.5%) | 0 (0.0%) |
| 60 to 64 Years | 74 (46.8%) | 0 (0.0%) |
| 65 to 74 Years | 35 (30.7%) | 0 (0.0%) |
| 75 Years and over | 18 (6.7%) | 0 (0.0%) |
| Total | 668 (46.8%) | 17 (2.5%) |
Employment Status by Educational Attainment in Bay Springs
According to labor force statistics for Bay Springs, 65.1% of individuals (600) out of the total population between 25 and 64 years of age (921) are in the labor force, with 2.8% or 17 of them being unemployed. The group with the highest labor force participation rate are those with the educational attainment of college / associate degree, with 89.1% or 180 individuals in the labor force. Within the labor force, individuals with college / associate degree education have the highest percentage of unemployment, with 9.4% or 17 of them being unemployed.
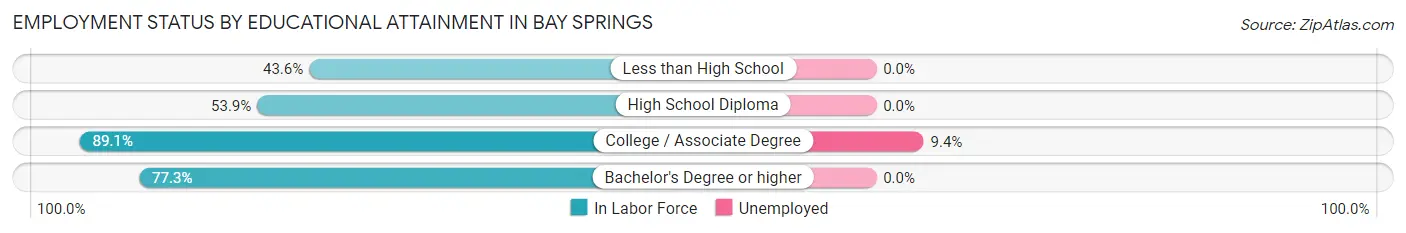
| Educational Attainment | In Labor Force | Unemployed |
| Less than High School | 58 (43.6%) | 0 (0.0%) |
| High School Diploma | 209 (53.9%) | 0 (0.0%) |
| College / Associate Degree | 180 (89.1%) | 19 (9.4%) |
| Bachelor's Degree or higher | 153 (77.3%) | 0 (0.0%) |
| Total | 600 (65.1%) | 26 (2.8%) |
Employment Occupations by Sex in Bay Springs
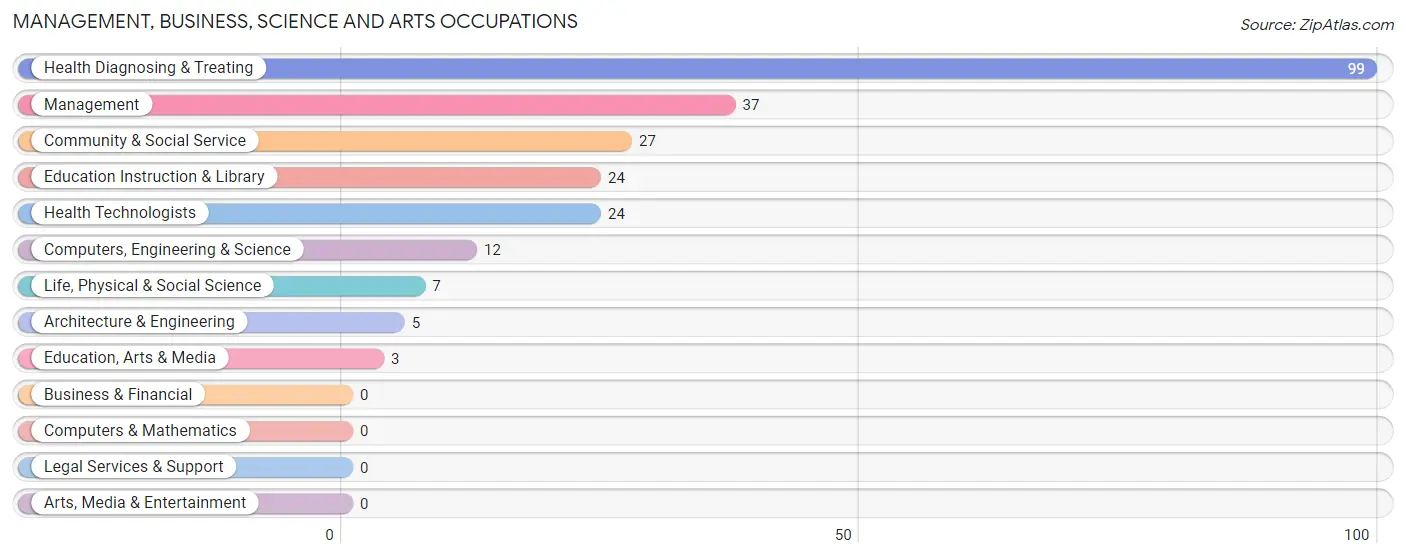
Management, Business, Science and Arts Occupations
The most common Management, Business, Science and Arts occupations in Bay Springs are Health Diagnosing & Treating (99 | 15.2%), Management (37 | 5.7%), Community & Social Service (27 | 4.1%), Education Instruction & Library (24 | 3.7%), and Health Technologists (24 | 3.7%).
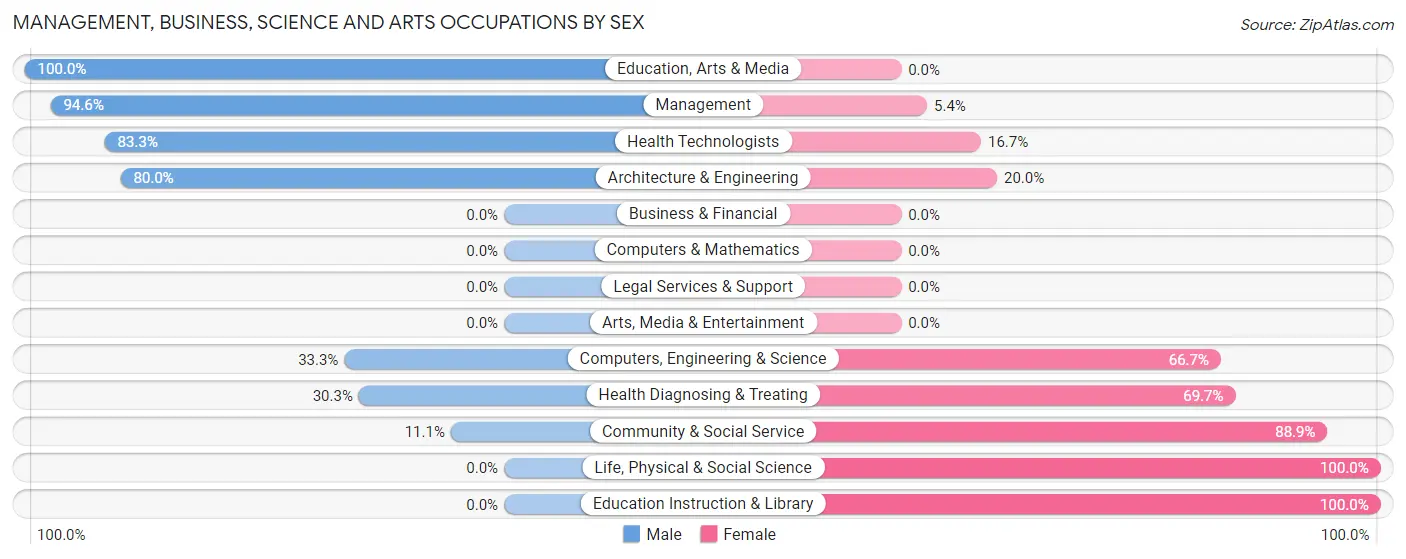
Management, Business, Science and Arts Occupations by Sex
Within the Management, Business, Science and Arts occupations in Bay Springs, the most male-oriented occupations are Education, Arts & Media (100.0%), Management (94.6%), and Health Technologists (83.3%), while the most female-oriented occupations are Life, Physical & Social Science (100.0%), Education Instruction & Library (100.0%), and Community & Social Service (88.9%).
| Occupation | Male | Female |
| Management | 35 (94.6%) | 2 (5.4%) |
| Business & Financial | 0 (0.0%) | 0 (0.0%) |
| Computers, Engineering & Science | 4 (33.3%) | 8 (66.7%) |
| Computers & Mathematics | 0 (0.0%) | 0 (0.0%) |
| Architecture & Engineering | 4 (80.0%) | 1 (20.0%) |
| Life, Physical & Social Science | 0 (0.0%) | 7 (100.0%) |
| Community & Social Service | 3 (11.1%) | 24 (88.9%) |
| Education, Arts & Media | 3 (100.0%) | 0 (0.0%) |
| Legal Services & Support | 0 (0.0%) | 0 (0.0%) |
| Education Instruction & Library | 0 (0.0%) | 24 (100.0%) |
| Arts, Media & Entertainment | 0 (0.0%) | 0 (0.0%) |
| Health Diagnosing & Treating | 30 (30.3%) | 69 (69.7%) |
| Health Technologists | 20 (83.3%) | 4 (16.7%) |
| Total (Category) | 72 (41.1%) | 103 (58.9%) |
| Total (Overall) | 257 (39.4%) | 395 (60.6%) |
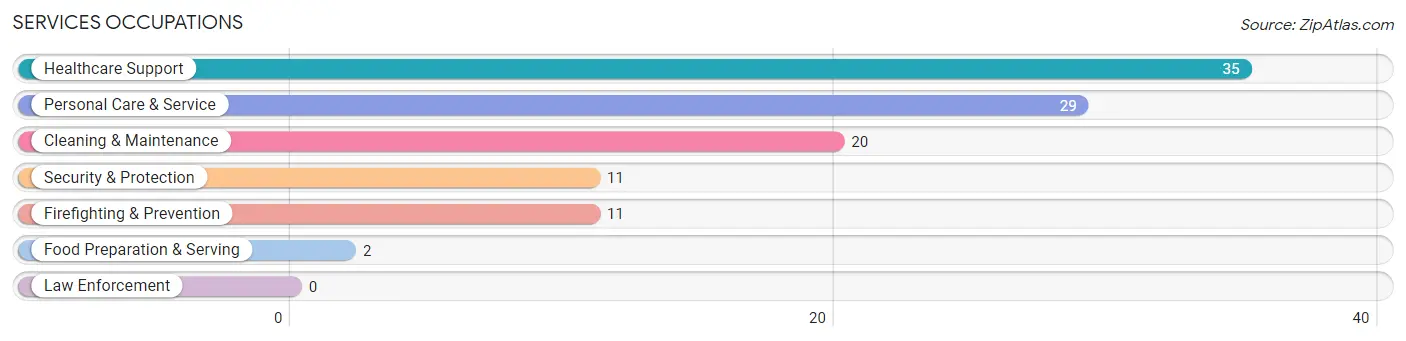
Services Occupations
The most common Services occupations in Bay Springs are Healthcare Support (35 | 5.4%), Personal Care & Service (29 | 4.4%), Cleaning & Maintenance (20 | 3.1%), Security & Protection (11 | 1.7%), and Firefighting & Prevention (11 | 1.7%).
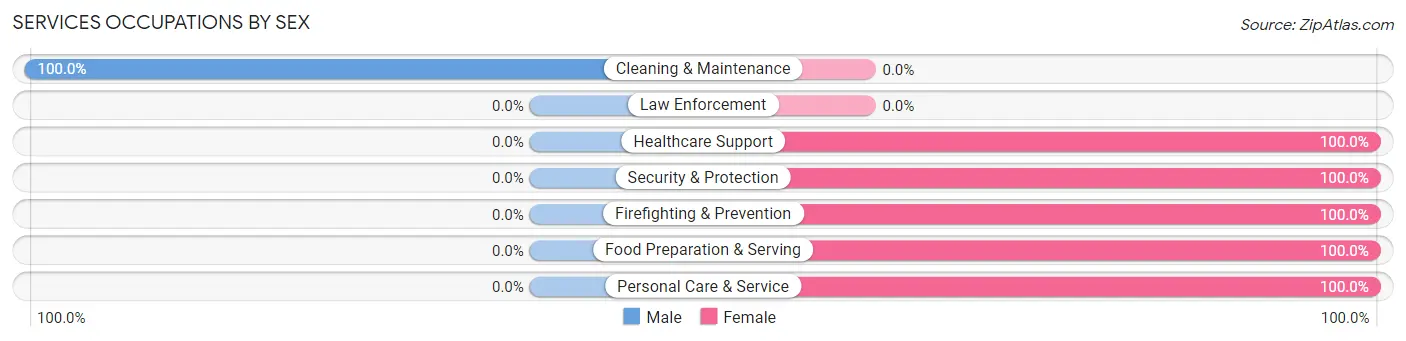
Services Occupations by Sex
| Occupation | Male | Female |
| Healthcare Support | 0 (0.0%) | 35 (100.0%) |
| Security & Protection | 0 (0.0%) | 11 (100.0%) |
| Firefighting & Prevention | 0 (0.0%) | 11 (100.0%) |
| Law Enforcement | 0 (0.0%) | 0 (0.0%) |
| Food Preparation & Serving | 0 (0.0%) | 2 (100.0%) |
| Cleaning & Maintenance | 20 (100.0%) | 0 (0.0%) |
| Personal Care & Service | 0 (0.0%) | 29 (100.0%) |
| Total (Category) | 20 (20.6%) | 77 (79.4%) |
| Total (Overall) | 257 (39.4%) | 395 (60.6%) |
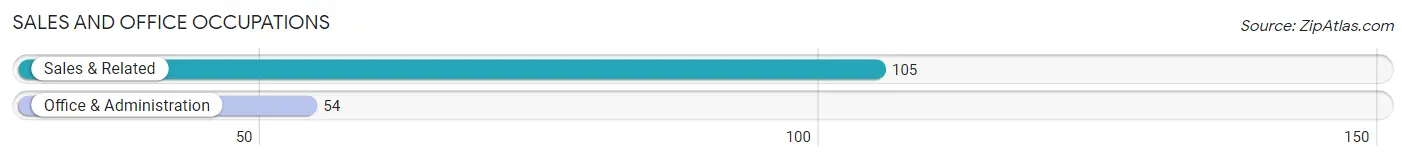
Sales and Office Occupations
The most common Sales and Office occupations in Bay Springs are Sales & Related (105 | 16.1%), and Office & Administration (54 | 8.3%).
Sales and Office Occupations by Sex
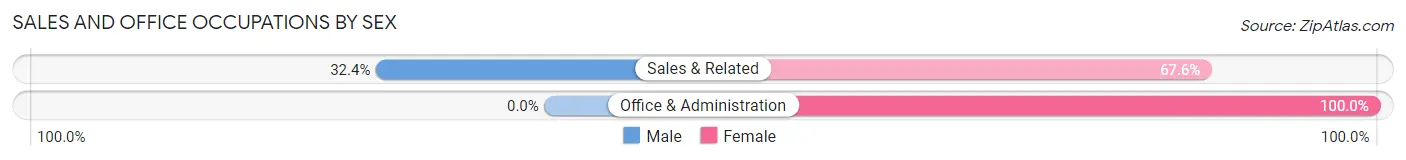
| Occupation | Male | Female |
| Sales & Related | 34 (32.4%) | 71 (67.6%) |
| Office & Administration | 0 (0.0%) | 54 (100.0%) |
| Total (Category) | 34 (21.4%) | 125 (78.6%) |
| Total (Overall) | 257 (39.4%) | 395 (60.6%) |
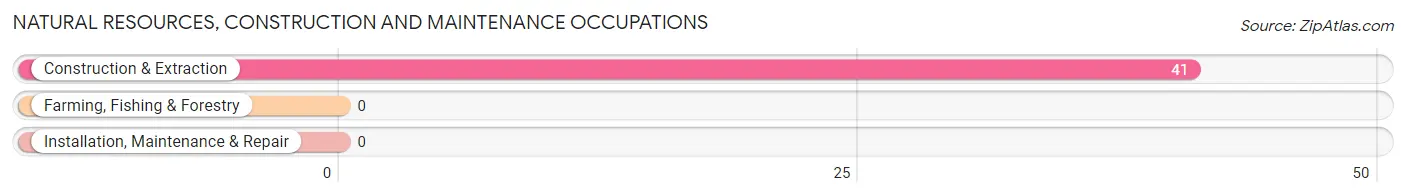
Natural Resources, Construction and Maintenance Occupations
The most common Natural Resources, Construction and Maintenance occupations in Bay Springs are , and Construction & Extraction (41 | 6.3%).
Natural Resources, Construction and Maintenance Occupations by Sex
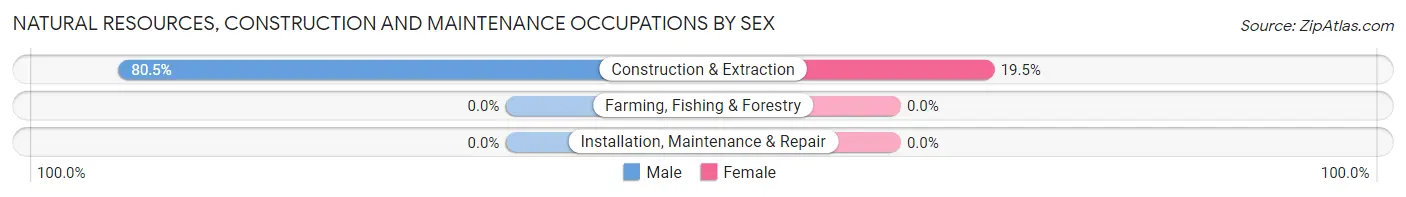
| Occupation | Male | Female |
| Farming, Fishing & Forestry | 0 (0.0%) | 0 (0.0%) |
| Construction & Extraction | 33 (80.5%) | 8 (19.5%) |
| Installation, Maintenance & Repair | 0 (0.0%) | 0 (0.0%) |
| Total (Category) | 33 (80.5%) | 8 (19.5%) |
| Total (Overall) | 257 (39.4%) | 395 (60.6%) |
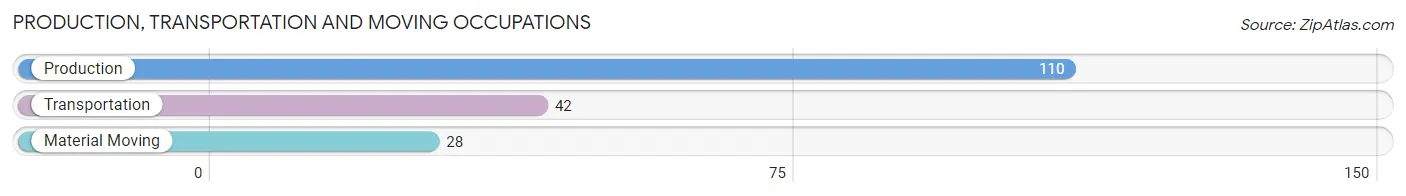
Production, Transportation and Moving Occupations
The most common Production, Transportation and Moving occupations in Bay Springs are Production (110 | 16.9%), Transportation (42 | 6.4%), and Material Moving (28 | 4.3%).
Production, Transportation and Moving Occupations by Sex
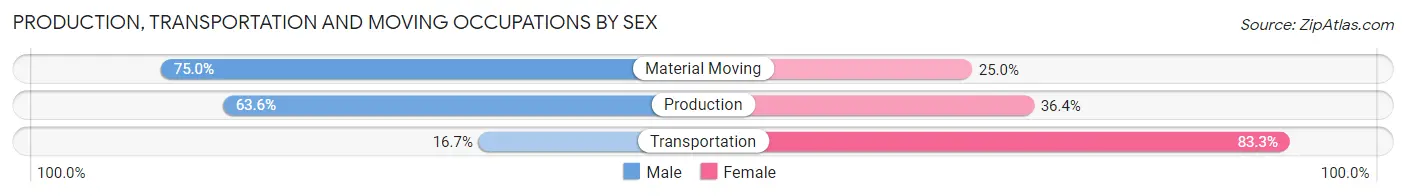
| Occupation | Male | Female |
| Production | 70 (63.6%) | 40 (36.4%) |
| Transportation | 7 (16.7%) | 35 (83.3%) |
| Material Moving | 21 (75.0%) | 7 (25.0%) |
| Total (Category) | 98 (54.4%) | 82 (45.6%) |
| Total (Overall) | 257 (39.4%) | 395 (60.6%) |
Employment Industries by Sex in Bay Springs
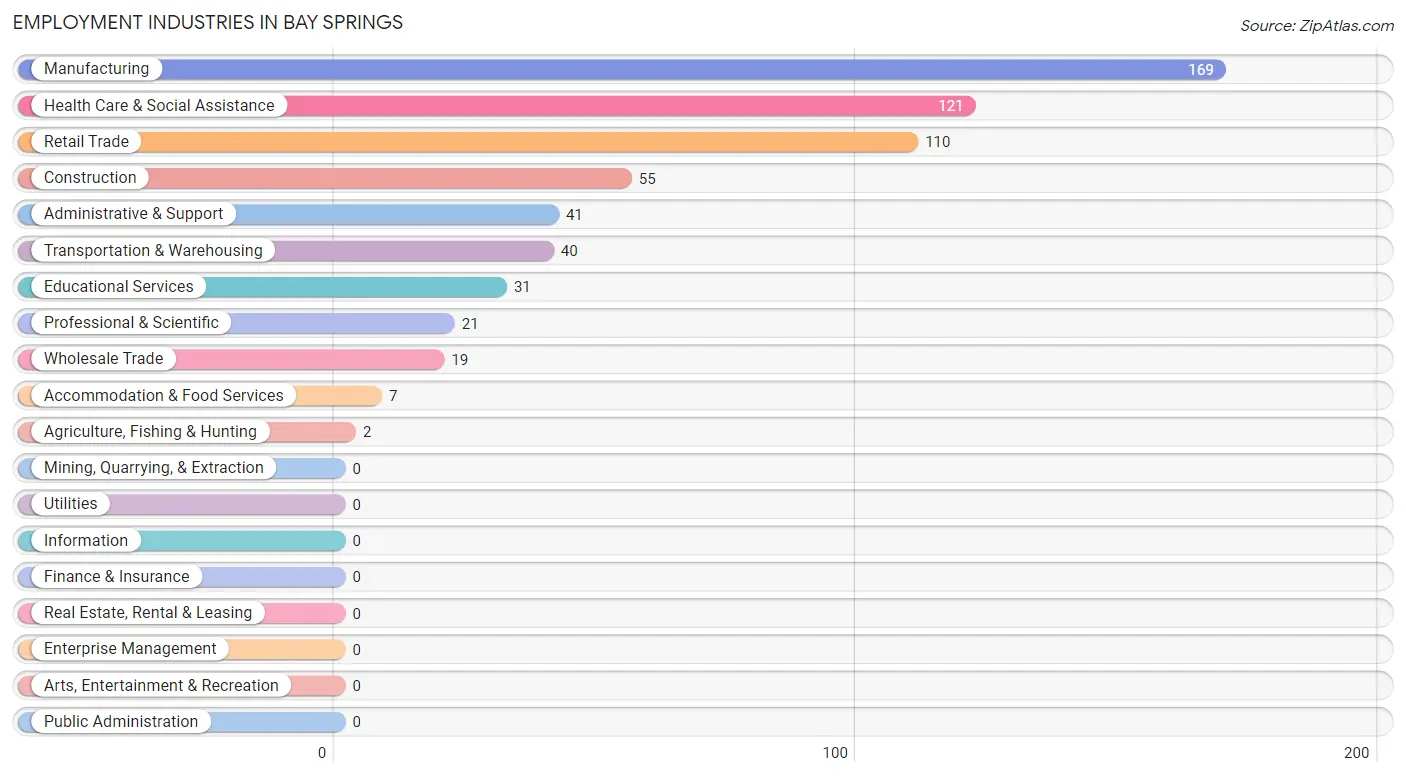
Employment Industries in Bay Springs
The major employment industries in Bay Springs include Manufacturing (169 | 25.9%), Health Care & Social Assistance (121 | 18.6%), Retail Trade (110 | 16.9%), Construction (55 | 8.4%), and Administrative & Support (41 | 6.3%).
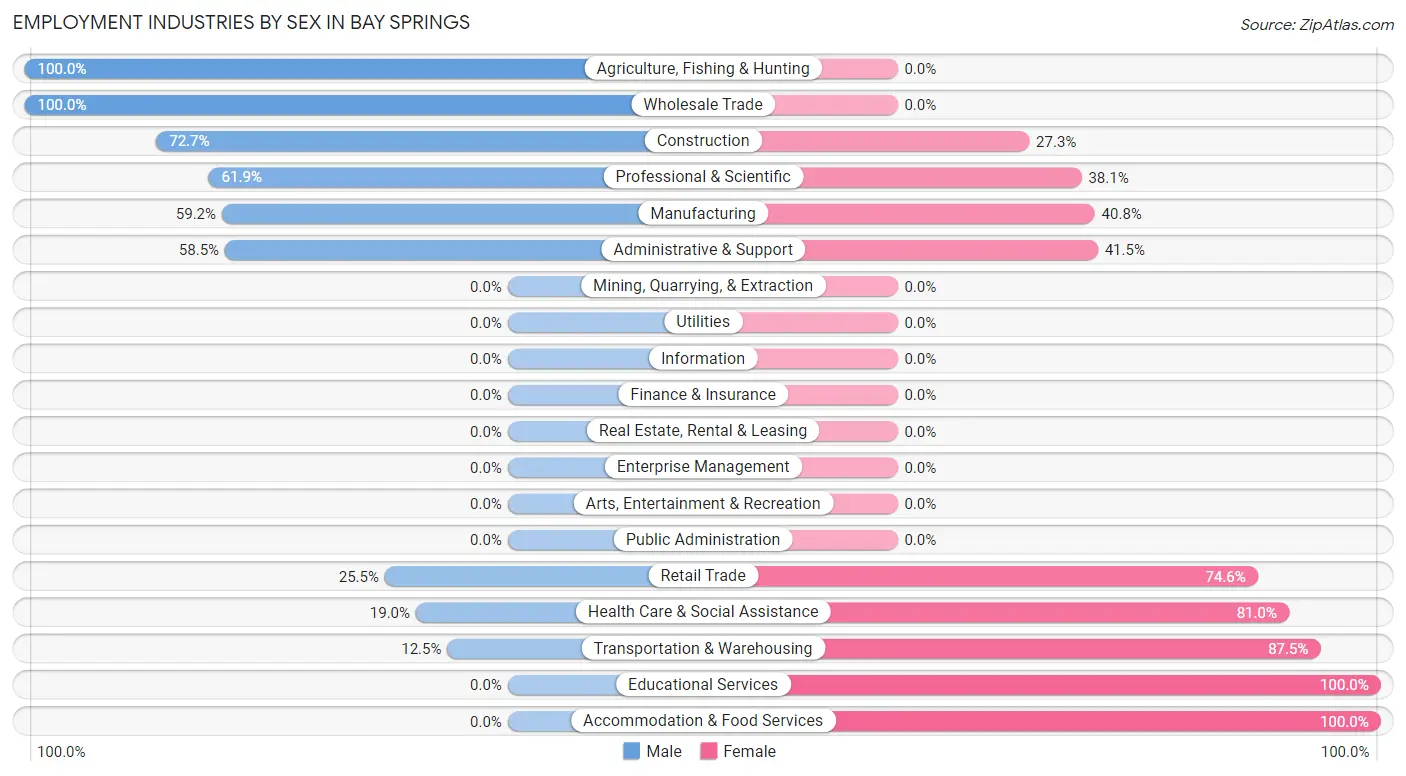
Employment Industries by Sex in Bay Springs
The Bay Springs industries that see more men than women are Agriculture, Fishing & Hunting (100.0%), Wholesale Trade (100.0%), and Construction (72.7%), whereas the industries that tend to have a higher number of women are Educational Services (100.0%), Accommodation & Food Services (100.0%), and Transportation & Warehousing (87.5%).
| Industry | Male | Female |
| Agriculture, Fishing & Hunting | 2 (100.0%) | 0 (0.0%) |
| Mining, Quarrying, & Extraction | 0 (0.0%) | 0 (0.0%) |
| Construction | 40 (72.7%) | 15 (27.3%) |
| Manufacturing | 100 (59.2%) | 69 (40.8%) |
| Wholesale Trade | 19 (100.0%) | 0 (0.0%) |
| Retail Trade | 28 (25.5%) | 82 (74.6%) |
| Transportation & Warehousing | 5 (12.5%) | 35 (87.5%) |
| Utilities | 0 (0.0%) | 0 (0.0%) |
| Information | 0 (0.0%) | 0 (0.0%) |
| Finance & Insurance | 0 (0.0%) | 0 (0.0%) |
| Real Estate, Rental & Leasing | 0 (0.0%) | 0 (0.0%) |
| Professional & Scientific | 13 (61.9%) | 8 (38.1%) |
| Enterprise Management | 0 (0.0%) | 0 (0.0%) |
| Administrative & Support | 24 (58.5%) | 17 (41.5%) |
| Educational Services | 0 (0.0%) | 31 (100.0%) |
| Health Care & Social Assistance | 23 (19.0%) | 98 (81.0%) |
| Arts, Entertainment & Recreation | 0 (0.0%) | 0 (0.0%) |
| Accommodation & Food Services | 0 (0.0%) | 7 (100.0%) |
| Public Administration | 0 (0.0%) | 0 (0.0%) |
| Total | 257 (39.4%) | 395 (60.6%) |
Education in Bay Springs
School Enrollment in Bay Springs
The most common levels of schooling among the 314 students in Bay Springs are middle school (86 | 27.4%), elementary school (71 | 22.6%), and high school (56 | 17.8%).
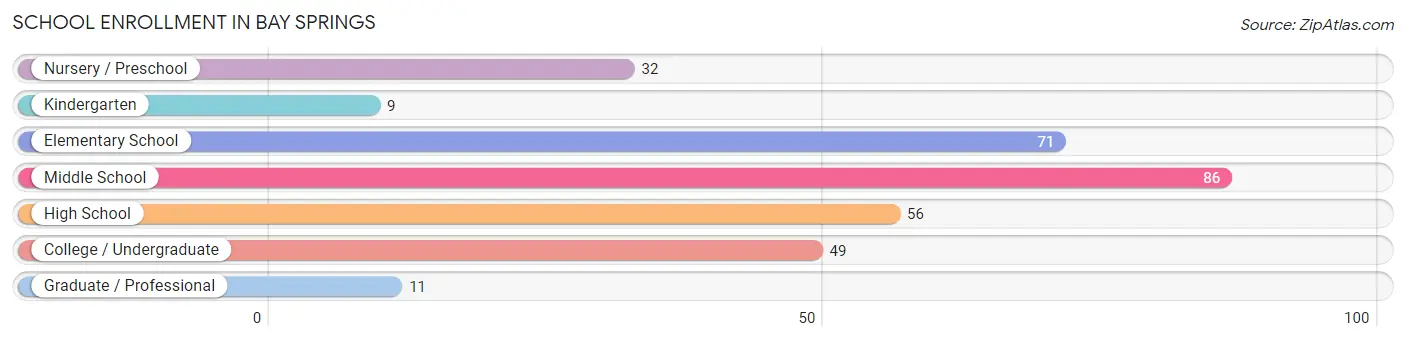
| School Level | # Students | % Students |
| Nursery / Preschool | 32 | 10.2% |
| Kindergarten | 9 | 2.9% |
| Elementary School | 71 | 22.6% |
| Middle School | 86 | 27.4% |
| High School | 56 | 17.8% |
| College / Undergraduate | 49 | 15.6% |
| Graduate / Professional | 11 | 3.5% |
| Total | 314 | 100.0% |
School Enrollment by Age by Funding Source in Bay Springs
Out of a total of 314 students who are enrolled in schools in Bay Springs, 54 (17.2%) attend a private institution, while the remaining 260 (82.8%) are enrolled in public schools. The age group of 25 to 34 year olds has the highest likelihood of being enrolled in private schools, with 8 (72.7% in the age bracket) enrolled. Conversely, the age group of 18 to 19 year olds has the lowest likelihood of being enrolled in a private school, with 32 (100.0% in the age bracket) attending a public institution.
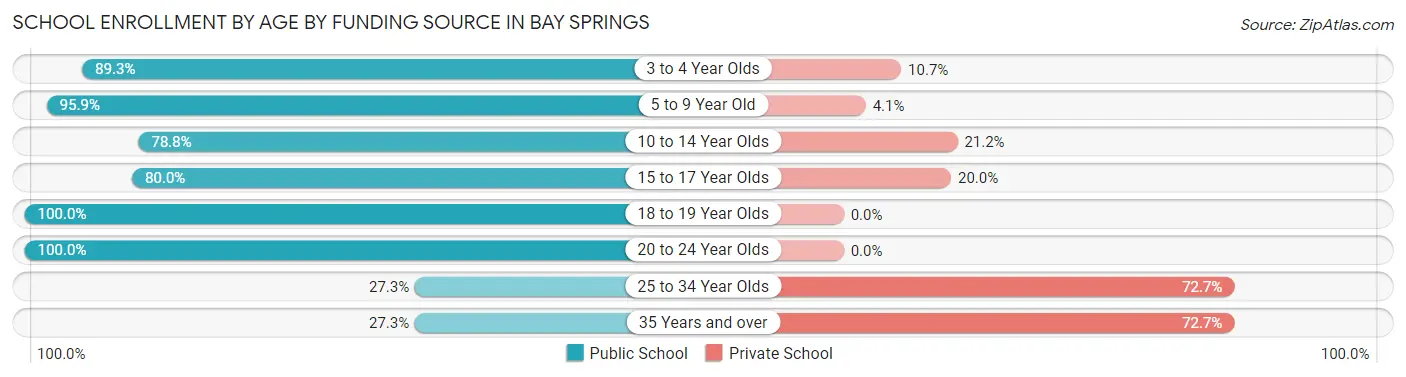
| Age Bracket | Public School | Private School |
| 3 to 4 Year Olds | 25 (89.3%) | 3 (10.7%) |
| 5 to 9 Year Old | 70 (95.9%) | 3 (4.1%) |
| 10 to 14 Year Olds | 93 (78.8%) | 25 (21.2%) |
| 15 to 17 Year Olds | 28 (80.0%) | 7 (20.0%) |
| 18 to 19 Year Olds | 32 (100.0%) | 0 (0.0%) |
| 20 to 24 Year Olds | 6 (100.0%) | 0 (0.0%) |
| 25 to 34 Year Olds | 3 (27.3%) | 8 (72.7%) |
| 35 Years and over | 3 (27.3%) | 8 (72.7%) |
| Total | 260 (82.8%) | 54 (17.2%) |
Educational Attainment by Field of Study in Bay Springs
Science & technology (86 | 28.3%), education (81 | 26.6%), physical & health sciences (50 | 16.5%), business (30 | 9.9%), and psychology (20 | 6.6%) are the most common fields of study among 304 individuals in Bay Springs who have obtained a bachelor's degree or higher.
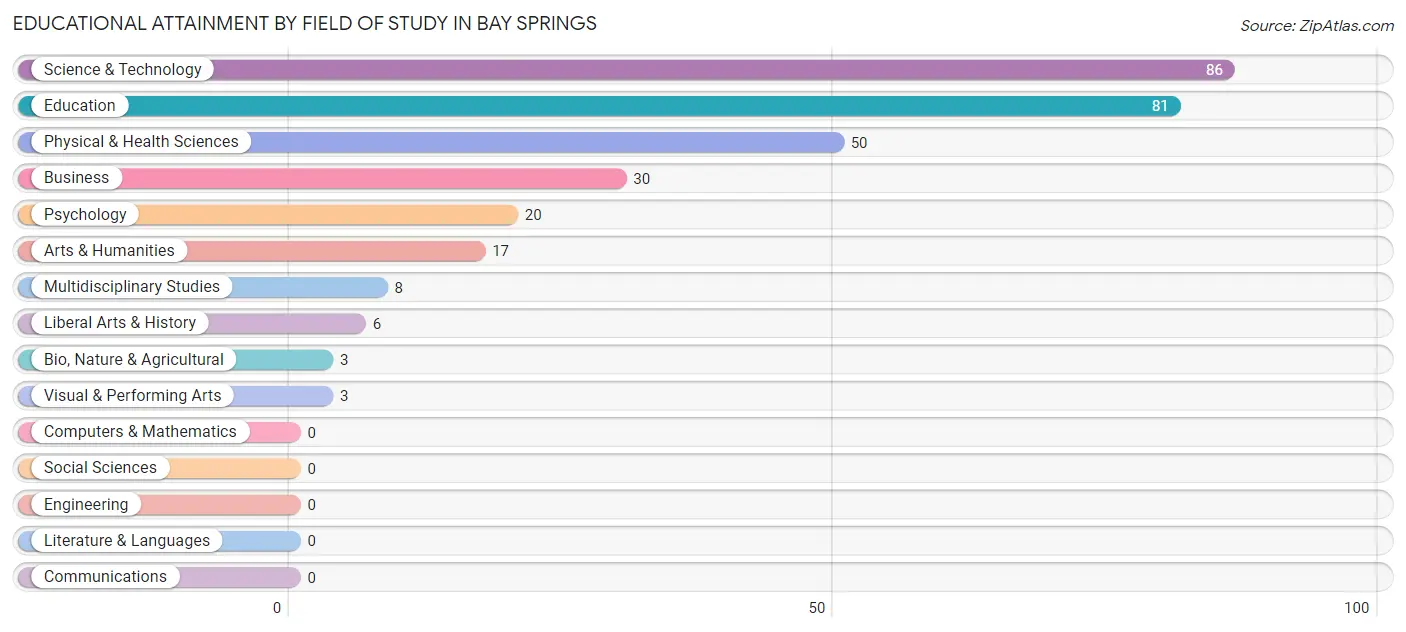
| Field of Study | # Graduates | % Graduates |
| Computers & Mathematics | 0 | 0.0% |
| Bio, Nature & Agricultural | 3 | 1.0% |
| Physical & Health Sciences | 50 | 16.5% |
| Psychology | 20 | 6.6% |
| Social Sciences | 0 | 0.0% |
| Engineering | 0 | 0.0% |
| Multidisciplinary Studies | 8 | 2.6% |
| Science & Technology | 86 | 28.3% |
| Business | 30 | 9.9% |
| Education | 81 | 26.6% |
| Literature & Languages | 0 | 0.0% |
| Liberal Arts & History | 6 | 2.0% |
| Visual & Performing Arts | 3 | 1.0% |
| Communications | 0 | 0.0% |
| Arts & Humanities | 17 | 5.6% |
| Total | 304 | 100.0% |
Transportation & Commute in Bay Springs
Vehicle Availability by Sex in Bay Springs
The most prevalent vehicle ownership categories in Bay Springs are males with 2 vehicles (134, accounting for 53.6%) and females with 2 vehicles (124, making up 34.1%).
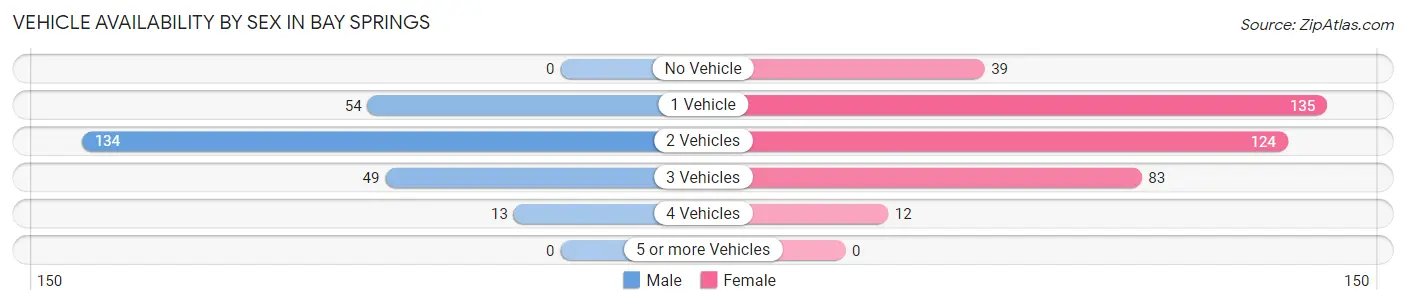
| Vehicles Available | Male | Female |
| No Vehicle | 0 (0.0%) | 39 (9.9%) |
| 1 Vehicle | 54 (21.6%) | 135 (34.4%) |
| 2 Vehicles | 134 (53.6%) | 124 (31.6%) |
| 3 Vehicles | 49 (19.6%) | 83 (21.1%) |
| 4 Vehicles | 13 (5.2%) | 12 (3.0%) |
| 5 or more Vehicles | 0 (0.0%) | 0 (0.0%) |
| Total | 250 (100.0%) | 393 (100.0%) |
Commute Time in Bay Springs
The most frequently occuring commute durations in Bay Springs are 5 to 9 minutes (149 commuters, 23.2%), 30 to 34 minutes (98 commuters, 15.3%), and 10 to 14 minutes (79 commuters, 12.3%).
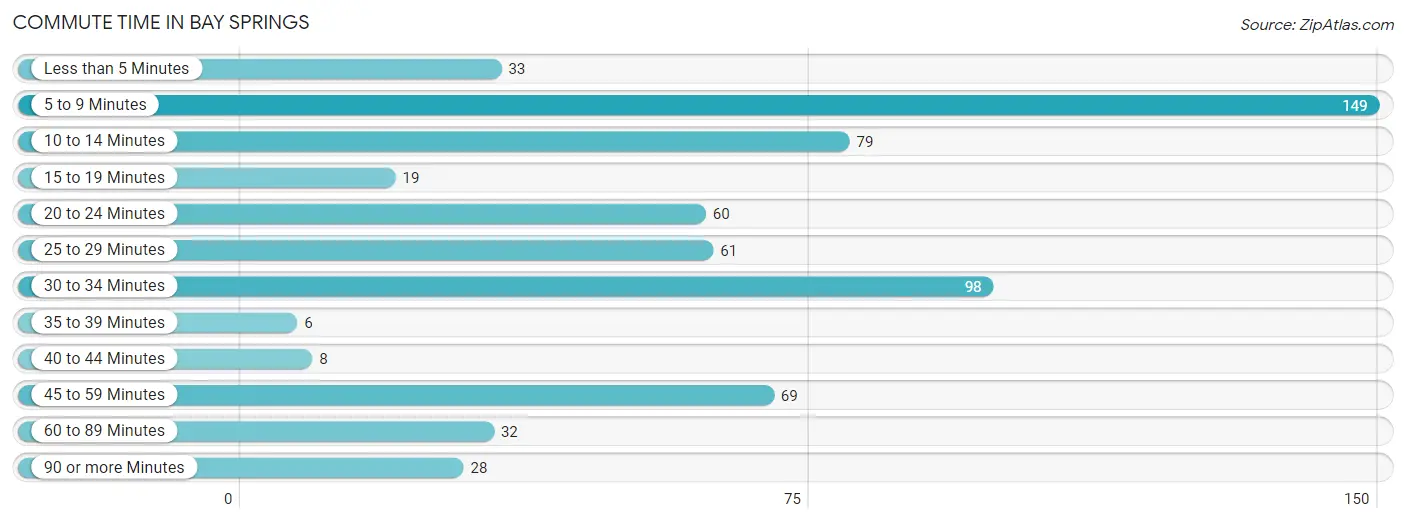
| Commute Time | # Commuters | % Commuters |
| Less than 5 Minutes | 33 | 5.1% |
| 5 to 9 Minutes | 149 | 23.2% |
| 10 to 14 Minutes | 79 | 12.3% |
| 15 to 19 Minutes | 19 | 3.0% |
| 20 to 24 Minutes | 60 | 9.3% |
| 25 to 29 Minutes | 61 | 9.5% |
| 30 to 34 Minutes | 98 | 15.3% |
| 35 to 39 Minutes | 6 | 0.9% |
| 40 to 44 Minutes | 8 | 1.3% |
| 45 to 59 Minutes | 69 | 10.7% |
| 60 to 89 Minutes | 32 | 5.0% |
| 90 or more Minutes | 28 | 4.4% |
Commute Time by Sex in Bay Springs
The most common commute times in Bay Springs are 5 to 9 minutes (90 commuters, 35.0%) for males and 30 to 34 minutes (81 commuters, 21.0%) for females.
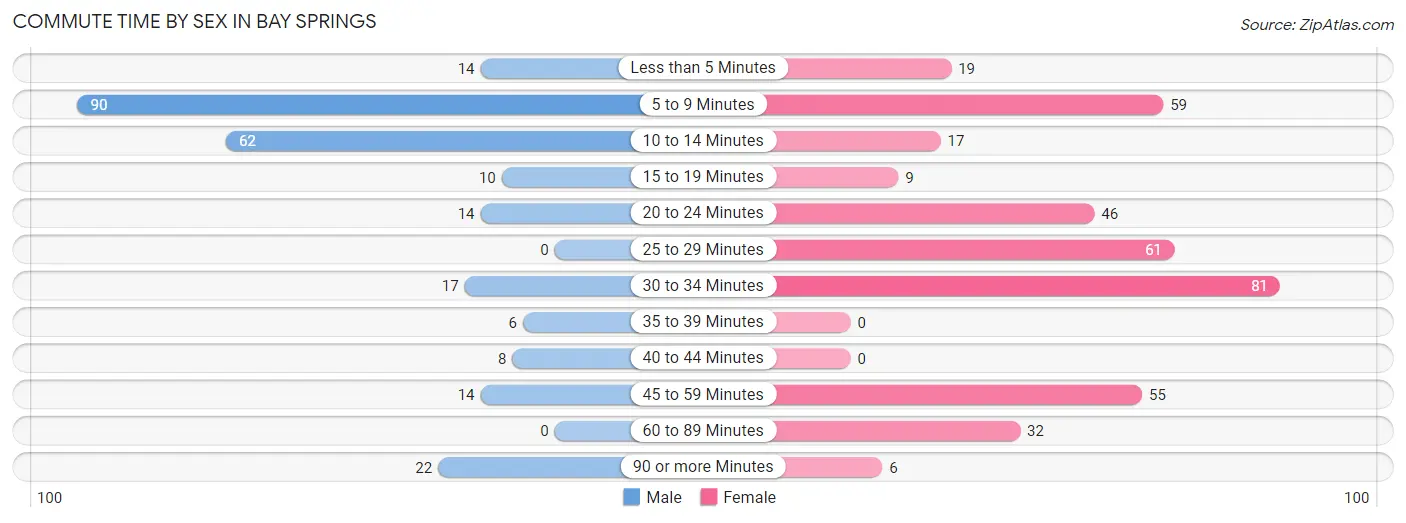
| Commute Time | Male | Female |
| Less than 5 Minutes | 14 (5.4%) | 19 (4.9%) |
| 5 to 9 Minutes | 90 (35.0%) | 59 (15.3%) |
| 10 to 14 Minutes | 62 (24.1%) | 17 (4.4%) |
| 15 to 19 Minutes | 10 (3.9%) | 9 (2.3%) |
| 20 to 24 Minutes | 14 (5.4%) | 46 (11.9%) |
| 25 to 29 Minutes | 0 (0.0%) | 61 (15.8%) |
| 30 to 34 Minutes | 17 (6.6%) | 81 (21.0%) |
| 35 to 39 Minutes | 6 (2.3%) | 0 (0.0%) |
| 40 to 44 Minutes | 8 (3.1%) | 0 (0.0%) |
| 45 to 59 Minutes | 14 (5.4%) | 55 (14.3%) |
| 60 to 89 Minutes | 0 (0.0%) | 32 (8.3%) |
| 90 or more Minutes | 22 (8.6%) | 6 (1.6%) |
Time of Departure to Work by Sex in Bay Springs
The most frequent times of departure to work in Bay Springs are 6:30 AM to 6:59 AM (69, 26.9%) for males and 6:30 AM to 6:59 AM (138, 35.8%) for females.
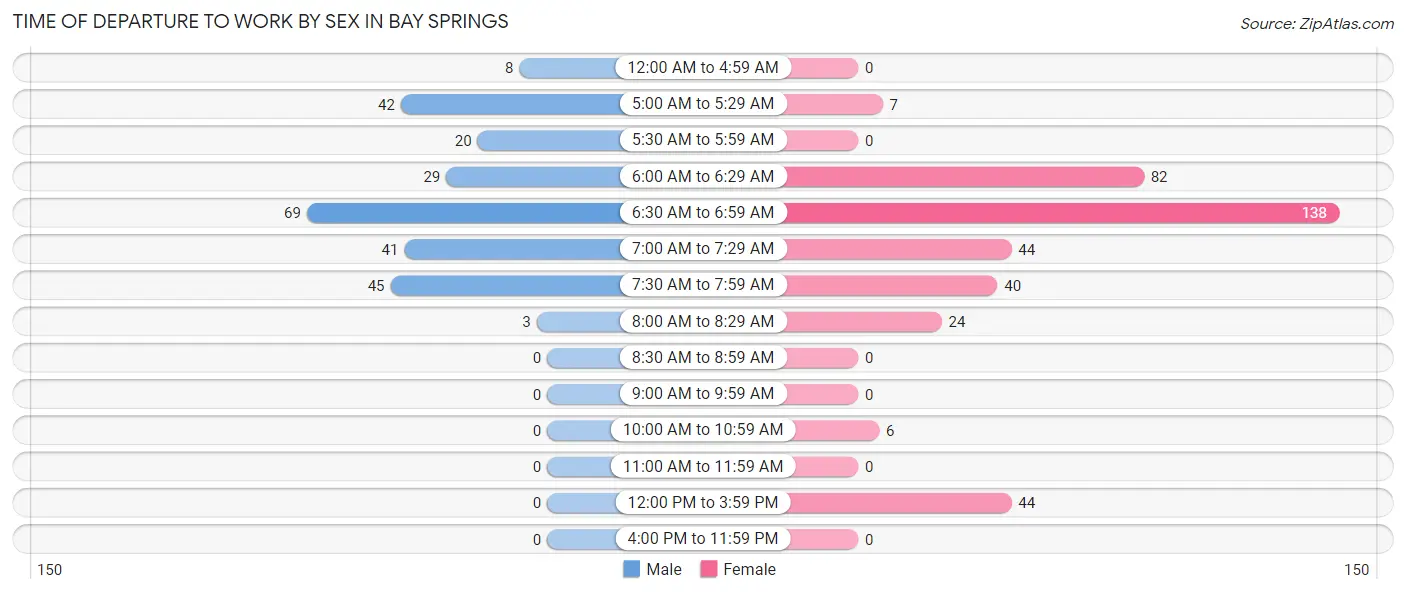
| Time of Departure | Male | Female |
| 12:00 AM to 4:59 AM | 8 (3.1%) | 0 (0.0%) |
| 5:00 AM to 5:29 AM | 42 (16.3%) | 7 (1.8%) |
| 5:30 AM to 5:59 AM | 20 (7.8%) | 0 (0.0%) |
| 6:00 AM to 6:29 AM | 29 (11.3%) | 82 (21.3%) |
| 6:30 AM to 6:59 AM | 69 (26.9%) | 138 (35.8%) |
| 7:00 AM to 7:29 AM | 41 (16.0%) | 44 (11.4%) |
| 7:30 AM to 7:59 AM | 45 (17.5%) | 40 (10.4%) |
| 8:00 AM to 8:29 AM | 3 (1.2%) | 24 (6.2%) |
| 8:30 AM to 8:59 AM | 0 (0.0%) | 0 (0.0%) |
| 9:00 AM to 9:59 AM | 0 (0.0%) | 0 (0.0%) |
| 10:00 AM to 10:59 AM | 0 (0.0%) | 6 (1.6%) |
| 11:00 AM to 11:59 AM | 0 (0.0%) | 0 (0.0%) |
| 12:00 PM to 3:59 PM | 0 (0.0%) | 44 (11.4%) |
| 4:00 PM to 11:59 PM | 0 (0.0%) | 0 (0.0%) |
| Total | 257 (100.0%) | 385 (100.0%) |
Housing Occupancy in Bay Springs
Occupancy by Ownership in Bay Springs
Of the total 761 dwellings in Bay Springs, owner-occupied units account for 489 (64.3%), while renter-occupied units make up 272 (35.7%).
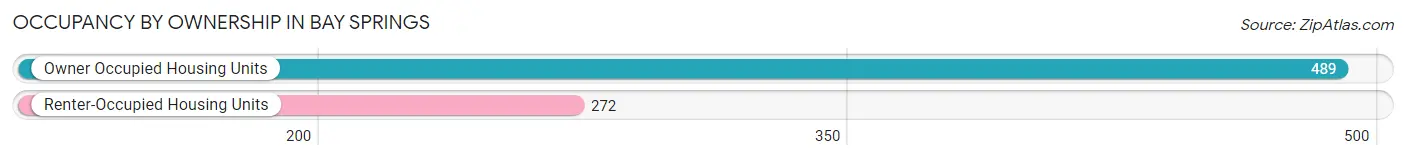
| Occupancy | # Housing Units | % Housing Units |
| Owner Occupied Housing Units | 489 | 64.3% |
| Renter-Occupied Housing Units | 272 | 35.7% |
| Total Occupied Housing Units | 761 | 100.0% |
Occupancy by Household Size in Bay Springs
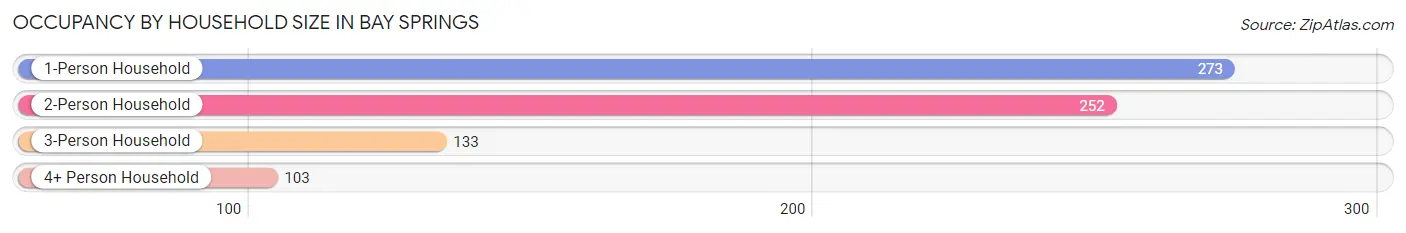
| Household Size | # Housing Units | % Housing Units |
| 1-Person Household | 273 | 35.9% |
| 2-Person Household | 252 | 33.1% |
| 3-Person Household | 133 | 17.5% |
| 4+ Person Household | 103 | 13.5% |
| Total Housing Units | 761 | 100.0% |
Occupancy by Ownership by Household Size in Bay Springs
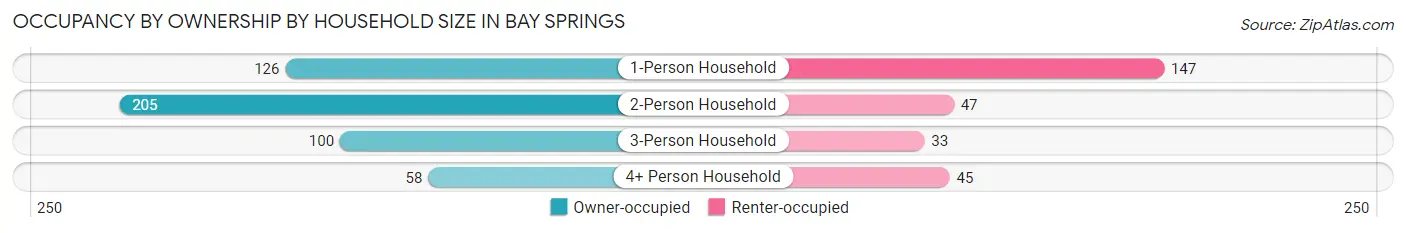
| Household Size | Owner-occupied | Renter-occupied |
| 1-Person Household | 126 (46.2%) | 147 (53.8%) |
| 2-Person Household | 205 (81.4%) | 47 (18.6%) |
| 3-Person Household | 100 (75.2%) | 33 (24.8%) |
| 4+ Person Household | 58 (56.3%) | 45 (43.7%) |
| Total Housing Units | 489 (64.3%) | 272 (35.7%) |
Occupancy by Educational Attainment in Bay Springs
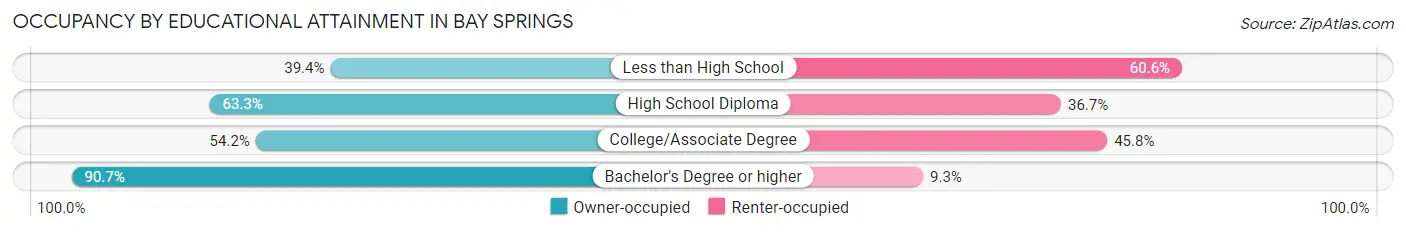
| Household Size | Owner-occupied | Renter-occupied |
| Less than High School | 39 (39.4%) | 60 (60.6%) |
| High School Diploma | 197 (63.3%) | 114 (36.7%) |
| College/Associate Degree | 97 (54.2%) | 82 (45.8%) |
| Bachelor's Degree or higher | 156 (90.7%) | 16 (9.3%) |
Occupancy by Age of Householder in Bay Springs
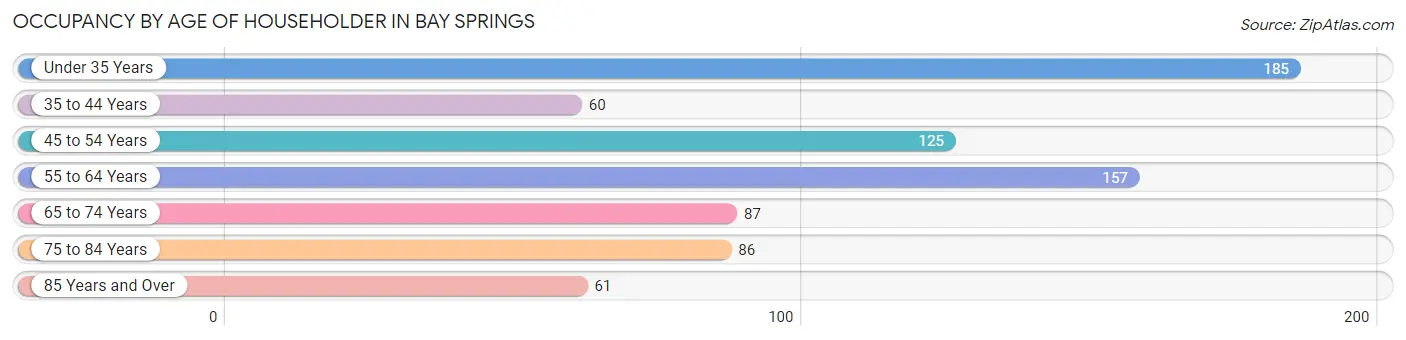
| Age Bracket | # Households | % Households |
| Under 35 Years | 185 | 24.3% |
| 35 to 44 Years | 60 | 7.9% |
| 45 to 54 Years | 125 | 16.4% |
| 55 to 64 Years | 157 | 20.6% |
| 65 to 74 Years | 87 | 11.4% |
| 75 to 84 Years | 86 | 11.3% |
| 85 Years and Over | 61 | 8.0% |
| Total | 761 | 100.0% |
Housing Finances in Bay Springs
Median Income by Occupancy in Bay Springs
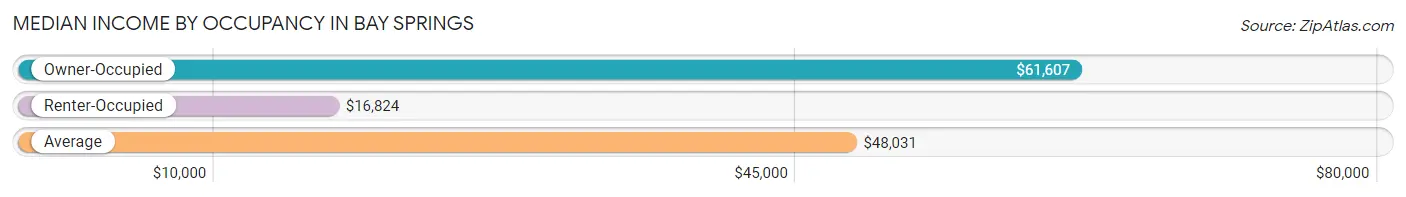
| Occupancy Type | # Households | Median Income |
| Owner-Occupied | 489 (64.3%) | $61,607 |
| Renter-Occupied | 272 (35.7%) | $16,824 |
| Average | 761 (100.0%) | $48,031 |
Occupancy by Householder Income Bracket in Bay Springs
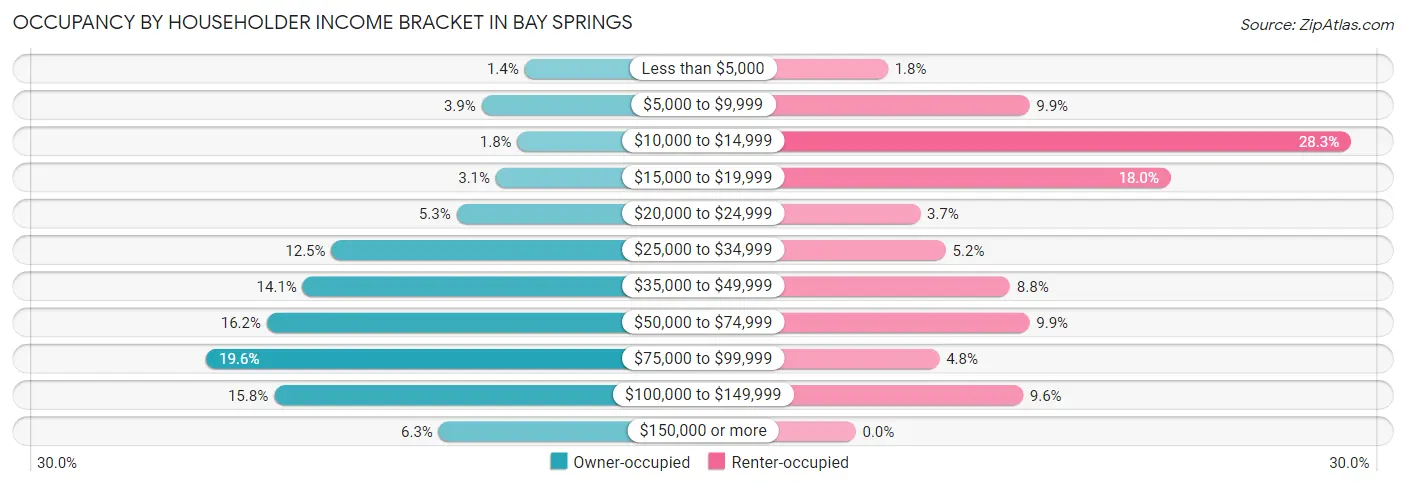
| Income Bracket | Owner-occupied | Renter-occupied |
| Less than $5,000 | 7 (1.4%) | 5 (1.8%) |
| $5,000 to $9,999 | 19 (3.9%) | 27 (9.9%) |
| $10,000 to $14,999 | 9 (1.8%) | 77 (28.3%) |
| $15,000 to $19,999 | 15 (3.1%) | 49 (18.0%) |
| $20,000 to $24,999 | 26 (5.3%) | 10 (3.7%) |
| $25,000 to $34,999 | 61 (12.5%) | 14 (5.1%) |
| $35,000 to $49,999 | 69 (14.1%) | 24 (8.8%) |
| $50,000 to $74,999 | 79 (16.2%) | 27 (9.9%) |
| $75,000 to $99,999 | 96 (19.6%) | 13 (4.8%) |
| $100,000 to $149,999 | 77 (15.8%) | 26 (9.6%) |
| $150,000 or more | 31 (6.3%) | 0 (0.0%) |
| Total | 489 (100.0%) | 272 (100.0%) |
Monthly Housing Cost Tiers in Bay Springs
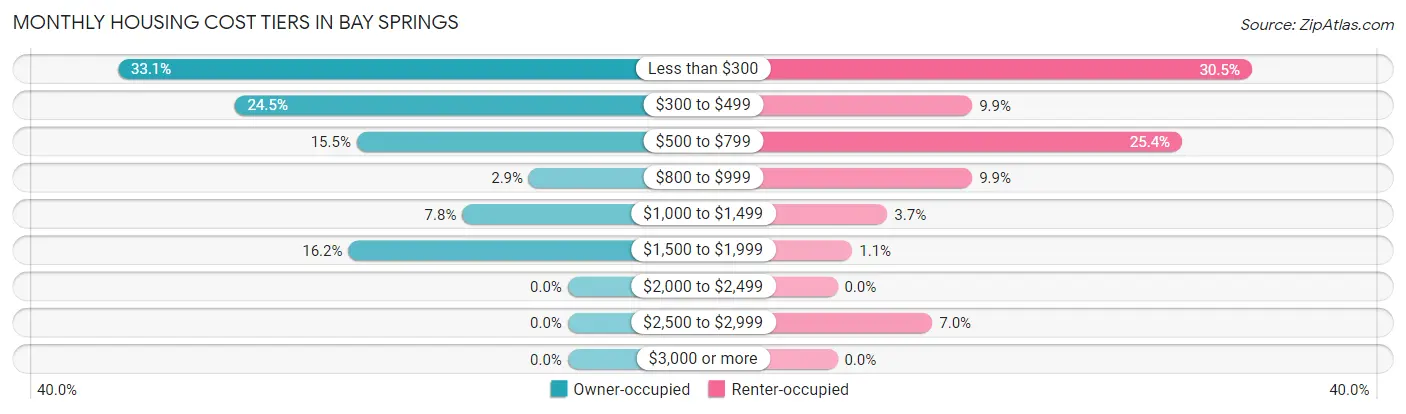
| Monthly Cost | Owner-occupied | Renter-occupied |
| Less than $300 | 162 (33.1%) | 83 (30.5%) |
| $300 to $499 | 120 (24.5%) | 27 (9.9%) |
| $500 to $799 | 76 (15.5%) | 69 (25.4%) |
| $800 to $999 | 14 (2.9%) | 27 (9.9%) |
| $1,000 to $1,499 | 38 (7.8%) | 10 (3.7%) |
| $1,500 to $1,999 | 79 (16.2%) | 3 (1.1%) |
| $2,000 to $2,499 | 0 (0.0%) | 0 (0.0%) |
| $2,500 to $2,999 | 0 (0.0%) | 19 (7.0%) |
| $3,000 or more | 0 (0.0%) | 0 (0.0%) |
| Total | 489 (100.0%) | 272 (100.0%) |
Physical Housing Characteristics in Bay Springs
Housing Structures in Bay Springs
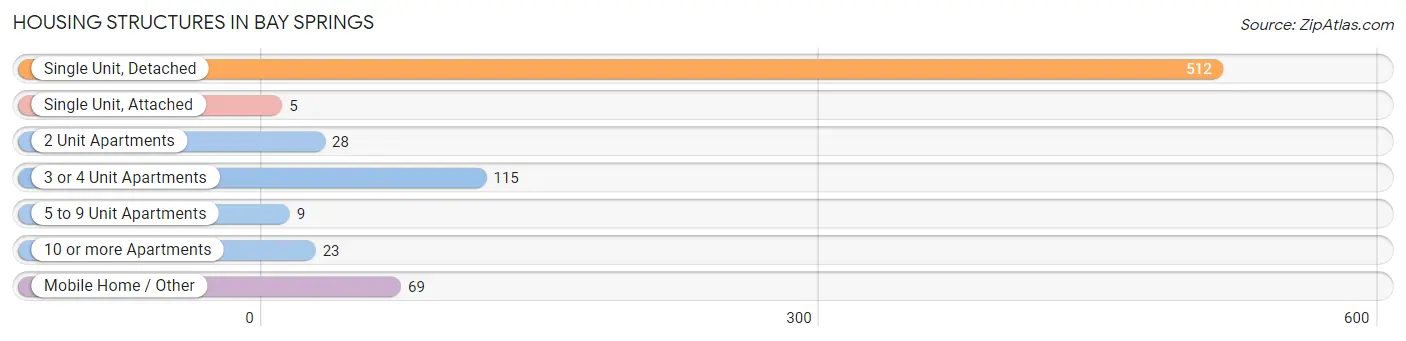
| Structure Type | # Housing Units | % Housing Units |
| Single Unit, Detached | 512 | 67.3% |
| Single Unit, Attached | 5 | 0.7% |
| 2 Unit Apartments | 28 | 3.7% |
| 3 or 4 Unit Apartments | 115 | 15.1% |
| 5 to 9 Unit Apartments | 9 | 1.2% |
| 10 or more Apartments | 23 | 3.0% |
| Mobile Home / Other | 69 | 9.1% |
| Total | 761 | 100.0% |
Housing Structures by Occupancy in Bay Springs
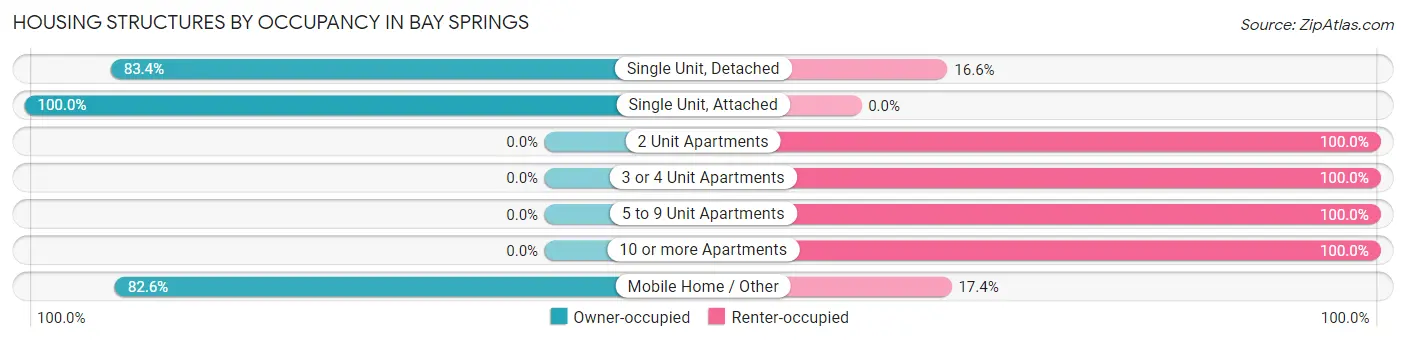
| Structure Type | Owner-occupied | Renter-occupied |
| Single Unit, Detached | 427 (83.4%) | 85 (16.6%) |
| Single Unit, Attached | 5 (100.0%) | 0 (0.0%) |
| 2 Unit Apartments | 0 (0.0%) | 28 (100.0%) |
| 3 or 4 Unit Apartments | 0 (0.0%) | 115 (100.0%) |
| 5 to 9 Unit Apartments | 0 (0.0%) | 9 (100.0%) |
| 10 or more Apartments | 0 (0.0%) | 23 (100.0%) |
| Mobile Home / Other | 57 (82.6%) | 12 (17.4%) |
| Total | 489 (64.3%) | 272 (35.7%) |
Housing Structures by Number of Rooms in Bay Springs
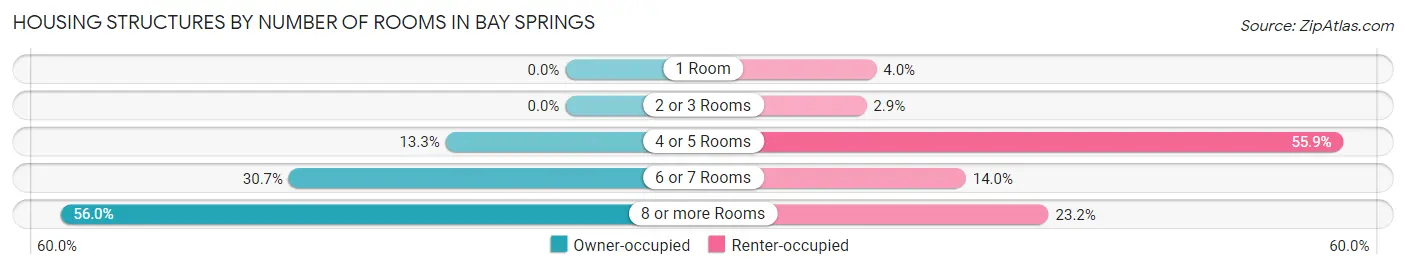
| Number of Rooms | Owner-occupied | Renter-occupied |
| 1 Room | 0 (0.0%) | 11 (4.0%) |
| 2 or 3 Rooms | 0 (0.0%) | 8 (2.9%) |
| 4 or 5 Rooms | 65 (13.3%) | 152 (55.9%) |
| 6 or 7 Rooms | 150 (30.7%) | 38 (14.0%) |
| 8 or more Rooms | 274 (56.0%) | 63 (23.2%) |
| Total | 489 (100.0%) | 272 (100.0%) |
Housing Structure by Heating Type in Bay Springs
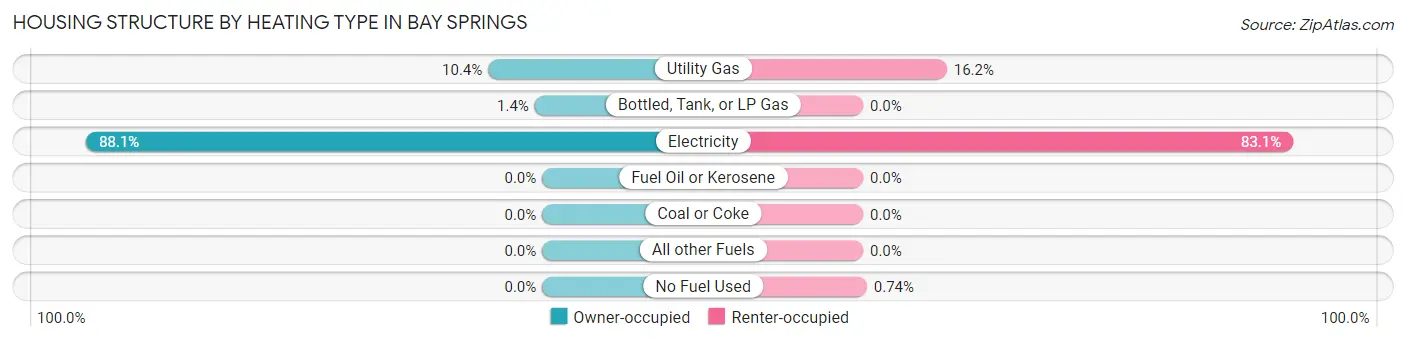
| Heating Type | Owner-occupied | Renter-occupied |
| Utility Gas | 51 (10.4%) | 44 (16.2%) |
| Bottled, Tank, or LP Gas | 7 (1.4%) | 0 (0.0%) |
| Electricity | 431 (88.1%) | 226 (83.1%) |
| Fuel Oil or Kerosene | 0 (0.0%) | 0 (0.0%) |
| Coal or Coke | 0 (0.0%) | 0 (0.0%) |
| All other Fuels | 0 (0.0%) | 0 (0.0%) |
| No Fuel Used | 0 (0.0%) | 2 (0.7%) |
| Total | 489 (100.0%) | 272 (100.0%) |
Household Vehicle Usage in Bay Springs
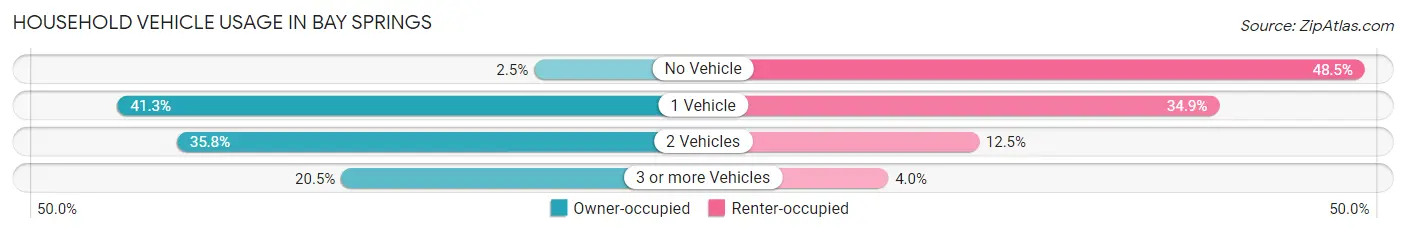
| Vehicles per Household | Owner-occupied | Renter-occupied |
| No Vehicle | 12 (2.5%) | 132 (48.5%) |
| 1 Vehicle | 202 (41.3%) | 95 (34.9%) |
| 2 Vehicles | 175 (35.8%) | 34 (12.5%) |
| 3 or more Vehicles | 100 (20.4%) | 11 (4.0%) |
| Total | 489 (100.0%) | 272 (100.0%) |
Real Estate & Mortgages in Bay Springs
Real Estate and Mortgage Overview in Bay Springs
| Characteristic | Without Mortgage | With Mortgage |
| Housing Units | 331 | 158 |
| Median Property Value | $129,300 | $227,400 |
| Median Household Income | $49,507 | $8 |
| Monthly Housing Costs | $304 | $0 |
| Real Estate Taxes | $806 | $54 |
Property Value by Mortgage Status in Bay Springs
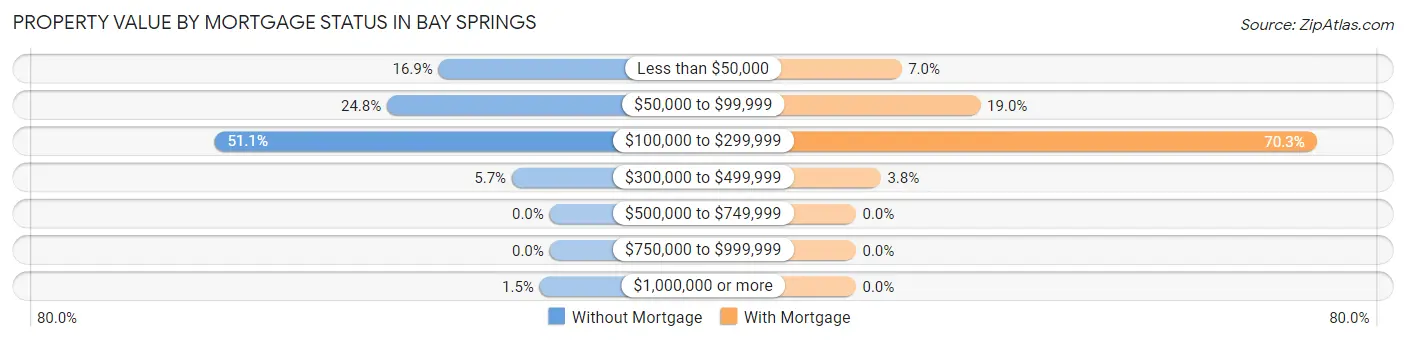
| Property Value | Without Mortgage | With Mortgage |
| Less than $50,000 | 56 (16.9%) | 11 (7.0%) |
| $50,000 to $99,999 | 82 (24.8%) | 30 (19.0%) |
| $100,000 to $299,999 | 169 (51.1%) | 111 (70.3%) |
| $300,000 to $499,999 | 19 (5.7%) | 6 (3.8%) |
| $500,000 to $749,999 | 0 (0.0%) | 0 (0.0%) |
| $750,000 to $999,999 | 0 (0.0%) | 0 (0.0%) |
| $1,000,000 or more | 5 (1.5%) | 0 (0.0%) |
| Total | 331 (100.0%) | 158 (100.0%) |
Household Income by Mortgage Status in Bay Springs
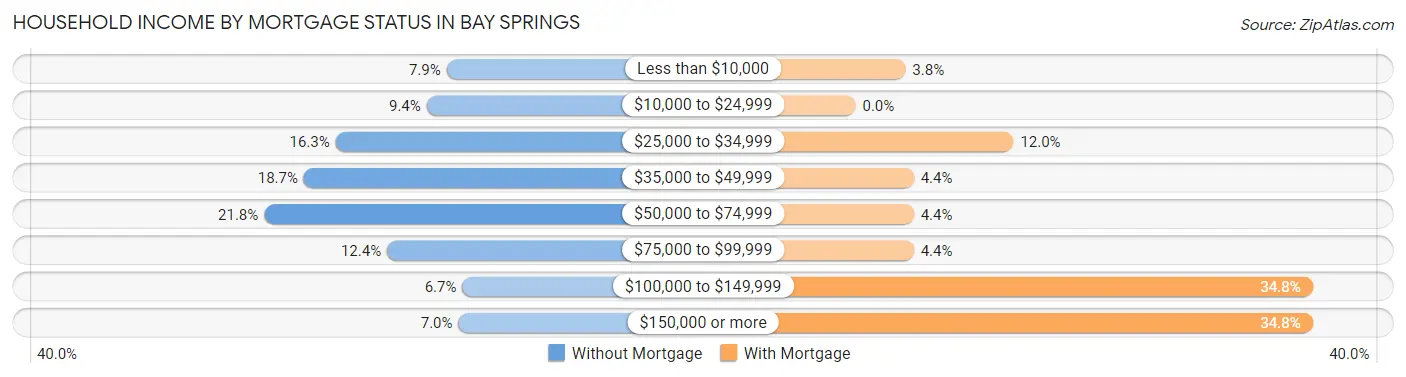
| Household Income | Without Mortgage | With Mortgage |
| Less than $10,000 | 26 (7.9%) | 6 (3.8%) |
| $10,000 to $24,999 | 31 (9.4%) | 0 (0.0%) |
| $25,000 to $34,999 | 54 (16.3%) | 19 (12.0%) |
| $35,000 to $49,999 | 62 (18.7%) | 7 (4.4%) |
| $50,000 to $74,999 | 72 (21.7%) | 7 (4.4%) |
| $75,000 to $99,999 | 41 (12.4%) | 7 (4.4%) |
| $100,000 to $149,999 | 22 (6.7%) | 55 (34.8%) |
| $150,000 or more | 23 (7.0%) | 55 (34.8%) |
| Total | 331 (100.0%) | 158 (100.0%) |
Property Value to Household Income Ratio in Bay Springs
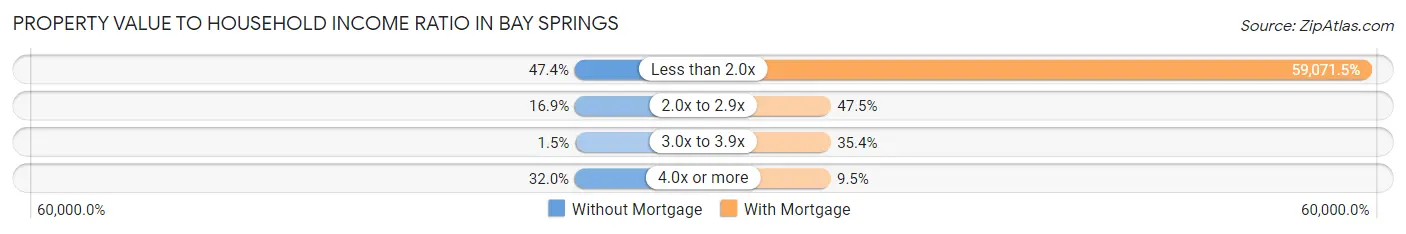
| Value-to-Income Ratio | Without Mortgage | With Mortgage |
| Less than 2.0x | 157 (47.4%) | 93,333 (59,071.5%) |
| 2.0x to 2.9x | 56 (16.9%) | 75 (47.5%) |
| 3.0x to 3.9x | 5 (1.5%) | 56 (35.4%) |
| 4.0x or more | 106 (32.0%) | 15 (9.5%) |
| Total | 331 (100.0%) | 158 (100.0%) |
Real Estate Taxes by Mortgage Status in Bay Springs
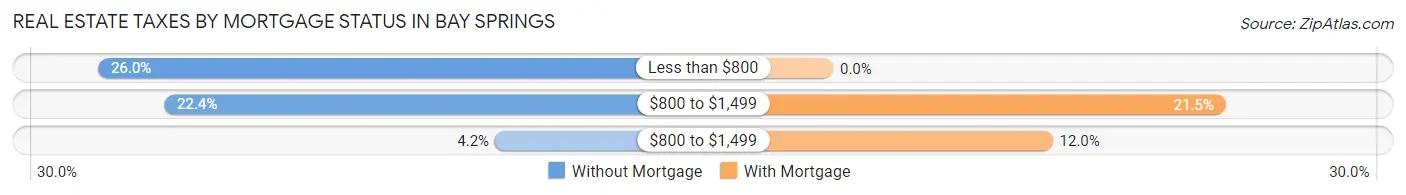
| Property Taxes | Without Mortgage | With Mortgage |
| Less than $800 | 86 (26.0%) | 0 (0.0%) |
| $800 to $1,499 | 74 (22.4%) | 34 (21.5%) |
| $800 to $1,499 | 14 (4.2%) | 19 (12.0%) |
| Total | 331 (100.0%) | 158 (100.0%) |
Health & Disability in Bay Springs
Health Insurance Coverage by Age in Bay Springs
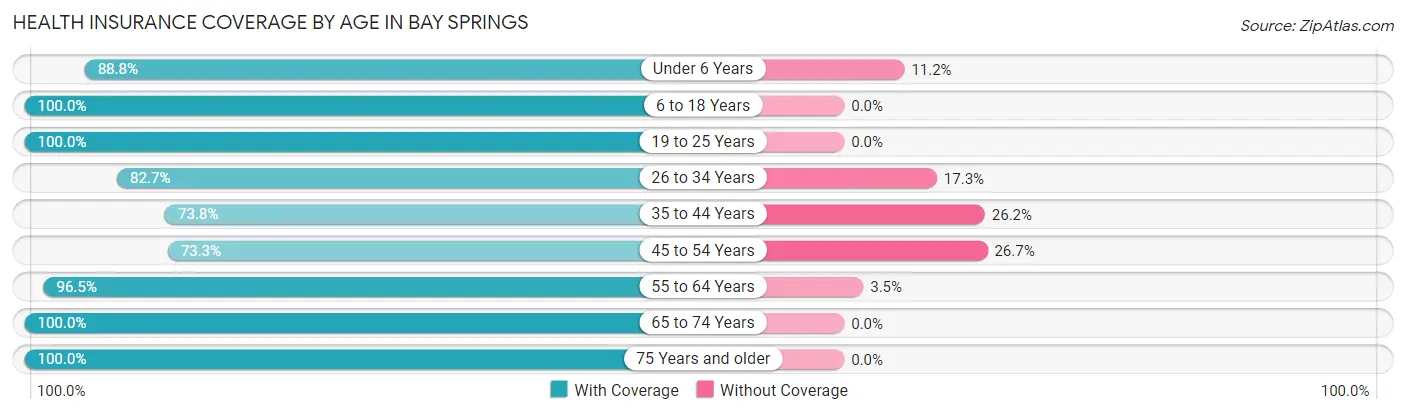
| Age Bracket | With Coverage | Without Coverage |
| Under 6 Years | 87 (88.8%) | 11 (11.2%) |
| 6 to 18 Years | 292 (100.0%) | 0 (0.0%) |
| 19 to 25 Years | 116 (100.0%) | 0 (0.0%) |
| 26 to 34 Years | 206 (82.7%) | 43 (17.3%) |
| 35 to 44 Years | 107 (73.8%) | 38 (26.2%) |
| 45 to 54 Years | 162 (73.3%) | 59 (26.7%) |
| 55 to 64 Years | 245 (96.5%) | 9 (3.5%) |
| 65 to 74 Years | 114 (100.0%) | 0 (0.0%) |
| 75 Years and older | 246 (100.0%) | 0 (0.0%) |
| Total | 1,575 (90.8%) | 160 (9.2%) |
Health Insurance Coverage by Citizenship Status in Bay Springs
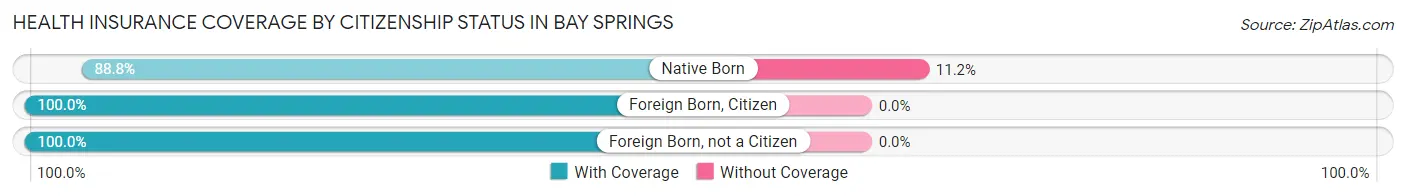
| Citizenship Status | With Coverage | Without Coverage |
| Native Born | 87 (88.8%) | 11 (11.2%) |
| Foreign Born, Citizen | 292 (100.0%) | 0 (0.0%) |
| Foreign Born, not a Citizen | 116 (100.0%) | 0 (0.0%) |
Health Insurance Coverage by Household Income in Bay Springs
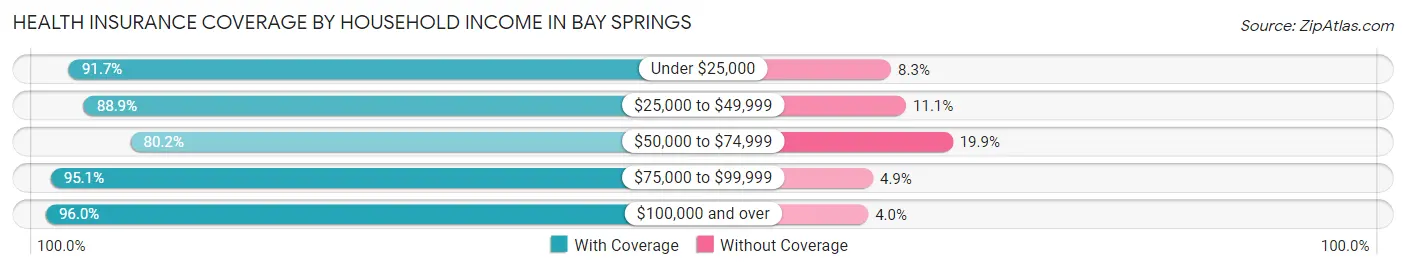
| Household Income | With Coverage | Without Coverage |
| Under $25,000 | 408 (91.7%) | 37 (8.3%) |
| $25,000 to $49,999 | 288 (88.9%) | 36 (11.1%) |
| $50,000 to $74,999 | 218 (80.1%) | 54 (19.9%) |
| $75,000 to $99,999 | 309 (95.1%) | 16 (4.9%) |
| $100,000 and over | 335 (96.0%) | 14 (4.0%) |
Public vs Private Health Insurance Coverage by Age in Bay Springs
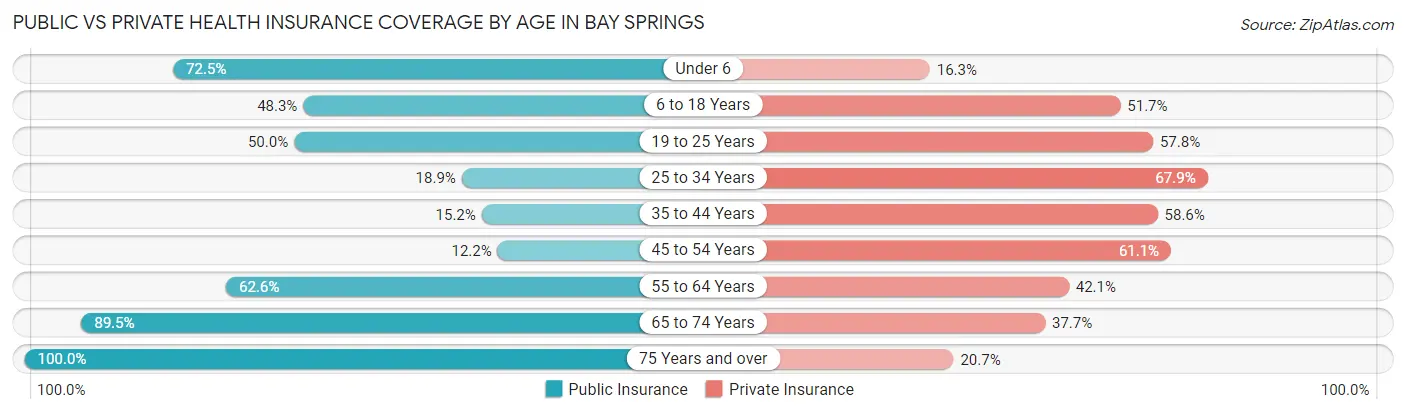
| Age Bracket | Public Insurance | Private Insurance |
| Under 6 | 71 (72.5%) | 16 (16.3%) |
| 6 to 18 Years | 141 (48.3%) | 151 (51.7%) |
| 19 to 25 Years | 58 (50.0%) | 67 (57.8%) |
| 25 to 34 Years | 47 (18.9%) | 169 (67.9%) |
| 35 to 44 Years | 22 (15.2%) | 85 (58.6%) |
| 45 to 54 Years | 27 (12.2%) | 135 (61.1%) |
| 55 to 64 Years | 159 (62.6%) | 107 (42.1%) |
| 65 to 74 Years | 102 (89.5%) | 43 (37.7%) |
| 75 Years and over | 246 (100.0%) | 51 (20.7%) |
| Total | 873 (50.3%) | 824 (47.5%) |
Disability Status by Sex by Age in Bay Springs
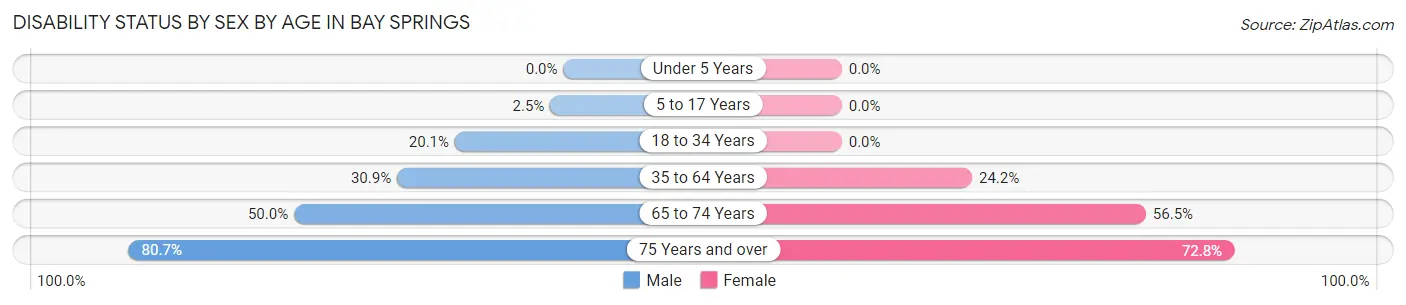
| Age Bracket | Male | Female |
| Under 5 Years | 0 (0.0%) | 0 (0.0%) |
| 5 to 17 Years | 4 (2.5%) | 0 (0.0%) |
| 18 to 34 Years | 28 (20.1%) | 0 (0.0%) |
| 35 to 64 Years | 88 (30.9%) | 81 (24.2%) |
| 65 to 74 Years | 26 (50.0%) | 35 (56.5%) |
| 75 Years and over | 71 (80.7%) | 115 (72.8%) |
Disability Class by Sex by Age in Bay Springs
Disability Class: Hearing Difficulty
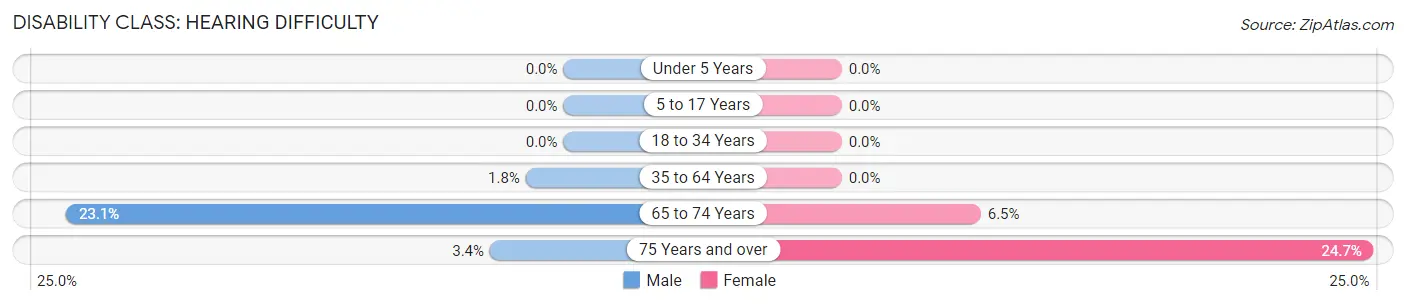
| Age Bracket | Male | Female |
| Under 5 Years | 0 (0.0%) | 0 (0.0%) |
| 5 to 17 Years | 0 (0.0%) | 0 (0.0%) |
| 18 to 34 Years | 0 (0.0%) | 0 (0.0%) |
| 35 to 64 Years | 5 (1.8%) | 0 (0.0%) |
| 65 to 74 Years | 12 (23.1%) | 4 (6.5%) |
| 75 Years and over | 3 (3.4%) | 39 (24.7%) |
Disability Class: Vision Difficulty
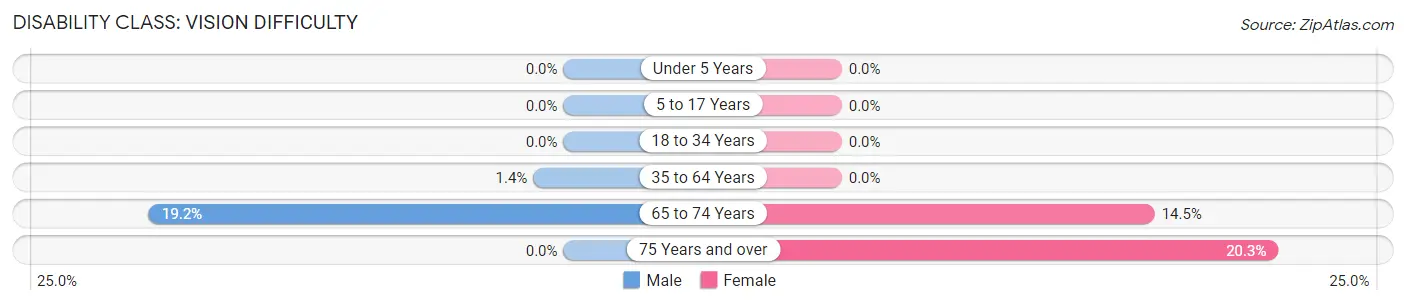
| Age Bracket | Male | Female |
| Under 5 Years | 0 (0.0%) | 0 (0.0%) |
| 5 to 17 Years | 0 (0.0%) | 0 (0.0%) |
| 18 to 34 Years | 0 (0.0%) | 0 (0.0%) |
| 35 to 64 Years | 4 (1.4%) | 0 (0.0%) |
| 65 to 74 Years | 10 (19.2%) | 9 (14.5%) |
| 75 Years and over | 0 (0.0%) | 32 (20.3%) |
Disability Class: Cognitive Difficulty
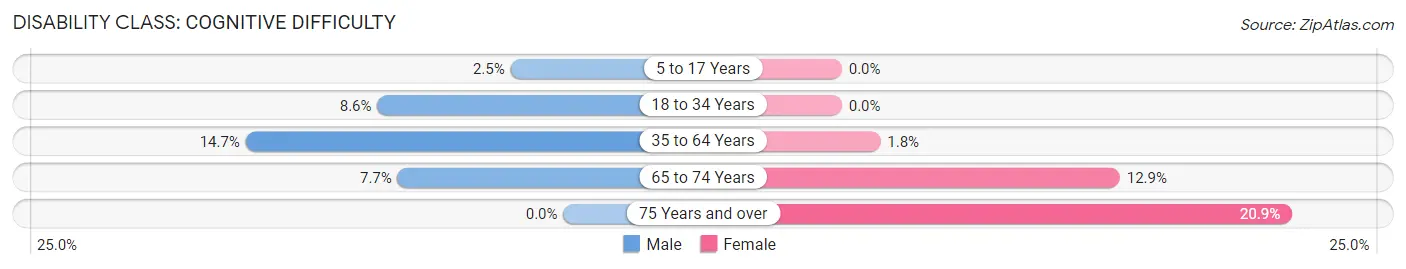
| Age Bracket | Male | Female |
| 5 to 17 Years | 4 (2.5%) | 0 (0.0%) |
| 18 to 34 Years | 12 (8.6%) | 0 (0.0%) |
| 35 to 64 Years | 42 (14.7%) | 6 (1.8%) |
| 65 to 74 Years | 4 (7.7%) | 8 (12.9%) |
| 75 Years and over | 0 (0.0%) | 33 (20.9%) |
Disability Class: Ambulatory Difficulty
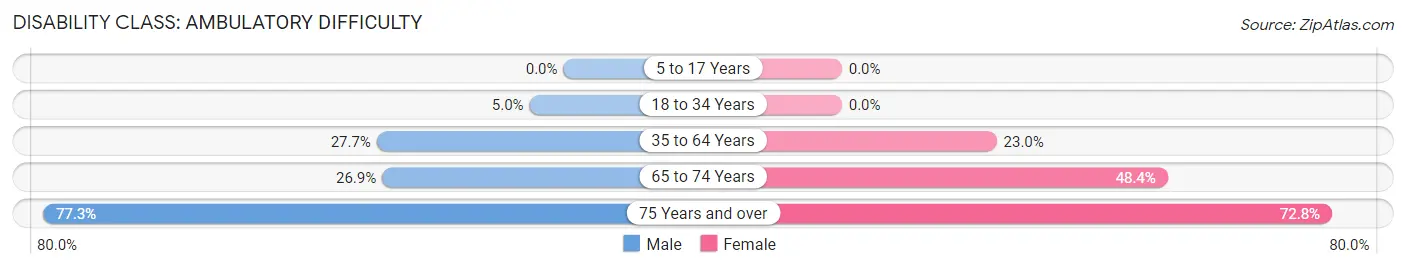
| Age Bracket | Male | Female |
| 5 to 17 Years | 0 (0.0%) | 0 (0.0%) |
| 18 to 34 Years | 7 (5.0%) | 0 (0.0%) |
| 35 to 64 Years | 79 (27.7%) | 77 (23.0%) |
| 65 to 74 Years | 14 (26.9%) | 30 (48.4%) |
| 75 Years and over | 68 (77.3%) | 115 (72.8%) |
Disability Class: Self-Care Difficulty
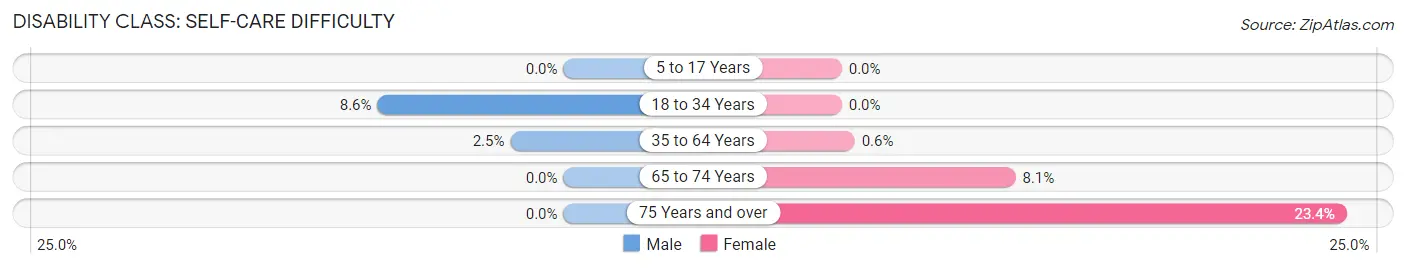
| Age Bracket | Male | Female |
| 5 to 17 Years | 0 (0.0%) | 0 (0.0%) |
| 18 to 34 Years | 12 (8.6%) | 0 (0.0%) |
| 35 to 64 Years | 7 (2.5%) | 2 (0.6%) |
| 65 to 74 Years | 0 (0.0%) | 5 (8.1%) |
| 75 Years and over | 0 (0.0%) | 37 (23.4%) |
Technology Access in Bay Springs
Computing Device Access in Bay Springs
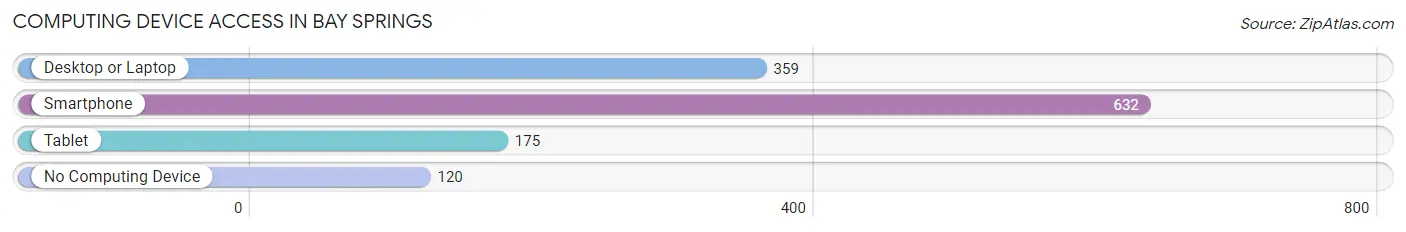
| Device Type | # Households | % Households |
| Desktop or Laptop | 359 | 47.2% |
| Smartphone | 632 | 83.1% |
| Tablet | 175 | 23.0% |
| No Computing Device | 120 | 15.8% |
| Total | 761 | 100.0% |
Internet Access in Bay Springs
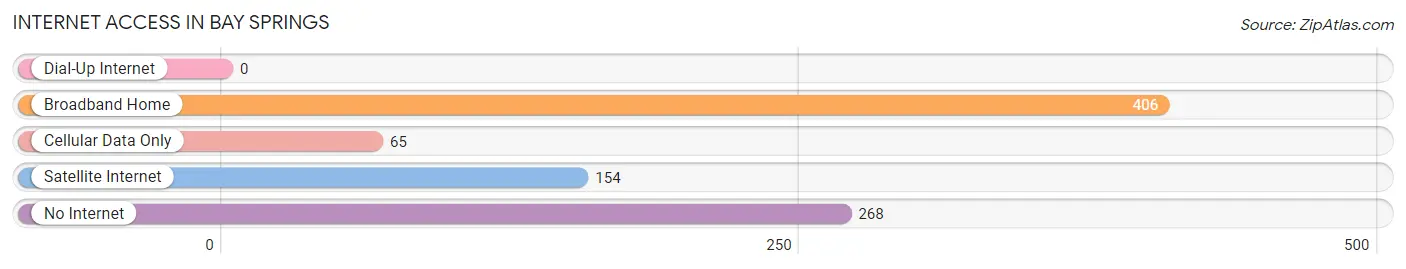
| Internet Type | # Households | % Households |
| Dial-Up Internet | 0 | 0.0% |
| Broadband Home | 406 | 53.3% |
| Cellular Data Only | 65 | 8.5% |
| Satellite Internet | 154 | 20.2% |
| No Internet | 268 | 35.2% |
| Total | 761 | 100.0% |
Bay Springs Summary
History
The town of Bay Springs, Mississippi is located in Jasper County, in the southeastern part of the state. It is situated on the banks of the Pearl River, and is part of the Jackson Metropolitan Statistical Area. The town was founded in 1837, and was originally known as “Bay Spring”. The name was changed to “Bay Springs” in 1845.
The town was originally settled by Native Americans, and was later inhabited by French and Spanish settlers. The town was a major trading post for the Choctaw and Chickasaw tribes, and was a popular destination for travelers. The town was also a major stop on the Natchez Trace, a major trade route in the early 19th century.
The town was an important center of the cotton industry in the 19th century, and was home to several cotton plantations. The town was also home to several churches, including the First Baptist Church of Bay Springs, which was founded in 1845.
The town was also home to several schools, including the Bay Springs Academy, which was founded in 1851. The school was later renamed the Bay Springs High School, and is still in operation today.
The town was also home to several businesses, including a sawmill, a gristmill, and a cotton gin. The town was also home to several banks, including the Bank of Bay Springs, which was founded in 1872.
The town was also home to several newspapers, including the Bay Springs News, which was founded in 1876. The town was also home to several hotels, including the Bay Springs Hotel, which was built in 1877.
The town was also home to several churches, including the First Methodist Church of Bay Springs, which was founded in 1883. The town was also home to several fraternal organizations, including the Masonic Lodge, which was founded in 1885.
The town was also home to several businesses, including a sawmill, a gristmill, and a cotton gin. The town was also home to several banks, including the Bank of Bay Springs, which was founded in 1872.
Geography
Bay Springs is located in the southeastern part of Mississippi, in Jasper County. The town is situated on the banks of the Pearl River, and is part of the Jackson Metropolitan Statistical Area. The town is located approximately 30 miles south of the state capital, Jackson.
The town is located in a rural area, and is surrounded by forests and farmland. The town is located in a humid subtropical climate zone, and has hot, humid summers and mild winters. The average annual temperature is around 70 degrees Fahrenheit.
The town is located near several major highways, including Interstate 20, US Highway 49, and US Highway 80. The town is also located near several major airports, including the Jackson-Evers International Airport, the Hattiesburg-Laurel Regional Airport, and the Gulfport-Biloxi International Airport.
Economy
The economy of Bay Springs is largely based on agriculture and tourism. The town is home to several farms, and is a popular destination for hunters and fishermen. The town is also home to several businesses, including a sawmill, a gristmill, and a cotton gin.
The town is also home to several banks, including the Bank of Bay Springs, which was founded in 1872. The town is also home to several hotels, including the Bay Springs Hotel, which was built in 1877.
The town is also home to several churches, including the First Methodist Church of Bay Springs, which was founded in 1883. The town is also home to several fraternal organizations, including the Masonic Lodge, which was founded in 1885.
Demographics
As of the 2010 census, the population of Bay Springs was 1,845. The town has a total area of 2.2 square miles, and a population density of 830 people per square mile. The median household income in the town is $30,000, and the median age is 37.
The town is predominantly white, with a population that is 97.3% white, 0.7% African American, 0.2% Native American, 0.2% Asian, and 0.6% from other races. The town is also home to a large Hispanic population, with a population that is 8.3% Hispanic or Latino.
The town is also home to several churches, including the First Baptist Church of Bay Springs, which was founded in 1845. The town is also home to several schools, including the Bay Springs High School, which was founded in 1851.
Common Questions
What is Per Capita Income in Bay Springs?
Per Capita income in Bay Springs is $26,481.
What is the Median Family Income in Bay Springs?
Median Family Income in Bay Springs is $79,375.
What is the Median Household income in Bay Springs?
Median Household Income in Bay Springs is $48,031.
What is Income or Wage Gap in Bay Springs?
Income or Wage Gap in Bay Springs is 12.9%.
Women in Bay Springs earn 87.1 cents for every dollar earned by a man.
What is Inequality or Gini Index in Bay Springs?
Inequality or Gini Index in Bay Springs is 0.46.
What is the Total Population of Bay Springs?
Total Population of Bay Springs is 1,789.
What is the Total Male Population of Bay Springs?
Total Male Population of Bay Springs is 805.
What is the Total Female Population of Bay Springs?
Total Female Population of Bay Springs is 984.
What is the Ratio of Males per 100 Females in Bay Springs?
There are 81.81 Males per 100 Females in Bay Springs.
What is the Ratio of Females per 100 Males in Bay Springs?
There are 122.24 Females per 100 Males in Bay Springs.
What is the Median Population Age in Bay Springs?
Median Population Age in Bay Springs is 42.5 Years.
What is the Average Family Size in Bay Springs
Average Family Size in Bay Springs is 3.0 People.
What is the Average Household Size in Bay Springs
Average Household Size in Bay Springs is 2.2 People.
How Large is the Labor Force in Bay Springs?
There are 668 People in the Labor Forcein in Bay Springs.
What is the Percentage of People in the Labor Force in Bay Springs?
46.8% of People are in the Labor Force in Bay Springs.
What is the Unemployment Rate in Bay Springs?
Unemployment Rate in Bay Springs is 2.5%.