Shuqualak, MS Map & Demographics
Shuqualak Map
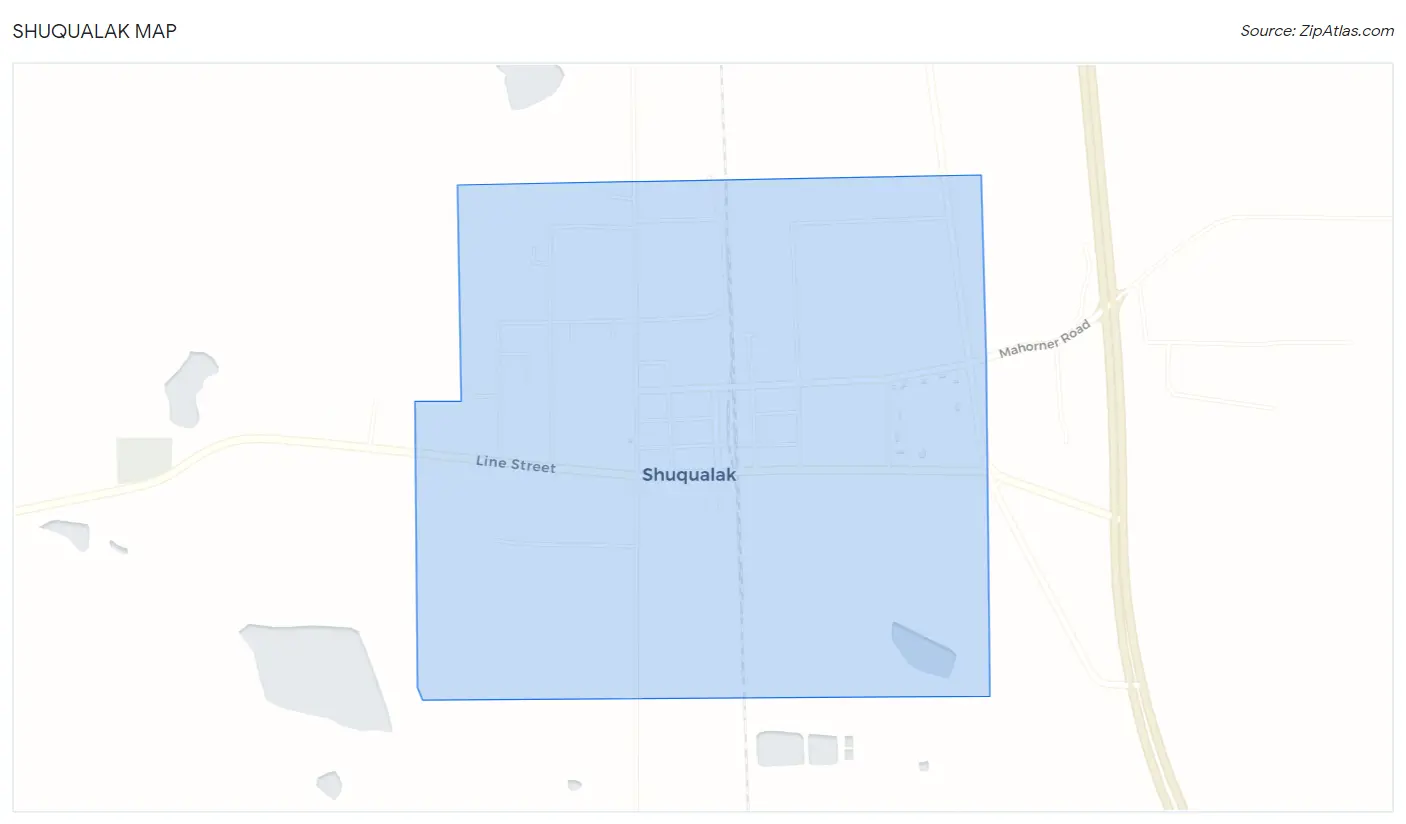
Shuqualak Overview
$18,232
PER CAPITA INCOME
$62,708
AVG FAMILY INCOME
$35,625
AVG HOUSEHOLD INCOME
25.5%
WAGE / INCOME GAP [ % ]
74.5¢/ $1
WAGE / INCOME GAP [ $ ]
$16,081
FAMILY INCOME DEFICIT
0.46
INEQUALITY / GINI INDEX
354
TOTAL POPULATION
148
MALE POPULATION
206
FEMALE POPULATION
71.84
MALES / 100 FEMALES
139.19
FEMALES / 100 MALES
34.2
MEDIAN AGE
4.2
AVG FAMILY SIZE
2.9
AVG HOUSEHOLD SIZE
152
LABOR FORCE [ PEOPLE ]
59.6%
PERCENT IN LABOR FORCE
10.5%
UNEMPLOYMENT RATE
Shuqualak Zip Codes
Shuqualak Area Codes
Income in Shuqualak
Income Overview in Shuqualak
Per Capita Income in Shuqualak is $18,232, while median incomes of families and households are $62,708 and $35,625 respectively.
| Characteristic | Number | Measure |
| Per Capita Income | 354 | $18,232 |
| Median Family Income | 73 | $62,708 |
| Mean Family Income | 73 | $55,525 |
| Median Household Income | 121 | $35,625 |
| Mean Household Income | 121 | $46,310 |
| Income Deficit | 73 | $16,081 |
| Wage / Income Gap (%) | 354 | 25.52% |
| Wage / Income Gap ($) | 354 | 74.48¢ per $1 |
| Gini / Inequality Index | 354 | 0.46 |
Earnings by Sex in Shuqualak
Average Earnings in Shuqualak are $31,394, $41,250 for men and $30,721 for women, a difference of 25.5%.
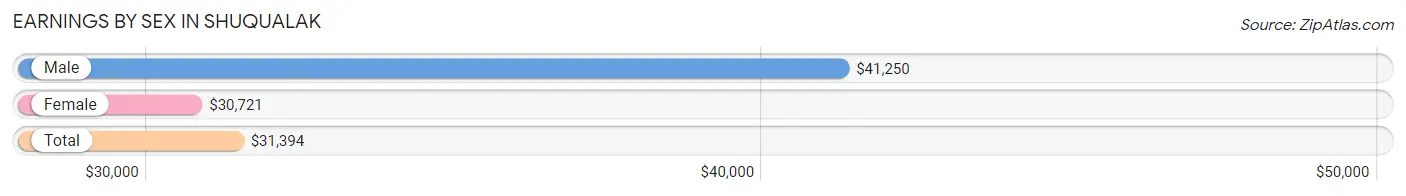
| Sex | Number | Average Earnings |
| Male | 48 (31.0%) | $41,250 |
| Female | 107 (69.0%) | $30,721 |
| Total | 155 (100.0%) | $31,394 |
Earnings by Sex by Income Bracket in Shuqualak
The most common earnings brackets in Shuqualak are $15,000 to $17,499 for men (9 | 18.8%) and $30,000 to $34,999 for women (31 | 29.0%).
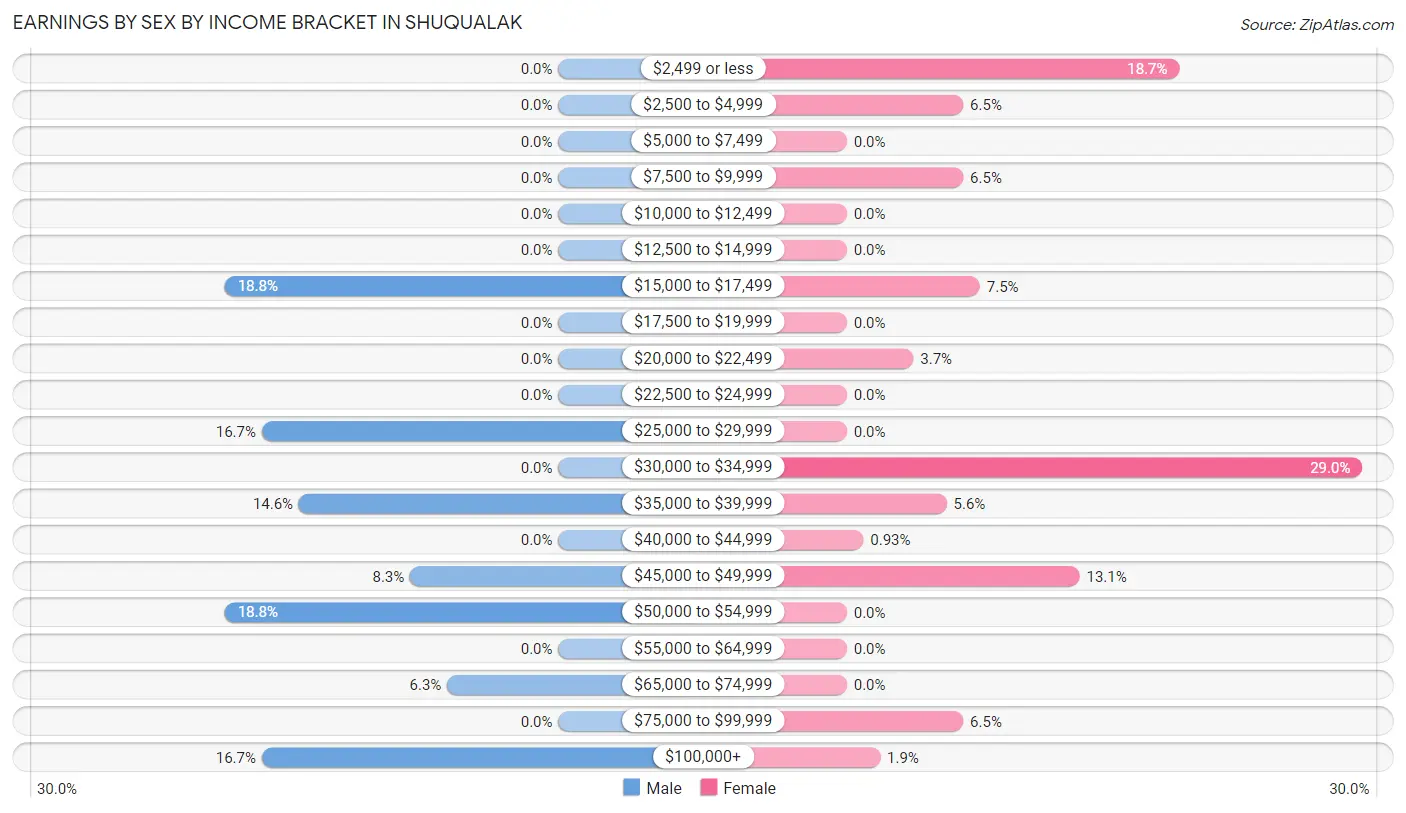
| Income | Male | Female |
| $2,499 or less | 0 (0.0%) | 20 (18.7%) |
| $2,500 to $4,999 | 0 (0.0%) | 7 (6.5%) |
| $5,000 to $7,499 | 0 (0.0%) | 0 (0.0%) |
| $7,500 to $9,999 | 0 (0.0%) | 7 (6.5%) |
| $10,000 to $12,499 | 0 (0.0%) | 0 (0.0%) |
| $12,500 to $14,999 | 0 (0.0%) | 0 (0.0%) |
| $15,000 to $17,499 | 9 (18.8%) | 8 (7.5%) |
| $17,500 to $19,999 | 0 (0.0%) | 0 (0.0%) |
| $20,000 to $22,499 | 0 (0.0%) | 4 (3.7%) |
| $22,500 to $24,999 | 0 (0.0%) | 0 (0.0%) |
| $25,000 to $29,999 | 8 (16.7%) | 0 (0.0%) |
| $30,000 to $34,999 | 0 (0.0%) | 31 (29.0%) |
| $35,000 to $39,999 | 7 (14.6%) | 6 (5.6%) |
| $40,000 to $44,999 | 0 (0.0%) | 1 (0.9%) |
| $45,000 to $49,999 | 4 (8.3%) | 14 (13.1%) |
| $50,000 to $54,999 | 9 (18.8%) | 0 (0.0%) |
| $55,000 to $64,999 | 0 (0.0%) | 0 (0.0%) |
| $65,000 to $74,999 | 3 (6.2%) | 0 (0.0%) |
| $75,000 to $99,999 | 0 (0.0%) | 7 (6.5%) |
| $100,000+ | 8 (16.7%) | 2 (1.9%) |
| Total | 48 (100.0%) | 107 (100.0%) |
Earnings by Sex by Educational Attainment in Shuqualak
Average earnings in Shuqualak are $46,875 for men and $30,673 for women, a difference of 34.6%. Men with an educational attainment of high school diploma enjoy the highest average annual earnings of $53,194, while those with high school diploma education earn the least with $53,194. Women with an educational attainment of bachelor's degree earn the most with the average annual earnings of $36,875, while those with high school diploma education have the smallest earnings of $2,499.
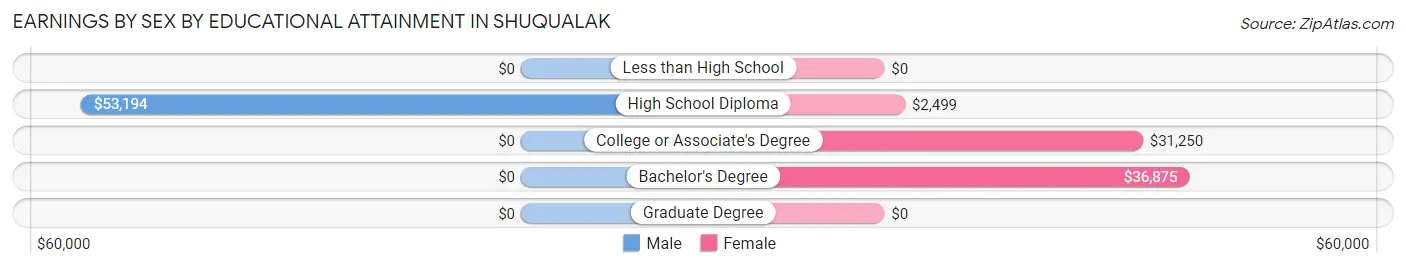
| Educational Attainment | Male Income | Female Income |
| Less than High School | - | - |
| High School Diploma | $53,194 | $2,499 |
| College or Associate's Degree | - | - |
| Bachelor's Degree | - | - |
| Graduate Degree | - | - |
| Total | $46,875 | $30,673 |
Family Income in Shuqualak
Family Income Brackets in Shuqualak
According to the Shuqualak family income data, there are 24 families falling into the $75,000 to $99,999 income range, which is the most common income bracket and makes up 32.9% of all families.
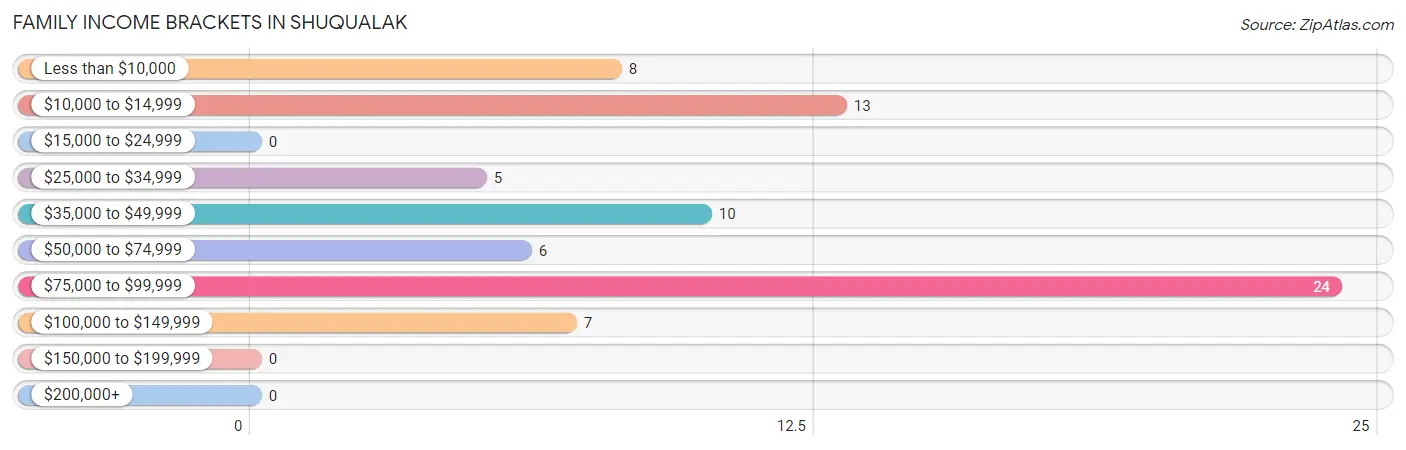
| Income Bracket | # Families | % Families |
| Less than $10,000 | 8 | 11.0% |
| $10,000 to $14,999 | 13 | 17.8% |
| $15,000 to $24,999 | 0 | 0.0% |
| $25,000 to $34,999 | 5 | 6.8% |
| $35,000 to $49,999 | 10 | 13.7% |
| $50,000 to $74,999 | 6 | 8.2% |
| $75,000 to $99,999 | 24 | 32.9% |
| $100,000 to $149,999 | 7 | 9.6% |
| $150,000 to $199,999 | 0 | 0.0% |
| $200,000+ | 0 | 0.0% |
Family Income by Famaliy Size in Shuqualak
2-person families (22 | 30.1%) account for the highest median family income in Shuqualak with $86,786 per family, while 2-person families (22 | 30.1%) have the highest median income of $43,393 per family member.
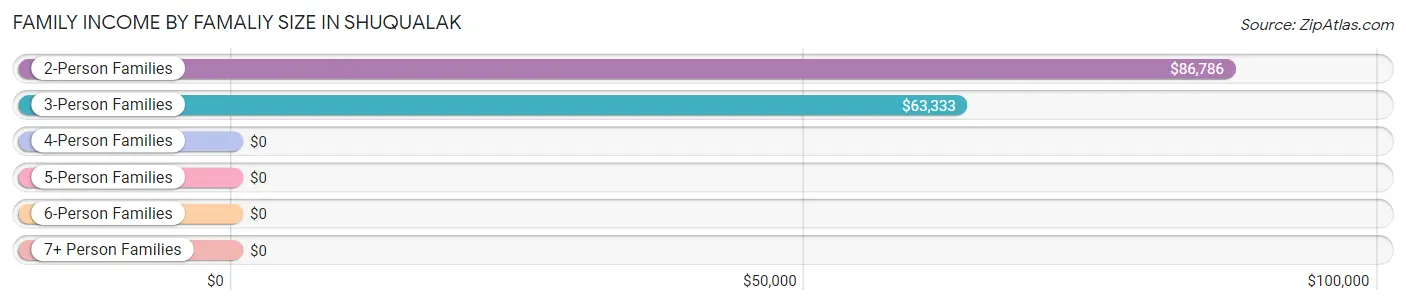
| Income Bracket | # Families | Median Income |
| 2-Person Families | 22 (30.1%) | $86,786 |
| 3-Person Families | 22 (30.1%) | $63,333 |
| 4-Person Families | 22 (30.1%) | $0 |
| 5-Person Families | 7 (9.6%) | $0 |
| 6-Person Families | 0 (0.0%) | $0 |
| 7+ Person Families | 0 (0.0%) | $0 |
| Total | 73 (100.0%) | $62,708 |
Family Income by Number of Earners in Shuqualak
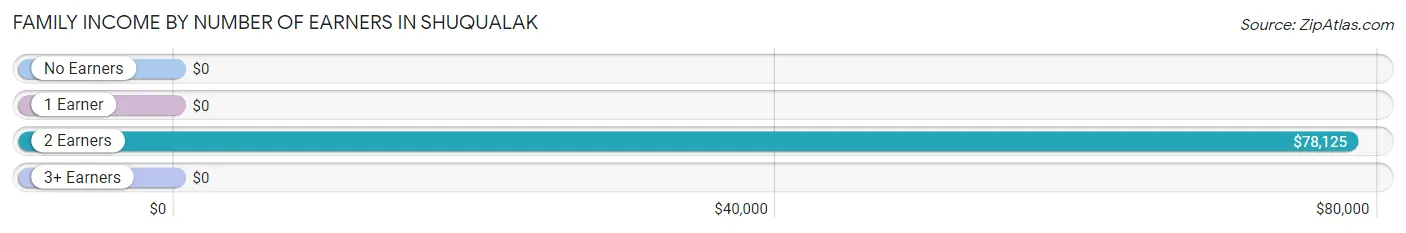
| Number of Earners | # Families | Median Income |
| No Earners | 10 (13.7%) | $0 |
| 1 Earner | 33 (45.2%) | $0 |
| 2 Earners | 30 (41.1%) | $78,125 |
| 3+ Earners | 0 (0.0%) | $0 |
| Total | 73 (100.0%) | $62,708 |
Household Income in Shuqualak
Household Income Brackets in Shuqualak
With 30 households falling in the category, the $10,000 to $14,999 income range is the most frequent in Shuqualak, accounting for 24.8% of all households.
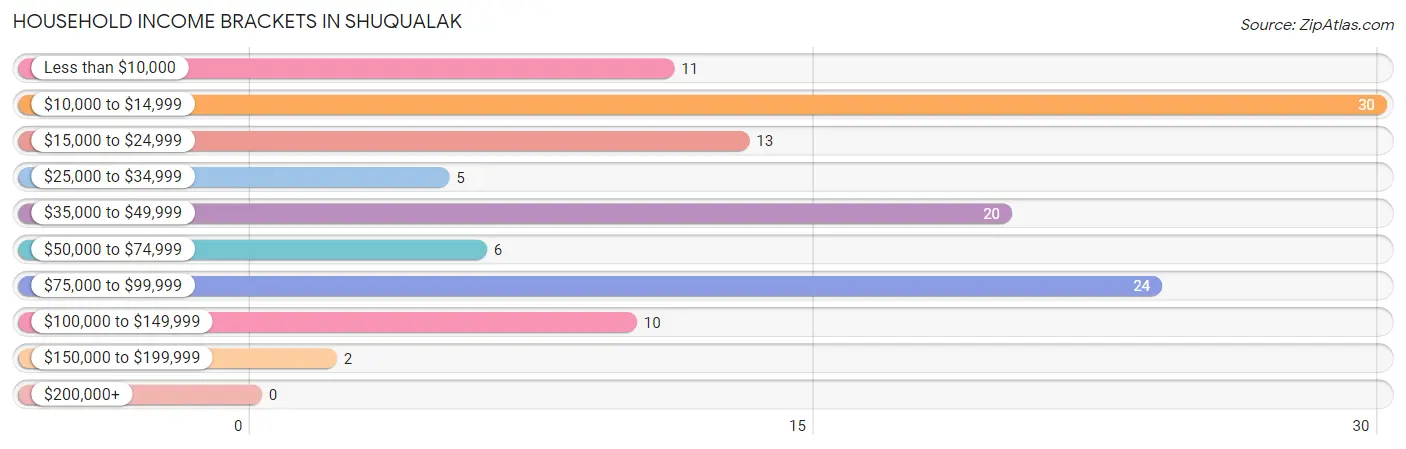
| Income Bracket | # Households | % Households |
| Less than $10,000 | 11 | 9.1% |
| $10,000 to $14,999 | 30 | 24.8% |
| $15,000 to $24,999 | 13 | 10.7% |
| $25,000 to $34,999 | 5 | 4.1% |
| $35,000 to $49,999 | 20 | 16.5% |
| $50,000 to $74,999 | 6 | 5.0% |
| $75,000 to $99,999 | 24 | 19.8% |
| $100,000 to $149,999 | 10 | 8.3% |
| $150,000 to $199,999 | 2 | 1.7% |
| $200,000+ | 0 | 0.0% |
Household Income by Householder Age in Shuqualak
The median household income in Shuqualak is $35,625, with the highest median household income of $15,938 found in the 65+ years age bracket for the primary householder. A total of 22 households (18.2%) fall into this category. Meanwhile, the 15 to 24 years age bracket for the primary householder has the lowest median household income of $0, with 3 households (2.5%) in this group.
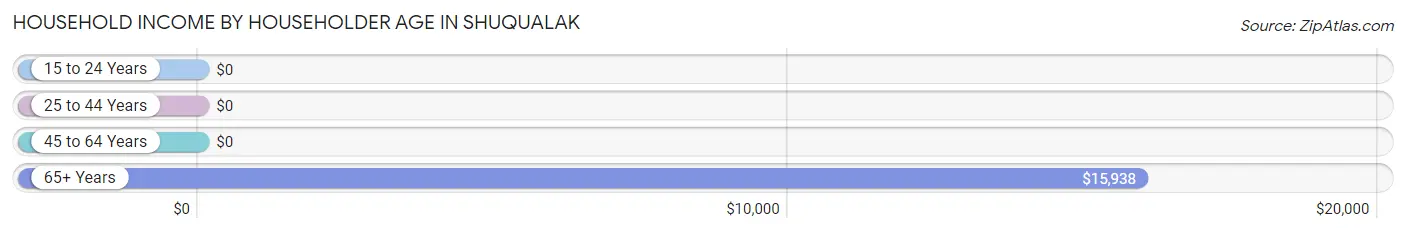
| Income Bracket | # Households | Median Income |
| 15 to 24 Years | 3 (2.5%) | $0 |
| 25 to 44 Years | 45 (37.2%) | $0 |
| 45 to 64 Years | 51 (42.1%) | $0 |
| 65+ Years | 22 (18.2%) | $15,938 |
| Total | 121 (100.0%) | $35,625 |
Poverty in Shuqualak
Income Below Poverty by Sex and Age in Shuqualak
With 29.0% poverty level for males and 39.8% for females among the residents of Shuqualak, 6 to 11 year old males and 16 and 17 year old females are the most vulnerable to poverty, with 11 males (100.0%) and 2 females (100.0%) in their respective age groups living below the poverty level.
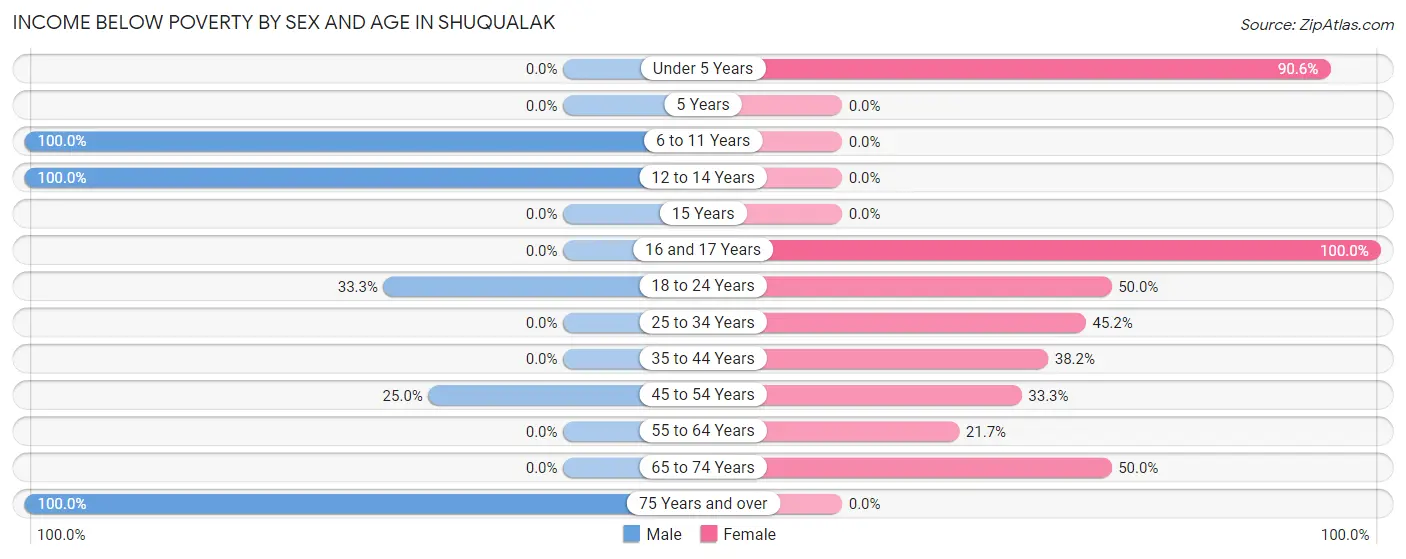
| Age Bracket | Male | Female |
| Under 5 Years | 0 (0.0%) | 29 (90.6%) |
| 5 Years | 0 (0.0%) | 0 (0.0%) |
| 6 to 11 Years | 11 (100.0%) | 0 (0.0%) |
| 12 to 14 Years | 12 (100.0%) | 0 (0.0%) |
| 15 Years | 0 (0.0%) | 0 (0.0%) |
| 16 and 17 Years | 0 (0.0%) | 2 (100.0%) |
| 18 to 24 Years | 10 (33.3%) | 1 (50.0%) |
| 25 to 34 Years | 0 (0.0%) | 19 (45.2%) |
| 35 to 44 Years | 0 (0.0%) | 13 (38.2%) |
| 45 to 54 Years | 5 (25.0%) | 5 (33.3%) |
| 55 to 64 Years | 0 (0.0%) | 10 (21.7%) |
| 65 to 74 Years | 0 (0.0%) | 3 (50.0%) |
| 75 Years and over | 5 (100.0%) | 0 (0.0%) |
| Total | 43 (29.0%) | 82 (39.8%) |
Income Above Poverty by Sex and Age in Shuqualak
According to the poverty statistics in Shuqualak, males aged under 5 years and females aged 6 to 11 years are the age groups that are most secure financially, with 100.0% of males and 100.0% of females in these age groups living above the poverty line.
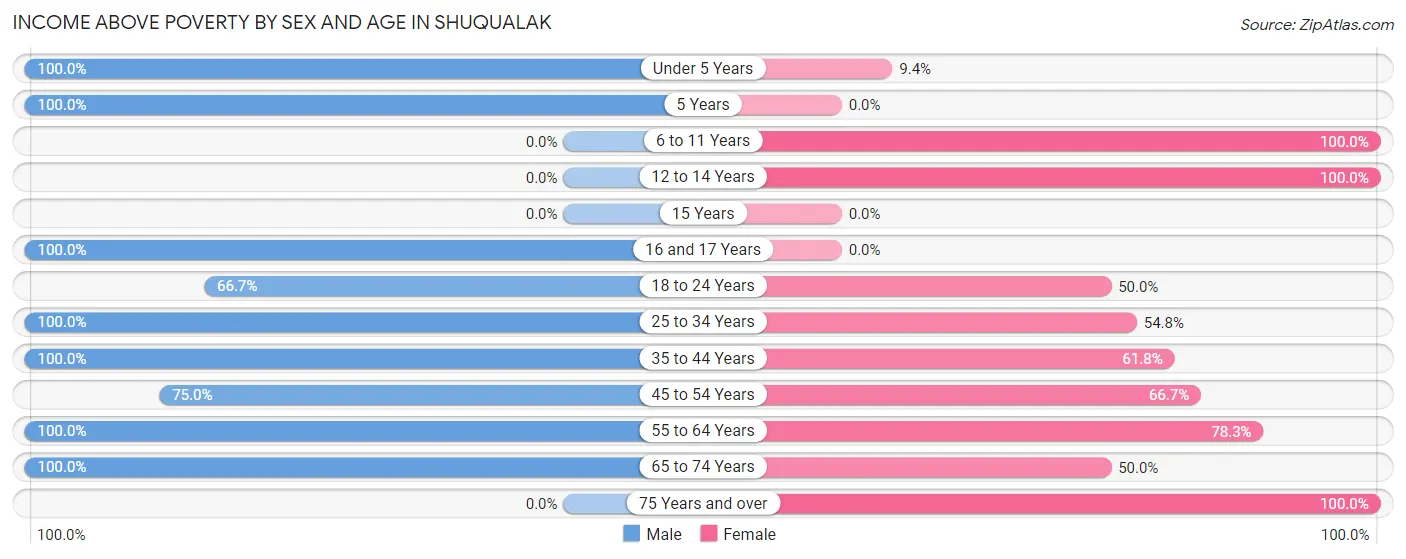
| Age Bracket | Male | Female |
| Under 5 Years | 5 (100.0%) | 3 (9.4%) |
| 5 Years | 23 (100.0%) | 0 (0.0%) |
| 6 to 11 Years | 0 (0.0%) | 8 (100.0%) |
| 12 to 14 Years | 0 (0.0%) | 8 (100.0%) |
| 15 Years | 0 (0.0%) | 0 (0.0%) |
| 16 and 17 Years | 7 (100.0%) | 0 (0.0%) |
| 18 to 24 Years | 20 (66.7%) | 1 (50.0%) |
| 25 to 34 Years | 7 (100.0%) | 23 (54.8%) |
| 35 to 44 Years | 12 (100.0%) | 21 (61.8%) |
| 45 to 54 Years | 15 (75.0%) | 10 (66.7%) |
| 55 to 64 Years | 9 (100.0%) | 36 (78.3%) |
| 65 to 74 Years | 7 (100.0%) | 3 (50.0%) |
| 75 Years and over | 0 (0.0%) | 11 (100.0%) |
| Total | 105 (71.0%) | 124 (60.2%) |
Income Below Poverty Among Married-Couple Families in Shuqualak
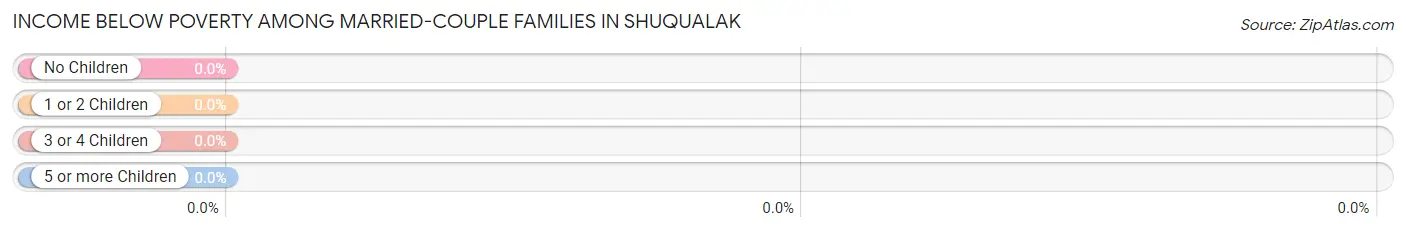
| Children | Above Poverty | Below Poverty |
| No Children | 9 (100.0%) | 0 (0.0%) |
| 1 or 2 Children | 15 (100.0%) | 0 (0.0%) |
| 3 or 4 Children | 0 (0.0%) | 0 (0.0%) |
| 5 or more Children | 0 (0.0%) | 0 (0.0%) |
| Total | 24 (100.0%) | 0 (0.0%) |
Income Below Poverty Among Single-Parent Households in Shuqualak
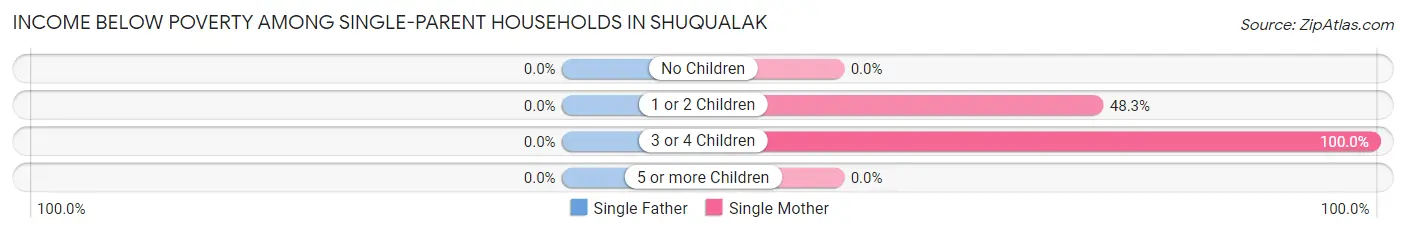
| Children | Single Father | Single Mother |
| No Children | 0 (0.0%) | 0 (0.0%) |
| 1 or 2 Children | 0 (0.0%) | 14 (48.3%) |
| 3 or 4 Children | 0 (0.0%) | 7 (100.0%) |
| 5 or more Children | 0 (0.0%) | 0 (0.0%) |
| Total | 0 (0.0%) | 21 (50.0%) |
Income Below Poverty Among Married-Couple vs Single-Parent Households in Shuqualak
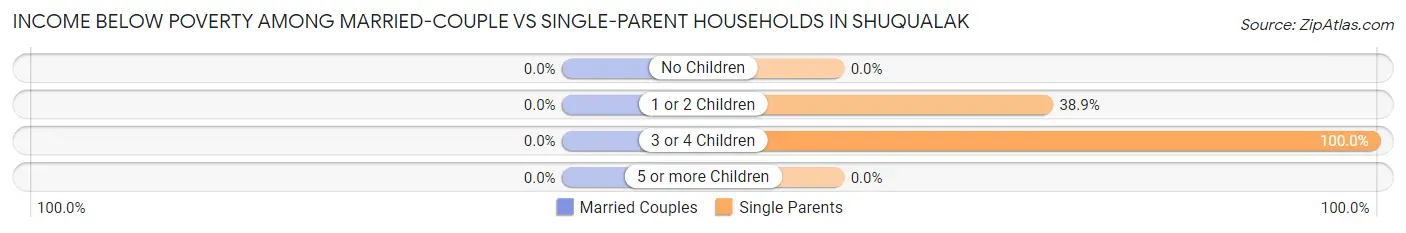
| Children | Married-Couple Families | Single-Parent Households |
| No Children | 0 (0.0%) | 0 (0.0%) |
| 1 or 2 Children | 0 (0.0%) | 14 (38.9%) |
| 3 or 4 Children | 0 (0.0%) | 7 (100.0%) |
| 5 or more Children | 0 (0.0%) | 0 (0.0%) |
| Total | 0 (0.0%) | 21 (42.9%) |
Race in Shuqualak
The most populous races in Shuqualak are Black / African American (316 | 89.3%), and White / Caucasian (38 | 10.7%).
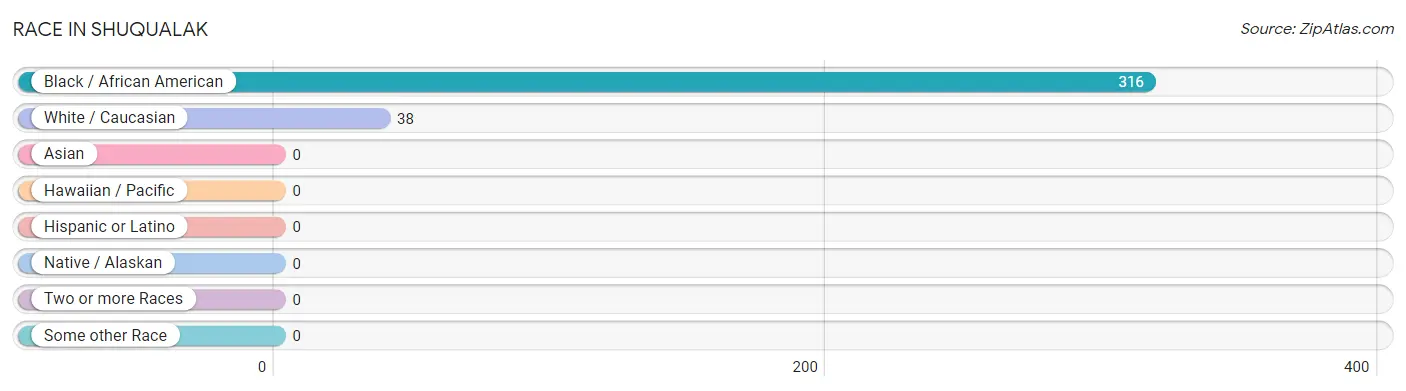
| Race | # Population | % Population |
| Asian | 0 | 0.0% |
| Black / African American | 316 | 89.3% |
| Hawaiian / Pacific | 0 | 0.0% |
| Hispanic or Latino | 0 | 0.0% |
| Native / Alaskan | 0 | 0.0% |
| White / Caucasian | 38 | 10.7% |
| Two or more Races | 0 | 0.0% |
| Some other Race | 0 | 0.0% |
| Total | 354 | 100.0% |
Ancestry in Shuqualak
The most populous ancestries reported in Shuqualak are Scottish (26 | 7.3%), Irish (9 | 2.5%), American (2 | 0.6%), English (1 | 0.3%), and German (1 | 0.3%), together accounting for 11.0% of all Shuqualak residents.
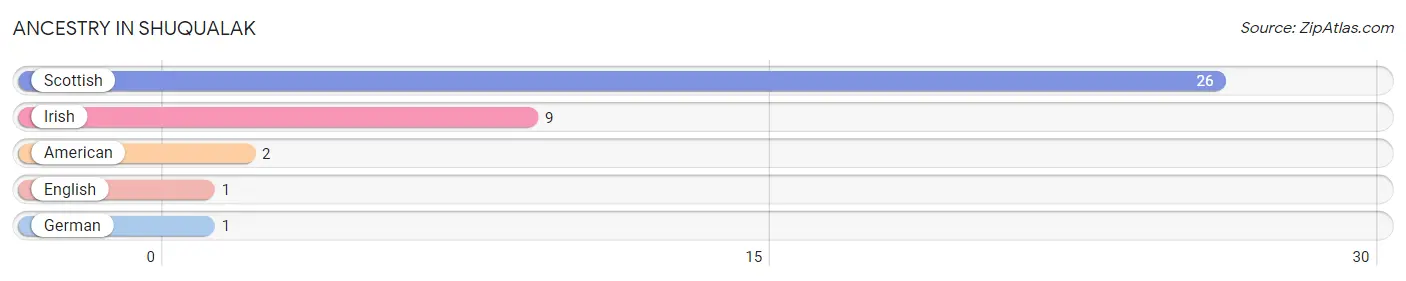
| Ancestry | # Population | % Population |
| American | 2 | 0.6% |
| English | 1 | 0.3% |
| German | 1 | 0.3% |
| Irish | 9 | 2.5% |
| Scottish | 26 | 7.3% | View All 5 Rows |
Immigrants in Shuqualak

| Immigration Origin | # Population | % Population | View All 0 Rows |
Sex and Age in Shuqualak
Sex and Age in Shuqualak
The most populous age groups in Shuqualak are 5 to 9 Years (34 | 23.0%) for men and 55 to 59 Years (39 | 18.9%) for women.
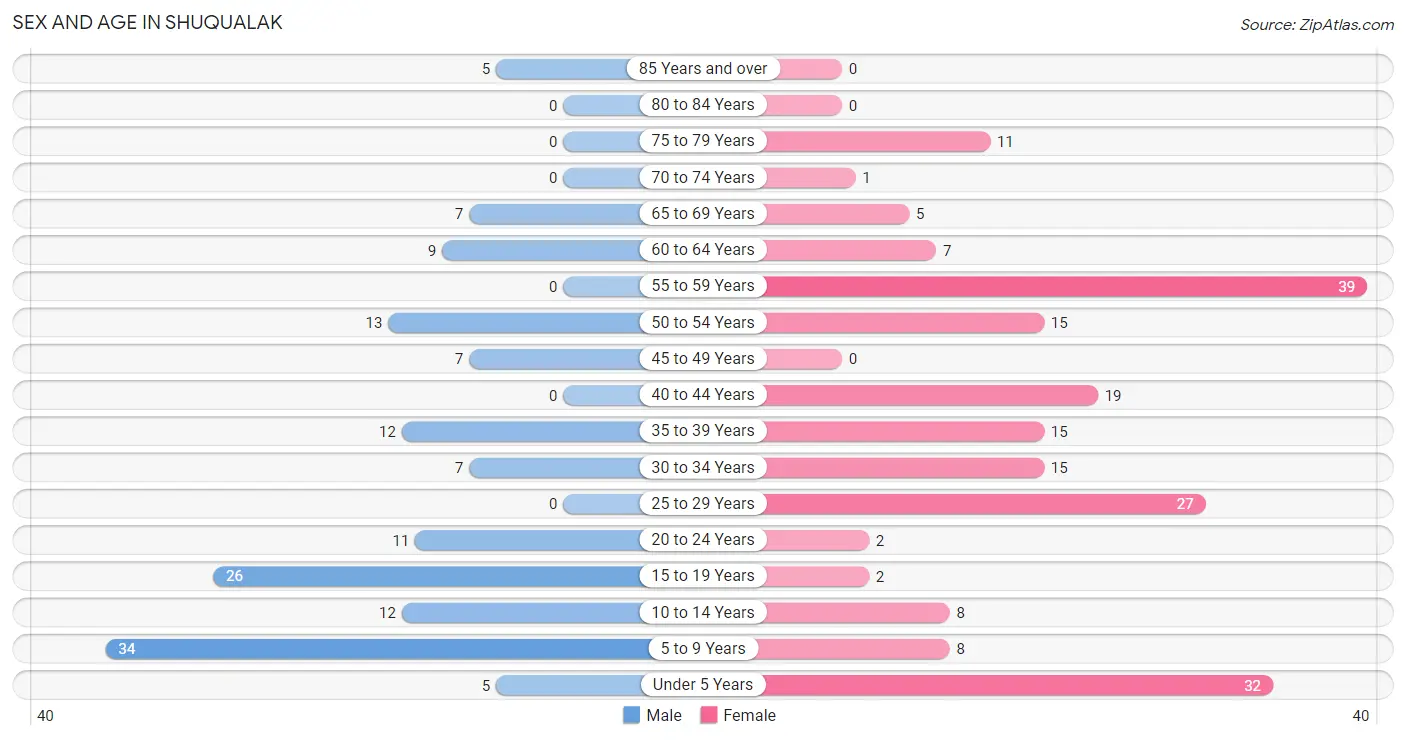
| Age Bracket | Male | Female |
| Under 5 Years | 5 (3.4%) | 32 (15.5%) |
| 5 to 9 Years | 34 (23.0%) | 8 (3.9%) |
| 10 to 14 Years | 12 (8.1%) | 8 (3.9%) |
| 15 to 19 Years | 26 (17.6%) | 2 (1.0%) |
| 20 to 24 Years | 11 (7.4%) | 2 (1.0%) |
| 25 to 29 Years | 0 (0.0%) | 27 (13.1%) |
| 30 to 34 Years | 7 (4.7%) | 15 (7.3%) |
| 35 to 39 Years | 12 (8.1%) | 15 (7.3%) |
| 40 to 44 Years | 0 (0.0%) | 19 (9.2%) |
| 45 to 49 Years | 7 (4.7%) | 0 (0.0%) |
| 50 to 54 Years | 13 (8.8%) | 15 (7.3%) |
| 55 to 59 Years | 0 (0.0%) | 39 (18.9%) |
| 60 to 64 Years | 9 (6.1%) | 7 (3.4%) |
| 65 to 69 Years | 7 (4.7%) | 5 (2.4%) |
| 70 to 74 Years | 0 (0.0%) | 1 (0.5%) |
| 75 to 79 Years | 0 (0.0%) | 11 (5.3%) |
| 80 to 84 Years | 0 (0.0%) | 0 (0.0%) |
| 85 Years and over | 5 (3.4%) | 0 (0.0%) |
| Total | 148 (100.0%) | 206 (100.0%) |
Families and Households in Shuqualak
Median Family Size in Shuqualak
The median family size in Shuqualak is 4.18 persons per family, with single female/mother families (42 | 57.5%) accounting for the largest median family size of 4.64 persons per family. On the other hand, single male/father families (7 | 9.6%) represent the smallest median family size with 2.57 persons per family.
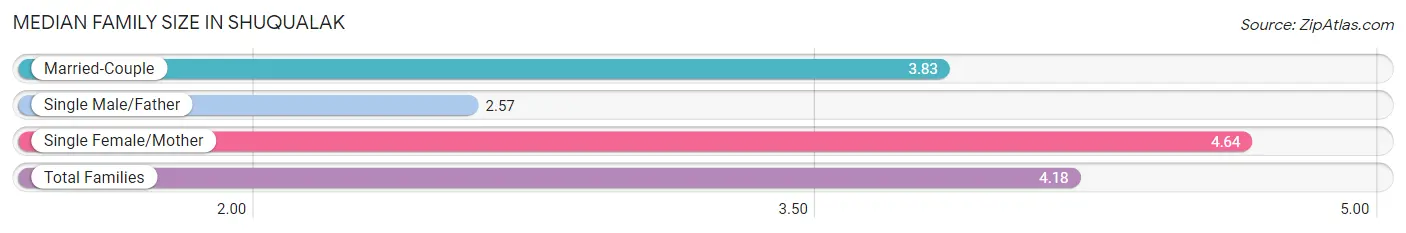
| Family Type | # Families | Family Size |
| Married-Couple | 24 (32.9%) | 3.83 |
| Single Male/Father | 7 (9.6%) | 2.57 |
| Single Female/Mother | 42 (57.5%) | 4.64 |
| Total Families | 73 (100.0%) | 4.18 |
Median Household Size in Shuqualak
The median household size in Shuqualak is 2.93 persons per household, with single female/mother households (42 | 34.7%) accounting for the largest median household size of 4.64 persons per household. non-family households (48 | 39.7%) represent the smallest median household size with 1.02 persons per household.
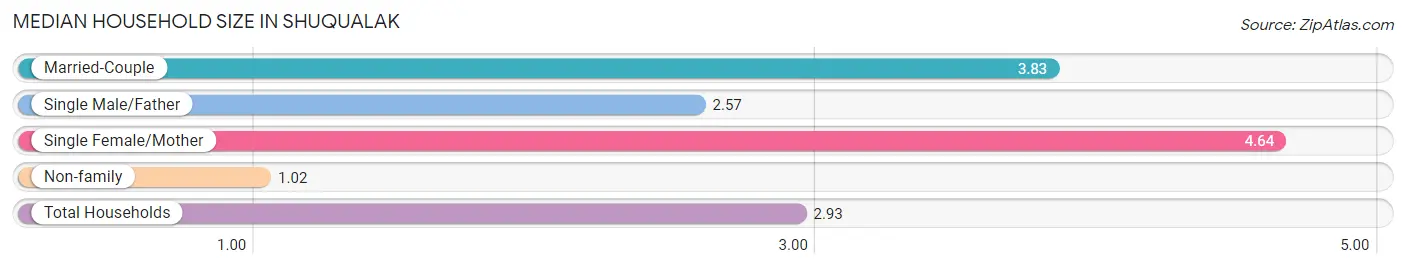
| Household Type | # Households | Household Size |
| Married-Couple | 24 (19.8%) | 3.83 |
| Single Male/Father | 7 (5.8%) | 2.57 |
| Single Female/Mother | 42 (34.7%) | 4.64 |
| Non-family | 48 (39.7%) | 1.02 |
| Total Households | 121 (100.0%) | 2.93 |
Household Size by Marriage Status in Shuqualak
Out of a total of 121 households in Shuqualak, 73 (60.3%) are family households, while 48 (39.7%) are nonfamily households. The most numerous type of family households are 2-person households, comprising 22, and the most common type of nonfamily households are 1-person households, comprising 45.
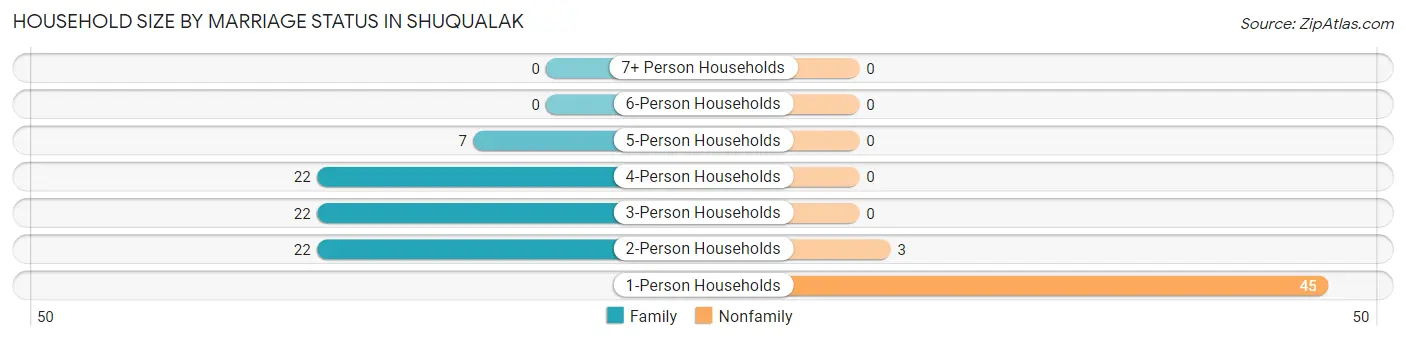
| Household Size | Family Households | Nonfamily Households |
| 1-Person Households | - | 45 (37.2%) |
| 2-Person Households | 22 (18.2%) | 3 (2.5%) |
| 3-Person Households | 22 (18.2%) | 0 (0.0%) |
| 4-Person Households | 22 (18.2%) | 0 (0.0%) |
| 5-Person Households | 7 (5.8%) | 0 (0.0%) |
| 6-Person Households | 0 (0.0%) | 0 (0.0%) |
| 7+ Person Households | 0 (0.0%) | 0 (0.0%) |
| Total | 73 (60.3%) | 48 (39.7%) |
Female Fertility in Shuqualak
Fertility by Age in Shuqualak
Average fertility rate in Shuqualak is 13.0 births per 1,000 women. Women in the age bracket of 20 to 34 years have the highest fertility rate with 23.0 births per 1,000 women. Women in the age bracket of 20 to 34 years acount for 100.0% of all women with births.
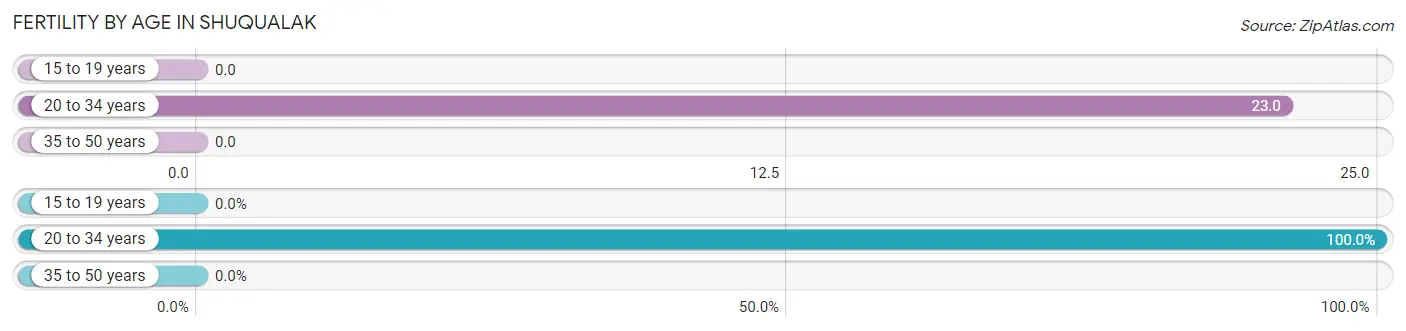
| Age Bracket | Women with Births | Births / 1,000 Women |
| 15 to 19 years | 0 (0.0%) | 0.0 |
| 20 to 34 years | 1 (100.0%) | 23.0 |
| 35 to 50 years | 0 (0.0%) | 0.0 |
| Total | 1 (100.0%) | 13.0 |
Fertility by Age by Marriage Status in Shuqualak
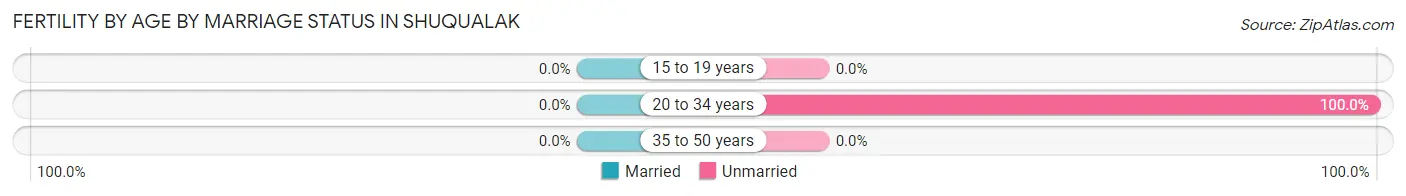
| Age Bracket | Married | Unmarried |
| 15 to 19 years | 0 (0.0%) | 0 (0.0%) |
| 20 to 34 years | 0 (0.0%) | 1 (100.0%) |
| 35 to 50 years | 0 (0.0%) | 0 (0.0%) |
| Total | 0 (0.0%) | 1 (100.0%) |
Fertility by Education in Shuqualak
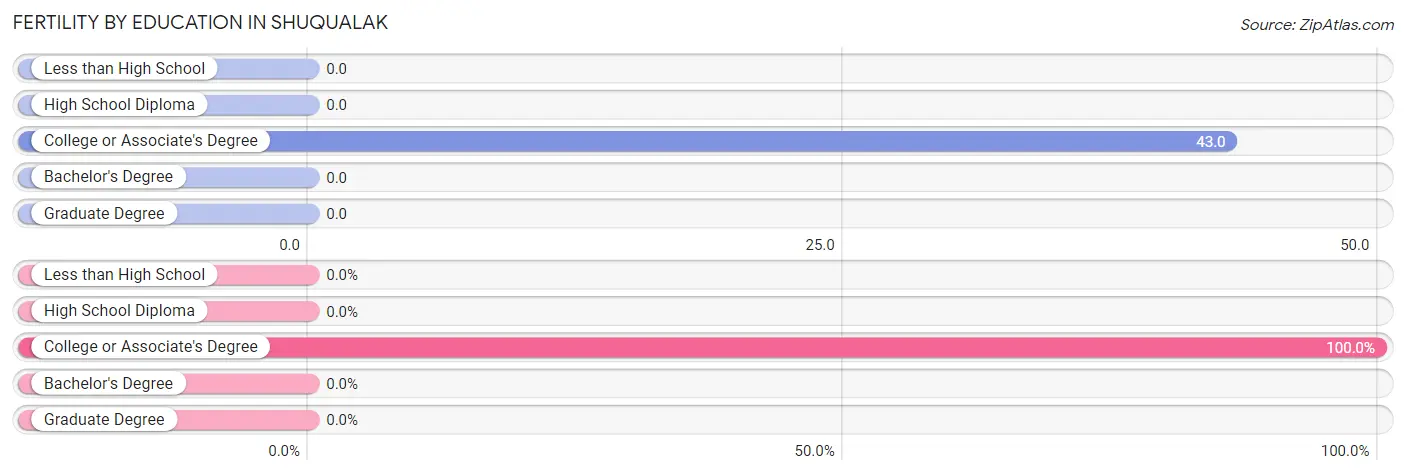
| Educational Attainment | Women with Births | Births / 1,000 Women |
| Less than High School | 0 (0.0%) | 0.0 |
| High School Diploma | 0 (0.0%) | 0.0 |
| College or Associate's Degree | 1 (100.0%) | 43.0 |
| Bachelor's Degree | 0 (0.0%) | 0.0 |
| Graduate Degree | 0 (0.0%) | 0.0 |
| Total | 1 (100.0%) | 13.0 |
Fertility by Education by Marriage Status in Shuqualak
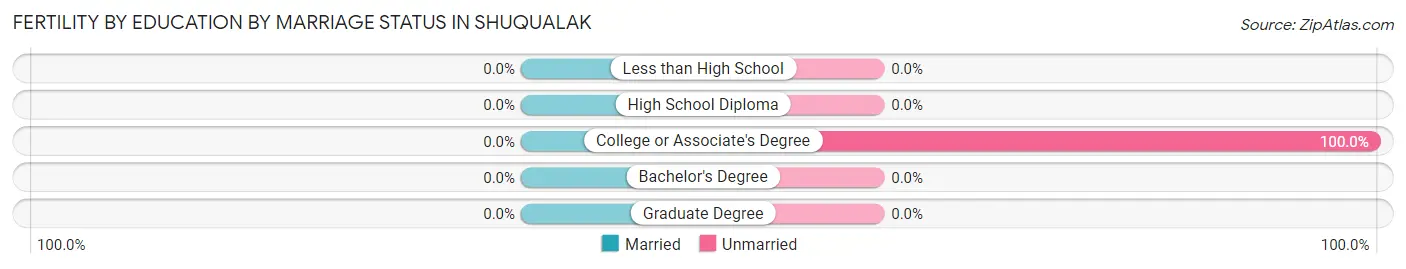
| Educational Attainment | Married | Unmarried |
| Less than High School | 0 (0.0%) | 0 (0.0%) |
| High School Diploma | 0 (0.0%) | 0 (0.0%) |
| College or Associate's Degree | 0 (0.0%) | 1 (100.0%) |
| Bachelor's Degree | 0 (0.0%) | 0 (0.0%) |
| Graduate Degree | 0 (0.0%) | 0 (0.0%) |
| Total | 0 (0.0%) | 1 (100.0%) |
Employment Characteristics in Shuqualak
Employment by Class of Employer in Shuqualak
Among the 129 employed individuals in Shuqualak, private company employees (105 | 81.4%), local government employees (12 | 9.3%), and state government employees (11 | 8.5%) make up the most common classes of employment.
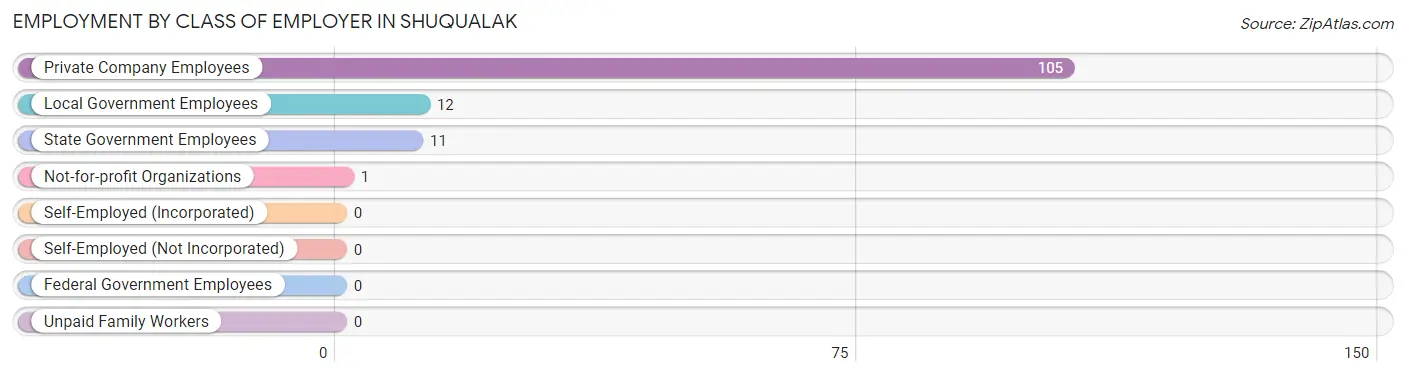
| Employer Class | # Employees | % Employees |
| Private Company Employees | 105 | 81.4% |
| Self-Employed (Incorporated) | 0 | 0.0% |
| Self-Employed (Not Incorporated) | 0 | 0.0% |
| Not-for-profit Organizations | 1 | 0.8% |
| Local Government Employees | 12 | 9.3% |
| State Government Employees | 11 | 8.5% |
| Federal Government Employees | 0 | 0.0% |
| Unpaid Family Workers | 0 | 0.0% |
| Total | 129 | 100.0% |
Employment Status by Age in Shuqualak
According to the labor force statistics for Shuqualak, out of the total population over 16 years of age (255), 59.6% or 152 individuals are in the labor force, with 10.5% or 16 of them unemployed. The age group with the highest labor force participation rate is 30 to 34 years, with 100.0% or 22 individuals in the labor force. Within the labor force, the 25 to 29 years age range has the highest percentage of unemployed individuals, with 100.0% or 8 of them being unemployed.
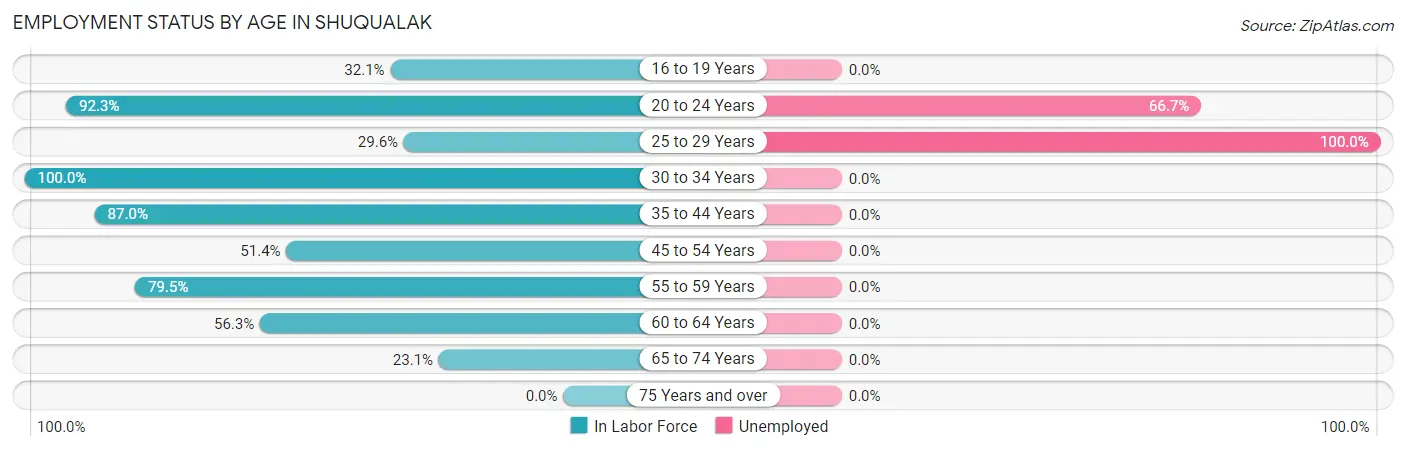
| Age Bracket | In Labor Force | Unemployed |
| 16 to 19 Years | 9 (32.1%) | 0 (0.0%) |
| 20 to 24 Years | 12 (92.3%) | 8 (66.7%) |
| 25 to 29 Years | 8 (29.6%) | 8 (100.0%) |
| 30 to 34 Years | 22 (100.0%) | 0 (0.0%) |
| 35 to 44 Years | 40 (87.0%) | 0 (0.0%) |
| 45 to 54 Years | 18 (51.4%) | 0 (0.0%) |
| 55 to 59 Years | 31 (79.5%) | 0 (0.0%) |
| 60 to 64 Years | 9 (56.3%) | 0 (0.0%) |
| 65 to 74 Years | 3 (23.1%) | 0 (0.0%) |
| 75 Years and over | 0 (0.0%) | 0 (0.0%) |
| Total | 152 (59.6%) | 16 (10.5%) |
Employment Status by Educational Attainment in Shuqualak
According to labor force statistics for Shuqualak, 69.2% of individuals (128) out of the total population between 25 and 64 years of age (185) are in the labor force, with 6.3% or 8 of them being unemployed. The group with the highest labor force participation rate are those with the educational attainment of bachelor's degree or higher, with 100.0% or 26 individuals in the labor force. Within the labor force, individuals with college / associate degree education have the highest percentage of unemployment, with 14.8% or 8 of them being unemployed.
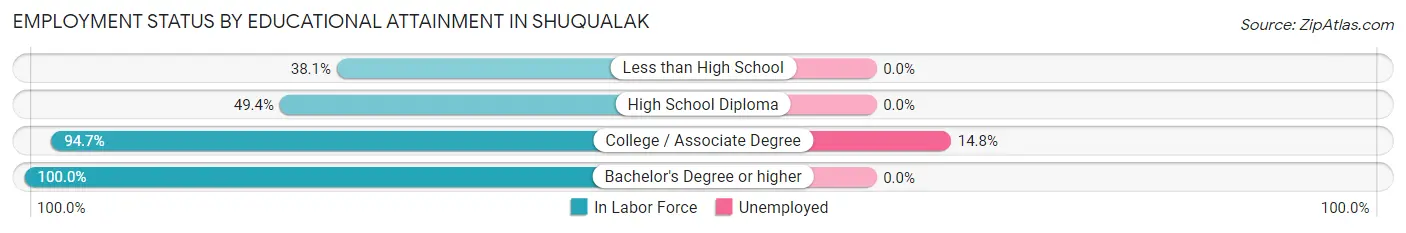
| Educational Attainment | In Labor Force | Unemployed |
| Less than High School | 8 (38.1%) | 0 (0.0%) |
| High School Diploma | 40 (49.4%) | 0 (0.0%) |
| College / Associate Degree | 54 (94.7%) | 8 (14.8%) |
| Bachelor's Degree or higher | 26 (100.0%) | 0 (0.0%) |
| Total | 128 (69.2%) | 12 (6.3%) |
Employment Occupations by Sex in Shuqualak
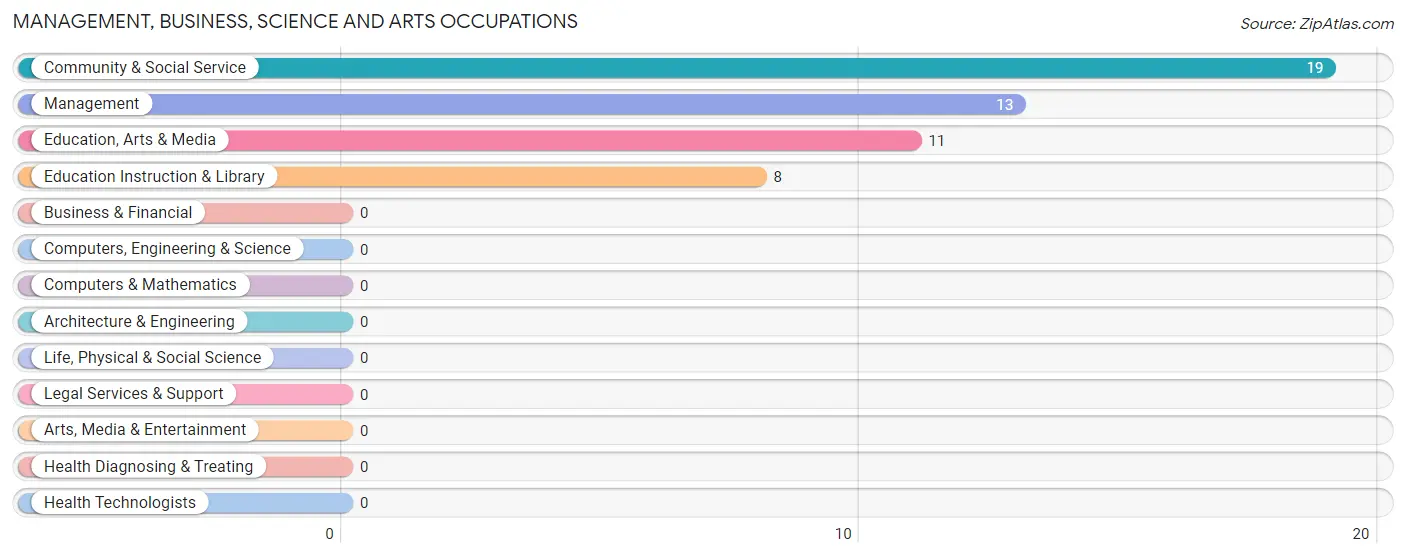
Management, Business, Science and Arts Occupations
The most common Management, Business, Science and Arts occupations in Shuqualak are Community & Social Service (19 | 14.0%), Management (13 | 9.6%), Education, Arts & Media (11 | 8.1%), and Education Instruction & Library (8 | 5.9%).
Management, Business, Science and Arts Occupations by Sex
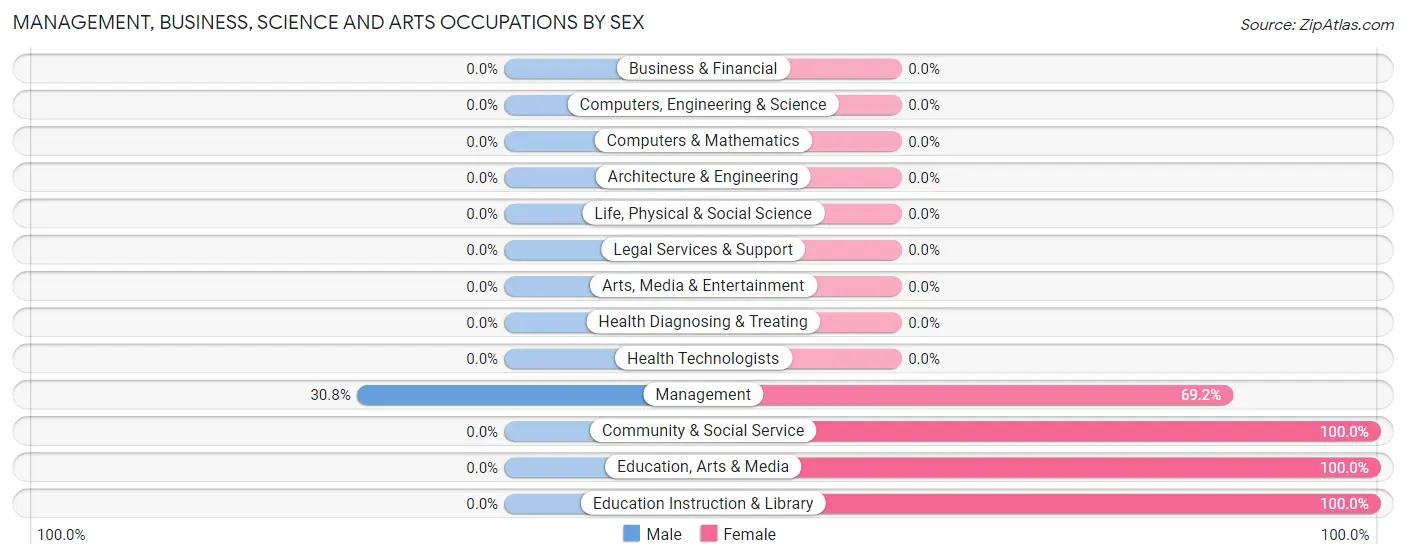
| Occupation | Male | Female |
| Management | 4 (30.8%) | 9 (69.2%) |
| Business & Financial | 0 (0.0%) | 0 (0.0%) |
| Computers, Engineering & Science | 0 (0.0%) | 0 (0.0%) |
| Computers & Mathematics | 0 (0.0%) | 0 (0.0%) |
| Architecture & Engineering | 0 (0.0%) | 0 (0.0%) |
| Life, Physical & Social Science | 0 (0.0%) | 0 (0.0%) |
| Community & Social Service | 0 (0.0%) | 19 (100.0%) |
| Education, Arts & Media | 0 (0.0%) | 11 (100.0%) |
| Legal Services & Support | 0 (0.0%) | 0 (0.0%) |
| Education Instruction & Library | 0 (0.0%) | 8 (100.0%) |
| Arts, Media & Entertainment | 0 (0.0%) | 0 (0.0%) |
| Health Diagnosing & Treating | 0 (0.0%) | 0 (0.0%) |
| Health Technologists | 0 (0.0%) | 0 (0.0%) |
| Total (Category) | 4 (12.5%) | 28 (87.5%) |
| Total (Overall) | 48 (35.3%) | 88 (64.7%) |
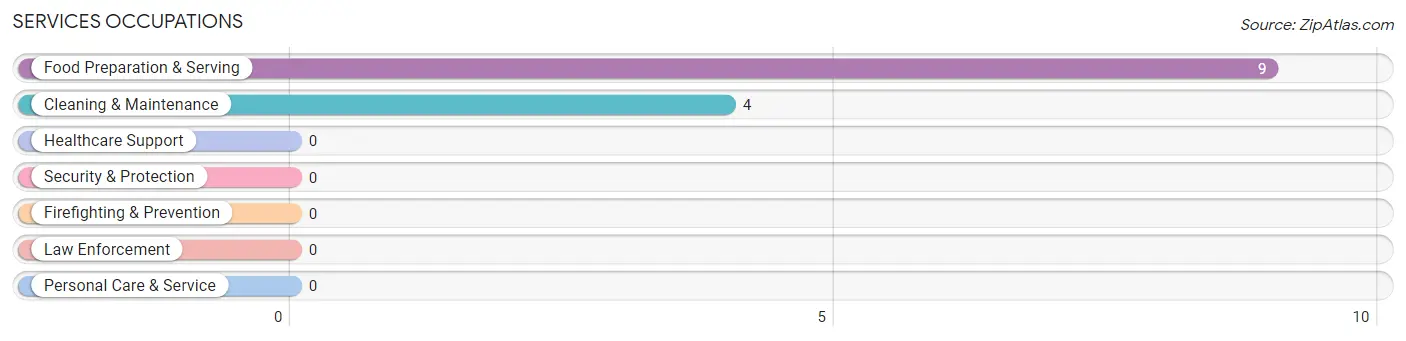
Services Occupations
The most common Services occupations in Shuqualak are Food Preparation & Serving (9 | 6.6%), and Cleaning & Maintenance (4 | 2.9%).
Services Occupations by Sex
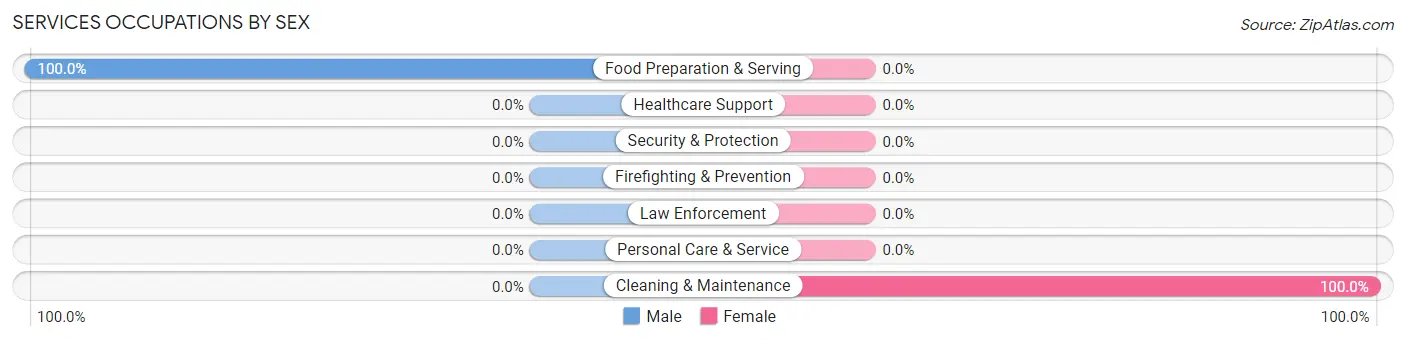
| Occupation | Male | Female |
| Healthcare Support | 0 (0.0%) | 0 (0.0%) |
| Security & Protection | 0 (0.0%) | 0 (0.0%) |
| Firefighting & Prevention | 0 (0.0%) | 0 (0.0%) |
| Law Enforcement | 0 (0.0%) | 0 (0.0%) |
| Food Preparation & Serving | 9 (100.0%) | 0 (0.0%) |
| Cleaning & Maintenance | 0 (0.0%) | 4 (100.0%) |
| Personal Care & Service | 0 (0.0%) | 0 (0.0%) |
| Total (Category) | 9 (69.2%) | 4 (30.8%) |
| Total (Overall) | 48 (35.3%) | 88 (64.7%) |
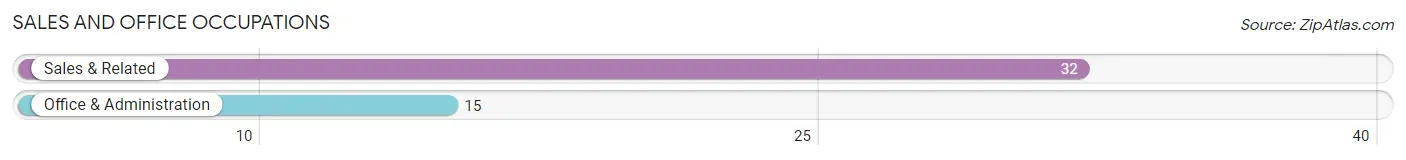
Sales and Office Occupations
The most common Sales and Office occupations in Shuqualak are Sales & Related (32 | 23.5%), and Office & Administration (15 | 11.0%).
Sales and Office Occupations by Sex
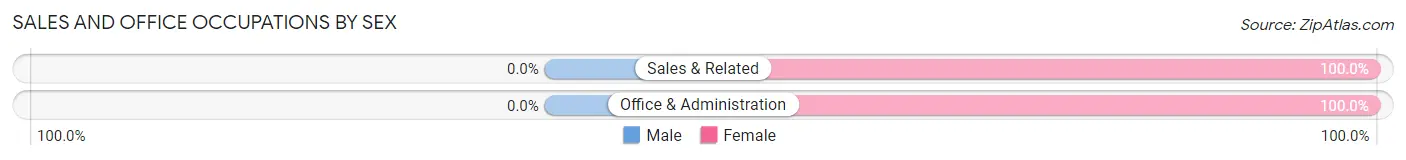
| Occupation | Male | Female |
| Sales & Related | 0 (0.0%) | 32 (100.0%) |
| Office & Administration | 0 (0.0%) | 15 (100.0%) |
| Total (Category) | 0 (0.0%) | 47 (100.0%) |
| Total (Overall) | 48 (35.3%) | 88 (64.7%) |
Natural Resources, Construction and Maintenance Occupations
The most common Natural Resources, Construction and Maintenance occupations in Shuqualak are , and Installation, Maintenance & Repair (8 | 5.9%).
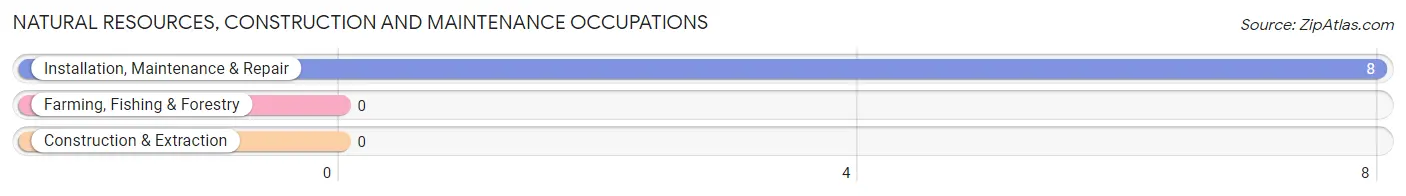
Natural Resources, Construction and Maintenance Occupations by Sex
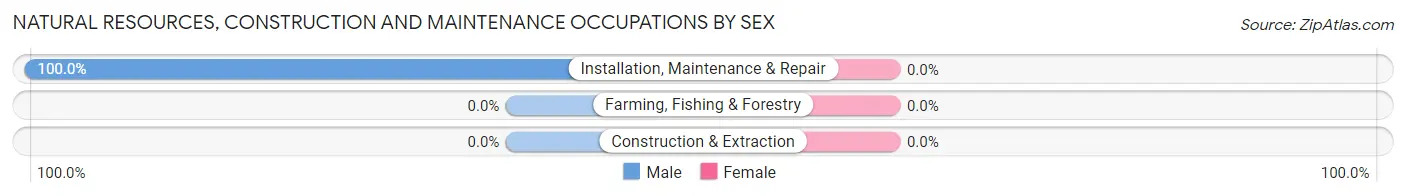
| Occupation | Male | Female |
| Farming, Fishing & Forestry | 0 (0.0%) | 0 (0.0%) |
| Construction & Extraction | 0 (0.0%) | 0 (0.0%) |
| Installation, Maintenance & Repair | 8 (100.0%) | 0 (0.0%) |
| Total (Category) | 8 (100.0%) | 0 (0.0%) |
| Total (Overall) | 48 (35.3%) | 88 (64.7%) |
Production, Transportation and Moving Occupations
The most common Production, Transportation and Moving occupations in Shuqualak are Production (18 | 13.2%), Transportation (15 | 11.0%), and Material Moving (3 | 2.2%).
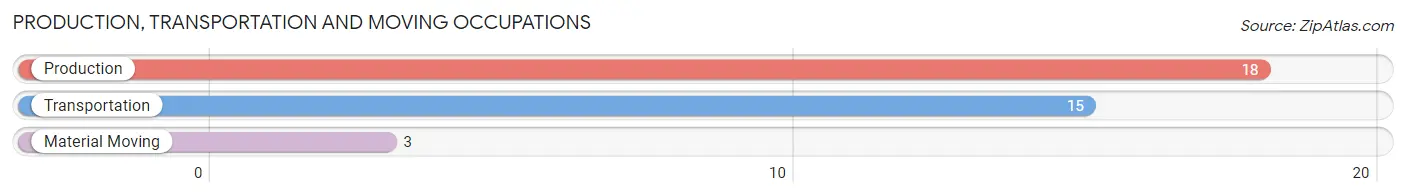
Production, Transportation and Moving Occupations by Sex
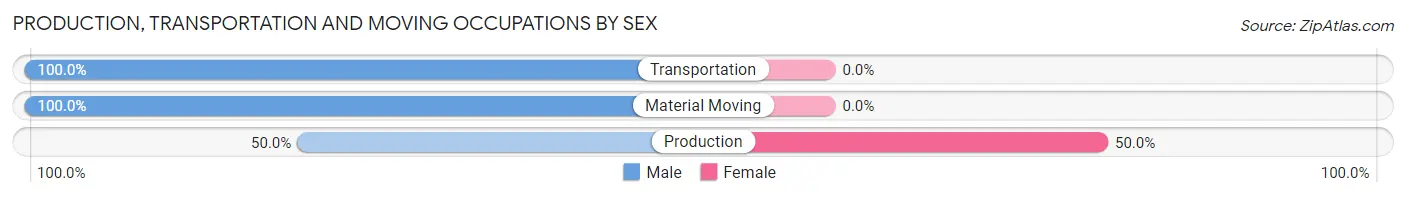
| Occupation | Male | Female |
| Production | 9 (50.0%) | 9 (50.0%) |
| Transportation | 15 (100.0%) | 0 (0.0%) |
| Material Moving | 3 (100.0%) | 0 (0.0%) |
| Total (Category) | 27 (75.0%) | 9 (25.0%) |
| Total (Overall) | 48 (35.3%) | 88 (64.7%) |
Employment Industries by Sex in Shuqualak
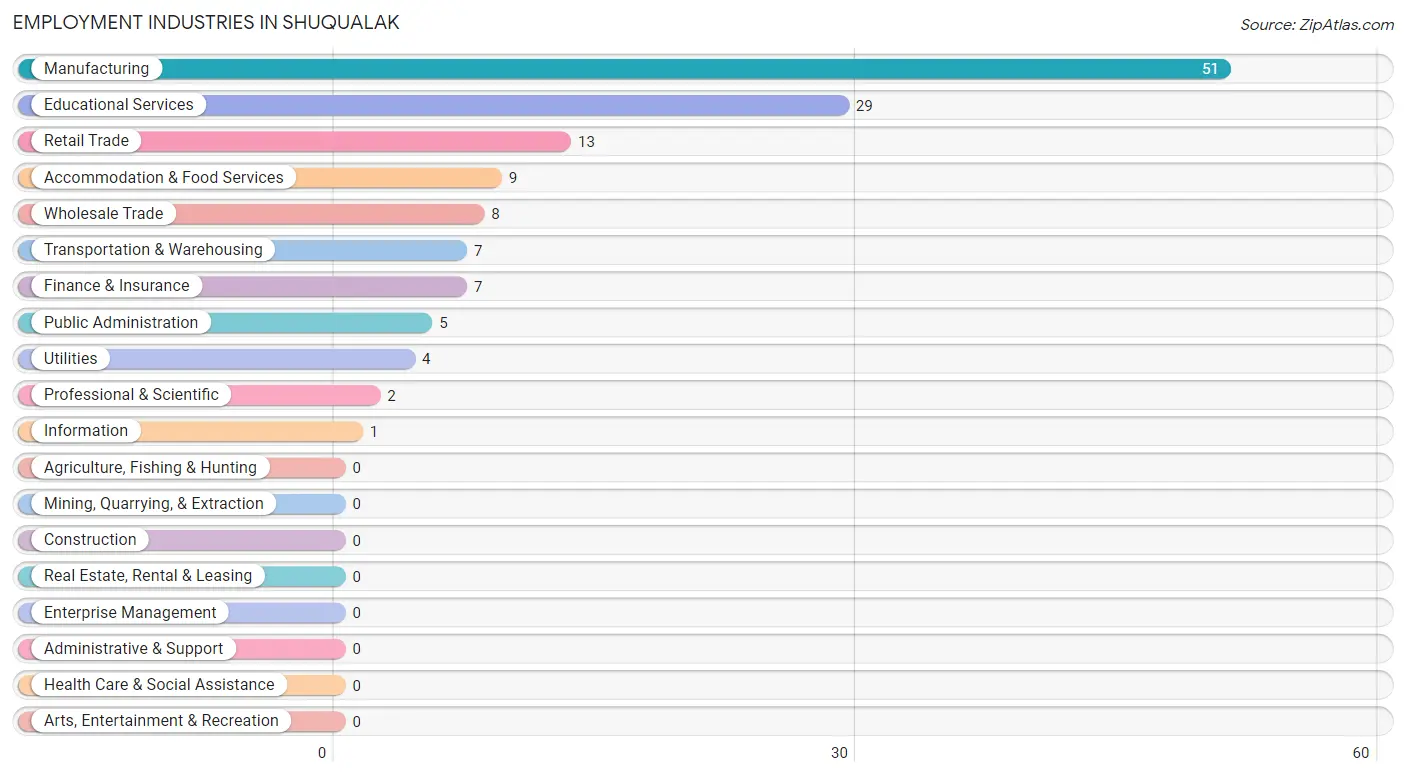
Employment Industries in Shuqualak
The major employment industries in Shuqualak include Manufacturing (51 | 37.5%), Educational Services (29 | 21.3%), Retail Trade (13 | 9.6%), Accommodation & Food Services (9 | 6.6%), and Wholesale Trade (8 | 5.9%).
Employment Industries by Sex in Shuqualak
The Shuqualak industries that see more men than women are Wholesale Trade (100.0%), Transportation & Warehousing (100.0%), and Utilities (100.0%), whereas the industries that tend to have a higher number of women are Retail Trade (100.0%), Information (100.0%), and Finance & Insurance (100.0%).
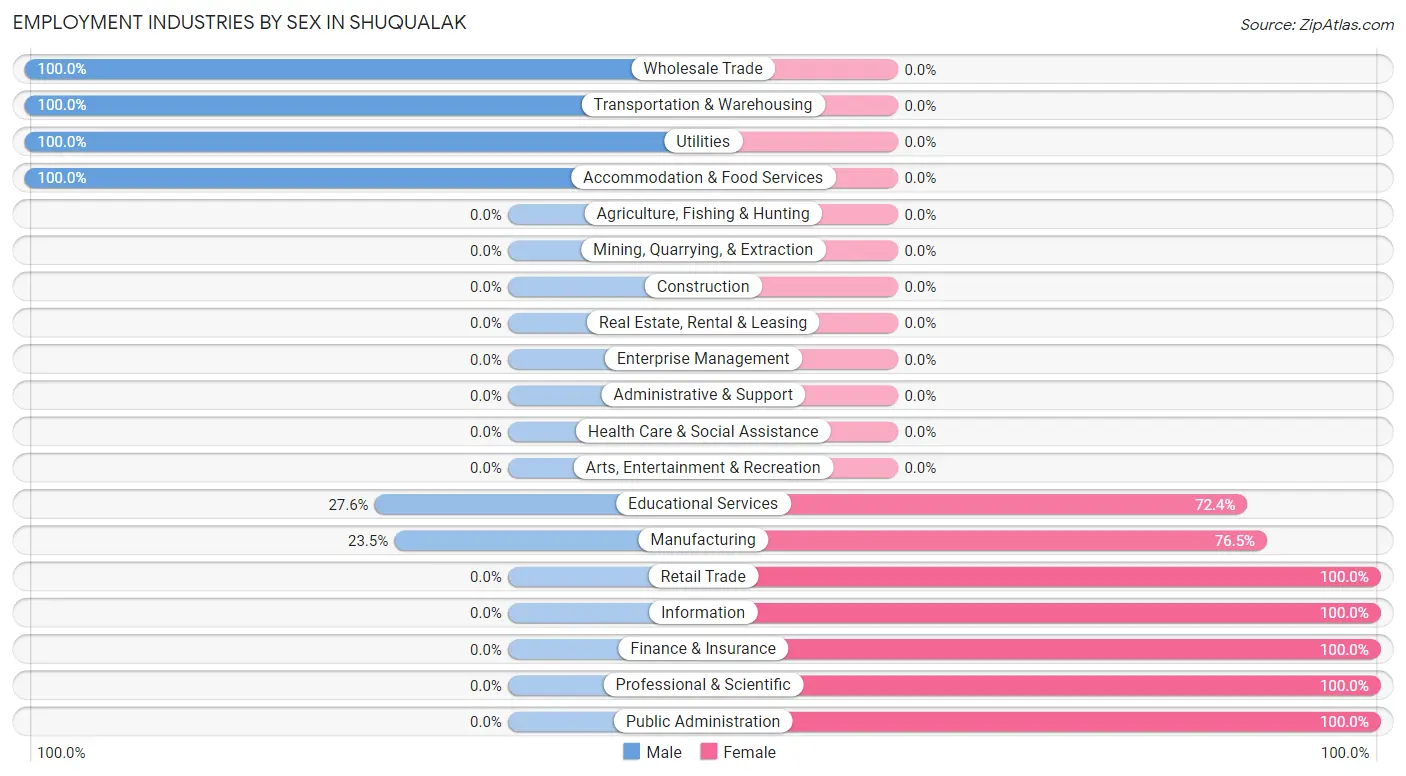
| Industry | Male | Female |
| Agriculture, Fishing & Hunting | 0 (0.0%) | 0 (0.0%) |
| Mining, Quarrying, & Extraction | 0 (0.0%) | 0 (0.0%) |
| Construction | 0 (0.0%) | 0 (0.0%) |
| Manufacturing | 12 (23.5%) | 39 (76.5%) |
| Wholesale Trade | 8 (100.0%) | 0 (0.0%) |
| Retail Trade | 0 (0.0%) | 13 (100.0%) |
| Transportation & Warehousing | 7 (100.0%) | 0 (0.0%) |
| Utilities | 4 (100.0%) | 0 (0.0%) |
| Information | 0 (0.0%) | 1 (100.0%) |
| Finance & Insurance | 0 (0.0%) | 7 (100.0%) |
| Real Estate, Rental & Leasing | 0 (0.0%) | 0 (0.0%) |
| Professional & Scientific | 0 (0.0%) | 2 (100.0%) |
| Enterprise Management | 0 (0.0%) | 0 (0.0%) |
| Administrative & Support | 0 (0.0%) | 0 (0.0%) |
| Educational Services | 8 (27.6%) | 21 (72.4%) |
| Health Care & Social Assistance | 0 (0.0%) | 0 (0.0%) |
| Arts, Entertainment & Recreation | 0 (0.0%) | 0 (0.0%) |
| Accommodation & Food Services | 9 (100.0%) | 0 (0.0%) |
| Public Administration | 0 (0.0%) | 5 (100.0%) |
| Total | 48 (35.3%) | 88 (64.7%) |
Education in Shuqualak
School Enrollment in Shuqualak
The most common levels of schooling among the 109 students in Shuqualak are college / undergraduate (28 | 25.7%), nursery / preschool (23 | 21.1%), and middle school (20 | 18.3%).
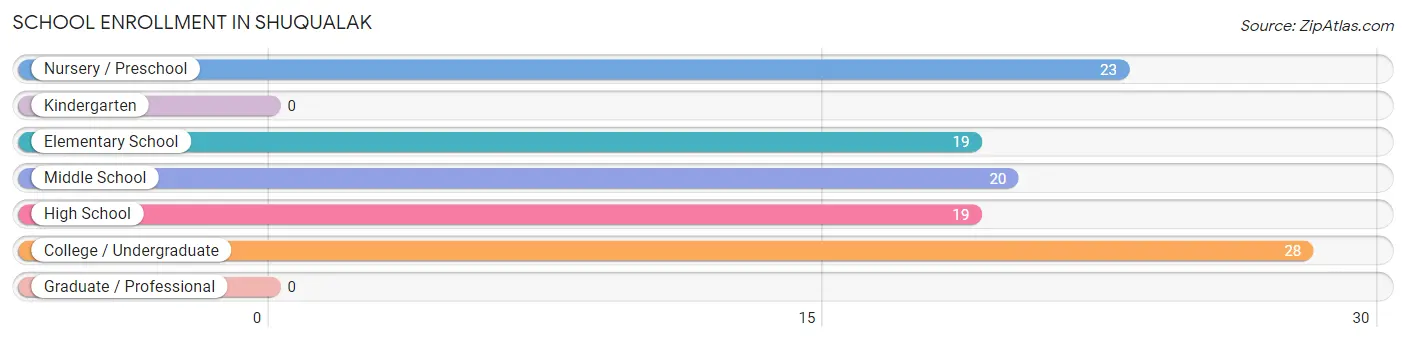
| School Level | # Students | % Students |
| Nursery / Preschool | 23 | 21.1% |
| Kindergarten | 0 | 0.0% |
| Elementary School | 19 | 17.4% |
| Middle School | 20 | 18.3% |
| High School | 19 | 17.4% |
| College / Undergraduate | 28 | 25.7% |
| Graduate / Professional | 0 | 0.0% |
| Total | 109 | 100.0% |
School Enrollment by Age by Funding Source in Shuqualak
Out of a total of 109 students who are enrolled in schools in Shuqualak, 13 (11.9%) attend a private institution, while the remaining 96 (88.1%) are enrolled in public schools. The age group of 5 to 9 year old has the highest likelihood of being enrolled in private schools, with 13 (30.9% in the age bracket) enrolled. Conversely, the age group of 10 to 14 year olds has the lowest likelihood of being enrolled in a private school, with 20 (100.0% in the age bracket) attending a public institution.
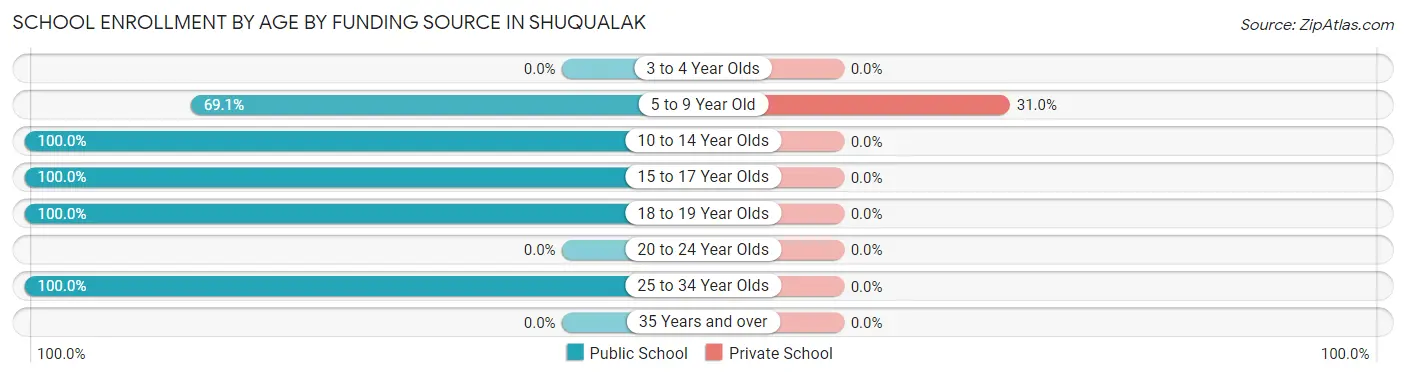
| Age Bracket | Public School | Private School |
| 3 to 4 Year Olds | 0 (0.0%) | 0 (0.0%) |
| 5 to 9 Year Old | 29 (69.1%) | 13 (30.9%) |
| 10 to 14 Year Olds | 20 (100.0%) | 0 (0.0%) |
| 15 to 17 Year Olds | 9 (100.0%) | 0 (0.0%) |
| 18 to 19 Year Olds | 19 (100.0%) | 0 (0.0%) |
| 20 to 24 Year Olds | 0 (0.0%) | 0 (0.0%) |
| 25 to 34 Year Olds | 19 (100.0%) | 0 (0.0%) |
| 35 Years and over | 0 (0.0%) | 0 (0.0%) |
| Total | 96 (88.1%) | 13 (11.9%) |
Educational Attainment by Field of Study in Shuqualak
Education (21 | 80.8%), and arts & humanities (5 | 19.2%) are the most common fields of study among 26 individuals in Shuqualak who have obtained a bachelor's degree or higher.
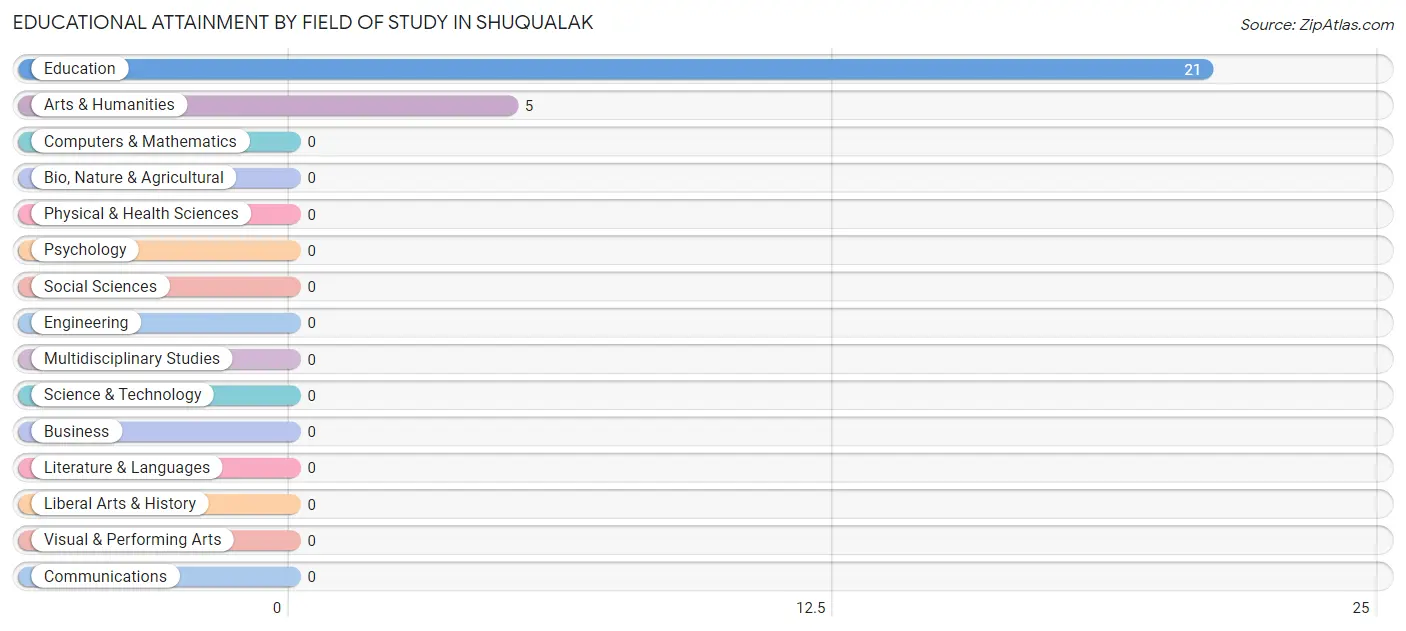
| Field of Study | # Graduates | % Graduates |
| Computers & Mathematics | 0 | 0.0% |
| Bio, Nature & Agricultural | 0 | 0.0% |
| Physical & Health Sciences | 0 | 0.0% |
| Psychology | 0 | 0.0% |
| Social Sciences | 0 | 0.0% |
| Engineering | 0 | 0.0% |
| Multidisciplinary Studies | 0 | 0.0% |
| Science & Technology | 0 | 0.0% |
| Business | 0 | 0.0% |
| Education | 21 | 80.8% |
| Literature & Languages | 0 | 0.0% |
| Liberal Arts & History | 0 | 0.0% |
| Visual & Performing Arts | 0 | 0.0% |
| Communications | 0 | 0.0% |
| Arts & Humanities | 5 | 19.2% |
| Total | 26 | 100.0% |
Transportation & Commute in Shuqualak
Vehicle Availability by Sex in Shuqualak
The most prevalent vehicle ownership categories in Shuqualak are males with 2 vehicles (29, accounting for 60.4%) and females with 2 vehicles (48, making up 35.8%).
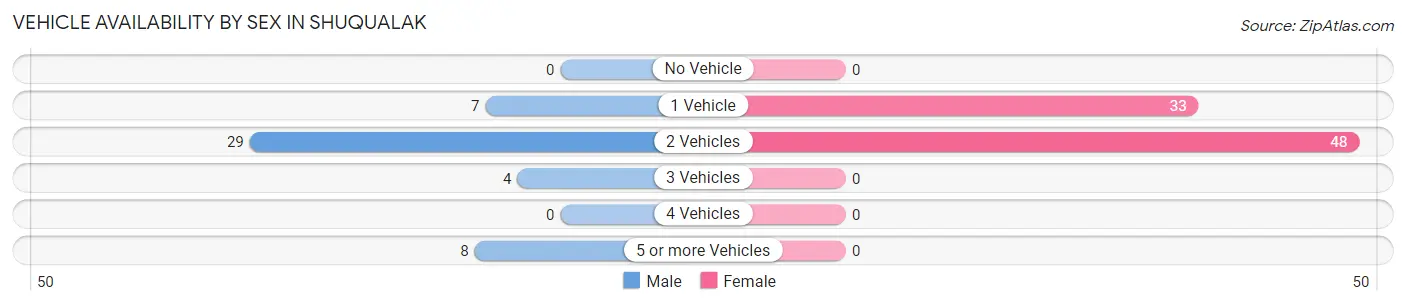
| Vehicles Available | Male | Female |
| No Vehicle | 0 (0.0%) | 0 (0.0%) |
| 1 Vehicle | 7 (14.6%) | 33 (40.7%) |
| 2 Vehicles | 29 (60.4%) | 48 (59.3%) |
| 3 Vehicles | 4 (8.3%) | 0 (0.0%) |
| 4 Vehicles | 0 (0.0%) | 0 (0.0%) |
| 5 or more Vehicles | 8 (16.7%) | 0 (0.0%) |
| Total | 48 (100.0%) | 81 (100.0%) |
Commute Time in Shuqualak
The most frequently occuring commute durations in Shuqualak are 20 to 24 minutes (34 commuters, 26.4%), 5 to 9 minutes (28 commuters, 21.7%), and 15 to 19 minutes (16 commuters, 12.4%).
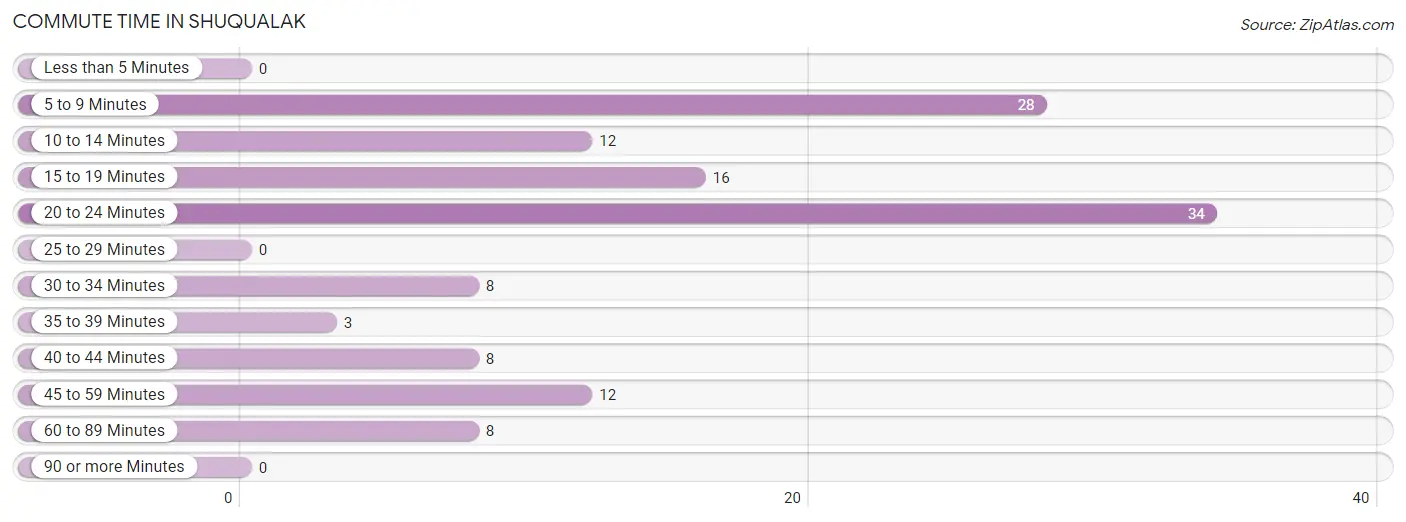
| Commute Time | # Commuters | % Commuters |
| Less than 5 Minutes | 0 | 0.0% |
| 5 to 9 Minutes | 28 | 21.7% |
| 10 to 14 Minutes | 12 | 9.3% |
| 15 to 19 Minutes | 16 | 12.4% |
| 20 to 24 Minutes | 34 | 26.4% |
| 25 to 29 Minutes | 0 | 0.0% |
| 30 to 34 Minutes | 8 | 6.2% |
| 35 to 39 Minutes | 3 | 2.3% |
| 40 to 44 Minutes | 8 | 6.2% |
| 45 to 59 Minutes | 12 | 9.3% |
| 60 to 89 Minutes | 8 | 6.2% |
| 90 or more Minutes | 0 | 0.0% |
Commute Time by Sex in Shuqualak
The most common commute times in Shuqualak are 5 to 9 minutes (13 commuters, 27.1%) for males and 20 to 24 minutes (34 commuters, 42.0%) for females.
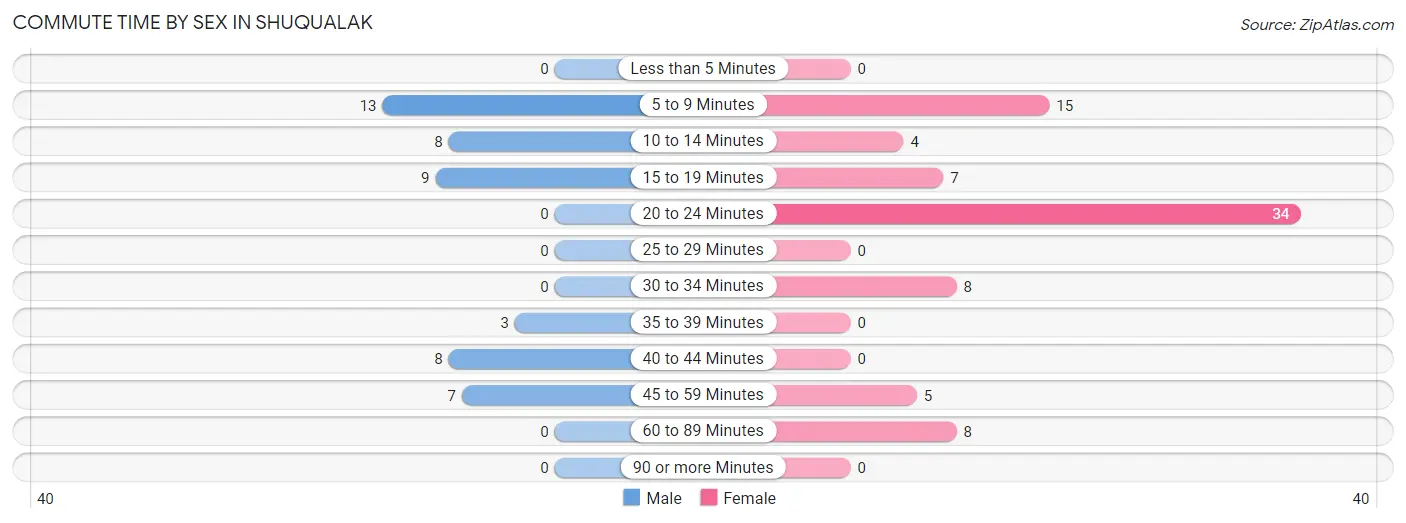
| Commute Time | Male | Female |
| Less than 5 Minutes | 0 (0.0%) | 0 (0.0%) |
| 5 to 9 Minutes | 13 (27.1%) | 15 (18.5%) |
| 10 to 14 Minutes | 8 (16.7%) | 4 (4.9%) |
| 15 to 19 Minutes | 9 (18.8%) | 7 (8.6%) |
| 20 to 24 Minutes | 0 (0.0%) | 34 (42.0%) |
| 25 to 29 Minutes | 0 (0.0%) | 0 (0.0%) |
| 30 to 34 Minutes | 0 (0.0%) | 8 (9.9%) |
| 35 to 39 Minutes | 3 (6.2%) | 0 (0.0%) |
| 40 to 44 Minutes | 8 (16.7%) | 0 (0.0%) |
| 45 to 59 Minutes | 7 (14.6%) | 5 (6.2%) |
| 60 to 89 Minutes | 0 (0.0%) | 8 (9.9%) |
| 90 or more Minutes | 0 (0.0%) | 0 (0.0%) |
Time of Departure to Work by Sex in Shuqualak
The most frequent times of departure to work in Shuqualak are 6:00 AM to 6:29 AM (9, 18.8%) for males and 7:30 AM to 7:59 AM (26, 32.1%) for females.
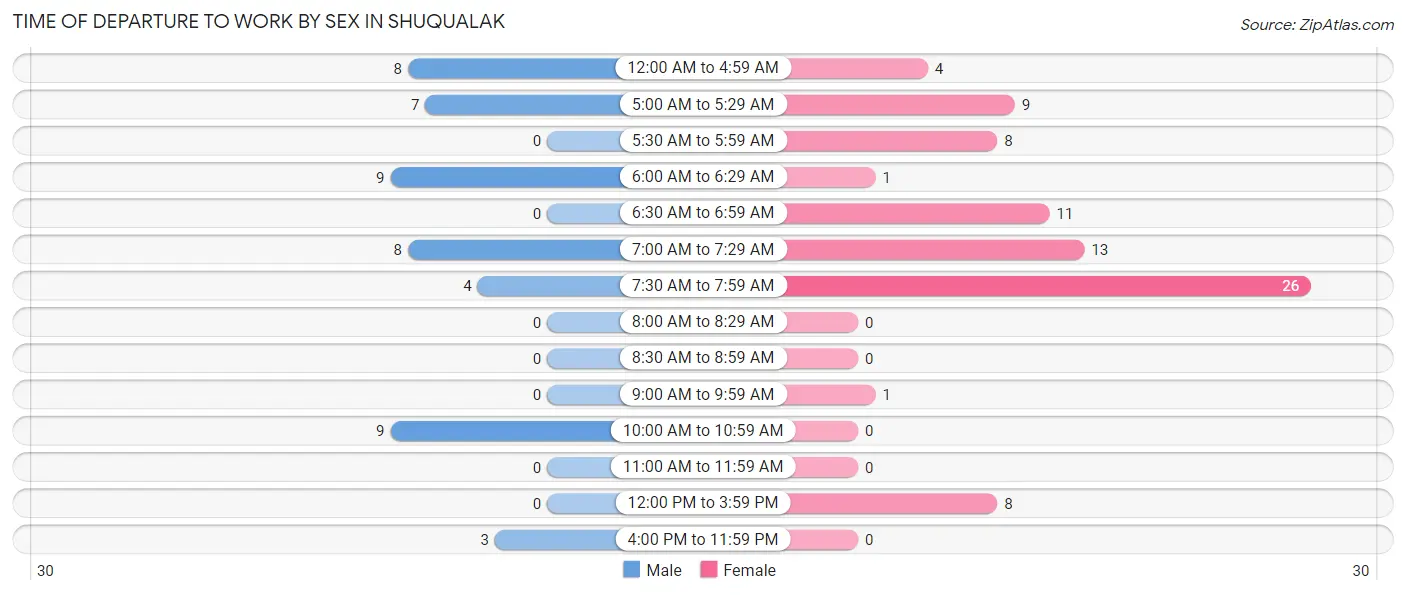
| Time of Departure | Male | Female |
| 12:00 AM to 4:59 AM | 8 (16.7%) | 4 (4.9%) |
| 5:00 AM to 5:29 AM | 7 (14.6%) | 9 (11.1%) |
| 5:30 AM to 5:59 AM | 0 (0.0%) | 8 (9.9%) |
| 6:00 AM to 6:29 AM | 9 (18.8%) | 1 (1.2%) |
| 6:30 AM to 6:59 AM | 0 (0.0%) | 11 (13.6%) |
| 7:00 AM to 7:29 AM | 8 (16.7%) | 13 (16.1%) |
| 7:30 AM to 7:59 AM | 4 (8.3%) | 26 (32.1%) |
| 8:00 AM to 8:29 AM | 0 (0.0%) | 0 (0.0%) |
| 8:30 AM to 8:59 AM | 0 (0.0%) | 0 (0.0%) |
| 9:00 AM to 9:59 AM | 0 (0.0%) | 1 (1.2%) |
| 10:00 AM to 10:59 AM | 9 (18.8%) | 0 (0.0%) |
| 11:00 AM to 11:59 AM | 0 (0.0%) | 0 (0.0%) |
| 12:00 PM to 3:59 PM | 0 (0.0%) | 8 (9.9%) |
| 4:00 PM to 11:59 PM | 3 (6.2%) | 0 (0.0%) |
| Total | 48 (100.0%) | 81 (100.0%) |
Housing Occupancy in Shuqualak
Occupancy by Ownership in Shuqualak
Of the total 121 dwellings in Shuqualak, owner-occupied units account for 87 (71.9%), while renter-occupied units make up 34 (28.1%).
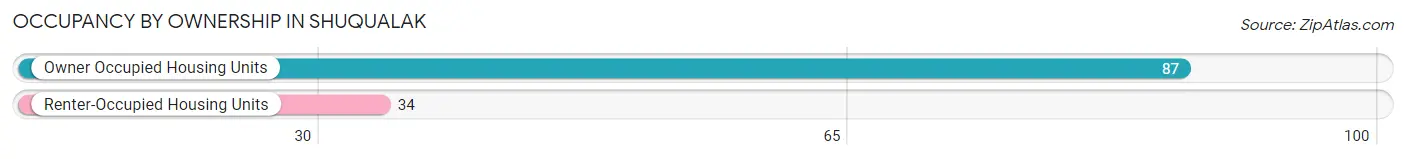
| Occupancy | # Housing Units | % Housing Units |
| Owner Occupied Housing Units | 87 | 71.9% |
| Renter-Occupied Housing Units | 34 | 28.1% |
| Total Occupied Housing Units | 121 | 100.0% |
Occupancy by Household Size in Shuqualak
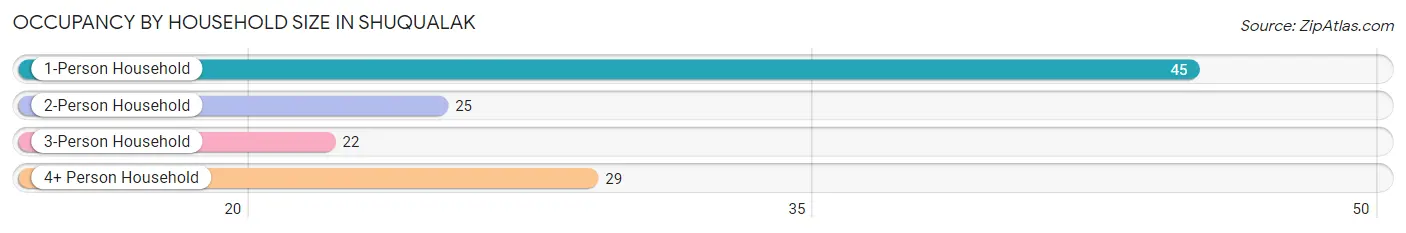
| Household Size | # Housing Units | % Housing Units |
| 1-Person Household | 45 | 37.2% |
| 2-Person Household | 25 | 20.7% |
| 3-Person Household | 22 | 18.2% |
| 4+ Person Household | 29 | 24.0% |
| Total Housing Units | 121 | 100.0% |
Occupancy by Ownership by Household Size in Shuqualak
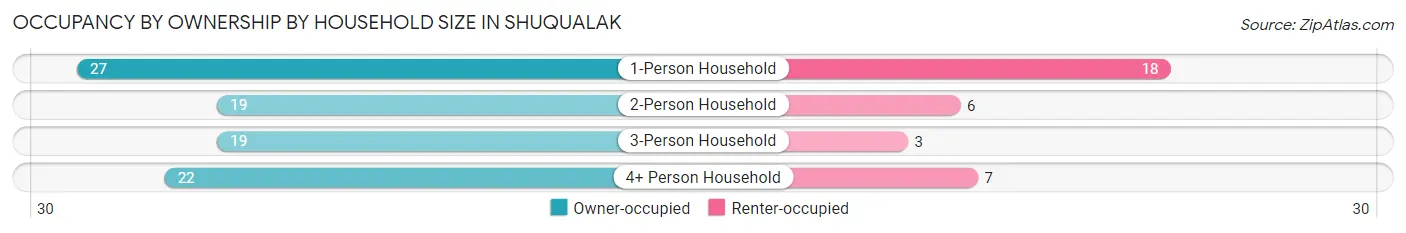
| Household Size | Owner-occupied | Renter-occupied |
| 1-Person Household | 27 (60.0%) | 18 (40.0%) |
| 2-Person Household | 19 (76.0%) | 6 (24.0%) |
| 3-Person Household | 19 (86.4%) | 3 (13.6%) |
| 4+ Person Household | 22 (75.9%) | 7 (24.1%) |
| Total Housing Units | 87 (71.9%) | 34 (28.1%) |
Occupancy by Educational Attainment in Shuqualak
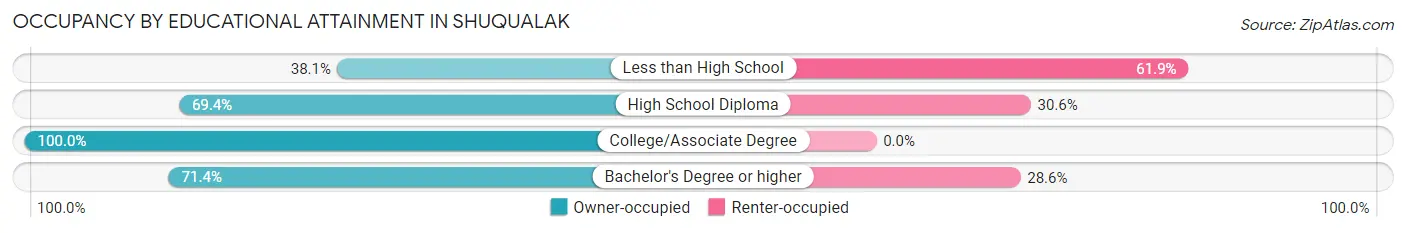
| Household Size | Owner-occupied | Renter-occupied |
| Less than High School | 8 (38.1%) | 13 (61.9%) |
| High School Diploma | 34 (69.4%) | 15 (30.6%) |
| College/Associate Degree | 30 (100.0%) | 0 (0.0%) |
| Bachelor's Degree or higher | 15 (71.4%) | 6 (28.6%) |
Occupancy by Age of Householder in Shuqualak
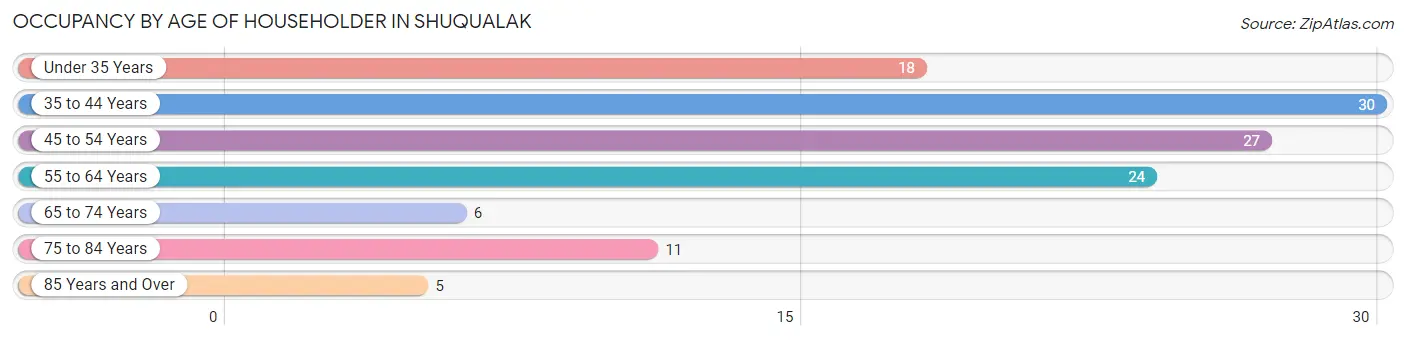
| Age Bracket | # Households | % Households |
| Under 35 Years | 18 | 14.9% |
| 35 to 44 Years | 30 | 24.8% |
| 45 to 54 Years | 27 | 22.3% |
| 55 to 64 Years | 24 | 19.8% |
| 65 to 74 Years | 6 | 5.0% |
| 75 to 84 Years | 11 | 9.1% |
| 85 Years and Over | 5 | 4.1% |
| Total | 121 | 100.0% |
Housing Finances in Shuqualak
Median Income by Occupancy in Shuqualak
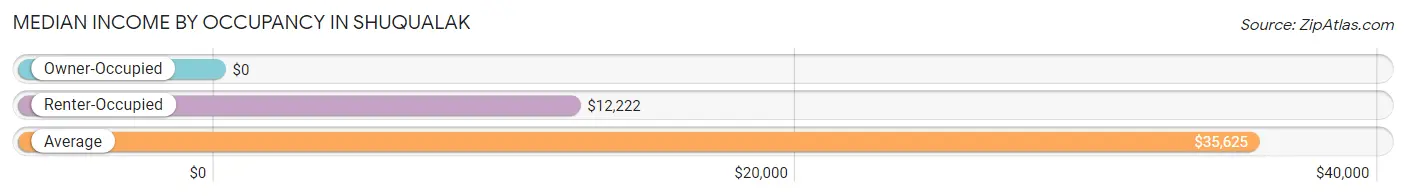
| Occupancy Type | # Households | Median Income |
| Owner-Occupied | 87 (71.9%) | $0 |
| Renter-Occupied | 34 (28.1%) | $12,222 |
| Average | 121 (100.0%) | $35,625 |
Occupancy by Householder Income Bracket in Shuqualak
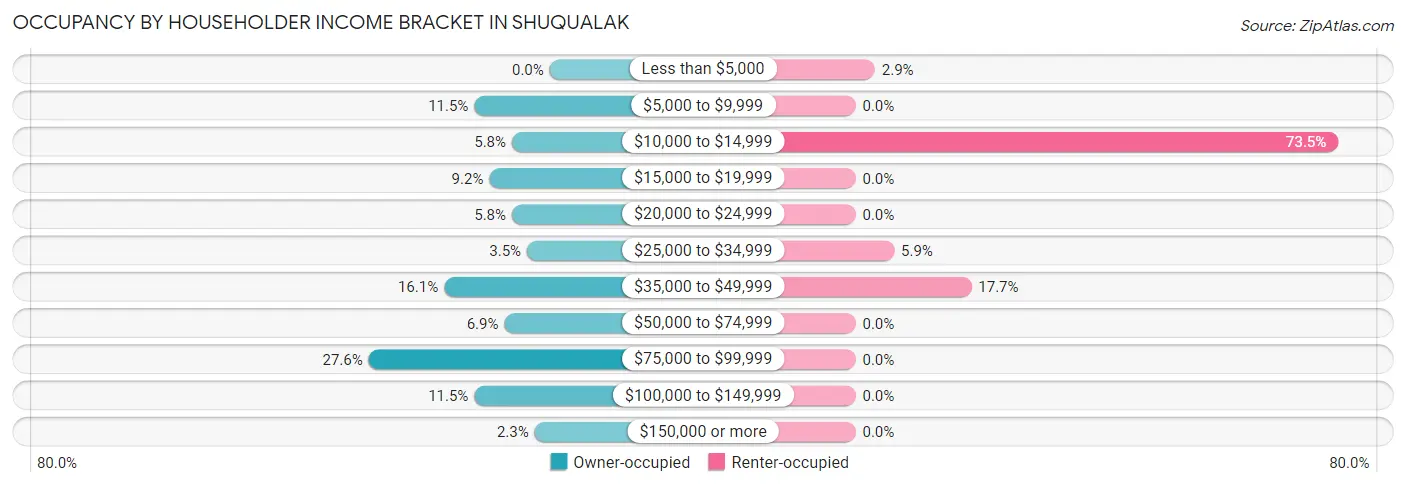
| Income Bracket | Owner-occupied | Renter-occupied |
| Less than $5,000 | 0 (0.0%) | 1 (2.9%) |
| $5,000 to $9,999 | 10 (11.5%) | 0 (0.0%) |
| $10,000 to $14,999 | 5 (5.8%) | 25 (73.5%) |
| $15,000 to $19,999 | 8 (9.2%) | 0 (0.0%) |
| $20,000 to $24,999 | 5 (5.8%) | 0 (0.0%) |
| $25,000 to $34,999 | 3 (3.5%) | 2 (5.9%) |
| $35,000 to $49,999 | 14 (16.1%) | 6 (17.6%) |
| $50,000 to $74,999 | 6 (6.9%) | 0 (0.0%) |
| $75,000 to $99,999 | 24 (27.6%) | 0 (0.0%) |
| $100,000 to $149,999 | 10 (11.5%) | 0 (0.0%) |
| $150,000 or more | 2 (2.3%) | 0 (0.0%) |
| Total | 87 (100.0%) | 34 (100.0%) |
Monthly Housing Cost Tiers in Shuqualak
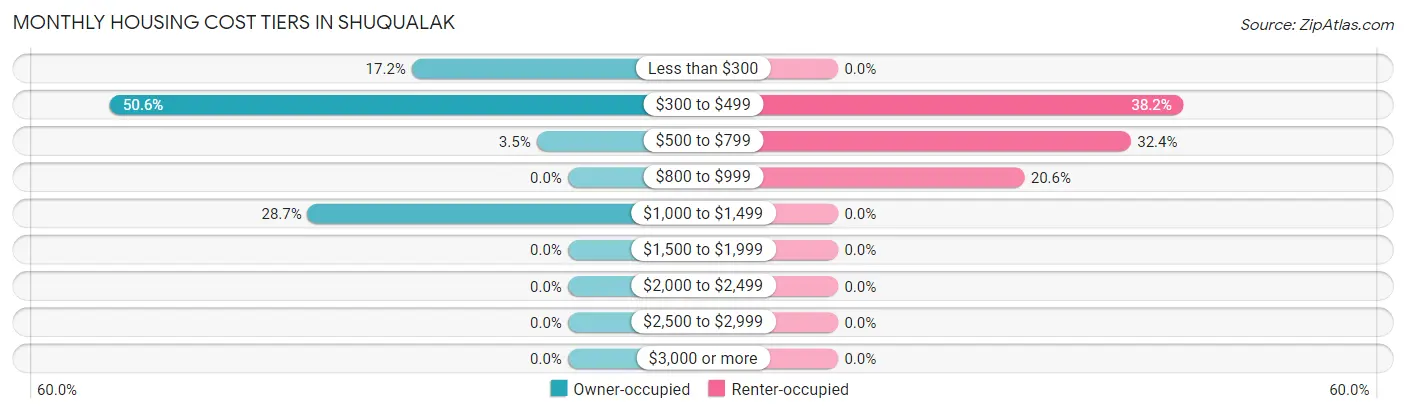
| Monthly Cost | Owner-occupied | Renter-occupied |
| Less than $300 | 15 (17.2%) | 0 (0.0%) |
| $300 to $499 | 44 (50.6%) | 13 (38.2%) |
| $500 to $799 | 3 (3.5%) | 11 (32.4%) |
| $800 to $999 | 0 (0.0%) | 7 (20.6%) |
| $1,000 to $1,499 | 25 (28.7%) | 0 (0.0%) |
| $1,500 to $1,999 | 0 (0.0%) | 0 (0.0%) |
| $2,000 to $2,499 | 0 (0.0%) | 0 (0.0%) |
| $2,500 to $2,999 | 0 (0.0%) | 0 (0.0%) |
| $3,000 or more | 0 (0.0%) | 0 (0.0%) |
| Total | 87 (100.0%) | 34 (100.0%) |
Physical Housing Characteristics in Shuqualak
Housing Structures in Shuqualak
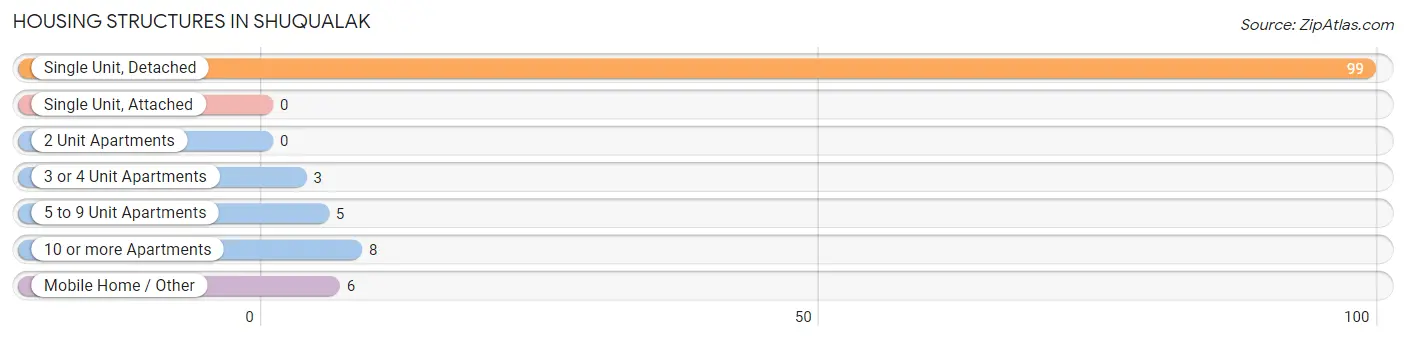
| Structure Type | # Housing Units | % Housing Units |
| Single Unit, Detached | 99 | 81.8% |
| Single Unit, Attached | 0 | 0.0% |
| 2 Unit Apartments | 0 | 0.0% |
| 3 or 4 Unit Apartments | 3 | 2.5% |
| 5 to 9 Unit Apartments | 5 | 4.1% |
| 10 or more Apartments | 8 | 6.6% |
| Mobile Home / Other | 6 | 5.0% |
| Total | 121 | 100.0% |
Housing Structures by Occupancy in Shuqualak
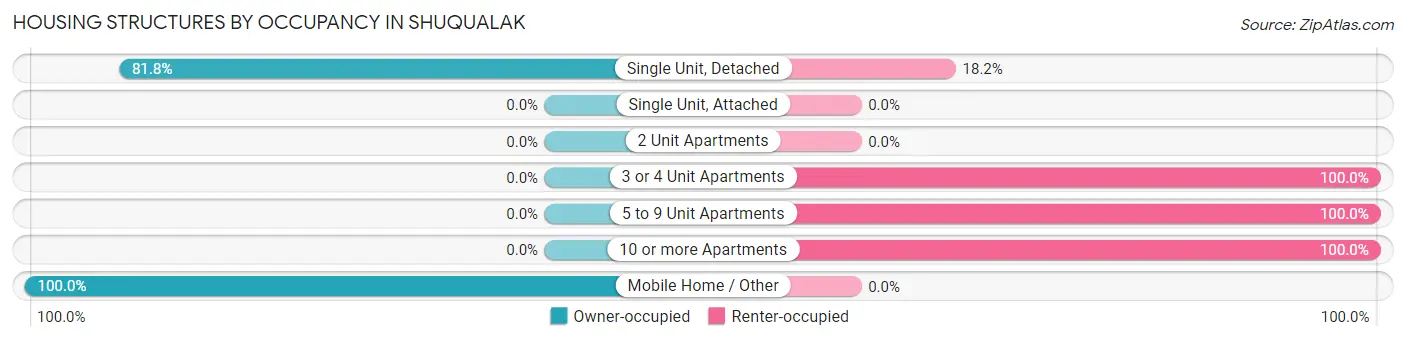
| Structure Type | Owner-occupied | Renter-occupied |
| Single Unit, Detached | 81 (81.8%) | 18 (18.2%) |
| Single Unit, Attached | 0 (0.0%) | 0 (0.0%) |
| 2 Unit Apartments | 0 (0.0%) | 0 (0.0%) |
| 3 or 4 Unit Apartments | 0 (0.0%) | 3 (100.0%) |
| 5 to 9 Unit Apartments | 0 (0.0%) | 5 (100.0%) |
| 10 or more Apartments | 0 (0.0%) | 8 (100.0%) |
| Mobile Home / Other | 6 (100.0%) | 0 (0.0%) |
| Total | 87 (71.9%) | 34 (28.1%) |
Housing Structures by Number of Rooms in Shuqualak
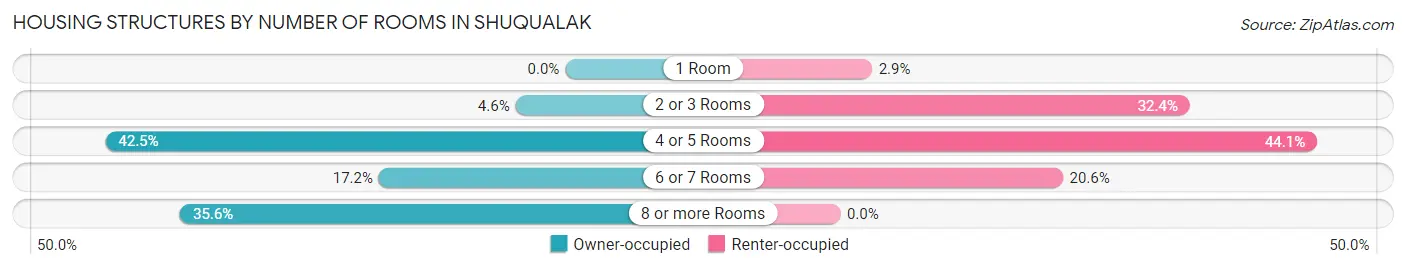
| Number of Rooms | Owner-occupied | Renter-occupied |
| 1 Room | 0 (0.0%) | 1 (2.9%) |
| 2 or 3 Rooms | 4 (4.6%) | 11 (32.4%) |
| 4 or 5 Rooms | 37 (42.5%) | 15 (44.1%) |
| 6 or 7 Rooms | 15 (17.2%) | 7 (20.6%) |
| 8 or more Rooms | 31 (35.6%) | 0 (0.0%) |
| Total | 87 (100.0%) | 34 (100.0%) |
Housing Structure by Heating Type in Shuqualak
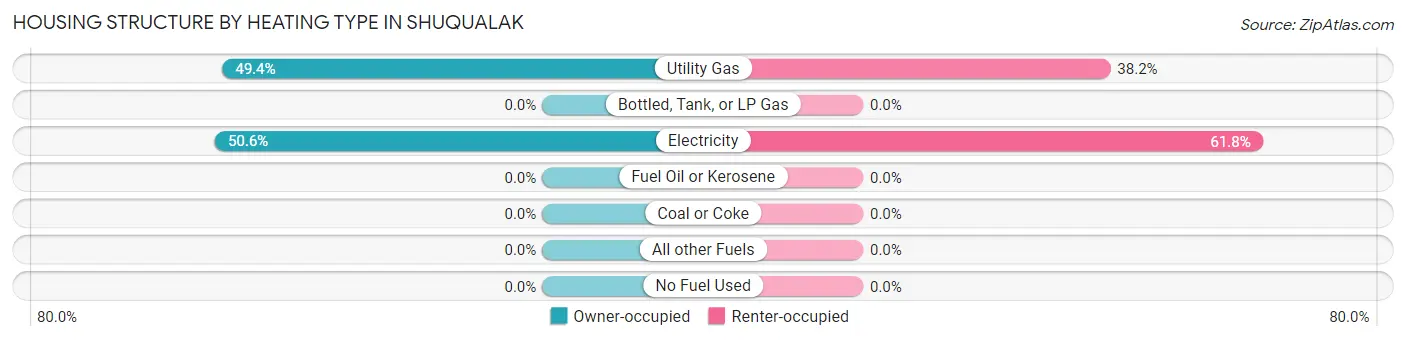
| Heating Type | Owner-occupied | Renter-occupied |
| Utility Gas | 43 (49.4%) | 13 (38.2%) |
| Bottled, Tank, or LP Gas | 0 (0.0%) | 0 (0.0%) |
| Electricity | 44 (50.6%) | 21 (61.8%) |
| Fuel Oil or Kerosene | 0 (0.0%) | 0 (0.0%) |
| Coal or Coke | 0 (0.0%) | 0 (0.0%) |
| All other Fuels | 0 (0.0%) | 0 (0.0%) |
| No Fuel Used | 0 (0.0%) | 0 (0.0%) |
| Total | 87 (100.0%) | 34 (100.0%) |
Household Vehicle Usage in Shuqualak
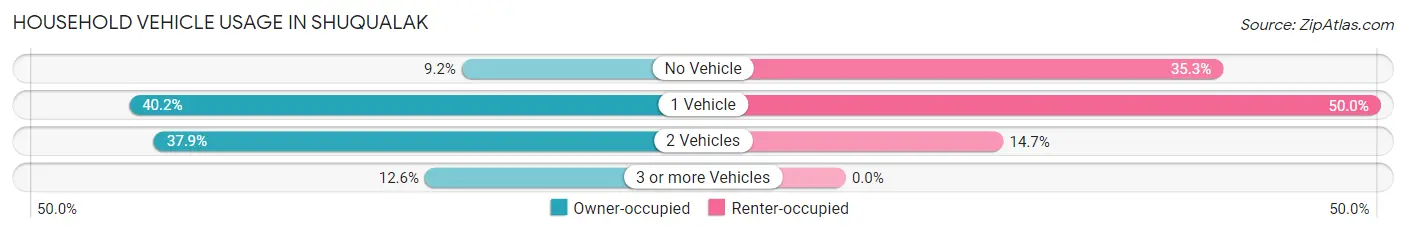
| Vehicles per Household | Owner-occupied | Renter-occupied |
| No Vehicle | 8 (9.2%) | 12 (35.3%) |
| 1 Vehicle | 35 (40.2%) | 17 (50.0%) |
| 2 Vehicles | 33 (37.9%) | 5 (14.7%) |
| 3 or more Vehicles | 11 (12.6%) | 0 (0.0%) |
| Total | 87 (100.0%) | 34 (100.0%) |
Real Estate & Mortgages in Shuqualak
Real Estate and Mortgage Overview in Shuqualak
| Characteristic | Without Mortgage | With Mortgage |
| Housing Units | 59 | 28 |
| Median Property Value | $50,900 | $125,000 |
| Median Household Income | $43,750 | $2 |
| Monthly Housing Costs | $426 | $0 |
| Real Estate Taxes | $843 | $3 |
Property Value by Mortgage Status in Shuqualak
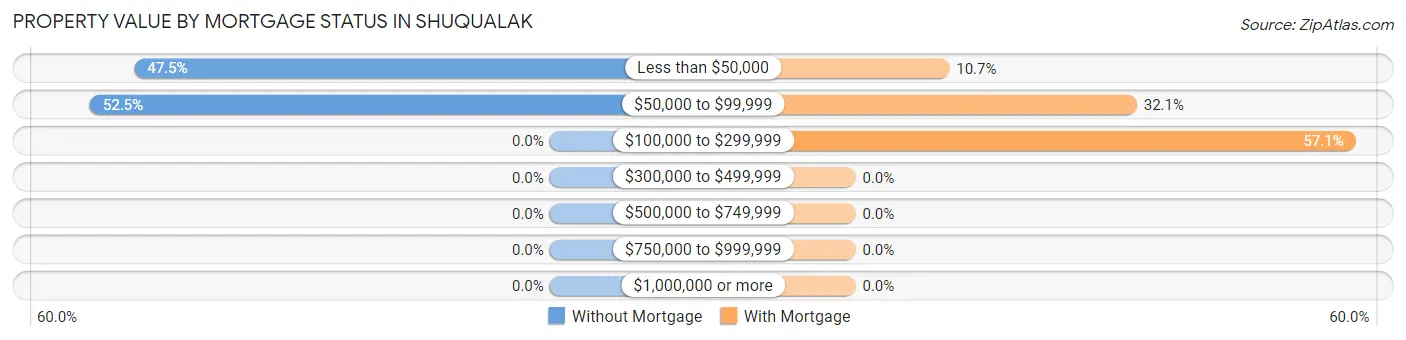
| Property Value | Without Mortgage | With Mortgage |
| Less than $50,000 | 28 (47.5%) | 3 (10.7%) |
| $50,000 to $99,999 | 31 (52.5%) | 9 (32.1%) |
| $100,000 to $299,999 | 0 (0.0%) | 16 (57.1%) |
| $300,000 to $499,999 | 0 (0.0%) | 0 (0.0%) |
| $500,000 to $749,999 | 0 (0.0%) | 0 (0.0%) |
| $750,000 to $999,999 | 0 (0.0%) | 0 (0.0%) |
| $1,000,000 or more | 0 (0.0%) | 0 (0.0%) |
| Total | 59 (100.0%) | 28 (100.0%) |
Household Income by Mortgage Status in Shuqualak
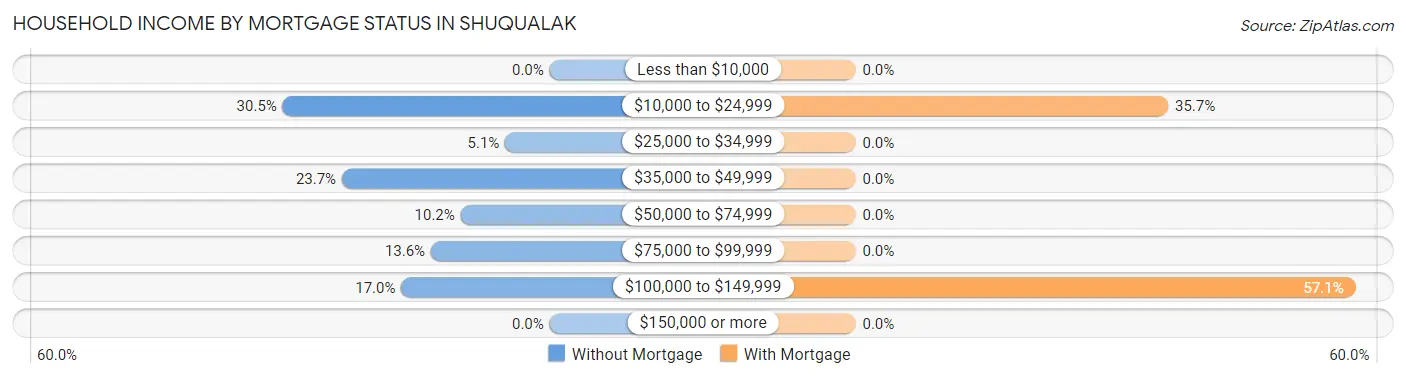
| Household Income | Without Mortgage | With Mortgage |
| Less than $10,000 | 0 (0.0%) | 0 (0.0%) |
| $10,000 to $24,999 | 18 (30.5%) | 10 (35.7%) |
| $25,000 to $34,999 | 3 (5.1%) | 0 (0.0%) |
| $35,000 to $49,999 | 14 (23.7%) | 0 (0.0%) |
| $50,000 to $74,999 | 6 (10.2%) | 0 (0.0%) |
| $75,000 to $99,999 | 8 (13.6%) | 0 (0.0%) |
| $100,000 to $149,999 | 10 (17.0%) | 16 (57.1%) |
| $150,000 or more | 0 (0.0%) | 0 (0.0%) |
| Total | 59 (100.0%) | 28 (100.0%) |
Property Value to Household Income Ratio in Shuqualak
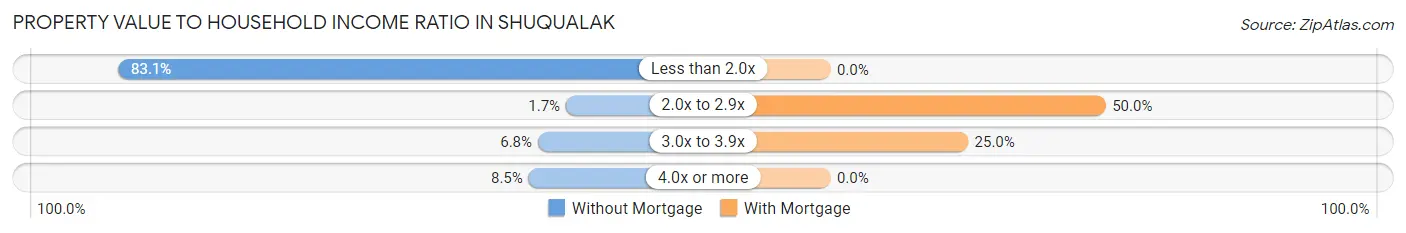
| Value-to-Income Ratio | Without Mortgage | With Mortgage |
| Less than 2.0x | 49 (83.1%) | 0 (0.0%) |
| 2.0x to 2.9x | 1 (1.7%) | 14 (50.0%) |
| 3.0x to 3.9x | 4 (6.8%) | 7 (25.0%) |
| 4.0x or more | 5 (8.5%) | 0 (0.0%) |
| Total | 59 (100.0%) | 28 (100.0%) |
Real Estate Taxes by Mortgage Status in Shuqualak
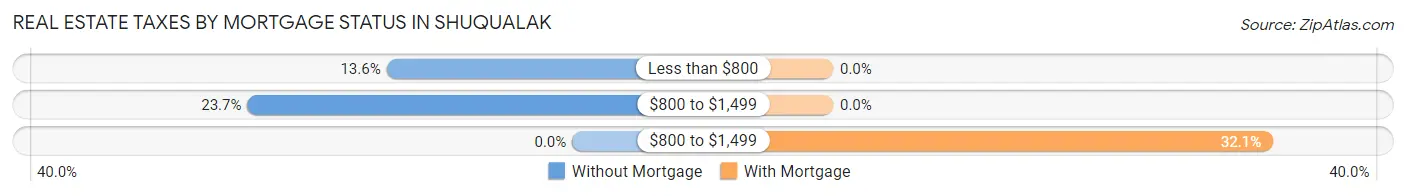
| Property Taxes | Without Mortgage | With Mortgage |
| Less than $800 | 8 (13.6%) | 0 (0.0%) |
| $800 to $1,499 | 14 (23.7%) | 0 (0.0%) |
| $800 to $1,499 | 0 (0.0%) | 9 (32.1%) |
| Total | 59 (100.0%) | 28 (100.0%) |
Health & Disability in Shuqualak
Health Insurance Coverage by Age in Shuqualak
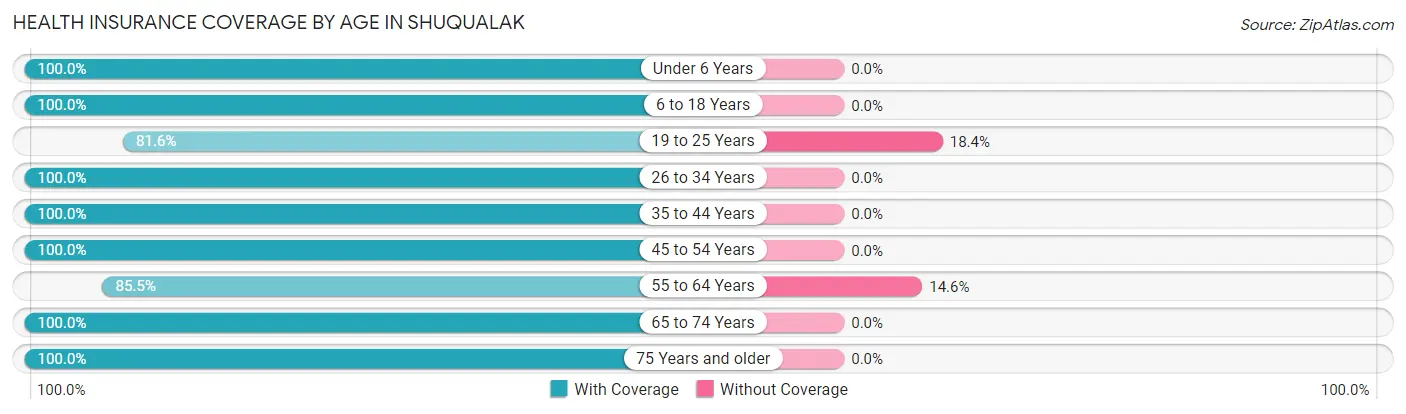
| Age Bracket | With Coverage | Without Coverage |
| Under 6 Years | 60 (100.0%) | 0 (0.0%) |
| 6 to 18 Years | 58 (100.0%) | 0 (0.0%) |
| 19 to 25 Years | 40 (81.6%) | 9 (18.4%) |
| 26 to 34 Years | 22 (100.0%) | 0 (0.0%) |
| 35 to 44 Years | 46 (100.0%) | 0 (0.0%) |
| 45 to 54 Years | 35 (100.0%) | 0 (0.0%) |
| 55 to 64 Years | 47 (85.5%) | 8 (14.5%) |
| 65 to 74 Years | 13 (100.0%) | 0 (0.0%) |
| 75 Years and older | 16 (100.0%) | 0 (0.0%) |
| Total | 337 (95.2%) | 17 (4.8%) |
Health Insurance Coverage by Citizenship Status in Shuqualak
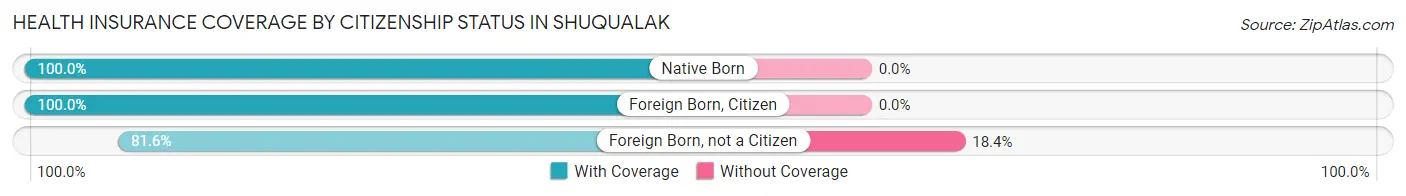
| Citizenship Status | With Coverage | Without Coverage |
| Native Born | 60 (100.0%) | 0 (0.0%) |
| Foreign Born, Citizen | 58 (100.0%) | 0 (0.0%) |
| Foreign Born, not a Citizen | 40 (81.6%) | 9 (18.4%) |
Health Insurance Coverage by Household Income in Shuqualak
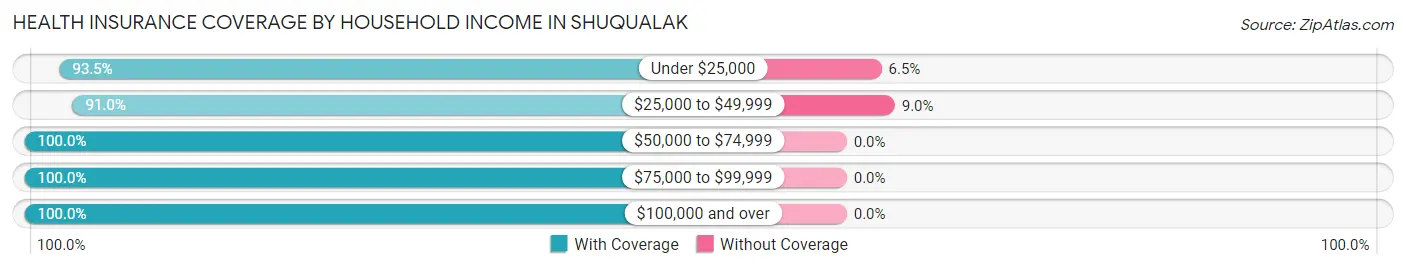
| Household Income | With Coverage | Without Coverage |
| Under $25,000 | 129 (93.5%) | 9 (6.5%) |
| $25,000 to $49,999 | 81 (91.0%) | 8 (9.0%) |
| $50,000 to $74,999 | 23 (100.0%) | 0 (0.0%) |
| $75,000 to $99,999 | 80 (100.0%) | 0 (0.0%) |
| $100,000 and over | 24 (100.0%) | 0 (0.0%) |
Public vs Private Health Insurance Coverage by Age in Shuqualak
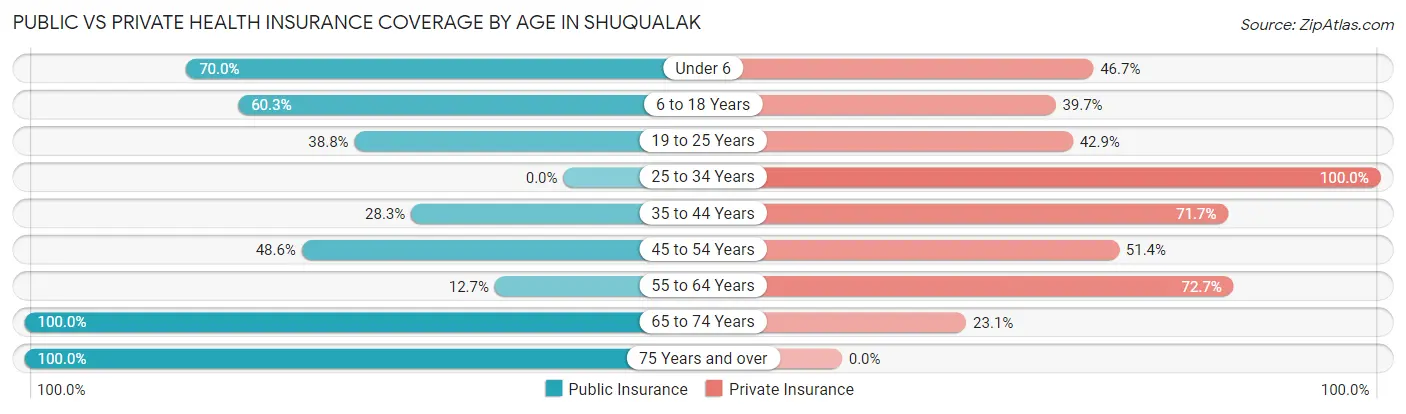
| Age Bracket | Public Insurance | Private Insurance |
| Under 6 | 42 (70.0%) | 28 (46.7%) |
| 6 to 18 Years | 35 (60.3%) | 23 (39.7%) |
| 19 to 25 Years | 19 (38.8%) | 21 (42.9%) |
| 25 to 34 Years | 0 (0.0%) | 22 (100.0%) |
| 35 to 44 Years | 13 (28.3%) | 33 (71.7%) |
| 45 to 54 Years | 17 (48.6%) | 18 (51.4%) |
| 55 to 64 Years | 7 (12.7%) | 40 (72.7%) |
| 65 to 74 Years | 13 (100.0%) | 3 (23.1%) |
| 75 Years and over | 16 (100.0%) | 0 (0.0%) |
| Total | 162 (45.8%) | 188 (53.1%) |
Disability Status by Sex by Age in Shuqualak
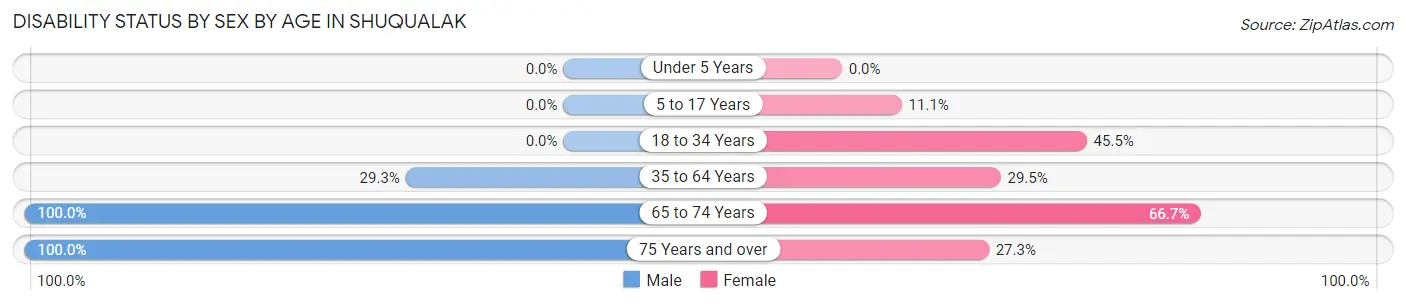
| Age Bracket | Male | Female |
| Under 5 Years | 0 (0.0%) | 0 (0.0%) |
| 5 to 17 Years | 0 (0.0%) | 2 (11.1%) |
| 18 to 34 Years | 0 (0.0%) | 20 (45.5%) |
| 35 to 64 Years | 12 (29.3%) | 28 (29.5%) |
| 65 to 74 Years | 7 (100.0%) | 4 (66.7%) |
| 75 Years and over | 5 (100.0%) | 3 (27.3%) |
Disability Class by Sex by Age in Shuqualak
Disability Class: Hearing Difficulty
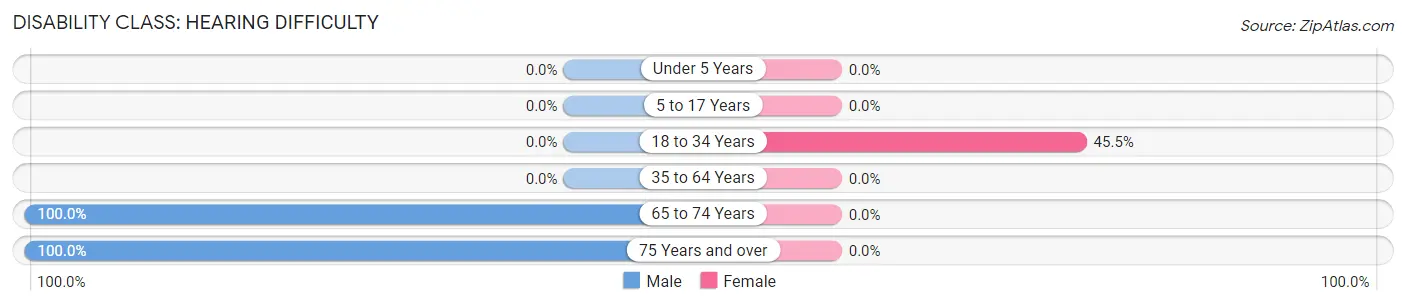
| Age Bracket | Male | Female |
| Under 5 Years | 0 (0.0%) | 0 (0.0%) |
| 5 to 17 Years | 0 (0.0%) | 0 (0.0%) |
| 18 to 34 Years | 0 (0.0%) | 20 (45.5%) |
| 35 to 64 Years | 0 (0.0%) | 0 (0.0%) |
| 65 to 74 Years | 7 (100.0%) | 0 (0.0%) |
| 75 Years and over | 5 (100.0%) | 0 (0.0%) |
Disability Class: Vision Difficulty
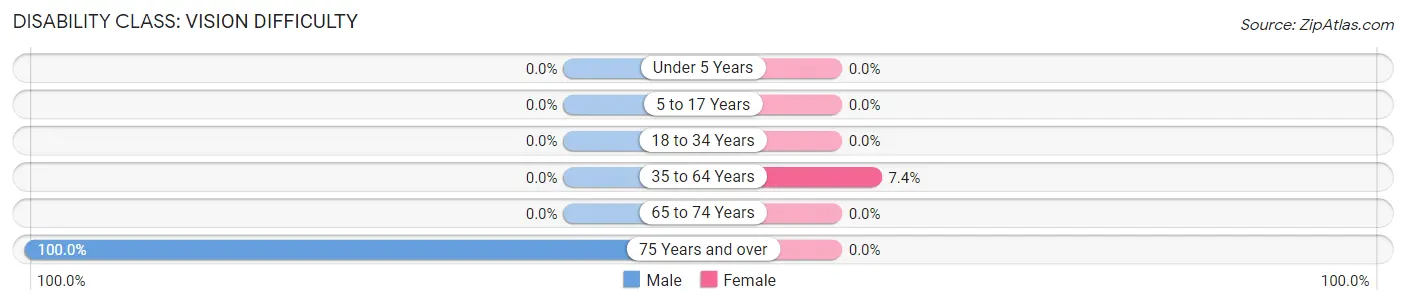
| Age Bracket | Male | Female |
| Under 5 Years | 0 (0.0%) | 0 (0.0%) |
| 5 to 17 Years | 0 (0.0%) | 0 (0.0%) |
| 18 to 34 Years | 0 (0.0%) | 0 (0.0%) |
| 35 to 64 Years | 0 (0.0%) | 7 (7.4%) |
| 65 to 74 Years | 0 (0.0%) | 0 (0.0%) |
| 75 Years and over | 5 (100.0%) | 0 (0.0%) |
Disability Class: Cognitive Difficulty
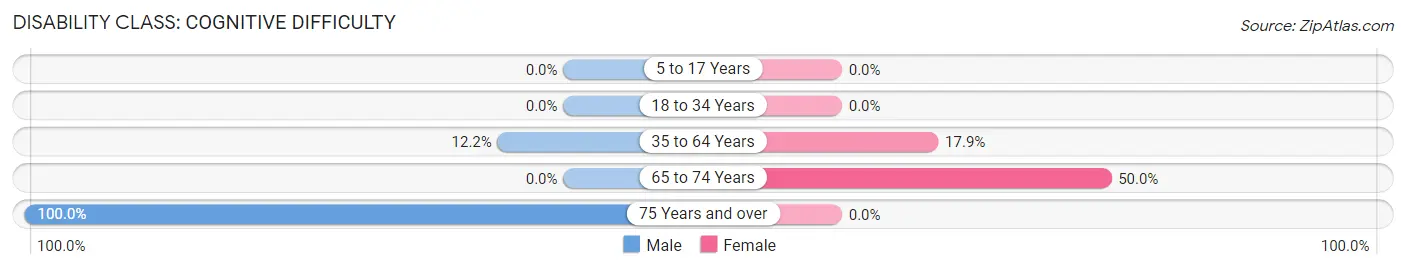
| Age Bracket | Male | Female |
| 5 to 17 Years | 0 (0.0%) | 0 (0.0%) |
| 18 to 34 Years | 0 (0.0%) | 0 (0.0%) |
| 35 to 64 Years | 5 (12.2%) | 17 (17.9%) |
| 65 to 74 Years | 0 (0.0%) | 3 (50.0%) |
| 75 Years and over | 5 (100.0%) | 0 (0.0%) |
Disability Class: Ambulatory Difficulty

| Age Bracket | Male | Female |
| 5 to 17 Years | 0 (0.0%) | 0 (0.0%) |
| 18 to 34 Years | 0 (0.0%) | 0 (0.0%) |
| 35 to 64 Years | 12 (29.3%) | 18 (19.0%) |
| 65 to 74 Years | 7 (100.0%) | 4 (66.7%) |
| 75 Years and over | 5 (100.0%) | 3 (27.3%) |
Disability Class: Self-Care Difficulty
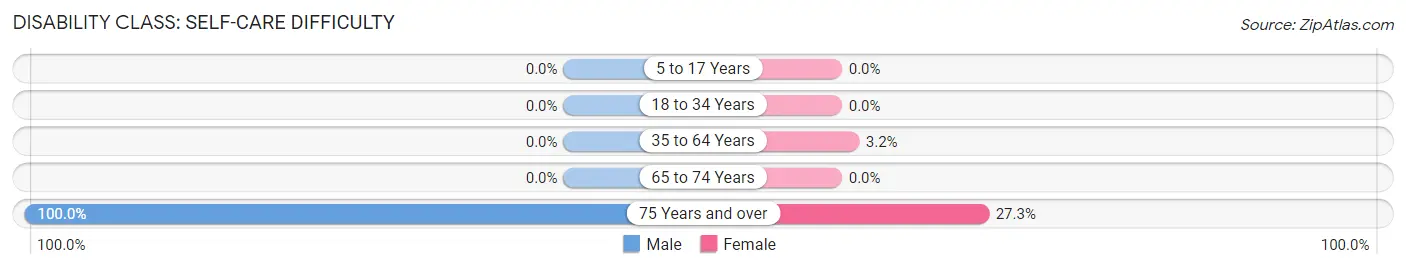
| Age Bracket | Male | Female |
| 5 to 17 Years | 0 (0.0%) | 0 (0.0%) |
| 18 to 34 Years | 0 (0.0%) | 0 (0.0%) |
| 35 to 64 Years | 0 (0.0%) | 3 (3.2%) |
| 65 to 74 Years | 0 (0.0%) | 0 (0.0%) |
| 75 Years and over | 5 (100.0%) | 3 (27.3%) |
Technology Access in Shuqualak
Computing Device Access in Shuqualak
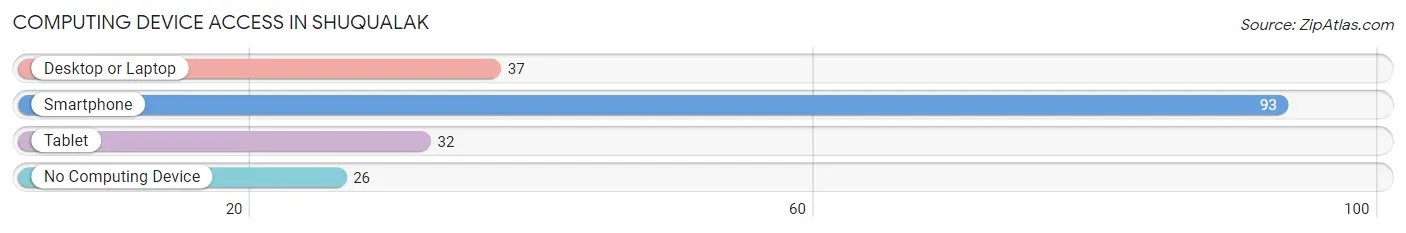
| Device Type | # Households | % Households |
| Desktop or Laptop | 37 | 30.6% |
| Smartphone | 93 | 76.9% |
| Tablet | 32 | 26.5% |
| No Computing Device | 26 | 21.5% |
| Total | 121 | 100.0% |
Internet Access in Shuqualak
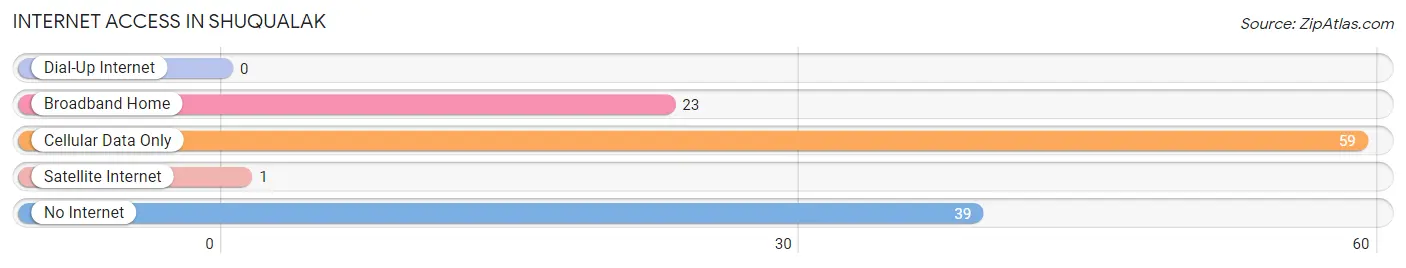
| Internet Type | # Households | % Households |
| Dial-Up Internet | 0 | 0.0% |
| Broadband Home | 23 | 19.0% |
| Cellular Data Only | 59 | 48.8% |
| Satellite Internet | 1 | 0.8% |
| No Internet | 39 | 32.2% |
| Total | 121 | 100.0% |
Shuqualak Summary
Shuqualak, Mississippi is a small town located in Noxubee County in the east-central part of the state. The town is situated along the banks of the Shuqualak Creek, which is a tributary of the Tombigbee River. The town was founded in 1837 and is named after the Choctaw word for “black water”. The population of Shuqualak was estimated to be 545 in 2019.
History
Shuqualak was founded in 1837 by a group of settlers from Georgia and Alabama. The town was originally known as “Shuqualak Station” and was a stop on the Mobile and Ohio Railroad. The town was officially incorporated in 1845 and was named after the Choctaw word for “black water”.
During the Civil War, Shuqualak was a major supply depot for the Confederate Army. The town was also the site of a major battle in 1863, when Union forces attempted to capture the town. The Union forces were unsuccessful and the town remained in Confederate hands until the end of the war.
In the late 19th century, Shuqualak was a thriving agricultural center. The town was home to several cotton gins, sawmills, and other businesses. The town also had a thriving African-American community, which included several churches, schools, and businesses.
Geography
Shuqualak is located in Noxubee County in the east-central part of Mississippi. The town is situated along the banks of the Shuqualak Creek, which is a tributary of the Tombigbee River. The town is located approximately 20 miles south of the city of Macon and 40 miles north of the city of Meridian.
The town is located in a rural area and is surrounded by farmland. The terrain is mostly flat and the climate is humid subtropical. The average temperature in the summer is around 90 degrees Fahrenheit and the average temperature in the winter is around 50 degrees Fahrenheit.
Economy
The economy of Shuqualak is largely based on agriculture. The town is home to several cotton gins, sawmills, and other businesses. The town also has a small manufacturing sector, which includes a furniture factory and a woodworking shop.
The town also has a small tourism industry, which includes several bed and breakfasts and a few restaurants. The town is also home to several churches, schools, and other businesses.
Demographics
The population of Shuqualak was estimated to be 545 in 2019. The town is predominantly white, with African-Americans making up approximately 25% of the population. The median household income in the town is approximately $30,000. The town has a poverty rate of approximately 20%.
The town is served by the Noxubee County School District, which includes two elementary schools, one middle school, and one high school. The town also has a public library and a few churches.
Conclusion
Shuqualak, Mississippi is a small town located in Noxubee County in the east-central part of the state. The town was founded in 1837 and is named after the Choctaw word for “black water”. The town has a population of approximately 545 and is predominantly white. The economy of the town is largely based on agriculture and the town also has a small manufacturing sector and a small tourism industry. The town is served by the Noxubee County School District and has a public library and several churches.
Common Questions
What is Per Capita Income in Shuqualak?
Per Capita income in Shuqualak is $18,232.
What is the Median Family Income in Shuqualak?
Median Family Income in Shuqualak is $62,708.
What is the Median Household income in Shuqualak?
Median Household Income in Shuqualak is $35,625.
What is Income or Wage Gap in Shuqualak?
Income or Wage Gap in Shuqualak is 25.5%.
Women in Shuqualak earn 74.5 cents for every dollar earned by a man.
What is Family Income Deficit in Shuqualak?
Family Income Deficit in Shuqualak is $16,081.
Families that are below poverty line in Shuqualak earn $16,081 less on average than the poverty threshold level.
What is Inequality or Gini Index in Shuqualak?
Inequality or Gini Index in Shuqualak is 0.46.
What is the Total Population of Shuqualak?
Total Population of Shuqualak is 354.
What is the Total Male Population of Shuqualak?
Total Male Population of Shuqualak is 148.
What is the Total Female Population of Shuqualak?
Total Female Population of Shuqualak is 206.
What is the Ratio of Males per 100 Females in Shuqualak?
There are 71.84 Males per 100 Females in Shuqualak.
What is the Ratio of Females per 100 Males in Shuqualak?
There are 139.19 Females per 100 Males in Shuqualak.
What is the Median Population Age in Shuqualak?
Median Population Age in Shuqualak is 34.2 Years.
What is the Average Family Size in Shuqualak
Average Family Size in Shuqualak is 4.2 People.
What is the Average Household Size in Shuqualak
Average Household Size in Shuqualak is 2.9 People.
How Large is the Labor Force in Shuqualak?
There are 152 People in the Labor Forcein in Shuqualak.
What is the Percentage of People in the Labor Force in Shuqualak?
59.6% of People are in the Labor Force in Shuqualak.
What is the Unemployment Rate in Shuqualak?
Unemployment Rate in Shuqualak is 10.5%.