Winona, MS Map & Demographics
Winona Map
Winona Overview
$14,769
PER CAPITA INCOME
$27,670
AVG FAMILY INCOME
$26,250
AVG HOUSEHOLD INCOME
50.8%
WAGE / INCOME GAP [ % ]
49.2¢/ $1
WAGE / INCOME GAP [ $ ]
$12,283
FAMILY INCOME DEFICIT
0.46
INEQUALITY / GINI INDEX
4,422
TOTAL POPULATION
1,930
MALE POPULATION
2,492
FEMALE POPULATION
77.45
MALES / 100 FEMALES
129.12
FEMALES / 100 MALES
33.7
MEDIAN AGE
3.4
AVG FAMILY SIZE
2.7
AVG HOUSEHOLD SIZE
1,470
LABOR FORCE [ PEOPLE ]
45.4%
PERCENT IN LABOR FORCE
8.6%
UNEMPLOYMENT RATE
Winona Zip Codes
Winona Area Codes
Income in Winona
Income Overview in Winona
Per Capita Income in Winona is $14,769, while median incomes of families and households are $27,670 and $26,250 respectively.
| Characteristic | Number | Measure |
| Per Capita Income | 4,422 | $14,769 |
| Median Family Income | 1,039 | $27,670 |
| Mean Family Income | 1,039 | $41,961 |
| Median Household Income | 1,569 | $26,250 |
| Mean Household Income | 1,569 | $37,843 |
| Income Deficit | 1,039 | $12,283 |
| Wage / Income Gap (%) | 4,422 | 50.80% |
| Wage / Income Gap ($) | 4,422 | 49.20¢ per $1 |
| Gini / Inequality Index | 4,422 | 0.46 |
Earnings by Sex in Winona
Average Earnings in Winona are $24,637, $33,333 for men and $16,401 for women, a difference of 50.8%.
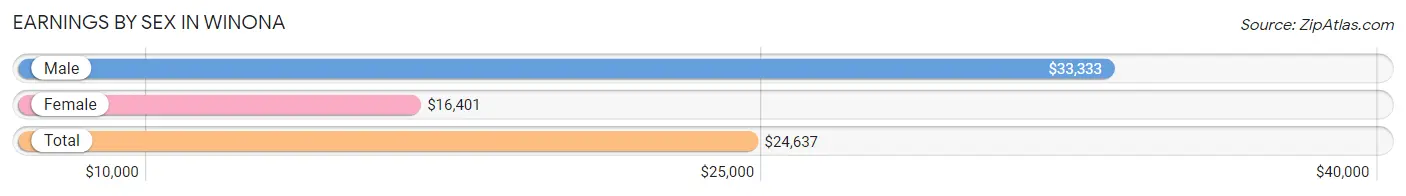
| Sex | Number | Average Earnings |
| Male | 596 (40.7%) | $33,333 |
| Female | 869 (59.3%) | $16,401 |
| Total | 1,465 (100.0%) | $24,637 |
Earnings by Sex by Income Bracket in Winona
The most common earnings brackets in Winona are $25,000 to $29,999 for men (127 | 21.3%) and $15,000 to $17,499 for women (190 | 21.9%).
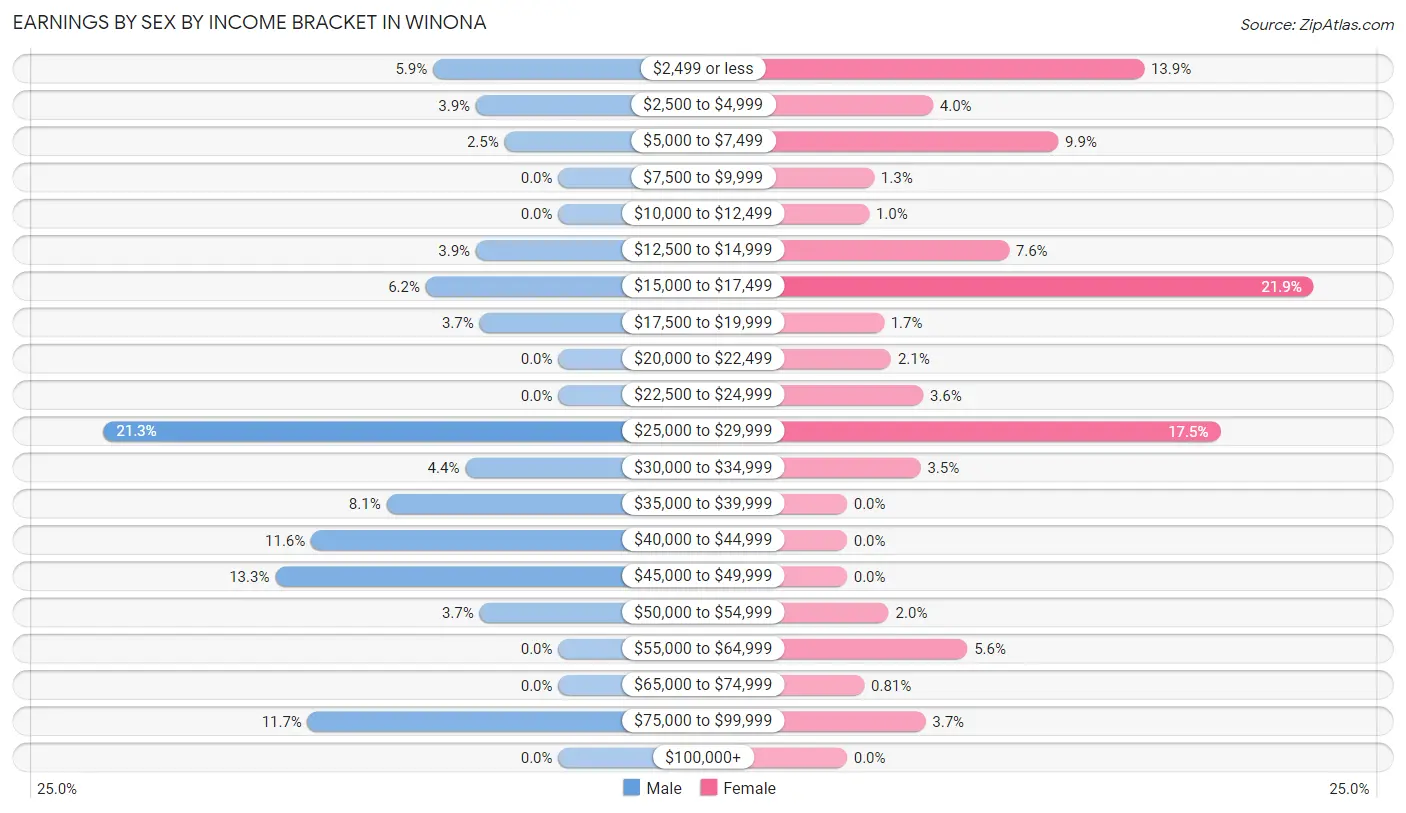
| Income | Male | Female |
| $2,499 or less | 35 (5.9%) | 121 (13.9%) |
| $2,500 to $4,999 | 23 (3.9%) | 35 (4.0%) |
| $5,000 to $7,499 | 15 (2.5%) | 86 (9.9%) |
| $7,500 to $9,999 | 0 (0.0%) | 11 (1.3%) |
| $10,000 to $12,499 | 0 (0.0%) | 9 (1.0%) |
| $12,500 to $14,999 | 23 (3.9%) | 66 (7.6%) |
| $15,000 to $17,499 | 37 (6.2%) | 190 (21.9%) |
| $17,500 to $19,999 | 22 (3.7%) | 15 (1.7%) |
| $20,000 to $22,499 | 0 (0.0%) | 18 (2.1%) |
| $22,500 to $24,999 | 0 (0.0%) | 31 (3.6%) |
| $25,000 to $29,999 | 127 (21.3%) | 152 (17.5%) |
| $30,000 to $34,999 | 26 (4.4%) | 30 (3.5%) |
| $35,000 to $39,999 | 48 (8.1%) | 0 (0.0%) |
| $40,000 to $44,999 | 69 (11.6%) | 0 (0.0%) |
| $45,000 to $49,999 | 79 (13.3%) | 0 (0.0%) |
| $50,000 to $54,999 | 22 (3.7%) | 17 (2.0%) |
| $55,000 to $64,999 | 0 (0.0%) | 49 (5.6%) |
| $65,000 to $74,999 | 0 (0.0%) | 7 (0.8%) |
| $75,000 to $99,999 | 70 (11.7%) | 32 (3.7%) |
| $100,000+ | 0 (0.0%) | 0 (0.0%) |
| Total | 596 (100.0%) | 869 (100.0%) |
Earnings by Sex by Educational Attainment in Winona
Average earnings in Winona are $35,368 for men and $16,512 for women, a difference of 53.3%. Men with an educational attainment of high school diploma enjoy the highest average annual earnings of $41,500, while those with less than high school education earn the least with $29,279. Women with an educational attainment of college or associate's degree earn the most with the average annual earnings of $22,841, while those with graduate degree education have the smallest earnings of $16,514.
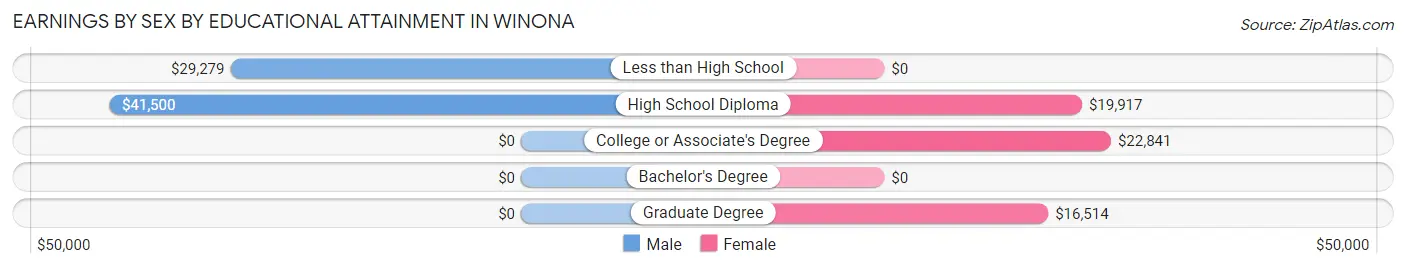
| Educational Attainment | Male Income | Female Income |
| Less than High School | $29,279 | $0 |
| High School Diploma | $41,500 | $19,917 |
| College or Associate's Degree | - | - |
| Bachelor's Degree | - | - |
| Graduate Degree | - | - |
| Total | $35,368 | $16,512 |
Family Income in Winona
Family Income Brackets in Winona
According to the Winona family income data, there are 246 families falling into the $25,000 to $34,999 income range, which is the most common income bracket and makes up 23.7% of all families. Conversely, the $200,000+ income bracket is the least frequent group with only 4 families (0.4%) belonging to this category.
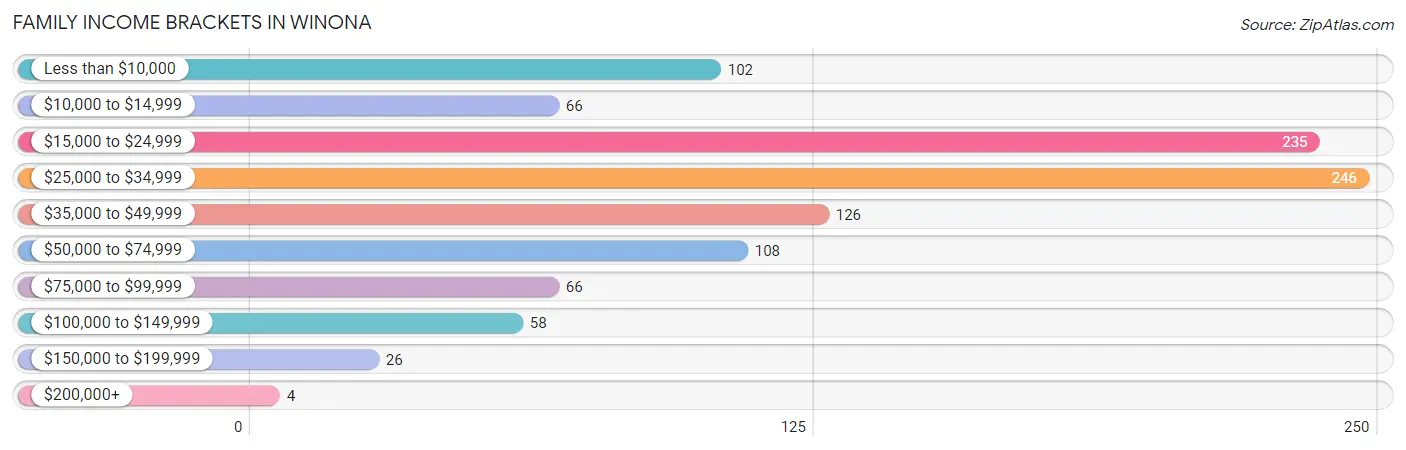
| Income Bracket | # Families | % Families |
| Less than $10,000 | 102 | 9.8% |
| $10,000 to $14,999 | 66 | 6.4% |
| $15,000 to $24,999 | 235 | 22.6% |
| $25,000 to $34,999 | 246 | 23.7% |
| $35,000 to $49,999 | 126 | 12.1% |
| $50,000 to $74,999 | 108 | 10.4% |
| $75,000 to $99,999 | 66 | 6.4% |
| $100,000 to $149,999 | 58 | 5.6% |
| $150,000 to $199,999 | 26 | 2.5% |
| $200,000+ | 4 | 0.4% |
Family Income by Famaliy Size in Winona
4-person families (72 | 6.9%) account for the highest median family income in Winona with $70,833 per family, while 4-person families (72 | 6.9%) have the highest median income of $17,708 per family member.
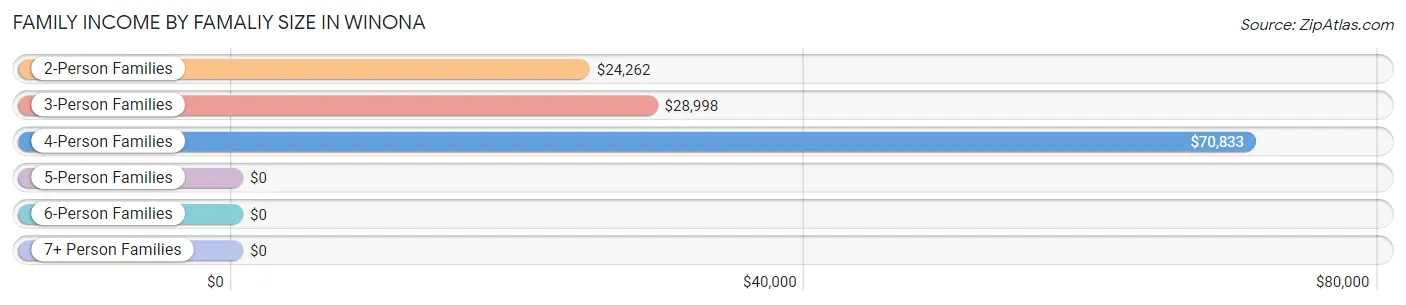
| Income Bracket | # Families | Median Income |
| 2-Person Families | 547 (52.6%) | $24,262 |
| 3-Person Families | 281 (27.1%) | $28,998 |
| 4-Person Families | 72 (6.9%) | $70,833 |
| 5-Person Families | 72 (6.9%) | $0 |
| 6-Person Families | 16 (1.5%) | $0 |
| 7+ Person Families | 51 (4.9%) | $0 |
| Total | 1,039 (100.0%) | $27,670 |
Family Income by Number of Earners in Winona
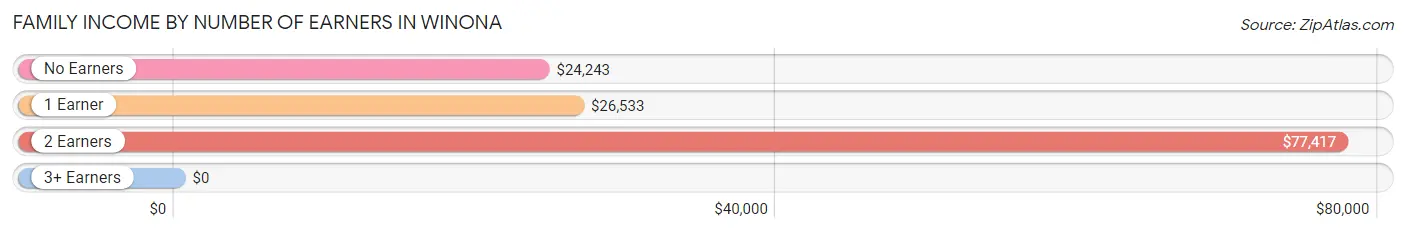
| Number of Earners | # Families | Median Income |
| No Earners | 291 (28.0%) | $24,243 |
| 1 Earner | 548 (52.7%) | $26,533 |
| 2 Earners | 123 (11.8%) | $77,417 |
| 3+ Earners | 77 (7.4%) | $0 |
| Total | 1,039 (100.0%) | $27,670 |
Household Income in Winona
Household Income Brackets in Winona
With 377 households falling in the category, the $15,000 to $24,999 income range is the most frequent in Winona, accounting for 24.0% of all households. In contrast, only 5 households (0.3%) fall into the $200,000+ income bracket, making it the least populous group.
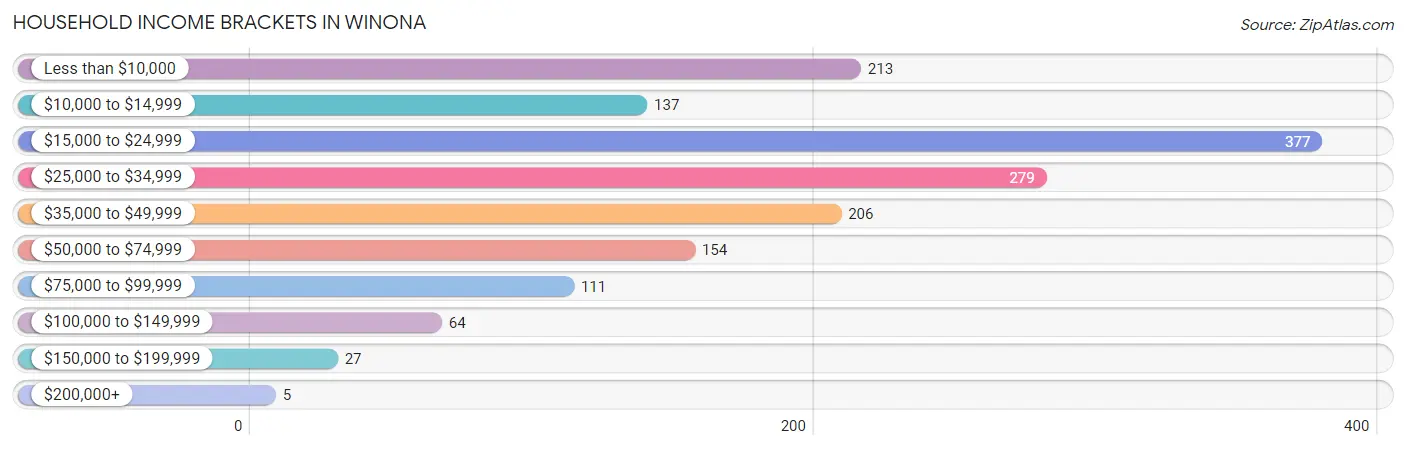
| Income Bracket | # Households | % Households |
| Less than $10,000 | 213 | 13.6% |
| $10,000 to $14,999 | 137 | 8.7% |
| $15,000 to $24,999 | 377 | 24.0% |
| $25,000 to $34,999 | 279 | 17.8% |
| $35,000 to $49,999 | 206 | 13.1% |
| $50,000 to $74,999 | 154 | 9.8% |
| $75,000 to $99,999 | 111 | 7.1% |
| $100,000 to $149,999 | 64 | 4.1% |
| $150,000 to $199,999 | 27 | 1.7% |
| $200,000+ | 5 | 0.3% |
Household Income by Householder Age in Winona
The median household income in Winona is $26,250, with the highest median household income of $27,950 found in the 25 to 44 years age bracket for the primary householder. A total of 528 households (33.7%) fall into this category.
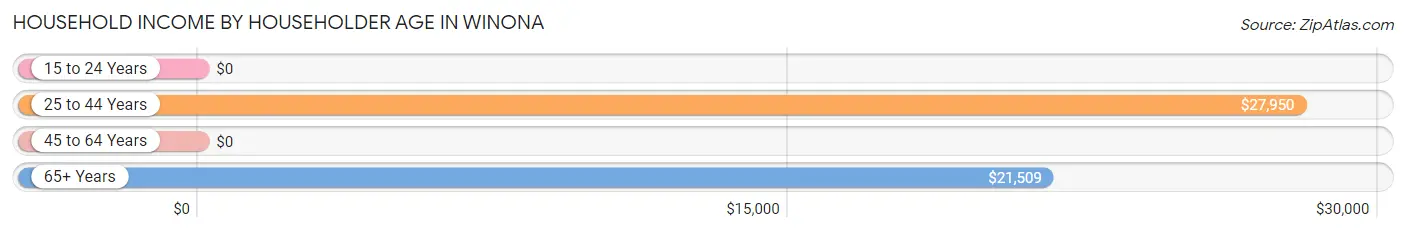
| Income Bracket | # Households | Median Income |
| 15 to 24 Years | 0 (0.0%) | $0 |
| 25 to 44 Years | 528 (33.7%) | $27,950 |
| 45 to 64 Years | 574 (36.6%) | $0 |
| 65+ Years | 467 (29.8%) | $21,509 |
| Total | 1,569 (100.0%) | $26,250 |
Poverty in Winona
Income Below Poverty by Sex and Age in Winona
With 34.1% poverty level for males and 40.9% for females among the residents of Winona, under 5 year old males and 12 to 14 year old females are the most vulnerable to poverty, with 125 males (100.0%) and 126 females (100.0%) in their respective age groups living below the poverty level.
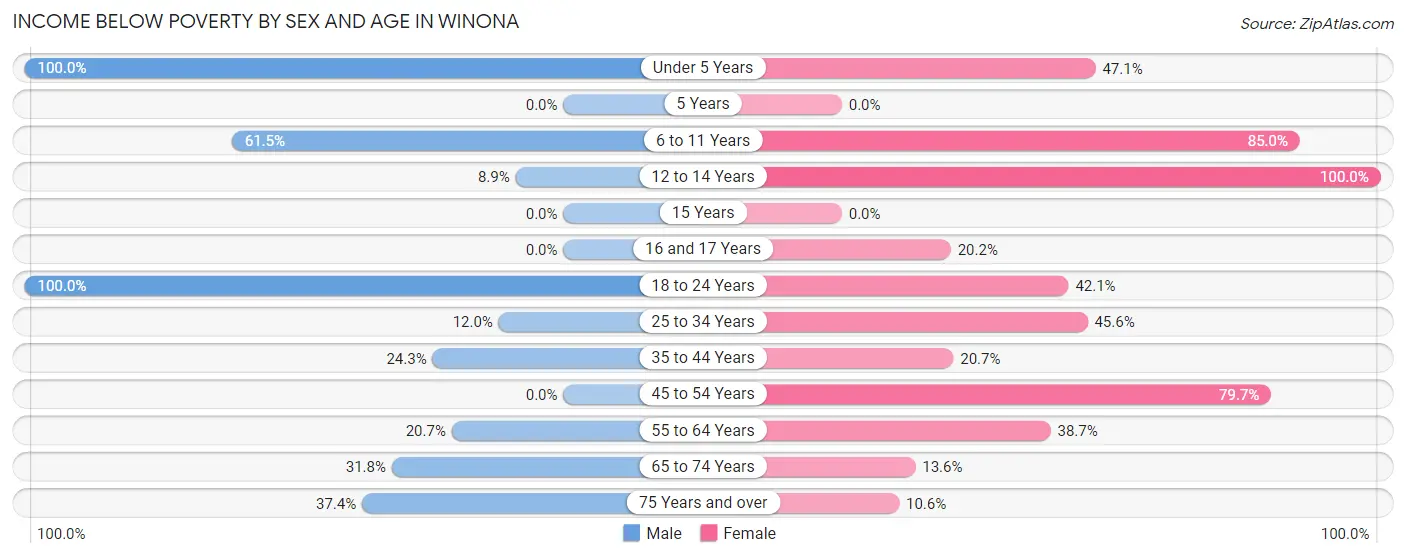
| Age Bracket | Male | Female |
| Under 5 Years | 125 (100.0%) | 81 (47.1%) |
| 5 Years | 0 (0.0%) | 0 (0.0%) |
| 6 to 11 Years | 184 (61.5%) | 68 (85.0%) |
| 12 to 14 Years | 22 (8.9%) | 126 (100.0%) |
| 15 Years | 0 (0.0%) | 0 (0.0%) |
| 16 and 17 Years | 0 (0.0%) | 36 (20.2%) |
| 18 to 24 Years | 80 (100.0%) | 175 (42.1%) |
| 25 to 34 Years | 27 (12.0%) | 88 (45.6%) |
| 35 to 44 Years | 51 (24.3%) | 66 (20.7%) |
| 45 to 54 Years | 0 (0.0%) | 208 (79.7%) |
| 55 to 64 Years | 52 (20.7%) | 98 (38.7%) |
| 65 to 74 Years | 71 (31.8%) | 15 (13.6%) |
| 75 Years and over | 34 (37.4%) | 24 (10.6%) |
| Total | 646 (34.1%) | 985 (40.9%) |
Income Above Poverty by Sex and Age in Winona
According to the poverty statistics in Winona, males aged 5 years and females aged 5 years are the age groups that are most secure financially, with 100.0% of males and 100.0% of females in these age groups living above the poverty line.
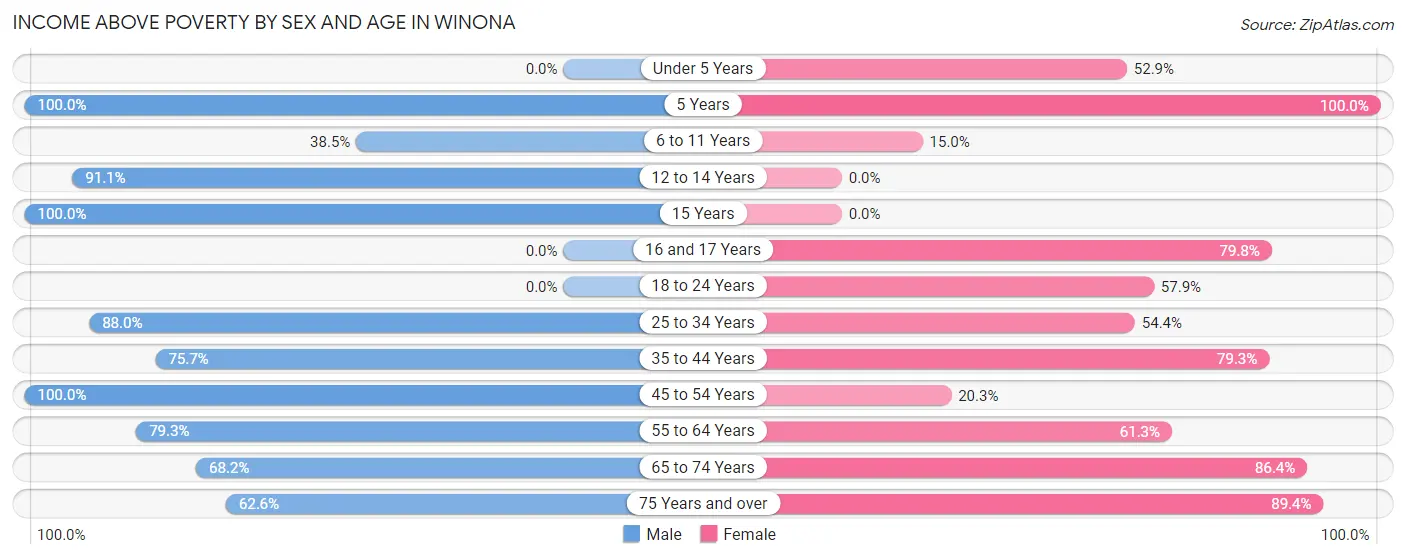
| Age Bracket | Male | Female |
| Under 5 Years | 0 (0.0%) | 91 (52.9%) |
| 5 Years | 30 (100.0%) | 73 (100.0%) |
| 6 to 11 Years | 115 (38.5%) | 12 (15.0%) |
| 12 to 14 Years | 226 (91.1%) | 0 (0.0%) |
| 15 Years | 31 (100.0%) | 0 (0.0%) |
| 16 and 17 Years | 0 (0.0%) | 142 (79.8%) |
| 18 to 24 Years | 0 (0.0%) | 241 (57.9%) |
| 25 to 34 Years | 198 (88.0%) | 105 (54.4%) |
| 35 to 44 Years | 159 (75.7%) | 253 (79.3%) |
| 45 to 54 Years | 83 (100.0%) | 53 (20.3%) |
| 55 to 64 Years | 199 (79.3%) | 155 (61.3%) |
| 65 to 74 Years | 152 (68.2%) | 95 (86.4%) |
| 75 Years and over | 57 (62.6%) | 202 (89.4%) |
| Total | 1,250 (65.9%) | 1,422 (59.1%) |
Income Below Poverty Among Married-Couple Families in Winona
The poverty statistics for married-couple families in Winona show that 6.2% or 28 of the total 451 families live below the poverty line. Families with 3 or 4 children have the highest poverty rate of 50.0%, comprising of 17 families. On the other hand, families with no children have the lowest poverty rate of 0.8%, which includes 2 families.
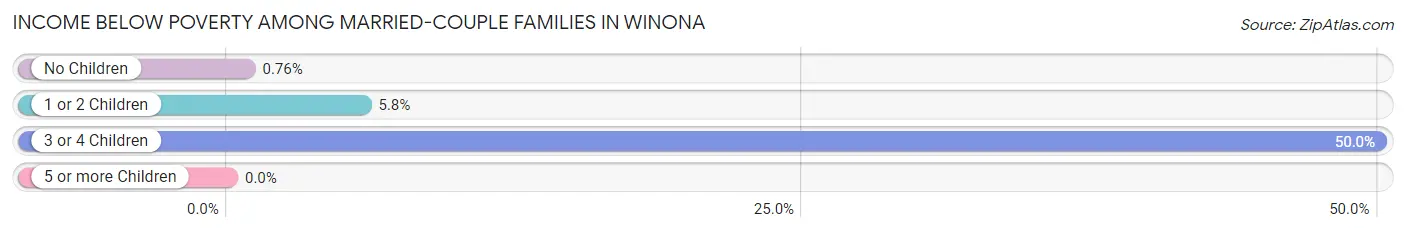
| Children | Above Poverty | Below Poverty |
| No Children | 260 (99.2%) | 2 (0.8%) |
| 1 or 2 Children | 146 (94.2%) | 9 (5.8%) |
| 3 or 4 Children | 17 (50.0%) | 17 (50.0%) |
| 5 or more Children | 0 (0.0%) | 0 (0.0%) |
| Total | 423 (93.8%) | 28 (6.2%) |
Income Below Poverty Among Single-Parent Households in Winona
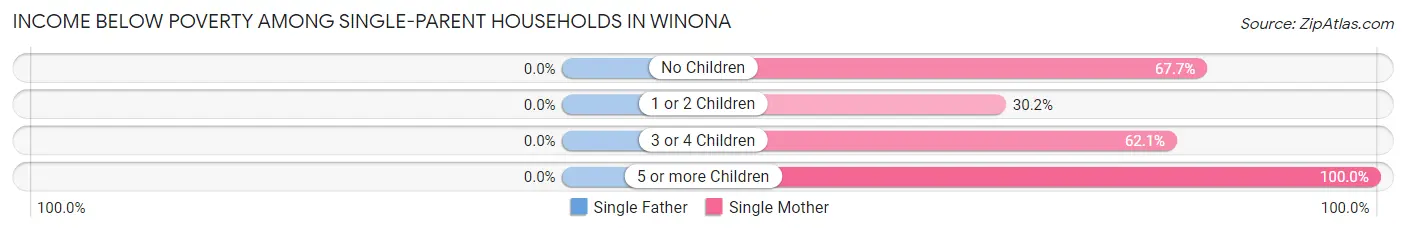
| Children | Single Father | Single Mother |
| No Children | 0 (0.0%) | 153 (67.7%) |
| 1 or 2 Children | 0 (0.0%) | 71 (30.2%) |
| 3 or 4 Children | 0 (0.0%) | 18 (62.1%) |
| 5 or more Children | 0 (0.0%) | 50 (100.0%) |
| Total | 0 (0.0%) | 292 (54.1%) |
Income Below Poverty Among Married-Couple vs Single-Parent Households in Winona
The poverty data for Winona shows that 28 of the married-couple family households (6.2%) and 292 of the single-parent households (49.7%) are living below the poverty level. Within the married-couple family households, those with 3 or 4 children have the highest poverty rate, with 17 households (50.0%) falling below the poverty line. Among the single-parent households, those with 5 or more children have the highest poverty rate, with 50 household (100.0%) living below poverty.
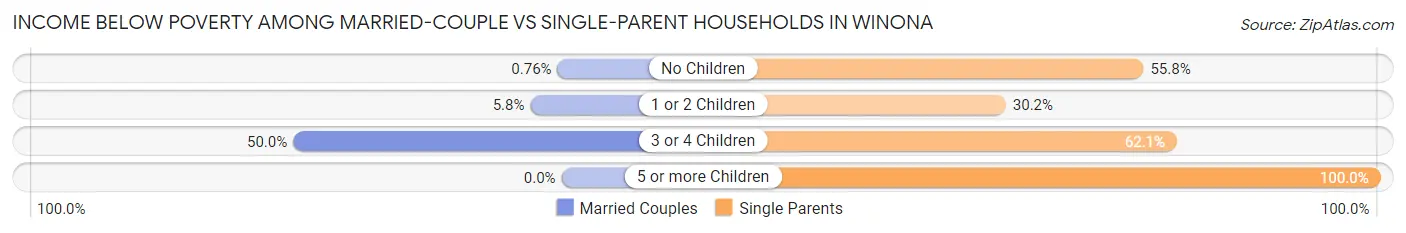
| Children | Married-Couple Families | Single-Parent Households |
| No Children | 2 (0.8%) | 153 (55.8%) |
| 1 or 2 Children | 9 (5.8%) | 71 (30.2%) |
| 3 or 4 Children | 17 (50.0%) | 18 (62.1%) |
| 5 or more Children | 0 (0.0%) | 50 (100.0%) |
| Total | 28 (6.2%) | 292 (49.7%) |
Race in Winona
The most populous races in Winona are Black / African American (2,593 | 58.6%), White / Caucasian (1,814 | 41.0%), and Two or more Races (15 | 0.3%).
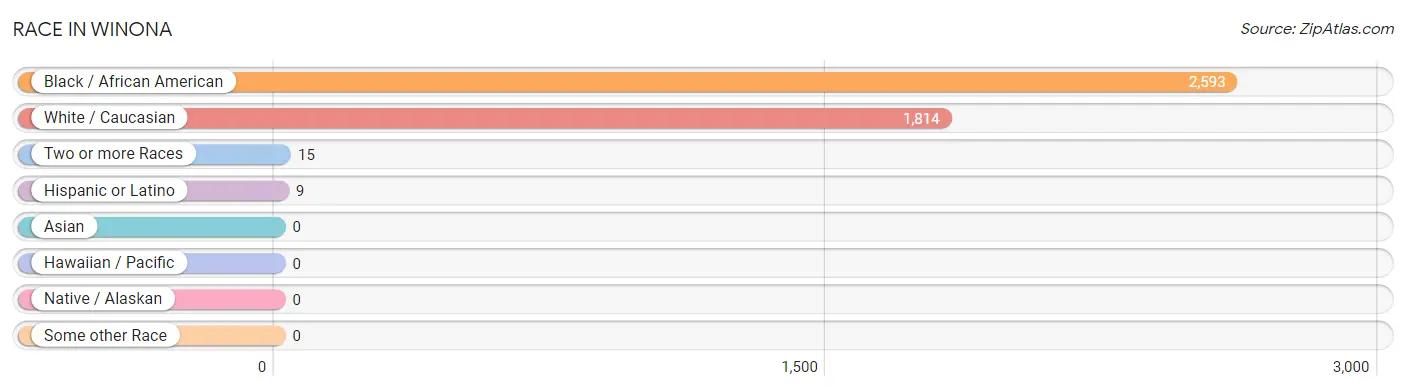
| Race | # Population | % Population |
| Asian | 0 | 0.0% |
| Black / African American | 2,593 | 58.6% |
| Hawaiian / Pacific | 0 | 0.0% |
| Hispanic or Latino | 9 | 0.2% |
| Native / Alaskan | 0 | 0.0% |
| White / Caucasian | 1,814 | 41.0% |
| Two or more Races | 15 | 0.3% |
| Some other Race | 0 | 0.0% |
| Total | 4,422 | 100.0% |
Ancestry in Winona
The most populous ancestries reported in Winona are English (376 | 8.5%), American (327 | 7.4%), Irish (294 | 6.7%), German (59 | 1.3%), and Scottish (55 | 1.2%), together accounting for 25.1% of all Winona residents.
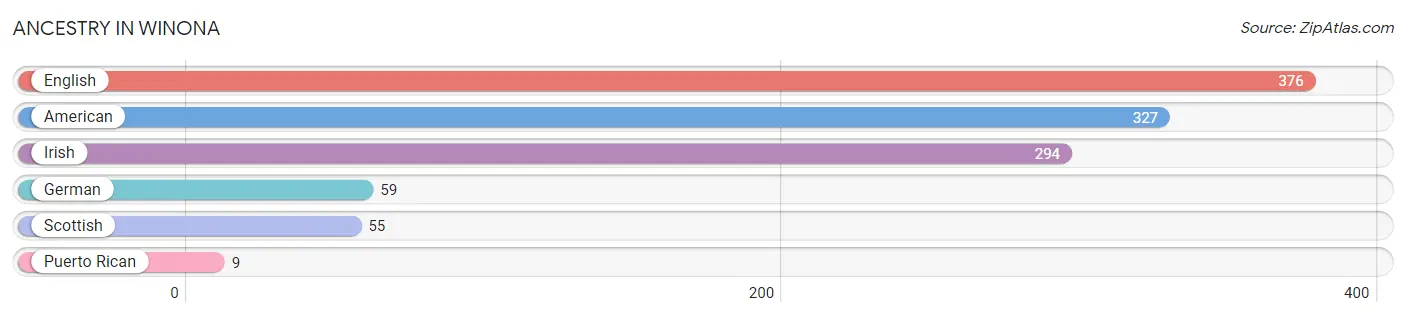
| Ancestry | # Population | % Population |
| American | 327 | 7.4% |
| English | 376 | 8.5% |
| German | 59 | 1.3% |
| Irish | 294 | 6.7% |
| Puerto Rican | 9 | 0.2% |
| Scottish | 55 | 1.2% | View All 6 Rows |
Immigrants in Winona

| Immigration Origin | # Population | % Population | View All 0 Rows |
Sex and Age in Winona
Sex and Age in Winona
The most populous age groups in Winona are 10 to 14 Years (464 | 24.0%) for men and 15 to 19 Years (379 | 15.2%) for women.
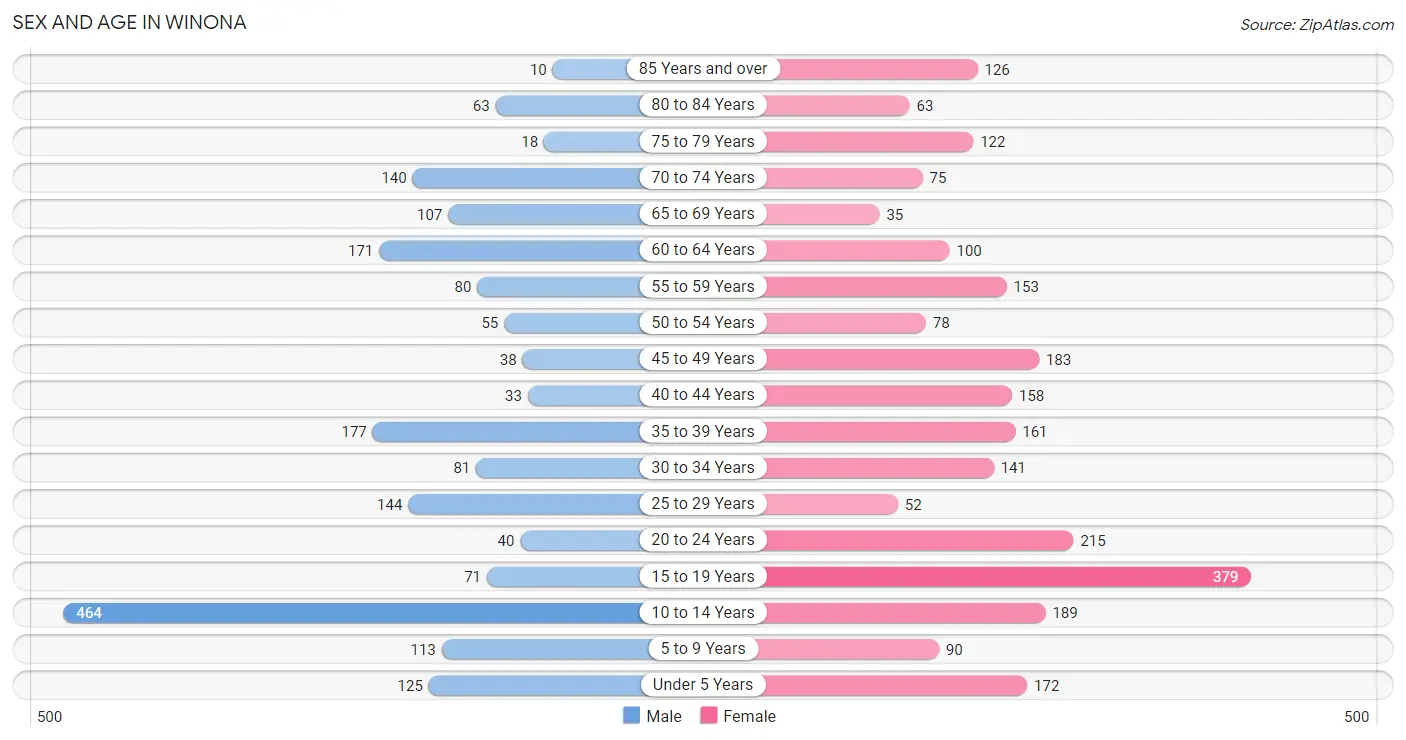
| Age Bracket | Male | Female |
| Under 5 Years | 125 (6.5%) | 172 (6.9%) |
| 5 to 9 Years | 113 (5.9%) | 90 (3.6%) |
| 10 to 14 Years | 464 (24.0%) | 189 (7.6%) |
| 15 to 19 Years | 71 (3.7%) | 379 (15.2%) |
| 20 to 24 Years | 40 (2.1%) | 215 (8.6%) |
| 25 to 29 Years | 144 (7.5%) | 52 (2.1%) |
| 30 to 34 Years | 81 (4.2%) | 141 (5.7%) |
| 35 to 39 Years | 177 (9.2%) | 161 (6.5%) |
| 40 to 44 Years | 33 (1.7%) | 158 (6.3%) |
| 45 to 49 Years | 38 (2.0%) | 183 (7.3%) |
| 50 to 54 Years | 55 (2.9%) | 78 (3.1%) |
| 55 to 59 Years | 80 (4.2%) | 153 (6.1%) |
| 60 to 64 Years | 171 (8.9%) | 100 (4.0%) |
| 65 to 69 Years | 107 (5.5%) | 35 (1.4%) |
| 70 to 74 Years | 140 (7.2%) | 75 (3.0%) |
| 75 to 79 Years | 18 (0.9%) | 122 (4.9%) |
| 80 to 84 Years | 63 (3.3%) | 63 (2.5%) |
| 85 Years and over | 10 (0.5%) | 126 (5.1%) |
| Total | 1,930 (100.0%) | 2,492 (100.0%) |
Families and Households in Winona
Median Family Size in Winona
The median family size in Winona is 3.44 persons per family, with single male/father families (48 | 4.6%) accounting for the largest median family size of 4 persons per family. On the other hand, married-couple families (451 | 43.4%) represent the smallest median family size with 3.25 persons per family.
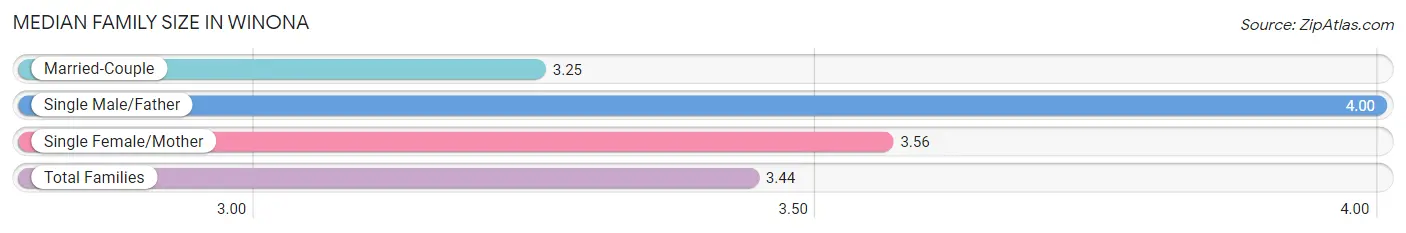
| Family Type | # Families | Family Size |
| Married-Couple | 451 (43.4%) | 3.25 |
| Single Male/Father | 48 (4.6%) | 4.00 |
| Single Female/Mother | 540 (52.0%) | 3.56 |
| Total Families | 1,039 (100.0%) | 3.44 |
Median Household Size in Winona
The median household size in Winona is 2.74 persons per household, with single male/father households (48 | 3.1%) accounting for the largest median household size of 4.69 persons per household. non-family households (530 | 33.8%) represent the smallest median household size with 1.26 persons per household.
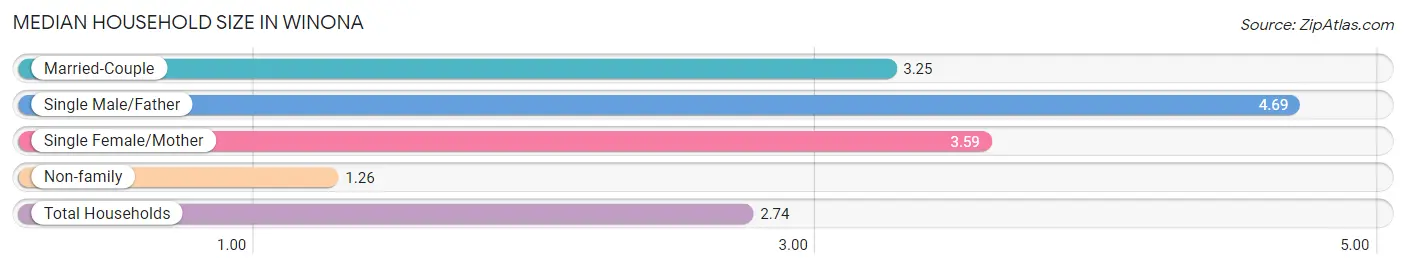
| Household Type | # Households | Household Size |
| Married-Couple | 451 (28.7%) | 3.25 |
| Single Male/Father | 48 (3.1%) | 4.69 |
| Single Female/Mother | 540 (34.4%) | 3.59 |
| Non-family | 530 (33.8%) | 1.26 |
| Total Households | 1,569 (100.0%) | 2.74 |
Household Size by Marriage Status in Winona
Out of a total of 1,569 households in Winona, 1,039 (66.2%) are family households, while 530 (33.8%) are nonfamily households. The most numerous type of family households are 2-person households, comprising 526, and the most common type of nonfamily households are 1-person households, comprising 427.
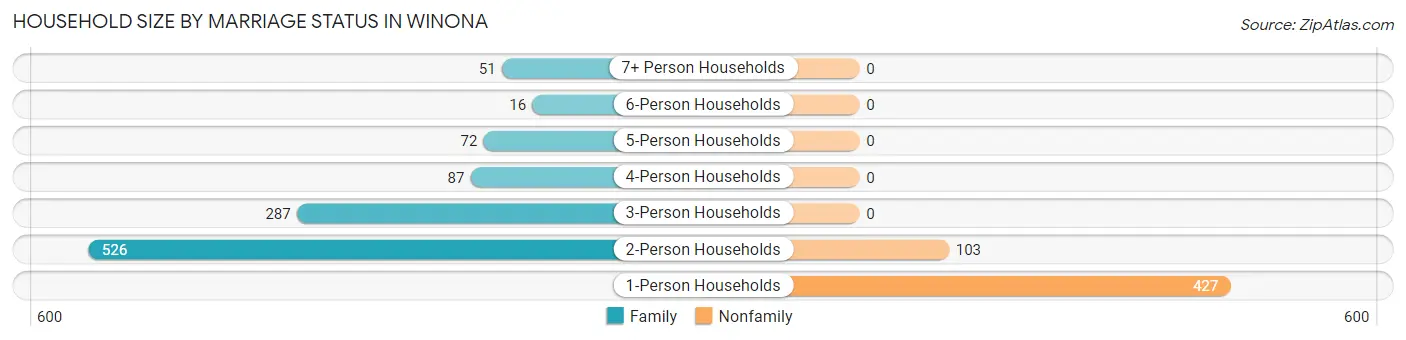
| Household Size | Family Households | Nonfamily Households |
| 1-Person Households | - | 427 (27.2%) |
| 2-Person Households | 526 (33.5%) | 103 (6.6%) |
| 3-Person Households | 287 (18.3%) | 0 (0.0%) |
| 4-Person Households | 87 (5.5%) | 0 (0.0%) |
| 5-Person Households | 72 (4.6%) | 0 (0.0%) |
| 6-Person Households | 16 (1.0%) | 0 (0.0%) |
| 7+ Person Households | 51 (3.3%) | 0 (0.0%) |
| Total | 1,039 (66.2%) | 530 (33.8%) |
Female Fertility in Winona
Fertility by Age in Winona
Average fertility rate in Winona is 86.0 births per 1,000 women. Women in the age bracket of 20 to 34 years have the highest fertility rate with 154.0 births per 1,000 women. Women in the age bracket of 20 to 34 years acount for 56.8% of all women with births.
| Age Bracket | Women with Births | Births / 1,000 Women |
| 15 to 19 years | 0 (0.0%) | 0.0 |
| 20 to 34 years | 63 (56.8%) | 154.0 |
| 35 to 50 years | 48 (43.2%) | 94.0 |
| Total | 111 (100.0%) | 86.0 |
Fertility by Age by Marriage Status in Winona
16.2% of women with births (111) in Winona are married. The highest percentage of unmarried women with births falls into 35 to 50 years age bracket with 100.0% of them unmarried at the time of birth, while the lowest percentage of unmarried women with births belong to 20 to 34 years age bracket with 71.4% of them unmarried.
| Age Bracket | Married | Unmarried |
| 15 to 19 years | 0 (0.0%) | 0 (0.0%) |
| 20 to 34 years | 18 (28.6%) | 45 (71.4%) |
| 35 to 50 years | 0 (0.0%) | 48 (100.0%) |
| Total | 18 (16.2%) | 93 (83.8%) |
Fertility by Education in Winona
| Educational Attainment | Women with Births | Births / 1,000 Women |
| Less than High School | 82 (73.9%) | 238.0 |
| High School Diploma | 0 (0.0%) | 0.0 |
| College or Associate's Degree | 29 (26.1%) | 47.0 |
| Bachelor's Degree | 0 (0.0%) | 0.0 |
| Graduate Degree | 0 (0.0%) | 0.0 |
| Total | 111 (100.0%) | 86.0 |
Fertility by Education by Marriage Status in Winona
83.8% of women with births in Winona are unmarried. Women with the educational attainment of college or associate's degree are most likely to be married with 62.1% of them married at childbirth, while women with the educational attainment of less than high school are least likely to be married with 100.0% of them unmarried at childbirth.
| Educational Attainment | Married | Unmarried |
| Less than High School | 0 (0.0%) | 82 (100.0%) |
| High School Diploma | 0 (0.0%) | 0 (0.0%) |
| College or Associate's Degree | 18 (62.1%) | 11 (37.9%) |
| Bachelor's Degree | 0 (0.0%) | 0 (0.0%) |
| Graduate Degree | 0 (0.0%) | 0 (0.0%) |
| Total | 18 (16.2%) | 93 (83.8%) |
Employment Characteristics in Winona
Employment by Class of Employer in Winona
Among the 1,344 employed individuals in Winona, private company employees (846 | 62.9%), state government employees (186 | 13.8%), and not-for-profit organizations (167 | 12.4%) make up the most common classes of employment.
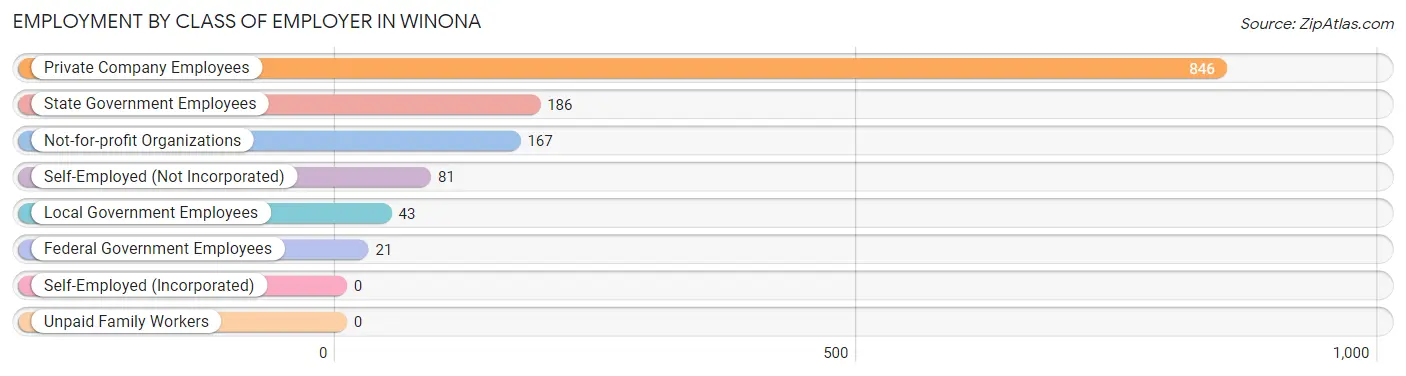
| Employer Class | # Employees | % Employees |
| Private Company Employees | 846 | 62.9% |
| Self-Employed (Incorporated) | 0 | 0.0% |
| Self-Employed (Not Incorporated) | 81 | 6.0% |
| Not-for-profit Organizations | 167 | 12.4% |
| Local Government Employees | 43 | 3.2% |
| State Government Employees | 186 | 13.8% |
| Federal Government Employees | 21 | 1.6% |
| Unpaid Family Workers | 0 | 0.0% |
| Total | 1,344 | 100.0% |
Employment Status by Age in Winona
According to the labor force statistics for Winona, out of the total population over 16 years of age (3,238), 45.4% or 1,470 individuals are in the labor force, with 8.6% or 126 of them unemployed. The age group with the highest labor force participation rate is 45 to 54 years, with 81.1% or 287 individuals in the labor force. Within the labor force, the 30 to 34 years age range has the highest percentage of unemployed individuals, with 47.5% or 77 of them being unemployed.
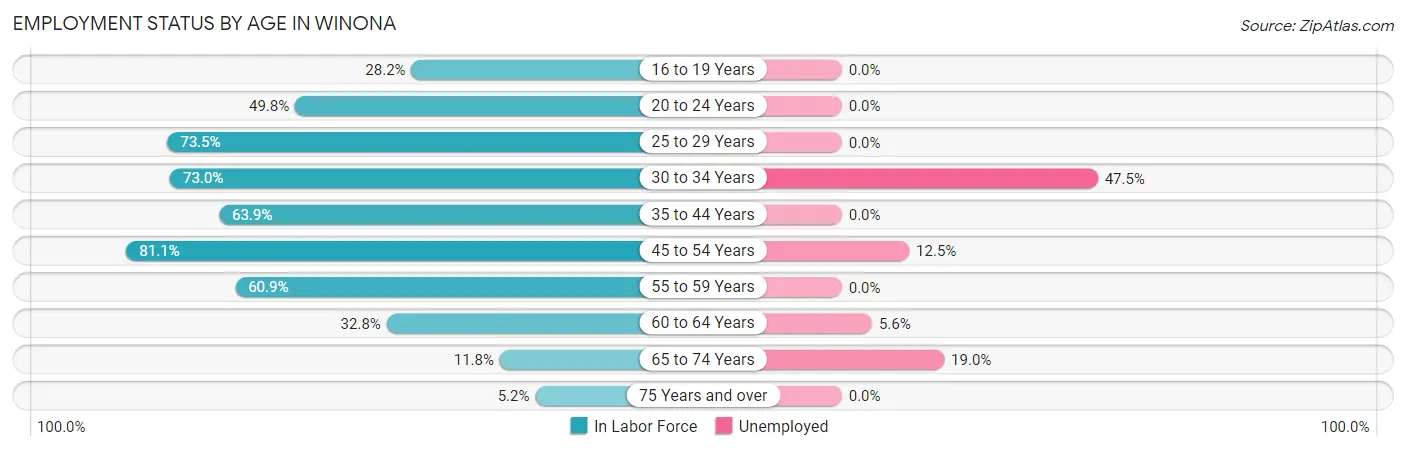
| Age Bracket | In Labor Force | Unemployed |
| 16 to 19 Years | 118 (28.2%) | 0 (0.0%) |
| 20 to 24 Years | 127 (49.8%) | 0 (0.0%) |
| 25 to 29 Years | 144 (73.5%) | 0 (0.0%) |
| 30 to 34 Years | 162 (73.0%) | 77 (47.5%) |
| 35 to 44 Years | 338 (63.9%) | 0 (0.0%) |
| 45 to 54 Years | 287 (81.1%) | 36 (12.5%) |
| 55 to 59 Years | 142 (60.9%) | 0 (0.0%) |
| 60 to 64 Years | 89 (32.8%) | 5 (5.6%) |
| 65 to 74 Years | 42 (11.8%) | 8 (19.0%) |
| 75 Years and over | 21 (5.2%) | 0 (0.0%) |
| Total | 1,470 (45.4%) | 126 (8.6%) |
Employment Status by Educational Attainment in Winona
According to labor force statistics for Winona, 64.4% of individuals (1,162) out of the total population between 25 and 64 years of age (1,805) are in the labor force, with 10.2% or 119 of them being unemployed. The group with the highest labor force participation rate are those with the educational attainment of bachelor's degree or higher, with 88.8% or 245 individuals in the labor force. Within the labor force, individuals with bachelor's degree or higher education have the highest percentage of unemployment, with 25.7% or 63 of them being unemployed.
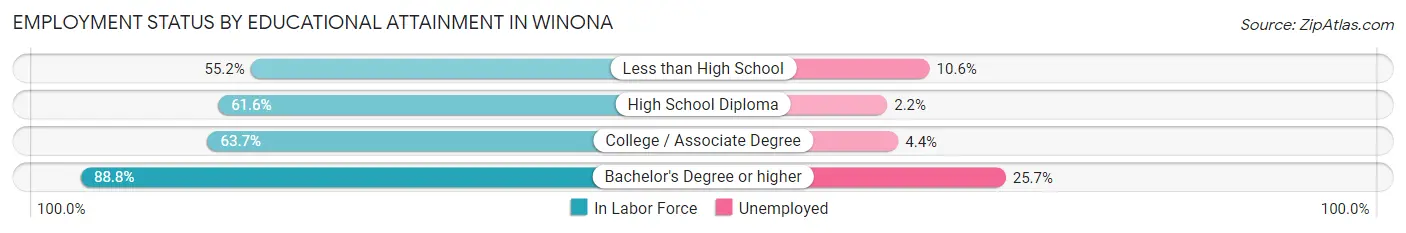
| Educational Attainment | In Labor Force | Unemployed |
| Less than High School | 322 (55.2%) | 62 (10.6%) |
| High School Diploma | 231 (61.6%) | 8 (2.2%) |
| College / Associate Degree | 364 (63.7%) | 25 (4.4%) |
| Bachelor's Degree or higher | 245 (88.8%) | 71 (25.7%) |
| Total | 1,162 (64.4%) | 184 (10.2%) |
Employment Occupations by Sex in Winona
Management, Business, Science and Arts Occupations
The most common Management, Business, Science and Arts occupations in Winona are Community & Social Service (163 | 12.1%), Education Instruction & Library (134 | 10.0%), Health Diagnosing & Treating (31 | 2.3%), Management (18 | 1.3%), and Arts, Media & Entertainment (17 | 1.3%).
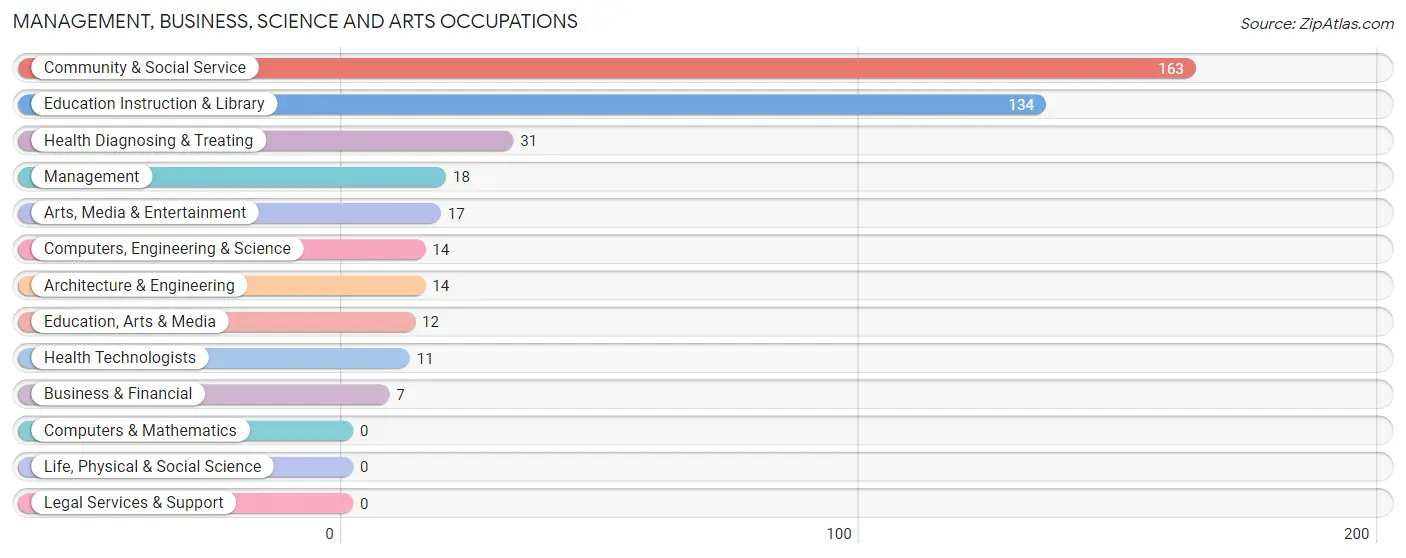
Management, Business, Science and Arts Occupations by Sex
Within the Management, Business, Science and Arts occupations in Winona, the most male-oriented occupations are Management (100.0%), Computers, Engineering & Science (100.0%), and Architecture & Engineering (100.0%), while the most female-oriented occupations are Business & Financial (100.0%), Education, Arts & Media (100.0%), and Education Instruction & Library (100.0%).
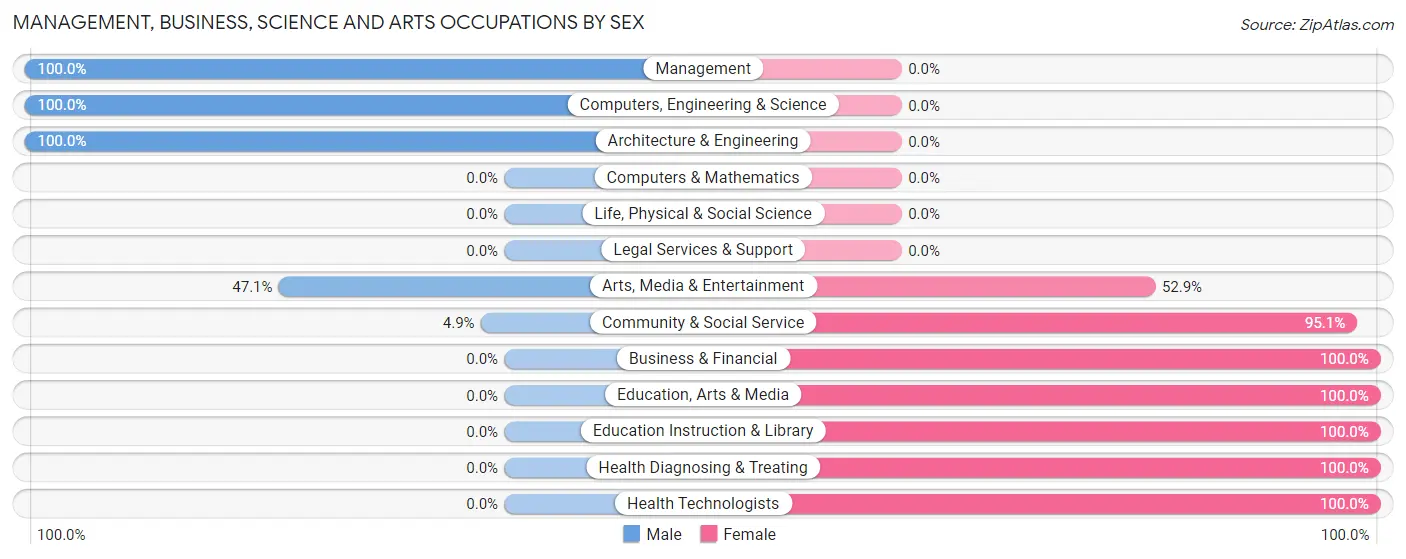
| Occupation | Male | Female |
| Management | 18 (100.0%) | 0 (0.0%) |
| Business & Financial | 0 (0.0%) | 7 (100.0%) |
| Computers, Engineering & Science | 14 (100.0%) | 0 (0.0%) |
| Computers & Mathematics | 0 (0.0%) | 0 (0.0%) |
| Architecture & Engineering | 14 (100.0%) | 0 (0.0%) |
| Life, Physical & Social Science | 0 (0.0%) | 0 (0.0%) |
| Community & Social Service | 8 (4.9%) | 155 (95.1%) |
| Education, Arts & Media | 0 (0.0%) | 12 (100.0%) |
| Legal Services & Support | 0 (0.0%) | 0 (0.0%) |
| Education Instruction & Library | 0 (0.0%) | 134 (100.0%) |
| Arts, Media & Entertainment | 8 (47.1%) | 9 (52.9%) |
| Health Diagnosing & Treating | 0 (0.0%) | 31 (100.0%) |
| Health Technologists | 0 (0.0%) | 11 (100.0%) |
| Total (Category) | 40 (17.2%) | 193 (82.8%) |
| Total (Overall) | 539 (40.1%) | 805 (59.9%) |
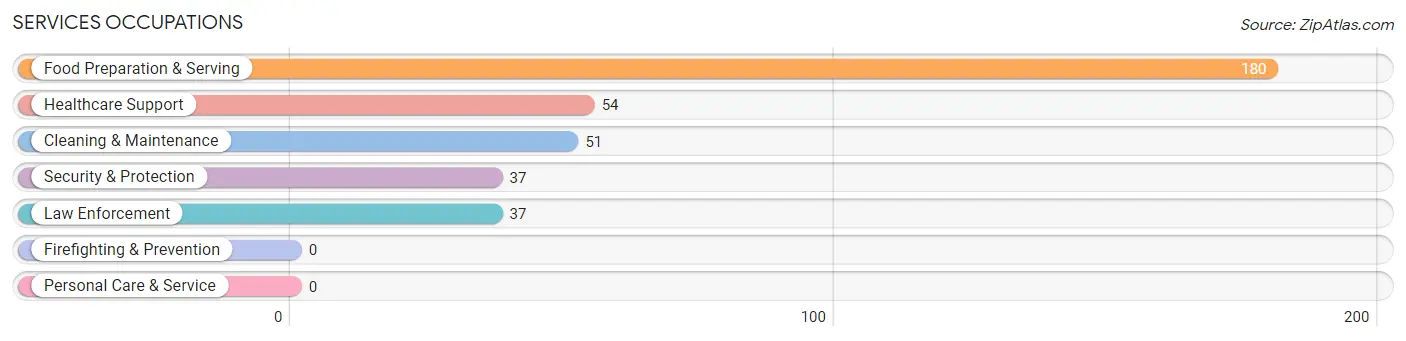
Services Occupations
The most common Services occupations in Winona are Food Preparation & Serving (180 | 13.4%), Healthcare Support (54 | 4.0%), Cleaning & Maintenance (51 | 3.8%), Security & Protection (37 | 2.8%), and Law Enforcement (37 | 2.8%).
Services Occupations by Sex
Within the Services occupations in Winona, the most male-oriented occupations are Security & Protection (100.0%), Law Enforcement (100.0%), and Cleaning & Maintenance (52.9%), while the most female-oriented occupations are Healthcare Support (100.0%), Food Preparation & Serving (100.0%), and Cleaning & Maintenance (47.1%).
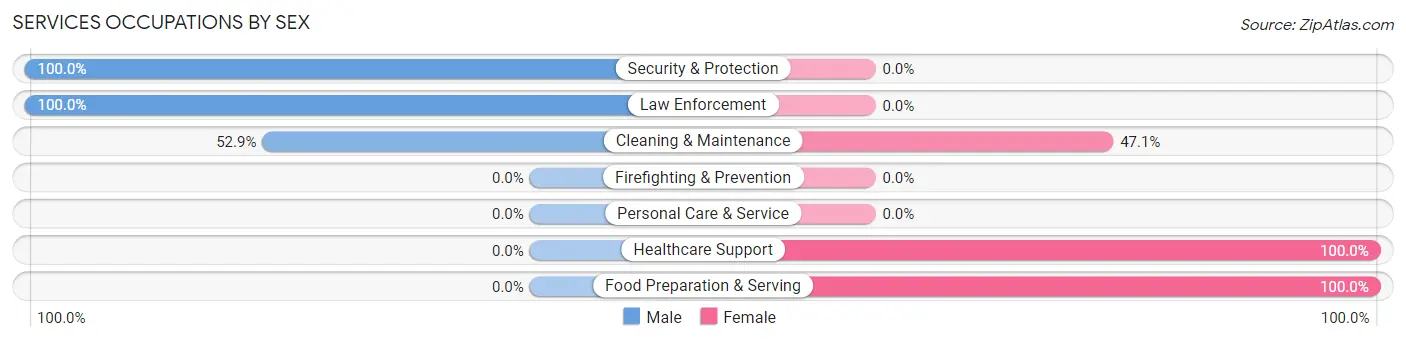
| Occupation | Male | Female |
| Healthcare Support | 0 (0.0%) | 54 (100.0%) |
| Security & Protection | 37 (100.0%) | 0 (0.0%) |
| Firefighting & Prevention | 0 (0.0%) | 0 (0.0%) |
| Law Enforcement | 37 (100.0%) | 0 (0.0%) |
| Food Preparation & Serving | 0 (0.0%) | 180 (100.0%) |
| Cleaning & Maintenance | 27 (52.9%) | 24 (47.1%) |
| Personal Care & Service | 0 (0.0%) | 0 (0.0%) |
| Total (Category) | 64 (19.9%) | 258 (80.1%) |
| Total (Overall) | 539 (40.1%) | 805 (59.9%) |
Sales and Office Occupations
The most common Sales and Office occupations in Winona are Sales & Related (202 | 15.0%), and Office & Administration (118 | 8.8%).

Sales and Office Occupations by Sex

| Occupation | Male | Female |
| Sales & Related | 6 (3.0%) | 196 (97.0%) |
| Office & Administration | 18 (15.2%) | 100 (84.8%) |
| Total (Category) | 24 (7.5%) | 296 (92.5%) |
| Total (Overall) | 539 (40.1%) | 805 (59.9%) |
Natural Resources, Construction and Maintenance Occupations
The most common Natural Resources, Construction and Maintenance occupations in Winona are Construction & Extraction (66 | 4.9%), Installation, Maintenance & Repair (56 | 4.2%), and Farming, Fishing & Forestry (15 | 1.1%).
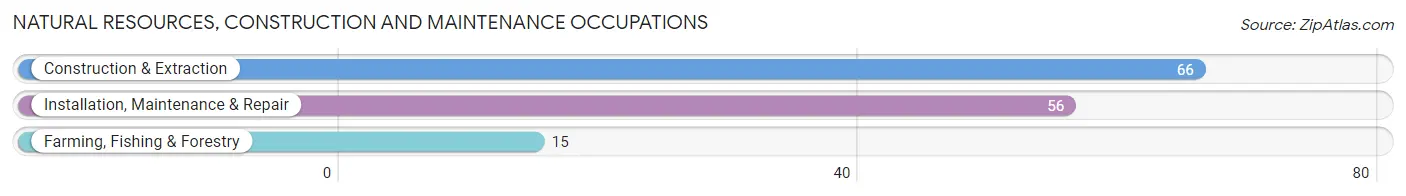
Natural Resources, Construction and Maintenance Occupations by Sex
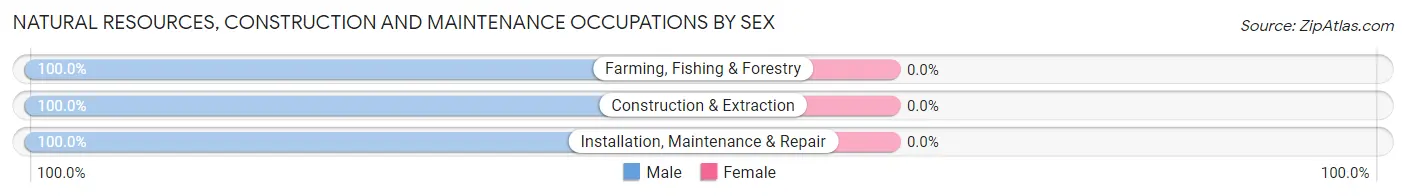
| Occupation | Male | Female |
| Farming, Fishing & Forestry | 15 (100.0%) | 0 (0.0%) |
| Construction & Extraction | 66 (100.0%) | 0 (0.0%) |
| Installation, Maintenance & Repair | 56 (100.0%) | 0 (0.0%) |
| Total (Category) | 137 (100.0%) | 0 (0.0%) |
| Total (Overall) | 539 (40.1%) | 805 (59.9%) |
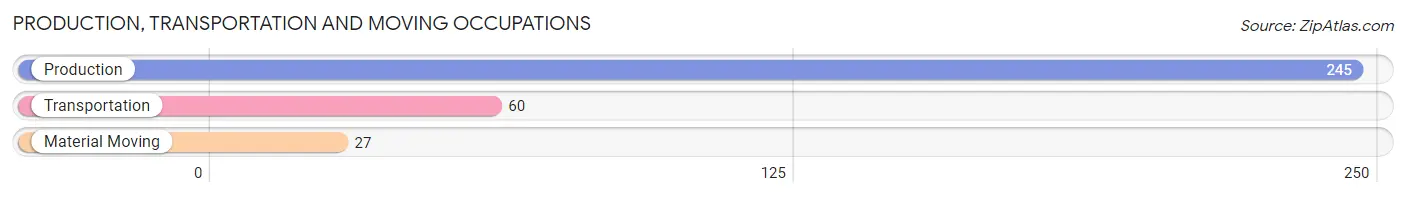
Production, Transportation and Moving Occupations
The most common Production, Transportation and Moving occupations in Winona are Production (245 | 18.2%), Transportation (60 | 4.5%), and Material Moving (27 | 2.0%).
Production, Transportation and Moving Occupations by Sex
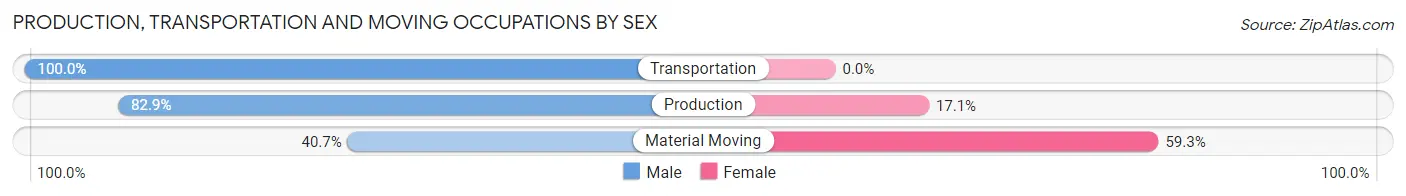
| Occupation | Male | Female |
| Production | 203 (82.9%) | 42 (17.1%) |
| Transportation | 60 (100.0%) | 0 (0.0%) |
| Material Moving | 11 (40.7%) | 16 (59.3%) |
| Total (Category) | 274 (82.5%) | 58 (17.5%) |
| Total (Overall) | 539 (40.1%) | 805 (59.9%) |
Employment Industries by Sex in Winona
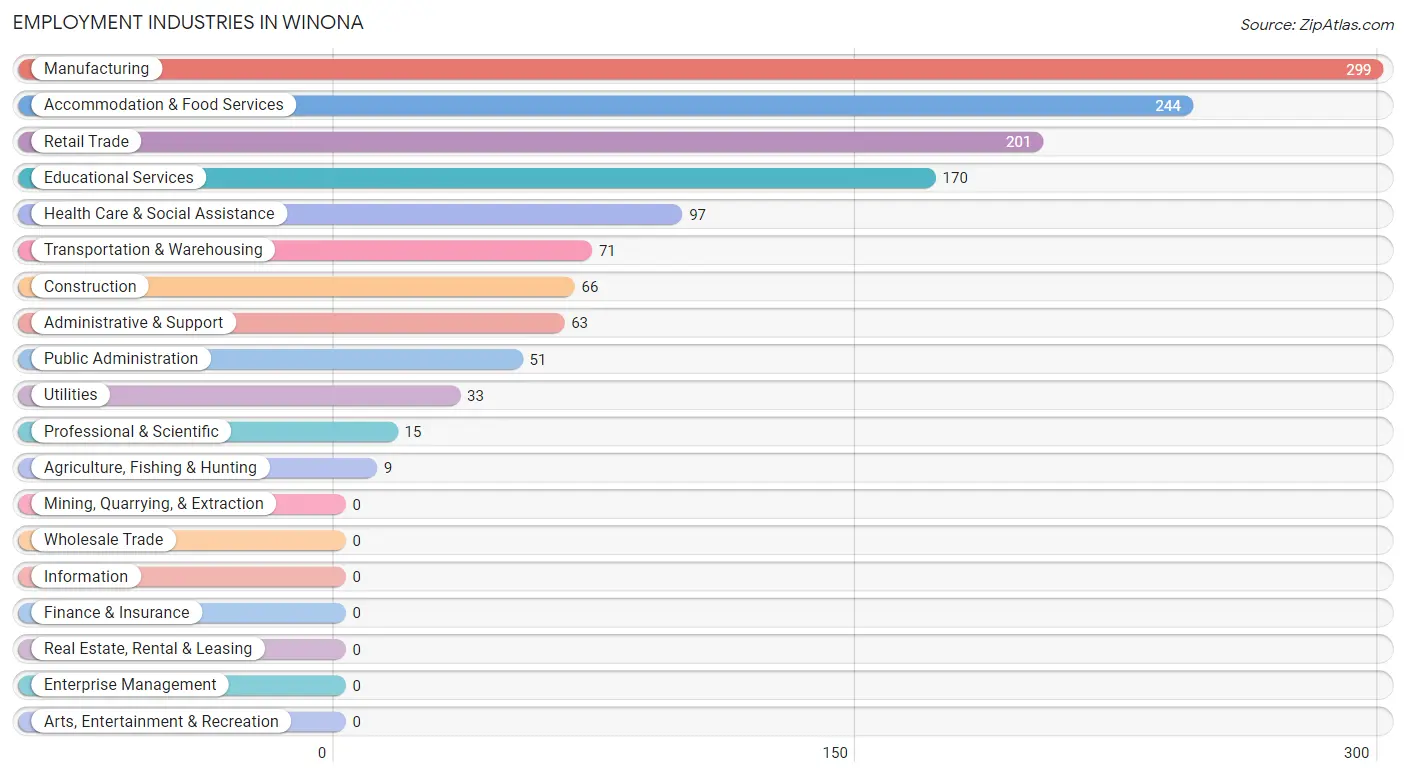
Employment Industries in Winona
The major employment industries in Winona include Manufacturing (299 | 22.3%), Accommodation & Food Services (244 | 18.1%), Retail Trade (201 | 15.0%), Educational Services (170 | 12.7%), and Health Care & Social Assistance (97 | 7.2%).
Employment Industries by Sex in Winona
The Winona industries that see more men than women are Construction (100.0%), Transportation & Warehousing (100.0%), and Public Administration (100.0%), whereas the industries that tend to have a higher number of women are Agriculture, Fishing & Hunting (100.0%), Educational Services (100.0%), and Health Care & Social Assistance (100.0%).
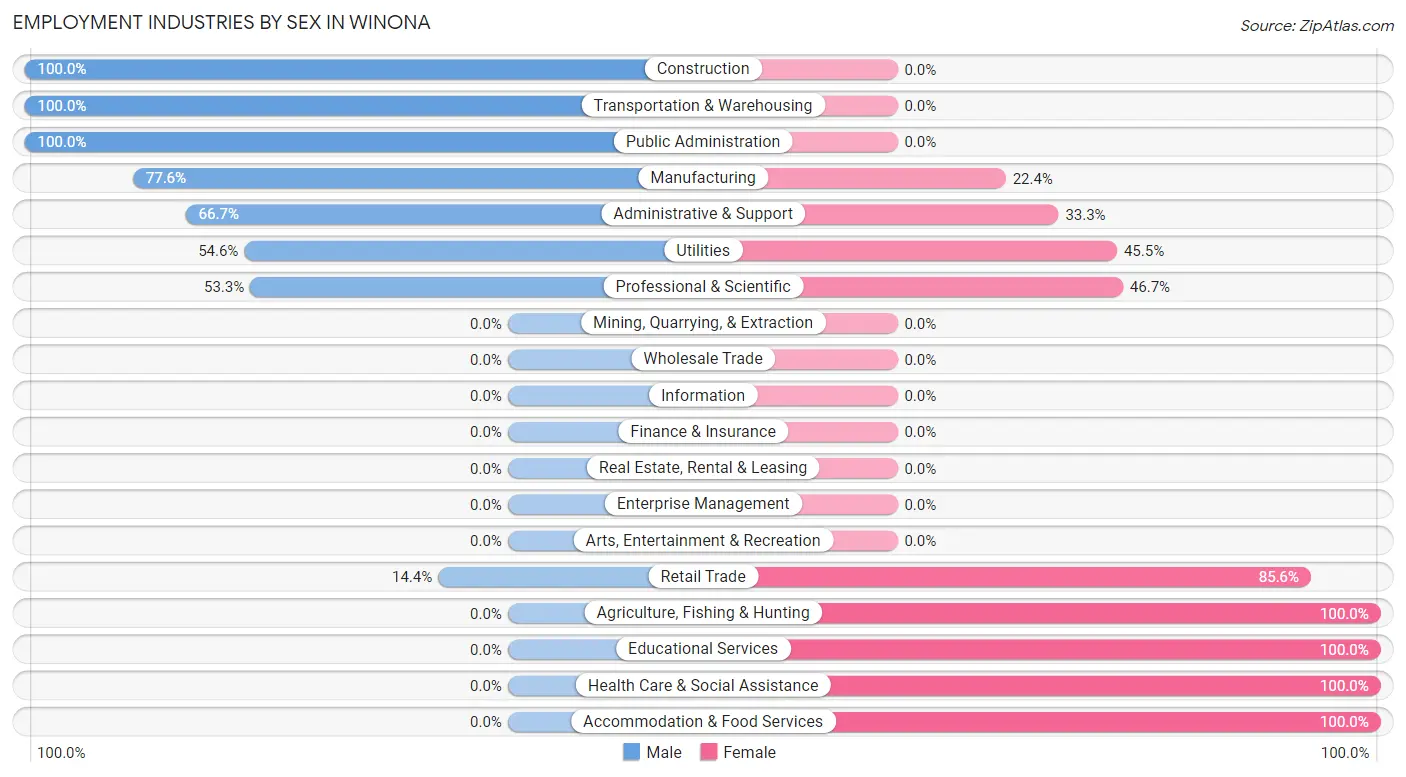
| Industry | Male | Female |
| Agriculture, Fishing & Hunting | 0 (0.0%) | 9 (100.0%) |
| Mining, Quarrying, & Extraction | 0 (0.0%) | 0 (0.0%) |
| Construction | 66 (100.0%) | 0 (0.0%) |
| Manufacturing | 232 (77.6%) | 67 (22.4%) |
| Wholesale Trade | 0 (0.0%) | 0 (0.0%) |
| Retail Trade | 29 (14.4%) | 172 (85.6%) |
| Transportation & Warehousing | 71 (100.0%) | 0 (0.0%) |
| Utilities | 18 (54.5%) | 15 (45.5%) |
| Information | 0 (0.0%) | 0 (0.0%) |
| Finance & Insurance | 0 (0.0%) | 0 (0.0%) |
| Real Estate, Rental & Leasing | 0 (0.0%) | 0 (0.0%) |
| Professional & Scientific | 8 (53.3%) | 7 (46.7%) |
| Enterprise Management | 0 (0.0%) | 0 (0.0%) |
| Administrative & Support | 42 (66.7%) | 21 (33.3%) |
| Educational Services | 0 (0.0%) | 170 (100.0%) |
| Health Care & Social Assistance | 0 (0.0%) | 97 (100.0%) |
| Arts, Entertainment & Recreation | 0 (0.0%) | 0 (0.0%) |
| Accommodation & Food Services | 0 (0.0%) | 244 (100.0%) |
| Public Administration | 51 (100.0%) | 0 (0.0%) |
| Total | 539 (40.1%) | 805 (59.9%) |
Education in Winona
School Enrollment in Winona
The most common levels of schooling among the 1,185 students in Winona are college / undergraduate (335 | 28.3%), middle school (332 | 28.0%), and elementary school (236 | 19.9%).
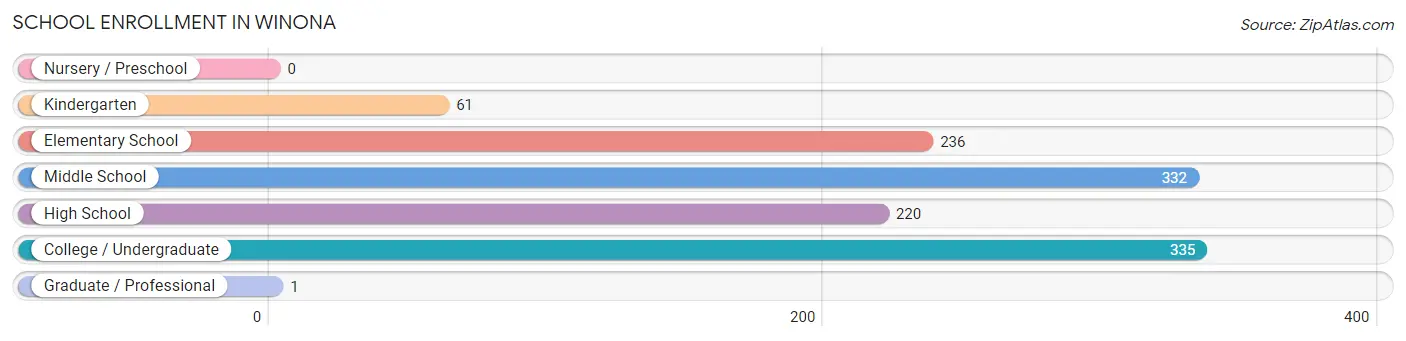
| School Level | # Students | % Students |
| Nursery / Preschool | 0 | 0.0% |
| Kindergarten | 61 | 5.1% |
| Elementary School | 236 | 19.9% |
| Middle School | 332 | 28.0% |
| High School | 220 | 18.6% |
| College / Undergraduate | 335 | 28.3% |
| Graduate / Professional | 1 | 0.1% |
| Total | 1,185 | 100.0% |
School Enrollment by Age by Funding Source in Winona
Out of a total of 1,185 students who are enrolled in schools in Winona, 28 (2.4%) attend a private institution, while the remaining 1,157 (97.6%) are enrolled in public schools. The age group of 15 to 17 year olds has the highest likelihood of being enrolled in private schools, with 16 (7.7% in the age bracket) enrolled. Conversely, the age group of 5 to 9 year old has the lowest likelihood of being enrolled in a private school, with 130 (100.0% in the age bracket) attending a public institution.
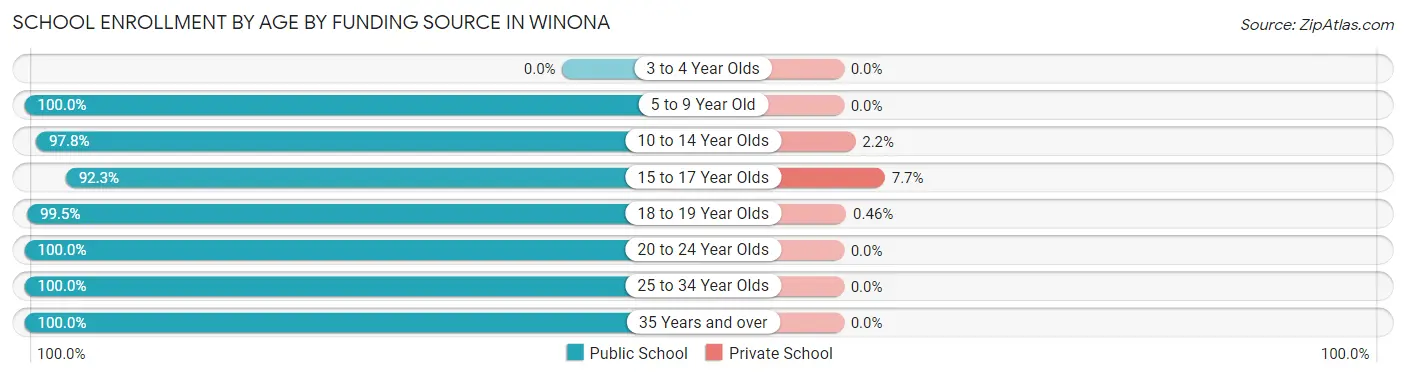
| Age Bracket | Public School | Private School |
| 3 to 4 Year Olds | 0 (0.0%) | 0 (0.0%) |
| 5 to 9 Year Old | 130 (100.0%) | 0 (0.0%) |
| 10 to 14 Year Olds | 498 (97.8%) | 11 (2.2%) |
| 15 to 17 Year Olds | 193 (92.3%) | 16 (7.7%) |
| 18 to 19 Year Olds | 215 (99.5%) | 1 (0.5%) |
| 20 to 24 Year Olds | 35 (100.0%) | 0 (0.0%) |
| 25 to 34 Year Olds | 27 (100.0%) | 0 (0.0%) |
| 35 Years and over | 59 (100.0%) | 0 (0.0%) |
| Total | 1,157 (97.6%) | 28 (2.4%) |
Educational Attainment by Field of Study in Winona
Arts & humanities (140 | 35.3%), business (88 | 22.2%), education (75 | 18.9%), bio, nature & agricultural (35 | 8.8%), and computers & mathematics (27 | 6.8%) are the most common fields of study among 396 individuals in Winona who have obtained a bachelor's degree or higher.
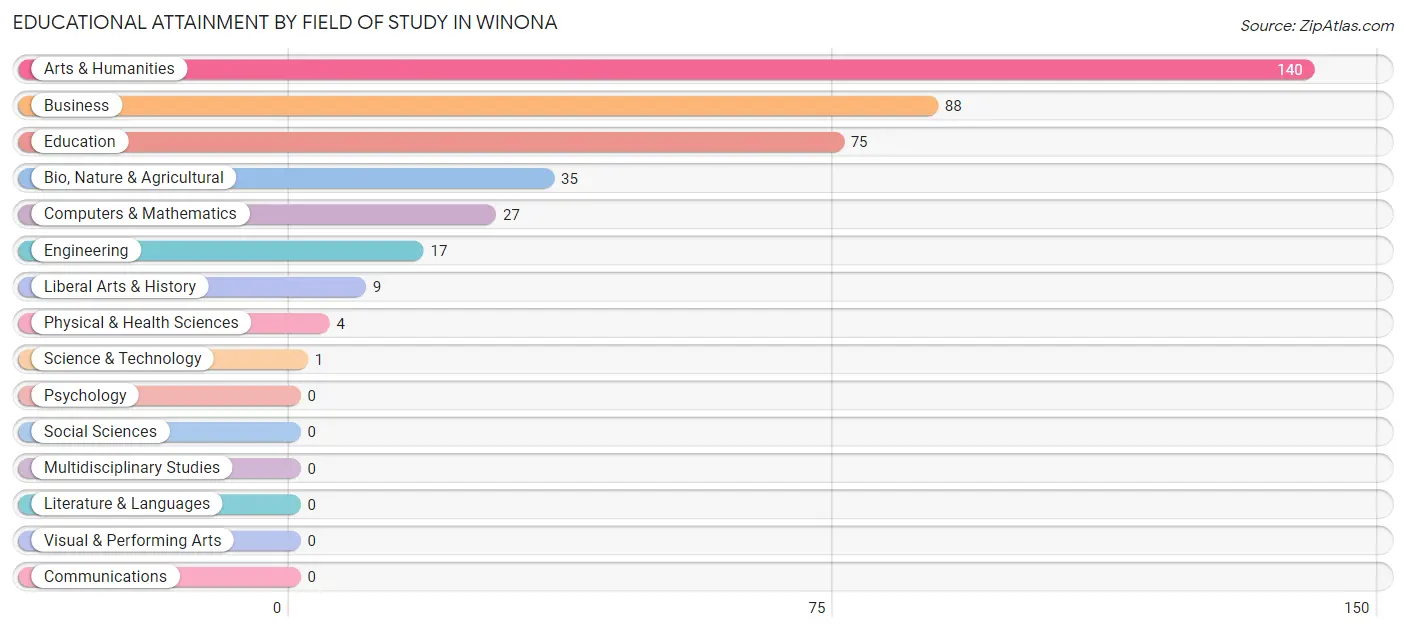
| Field of Study | # Graduates | % Graduates |
| Computers & Mathematics | 27 | 6.8% |
| Bio, Nature & Agricultural | 35 | 8.8% |
| Physical & Health Sciences | 4 | 1.0% |
| Psychology | 0 | 0.0% |
| Social Sciences | 0 | 0.0% |
| Engineering | 17 | 4.3% |
| Multidisciplinary Studies | 0 | 0.0% |
| Science & Technology | 1 | 0.3% |
| Business | 88 | 22.2% |
| Education | 75 | 18.9% |
| Literature & Languages | 0 | 0.0% |
| Liberal Arts & History | 9 | 2.3% |
| Visual & Performing Arts | 0 | 0.0% |
| Communications | 0 | 0.0% |
| Arts & Humanities | 140 | 35.3% |
| Total | 396 | 100.0% |
Transportation & Commute in Winona
Vehicle Availability by Sex in Winona
The most prevalent vehicle ownership categories in Winona are males with 2 vehicles (327, accounting for 60.7%) and females with 2 vehicles (243, making up 40.6%).
| Vehicles Available | Male | Female |
| No Vehicle | 27 (5.0%) | 13 (1.6%) |
| 1 Vehicle | 36 (6.7%) | 418 (51.9%) |
| 2 Vehicles | 327 (60.7%) | 243 (30.2%) |
| 3 Vehicles | 131 (24.3%) | 107 (13.3%) |
| 4 Vehicles | 18 (3.3%) | 24 (3.0%) |
| 5 or more Vehicles | 0 (0.0%) | 0 (0.0%) |
| Total | 539 (100.0%) | 805 (100.0%) |
Commute Time in Winona
The most frequently occuring commute durations in Winona are 10 to 14 minutes (337 commuters, 25.3%), 5 to 9 minutes (282 commuters, 21.2%), and 20 to 24 minutes (187 commuters, 14.0%).
| Commute Time | # Commuters | % Commuters |
| Less than 5 Minutes | 75 | 5.6% |
| 5 to 9 Minutes | 282 | 21.2% |
| 10 to 14 Minutes | 337 | 25.3% |
| 15 to 19 Minutes | 38 | 2.9% |
| 20 to 24 Minutes | 187 | 14.0% |
| 25 to 29 Minutes | 0 | 0.0% |
| 30 to 34 Minutes | 158 | 11.8% |
| 35 to 39 Minutes | 34 | 2.5% |
| 40 to 44 Minutes | 49 | 3.7% |
| 45 to 59 Minutes | 33 | 2.5% |
| 60 to 89 Minutes | 111 | 8.3% |
| 90 or more Minutes | 29 | 2.2% |
Commute Time by Sex in Winona
The most common commute times in Winona are 10 to 14 minutes (169 commuters, 31.4%) for males and 5 to 9 minutes (231 commuters, 29.1%) for females.
| Commute Time | Male | Female |
| Less than 5 Minutes | 34 (6.3%) | 41 (5.2%) |
| 5 to 9 Minutes | 51 (9.5%) | 231 (29.1%) |
| 10 to 14 Minutes | 169 (31.4%) | 168 (21.2%) |
| 15 to 19 Minutes | 0 (0.0%) | 38 (4.8%) |
| 20 to 24 Minutes | 0 (0.0%) | 187 (23.5%) |
| 25 to 29 Minutes | 0 (0.0%) | 0 (0.0%) |
| 30 to 34 Minutes | 108 (20.0%) | 50 (6.3%) |
| 35 to 39 Minutes | 0 (0.0%) | 34 (4.3%) |
| 40 to 44 Minutes | 29 (5.4%) | 20 (2.5%) |
| 45 to 59 Minutes | 8 (1.5%) | 25 (3.2%) |
| 60 to 89 Minutes | 111 (20.6%) | 0 (0.0%) |
| 90 or more Minutes | 29 (5.4%) | 0 (0.0%) |
Time of Departure to Work by Sex in Winona
The most frequent times of departure to work in Winona are 6:00 AM to 6:29 AM (136, 25.2%) for males and 12:00 AM to 4:59 AM (144, 18.1%) for females.
| Time of Departure | Male | Female |
| 12:00 AM to 4:59 AM | 131 (24.3%) | 144 (18.1%) |
| 5:00 AM to 5:29 AM | 0 (0.0%) | 13 (1.6%) |
| 5:30 AM to 5:59 AM | 13 (2.4%) | 20 (2.5%) |
| 6:00 AM to 6:29 AM | 136 (25.2%) | 12 (1.5%) |
| 6:30 AM to 6:59 AM | 123 (22.8%) | 101 (12.7%) |
| 7:00 AM to 7:29 AM | 30 (5.6%) | 55 (6.9%) |
| 7:30 AM to 7:59 AM | 0 (0.0%) | 67 (8.4%) |
| 8:00 AM to 8:29 AM | 17 (3.2%) | 32 (4.0%) |
| 8:30 AM to 8:59 AM | 0 (0.0%) | 18 (2.3%) |
| 9:00 AM to 9:59 AM | 0 (0.0%) | 134 (16.9%) |
| 10:00 AM to 10:59 AM | 0 (0.0%) | 0 (0.0%) |
| 11:00 AM to 11:59 AM | 0 (0.0%) | 58 (7.3%) |
| 12:00 PM to 3:59 PM | 19 (3.5%) | 18 (2.3%) |
| 4:00 PM to 11:59 PM | 70 (13.0%) | 122 (15.4%) |
| Total | 539 (100.0%) | 794 (100.0%) |
Housing Occupancy in Winona
Occupancy by Ownership in Winona
Of the total 1,569 dwellings in Winona, owner-occupied units account for 723 (46.1%), while renter-occupied units make up 846 (53.9%).
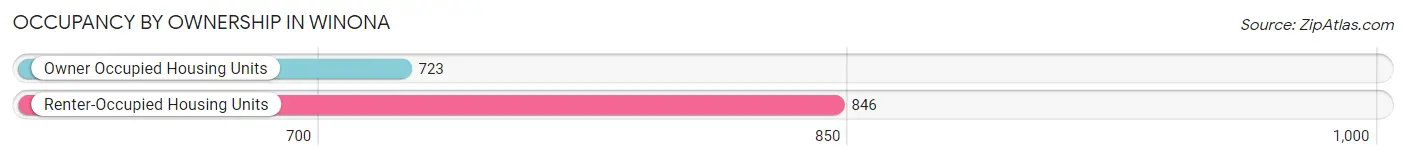
| Occupancy | # Housing Units | % Housing Units |
| Owner Occupied Housing Units | 723 | 46.1% |
| Renter-Occupied Housing Units | 846 | 53.9% |
| Total Occupied Housing Units | 1,569 | 100.0% |
Occupancy by Household Size in Winona
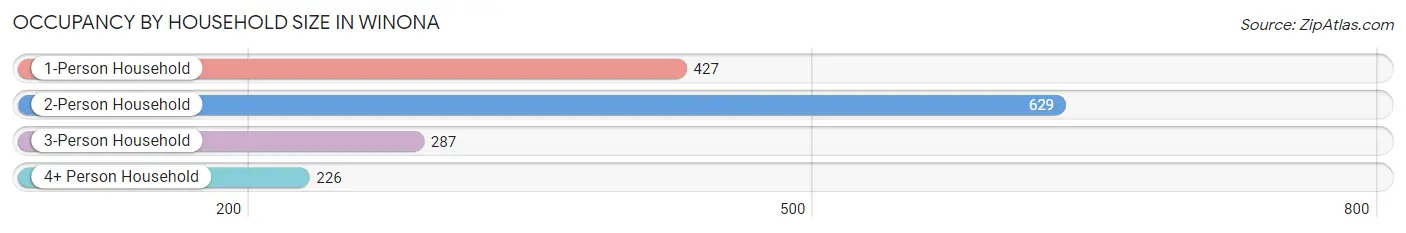
| Household Size | # Housing Units | % Housing Units |
| 1-Person Household | 427 | 27.2% |
| 2-Person Household | 629 | 40.1% |
| 3-Person Household | 287 | 18.3% |
| 4+ Person Household | 226 | 14.4% |
| Total Housing Units | 1,569 | 100.0% |
Occupancy by Ownership by Household Size in Winona
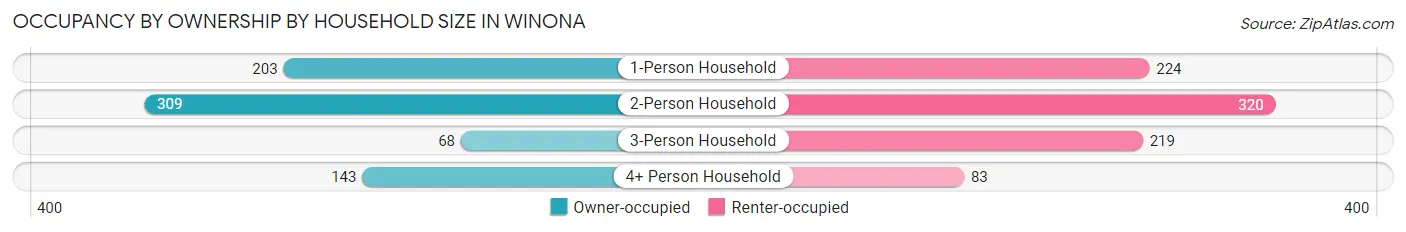
| Household Size | Owner-occupied | Renter-occupied |
| 1-Person Household | 203 (47.5%) | 224 (52.5%) |
| 2-Person Household | 309 (49.1%) | 320 (50.9%) |
| 3-Person Household | 68 (23.7%) | 219 (76.3%) |
| 4+ Person Household | 143 (63.3%) | 83 (36.7%) |
| Total Housing Units | 723 (46.1%) | 846 (53.9%) |
Occupancy by Educational Attainment in Winona
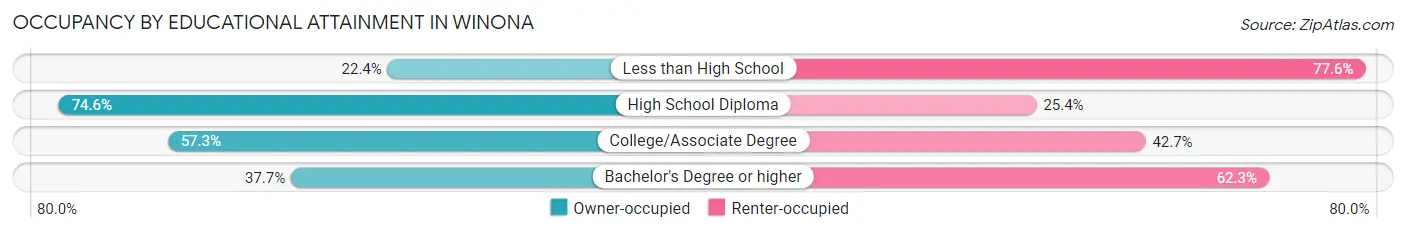
| Household Size | Owner-occupied | Renter-occupied |
| Less than High School | 113 (22.4%) | 391 (77.6%) |
| High School Diploma | 223 (74.6%) | 76 (25.4%) |
| College/Associate Degree | 287 (57.3%) | 214 (42.7%) |
| Bachelor's Degree or higher | 100 (37.7%) | 165 (62.3%) |
Occupancy by Age of Householder in Winona
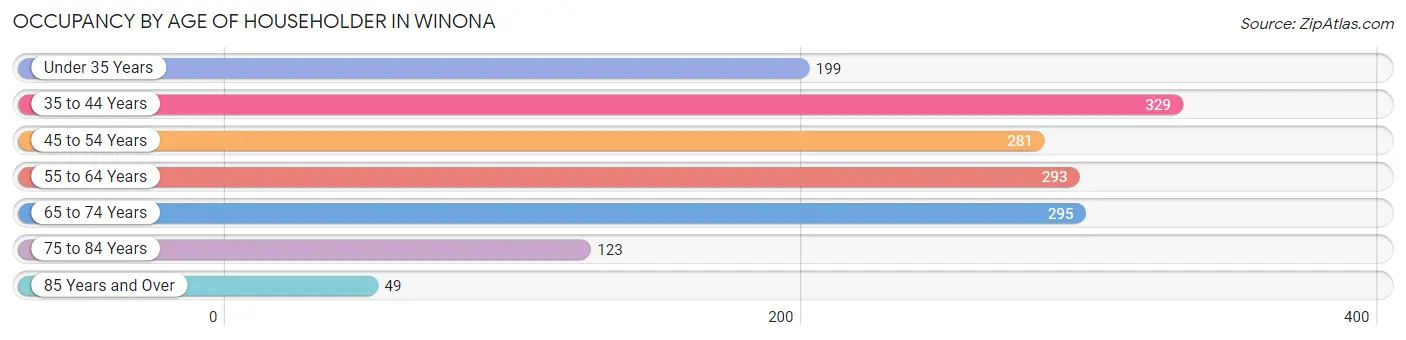
| Age Bracket | # Households | % Households |
| Under 35 Years | 199 | 12.7% |
| 35 to 44 Years | 329 | 21.0% |
| 45 to 54 Years | 281 | 17.9% |
| 55 to 64 Years | 293 | 18.7% |
| 65 to 74 Years | 295 | 18.8% |
| 75 to 84 Years | 123 | 7.8% |
| 85 Years and Over | 49 | 3.1% |
| Total | 1,569 | 100.0% |
Housing Finances in Winona
Median Income by Occupancy in Winona
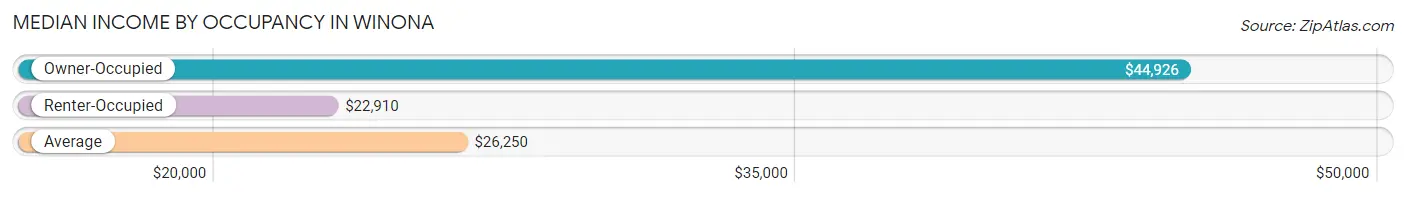
| Occupancy Type | # Households | Median Income |
| Owner-Occupied | 723 (46.1%) | $44,926 |
| Renter-Occupied | 846 (53.9%) | $22,910 |
| Average | 1,569 (100.0%) | $26,250 |
Occupancy by Householder Income Bracket in Winona
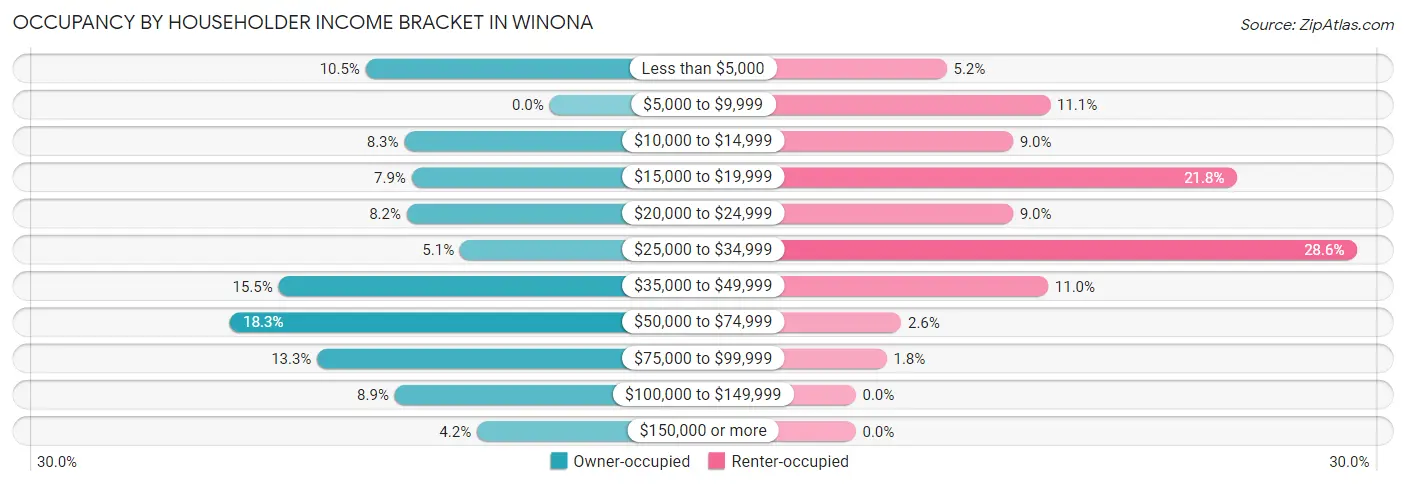
| Income Bracket | Owner-occupied | Renter-occupied |
| Less than $5,000 | 76 (10.5%) | 44 (5.2%) |
| $5,000 to $9,999 | 0 (0.0%) | 94 (11.1%) |
| $10,000 to $14,999 | 60 (8.3%) | 76 (9.0%) |
| $15,000 to $19,999 | 57 (7.9%) | 184 (21.7%) |
| $20,000 to $24,999 | 59 (8.2%) | 76 (9.0%) |
| $25,000 to $34,999 | 37 (5.1%) | 242 (28.6%) |
| $35,000 to $49,999 | 112 (15.5%) | 93 (11.0%) |
| $50,000 to $74,999 | 132 (18.3%) | 22 (2.6%) |
| $75,000 to $99,999 | 96 (13.3%) | 15 (1.8%) |
| $100,000 to $149,999 | 64 (8.8%) | 0 (0.0%) |
| $150,000 or more | 30 (4.2%) | 0 (0.0%) |
| Total | 723 (100.0%) | 846 (100.0%) |
Monthly Housing Cost Tiers in Winona
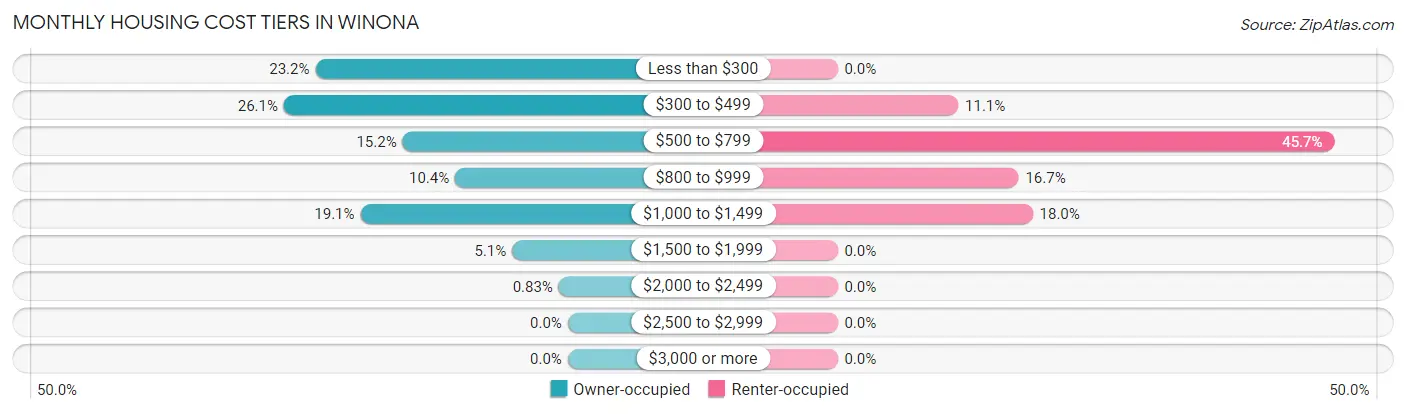
| Monthly Cost | Owner-occupied | Renter-occupied |
| Less than $300 | 168 (23.2%) | 0 (0.0%) |
| $300 to $499 | 189 (26.1%) | 94 (11.1%) |
| $500 to $799 | 110 (15.2%) | 387 (45.7%) |
| $800 to $999 | 75 (10.4%) | 141 (16.7%) |
| $1,000 to $1,499 | 138 (19.1%) | 152 (18.0%) |
| $1,500 to $1,999 | 37 (5.1%) | 0 (0.0%) |
| $2,000 to $2,499 | 6 (0.8%) | 0 (0.0%) |
| $2,500 to $2,999 | 0 (0.0%) | 0 (0.0%) |
| $3,000 or more | 0 (0.0%) | 0 (0.0%) |
| Total | 723 (100.0%) | 846 (100.0%) |
Physical Housing Characteristics in Winona
Housing Structures in Winona
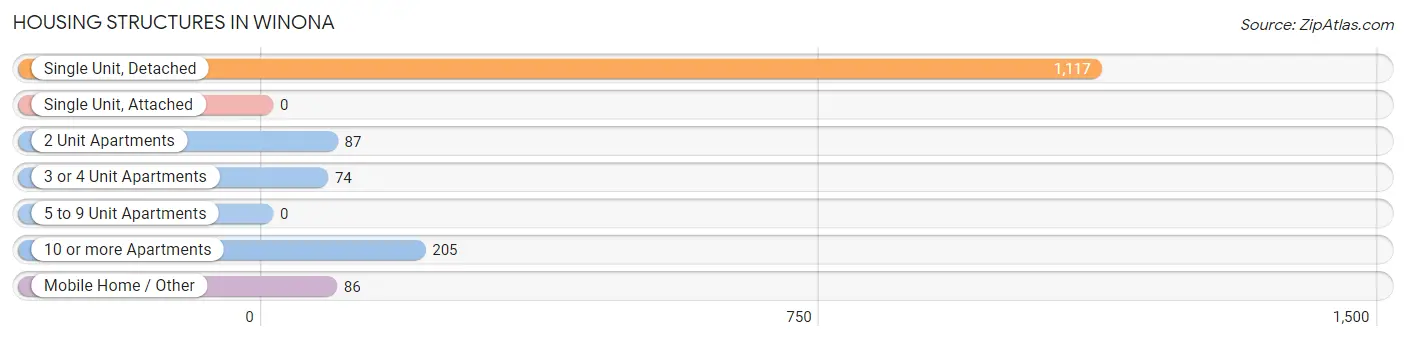
| Structure Type | # Housing Units | % Housing Units |
| Single Unit, Detached | 1,117 | 71.2% |
| Single Unit, Attached | 0 | 0.0% |
| 2 Unit Apartments | 87 | 5.5% |
| 3 or 4 Unit Apartments | 74 | 4.7% |
| 5 to 9 Unit Apartments | 0 | 0.0% |
| 10 or more Apartments | 205 | 13.1% |
| Mobile Home / Other | 86 | 5.5% |
| Total | 1,569 | 100.0% |
Housing Structures by Occupancy in Winona
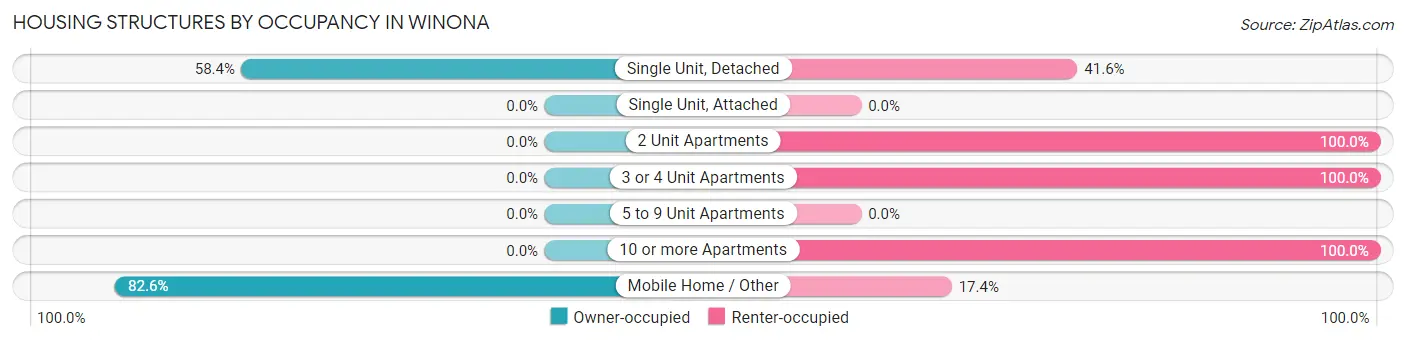
| Structure Type | Owner-occupied | Renter-occupied |
| Single Unit, Detached | 652 (58.4%) | 465 (41.6%) |
| Single Unit, Attached | 0 (0.0%) | 0 (0.0%) |
| 2 Unit Apartments | 0 (0.0%) | 87 (100.0%) |
| 3 or 4 Unit Apartments | 0 (0.0%) | 74 (100.0%) |
| 5 to 9 Unit Apartments | 0 (0.0%) | 0 (0.0%) |
| 10 or more Apartments | 0 (0.0%) | 205 (100.0%) |
| Mobile Home / Other | 71 (82.6%) | 15 (17.4%) |
| Total | 723 (46.1%) | 846 (53.9%) |
Housing Structures by Number of Rooms in Winona
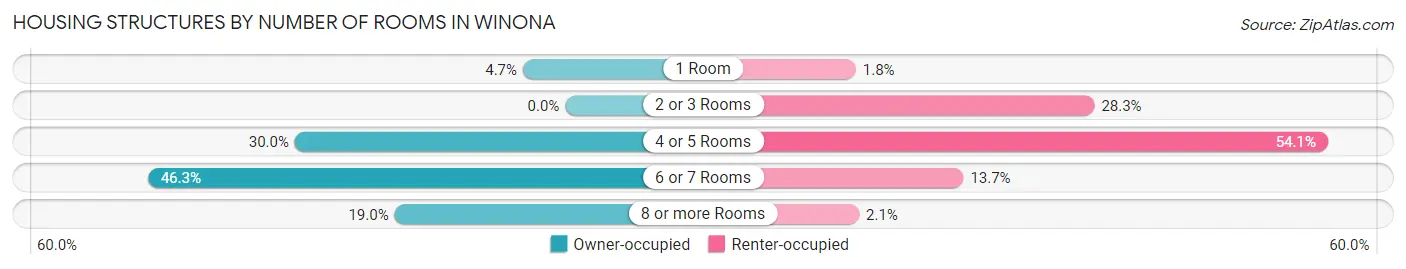
| Number of Rooms | Owner-occupied | Renter-occupied |
| 1 Room | 34 (4.7%) | 15 (1.8%) |
| 2 or 3 Rooms | 0 (0.0%) | 239 (28.2%) |
| 4 or 5 Rooms | 217 (30.0%) | 458 (54.1%) |
| 6 or 7 Rooms | 335 (46.3%) | 116 (13.7%) |
| 8 or more Rooms | 137 (19.0%) | 18 (2.1%) |
| Total | 723 (100.0%) | 846 (100.0%) |
Housing Structure by Heating Type in Winona
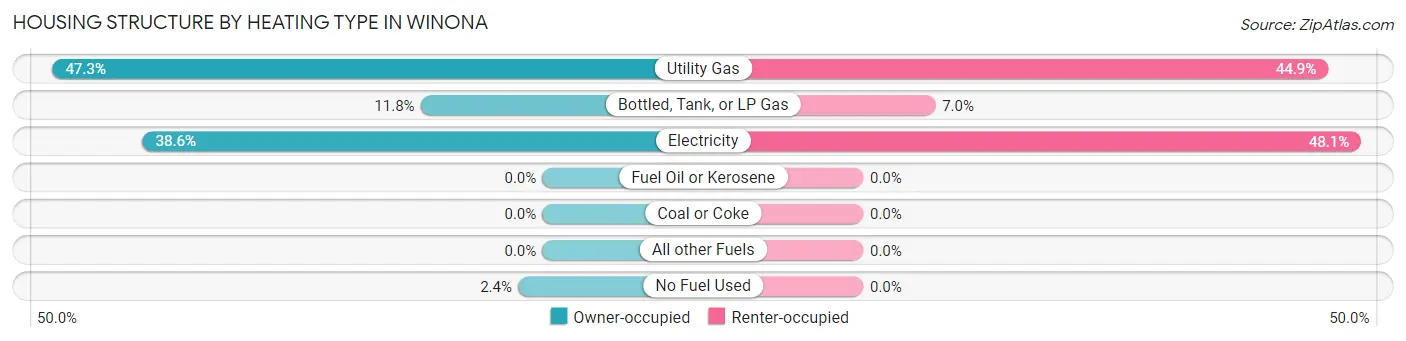
| Heating Type | Owner-occupied | Renter-occupied |
| Utility Gas | 342 (47.3%) | 380 (44.9%) |
| Bottled, Tank, or LP Gas | 85 (11.8%) | 59 (7.0%) |
| Electricity | 279 (38.6%) | 407 (48.1%) |
| Fuel Oil or Kerosene | 0 (0.0%) | 0 (0.0%) |
| Coal or Coke | 0 (0.0%) | 0 (0.0%) |
| All other Fuels | 0 (0.0%) | 0 (0.0%) |
| No Fuel Used | 17 (2.4%) | 0 (0.0%) |
| Total | 723 (100.0%) | 846 (100.0%) |
Household Vehicle Usage in Winona
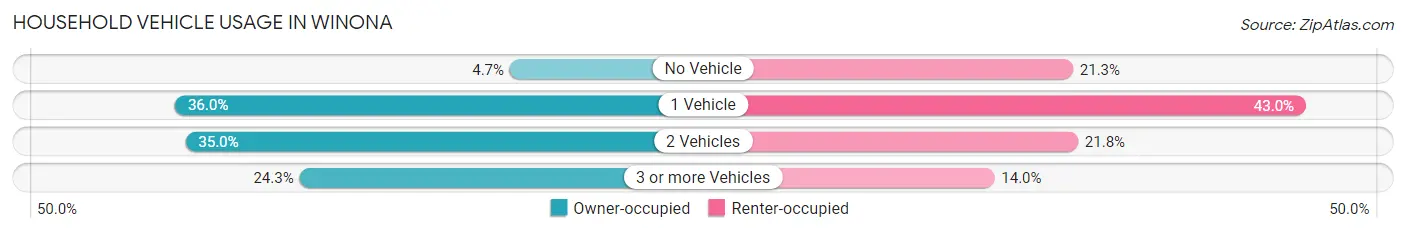
| Vehicles per Household | Owner-occupied | Renter-occupied |
| No Vehicle | 34 (4.7%) | 180 (21.3%) |
| 1 Vehicle | 260 (36.0%) | 364 (43.0%) |
| 2 Vehicles | 253 (35.0%) | 184 (21.7%) |
| 3 or more Vehicles | 176 (24.3%) | 118 (14.0%) |
| Total | 723 (100.0%) | 846 (100.0%) |
Real Estate & Mortgages in Winona
Real Estate and Mortgage Overview in Winona
| Characteristic | Without Mortgage | With Mortgage |
| Housing Units | 449 | 274 |
| Median Property Value | $78,800 | $103,700 |
| Median Household Income | $35,461 | $0 |
| Monthly Housing Costs | $360 | $0 |
| Real Estate Taxes | $681 | $70 |
Property Value by Mortgage Status in Winona
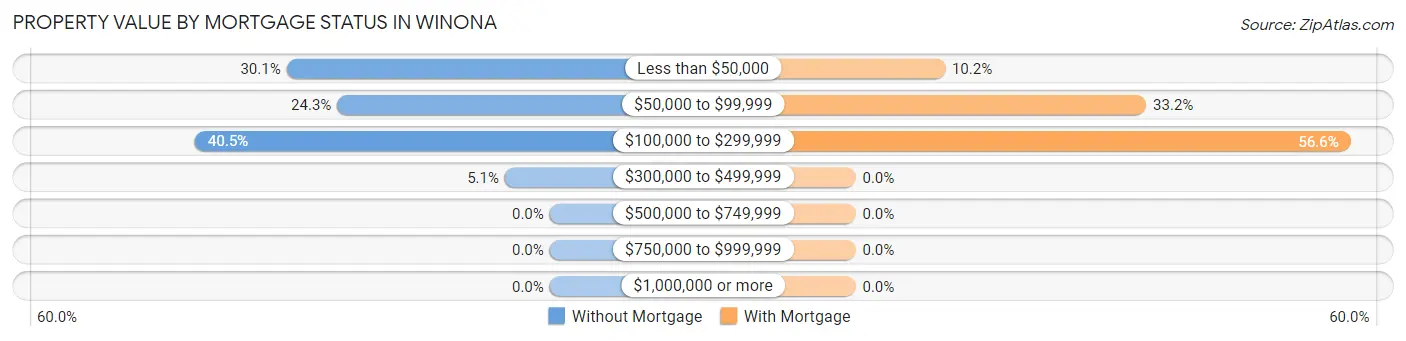
| Property Value | Without Mortgage | With Mortgage |
| Less than $50,000 | 135 (30.1%) | 28 (10.2%) |
| $50,000 to $99,999 | 109 (24.3%) | 91 (33.2%) |
| $100,000 to $299,999 | 182 (40.5%) | 155 (56.6%) |
| $300,000 to $499,999 | 23 (5.1%) | 0 (0.0%) |
| $500,000 to $749,999 | 0 (0.0%) | 0 (0.0%) |
| $750,000 to $999,999 | 0 (0.0%) | 0 (0.0%) |
| $1,000,000 or more | 0 (0.0%) | 0 (0.0%) |
| Total | 449 (100.0%) | 274 (100.0%) |
Household Income by Mortgage Status in Winona
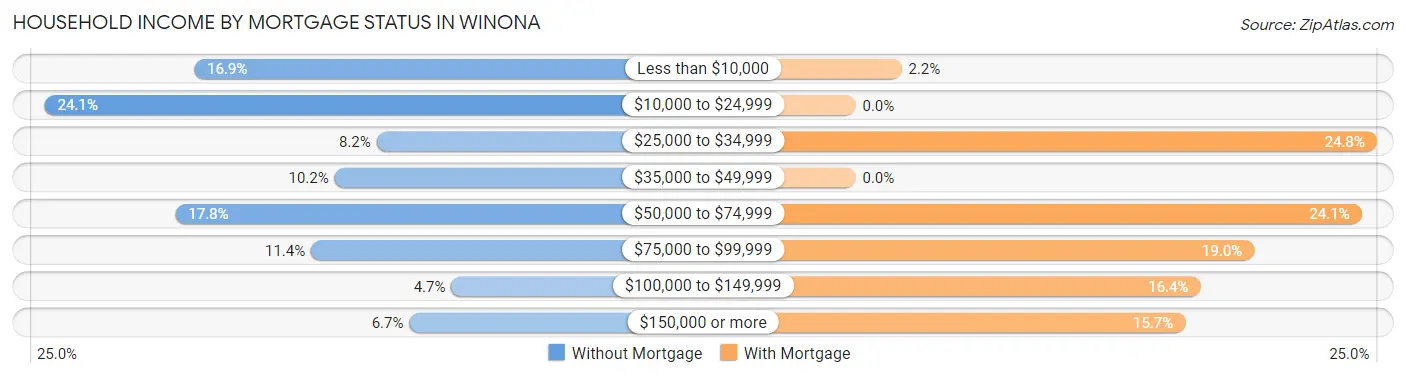
| Household Income | Without Mortgage | With Mortgage |
| Less than $10,000 | 76 (16.9%) | 6 (2.2%) |
| $10,000 to $24,999 | 108 (24.0%) | 0 (0.0%) |
| $25,000 to $34,999 | 37 (8.2%) | 68 (24.8%) |
| $35,000 to $49,999 | 46 (10.2%) | 0 (0.0%) |
| $50,000 to $74,999 | 80 (17.8%) | 66 (24.1%) |
| $75,000 to $99,999 | 51 (11.4%) | 52 (19.0%) |
| $100,000 to $149,999 | 21 (4.7%) | 45 (16.4%) |
| $150,000 or more | 30 (6.7%) | 43 (15.7%) |
| Total | 449 (100.0%) | 274 (100.0%) |
Property Value to Household Income Ratio in Winona
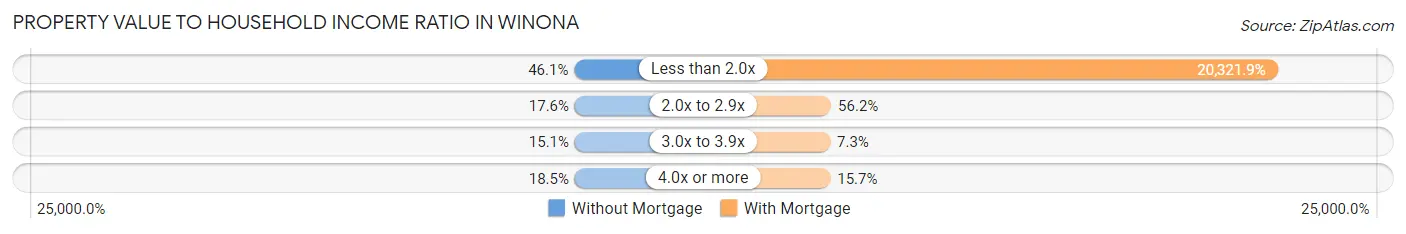
| Value-to-Income Ratio | Without Mortgage | With Mortgage |
| Less than 2.0x | 207 (46.1%) | 55,682 (20,321.9%) |
| 2.0x to 2.9x | 79 (17.6%) | 154 (56.2%) |
| 3.0x to 3.9x | 68 (15.1%) | 20 (7.3%) |
| 4.0x or more | 83 (18.5%) | 43 (15.7%) |
| Total | 449 (100.0%) | 274 (100.0%) |
Real Estate Taxes by Mortgage Status in Winona
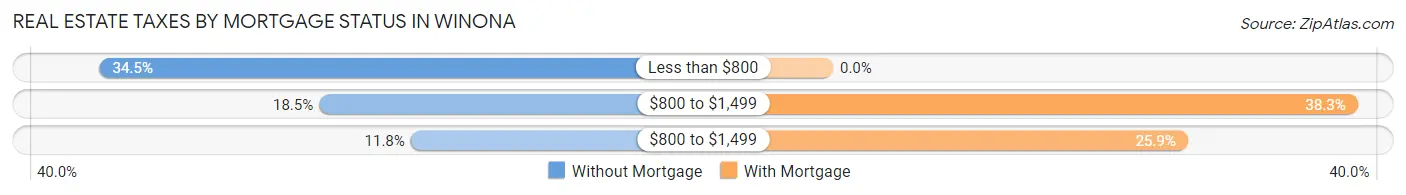
| Property Taxes | Without Mortgage | With Mortgage |
| Less than $800 | 155 (34.5%) | 0 (0.0%) |
| $800 to $1,499 | 83 (18.5%) | 105 (38.3%) |
| $800 to $1,499 | 53 (11.8%) | 71 (25.9%) |
| Total | 449 (100.0%) | 274 (100.0%) |
Health & Disability in Winona
Health Insurance Coverage by Age in Winona
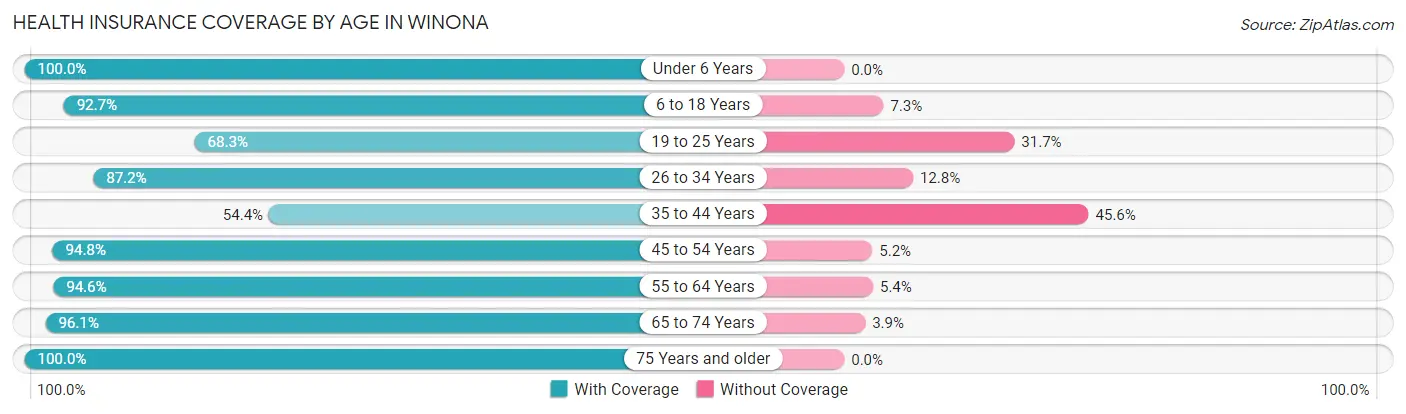
| Age Bracket | With Coverage | Without Coverage |
| Under 6 Years | 400 (100.0%) | 0 (0.0%) |
| 6 to 18 Years | 1,092 (92.7%) | 86 (7.3%) |
| 19 to 25 Years | 226 (68.3%) | 105 (31.7%) |
| 26 to 34 Years | 320 (87.2%) | 47 (12.8%) |
| 35 to 44 Years | 288 (54.4%) | 241 (45.6%) |
| 45 to 54 Years | 326 (94.8%) | 18 (5.2%) |
| 55 to 64 Years | 477 (94.6%) | 27 (5.4%) |
| 65 to 74 Years | 320 (96.1%) | 13 (3.9%) |
| 75 Years and older | 317 (100.0%) | 0 (0.0%) |
| Total | 3,766 (87.5%) | 537 (12.5%) |
Health Insurance Coverage by Citizenship Status in Winona
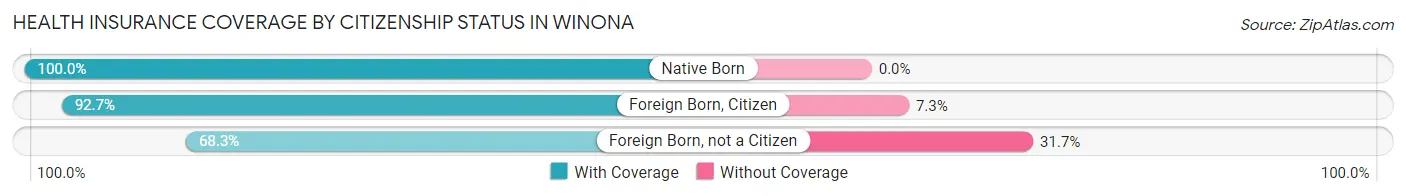
| Citizenship Status | With Coverage | Without Coverage |
| Native Born | 400 (100.0%) | 0 (0.0%) |
| Foreign Born, Citizen | 1,092 (92.7%) | 86 (7.3%) |
| Foreign Born, not a Citizen | 226 (68.3%) | 105 (31.7%) |
Health Insurance Coverage by Household Income in Winona
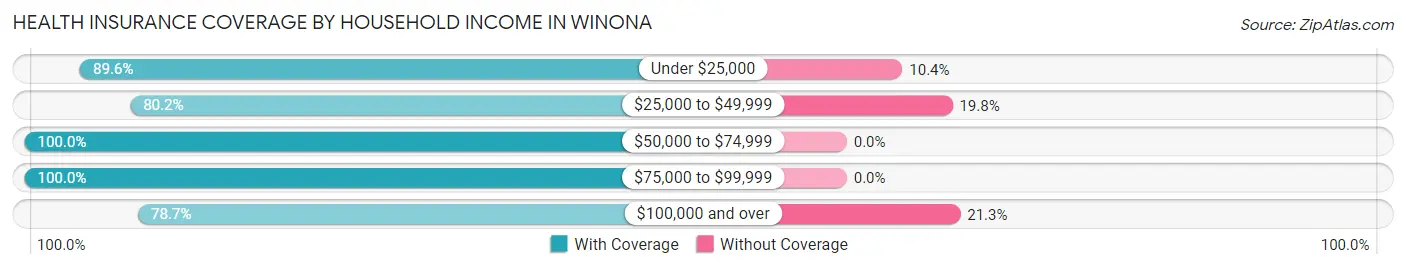
| Household Income | With Coverage | Without Coverage |
| Under $25,000 | 1,670 (89.6%) | 194 (10.4%) |
| $25,000 to $49,999 | 1,061 (80.2%) | 262 (19.8%) |
| $50,000 to $74,999 | 435 (100.0%) | 0 (0.0%) |
| $75,000 to $99,999 | 300 (100.0%) | 0 (0.0%) |
| $100,000 and over | 300 (78.7%) | 81 (21.3%) |
Public vs Private Health Insurance Coverage by Age in Winona
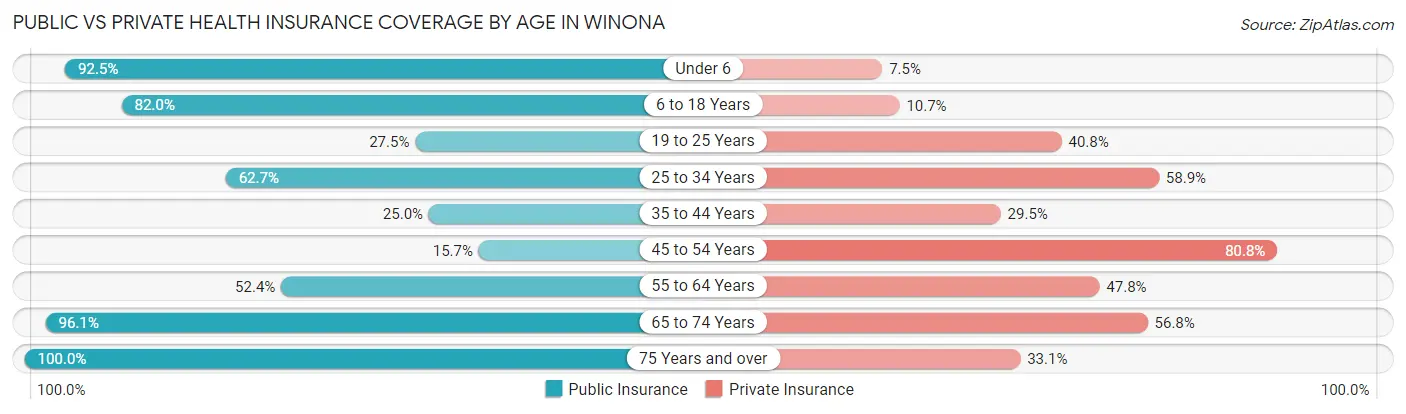
| Age Bracket | Public Insurance | Private Insurance |
| Under 6 | 370 (92.5%) | 30 (7.5%) |
| 6 to 18 Years | 966 (82.0%) | 126 (10.7%) |
| 19 to 25 Years | 91 (27.5%) | 135 (40.8%) |
| 25 to 34 Years | 230 (62.7%) | 216 (58.9%) |
| 35 to 44 Years | 132 (24.9%) | 156 (29.5%) |
| 45 to 54 Years | 54 (15.7%) | 278 (80.8%) |
| 55 to 64 Years | 264 (52.4%) | 241 (47.8%) |
| 65 to 74 Years | 320 (96.1%) | 189 (56.8%) |
| 75 Years and over | 317 (100.0%) | 105 (33.1%) |
| Total | 2,744 (63.8%) | 1,476 (34.3%) |
Disability Status by Sex by Age in Winona
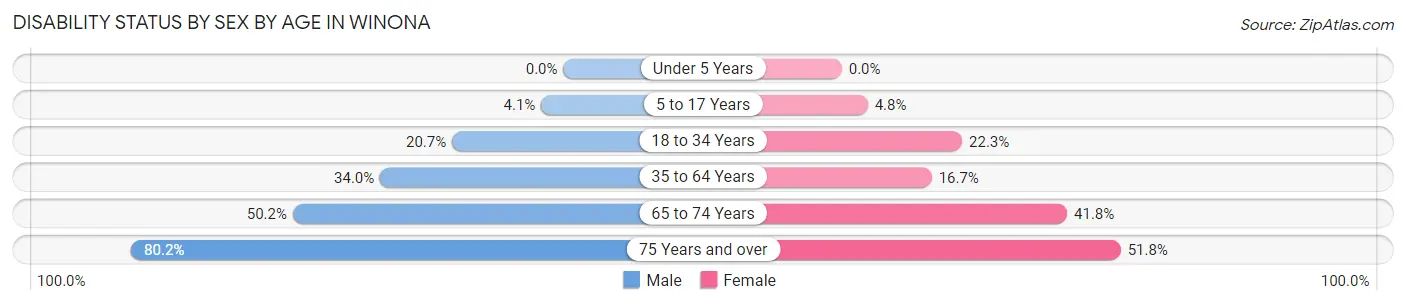
| Age Bracket | Male | Female |
| Under 5 Years | 0 (0.0%) | 0 (0.0%) |
| 5 to 17 Years | 25 (4.1%) | 22 (4.8%) |
| 18 to 34 Years | 63 (20.7%) | 136 (22.3%) |
| 35 to 64 Years | 185 (34.0%) | 139 (16.7%) |
| 65 to 74 Years | 112 (50.2%) | 46 (41.8%) |
| 75 Years and over | 73 (80.2%) | 117 (51.8%) |
Disability Class by Sex by Age in Winona
Disability Class: Hearing Difficulty
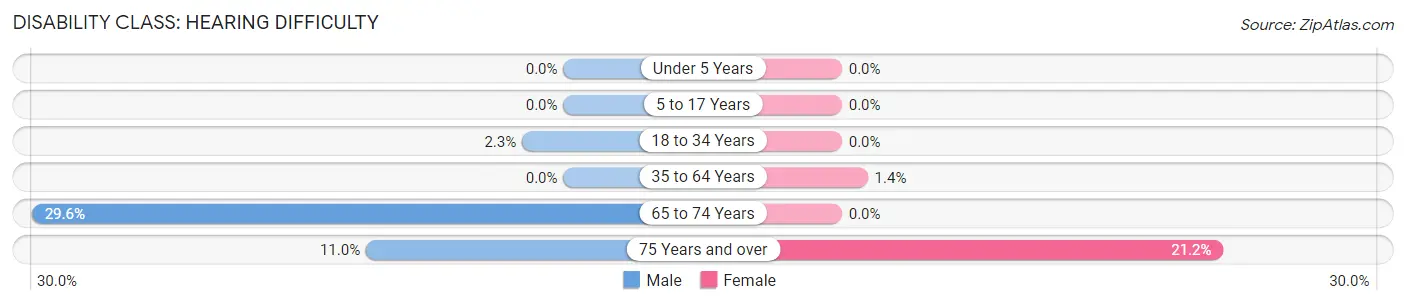
| Age Bracket | Male | Female |
| Under 5 Years | 0 (0.0%) | 0 (0.0%) |
| 5 to 17 Years | 0 (0.0%) | 0 (0.0%) |
| 18 to 34 Years | 7 (2.3%) | 0 (0.0%) |
| 35 to 64 Years | 0 (0.0%) | 12 (1.4%) |
| 65 to 74 Years | 66 (29.6%) | 0 (0.0%) |
| 75 Years and over | 10 (11.0%) | 48 (21.2%) |
Disability Class: Vision Difficulty
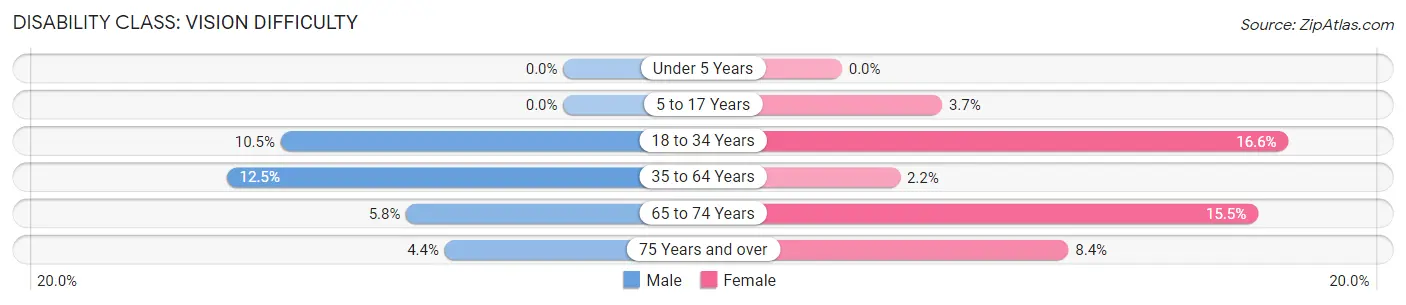
| Age Bracket | Male | Female |
| Under 5 Years | 0 (0.0%) | 0 (0.0%) |
| 5 to 17 Years | 0 (0.0%) | 17 (3.7%) |
| 18 to 34 Years | 32 (10.5%) | 101 (16.6%) |
| 35 to 64 Years | 68 (12.5%) | 18 (2.2%) |
| 65 to 74 Years | 13 (5.8%) | 17 (15.4%) |
| 75 Years and over | 4 (4.4%) | 19 (8.4%) |
Disability Class: Cognitive Difficulty
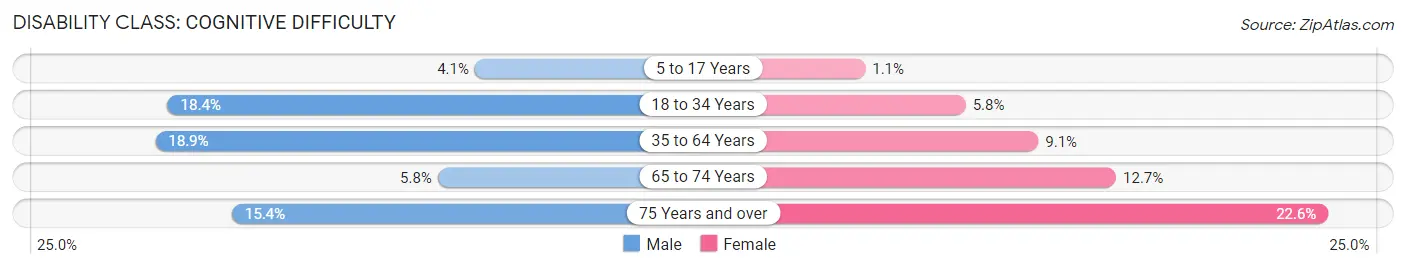
| Age Bracket | Male | Female |
| 5 to 17 Years | 25 (4.1%) | 5 (1.1%) |
| 18 to 34 Years | 56 (18.4%) | 35 (5.8%) |
| 35 to 64 Years | 103 (18.9%) | 76 (9.1%) |
| 65 to 74 Years | 13 (5.8%) | 14 (12.7%) |
| 75 Years and over | 14 (15.4%) | 51 (22.6%) |
Disability Class: Ambulatory Difficulty
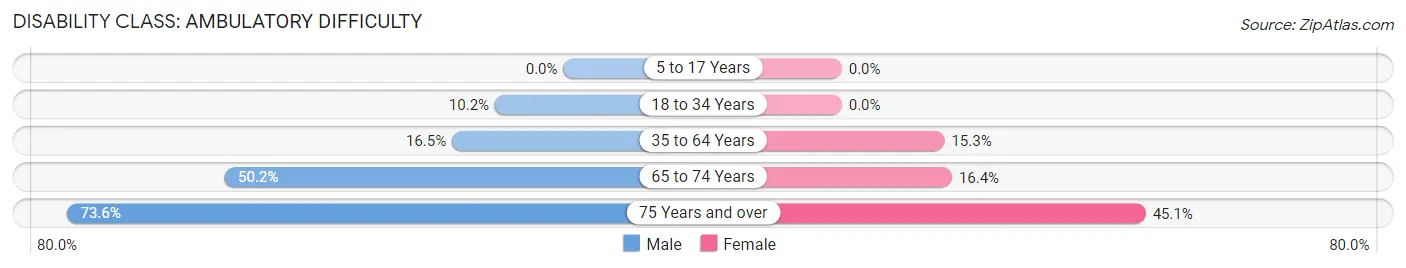
| Age Bracket | Male | Female |
| 5 to 17 Years | 0 (0.0%) | 0 (0.0%) |
| 18 to 34 Years | 31 (10.2%) | 0 (0.0%) |
| 35 to 64 Years | 90 (16.5%) | 127 (15.2%) |
| 65 to 74 Years | 112 (50.2%) | 18 (16.4%) |
| 75 Years and over | 67 (73.6%) | 102 (45.1%) |
Disability Class: Self-Care Difficulty
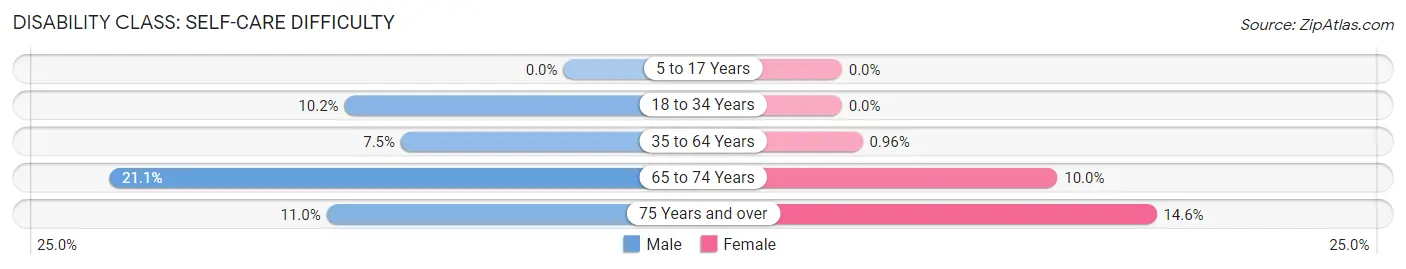
| Age Bracket | Male | Female |
| 5 to 17 Years | 0 (0.0%) | 0 (0.0%) |
| 18 to 34 Years | 31 (10.2%) | 0 (0.0%) |
| 35 to 64 Years | 41 (7.5%) | 8 (1.0%) |
| 65 to 74 Years | 47 (21.1%) | 11 (10.0%) |
| 75 Years and over | 10 (11.0%) | 33 (14.6%) |
Technology Access in Winona
Computing Device Access in Winona
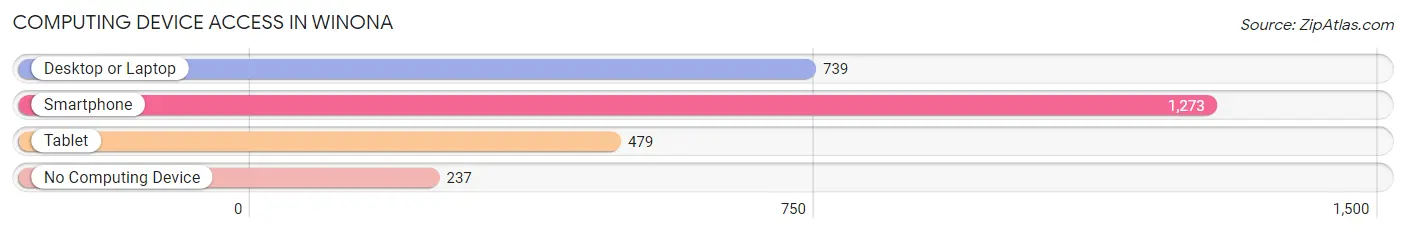
| Device Type | # Households | % Households |
| Desktop or Laptop | 739 | 47.1% |
| Smartphone | 1,273 | 81.1% |
| Tablet | 479 | 30.5% |
| No Computing Device | 237 | 15.1% |
| Total | 1,569 | 100.0% |
Internet Access in Winona
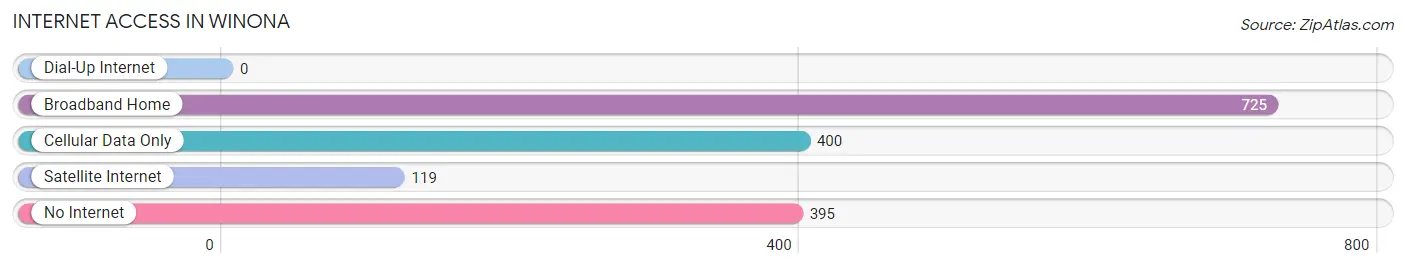
| Internet Type | # Households | % Households |
| Dial-Up Internet | 0 | 0.0% |
| Broadband Home | 725 | 46.2% |
| Cellular Data Only | 400 | 25.5% |
| Satellite Internet | 119 | 7.6% |
| No Internet | 395 | 25.2% |
| Total | 1,569 | 100.0% |
Winona Summary
Winona, Mississippi is a small city located in Montgomery County, Mississippi. It is situated in the heart of the Mississippi Delta, and is the county seat of Montgomery County. The city has a population of 5,717 as of the 2010 census, and is the largest city in the county.
History
The area that is now Winona was first settled in the early 1800s by Native Americans, and was later settled by European settlers in the 1830s. The city was originally known as "Crossroads" due to its location at the intersection of two major roads. In 1837, the town was renamed "Winona" after the daughter of a local Choctaw chief.
The city was officially incorporated in 1858, and was the first city in Montgomery County to be incorporated. During the Civil War, Winona served as a major supply depot for the Confederate Army. After the war, the city experienced a period of growth and prosperity, and by the early 1900s, it had become a major center for cotton production.
Geography
Winona is located in the heart of the Mississippi Delta, and is situated at the intersection of two major highways, US Highway 82 and Mississippi Highway 8. The city is located approximately 50 miles south of Memphis, Tennessee, and is situated on the banks of the Yocona River. The city has a total area of 4.2 square miles, all of which is land.
Economy
The economy of Winona is largely based on agriculture, with cotton being the primary crop. The city is also home to several manufacturing companies, including a furniture factory, a paper mill, and a plastics plant. The city is also home to a number of retail stores, restaurants, and other businesses.
Demographics
As of the 2010 census, Winona had a population of 5,717. The racial makeup of the city was 57.3% African American, 40.2% White, 0.3% Native American, 0.2% Asian, 0.1% Pacific Islander, 0.7% from other races, and 1.4% from two or more races. Hispanic or Latino of any race were 1.7% of the population.
The median income for a household in the city was $25,938, and the median income for a family was $31,964. The per capita income for the city was $14,845. About 24.2% of families and 28.2% of the population were below the poverty line, including 37.2% of those under age 18 and 22.2% of those age 65 or over.
Conclusion
Winona, Mississippi is a small city located in the heart of the Mississippi Delta. It has a long and rich history, and is the largest city in Montgomery County. The economy of the city is largely based on agriculture, with cotton being the primary crop. The city has a population of 5,717, and the racial makeup of the city is 57.3% African American, 40.2% White, 0.3% Native American, 0.2% Asian, 0.1% Pacific Islander, 0.7% from other races, and 1.4% from two or more races. The median income for a household in the city is $25,938, and the median income for a family is $31,964.
Common Questions
What is Per Capita Income in Winona?
Per Capita income in Winona is $14,769.
What is the Median Family Income in Winona?
Median Family Income in Winona is $27,670.
What is the Median Household income in Winona?
Median Household Income in Winona is $26,250.
What is Income or Wage Gap in Winona?
Income or Wage Gap in Winona is 50.8%.
Women in Winona earn 49.2 cents for every dollar earned by a man.
What is Family Income Deficit in Winona?
Family Income Deficit in Winona is $12,283.
Families that are below poverty line in Winona earn $12,283 less on average than the poverty threshold level.
What is Inequality or Gini Index in Winona?
Inequality or Gini Index in Winona is 0.46.
What is the Total Population of Winona?
Total Population of Winona is 4,422.
What is the Total Male Population of Winona?
Total Male Population of Winona is 1,930.
What is the Total Female Population of Winona?
Total Female Population of Winona is 2,492.
What is the Ratio of Males per 100 Females in Winona?
There are 77.45 Males per 100 Females in Winona.
What is the Ratio of Females per 100 Males in Winona?
There are 129.12 Females per 100 Males in Winona.
What is the Median Population Age in Winona?
Median Population Age in Winona is 33.7 Years.
What is the Average Family Size in Winona
Average Family Size in Winona is 3.4 People.
What is the Average Household Size in Winona
Average Household Size in Winona is 2.7 People.
How Large is the Labor Force in Winona?
There are 1,470 People in the Labor Forcein in Winona.
What is the Percentage of People in the Labor Force in Winona?
45.4% of People are in the Labor Force in Winona.
What is the Unemployment Rate in Winona?
Unemployment Rate in Winona is 8.6%.