Magee, MS Map & Demographics
Magee Map
Magee Overview
$20,678
PER CAPITA INCOME
$56,685
AVG FAMILY INCOME
$39,485
AVG HOUSEHOLD INCOME
14.6%
WAGE / INCOME GAP [ % ]
85.4¢/ $1
WAGE / INCOME GAP [ $ ]
0.49
INEQUALITY / GINI INDEX
3,974
TOTAL POPULATION
2,079
MALE POPULATION
1,895
FEMALE POPULATION
109.71
MALES / 100 FEMALES
91.15
FEMALES / 100 MALES
44.6
MEDIAN AGE
3.5
AVG FAMILY SIZE
2.6
AVG HOUSEHOLD SIZE
1,864
LABOR FORCE [ PEOPLE ]
56.7%
PERCENT IN LABOR FORCE
4.9%
UNEMPLOYMENT RATE
Magee Zip Codes
Magee Area Codes
Income in Magee
Income Overview in Magee
Per Capita Income in Magee is $20,678, while median incomes of families and households are $56,685 and $39,485 respectively.
| Characteristic | Number | Measure |
| Per Capita Income | 3,974 | $20,678 |
| Median Family Income | 783 | $56,685 |
| Mean Family Income | 783 | $68,844 |
| Median Household Income | 1,357 | $39,485 |
| Mean Household Income | 1,357 | $52,573 |
| Income Deficit | 783 | $0 |
| Wage / Income Gap (%) | 3,974 | 14.64% |
| Wage / Income Gap ($) | 3,974 | 85.36¢ per $1 |
| Gini / Inequality Index | 3,974 | 0.49 |
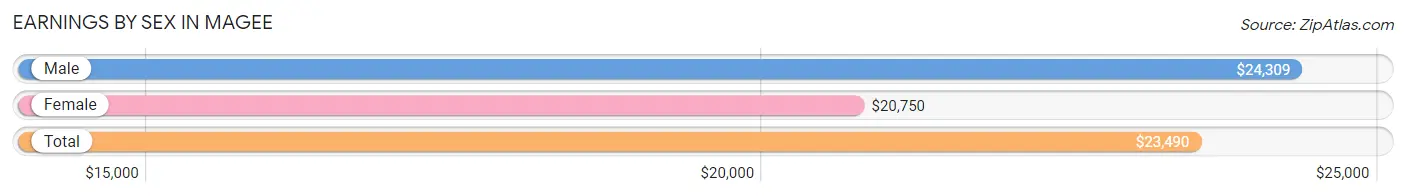
Earnings by Sex in Magee
Average Earnings in Magee are $23,490, $24,309 for men and $20,750 for women, a difference of 14.6%.
| Sex | Number | Average Earnings |
| Male | 1,062 (53.7%) | $24,309 |
| Female | 915 (46.3%) | $20,750 |
| Total | 1,977 (100.0%) | $23,490 |
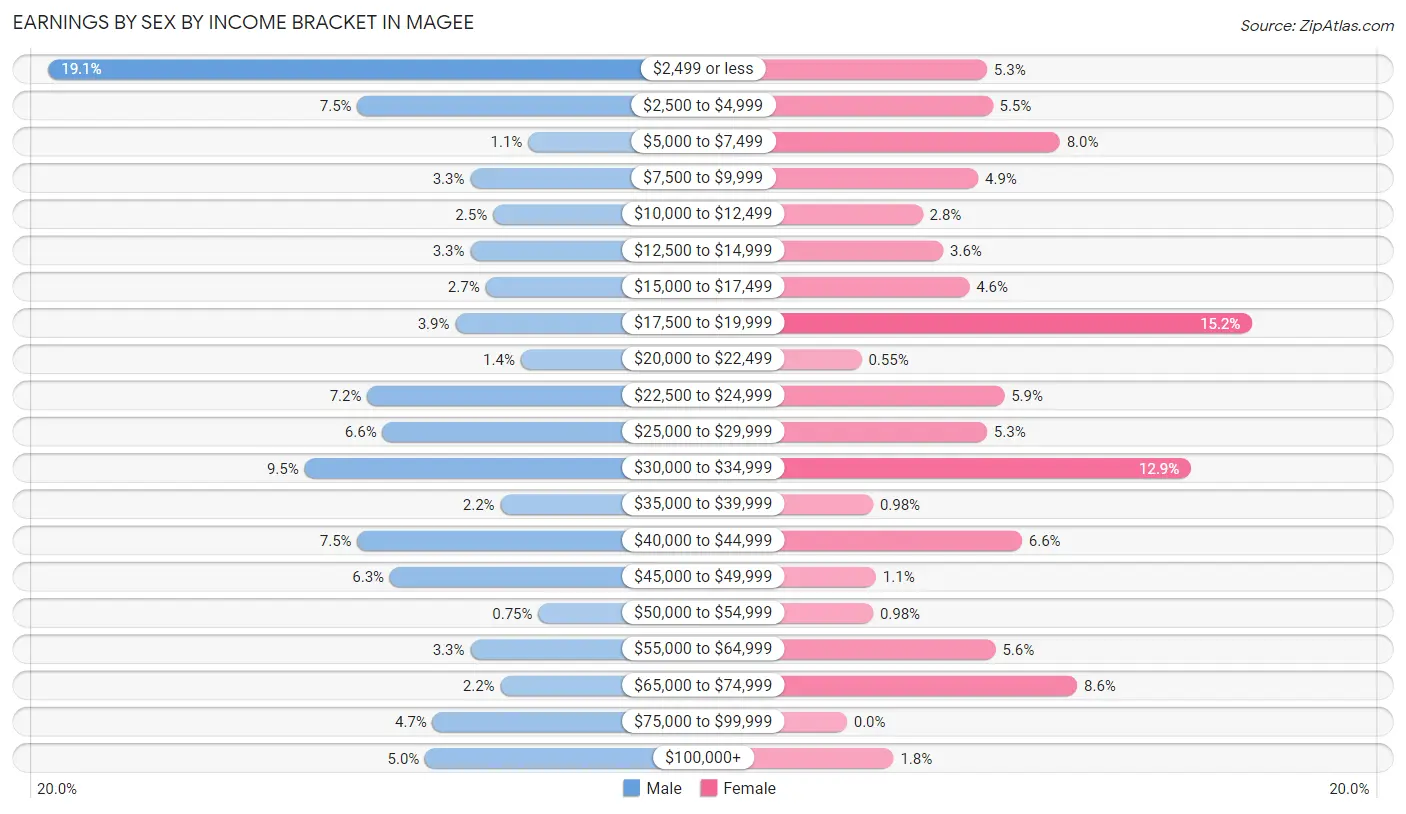
Earnings by Sex by Income Bracket in Magee
The most common earnings brackets in Magee are $2,499 or less for men (203 | 19.1%) and $17,500 to $19,999 for women (139 | 15.2%).
| Income | Male | Female |
| $2,499 or less | 203 (19.1%) | 48 (5.2%) |
| $2,500 to $4,999 | 80 (7.5%) | 50 (5.5%) |
| $5,000 to $7,499 | 12 (1.1%) | 73 (8.0%) |
| $7,500 to $9,999 | 35 (3.3%) | 45 (4.9%) |
| $10,000 to $12,499 | 26 (2.5%) | 26 (2.8%) |
| $12,500 to $14,999 | 35 (3.3%) | 33 (3.6%) |
| $15,000 to $17,499 | 29 (2.7%) | 42 (4.6%) |
| $17,500 to $19,999 | 41 (3.9%) | 139 (15.2%) |
| $20,000 to $22,499 | 15 (1.4%) | 5 (0.5%) |
| $22,500 to $24,999 | 76 (7.2%) | 54 (5.9%) |
| $25,000 to $29,999 | 70 (6.6%) | 48 (5.2%) |
| $30,000 to $34,999 | 101 (9.5%) | 118 (12.9%) |
| $35,000 to $39,999 | 23 (2.2%) | 9 (1.0%) |
| $40,000 to $44,999 | 80 (7.5%) | 60 (6.6%) |
| $45,000 to $49,999 | 67 (6.3%) | 10 (1.1%) |
| $50,000 to $54,999 | 8 (0.7%) | 9 (1.0%) |
| $55,000 to $64,999 | 35 (3.3%) | 51 (5.6%) |
| $65,000 to $74,999 | 23 (2.2%) | 79 (8.6%) |
| $75,000 to $99,999 | 50 (4.7%) | 0 (0.0%) |
| $100,000+ | 53 (5.0%) | 16 (1.8%) |
| Total | 1,062 (100.0%) | 915 (100.0%) |
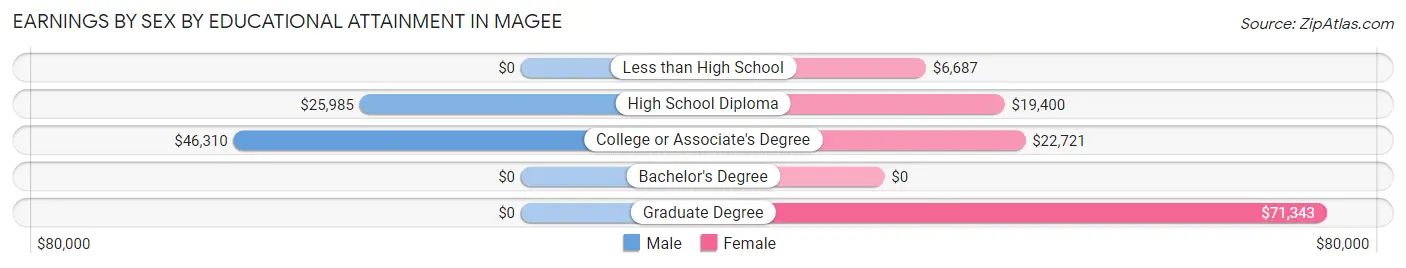
Earnings by Sex by Educational Attainment in Magee
Average earnings in Magee are $26,729 for men and $23,194 for women, a difference of 13.2%. Men with an educational attainment of college or associate's degree enjoy the highest average annual earnings of $46,310, while those with high school diploma education earn the least with $25,985. Women with an educational attainment of graduate degree earn the most with the average annual earnings of $71,343, while those with less than high school education have the smallest earnings of $6,687.
| Educational Attainment | Male Income | Female Income |
| Less than High School | - | - |
| High School Diploma | $25,985 | $19,400 |
| College or Associate's Degree | $46,310 | $22,721 |
| Bachelor's Degree | - | - |
| Graduate Degree | - | - |
| Total | $26,729 | $23,194 |
Family Income in Magee
Family Income Brackets in Magee
According to the Magee family income data, there are 141 families falling into the $100,000 to $149,999 income range, which is the most common income bracket and makes up 18.0% of all families. Conversely, the $200,000+ income bracket is the least frequent group with only 24 families (3.1%) belonging to this category.
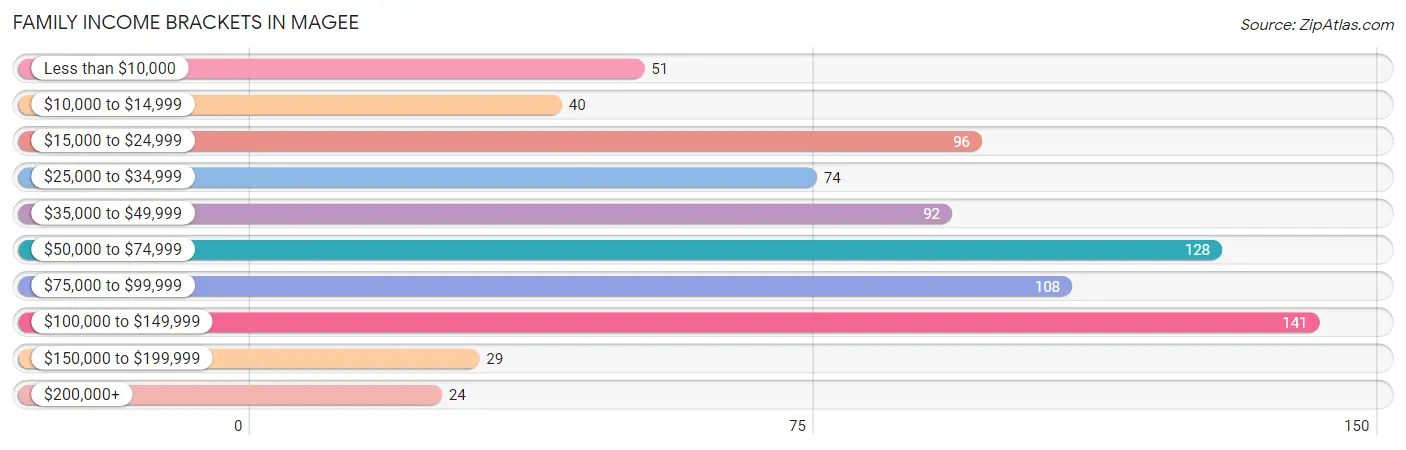
| Income Bracket | # Families | % Families |
| Less than $10,000 | 51 | 6.5% |
| $10,000 to $14,999 | 40 | 5.1% |
| $15,000 to $24,999 | 96 | 12.3% |
| $25,000 to $34,999 | 74 | 9.5% |
| $35,000 to $49,999 | 92 | 11.7% |
| $50,000 to $74,999 | 128 | 16.3% |
| $75,000 to $99,999 | 108 | 13.8% |
| $100,000 to $149,999 | 141 | 18.0% |
| $150,000 to $199,999 | 29 | 3.7% |
| $200,000+ | 24 | 3.1% |
Family Income by Famaliy Size in Magee
4-person families (160 | 20.4%) account for the highest median family income in Magee with $98,750 per family, while 4-person families (160 | 20.4%) have the highest median income of $24,688 per family member.
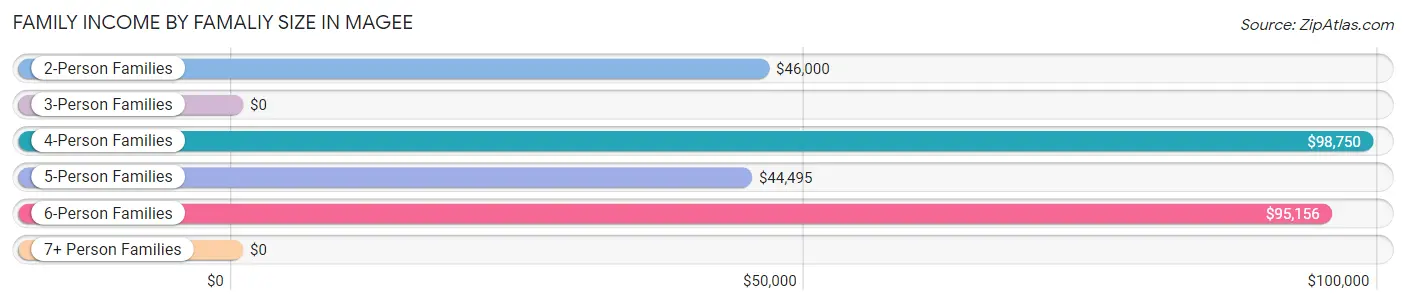
| Income Bracket | # Families | Median Income |
| 2-Person Families | 364 (46.5%) | $46,000 |
| 3-Person Families | 137 (17.5%) | $0 |
| 4-Person Families | 160 (20.4%) | $98,750 |
| 5-Person Families | 75 (9.6%) | $44,495 |
| 6-Person Families | 25 (3.2%) | $95,156 |
| 7+ Person Families | 22 (2.8%) | $0 |
| Total | 783 (100.0%) | $56,685 |
Family Income by Number of Earners in Magee
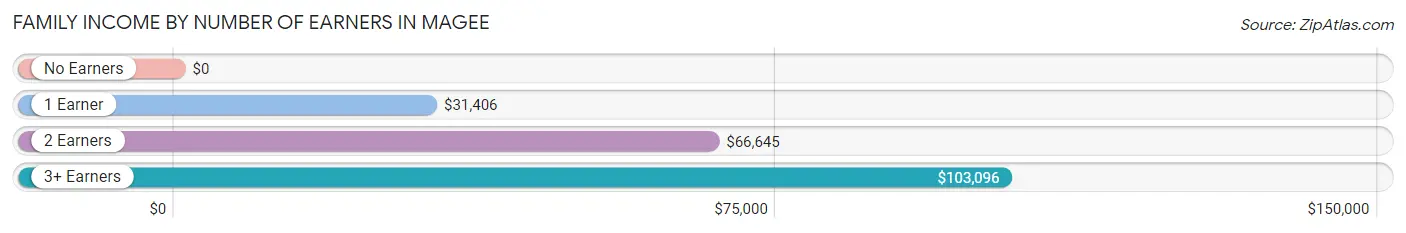
| Number of Earners | # Families | Median Income |
| No Earners | 132 (16.9%) | $0 |
| 1 Earner | 243 (31.0%) | $31,406 |
| 2 Earners | 249 (31.8%) | $66,645 |
| 3+ Earners | 159 (20.3%) | $103,096 |
| Total | 783 (100.0%) | $56,685 |
Household Income in Magee
Household Income Brackets in Magee
With 224 households falling in the category, the $15,000 to $24,999 income range is the most frequent in Magee, accounting for 16.5% of all households. In contrast, only 24 households (1.8%) fall into the $150,000 to $199,999 income bracket, making it the least populous group.
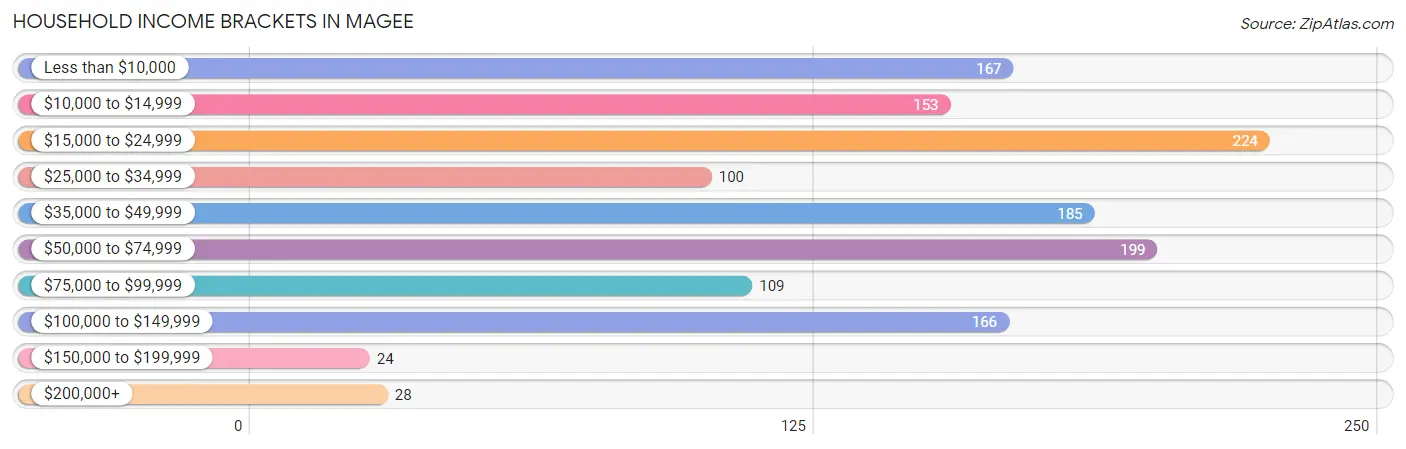
| Income Bracket | # Households | % Households |
| Less than $10,000 | 167 | 12.3% |
| $10,000 to $14,999 | 153 | 11.3% |
| $15,000 to $24,999 | 224 | 16.5% |
| $25,000 to $34,999 | 100 | 7.4% |
| $35,000 to $49,999 | 185 | 13.6% |
| $50,000 to $74,999 | 199 | 14.7% |
| $75,000 to $99,999 | 109 | 8.0% |
| $100,000 to $149,999 | 166 | 12.2% |
| $150,000 to $199,999 | 24 | 1.8% |
| $200,000+ | 28 | 2.1% |
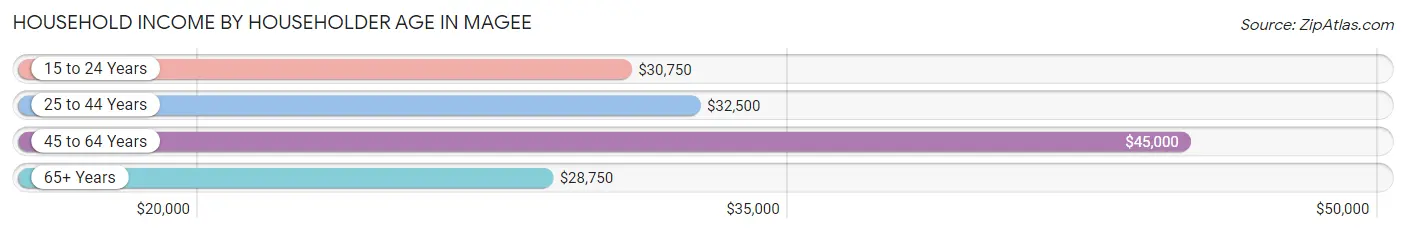
Household Income by Householder Age in Magee
The median household income in Magee is $39,485, with the highest median household income of $45,000 found in the 45 to 64 years age bracket for the primary householder. A total of 658 households (48.5%) fall into this category. Meanwhile, the 65+ years age bracket for the primary householder has the lowest median household income of $28,750, with 375 households (27.6%) in this group.
| Income Bracket | # Households | Median Income |
| 15 to 24 Years | 48 (3.5%) | $30,750 |
| 25 to 44 Years | 276 (20.3%) | $32,500 |
| 45 to 64 Years | 658 (48.5%) | $45,000 |
| 65+ Years | 375 (27.6%) | $28,750 |
| Total | 1,357 (100.0%) | $39,485 |
Poverty in Magee
Income Below Poverty by Sex and Age in Magee
With 27.8% poverty level for males and 22.2% for females among the residents of Magee, 12 to 14 year old males and 45 to 54 year old females are the most vulnerable to poverty, with 31 males (60.8%) and 89 females (39.4%) in their respective age groups living below the poverty level.
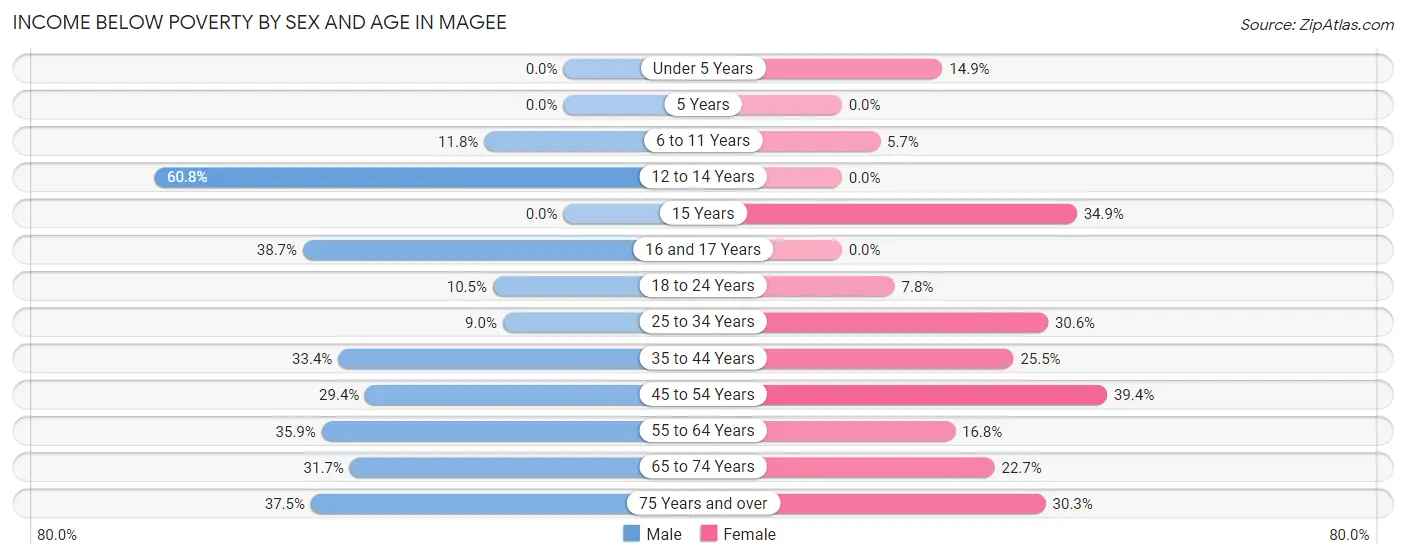
| Age Bracket | Male | Female |
| Under 5 Years | 0 (0.0%) | 13 (14.9%) |
| 5 Years | 0 (0.0%) | 0 (0.0%) |
| 6 to 11 Years | 22 (11.8%) | 5 (5.7%) |
| 12 to 14 Years | 31 (60.8%) | 0 (0.0%) |
| 15 Years | 0 (0.0%) | 30 (34.9%) |
| 16 and 17 Years | 41 (38.7%) | 0 (0.0%) |
| 18 to 24 Years | 11 (10.5%) | 4 (7.8%) |
| 25 to 34 Years | 18 (9.0%) | 60 (30.6%) |
| 35 to 44 Years | 104 (33.4%) | 52 (25.5%) |
| 45 to 54 Years | 83 (29.4%) | 89 (39.4%) |
| 55 to 64 Years | 112 (35.9%) | 74 (16.8%) |
| 65 to 74 Years | 33 (31.7%) | 44 (22.7%) |
| 75 Years and over | 51 (37.5%) | 23 (30.3%) |
| Total | 506 (27.8%) | 394 (22.2%) |
Income Above Poverty by Sex and Age in Magee
According to the poverty statistics in Magee, males aged under 5 years and females aged 5 years are the age groups that are most secure financially, with 100.0% of males and 100.0% of females in these age groups living above the poverty line.
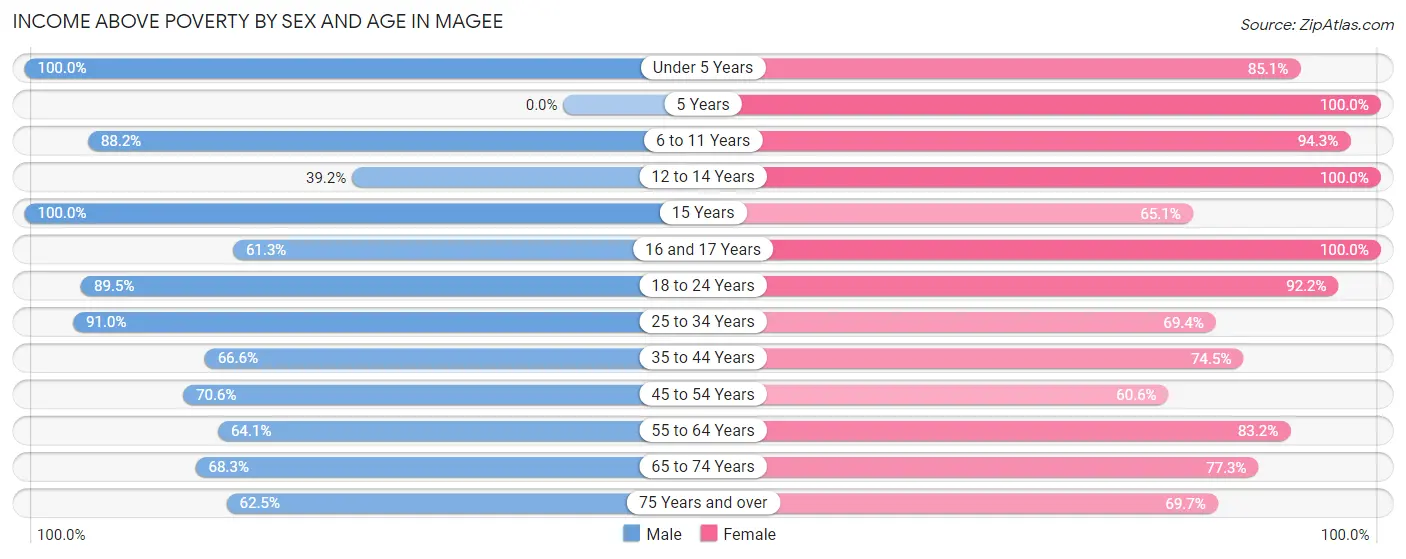
| Age Bracket | Male | Female |
| Under 5 Years | 25 (100.0%) | 74 (85.1%) |
| 5 Years | 0 (0.0%) | 19 (100.0%) |
| 6 to 11 Years | 165 (88.2%) | 83 (94.3%) |
| 12 to 14 Years | 20 (39.2%) | 58 (100.0%) |
| 15 Years | 4 (100.0%) | 56 (65.1%) |
| 16 and 17 Years | 65 (61.3%) | 49 (100.0%) |
| 18 to 24 Years | 94 (89.5%) | 47 (92.2%) |
| 25 to 34 Years | 182 (91.0%) | 136 (69.4%) |
| 35 to 44 Years | 207 (66.6%) | 152 (74.5%) |
| 45 to 54 Years | 199 (70.6%) | 137 (60.6%) |
| 55 to 64 Years | 200 (64.1%) | 366 (83.2%) |
| 65 to 74 Years | 71 (68.3%) | 150 (77.3%) |
| 75 Years and over | 85 (62.5%) | 53 (69.7%) |
| Total | 1,317 (72.2%) | 1,380 (77.8%) |
Income Below Poverty Among Married-Couple Families in Magee
The poverty statistics for married-couple families in Magee show that 7.0% or 28 of the total 397 families live below the poverty line. Families with no children have the highest poverty rate of 12.0%, comprising of 28 families. On the other hand, families with 1 or 2 children have the lowest poverty rate of 0.0%, which includes 0 families.
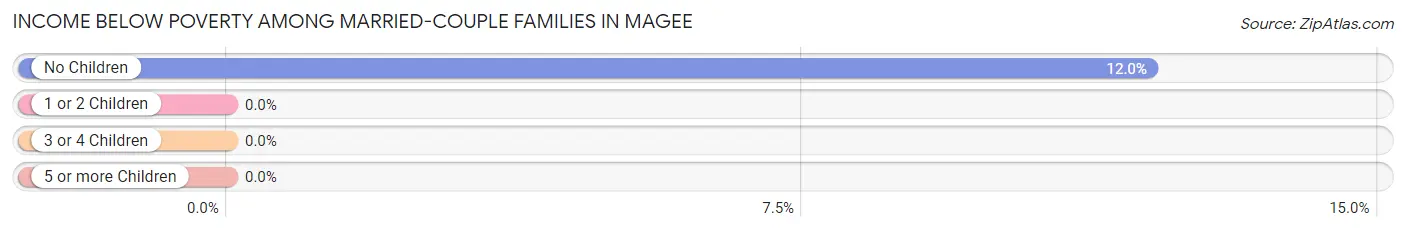
| Children | Above Poverty | Below Poverty |
| No Children | 205 (88.0%) | 28 (12.0%) |
| 1 or 2 Children | 85 (100.0%) | 0 (0.0%) |
| 3 or 4 Children | 75 (100.0%) | 0 (0.0%) |
| 5 or more Children | 4 (100.0%) | 0 (0.0%) |
| Total | 369 (92.9%) | 28 (7.0%) |
Income Below Poverty Among Single-Parent Households in Magee
According to the poverty data in Magee, 68.8% or 55 single-father households and 31.0% or 95 single-mother households are living below the poverty line. Among single-father households, those with 1 or 2 children have the highest poverty rate, with 55 households (100.0%) experiencing poverty. Likewise, among single-mother households, those with 1 or 2 children have the highest poverty rate, with 57 households (34.3%) falling below the poverty line.
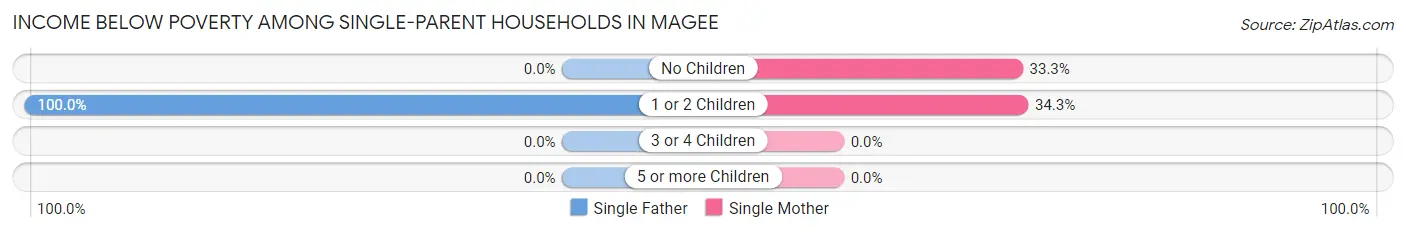
| Children | Single Father | Single Mother |
| No Children | 0 (0.0%) | 38 (33.3%) |
| 1 or 2 Children | 55 (100.0%) | 57 (34.3%) |
| 3 or 4 Children | 0 (0.0%) | 0 (0.0%) |
| 5 or more Children | 0 (0.0%) | 0 (0.0%) |
| Total | 55 (68.8%) | 95 (31.0%) |
Income Below Poverty Among Married-Couple vs Single-Parent Households in Magee
The poverty data for Magee shows that 28 of the married-couple family households (7.0%) and 150 of the single-parent households (38.9%) are living below the poverty level. Within the married-couple family households, those with no children have the highest poverty rate, with 28 households (12.0%) falling below the poverty line. Among the single-parent households, those with 1 or 2 children have the highest poverty rate, with 112 household (50.7%) living below poverty.
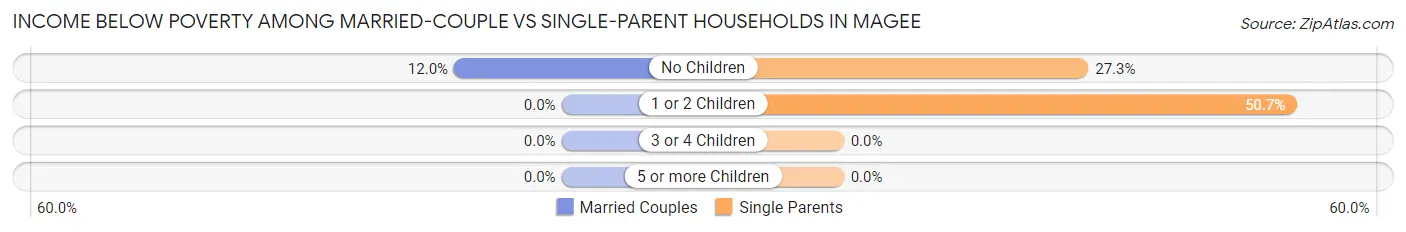
| Children | Married-Couple Families | Single-Parent Households |
| No Children | 28 (12.0%) | 38 (27.3%) |
| 1 or 2 Children | 0 (0.0%) | 112 (50.7%) |
| 3 or 4 Children | 0 (0.0%) | 0 (0.0%) |
| 5 or more Children | 0 (0.0%) | 0 (0.0%) |
| Total | 28 (7.0%) | 150 (38.9%) |
Race in Magee
The most populous races in Magee are White / Caucasian (2,148 | 54.0%), Black / African American (1,491 | 37.5%), and Hispanic or Latino (371 | 9.3%).
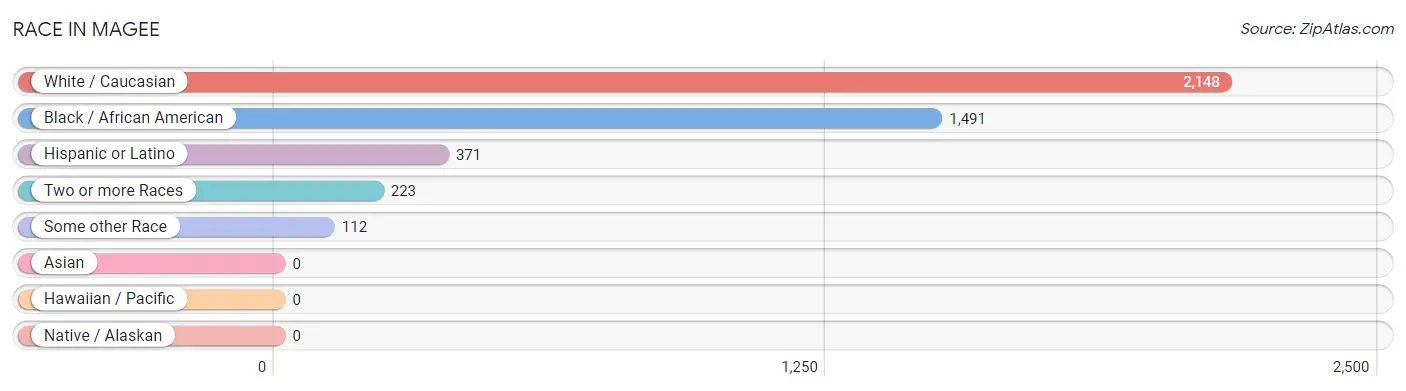
| Race | # Population | % Population |
| Asian | 0 | 0.0% |
| Black / African American | 1,491 | 37.5% |
| Hawaiian / Pacific | 0 | 0.0% |
| Hispanic or Latino | 371 | 9.3% |
| Native / Alaskan | 0 | 0.0% |
| White / Caucasian | 2,148 | 54.0% |
| Two or more Races | 223 | 5.6% |
| Some other Race | 112 | 2.8% |
| Total | 3,974 | 100.0% |
Ancestry in Magee
The most populous ancestries reported in Magee are American (611 | 15.4%), Mexican (364 | 9.2%), English (220 | 5.5%), Irish (178 | 4.5%), and German (157 | 4.0%), together accounting for 38.5% of all Magee residents.
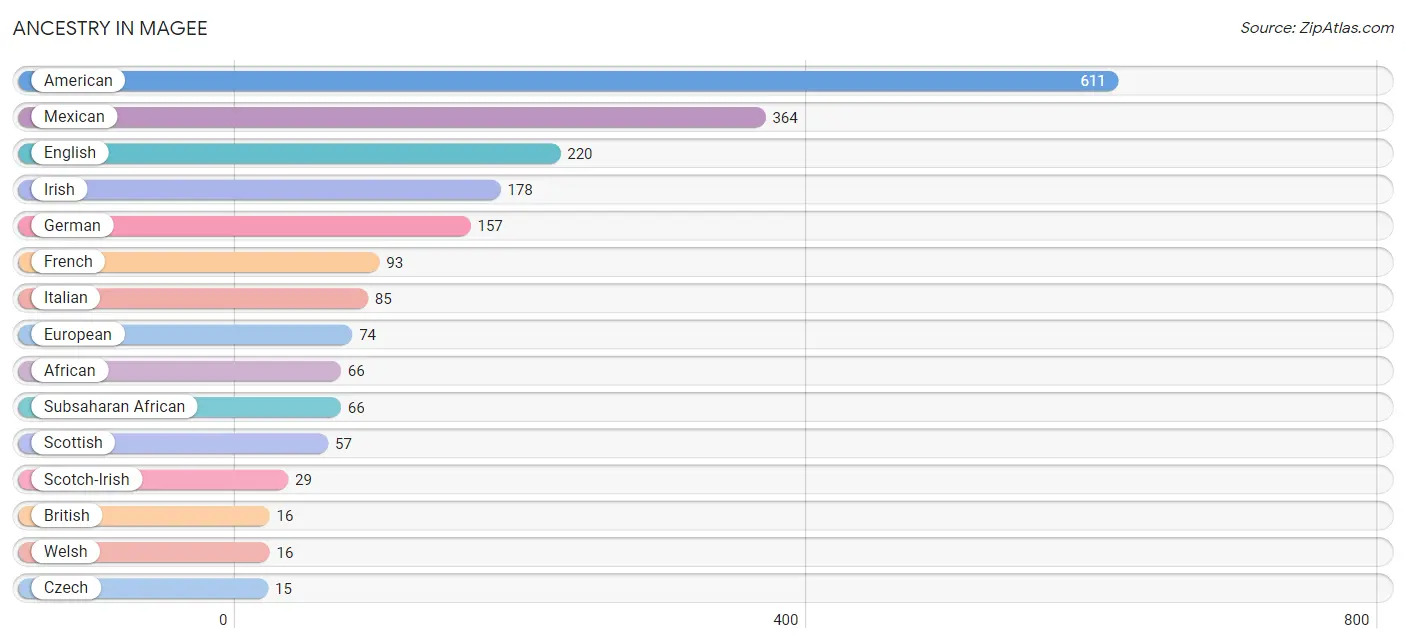
| Ancestry | # Population | % Population |
| African | 66 | 1.7% |
| American | 611 | 15.4% |
| British | 16 | 0.4% |
| Czech | 15 | 0.4% |
| English | 220 | 5.5% |
| European | 74 | 1.9% |
| French | 93 | 2.3% |
| German | 157 | 4.0% |
| Irish | 178 | 4.5% |
| Italian | 85 | 2.1% |
| Mexican | 364 | 9.2% |
| Scotch-Irish | 29 | 0.7% |
| Scottish | 57 | 1.4% |
| Subsaharan African | 66 | 1.7% |
| Welsh | 16 | 0.4% | View All 15 Rows |
Immigrants in Magee
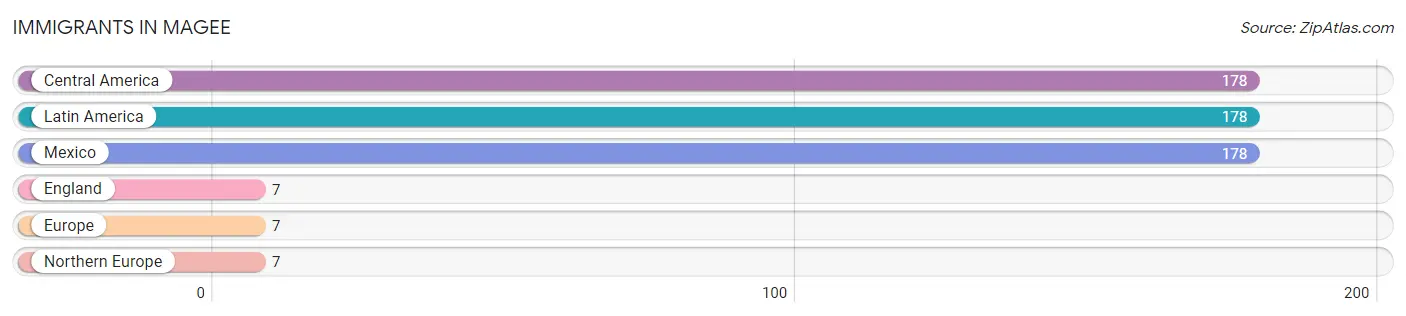
The most numerous immigrant groups reported in Magee came from Central America (178 | 4.5%), Latin America (178 | 4.5%), Mexico (178 | 4.5%), England (7 | 0.2%), and Europe (7 | 0.2%), together accounting for 13.8% of all Magee residents.
| Immigration Origin | # Population | % Population |
| Central America | 178 | 4.5% |
| England | 7 | 0.2% |
| Europe | 7 | 0.2% |
| Latin America | 178 | 4.5% |
| Mexico | 178 | 4.5% |
| Northern Europe | 7 | 0.2% | View All 6 Rows |
Sex and Age in Magee
Sex and Age in Magee
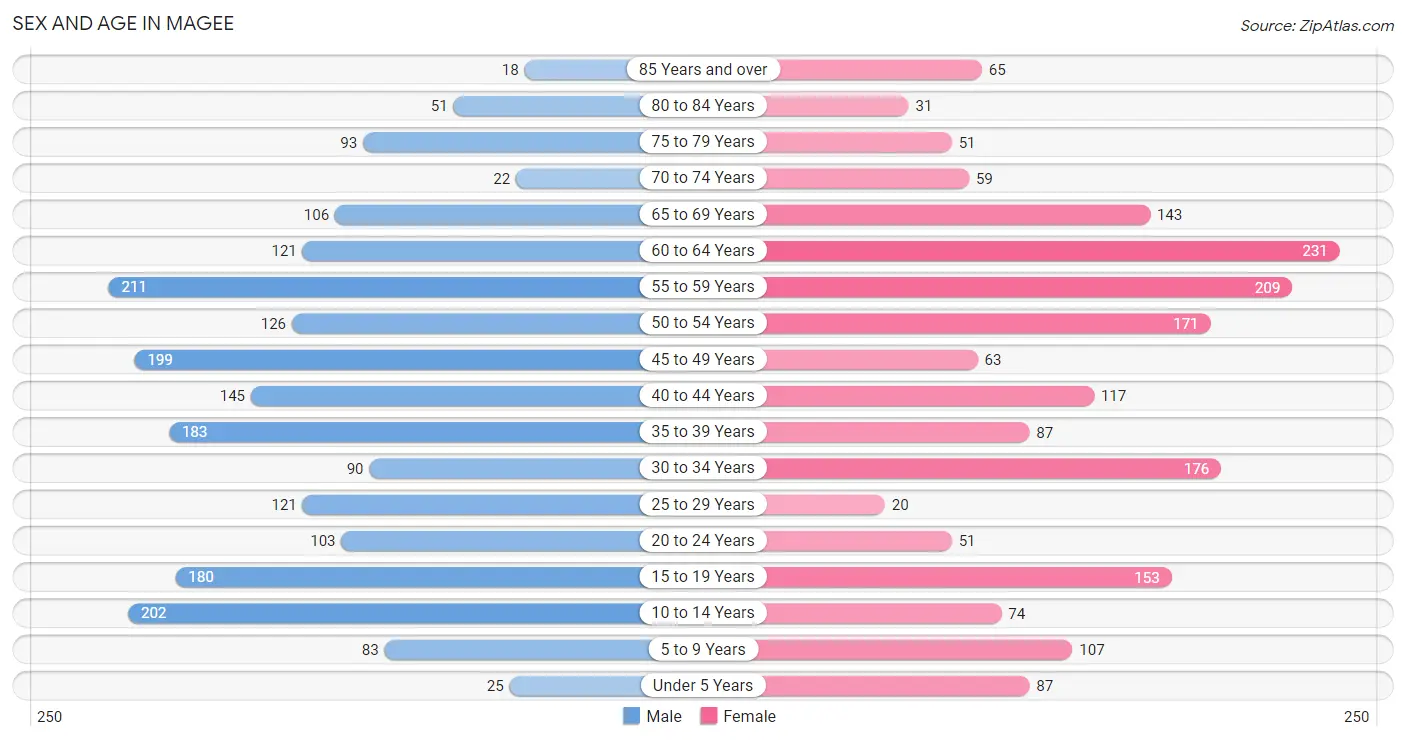
The most populous age groups in Magee are 55 to 59 Years (211 | 10.2%) for men and 60 to 64 Years (231 | 12.2%) for women.
| Age Bracket | Male | Female |
| Under 5 Years | 25 (1.2%) | 87 (4.6%) |
| 5 to 9 Years | 83 (4.0%) | 107 (5.7%) |
| 10 to 14 Years | 202 (9.7%) | 74 (3.9%) |
| 15 to 19 Years | 180 (8.7%) | 153 (8.1%) |
| 20 to 24 Years | 103 (5.0%) | 51 (2.7%) |
| 25 to 29 Years | 121 (5.8%) | 20 (1.1%) |
| 30 to 34 Years | 90 (4.3%) | 176 (9.3%) |
| 35 to 39 Years | 183 (8.8%) | 87 (4.6%) |
| 40 to 44 Years | 145 (7.0%) | 117 (6.2%) |
| 45 to 49 Years | 199 (9.6%) | 63 (3.3%) |
| 50 to 54 Years | 126 (6.1%) | 171 (9.0%) |
| 55 to 59 Years | 211 (10.2%) | 209 (11.0%) |
| 60 to 64 Years | 121 (5.8%) | 231 (12.2%) |
| 65 to 69 Years | 106 (5.1%) | 143 (7.5%) |
| 70 to 74 Years | 22 (1.1%) | 59 (3.1%) |
| 75 to 79 Years | 93 (4.5%) | 51 (2.7%) |
| 80 to 84 Years | 51 (2.5%) | 31 (1.6%) |
| 85 Years and over | 18 (0.9%) | 65 (3.4%) |
| Total | 2,079 (100.0%) | 1,895 (100.0%) |
Families and Households in Magee
Median Family Size in Magee
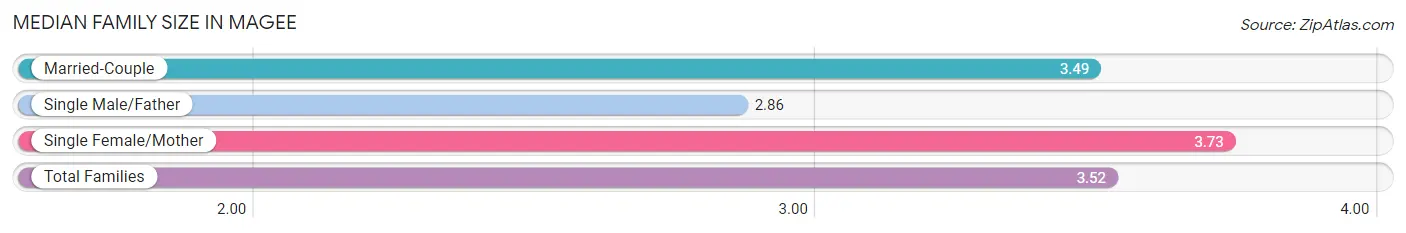
The median family size in Magee is 3.52 persons per family, with single female/mother families (306 | 39.1%) accounting for the largest median family size of 3.73 persons per family. On the other hand, single male/father families (80 | 10.2%) represent the smallest median family size with 2.86 persons per family.
| Family Type | # Families | Family Size |
| Married-Couple | 397 (50.7%) | 3.49 |
| Single Male/Father | 80 (10.2%) | 2.86 |
| Single Female/Mother | 306 (39.1%) | 3.73 |
| Total Families | 783 (100.0%) | 3.52 |
Median Household Size in Magee
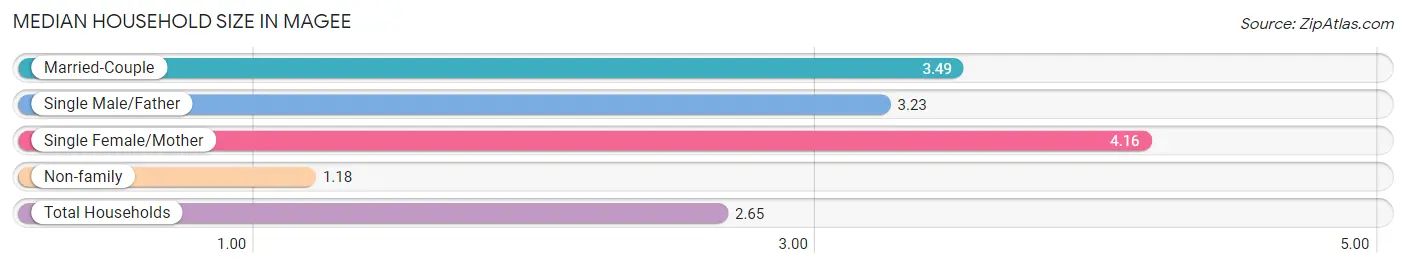
The median household size in Magee is 2.65 persons per household, with single female/mother households (306 | 22.6%) accounting for the largest median household size of 4.16 persons per household. non-family households (574 | 42.3%) represent the smallest median household size with 1.18 persons per household.
| Household Type | # Households | Household Size |
| Married-Couple | 397 (29.3%) | 3.49 |
| Single Male/Father | 80 (5.9%) | 3.23 |
| Single Female/Mother | 306 (22.6%) | 4.16 |
| Non-family | 574 (42.3%) | 1.18 |
| Total Households | 1,357 (100.0%) | 2.65 |
Household Size by Marriage Status in Magee
Out of a total of 1,357 households in Magee, 783 (57.7%) are family households, while 574 (42.3%) are nonfamily households. The most numerous type of family households are 2-person households, comprising 337, and the most common type of nonfamily households are 1-person households, comprising 544.
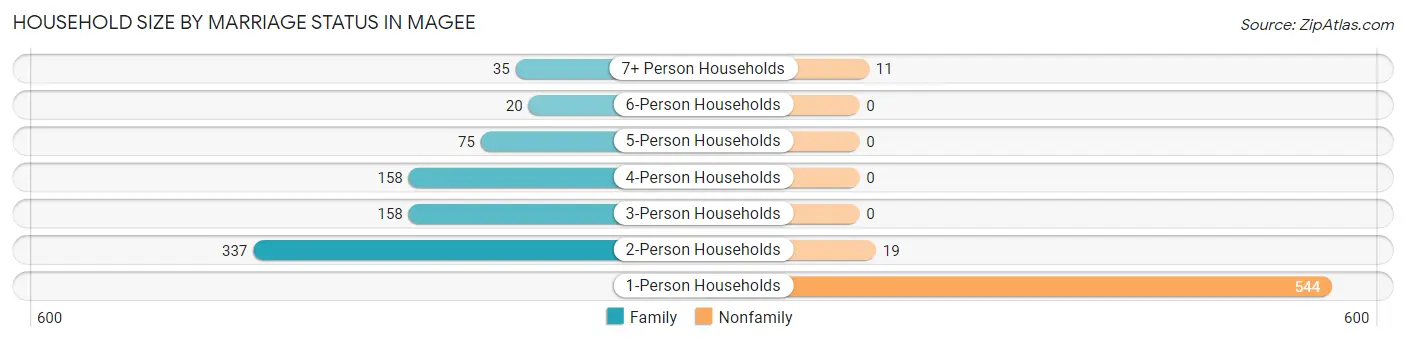
| Household Size | Family Households | Nonfamily Households |
| 1-Person Households | - | 544 (40.1%) |
| 2-Person Households | 337 (24.8%) | 19 (1.4%) |
| 3-Person Households | 158 (11.6%) | 0 (0.0%) |
| 4-Person Households | 158 (11.6%) | 0 (0.0%) |
| 5-Person Households | 75 (5.5%) | 0 (0.0%) |
| 6-Person Households | 20 (1.5%) | 0 (0.0%) |
| 7+ Person Households | 35 (2.6%) | 11 (0.8%) |
| Total | 783 (57.7%) | 574 (42.3%) |
Female Fertility in Magee
Fertility by Age in Magee
Average fertility rate in Magee is 24.0 births per 1,000 women. Women in the age bracket of 20 to 34 years have the highest fertility rate with 69.0 births per 1,000 women. Women in the age bracket of 20 to 34 years acount for 100.0% of all women with births.
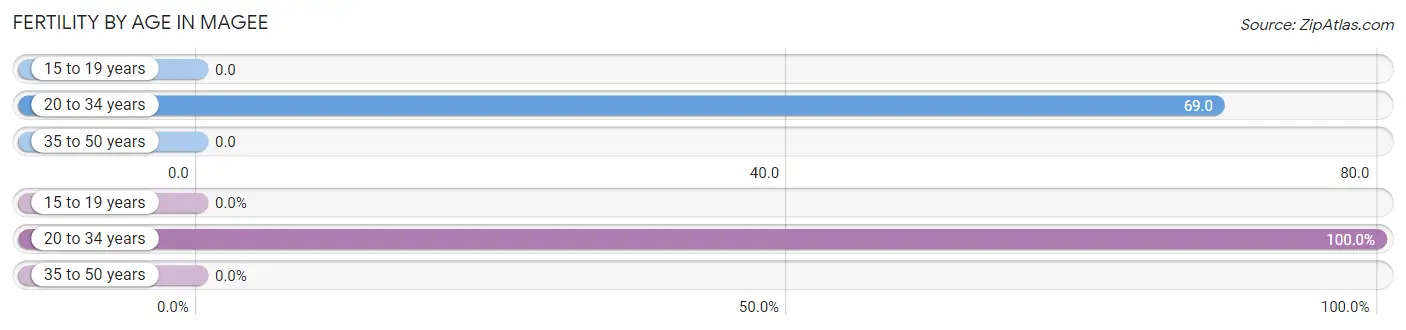
| Age Bracket | Women with Births | Births / 1,000 Women |
| 15 to 19 years | 0 (0.0%) | 0.0 |
| 20 to 34 years | 17 (100.0%) | 69.0 |
| 35 to 50 years | 0 (0.0%) | 0.0 |
| Total | 17 (100.0%) | 24.0 |
Fertility by Age by Marriage Status in Magee
17.6% of women with births (17) in Magee are married. The highest percentage of unmarried women with births falls into 20 to 34 years age bracket with 82.4% of them unmarried at the time of birth, while the lowest percentage of unmarried women with births belong to 20 to 34 years age bracket with 82.4% of them unmarried.
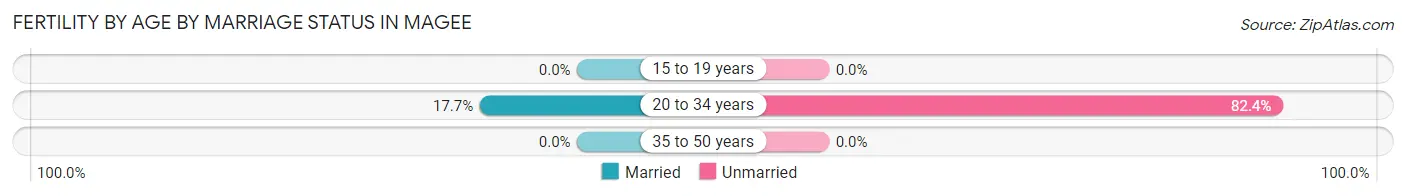
| Age Bracket | Married | Unmarried |
| 15 to 19 years | 0 (0.0%) | 0 (0.0%) |
| 20 to 34 years | 3 (17.6%) | 14 (82.4%) |
| 35 to 50 years | 0 (0.0%) | 0 (0.0%) |
| Total | 3 (17.6%) | 14 (82.4%) |
Fertility by Education in Magee
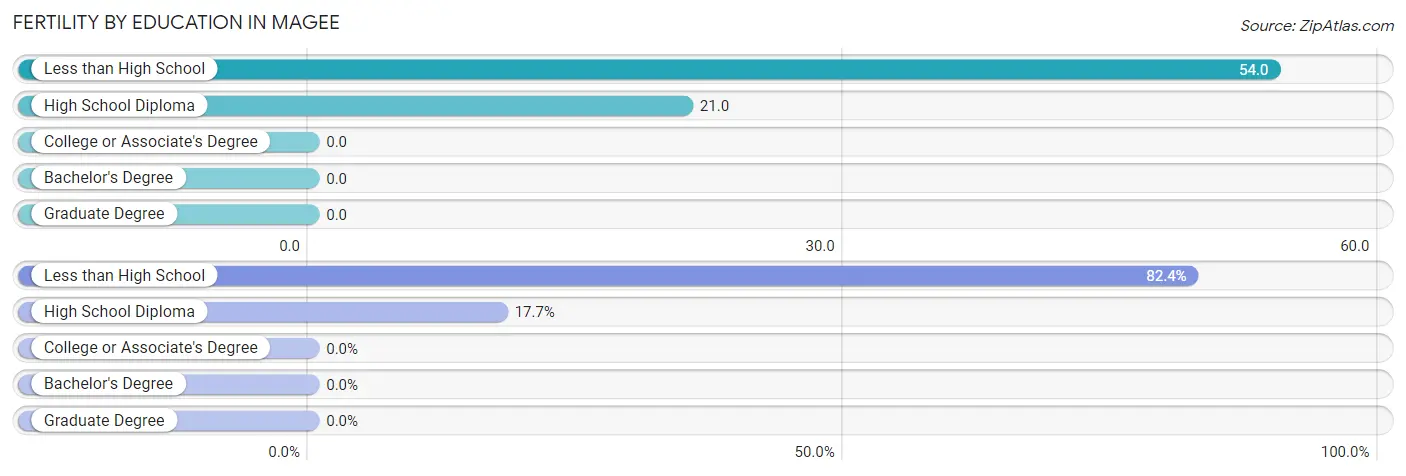
| Educational Attainment | Women with Births | Births / 1,000 Women |
| Less than High School | 14 (82.4%) | 54.0 |
| High School Diploma | 3 (17.6%) | 21.0 |
| College or Associate's Degree | 0 (0.0%) | 0.0 |
| Bachelor's Degree | 0 (0.0%) | 0.0 |
| Graduate Degree | 0 (0.0%) | 0.0 |
| Total | 17 (100.0%) | 24.0 |
Fertility by Education by Marriage Status in Magee
82.4% of women with births in Magee are unmarried. Women with the educational attainment of high school diploma are most likely to be married with 100.0% of them married at childbirth, while women with the educational attainment of less than high school are least likely to be married with 100.0% of them unmarried at childbirth.
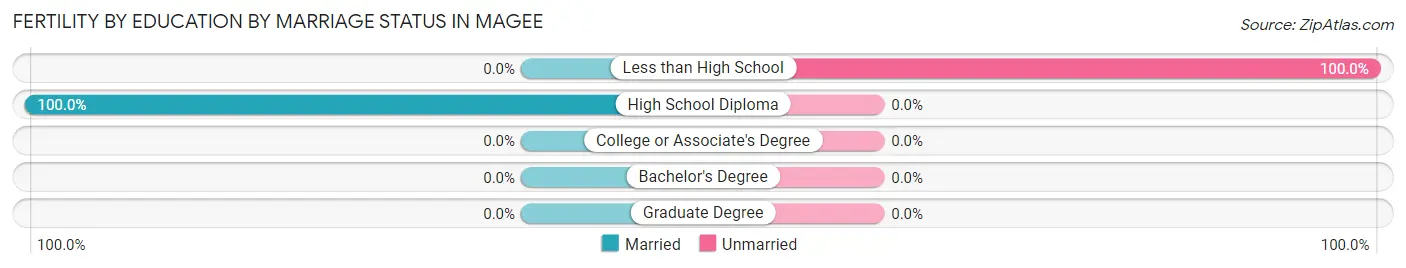
| Educational Attainment | Married | Unmarried |
| Less than High School | 0 (0.0%) | 14 (100.0%) |
| High School Diploma | 3 (100.0%) | 0 (0.0%) |
| College or Associate's Degree | 0 (0.0%) | 0 (0.0%) |
| Bachelor's Degree | 0 (0.0%) | 0 (0.0%) |
| Graduate Degree | 0 (0.0%) | 0 (0.0%) |
| Total | 3 (17.6%) | 14 (82.4%) |
Employment Characteristics in Magee
Employment by Class of Employer in Magee
Among the 1,765 employed individuals in Magee, private company employees (1,155 | 65.4%), state government employees (164 | 9.3%), and self-employed (not incorporated) (149 | 8.4%) make up the most common classes of employment.
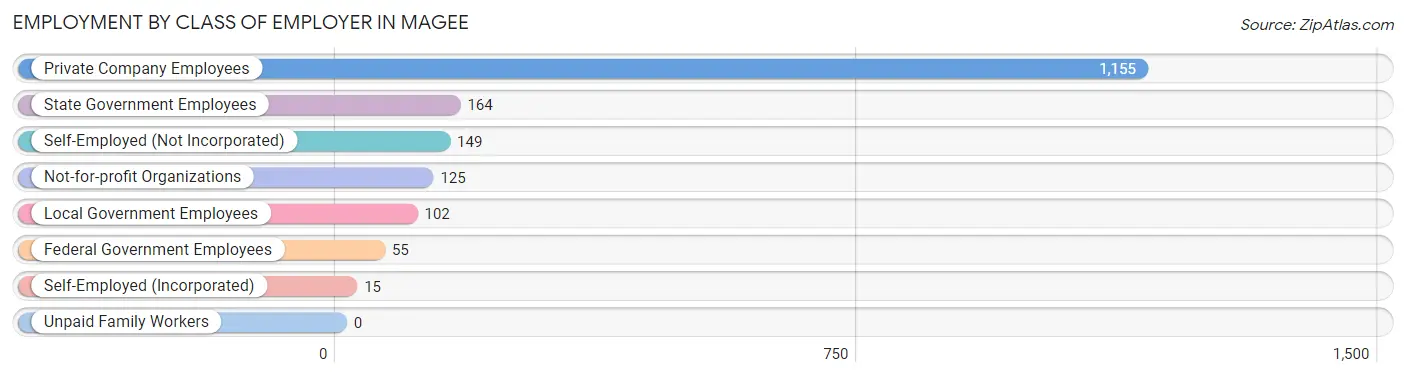
| Employer Class | # Employees | % Employees |
| Private Company Employees | 1,155 | 65.4% |
| Self-Employed (Incorporated) | 15 | 0.9% |
| Self-Employed (Not Incorporated) | 149 | 8.4% |
| Not-for-profit Organizations | 125 | 7.1% |
| Local Government Employees | 102 | 5.8% |
| State Government Employees | 164 | 9.3% |
| Federal Government Employees | 55 | 3.1% |
| Unpaid Family Workers | 0 | 0.0% |
| Total | 1,765 | 100.0% |
Employment Status by Age in Magee
According to the labor force statistics for Magee, out of the total population over 16 years of age (3,288), 56.7% or 1,864 individuals are in the labor force, with 4.9% or 91 of them unemployed. The age group with the highest labor force participation rate is 20 to 24 years, with 77.9% or 120 individuals in the labor force. Within the labor force, the 75 years and over age range has the highest percentage of unemployed individuals, with 53.1% or 26 of them being unemployed.
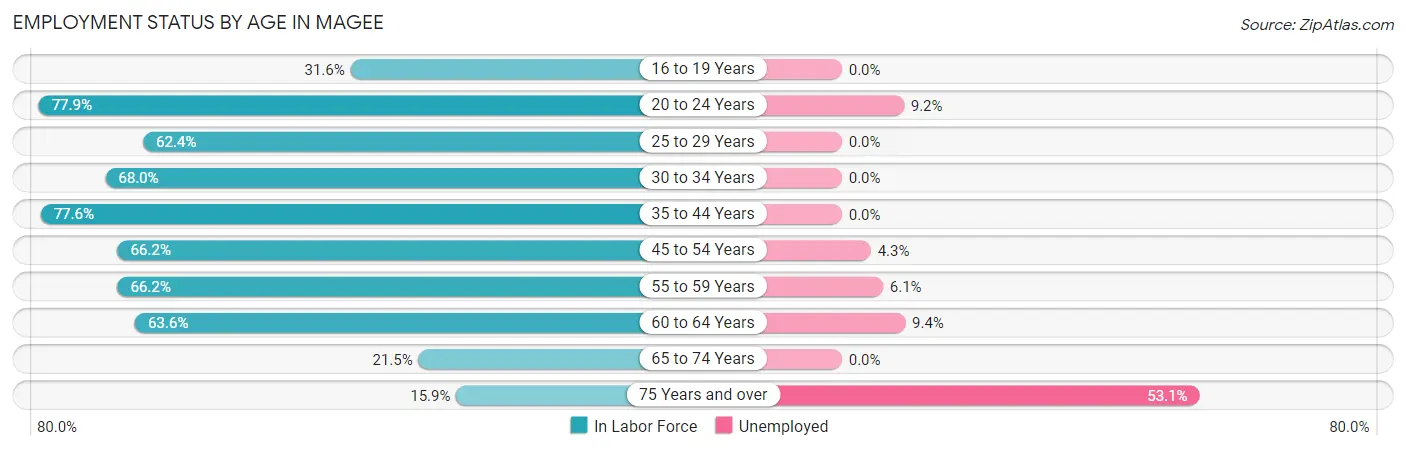
| Age Bracket | In Labor Force | Unemployed |
| 16 to 19 Years | 71 (31.6%) | 0 (0.0%) |
| 20 to 24 Years | 120 (77.9%) | 11 (9.2%) |
| 25 to 29 Years | 88 (62.4%) | 0 (0.0%) |
| 30 to 34 Years | 181 (68.0%) | 0 (0.0%) |
| 35 to 44 Years | 413 (77.6%) | 0 (0.0%) |
| 45 to 54 Years | 370 (66.2%) | 16 (4.3%) |
| 55 to 59 Years | 278 (66.2%) | 17 (6.1%) |
| 60 to 64 Years | 224 (63.6%) | 21 (9.4%) |
| 65 to 74 Years | 71 (21.5%) | 0 (0.0%) |
| 75 Years and over | 49 (15.9%) | 26 (53.1%) |
| Total | 1,864 (56.7%) | 91 (4.9%) |
Employment Status by Educational Attainment in Magee
According to labor force statistics for Magee, 68.5% of individuals (1,555) out of the total population between 25 and 64 years of age (2,270) are in the labor force, with 3.5% or 54 of them being unemployed. The group with the highest labor force participation rate are those with the educational attainment of bachelor's degree or higher, with 100.0% or 292 individuals in the labor force. Within the labor force, individuals with less than high school education have the highest percentage of unemployment, with 9.6% or 37 of them being unemployed.
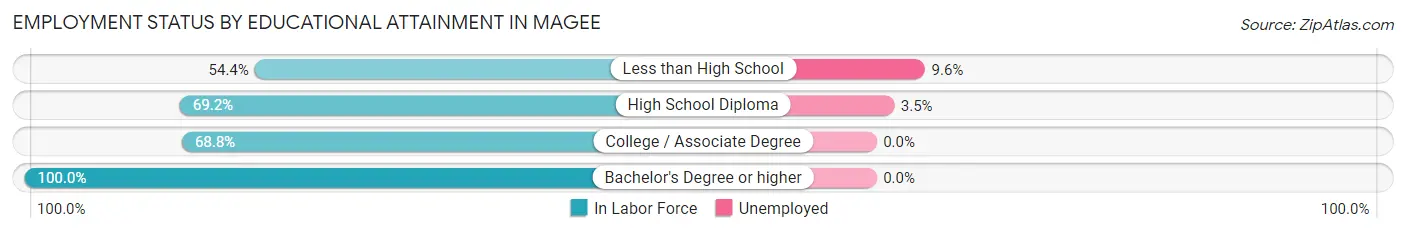
| Educational Attainment | In Labor Force | Unemployed |
| Less than High School | 384 (54.4%) | 68 (9.6%) |
| High School Diploma | 487 (69.2%) | 25 (3.5%) |
| College / Associate Degree | 391 (68.8%) | 0 (0.0%) |
| Bachelor's Degree or higher | 292 (100.0%) | 0 (0.0%) |
| Total | 1,555 (68.5%) | 79 (3.5%) |
Employment Occupations by Sex in Magee
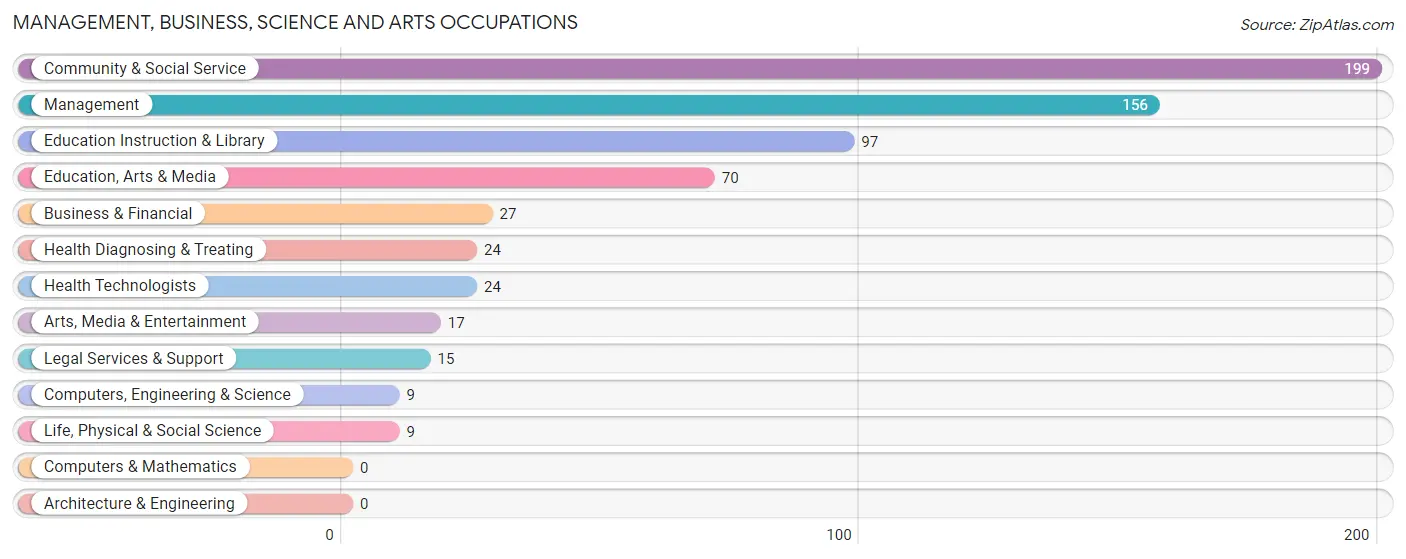
Management, Business, Science and Arts Occupations
The most common Management, Business, Science and Arts occupations in Magee are Community & Social Service (199 | 11.2%), Management (156 | 8.8%), Education Instruction & Library (97 | 5.5%), Education, Arts & Media (70 | 4.0%), and Business & Financial (27 | 1.5%).
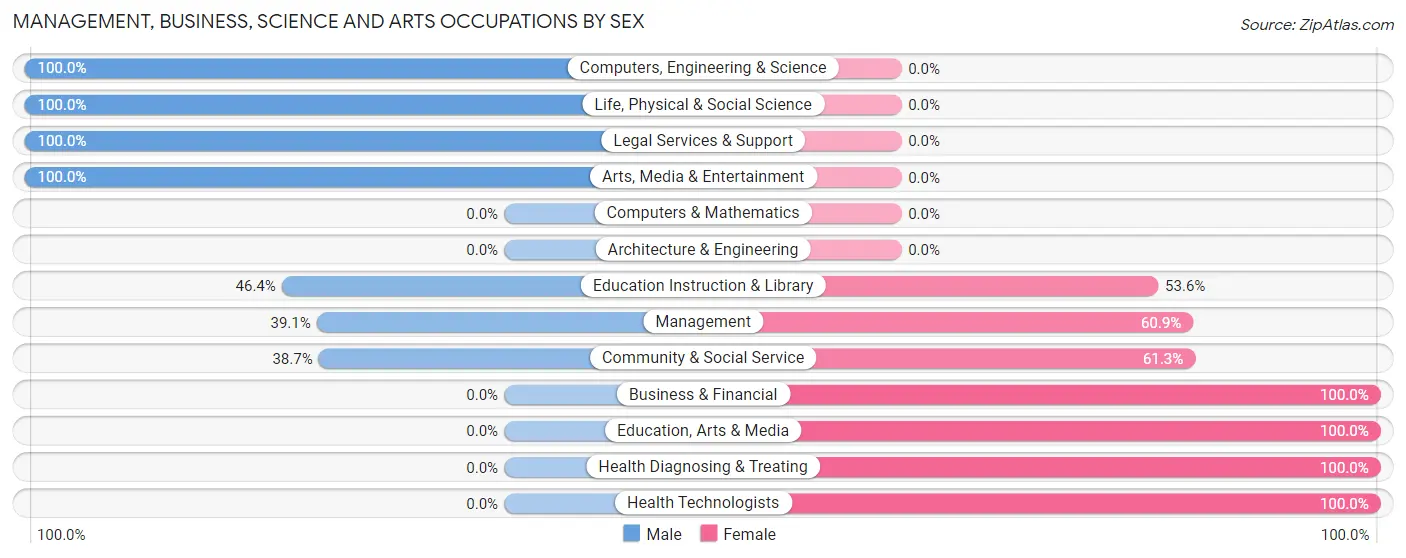
Management, Business, Science and Arts Occupations by Sex
Within the Management, Business, Science and Arts occupations in Magee, the most male-oriented occupations are Computers, Engineering & Science (100.0%), Life, Physical & Social Science (100.0%), and Legal Services & Support (100.0%), while the most female-oriented occupations are Business & Financial (100.0%), Education, Arts & Media (100.0%), and Health Diagnosing & Treating (100.0%).
| Occupation | Male | Female |
| Management | 61 (39.1%) | 95 (60.9%) |
| Business & Financial | 0 (0.0%) | 27 (100.0%) |
| Computers, Engineering & Science | 9 (100.0%) | 0 (0.0%) |
| Computers & Mathematics | 0 (0.0%) | 0 (0.0%) |
| Architecture & Engineering | 0 (0.0%) | 0 (0.0%) |
| Life, Physical & Social Science | 9 (100.0%) | 0 (0.0%) |
| Community & Social Service | 77 (38.7%) | 122 (61.3%) |
| Education, Arts & Media | 0 (0.0%) | 70 (100.0%) |
| Legal Services & Support | 15 (100.0%) | 0 (0.0%) |
| Education Instruction & Library | 45 (46.4%) | 52 (53.6%) |
| Arts, Media & Entertainment | 17 (100.0%) | 0 (0.0%) |
| Health Diagnosing & Treating | 0 (0.0%) | 24 (100.0%) |
| Health Technologists | 0 (0.0%) | 24 (100.0%) |
| Total (Category) | 147 (35.4%) | 268 (64.6%) |
| Total (Overall) | 898 (50.6%) | 876 (49.4%) |
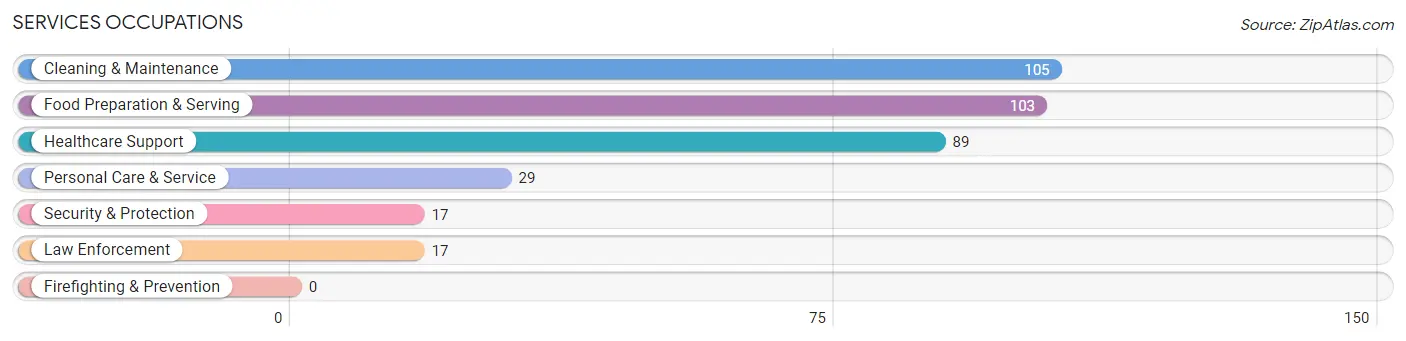
Services Occupations
The most common Services occupations in Magee are Cleaning & Maintenance (105 | 5.9%), Food Preparation & Serving (103 | 5.8%), Healthcare Support (89 | 5.0%), Personal Care & Service (29 | 1.6%), and Security & Protection (17 | 1.0%).
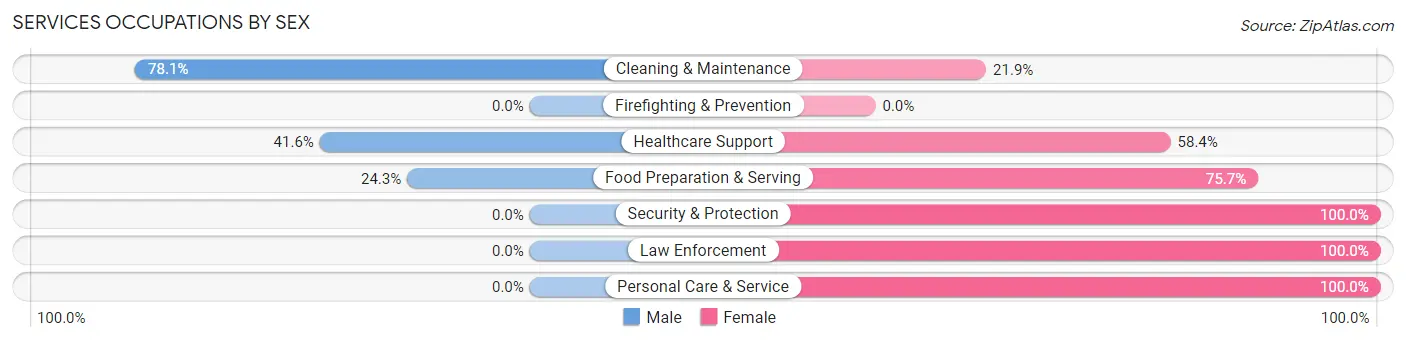
Services Occupations by Sex
Within the Services occupations in Magee, the most male-oriented occupations are Cleaning & Maintenance (78.1%), Healthcare Support (41.6%), and Food Preparation & Serving (24.3%), while the most female-oriented occupations are Security & Protection (100.0%), Law Enforcement (100.0%), and Personal Care & Service (100.0%).
| Occupation | Male | Female |
| Healthcare Support | 37 (41.6%) | 52 (58.4%) |
| Security & Protection | 0 (0.0%) | 17 (100.0%) |
| Firefighting & Prevention | 0 (0.0%) | 0 (0.0%) |
| Law Enforcement | 0 (0.0%) | 17 (100.0%) |
| Food Preparation & Serving | 25 (24.3%) | 78 (75.7%) |
| Cleaning & Maintenance | 82 (78.1%) | 23 (21.9%) |
| Personal Care & Service | 0 (0.0%) | 29 (100.0%) |
| Total (Category) | 144 (42.0%) | 199 (58.0%) |
| Total (Overall) | 898 (50.6%) | 876 (49.4%) |
Sales and Office Occupations
The most common Sales and Office occupations in Magee are Sales & Related (364 | 20.5%), and Office & Administration (88 | 5.0%).
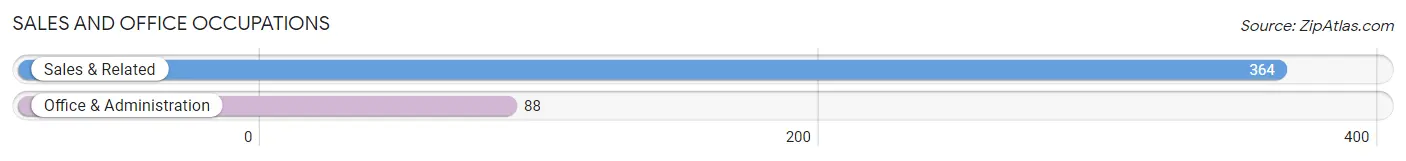
Sales and Office Occupations by Sex

| Occupation | Male | Female |
| Sales & Related | 144 (39.6%) | 220 (60.4%) |
| Office & Administration | 0 (0.0%) | 88 (100.0%) |
| Total (Category) | 144 (31.9%) | 308 (68.1%) |
| Total (Overall) | 898 (50.6%) | 876 (49.4%) |
Natural Resources, Construction and Maintenance Occupations
The most common Natural Resources, Construction and Maintenance occupations in Magee are Construction & Extraction (237 | 13.4%), Installation, Maintenance & Repair (64 | 3.6%), and Farming, Fishing & Forestry (24 | 1.3%).
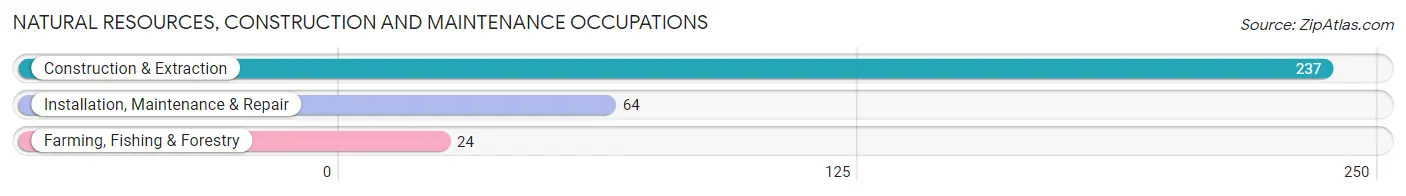
Natural Resources, Construction and Maintenance Occupations by Sex
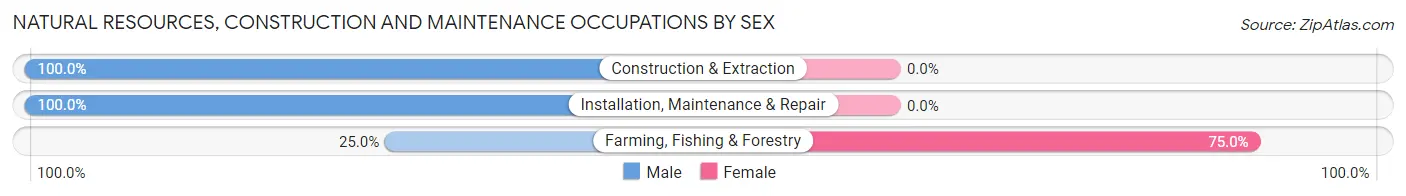
| Occupation | Male | Female |
| Farming, Fishing & Forestry | 6 (25.0%) | 18 (75.0%) |
| Construction & Extraction | 237 (100.0%) | 0 (0.0%) |
| Installation, Maintenance & Repair | 64 (100.0%) | 0 (0.0%) |
| Total (Category) | 307 (94.5%) | 18 (5.5%) |
| Total (Overall) | 898 (50.6%) | 876 (49.4%) |
Production, Transportation and Moving Occupations
The most common Production, Transportation and Moving occupations in Magee are Production (96 | 5.4%), Transportation (78 | 4.4%), and Material Moving (65 | 3.7%).
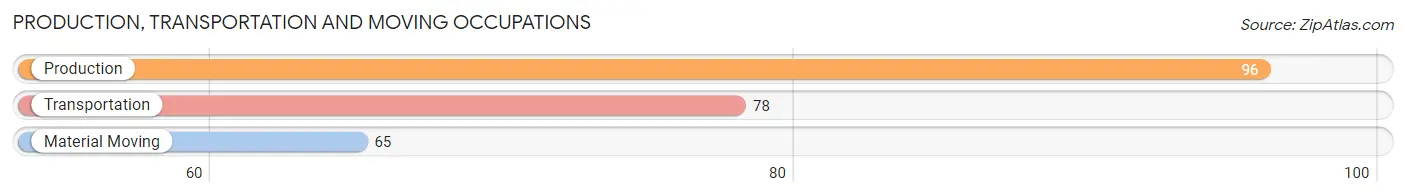
Production, Transportation and Moving Occupations by Sex
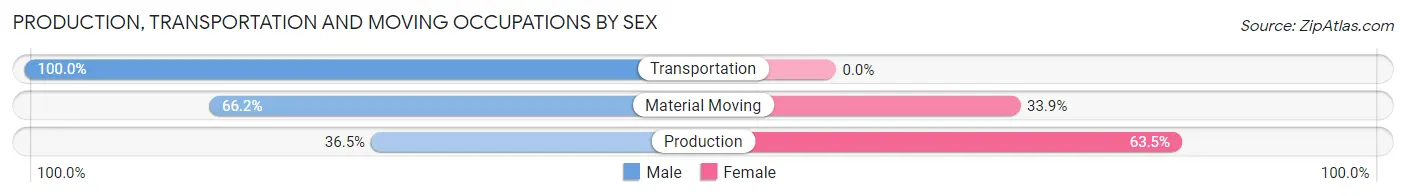
| Occupation | Male | Female |
| Production | 35 (36.5%) | 61 (63.5%) |
| Transportation | 78 (100.0%) | 0 (0.0%) |
| Material Moving | 43 (66.1%) | 22 (33.9%) |
| Total (Category) | 156 (65.3%) | 83 (34.7%) |
| Total (Overall) | 898 (50.6%) | 876 (49.4%) |
Employment Industries by Sex in Magee
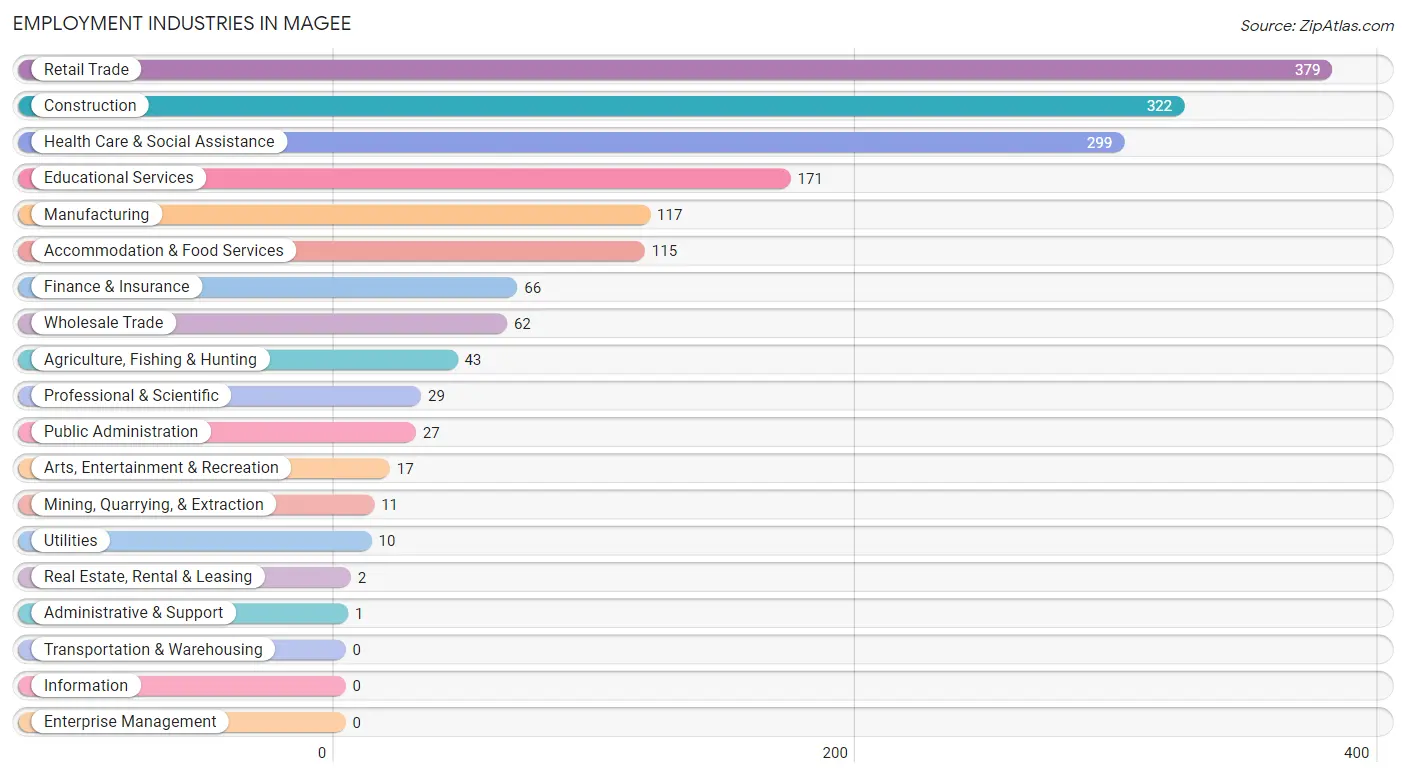
Employment Industries in Magee
The major employment industries in Magee include Retail Trade (379 | 21.4%), Construction (322 | 18.1%), Health Care & Social Assistance (299 | 16.9%), Educational Services (171 | 9.6%), and Manufacturing (117 | 6.6%).
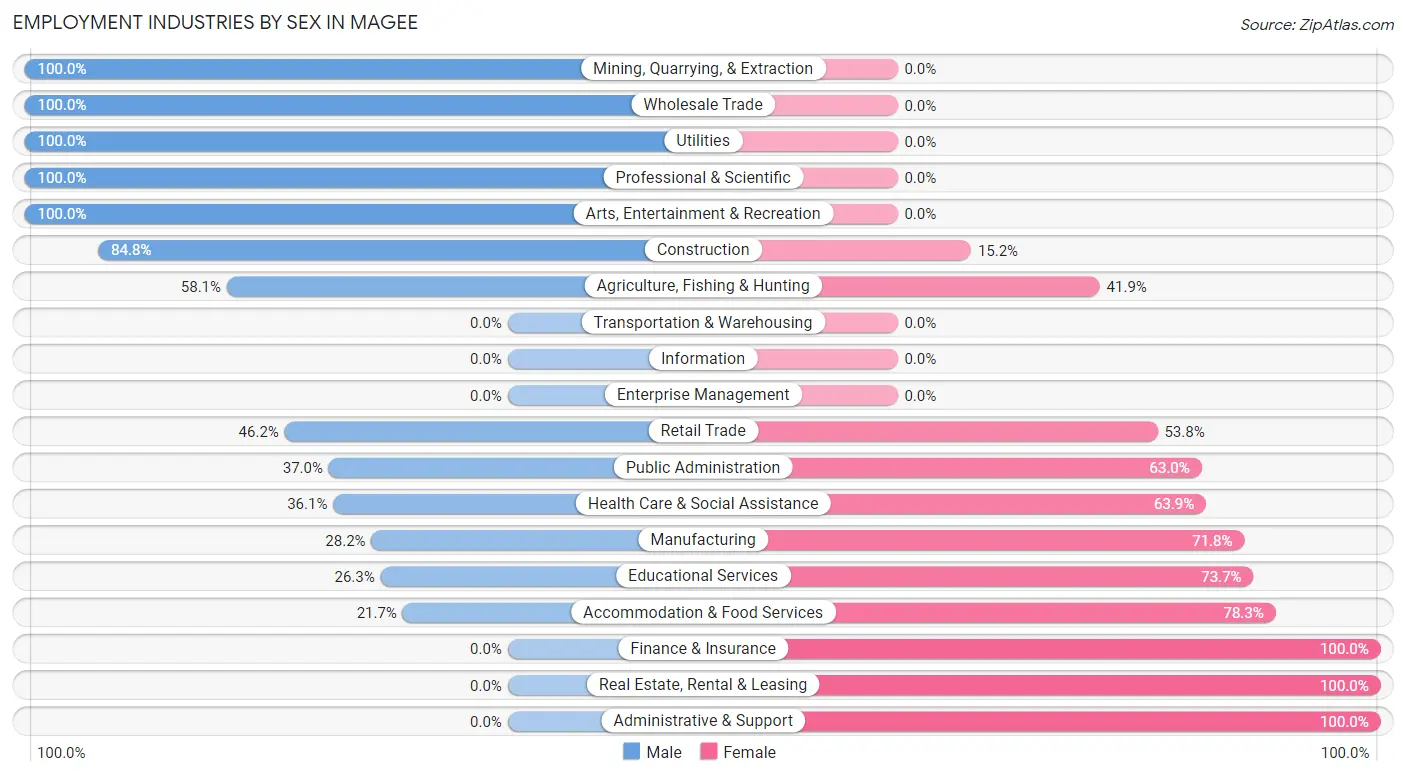
Employment Industries by Sex in Magee
The Magee industries that see more men than women are Mining, Quarrying, & Extraction (100.0%), Wholesale Trade (100.0%), and Utilities (100.0%), whereas the industries that tend to have a higher number of women are Finance & Insurance (100.0%), Real Estate, Rental & Leasing (100.0%), and Administrative & Support (100.0%).
| Industry | Male | Female |
| Agriculture, Fishing & Hunting | 25 (58.1%) | 18 (41.9%) |
| Mining, Quarrying, & Extraction | 11 (100.0%) | 0 (0.0%) |
| Construction | 273 (84.8%) | 49 (15.2%) |
| Manufacturing | 33 (28.2%) | 84 (71.8%) |
| Wholesale Trade | 62 (100.0%) | 0 (0.0%) |
| Retail Trade | 175 (46.2%) | 204 (53.8%) |
| Transportation & Warehousing | 0 (0.0%) | 0 (0.0%) |
| Utilities | 10 (100.0%) | 0 (0.0%) |
| Information | 0 (0.0%) | 0 (0.0%) |
| Finance & Insurance | 0 (0.0%) | 66 (100.0%) |
| Real Estate, Rental & Leasing | 0 (0.0%) | 2 (100.0%) |
| Professional & Scientific | 29 (100.0%) | 0 (0.0%) |
| Enterprise Management | 0 (0.0%) | 0 (0.0%) |
| Administrative & Support | 0 (0.0%) | 1 (100.0%) |
| Educational Services | 45 (26.3%) | 126 (73.7%) |
| Health Care & Social Assistance | 108 (36.1%) | 191 (63.9%) |
| Arts, Entertainment & Recreation | 17 (100.0%) | 0 (0.0%) |
| Accommodation & Food Services | 25 (21.7%) | 90 (78.3%) |
| Public Administration | 10 (37.0%) | 17 (63.0%) |
| Total | 898 (50.6%) | 876 (49.4%) |
Education in Magee
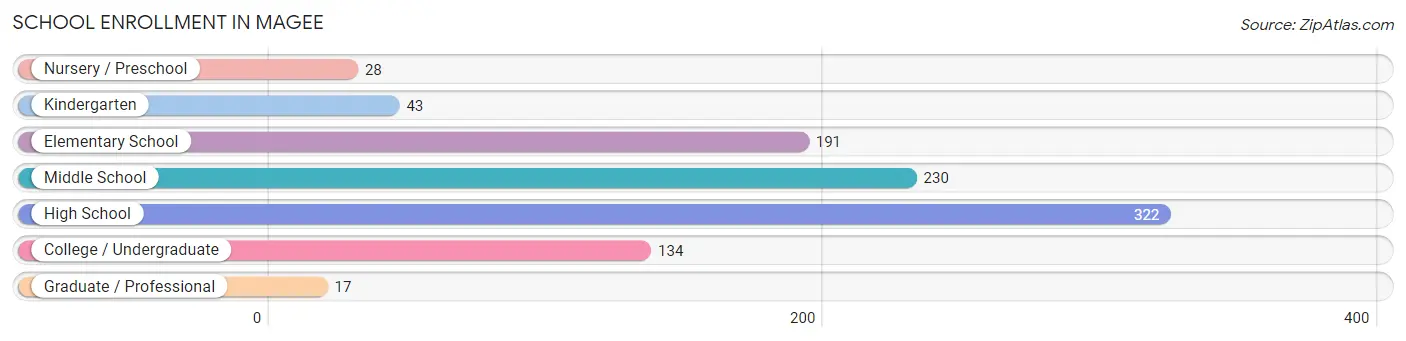
School Enrollment in Magee
The most common levels of schooling among the 965 students in Magee are high school (322 | 33.4%), middle school (230 | 23.8%), and elementary school (191 | 19.8%).
| School Level | # Students | % Students |
| Nursery / Preschool | 28 | 2.9% |
| Kindergarten | 43 | 4.5% |
| Elementary School | 191 | 19.8% |
| Middle School | 230 | 23.8% |
| High School | 322 | 33.4% |
| College / Undergraduate | 134 | 13.9% |
| Graduate / Professional | 17 | 1.8% |
| Total | 965 | 100.0% |
School Enrollment by Age by Funding Source in Magee
Out of a total of 965 students who are enrolled in schools in Magee, 196 (20.3%) attend a private institution, while the remaining 769 (79.7%) are enrolled in public schools. The age group of 18 to 19 year olds has the highest likelihood of being enrolled in private schools, with 17 (34.7% in the age bracket) enrolled. Conversely, the age group of 3 to 4 year olds has the lowest likelihood of being enrolled in a private school, with 57 (100.0% in the age bracket) attending a public institution.
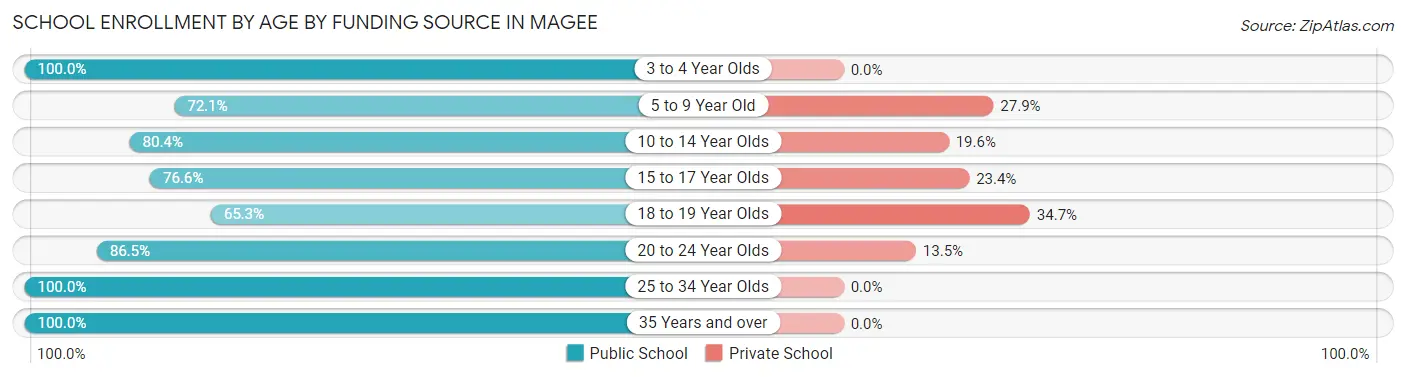
| Age Bracket | Public School | Private School |
| 3 to 4 Year Olds | 57 (100.0%) | 0 (0.0%) |
| 5 to 9 Year Old | 137 (72.1%) | 53 (27.9%) |
| 10 to 14 Year Olds | 222 (80.4%) | 54 (19.6%) |
| 15 to 17 Year Olds | 213 (76.6%) | 65 (23.4%) |
| 18 to 19 Year Olds | 32 (65.3%) | 17 (34.7%) |
| 20 to 24 Year Olds | 45 (86.5%) | 7 (13.5%) |
| 25 to 34 Year Olds | 40 (100.0%) | 0 (0.0%) |
| 35 Years and over | 23 (100.0%) | 0 (0.0%) |
| Total | 769 (79.7%) | 196 (20.3%) |
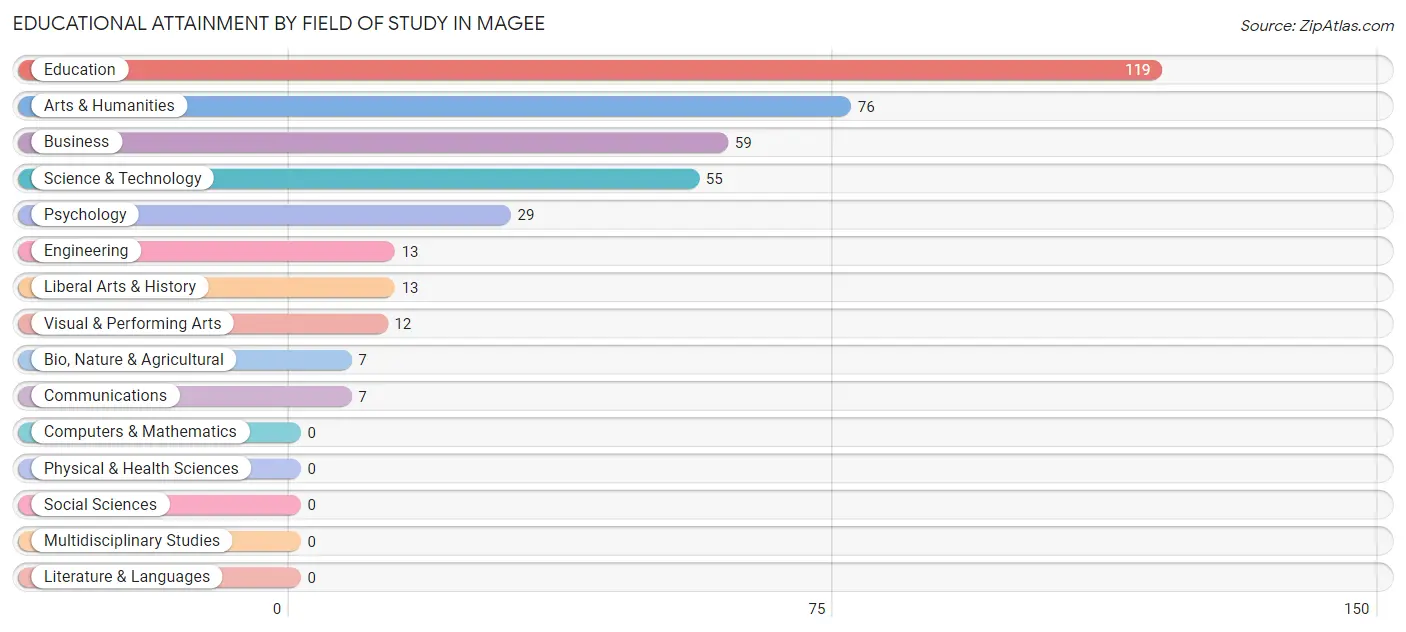
Educational Attainment by Field of Study in Magee
Education (119 | 30.5%), arts & humanities (76 | 19.5%), business (59 | 15.1%), science & technology (55 | 14.1%), and psychology (29 | 7.4%) are the most common fields of study among 390 individuals in Magee who have obtained a bachelor's degree or higher.
| Field of Study | # Graduates | % Graduates |
| Computers & Mathematics | 0 | 0.0% |
| Bio, Nature & Agricultural | 7 | 1.8% |
| Physical & Health Sciences | 0 | 0.0% |
| Psychology | 29 | 7.4% |
| Social Sciences | 0 | 0.0% |
| Engineering | 13 | 3.3% |
| Multidisciplinary Studies | 0 | 0.0% |
| Science & Technology | 55 | 14.1% |
| Business | 59 | 15.1% |
| Education | 119 | 30.5% |
| Literature & Languages | 0 | 0.0% |
| Liberal Arts & History | 13 | 3.3% |
| Visual & Performing Arts | 12 | 3.1% |
| Communications | 7 | 1.8% |
| Arts & Humanities | 76 | 19.5% |
| Total | 390 | 100.0% |
Transportation & Commute in Magee
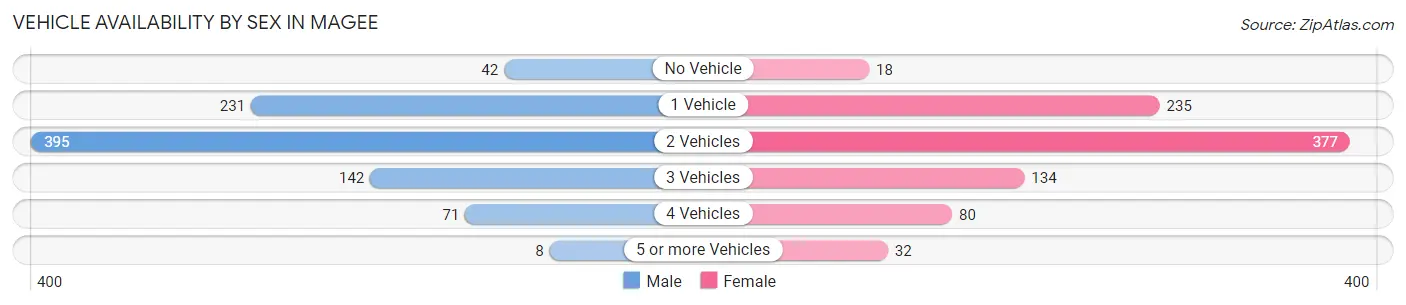
Vehicle Availability by Sex in Magee
The most prevalent vehicle ownership categories in Magee are males with 2 vehicles (395, accounting for 44.4%) and females with 2 vehicles (377, making up 45.1%).
| Vehicles Available | Male | Female |
| No Vehicle | 42 (4.7%) | 18 (2.1%) |
| 1 Vehicle | 231 (26.0%) | 235 (26.8%) |
| 2 Vehicles | 395 (44.4%) | 377 (43.0%) |
| 3 Vehicles | 142 (16.0%) | 134 (15.3%) |
| 4 Vehicles | 71 (8.0%) | 80 (9.1%) |
| 5 or more Vehicles | 8 (0.9%) | 32 (3.6%) |
| Total | 889 (100.0%) | 876 (100.0%) |
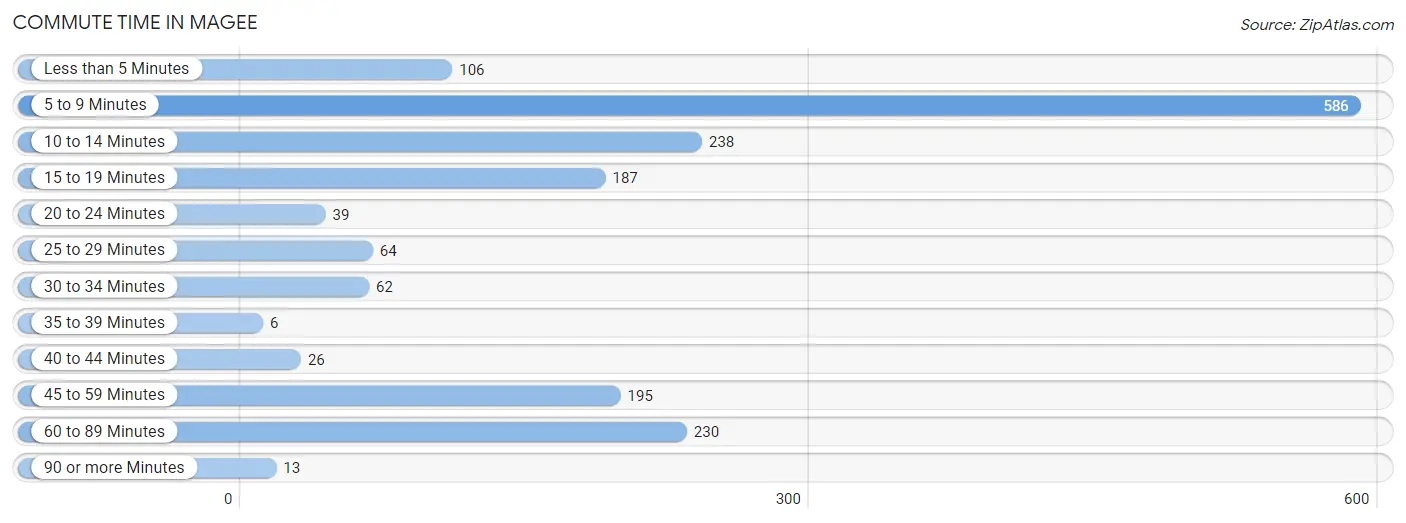
Commute Time in Magee
The most frequently occuring commute durations in Magee are 5 to 9 minutes (586 commuters, 33.5%), 10 to 14 minutes (238 commuters, 13.6%), and 60 to 89 minutes (230 commuters, 13.1%).
| Commute Time | # Commuters | % Commuters |
| Less than 5 Minutes | 106 | 6.0% |
| 5 to 9 Minutes | 586 | 33.5% |
| 10 to 14 Minutes | 238 | 13.6% |
| 15 to 19 Minutes | 187 | 10.7% |
| 20 to 24 Minutes | 39 | 2.2% |
| 25 to 29 Minutes | 64 | 3.6% |
| 30 to 34 Minutes | 62 | 3.5% |
| 35 to 39 Minutes | 6 | 0.3% |
| 40 to 44 Minutes | 26 | 1.5% |
| 45 to 59 Minutes | 195 | 11.1% |
| 60 to 89 Minutes | 230 | 13.1% |
| 90 or more Minutes | 13 | 0.7% |
Commute Time by Sex in Magee
The most common commute times in Magee are 60 to 89 minutes (225 commuters, 25.7%) for males and 5 to 9 minutes (365 commuters, 41.7%) for females.
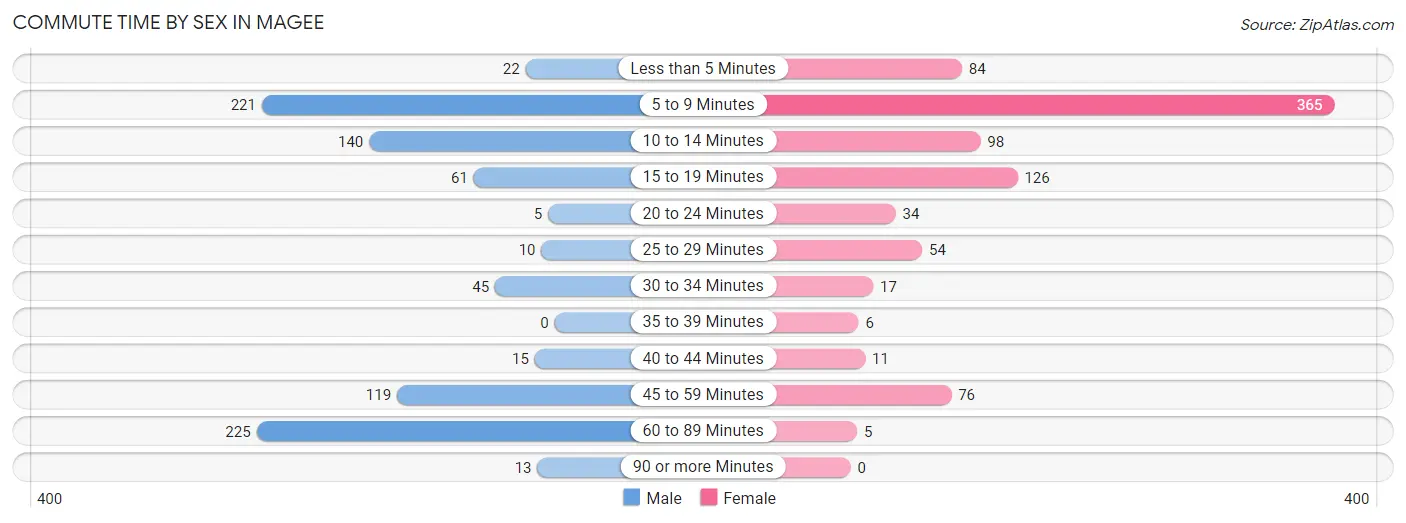
| Commute Time | Male | Female |
| Less than 5 Minutes | 22 (2.5%) | 84 (9.6%) |
| 5 to 9 Minutes | 221 (25.2%) | 365 (41.7%) |
| 10 to 14 Minutes | 140 (16.0%) | 98 (11.2%) |
| 15 to 19 Minutes | 61 (7.0%) | 126 (14.4%) |
| 20 to 24 Minutes | 5 (0.6%) | 34 (3.9%) |
| 25 to 29 Minutes | 10 (1.1%) | 54 (6.2%) |
| 30 to 34 Minutes | 45 (5.1%) | 17 (1.9%) |
| 35 to 39 Minutes | 0 (0.0%) | 6 (0.7%) |
| 40 to 44 Minutes | 15 (1.7%) | 11 (1.3%) |
| 45 to 59 Minutes | 119 (13.6%) | 76 (8.7%) |
| 60 to 89 Minutes | 225 (25.7%) | 5 (0.6%) |
| 90 or more Minutes | 13 (1.5%) | 0 (0.0%) |
Time of Departure to Work by Sex in Magee
The most frequent times of departure to work in Magee are 7:00 AM to 7:29 AM (158, 18.0%) for males and 7:00 AM to 7:29 AM (183, 20.9%) for females.
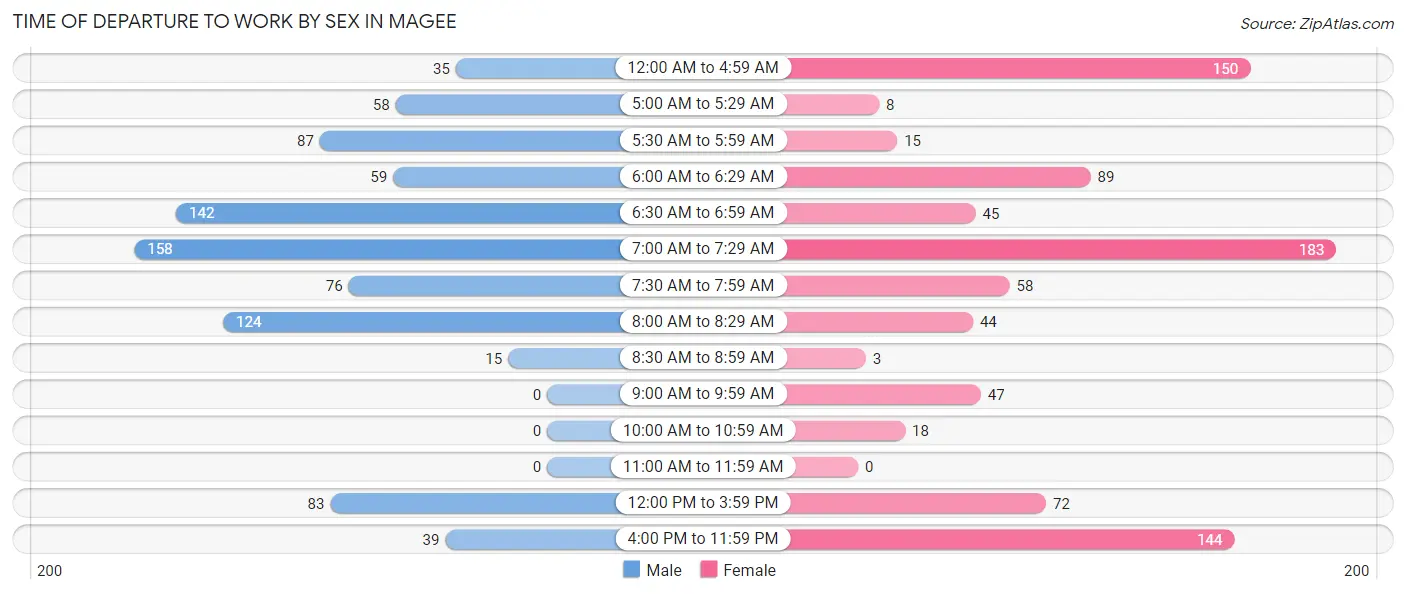
| Time of Departure | Male | Female |
| 12:00 AM to 4:59 AM | 35 (4.0%) | 150 (17.1%) |
| 5:00 AM to 5:29 AM | 58 (6.6%) | 8 (0.9%) |
| 5:30 AM to 5:59 AM | 87 (9.9%) | 15 (1.7%) |
| 6:00 AM to 6:29 AM | 59 (6.7%) | 89 (10.2%) |
| 6:30 AM to 6:59 AM | 142 (16.2%) | 45 (5.1%) |
| 7:00 AM to 7:29 AM | 158 (18.0%) | 183 (20.9%) |
| 7:30 AM to 7:59 AM | 76 (8.7%) | 58 (6.6%) |
| 8:00 AM to 8:29 AM | 124 (14.2%) | 44 (5.0%) |
| 8:30 AM to 8:59 AM | 15 (1.7%) | 3 (0.3%) |
| 9:00 AM to 9:59 AM | 0 (0.0%) | 47 (5.4%) |
| 10:00 AM to 10:59 AM | 0 (0.0%) | 18 (2.1%) |
| 11:00 AM to 11:59 AM | 0 (0.0%) | 0 (0.0%) |
| 12:00 PM to 3:59 PM | 83 (9.5%) | 72 (8.2%) |
| 4:00 PM to 11:59 PM | 39 (4.4%) | 144 (16.4%) |
| Total | 876 (100.0%) | 876 (100.0%) |
Housing Occupancy in Magee
Occupancy by Ownership in Magee
Of the total 1,357 dwellings in Magee, owner-occupied units account for 742 (54.7%), while renter-occupied units make up 615 (45.3%).

| Occupancy | # Housing Units | % Housing Units |
| Owner Occupied Housing Units | 742 | 54.7% |
| Renter-Occupied Housing Units | 615 | 45.3% |
| Total Occupied Housing Units | 1,357 | 100.0% |
Occupancy by Household Size in Magee
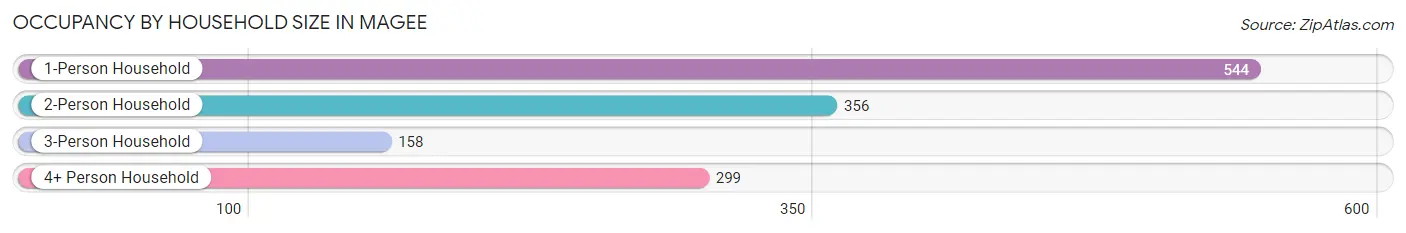
| Household Size | # Housing Units | % Housing Units |
| 1-Person Household | 544 | 40.1% |
| 2-Person Household | 356 | 26.2% |
| 3-Person Household | 158 | 11.6% |
| 4+ Person Household | 299 | 22.0% |
| Total Housing Units | 1,357 | 100.0% |
Occupancy by Ownership by Household Size in Magee
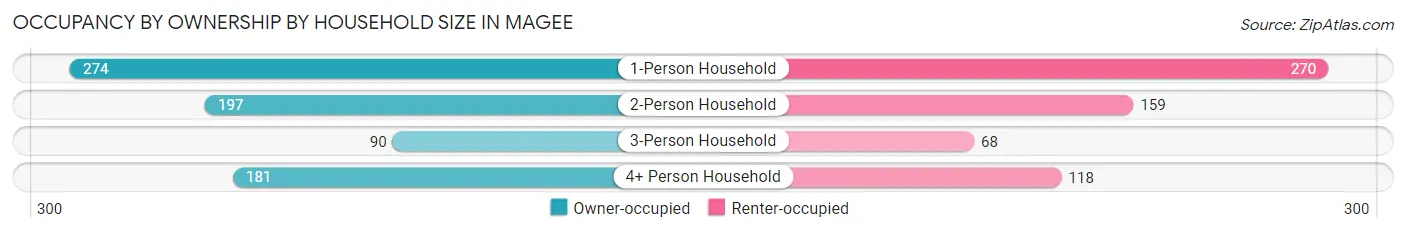
| Household Size | Owner-occupied | Renter-occupied |
| 1-Person Household | 274 (50.4%) | 270 (49.6%) |
| 2-Person Household | 197 (55.3%) | 159 (44.7%) |
| 3-Person Household | 90 (57.0%) | 68 (43.0%) |
| 4+ Person Household | 181 (60.5%) | 118 (39.5%) |
| Total Housing Units | 742 (54.7%) | 615 (45.3%) |
Occupancy by Educational Attainment in Magee
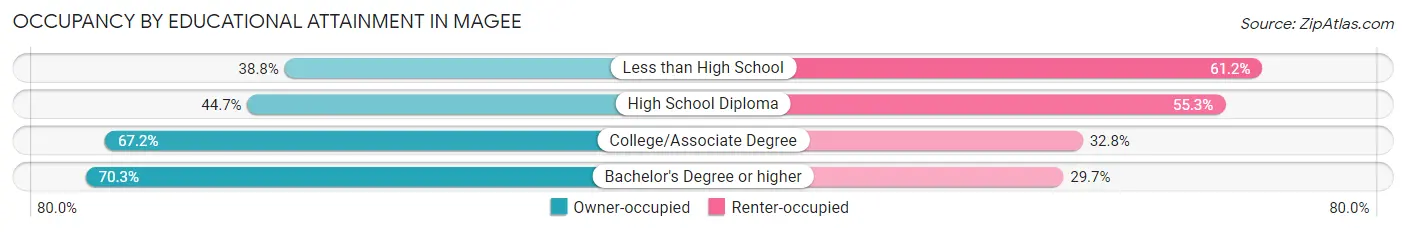
| Household Size | Owner-occupied | Renter-occupied |
| Less than High School | 100 (38.8%) | 158 (61.2%) |
| High School Diploma | 209 (44.7%) | 259 (55.3%) |
| College/Associate Degree | 234 (67.2%) | 114 (32.8%) |
| Bachelor's Degree or higher | 199 (70.3%) | 84 (29.7%) |
Occupancy by Age of Householder in Magee
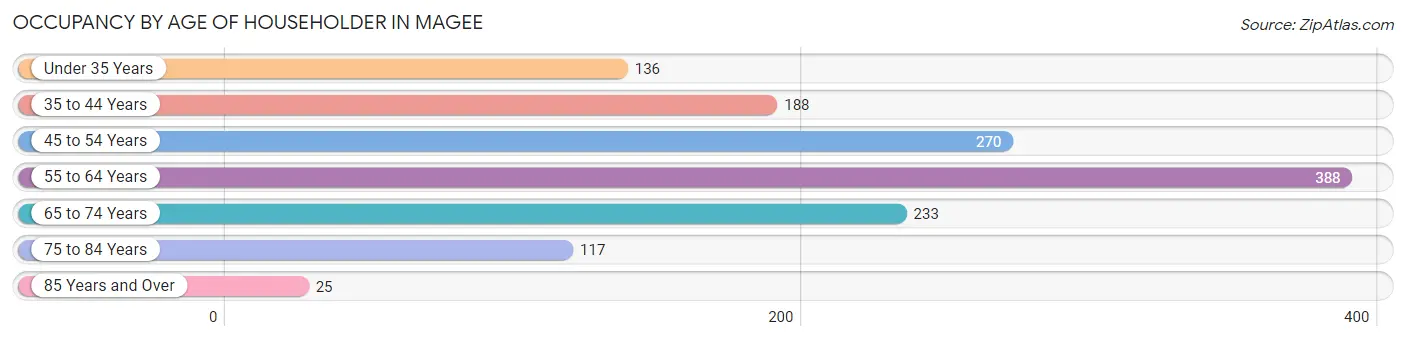
| Age Bracket | # Households | % Households |
| Under 35 Years | 136 | 10.0% |
| 35 to 44 Years | 188 | 13.9% |
| 45 to 54 Years | 270 | 19.9% |
| 55 to 64 Years | 388 | 28.6% |
| 65 to 74 Years | 233 | 17.2% |
| 75 to 84 Years | 117 | 8.6% |
| 85 Years and Over | 25 | 1.8% |
| Total | 1,357 | 100.0% |
Housing Finances in Magee
Median Income by Occupancy in Magee
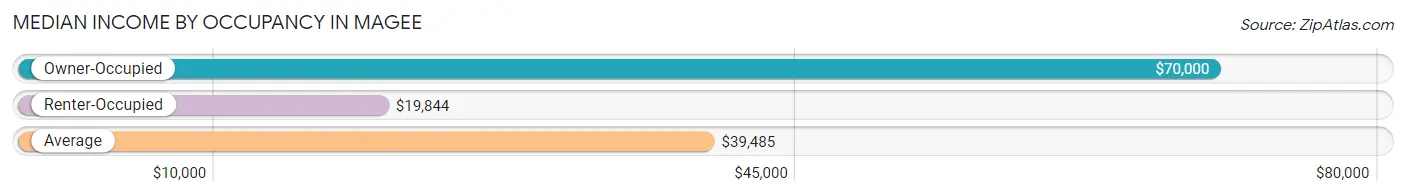
| Occupancy Type | # Households | Median Income |
| Owner-Occupied | 742 (54.7%) | $70,000 |
| Renter-Occupied | 615 (45.3%) | $19,844 |
| Average | 1,357 (100.0%) | $39,485 |
Occupancy by Householder Income Bracket in Magee
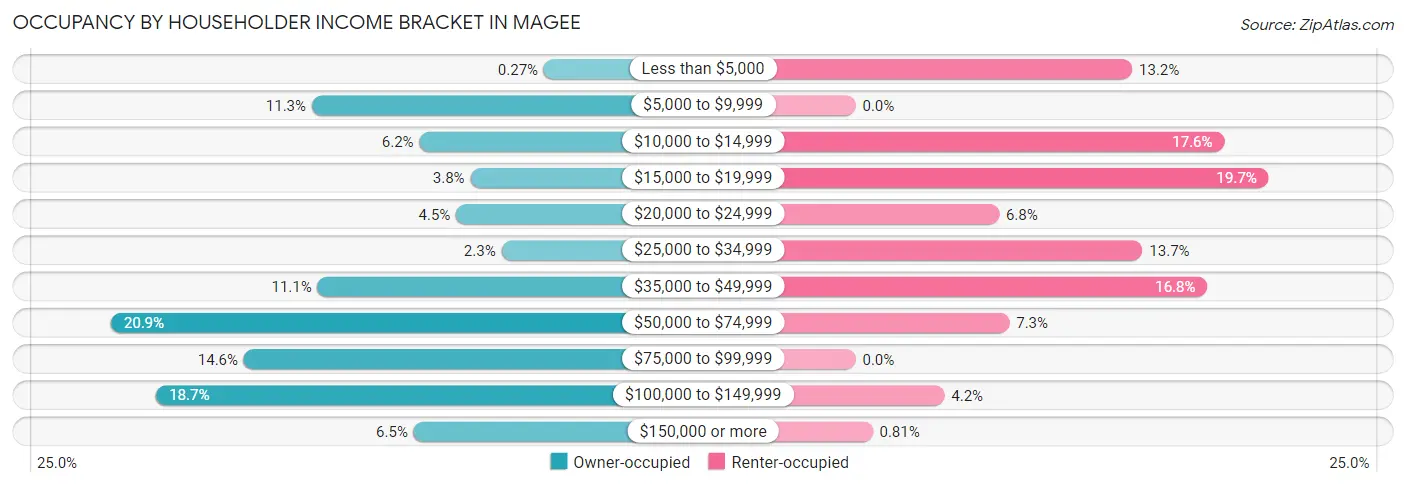
| Income Bracket | Owner-occupied | Renter-occupied |
| Less than $5,000 | 2 (0.3%) | 81 (13.2%) |
| $5,000 to $9,999 | 84 (11.3%) | 0 (0.0%) |
| $10,000 to $14,999 | 46 (6.2%) | 108 (17.6%) |
| $15,000 to $19,999 | 28 (3.8%) | 121 (19.7%) |
| $20,000 to $24,999 | 33 (4.4%) | 42 (6.8%) |
| $25,000 to $34,999 | 17 (2.3%) | 84 (13.7%) |
| $35,000 to $49,999 | 82 (11.1%) | 103 (16.8%) |
| $50,000 to $74,999 | 155 (20.9%) | 45 (7.3%) |
| $75,000 to $99,999 | 108 (14.6%) | 0 (0.0%) |
| $100,000 to $149,999 | 139 (18.7%) | 26 (4.2%) |
| $150,000 or more | 48 (6.5%) | 5 (0.8%) |
| Total | 742 (100.0%) | 615 (100.0%) |
Monthly Housing Cost Tiers in Magee
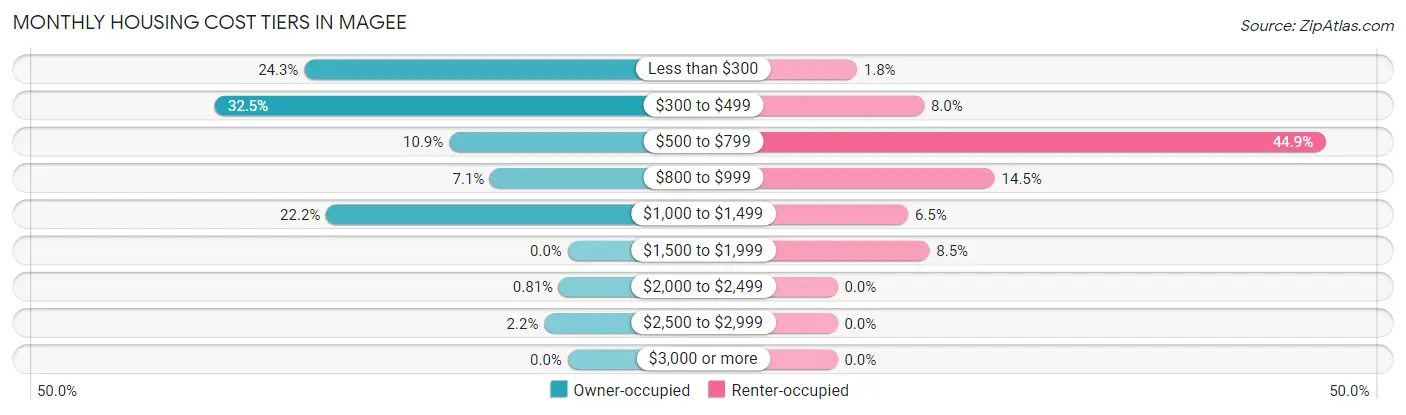
| Monthly Cost | Owner-occupied | Renter-occupied |
| Less than $300 | 180 (24.3%) | 11 (1.8%) |
| $300 to $499 | 241 (32.5%) | 49 (8.0%) |
| $500 to $799 | 81 (10.9%) | 276 (44.9%) |
| $800 to $999 | 53 (7.1%) | 89 (14.5%) |
| $1,000 to $1,499 | 165 (22.2%) | 40 (6.5%) |
| $1,500 to $1,999 | 0 (0.0%) | 52 (8.5%) |
| $2,000 to $2,499 | 6 (0.8%) | 0 (0.0%) |
| $2,500 to $2,999 | 16 (2.2%) | 0 (0.0%) |
| $3,000 or more | 0 (0.0%) | 0 (0.0%) |
| Total | 742 (100.0%) | 615 (100.0%) |
Physical Housing Characteristics in Magee
Housing Structures in Magee
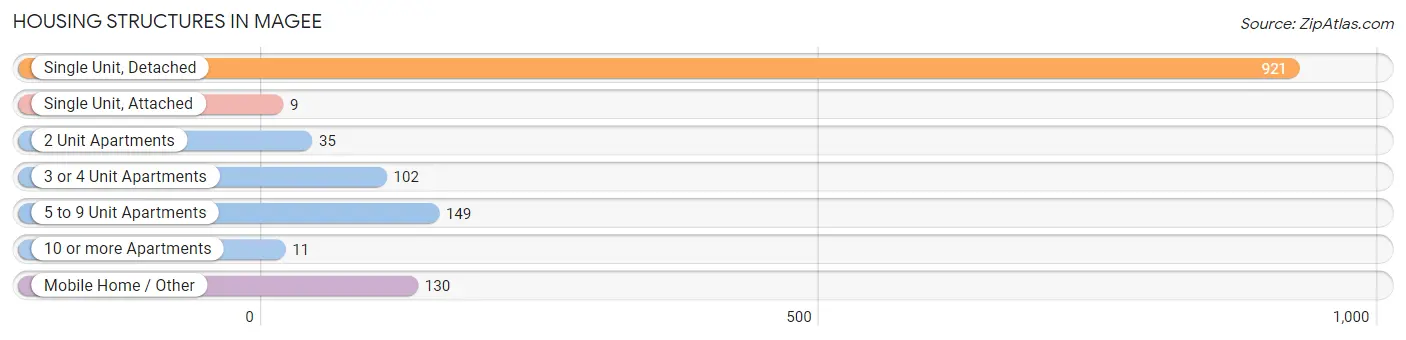
| Structure Type | # Housing Units | % Housing Units |
| Single Unit, Detached | 921 | 67.9% |
| Single Unit, Attached | 9 | 0.7% |
| 2 Unit Apartments | 35 | 2.6% |
| 3 or 4 Unit Apartments | 102 | 7.5% |
| 5 to 9 Unit Apartments | 149 | 11.0% |
| 10 or more Apartments | 11 | 0.8% |
| Mobile Home / Other | 130 | 9.6% |
| Total | 1,357 | 100.0% |
Housing Structures by Occupancy in Magee
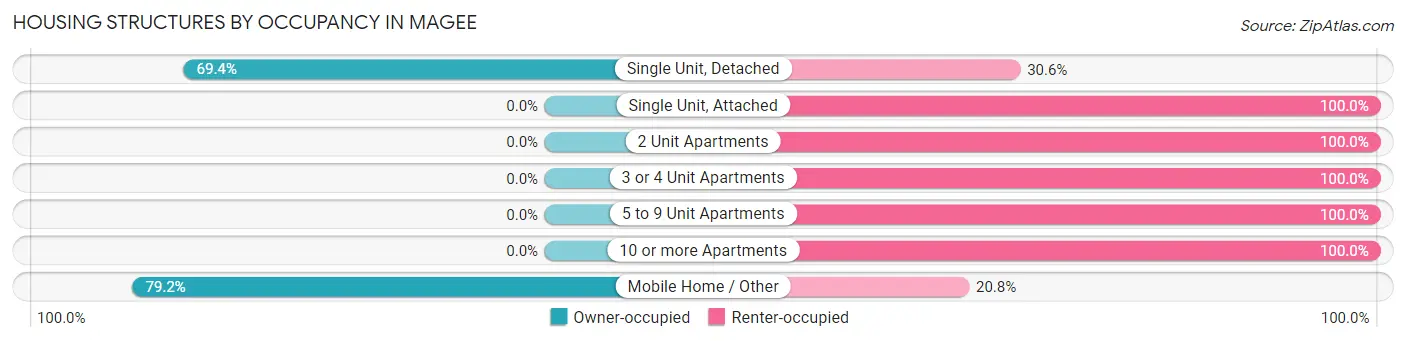
| Structure Type | Owner-occupied | Renter-occupied |
| Single Unit, Detached | 639 (69.4%) | 282 (30.6%) |
| Single Unit, Attached | 0 (0.0%) | 9 (100.0%) |
| 2 Unit Apartments | 0 (0.0%) | 35 (100.0%) |
| 3 or 4 Unit Apartments | 0 (0.0%) | 102 (100.0%) |
| 5 to 9 Unit Apartments | 0 (0.0%) | 149 (100.0%) |
| 10 or more Apartments | 0 (0.0%) | 11 (100.0%) |
| Mobile Home / Other | 103 (79.2%) | 27 (20.8%) |
| Total | 742 (54.7%) | 615 (45.3%) |
Housing Structures by Number of Rooms in Magee
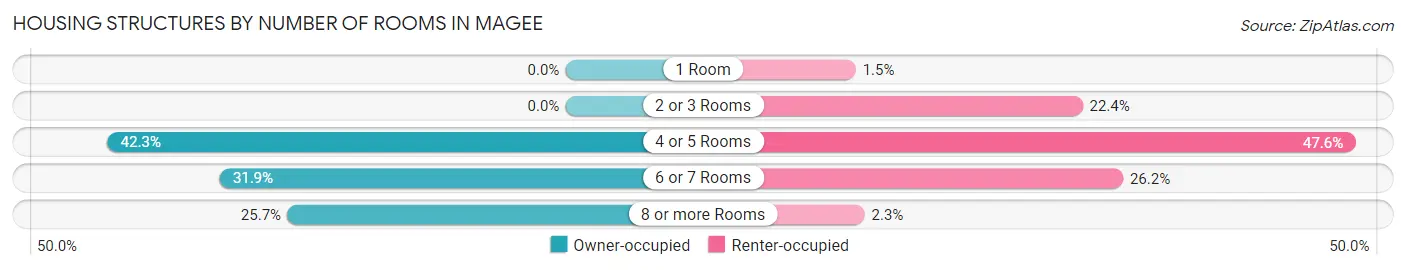
| Number of Rooms | Owner-occupied | Renter-occupied |
| 1 Room | 0 (0.0%) | 9 (1.5%) |
| 2 or 3 Rooms | 0 (0.0%) | 138 (22.4%) |
| 4 or 5 Rooms | 314 (42.3%) | 293 (47.6%) |
| 6 or 7 Rooms | 237 (31.9%) | 161 (26.2%) |
| 8 or more Rooms | 191 (25.7%) | 14 (2.3%) |
| Total | 742 (100.0%) | 615 (100.0%) |
Housing Structure by Heating Type in Magee
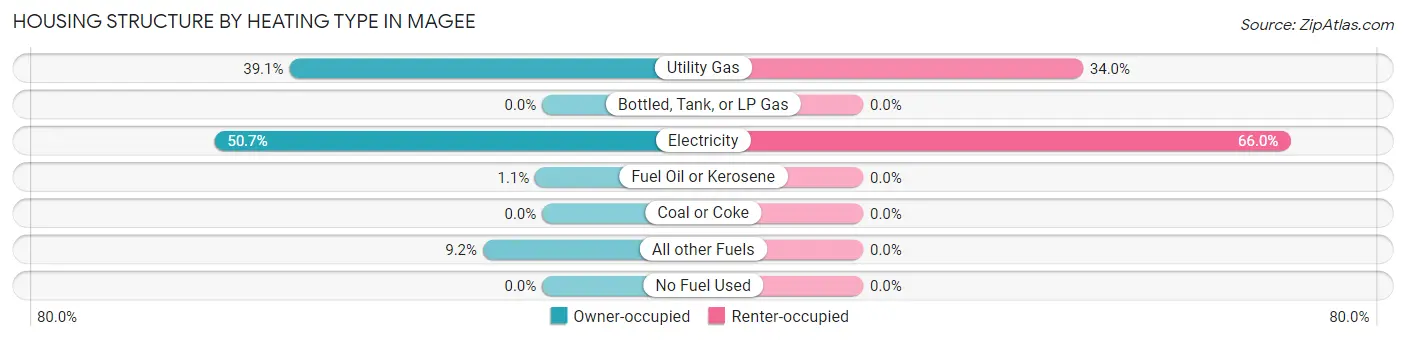
| Heating Type | Owner-occupied | Renter-occupied |
| Utility Gas | 290 (39.1%) | 209 (34.0%) |
| Bottled, Tank, or LP Gas | 0 (0.0%) | 0 (0.0%) |
| Electricity | 376 (50.7%) | 406 (66.0%) |
| Fuel Oil or Kerosene | 8 (1.1%) | 0 (0.0%) |
| Coal or Coke | 0 (0.0%) | 0 (0.0%) |
| All other Fuels | 68 (9.2%) | 0 (0.0%) |
| No Fuel Used | 0 (0.0%) | 0 (0.0%) |
| Total | 742 (100.0%) | 615 (100.0%) |
Household Vehicle Usage in Magee
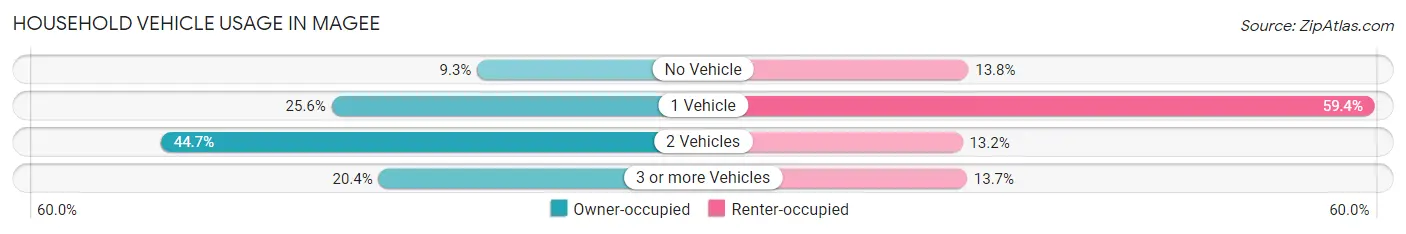
| Vehicles per Household | Owner-occupied | Renter-occupied |
| No Vehicle | 69 (9.3%) | 85 (13.8%) |
| 1 Vehicle | 190 (25.6%) | 365 (59.4%) |
| 2 Vehicles | 332 (44.7%) | 81 (13.2%) |
| 3 or more Vehicles | 151 (20.3%) | 84 (13.7%) |
| Total | 742 (100.0%) | 615 (100.0%) |
Real Estate & Mortgages in Magee
Real Estate and Mortgage Overview in Magee
| Characteristic | Without Mortgage | With Mortgage |
| Housing Units | 485 | 257 |
| Median Property Value | $94,400 | $155,900 |
| Median Household Income | $40,964 | $25 |
| Monthly Housing Costs | $365 | $0 |
| Real Estate Taxes | $828 | $34 |
Property Value by Mortgage Status in Magee
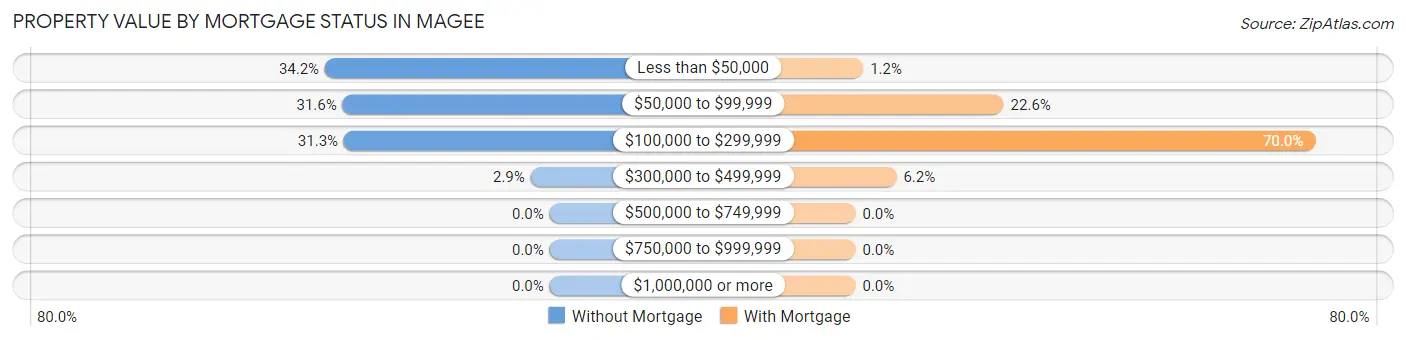
| Property Value | Without Mortgage | With Mortgage |
| Less than $50,000 | 166 (34.2%) | 3 (1.2%) |
| $50,000 to $99,999 | 153 (31.6%) | 58 (22.6%) |
| $100,000 to $299,999 | 152 (31.3%) | 180 (70.0%) |
| $300,000 to $499,999 | 14 (2.9%) | 16 (6.2%) |
| $500,000 to $749,999 | 0 (0.0%) | 0 (0.0%) |
| $750,000 to $999,999 | 0 (0.0%) | 0 (0.0%) |
| $1,000,000 or more | 0 (0.0%) | 0 (0.0%) |
| Total | 485 (100.0%) | 257 (100.0%) |
Household Income by Mortgage Status in Magee
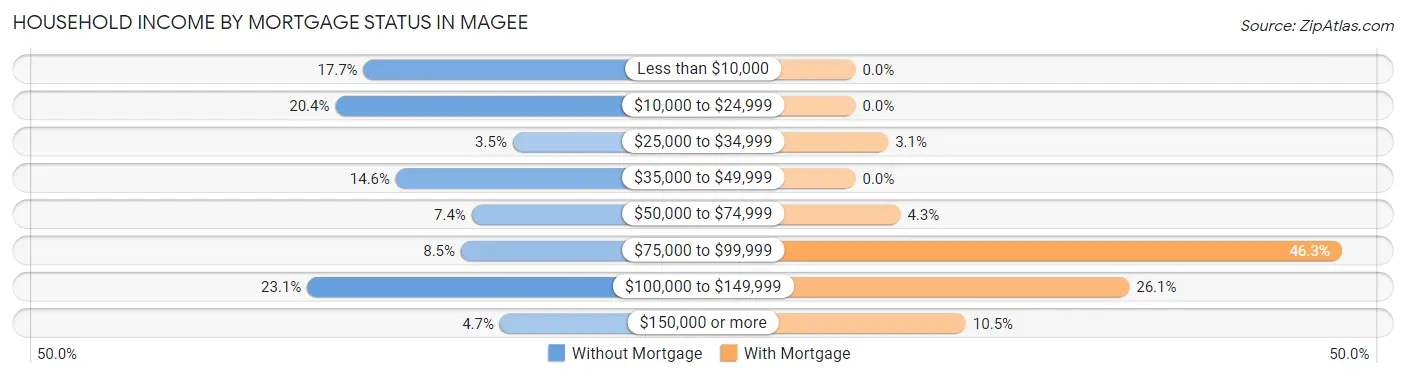
| Household Income | Without Mortgage | With Mortgage |
| Less than $10,000 | 86 (17.7%) | 0 (0.0%) |
| $10,000 to $24,999 | 99 (20.4%) | 0 (0.0%) |
| $25,000 to $34,999 | 17 (3.5%) | 8 (3.1%) |
| $35,000 to $49,999 | 71 (14.6%) | 0 (0.0%) |
| $50,000 to $74,999 | 36 (7.4%) | 11 (4.3%) |
| $75,000 to $99,999 | 41 (8.5%) | 119 (46.3%) |
| $100,000 to $149,999 | 112 (23.1%) | 67 (26.1%) |
| $150,000 or more | 23 (4.7%) | 27 (10.5%) |
| Total | 485 (100.0%) | 257 (100.0%) |
Property Value to Household Income Ratio in Magee
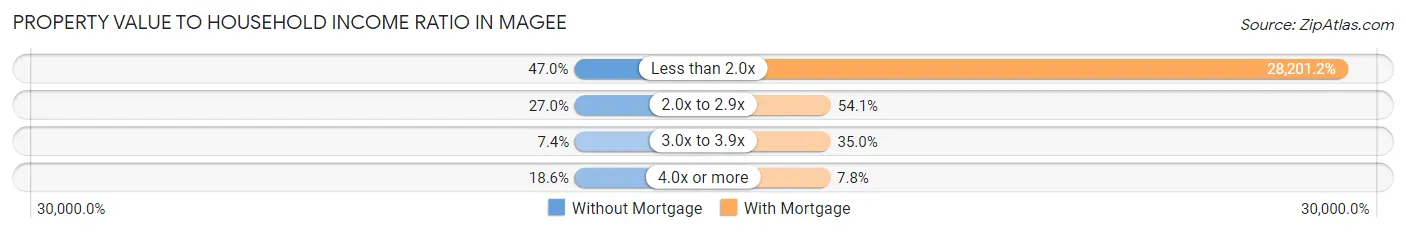
| Value-to-Income Ratio | Without Mortgage | With Mortgage |
| Less than 2.0x | 228 (47.0%) | 72,477 (28,201.2%) |
| 2.0x to 2.9x | 131 (27.0%) | 139 (54.1%) |
| 3.0x to 3.9x | 36 (7.4%) | 90 (35.0%) |
| 4.0x or more | 90 (18.6%) | 20 (7.8%) |
| Total | 485 (100.0%) | 257 (100.0%) |
Real Estate Taxes by Mortgage Status in Magee
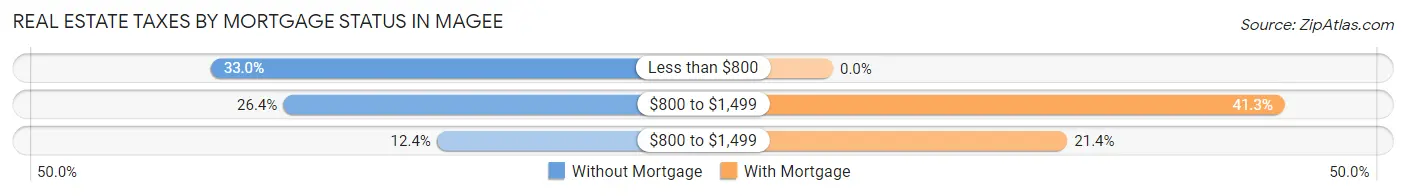
| Property Taxes | Without Mortgage | With Mortgage |
| Less than $800 | 160 (33.0%) | 0 (0.0%) |
| $800 to $1,499 | 128 (26.4%) | 106 (41.2%) |
| $800 to $1,499 | 60 (12.4%) | 55 (21.4%) |
| Total | 485 (100.0%) | 257 (100.0%) |
Health & Disability in Magee
Health Insurance Coverage by Age in Magee
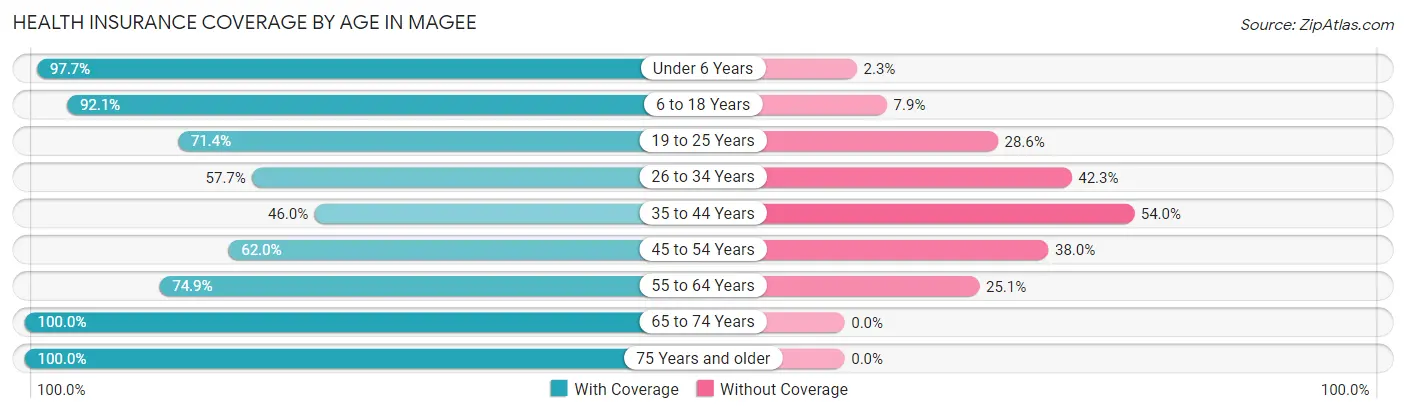
| Age Bracket | With Coverage | Without Coverage |
| Under 6 Years | 128 (97.7%) | 3 (2.3%) |
| 6 to 18 Years | 583 (92.1%) | 50 (7.9%) |
| 19 to 25 Years | 140 (71.4%) | 56 (28.6%) |
| 26 to 34 Years | 203 (57.7%) | 149 (42.3%) |
| 35 to 44 Years | 237 (46.0%) | 278 (54.0%) |
| 45 to 54 Years | 315 (62.0%) | 193 (38.0%) |
| 55 to 64 Years | 563 (74.9%) | 189 (25.1%) |
| 65 to 74 Years | 298 (100.0%) | 0 (0.0%) |
| 75 Years and older | 212 (100.0%) | 0 (0.0%) |
| Total | 2,679 (74.5%) | 918 (25.5%) |
Health Insurance Coverage by Citizenship Status in Magee
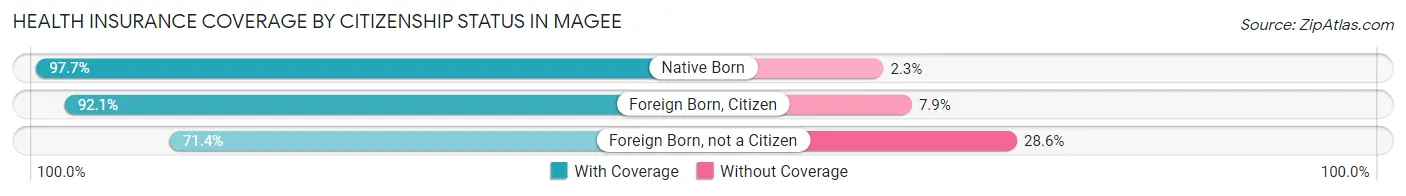
| Citizenship Status | With Coverage | Without Coverage |
| Native Born | 128 (97.7%) | 3 (2.3%) |
| Foreign Born, Citizen | 583 (92.1%) | 50 (7.9%) |
| Foreign Born, not a Citizen | 140 (71.4%) | 56 (28.6%) |
Health Insurance Coverage by Household Income in Magee
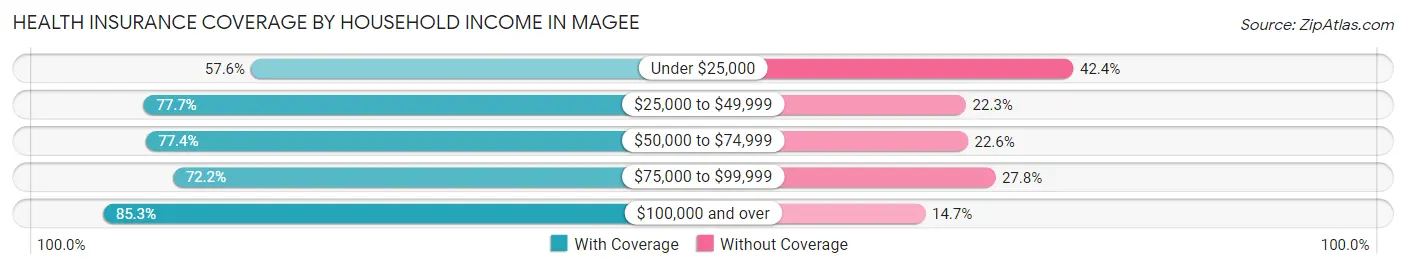
| Household Income | With Coverage | Without Coverage |
| Under $25,000 | 515 (57.6%) | 379 (42.4%) |
| $25,000 to $49,999 | 555 (77.7%) | 159 (22.3%) |
| $50,000 to $74,999 | 342 (77.4%) | 100 (22.6%) |
| $75,000 to $99,999 | 294 (72.2%) | 113 (27.8%) |
| $100,000 and over | 972 (85.3%) | 167 (14.7%) |
Public vs Private Health Insurance Coverage by Age in Magee
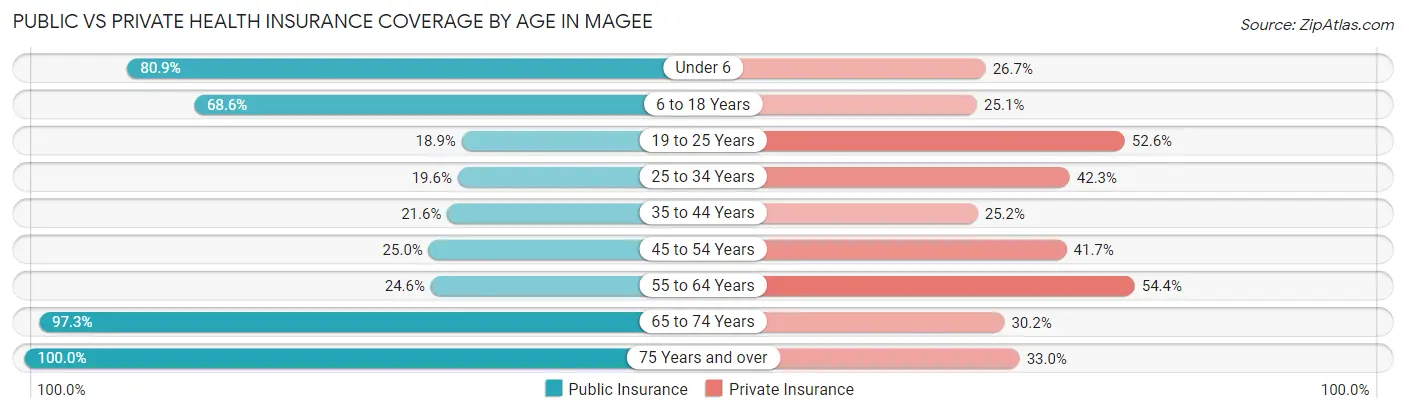
| Age Bracket | Public Insurance | Private Insurance |
| Under 6 | 106 (80.9%) | 35 (26.7%) |
| 6 to 18 Years | 434 (68.6%) | 159 (25.1%) |
| 19 to 25 Years | 37 (18.9%) | 103 (52.5%) |
| 25 to 34 Years | 69 (19.6%) | 149 (42.3%) |
| 35 to 44 Years | 111 (21.5%) | 130 (25.2%) |
| 45 to 54 Years | 127 (25.0%) | 212 (41.7%) |
| 55 to 64 Years | 185 (24.6%) | 409 (54.4%) |
| 65 to 74 Years | 290 (97.3%) | 90 (30.2%) |
| 75 Years and over | 212 (100.0%) | 70 (33.0%) |
| Total | 1,571 (43.7%) | 1,357 (37.7%) |
Disability Status by Sex by Age in Magee
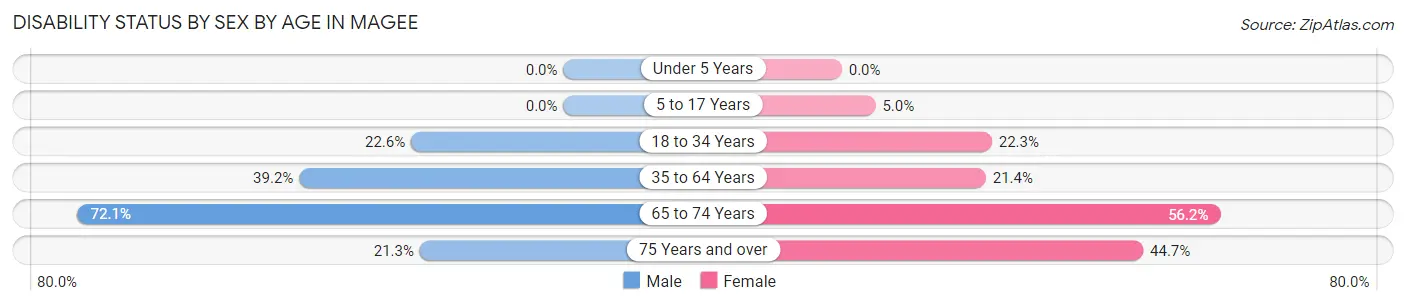
| Age Bracket | Male | Female |
| Under 5 Years | 0 (0.0%) | 0 (0.0%) |
| 5 to 17 Years | 0 (0.0%) | 15 (5.0%) |
| 18 to 34 Years | 69 (22.6%) | 55 (22.3%) |
| 35 to 64 Years | 355 (39.2%) | 186 (21.4%) |
| 65 to 74 Years | 75 (72.1%) | 109 (56.2%) |
| 75 Years and over | 29 (21.3%) | 34 (44.7%) |
Disability Class by Sex by Age in Magee
Disability Class: Hearing Difficulty
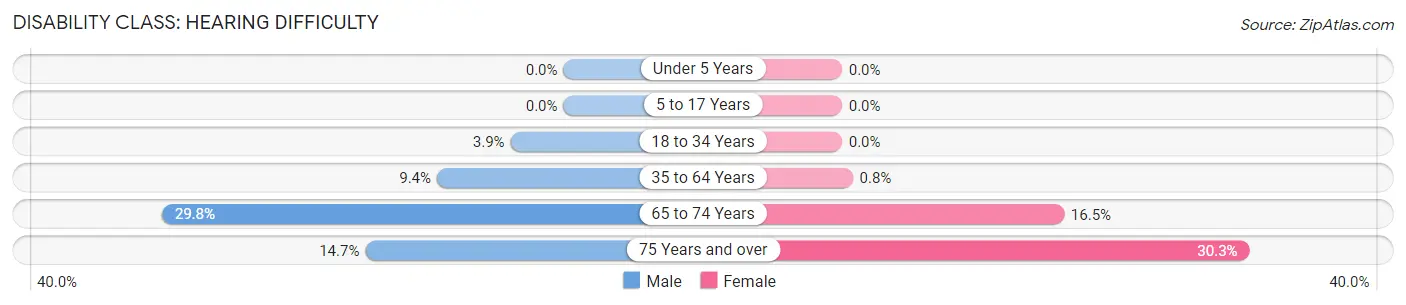
| Age Bracket | Male | Female |
| Under 5 Years | 0 (0.0%) | 0 (0.0%) |
| 5 to 17 Years | 0 (0.0%) | 0 (0.0%) |
| 18 to 34 Years | 12 (3.9%) | 0 (0.0%) |
| 35 to 64 Years | 85 (9.4%) | 7 (0.8%) |
| 65 to 74 Years | 31 (29.8%) | 32 (16.5%) |
| 75 Years and over | 20 (14.7%) | 23 (30.3%) |
Disability Class: Vision Difficulty
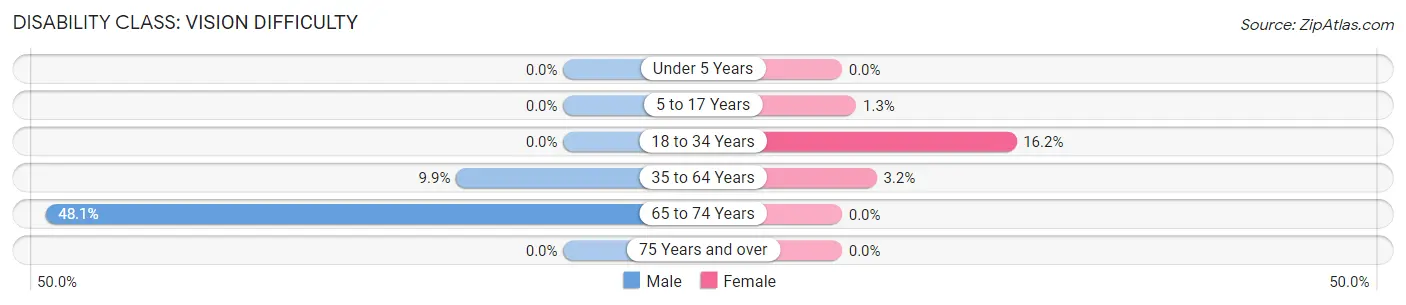
| Age Bracket | Male | Female |
| Under 5 Years | 0 (0.0%) | 0 (0.0%) |
| 5 to 17 Years | 0 (0.0%) | 4 (1.3%) |
| 18 to 34 Years | 0 (0.0%) | 40 (16.2%) |
| 35 to 64 Years | 90 (9.9%) | 28 (3.2%) |
| 65 to 74 Years | 50 (48.1%) | 0 (0.0%) |
| 75 Years and over | 0 (0.0%) | 0 (0.0%) |
Disability Class: Cognitive Difficulty
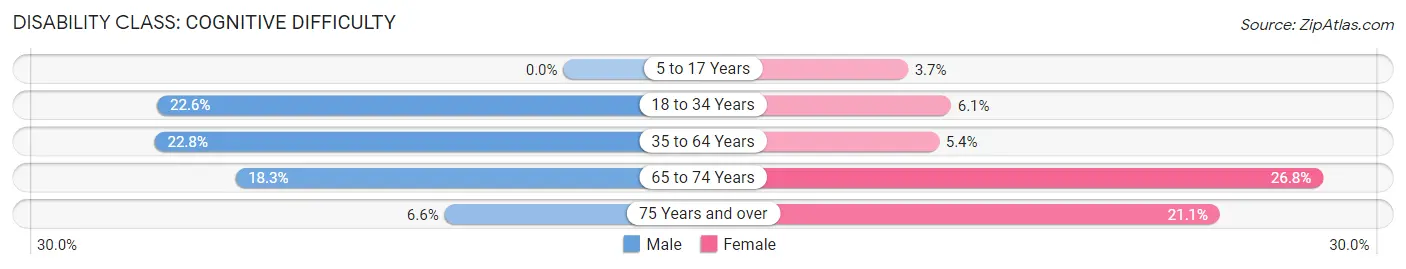
| Age Bracket | Male | Female |
| 5 to 17 Years | 0 (0.0%) | 11 (3.7%) |
| 18 to 34 Years | 69 (22.6%) | 15 (6.1%) |
| 35 to 64 Years | 206 (22.8%) | 47 (5.4%) |
| 65 to 74 Years | 19 (18.3%) | 52 (26.8%) |
| 75 Years and over | 9 (6.6%) | 16 (21.0%) |
Disability Class: Ambulatory Difficulty
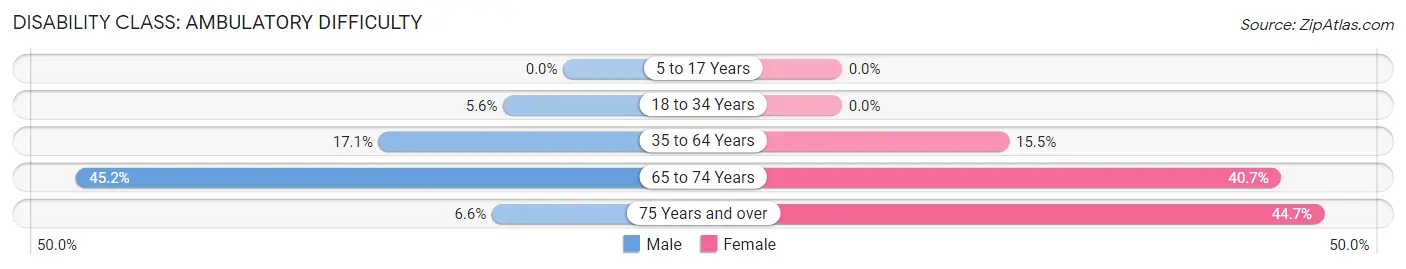
| Age Bracket | Male | Female |
| 5 to 17 Years | 0 (0.0%) | 0 (0.0%) |
| 18 to 34 Years | 17 (5.6%) | 0 (0.0%) |
| 35 to 64 Years | 155 (17.1%) | 135 (15.5%) |
| 65 to 74 Years | 47 (45.2%) | 79 (40.7%) |
| 75 Years and over | 9 (6.6%) | 34 (44.7%) |
Disability Class: Self-Care Difficulty
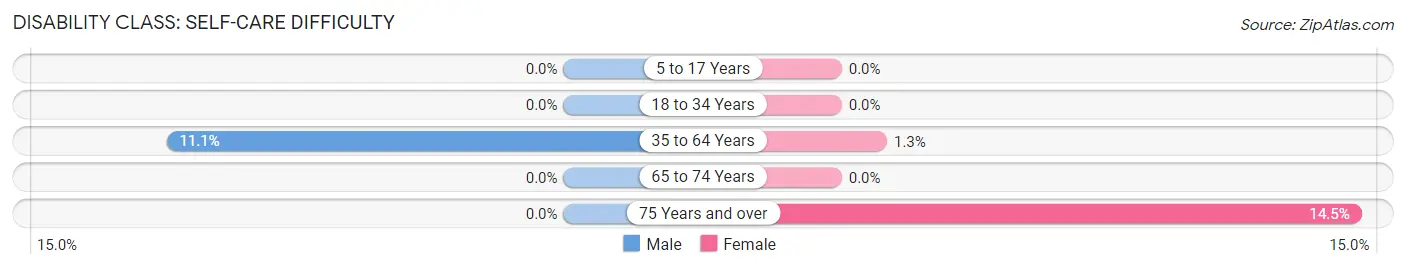
| Age Bracket | Male | Female |
| 5 to 17 Years | 0 (0.0%) | 0 (0.0%) |
| 18 to 34 Years | 0 (0.0%) | 0 (0.0%) |
| 35 to 64 Years | 100 (11.1%) | 11 (1.3%) |
| 65 to 74 Years | 0 (0.0%) | 0 (0.0%) |
| 75 Years and over | 0 (0.0%) | 11 (14.5%) |
Technology Access in Magee
Computing Device Access in Magee
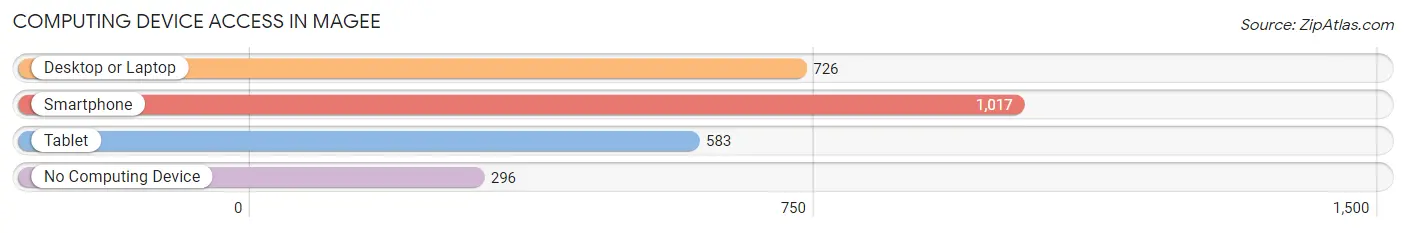
| Device Type | # Households | % Households |
| Desktop or Laptop | 726 | 53.5% |
| Smartphone | 1,017 | 74.9% |
| Tablet | 583 | 43.0% |
| No Computing Device | 296 | 21.8% |
| Total | 1,357 | 100.0% |
Internet Access in Magee
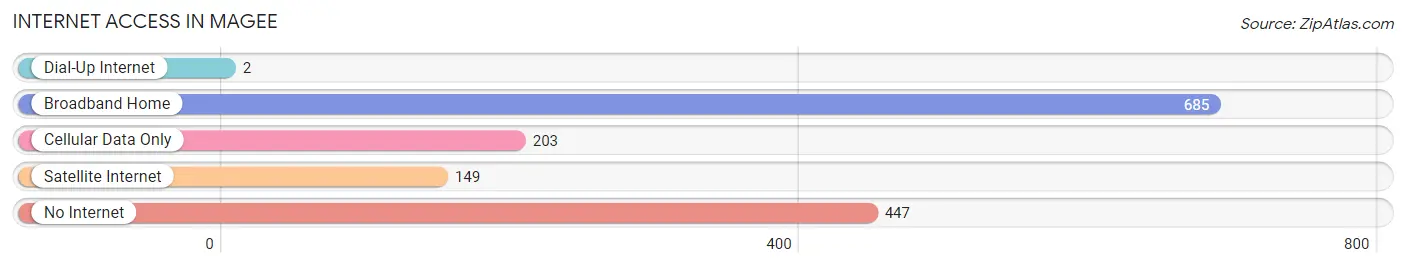
| Internet Type | # Households | % Households |
| Dial-Up Internet | 2 | 0.2% |
| Broadband Home | 685 | 50.5% |
| Cellular Data Only | 203 | 15.0% |
| Satellite Internet | 149 | 11.0% |
| No Internet | 447 | 32.9% |
| Total | 1,357 | 100.0% |
Magee Summary
Magee is a city located in Simpson County, Mississippi. It is situated in the southeastern part of the state, approximately 40 miles southeast of Jackson, the state capital. The city is part of the Jackson Metropolitan Statistical Area and has a population of approximately 4,500 people.
Geography
Magee is located at 32°45'N 89°45'W. It is situated in the southeastern part of the state, approximately 40 miles southeast of Jackson, the state capital. The city is part of the Jackson Metropolitan Statistical Area and has a population of approximately 4,500 people. The city is located in the Piney Woods region of Mississippi, and is surrounded by rolling hills and forests. The city is located on the banks of the Leaf River, which flows through the city and provides a source of recreation for the residents.
History
Magee was founded in 1872 by the Magee family, who had moved to the area from North Carolina. The city was named after the Magee family, and the city was incorporated in 1891. The city was originally a small farming community, but it began to grow in the early 20th century when the railroad was built through the city. The railroad brought new industry and jobs to the area, and the city began to grow rapidly.
In the 1950s, the city began to experience a period of growth and development. The city was home to several manufacturing plants, and the population began to grow. The city was also home to several schools, including Magee High School, which was established in 1954.
Economy
Magee is a small city, but it has a diverse economy. The city is home to several manufacturing plants, including a furniture factory, a paper mill, and a plastics plant. The city is also home to several retail stores, restaurants, and other businesses. The city is also home to several medical facilities, including Magee General Hospital.
The city is also home to several educational institutions, including Magee High School, Magee Junior College, and Magee Technical College. The city is also home to several churches, including the First Baptist Church of Magee.
Demographics
As of the 2010 census, the population of Magee was 4,510. The racial makeup of the city was 79.3% White, 18.3% African American, 0.3% Native American, 0.3% Asian, 0.1% Pacific Islander, 0.7% from other races, and 1.3% from two or more races. Hispanic or Latino of any race were 1.7% of the population.
The median income for a household in the city was $30,938, and the median income for a family was $37,917. The per capita income for the city was $15,945. About 19.2% of families and 22.2% of the population were below the poverty line, including 33.3% of those under age 18 and 16.2% of those age 65 or over.
Magee is a small city with a diverse economy and a rich history. The city is home to several manufacturing plants, retail stores, restaurants, and other businesses. The city is also home to several educational institutions, churches, and medical facilities. The city has a population of approximately 4,500 people, and the racial makeup of the city is 79.3% White, 18.3% African American, 0.3% Native American, 0.3% Asian, 0.1% Pacific Islander, 0.7% from other races, and 1.3% from two or more races. The median income for a household in the city was $30,938, and the median income for a family was $37,917. The per capita income for the city was $15,945.
Common Questions
What is Per Capita Income in Magee?
Per Capita income in Magee is $20,678.
What is the Median Family Income in Magee?
Median Family Income in Magee is $56,685.
What is the Median Household income in Magee?
Median Household Income in Magee is $39,485.
What is Income or Wage Gap in Magee?
Income or Wage Gap in Magee is 14.6%.
Women in Magee earn 85.4 cents for every dollar earned by a man.
What is Inequality or Gini Index in Magee?
Inequality or Gini Index in Magee is 0.49.
What is the Total Population of Magee?
Total Population of Magee is 3,974.
What is the Total Male Population of Magee?
Total Male Population of Magee is 2,079.
What is the Total Female Population of Magee?
Total Female Population of Magee is 1,895.
What is the Ratio of Males per 100 Females in Magee?
There are 109.71 Males per 100 Females in Magee.
What is the Ratio of Females per 100 Males in Magee?
There are 91.15 Females per 100 Males in Magee.
What is the Median Population Age in Magee?
Median Population Age in Magee is 44.6 Years.
What is the Average Family Size in Magee
Average Family Size in Magee is 3.5 People.
What is the Average Household Size in Magee
Average Household Size in Magee is 2.6 People.
How Large is the Labor Force in Magee?
There are 1,864 People in the Labor Forcein in Magee.
What is the Percentage of People in the Labor Force in Magee?
56.7% of People are in the Labor Force in Magee.
What is the Unemployment Rate in Magee?
Unemployment Rate in Magee is 4.9%.