Calhoun City, MS Map & Demographics
Calhoun City Map
Calhoun City Overview
$21,954
PER CAPITA INCOME
$50,875
AVG FAMILY INCOME
$41,375
AVG HOUSEHOLD INCOME
42.9%
WAGE / INCOME GAP [ % ]
57.1¢/ $1
WAGE / INCOME GAP [ $ ]
0.39
INEQUALITY / GINI INDEX
1,853
TOTAL POPULATION
881
MALE POPULATION
972
FEMALE POPULATION
90.64
MALES / 100 FEMALES
110.33
FEMALES / 100 MALES
44.1
MEDIAN AGE
2.9
AVG FAMILY SIZE
2.4
AVG HOUSEHOLD SIZE
736
LABOR FORCE [ PEOPLE ]
49.7%
PERCENT IN LABOR FORCE
7.2%
UNEMPLOYMENT RATE
Calhoun City Zip Codes
Calhoun City Area Codes
Income in Calhoun City
Income Overview in Calhoun City
Per Capita Income in Calhoun City is $21,954, while median incomes of families and households are $50,875 and $41,375 respectively.
| Characteristic | Number | Measure |
| Per Capita Income | 1,853 | $21,954 |
| Median Family Income | 508 | $50,875 |
| Mean Family Income | 508 | $61,128 |
| Median Household Income | 731 | $41,375 |
| Mean Household Income | 731 | $51,803 |
| Income Deficit | 508 | $0 |
| Wage / Income Gap (%) | 1,853 | 42.89% |
| Wage / Income Gap ($) | 1,853 | 57.11¢ per $1 |
| Gini / Inequality Index | 1,853 | 0.39 |
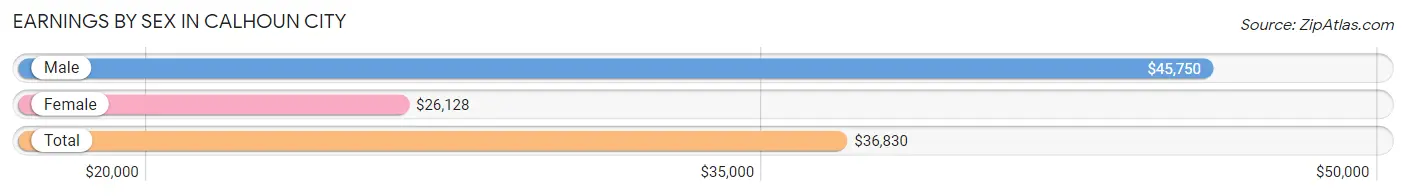
Earnings by Sex in Calhoun City
Average Earnings in Calhoun City are $36,830, $45,750 for men and $26,128 for women, a difference of 42.9%.
| Sex | Number | Average Earnings |
| Male | 390 (51.0%) | $45,750 |
| Female | 375 (49.0%) | $26,128 |
| Total | 765 (100.0%) | $36,830 |
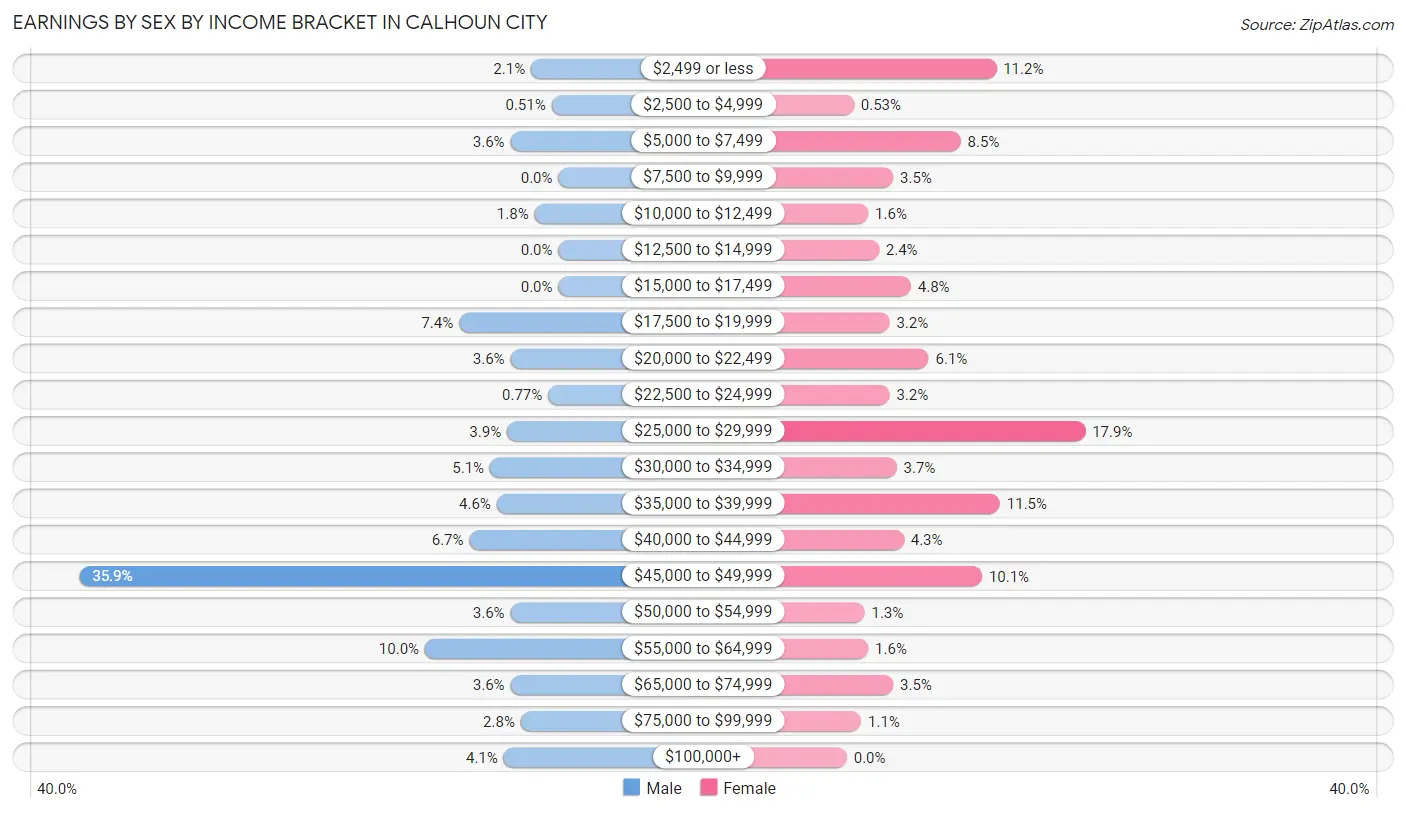
Earnings by Sex by Income Bracket in Calhoun City
The most common earnings brackets in Calhoun City are $45,000 to $49,999 for men (140 | 35.9%) and $25,000 to $29,999 for women (67 | 17.9%).
| Income | Male | Female |
| $2,499 or less | 8 (2.1%) | 42 (11.2%) |
| $2,500 to $4,999 | 2 (0.5%) | 2 (0.5%) |
| $5,000 to $7,499 | 14 (3.6%) | 32 (8.5%) |
| $7,500 to $9,999 | 0 (0.0%) | 13 (3.5%) |
| $10,000 to $12,499 | 7 (1.8%) | 6 (1.6%) |
| $12,500 to $14,999 | 0 (0.0%) | 9 (2.4%) |
| $15,000 to $17,499 | 0 (0.0%) | 18 (4.8%) |
| $17,500 to $19,999 | 29 (7.4%) | 12 (3.2%) |
| $20,000 to $22,499 | 14 (3.6%) | 23 (6.1%) |
| $22,500 to $24,999 | 3 (0.8%) | 12 (3.2%) |
| $25,000 to $29,999 | 15 (3.8%) | 67 (17.9%) |
| $30,000 to $34,999 | 20 (5.1%) | 14 (3.7%) |
| $35,000 to $39,999 | 18 (4.6%) | 43 (11.5%) |
| $40,000 to $44,999 | 26 (6.7%) | 16 (4.3%) |
| $45,000 to $49,999 | 140 (35.9%) | 38 (10.1%) |
| $50,000 to $54,999 | 14 (3.6%) | 5 (1.3%) |
| $55,000 to $64,999 | 39 (10.0%) | 6 (1.6%) |
| $65,000 to $74,999 | 14 (3.6%) | 13 (3.5%) |
| $75,000 to $99,999 | 11 (2.8%) | 4 (1.1%) |
| $100,000+ | 16 (4.1%) | 0 (0.0%) |
| Total | 390 (100.0%) | 375 (100.0%) |
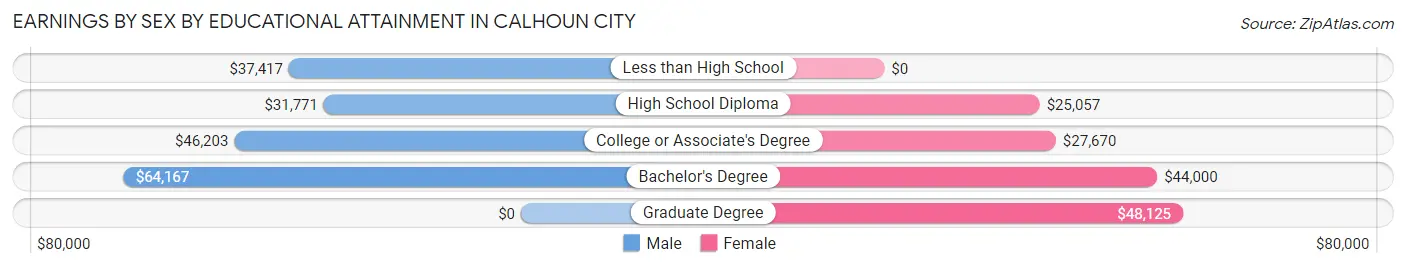
Earnings by Sex by Educational Attainment in Calhoun City
Average earnings in Calhoun City are $45,960 for men and $26,951 for women, a difference of 41.4%. Men with an educational attainment of bachelor's degree enjoy the highest average annual earnings of $64,167, while those with high school diploma education earn the least with $31,771. Women with an educational attainment of graduate degree earn the most with the average annual earnings of $48,125, while those with high school diploma education have the smallest earnings of $25,057.
| Educational Attainment | Male Income | Female Income |
| Less than High School | $37,417 | $0 |
| High School Diploma | $31,771 | $25,057 |
| College or Associate's Degree | $46,203 | $27,670 |
| Bachelor's Degree | $64,167 | $44,000 |
| Graduate Degree | - | - |
| Total | $45,960 | $26,951 |
Family Income in Calhoun City
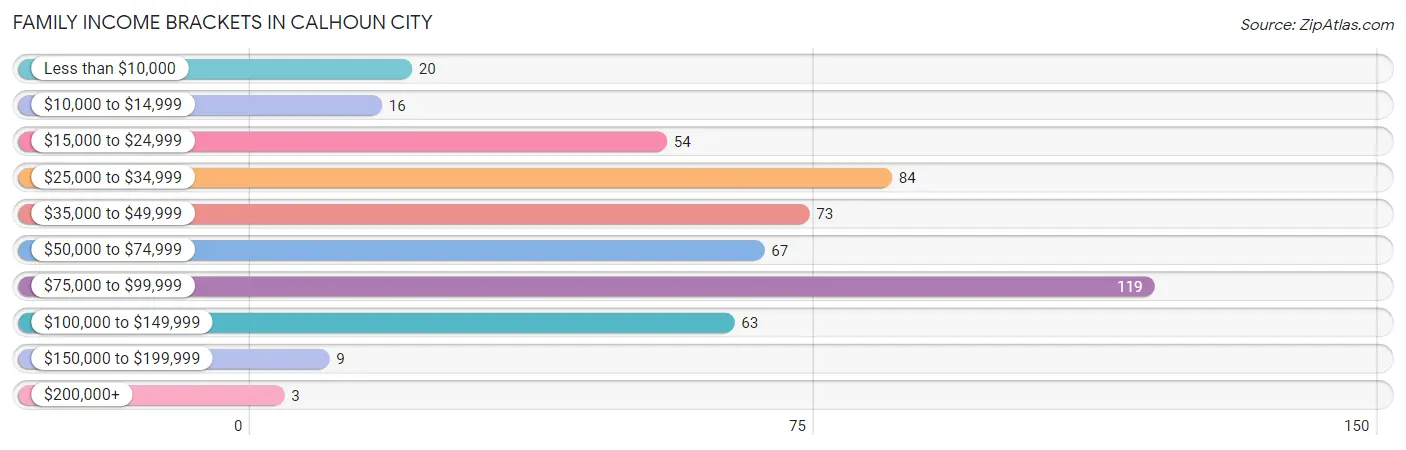
Family Income Brackets in Calhoun City
According to the Calhoun City family income data, there are 119 families falling into the $75,000 to $99,999 income range, which is the most common income bracket and makes up 23.4% of all families. Conversely, the $200,000+ income bracket is the least frequent group with only 3 families (0.6%) belonging to this category.
| Income Bracket | # Families | % Families |
| Less than $10,000 | 20 | 3.9% |
| $10,000 to $14,999 | 16 | 3.1% |
| $15,000 to $24,999 | 54 | 10.6% |
| $25,000 to $34,999 | 84 | 16.5% |
| $35,000 to $49,999 | 73 | 14.4% |
| $50,000 to $74,999 | 67 | 13.2% |
| $75,000 to $99,999 | 119 | 23.4% |
| $100,000 to $149,999 | 63 | 12.4% |
| $150,000 to $199,999 | 9 | 1.8% |
| $200,000+ | 3 | 0.6% |
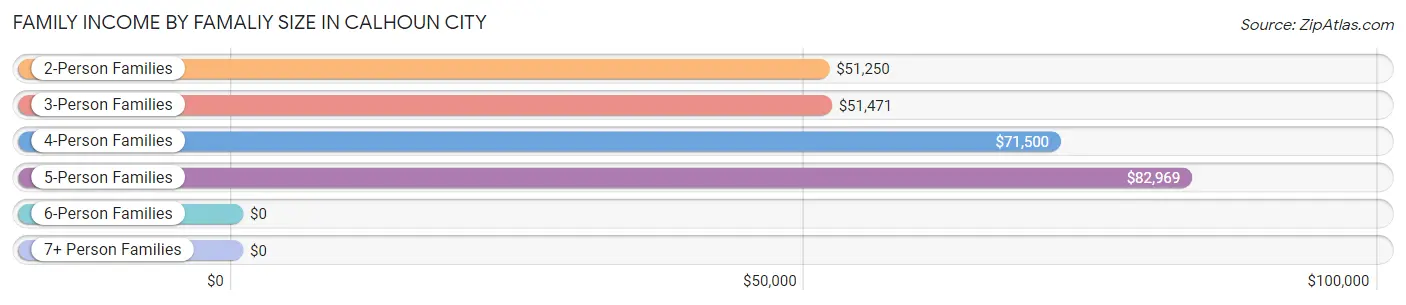
Family Income by Famaliy Size in Calhoun City
5-person families (23 | 4.5%) account for the highest median family income in Calhoun City with $82,969 per family, while 2-person families (285 | 56.1%) have the highest median income of $25,625 per family member.
| Income Bracket | # Families | Median Income |
| 2-Person Families | 285 (56.1%) | $51,250 |
| 3-Person Families | 98 (19.3%) | $51,471 |
| 4-Person Families | 72 (14.2%) | $71,500 |
| 5-Person Families | 23 (4.5%) | $82,969 |
| 6-Person Families | 30 (5.9%) | $0 |
| 7+ Person Families | 0 (0.0%) | $0 |
| Total | 508 (100.0%) | $50,875 |
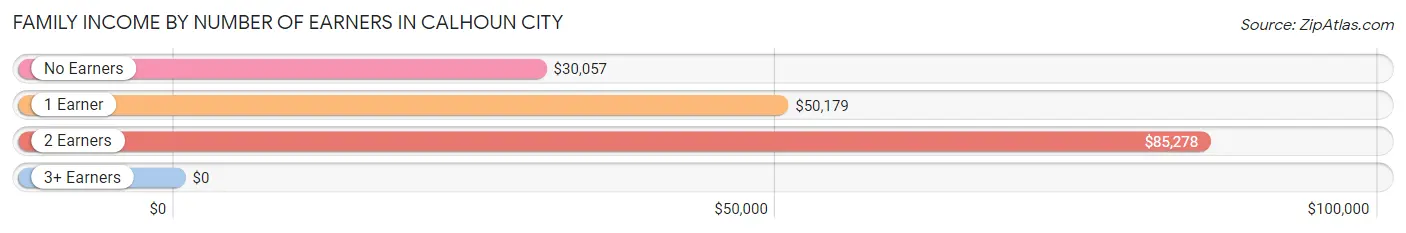
Family Income by Number of Earners in Calhoun City
| Number of Earners | # Families | Median Income |
| No Earners | 121 (23.8%) | $30,057 |
| 1 Earner | 219 (43.1%) | $50,179 |
| 2 Earners | 160 (31.5%) | $85,278 |
| 3+ Earners | 8 (1.6%) | $0 |
| Total | 508 (100.0%) | $50,875 |
Household Income in Calhoun City
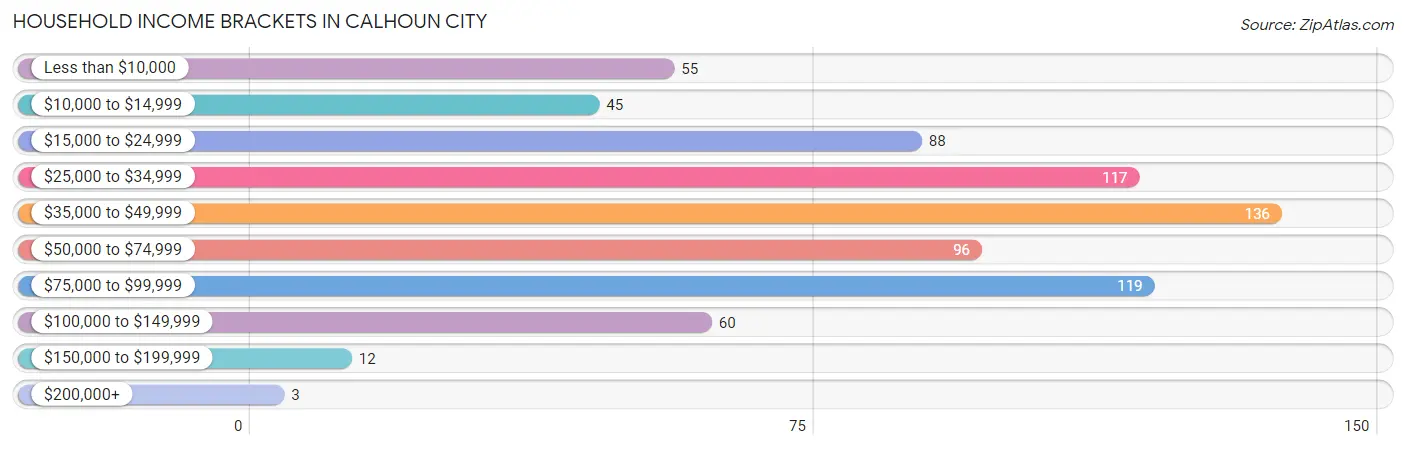
Household Income Brackets in Calhoun City
With 136 households falling in the category, the $35,000 to $49,999 income range is the most frequent in Calhoun City, accounting for 18.6% of all households. In contrast, only 3 households (0.4%) fall into the $200,000+ income bracket, making it the least populous group.
| Income Bracket | # Households | % Households |
| Less than $10,000 | 55 | 7.5% |
| $10,000 to $14,999 | 45 | 6.2% |
| $15,000 to $24,999 | 88 | 12.0% |
| $25,000 to $34,999 | 117 | 16.0% |
| $35,000 to $49,999 | 136 | 18.6% |
| $50,000 to $74,999 | 96 | 13.1% |
| $75,000 to $99,999 | 119 | 16.3% |
| $100,000 to $149,999 | 60 | 8.2% |
| $150,000 to $199,999 | 12 | 1.6% |
| $200,000+ | 3 | 0.4% |
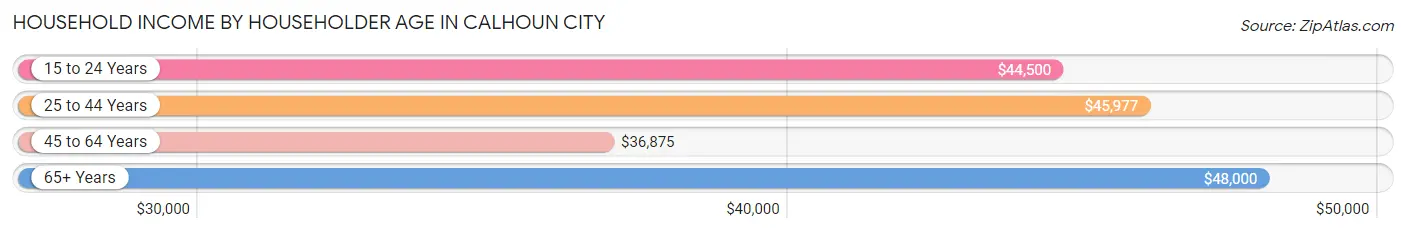
Household Income by Householder Age in Calhoun City
The median household income in Calhoun City is $41,375, with the highest median household income of $48,000 found in the 65+ years age bracket for the primary householder. A total of 228 households (31.2%) fall into this category. Meanwhile, the 45 to 64 years age bracket for the primary householder has the lowest median household income of $36,875, with 264 households (36.1%) in this group.
| Income Bracket | # Households | Median Income |
| 15 to 24 Years | 44 (6.0%) | $44,500 |
| 25 to 44 Years | 195 (26.7%) | $45,977 |
| 45 to 64 Years | 264 (36.1%) | $36,875 |
| 65+ Years | 228 (31.2%) | $48,000 |
| Total | 731 (100.0%) | $41,375 |
Poverty in Calhoun City
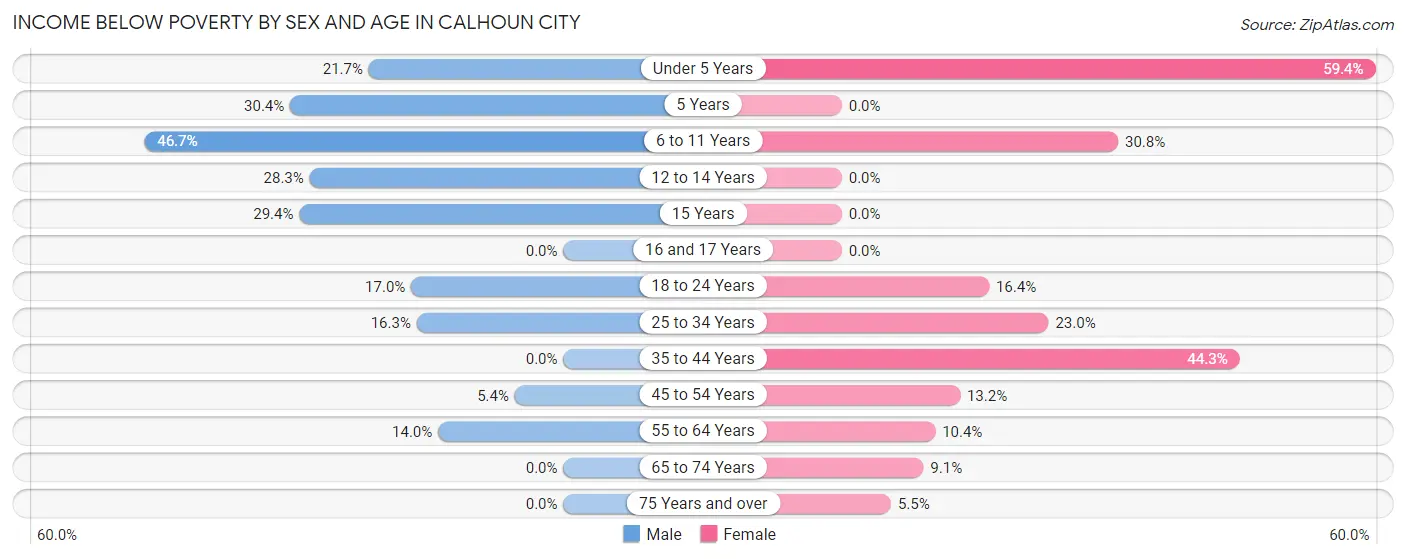
Income Below Poverty by Sex and Age in Calhoun City
With 12.8% poverty level for males and 20.8% for females among the residents of Calhoun City, 6 to 11 year old males and under 5 year old females are the most vulnerable to poverty, with 28 males (46.7%) and 41 females (59.4%) in their respective age groups living below the poverty level.
| Age Bracket | Male | Female |
| Under 5 Years | 13 (21.7%) | 41 (59.4%) |
| 5 Years | 7 (30.4%) | 0 (0.0%) |
| 6 to 11 Years | 28 (46.7%) | 24 (30.8%) |
| 12 to 14 Years | 13 (28.3%) | 0 (0.0%) |
| 15 Years | 5 (29.4%) | 0 (0.0%) |
| 16 and 17 Years | 0 (0.0%) | 0 (0.0%) |
| 18 to 24 Years | 10 (17.0%) | 10 (16.4%) |
| 25 to 34 Years | 16 (16.3%) | 32 (23.0%) |
| 35 to 44 Years | 0 (0.0%) | 35 (44.3%) |
| 45 to 54 Years | 4 (5.4%) | 15 (13.2%) |
| 55 to 64 Years | 12 (14.0%) | 13 (10.4%) |
| 65 to 74 Years | 0 (0.0%) | 11 (9.1%) |
| 75 Years and over | 0 (0.0%) | 4 (5.5%) |
| Total | 108 (12.8%) | 185 (20.8%) |
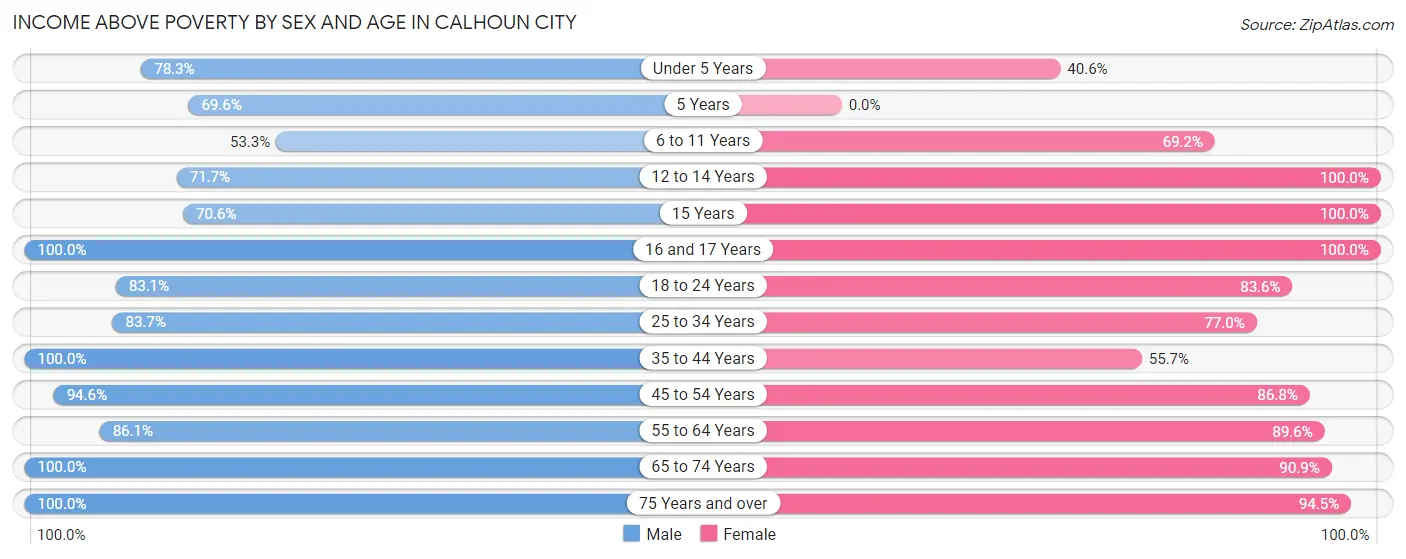
Income Above Poverty by Sex and Age in Calhoun City
According to the poverty statistics in Calhoun City, males aged 16 and 17 years and females aged 12 to 14 years are the age groups that are most secure financially, with 100.0% of males and 100.0% of females in these age groups living above the poverty line.
| Age Bracket | Male | Female |
| Under 5 Years | 47 (78.3%) | 28 (40.6%) |
| 5 Years | 16 (69.6%) | 0 (0.0%) |
| 6 to 11 Years | 32 (53.3%) | 54 (69.2%) |
| 12 to 14 Years | 33 (71.7%) | 14 (100.0%) |
| 15 Years | 12 (70.6%) | 5 (100.0%) |
| 16 and 17 Years | 41 (100.0%) | 11 (100.0%) |
| 18 to 24 Years | 49 (83.1%) | 51 (83.6%) |
| 25 to 34 Years | 82 (83.7%) | 107 (77.0%) |
| 35 to 44 Years | 149 (100.0%) | 44 (55.7%) |
| 45 to 54 Years | 70 (94.6%) | 99 (86.8%) |
| 55 to 64 Years | 74 (86.1%) | 112 (89.6%) |
| 65 to 74 Years | 92 (100.0%) | 110 (90.9%) |
| 75 Years and over | 37 (100.0%) | 69 (94.5%) |
| Total | 734 (87.2%) | 704 (79.2%) |
Income Below Poverty Among Married-Couple Families in Calhoun City
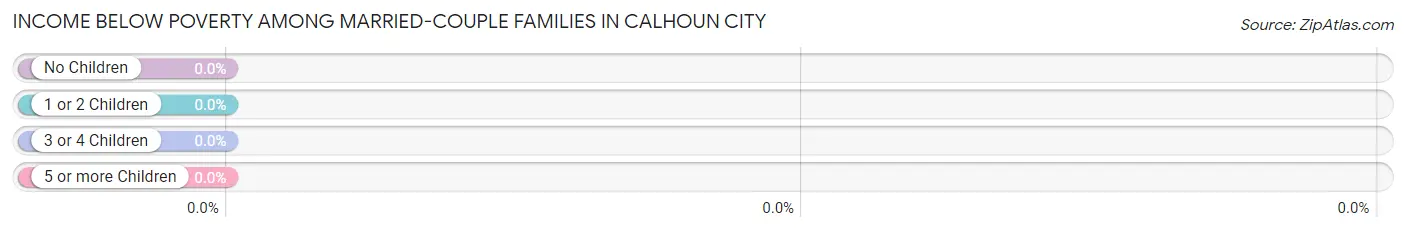
| Children | Above Poverty | Below Poverty |
| No Children | 154 (100.0%) | 0 (0.0%) |
| 1 or 2 Children | 79 (100.0%) | 0 (0.0%) |
| 3 or 4 Children | 38 (100.0%) | 0 (0.0%) |
| 5 or more Children | 0 (0.0%) | 0 (0.0%) |
| Total | 271 (100.0%) | 0 (0.0%) |
Income Below Poverty Among Single-Parent Households in Calhoun City
According to the poverty data in Calhoun City, 8.7% or 2 single-father households and 27.1% or 58 single-mother households are living below the poverty line. Among single-father households, those with 1 or 2 children have the highest poverty rate, with 2 households (12.5%) experiencing poverty. Likewise, among single-mother households, those with 3 or 4 children have the highest poverty rate, with 29 households (67.4%) falling below the poverty line.
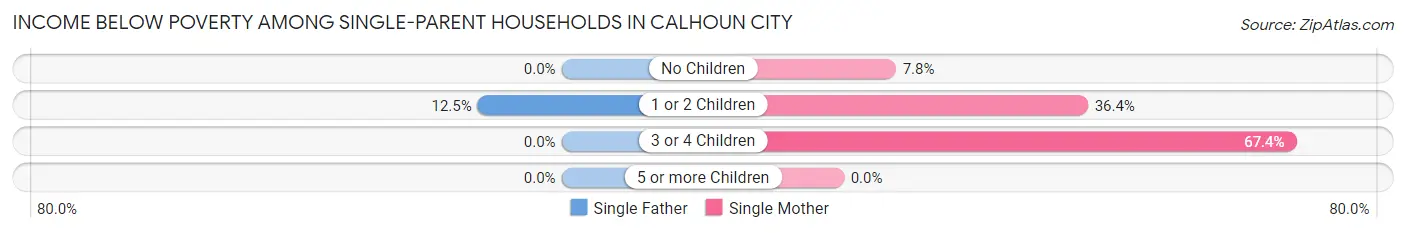
| Children | Single Father | Single Mother |
| No Children | 0 (0.0%) | 9 (7.8%) |
| 1 or 2 Children | 2 (12.5%) | 20 (36.4%) |
| 3 or 4 Children | 0 (0.0%) | 29 (67.4%) |
| 5 or more Children | 0 (0.0%) | 0 (0.0%) |
| Total | 2 (8.7%) | 58 (27.1%) |
Income Below Poverty Among Married-Couple vs Single-Parent Households in Calhoun City
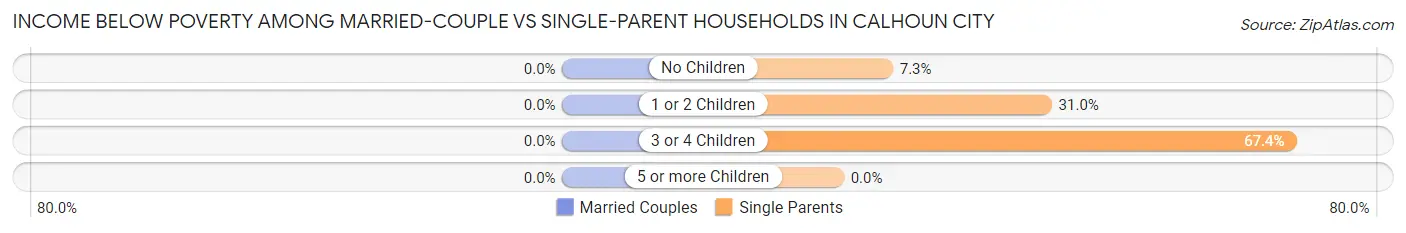
| Children | Married-Couple Families | Single-Parent Households |
| No Children | 0 (0.0%) | 9 (7.3%) |
| 1 or 2 Children | 0 (0.0%) | 22 (31.0%) |
| 3 or 4 Children | 0 (0.0%) | 29 (67.4%) |
| 5 or more Children | 0 (0.0%) | 0 (0.0%) |
| Total | 0 (0.0%) | 60 (25.3%) |
Race in Calhoun City
The most populous races in Calhoun City are White / Caucasian (1,109 | 59.9%), Black / African American (651 | 35.1%), and Hispanic or Latino (73 | 3.9%).
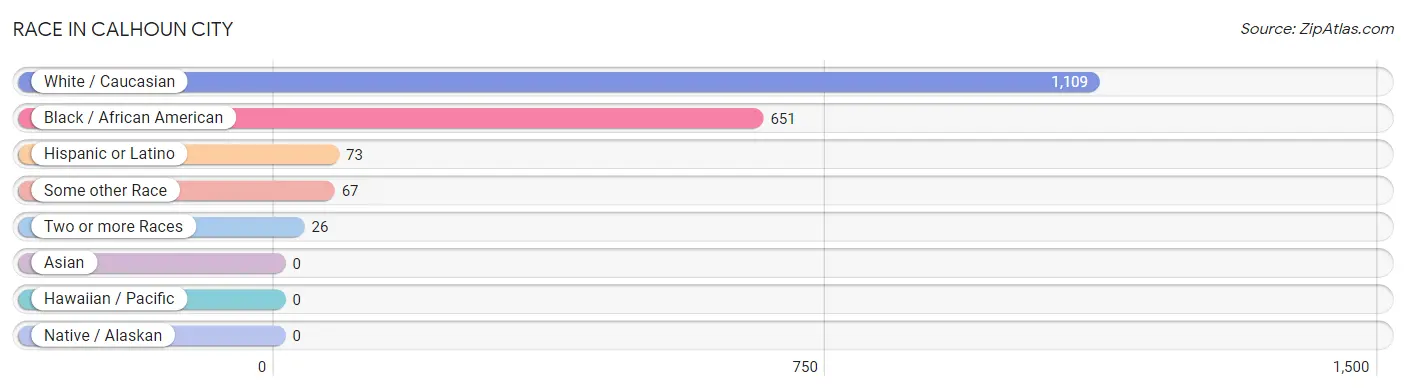
| Race | # Population | % Population |
| Asian | 0 | 0.0% |
| Black / African American | 651 | 35.1% |
| Hawaiian / Pacific | 0 | 0.0% |
| Hispanic or Latino | 73 | 3.9% |
| Native / Alaskan | 0 | 0.0% |
| White / Caucasian | 1,109 | 59.9% |
| Two or more Races | 26 | 1.4% |
| Some other Race | 67 | 3.6% |
| Total | 1,853 | 100.0% |
Ancestry in Calhoun City
The most populous ancestries reported in Calhoun City are American (570 | 30.8%), English (183 | 9.9%), Mexican (54 | 2.9%), German (47 | 2.5%), and Irish (40 | 2.2%), together accounting for 48.2% of all Calhoun City residents.
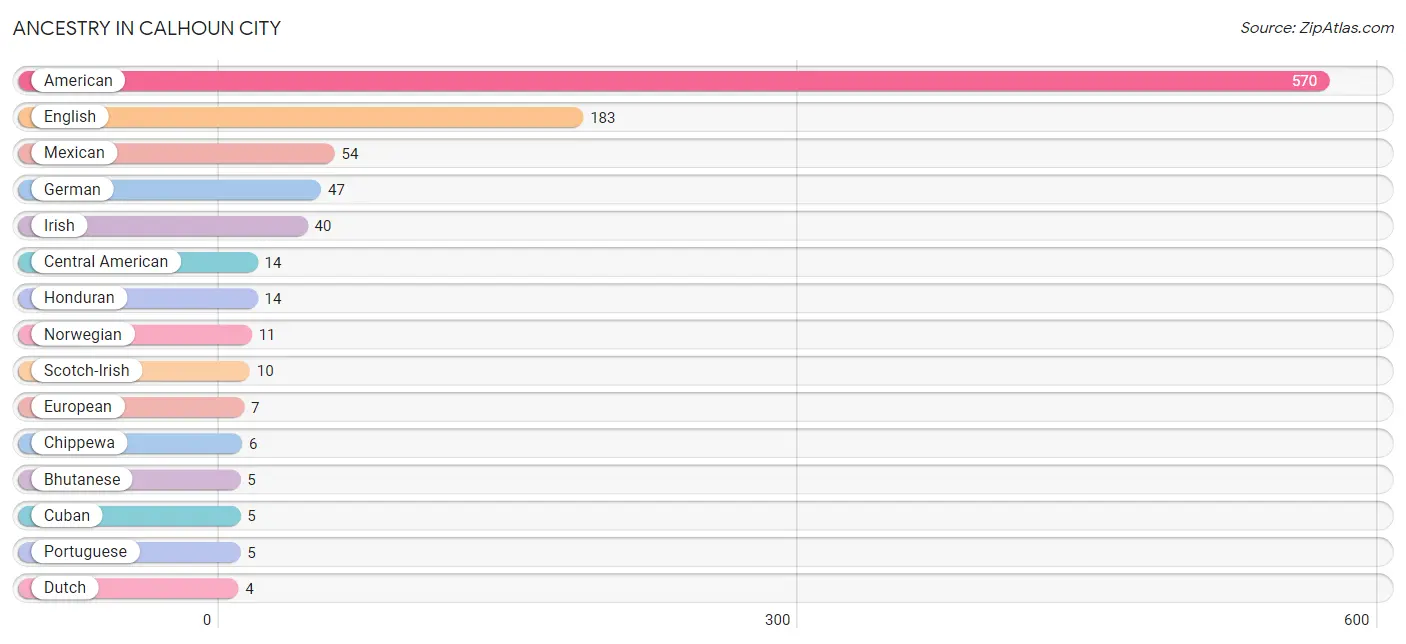
| Ancestry | # Population | % Population |
| African | 1 | 0.1% |
| American | 570 | 30.8% |
| Bhutanese | 5 | 0.3% |
| Central American | 14 | 0.8% |
| Chippewa | 6 | 0.3% |
| Cuban | 5 | 0.3% |
| Dutch | 4 | 0.2% |
| English | 183 | 9.9% |
| European | 7 | 0.4% |
| French | 3 | 0.2% |
| French American Indian | 1 | 0.1% |
| German | 47 | 2.5% |
| Greek | 4 | 0.2% |
| Honduran | 14 | 0.8% |
| Irish | 40 | 2.2% |
| Mexican | 54 | 2.9% |
| Mexican American Indian | 1 | 0.1% |
| Norwegian | 11 | 0.6% |
| Portuguese | 5 | 0.3% |
| Scotch-Irish | 10 | 0.5% |
| Subsaharan African | 1 | 0.1% | View All 21 Rows |
Immigrants in Calhoun City
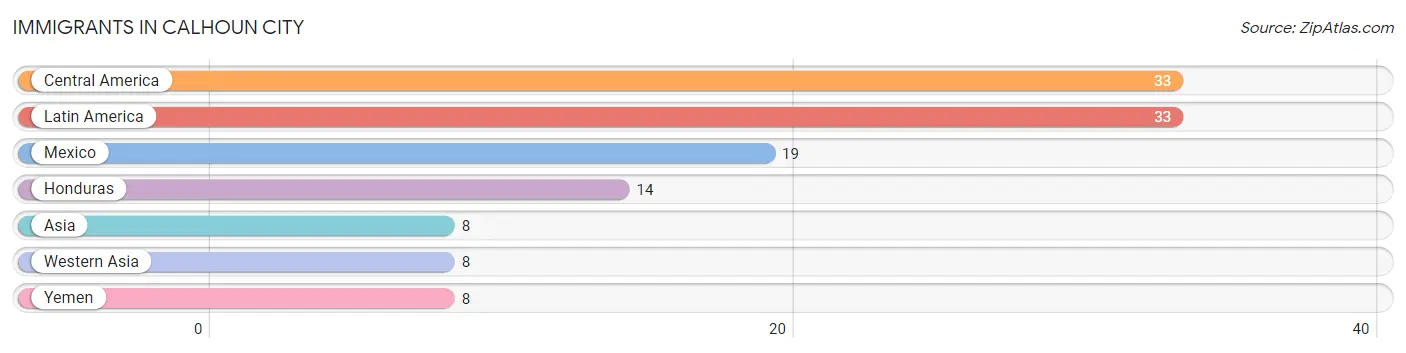
The most numerous immigrant groups reported in Calhoun City came from Central America (33 | 1.8%), Latin America (33 | 1.8%), Mexico (19 | 1.0%), Honduras (14 | 0.8%), and Asia (8 | 0.4%), together accounting for 5.8% of all Calhoun City residents.
| Immigration Origin | # Population | % Population |
| Asia | 8 | 0.4% |
| Central America | 33 | 1.8% |
| Honduras | 14 | 0.8% |
| Latin America | 33 | 1.8% |
| Mexico | 19 | 1.0% |
| Western Asia | 8 | 0.4% |
| Yemen | 8 | 0.4% | View All 7 Rows |
Sex and Age in Calhoun City
Sex and Age in Calhoun City
The most populous age groups in Calhoun City are 40 to 44 Years (101 | 11.5%) for men and 70 to 74 Years (101 | 10.4%) for women.
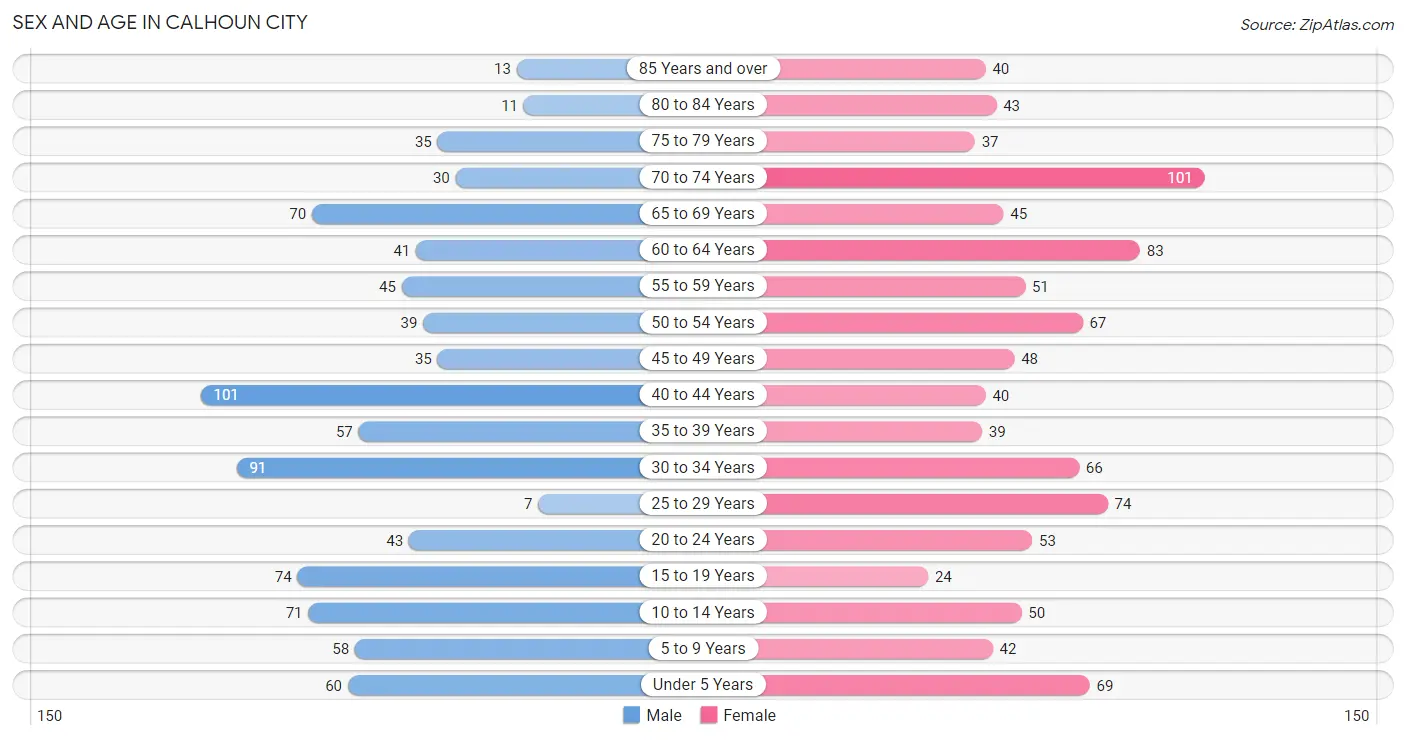
| Age Bracket | Male | Female |
| Under 5 Years | 60 (6.8%) | 69 (7.1%) |
| 5 to 9 Years | 58 (6.6%) | 42 (4.3%) |
| 10 to 14 Years | 71 (8.1%) | 50 (5.1%) |
| 15 to 19 Years | 74 (8.4%) | 24 (2.5%) |
| 20 to 24 Years | 43 (4.9%) | 53 (5.4%) |
| 25 to 29 Years | 7 (0.8%) | 74 (7.6%) |
| 30 to 34 Years | 91 (10.3%) | 66 (6.8%) |
| 35 to 39 Years | 57 (6.5%) | 39 (4.0%) |
| 40 to 44 Years | 101 (11.5%) | 40 (4.1%) |
| 45 to 49 Years | 35 (4.0%) | 48 (4.9%) |
| 50 to 54 Years | 39 (4.4%) | 67 (6.9%) |
| 55 to 59 Years | 45 (5.1%) | 51 (5.2%) |
| 60 to 64 Years | 41 (4.6%) | 83 (8.5%) |
| 65 to 69 Years | 70 (8.0%) | 45 (4.6%) |
| 70 to 74 Years | 30 (3.4%) | 101 (10.4%) |
| 75 to 79 Years | 35 (4.0%) | 37 (3.8%) |
| 80 to 84 Years | 11 (1.3%) | 43 (4.4%) |
| 85 Years and over | 13 (1.5%) | 40 (4.1%) |
| Total | 881 (100.0%) | 972 (100.0%) |
Families and Households in Calhoun City
Median Family Size in Calhoun City
The median family size in Calhoun City is 2.87 persons per family, with single female/mother families (214 | 42.1%) accounting for the largest median family size of 2.93 persons per family. On the other hand, single male/father families (23 | 4.5%) represent the smallest median family size with 2.13 persons per family.
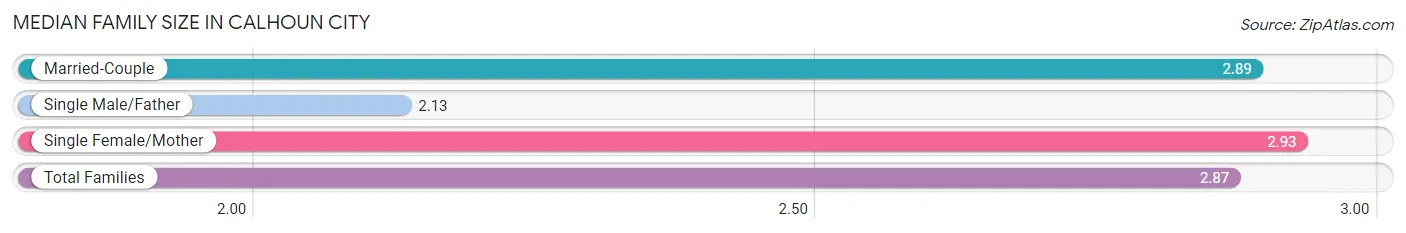
| Family Type | # Families | Family Size |
| Married-Couple | 271 (53.3%) | 2.89 |
| Single Male/Father | 23 (4.5%) | 2.13 |
| Single Female/Mother | 214 (42.1%) | 2.93 |
| Total Families | 508 (100.0%) | 2.87 |
Median Household Size in Calhoun City
The median household size in Calhoun City is 2.37 persons per household, with single female/mother households (214 | 29.3%) accounting for the largest median household size of 3 persons per household. non-family households (223 | 30.5%) represent the smallest median household size with 1.12 persons per household.
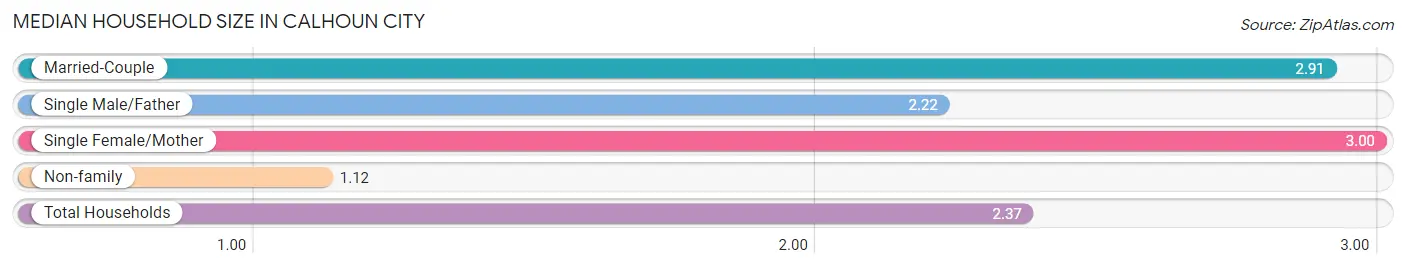
| Household Type | # Households | Household Size |
| Married-Couple | 271 (37.1%) | 2.91 |
| Single Male/Father | 23 (3.2%) | 2.22 |
| Single Female/Mother | 214 (29.3%) | 3.00 |
| Non-family | 223 (30.5%) | 1.12 |
| Total Households | 731 (100.0%) | 2.37 |
Household Size by Marriage Status in Calhoun City
Out of a total of 731 households in Calhoun City, 508 (69.5%) are family households, while 223 (30.5%) are nonfamily households. The most numerous type of family households are 2-person households, comprising 278, and the most common type of nonfamily households are 1-person households, comprising 194.
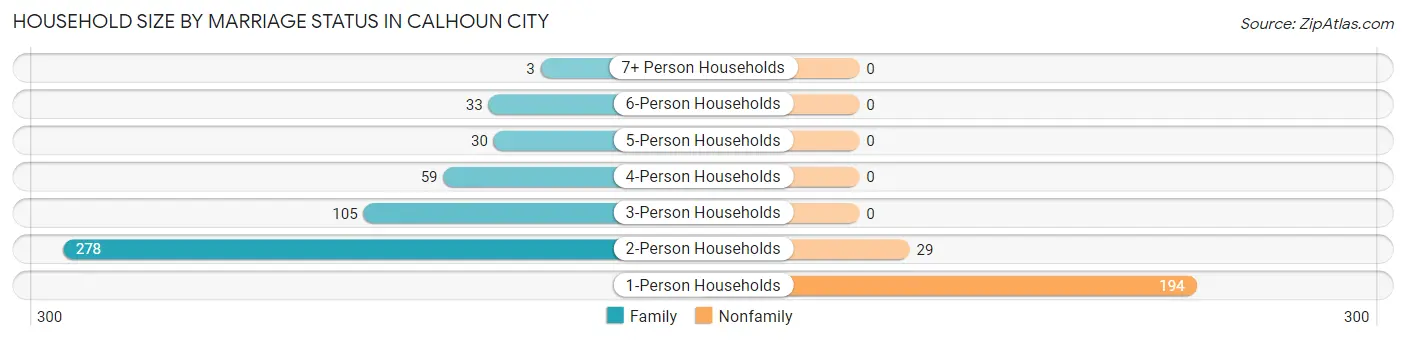
| Household Size | Family Households | Nonfamily Households |
| 1-Person Households | - | 194 (26.5%) |
| 2-Person Households | 278 (38.0%) | 29 (4.0%) |
| 3-Person Households | 105 (14.4%) | 0 (0.0%) |
| 4-Person Households | 59 (8.1%) | 0 (0.0%) |
| 5-Person Households | 30 (4.1%) | 0 (0.0%) |
| 6-Person Households | 33 (4.5%) | 0 (0.0%) |
| 7+ Person Households | 3 (0.4%) | 0 (0.0%) |
| Total | 508 (69.5%) | 223 (30.5%) |
Female Fertility in Calhoun City
Fertility by Age in Calhoun City
Average fertility rate in Calhoun City is 55.0 births per 1,000 women. Women in the age bracket of 20 to 34 years have the highest fertility rate with 104.0 births per 1,000 women. Women in the age bracket of 20 to 34 years acount for 100.0% of all women with births.
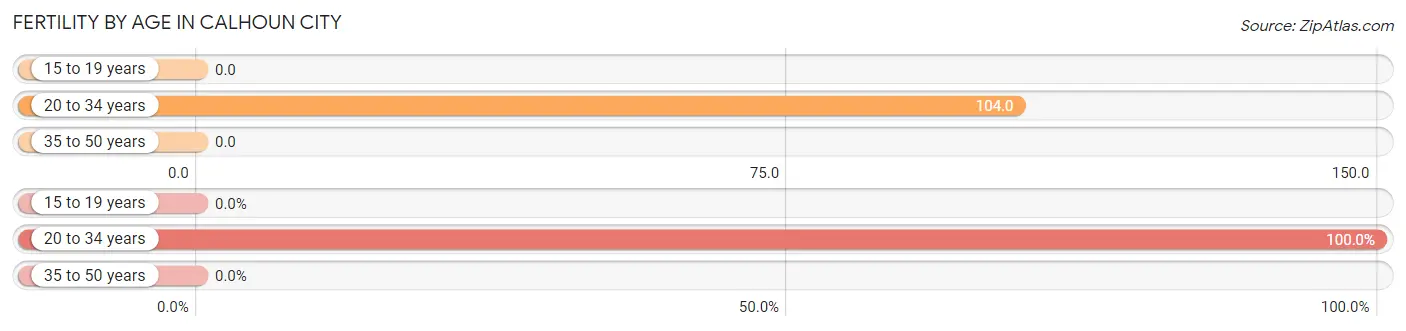
| Age Bracket | Women with Births | Births / 1,000 Women |
| 15 to 19 years | 0 (0.0%) | 0.0 |
| 20 to 34 years | 20 (100.0%) | 104.0 |
| 35 to 50 years | 0 (0.0%) | 0.0 |
| Total | 20 (100.0%) | 55.0 |
Fertility by Age by Marriage Status in Calhoun City
50.0% of women with births (20) in Calhoun City are married. The highest percentage of unmarried women with births falls into 20 to 34 years age bracket with 50.0% of them unmarried at the time of birth, while the lowest percentage of unmarried women with births belong to 20 to 34 years age bracket with 50.0% of them unmarried.
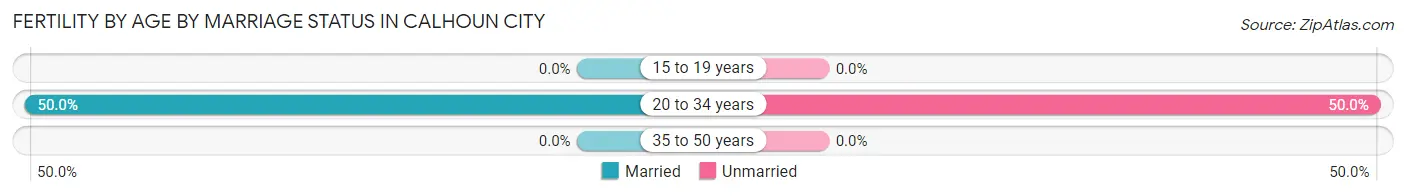
| Age Bracket | Married | Unmarried |
| 15 to 19 years | 0 (0.0%) | 0 (0.0%) |
| 20 to 34 years | 10 (50.0%) | 10 (50.0%) |
| 35 to 50 years | 0 (0.0%) | 0 (0.0%) |
| Total | 10 (50.0%) | 10 (50.0%) |
Fertility by Education in Calhoun City
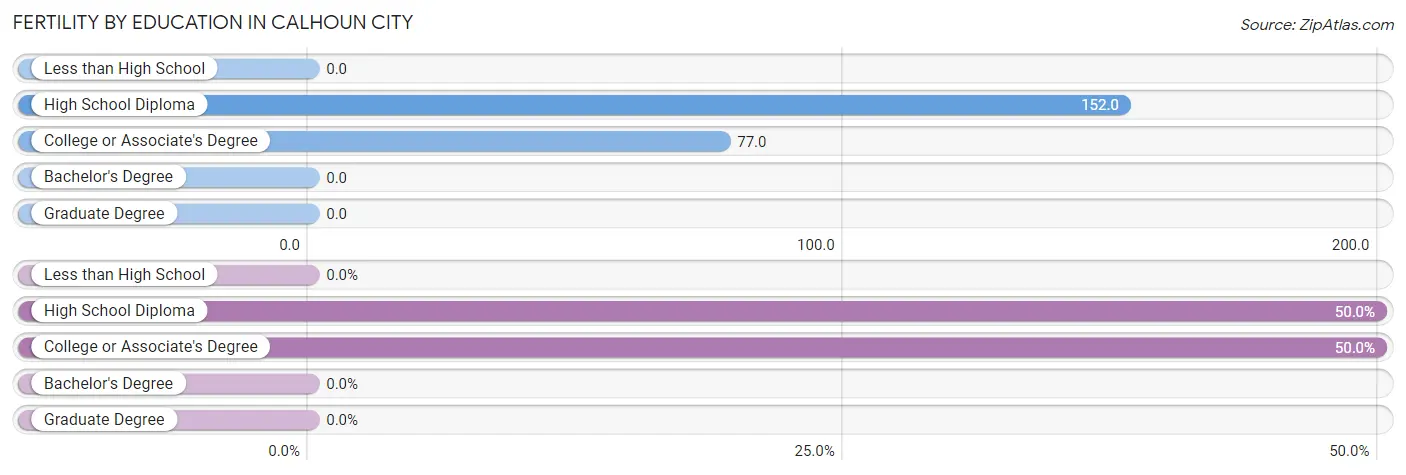
| Educational Attainment | Women with Births | Births / 1,000 Women |
| Less than High School | 0 (0.0%) | 0.0 |
| High School Diploma | 10 (50.0%) | 152.0 |
| College or Associate's Degree | 10 (50.0%) | 77.0 |
| Bachelor's Degree | 0 (0.0%) | 0.0 |
| Graduate Degree | 0 (0.0%) | 0.0 |
| Total | 20 (100.0%) | 55.0 |
Fertility by Education by Marriage Status in Calhoun City
50.0% of women with births in Calhoun City are unmarried. Women with the educational attainment of college or associate's degree are most likely to be married with 100.0% of them married at childbirth, while women with the educational attainment of high school diploma are least likely to be married with 100.0% of them unmarried at childbirth.
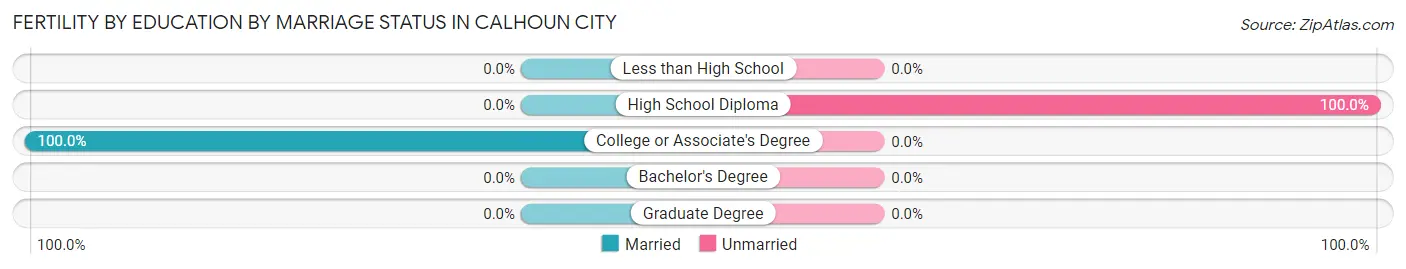
| Educational Attainment | Married | Unmarried |
| Less than High School | 0 (0.0%) | 0 (0.0%) |
| High School Diploma | 0 (0.0%) | 10 (100.0%) |
| College or Associate's Degree | 10 (100.0%) | 0 (0.0%) |
| Bachelor's Degree | 0 (0.0%) | 0 (0.0%) |
| Graduate Degree | 0 (0.0%) | 0 (0.0%) |
| Total | 10 (50.0%) | 10 (50.0%) |
Employment Characteristics in Calhoun City
Employment by Class of Employer in Calhoun City
Among the 682 employed individuals in Calhoun City, private company employees (534 | 78.3%), state government employees (56 | 8.2%), and federal government employees (28 | 4.1%) make up the most common classes of employment.
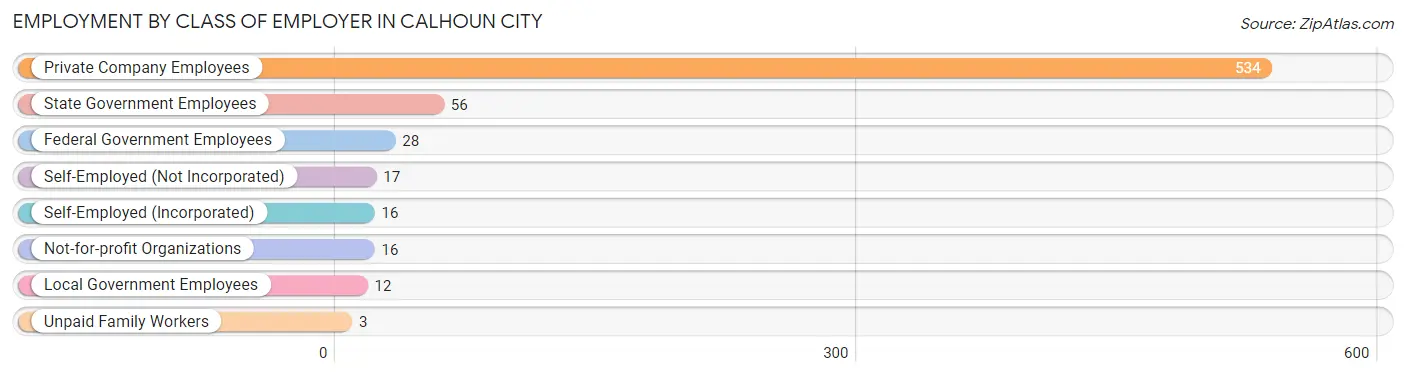
| Employer Class | # Employees | % Employees |
| Private Company Employees | 534 | 78.3% |
| Self-Employed (Incorporated) | 16 | 2.4% |
| Self-Employed (Not Incorporated) | 17 | 2.5% |
| Not-for-profit Organizations | 16 | 2.4% |
| Local Government Employees | 12 | 1.8% |
| State Government Employees | 56 | 8.2% |
| Federal Government Employees | 28 | 4.1% |
| Unpaid Family Workers | 3 | 0.4% |
| Total | 682 | 100.0% |
Employment Status by Age in Calhoun City
According to the labor force statistics for Calhoun City, out of the total population over 16 years of age (1,481), 49.7% or 736 individuals are in the labor force, with 7.2% or 53 of them unemployed. The age group with the highest labor force participation rate is 25 to 29 years, with 100.0% or 81 individuals in the labor force. Within the labor force, the 25 to 29 years age range has the highest percentage of unemployed individuals, with 16.0% or 13 of them being unemployed.
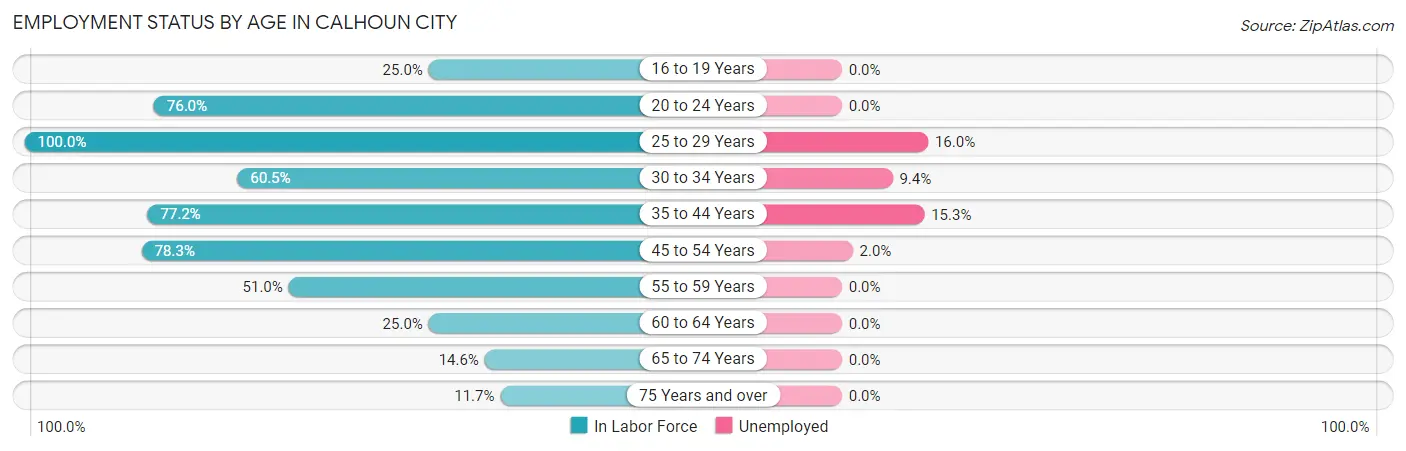
| Age Bracket | In Labor Force | Unemployed |
| 16 to 19 Years | 19 (25.0%) | 0 (0.0%) |
| 20 to 24 Years | 73 (76.0%) | 0 (0.0%) |
| 25 to 29 Years | 81 (100.0%) | 13 (16.0%) |
| 30 to 34 Years | 95 (60.5%) | 9 (9.4%) |
| 35 to 44 Years | 183 (77.2%) | 28 (15.3%) |
| 45 to 54 Years | 148 (78.3%) | 3 (2.0%) |
| 55 to 59 Years | 49 (51.0%) | 0 (0.0%) |
| 60 to 64 Years | 31 (25.0%) | 0 (0.0%) |
| 65 to 74 Years | 36 (14.6%) | 0 (0.0%) |
| 75 Years and over | 21 (11.7%) | 0 (0.0%) |
| Total | 736 (49.7%) | 53 (7.2%) |
Employment Status by Educational Attainment in Calhoun City
According to labor force statistics for Calhoun City, 66.4% of individuals (587) out of the total population between 25 and 64 years of age (884) are in the labor force, with 9.0% or 53 of them being unemployed. The group with the highest labor force participation rate are those with the educational attainment of bachelor's degree or higher, with 90.0% or 108 individuals in the labor force. Within the labor force, individuals with high school diploma education have the highest percentage of unemployment, with 21.4% or 28 of them being unemployed.
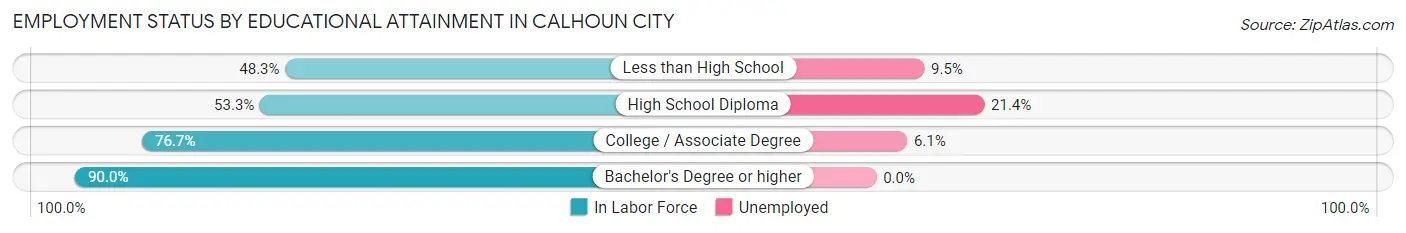
| Educational Attainment | In Labor Force | Unemployed |
| Less than High School | 84 (48.3%) | 17 (9.5%) |
| High School Diploma | 131 (53.3%) | 53 (21.4%) |
| College / Associate Degree | 264 (76.7%) | 21 (6.1%) |
| Bachelor's Degree or higher | 108 (90.0%) | 0 (0.0%) |
| Total | 587 (66.4%) | 80 (9.0%) |
Employment Occupations by Sex in Calhoun City
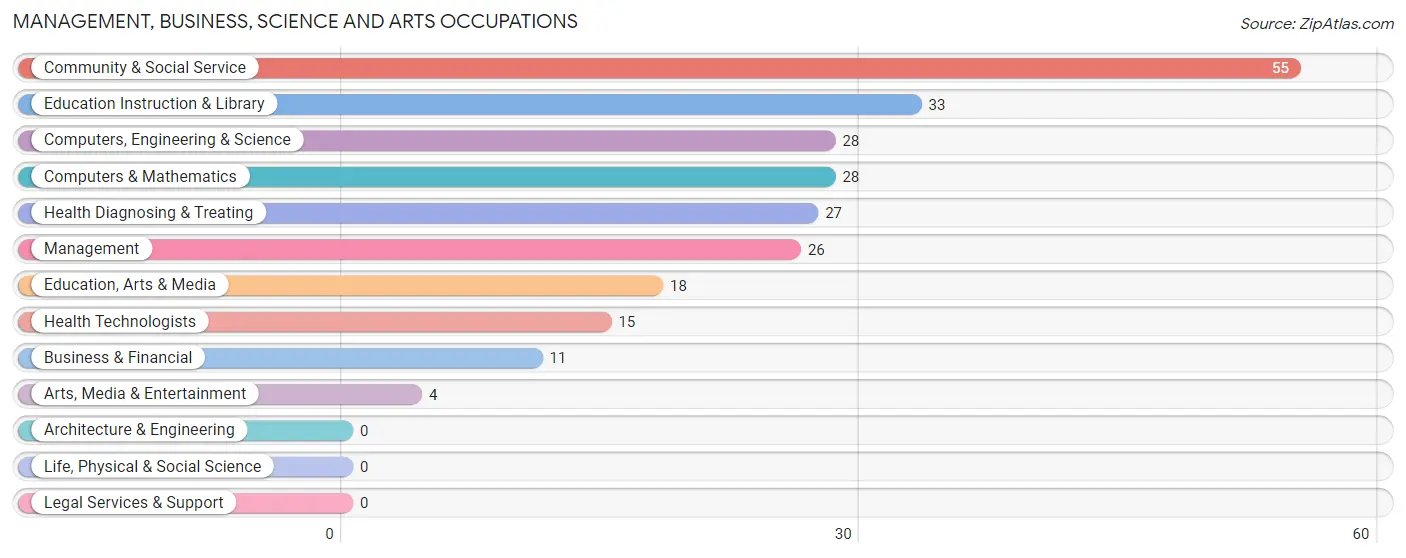
Management, Business, Science and Arts Occupations
The most common Management, Business, Science and Arts occupations in Calhoun City are Community & Social Service (55 | 8.2%), Education Instruction & Library (33 | 4.9%), Computers, Engineering & Science (28 | 4.2%), Computers & Mathematics (28 | 4.2%), and Health Diagnosing & Treating (27 | 4.0%).
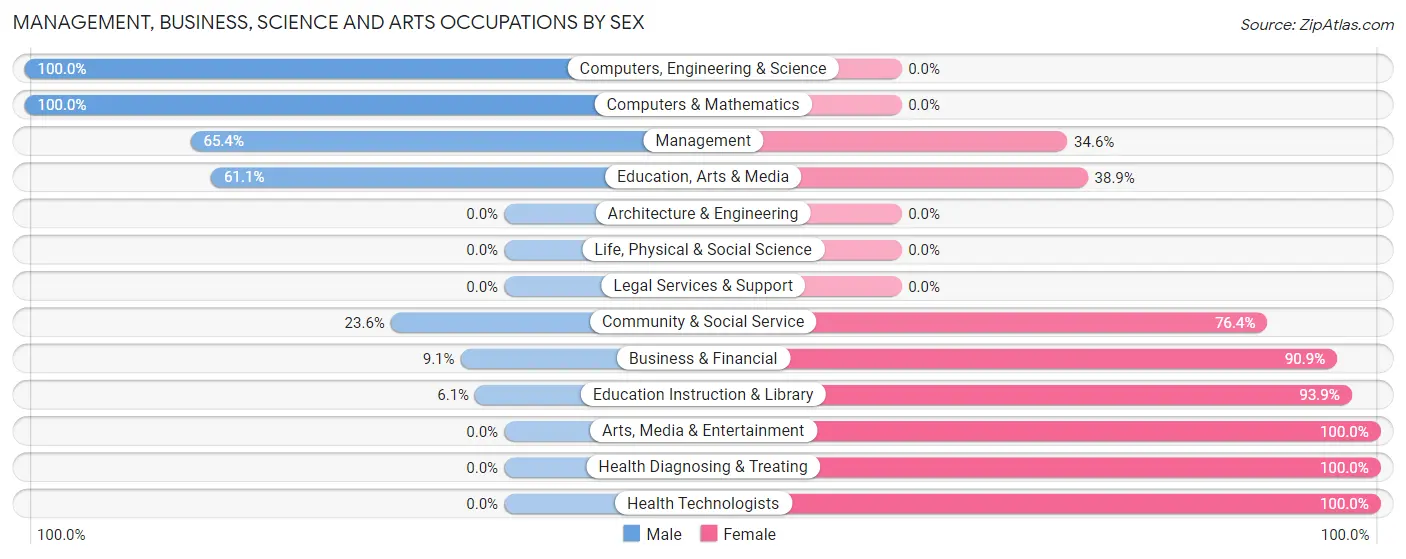
Management, Business, Science and Arts Occupations by Sex
Within the Management, Business, Science and Arts occupations in Calhoun City, the most male-oriented occupations are Computers, Engineering & Science (100.0%), Computers & Mathematics (100.0%), and Management (65.4%), while the most female-oriented occupations are Arts, Media & Entertainment (100.0%), Health Diagnosing & Treating (100.0%), and Health Technologists (100.0%).
| Occupation | Male | Female |
| Management | 17 (65.4%) | 9 (34.6%) |
| Business & Financial | 1 (9.1%) | 10 (90.9%) |
| Computers, Engineering & Science | 28 (100.0%) | 0 (0.0%) |
| Computers & Mathematics | 28 (100.0%) | 0 (0.0%) |
| Architecture & Engineering | 0 (0.0%) | 0 (0.0%) |
| Life, Physical & Social Science | 0 (0.0%) | 0 (0.0%) |
| Community & Social Service | 13 (23.6%) | 42 (76.4%) |
| Education, Arts & Media | 11 (61.1%) | 7 (38.9%) |
| Legal Services & Support | 0 (0.0%) | 0 (0.0%) |
| Education Instruction & Library | 2 (6.1%) | 31 (93.9%) |
| Arts, Media & Entertainment | 0 (0.0%) | 4 (100.0%) |
| Health Diagnosing & Treating | 0 (0.0%) | 27 (100.0%) |
| Health Technologists | 0 (0.0%) | 15 (100.0%) |
| Total (Category) | 59 (40.1%) | 88 (59.9%) |
| Total (Overall) | 353 (52.4%) | 321 (47.6%) |
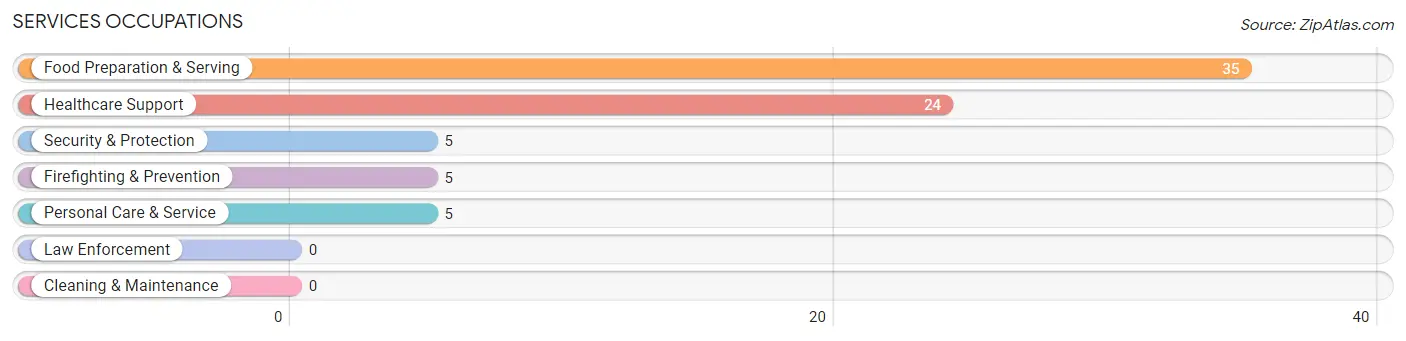
Services Occupations
The most common Services occupations in Calhoun City are Food Preparation & Serving (35 | 5.2%), Healthcare Support (24 | 3.6%), Security & Protection (5 | 0.7%), Firefighting & Prevention (5 | 0.7%), and Personal Care & Service (5 | 0.7%).
Services Occupations by Sex
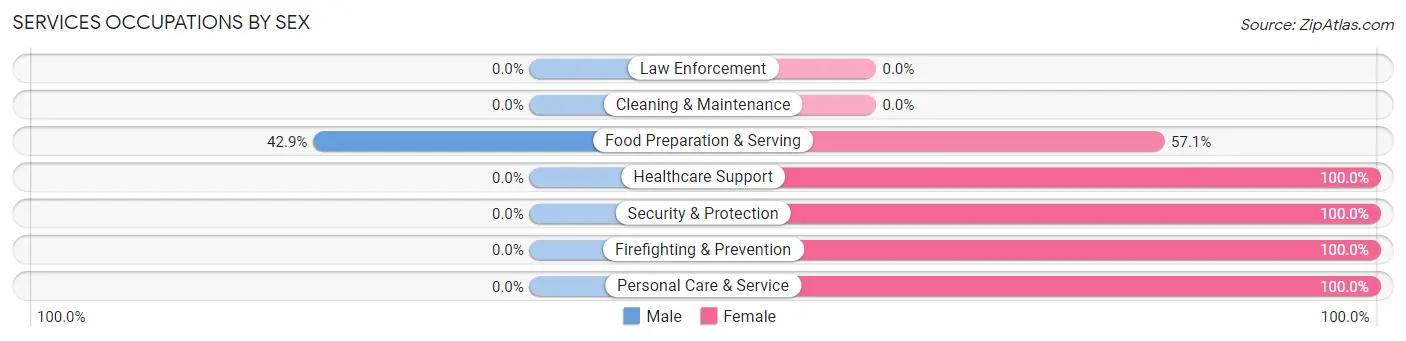
| Occupation | Male | Female |
| Healthcare Support | 0 (0.0%) | 24 (100.0%) |
| Security & Protection | 0 (0.0%) | 5 (100.0%) |
| Firefighting & Prevention | 0 (0.0%) | 5 (100.0%) |
| Law Enforcement | 0 (0.0%) | 0 (0.0%) |
| Food Preparation & Serving | 15 (42.9%) | 20 (57.1%) |
| Cleaning & Maintenance | 0 (0.0%) | 0 (0.0%) |
| Personal Care & Service | 0 (0.0%) | 5 (100.0%) |
| Total (Category) | 15 (21.7%) | 54 (78.3%) |
| Total (Overall) | 353 (52.4%) | 321 (47.6%) |
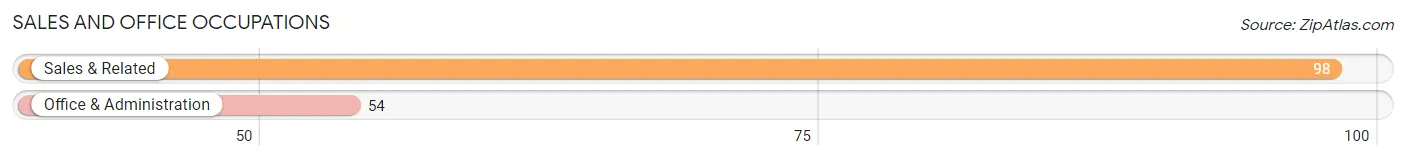
Sales and Office Occupations
The most common Sales and Office occupations in Calhoun City are Sales & Related (98 | 14.5%), and Office & Administration (54 | 8.0%).
Sales and Office Occupations by Sex
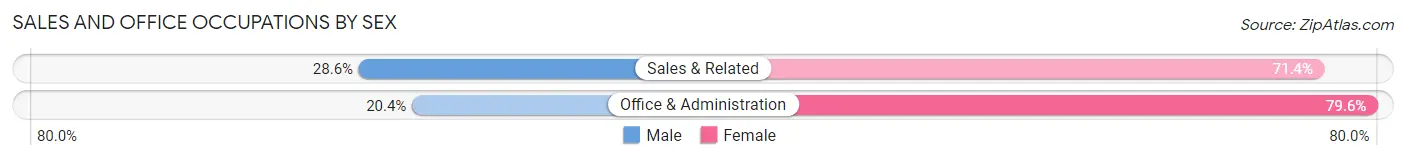
| Occupation | Male | Female |
| Sales & Related | 28 (28.6%) | 70 (71.4%) |
| Office & Administration | 11 (20.4%) | 43 (79.6%) |
| Total (Category) | 39 (25.7%) | 113 (74.3%) |
| Total (Overall) | 353 (52.4%) | 321 (47.6%) |
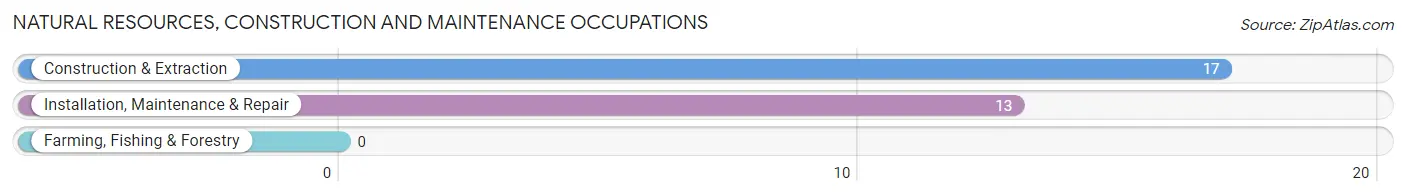
Natural Resources, Construction and Maintenance Occupations
The most common Natural Resources, Construction and Maintenance occupations in Calhoun City are Construction & Extraction (17 | 2.5%), and Installation, Maintenance & Repair (13 | 1.9%).
Natural Resources, Construction and Maintenance Occupations by Sex
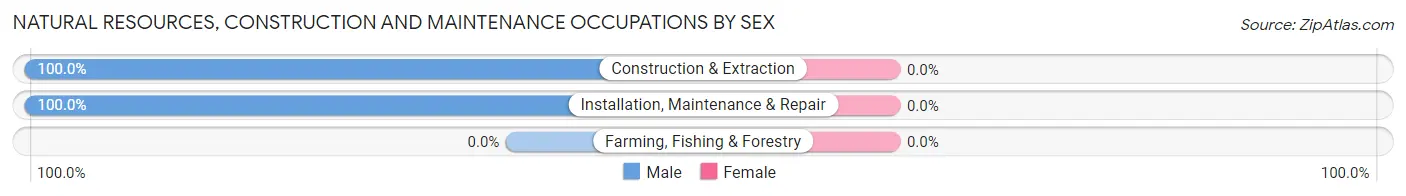
| Occupation | Male | Female |
| Farming, Fishing & Forestry | 0 (0.0%) | 0 (0.0%) |
| Construction & Extraction | 17 (100.0%) | 0 (0.0%) |
| Installation, Maintenance & Repair | 13 (100.0%) | 0 (0.0%) |
| Total (Category) | 30 (100.0%) | 0 (0.0%) |
| Total (Overall) | 353 (52.4%) | 321 (47.6%) |
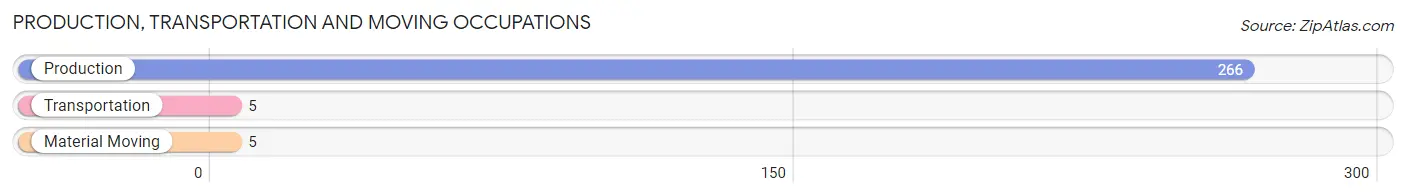
Production, Transportation and Moving Occupations
The most common Production, Transportation and Moving occupations in Calhoun City are Production (266 | 39.5%), Transportation (5 | 0.7%), and Material Moving (5 | 0.7%).
Production, Transportation and Moving Occupations by Sex
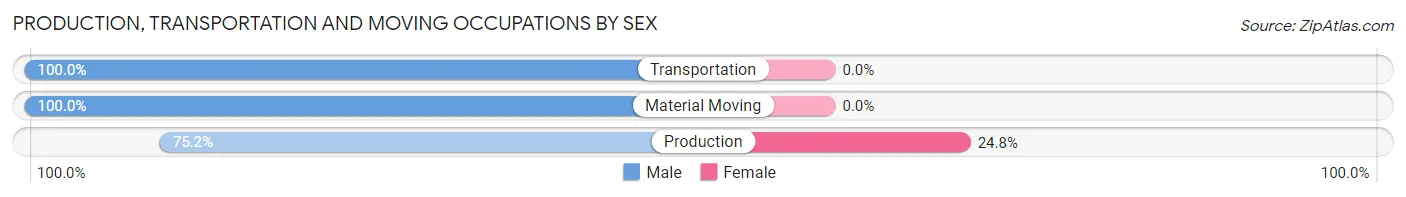
| Occupation | Male | Female |
| Production | 200 (75.2%) | 66 (24.8%) |
| Transportation | 5 (100.0%) | 0 (0.0%) |
| Material Moving | 5 (100.0%) | 0 (0.0%) |
| Total (Category) | 210 (76.1%) | 66 (23.9%) |
| Total (Overall) | 353 (52.4%) | 321 (47.6%) |
Employment Industries by Sex in Calhoun City
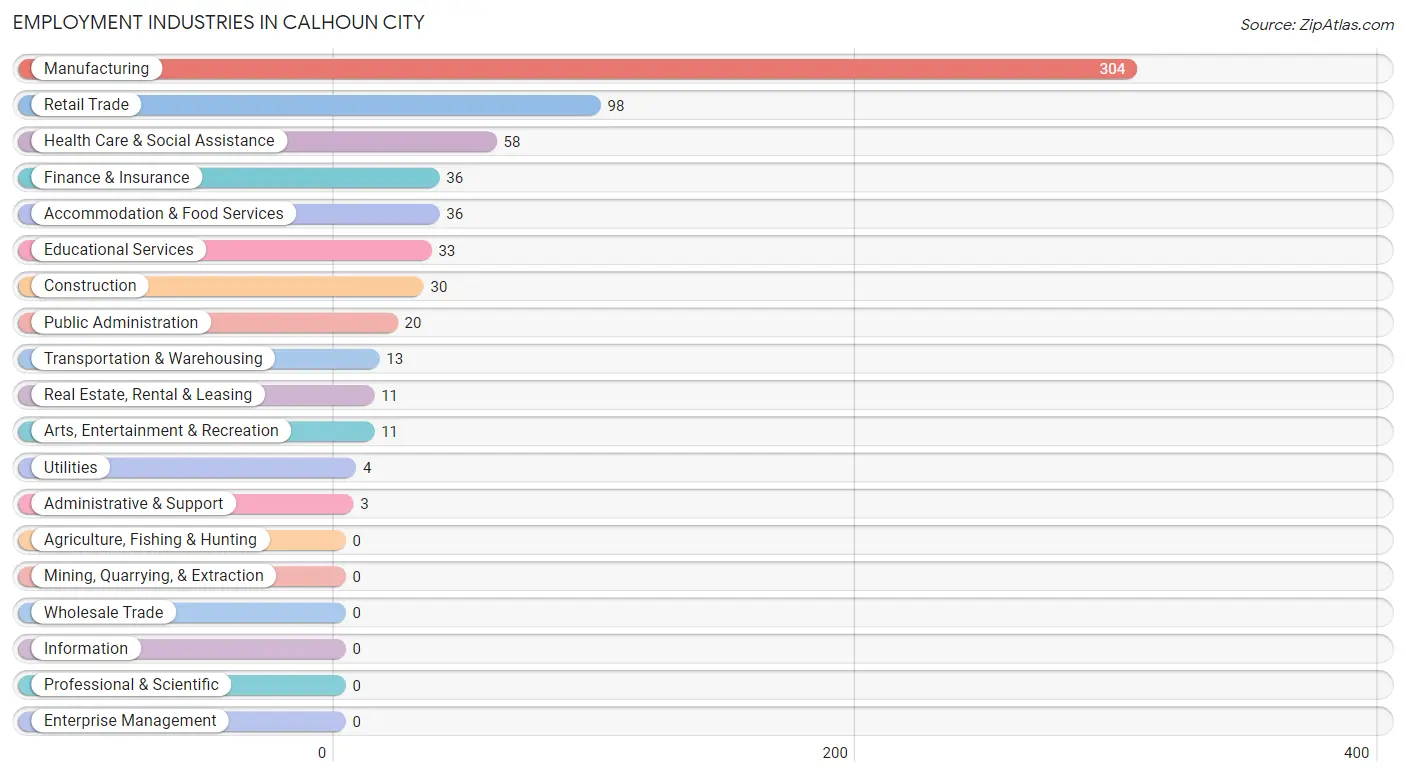
Employment Industries in Calhoun City
The major employment industries in Calhoun City include Manufacturing (304 | 45.1%), Retail Trade (98 | 14.5%), Health Care & Social Assistance (58 | 8.6%), Finance & Insurance (36 | 5.3%), and Accommodation & Food Services (36 | 5.3%).
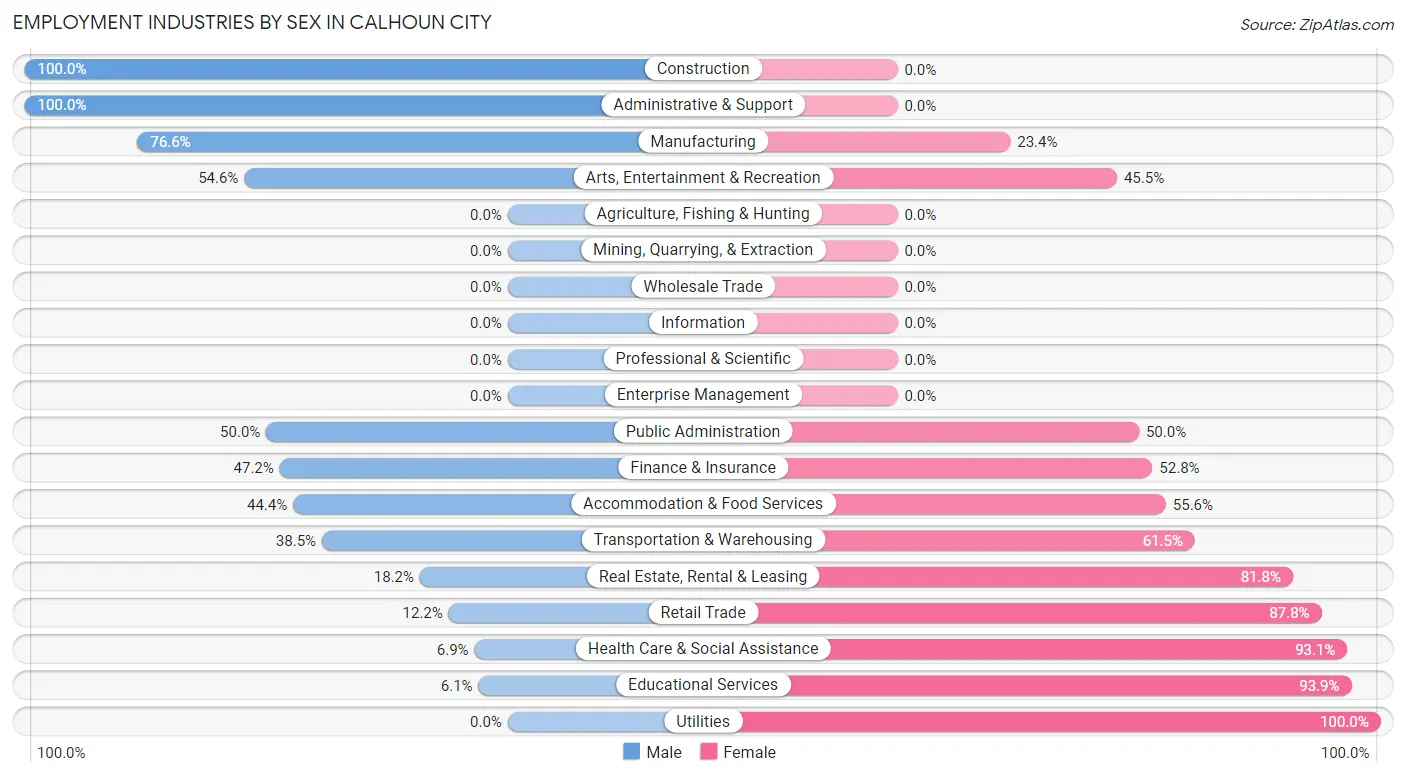
Employment Industries by Sex in Calhoun City
The Calhoun City industries that see more men than women are Construction (100.0%), Administrative & Support (100.0%), and Manufacturing (76.6%), whereas the industries that tend to have a higher number of women are Utilities (100.0%), Educational Services (93.9%), and Health Care & Social Assistance (93.1%).
| Industry | Male | Female |
| Agriculture, Fishing & Hunting | 0 (0.0%) | 0 (0.0%) |
| Mining, Quarrying, & Extraction | 0 (0.0%) | 0 (0.0%) |
| Construction | 30 (100.0%) | 0 (0.0%) |
| Manufacturing | 233 (76.6%) | 71 (23.4%) |
| Wholesale Trade | 0 (0.0%) | 0 (0.0%) |
| Retail Trade | 12 (12.2%) | 86 (87.8%) |
| Transportation & Warehousing | 5 (38.5%) | 8 (61.5%) |
| Utilities | 0 (0.0%) | 4 (100.0%) |
| Information | 0 (0.0%) | 0 (0.0%) |
| Finance & Insurance | 17 (47.2%) | 19 (52.8%) |
| Real Estate, Rental & Leasing | 2 (18.2%) | 9 (81.8%) |
| Professional & Scientific | 0 (0.0%) | 0 (0.0%) |
| Enterprise Management | 0 (0.0%) | 0 (0.0%) |
| Administrative & Support | 3 (100.0%) | 0 (0.0%) |
| Educational Services | 2 (6.1%) | 31 (93.9%) |
| Health Care & Social Assistance | 4 (6.9%) | 54 (93.1%) |
| Arts, Entertainment & Recreation | 6 (54.5%) | 5 (45.5%) |
| Accommodation & Food Services | 16 (44.4%) | 20 (55.6%) |
| Public Administration | 10 (50.0%) | 10 (50.0%) |
| Total | 353 (52.4%) | 321 (47.6%) |
Education in Calhoun City
School Enrollment in Calhoun City
The most common levels of schooling among the 317 students in Calhoun City are middle school (101 | 31.9%), high school (81 | 25.6%), and elementary school (72 | 22.7%).
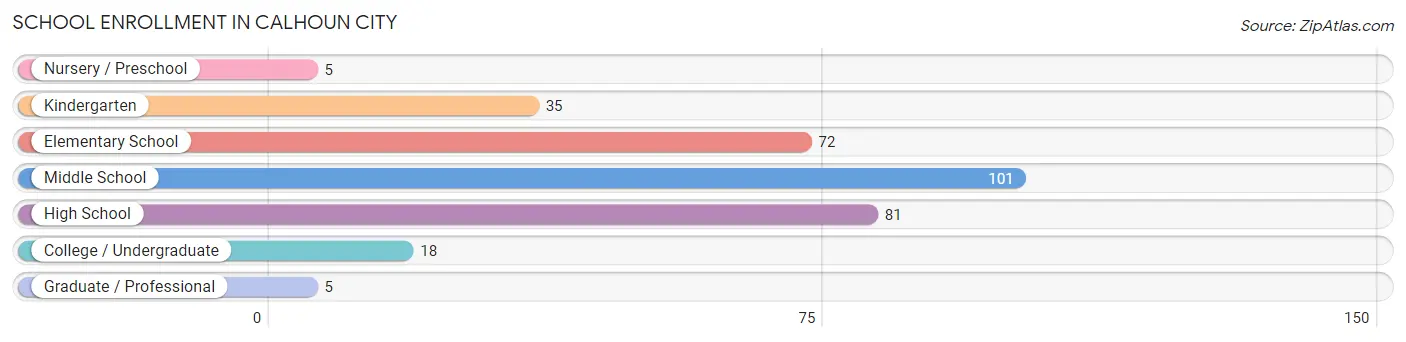
| School Level | # Students | % Students |
| Nursery / Preschool | 5 | 1.6% |
| Kindergarten | 35 | 11.0% |
| Elementary School | 72 | 22.7% |
| Middle School | 101 | 31.9% |
| High School | 81 | 25.6% |
| College / Undergraduate | 18 | 5.7% |
| Graduate / Professional | 5 | 1.6% |
| Total | 317 | 100.0% |
School Enrollment by Age by Funding Source in Calhoun City
Out of a total of 317 students who are enrolled in schools in Calhoun City, 12 (3.8%) attend a private institution, while the remaining 305 (96.2%) are enrolled in public schools. The age group of 15 to 17 year olds has the highest likelihood of being enrolled in private schools, with 8 (12.3% in the age bracket) enrolled. Conversely, the age group of 3 to 4 year olds has the lowest likelihood of being enrolled in a private school, with 15 (100.0% in the age bracket) attending a public institution.
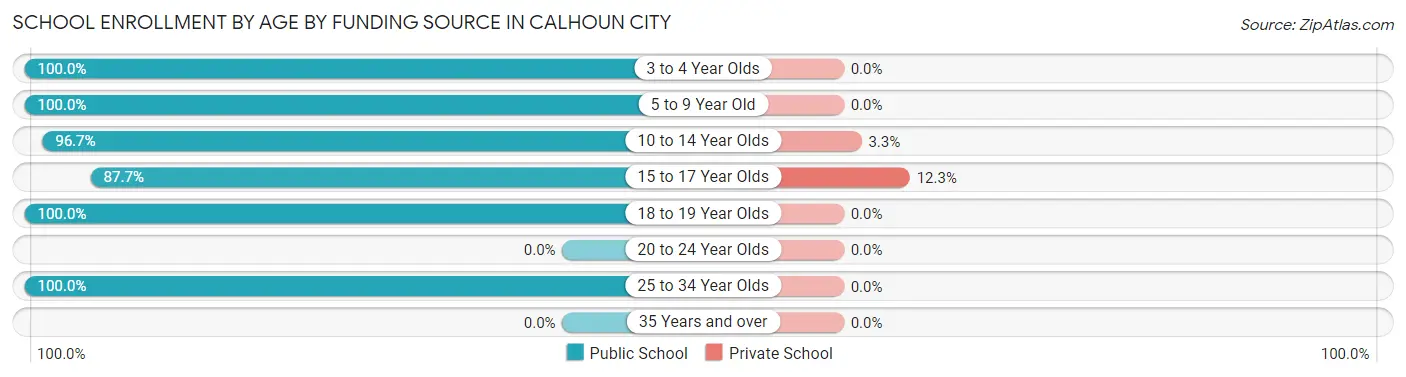
| Age Bracket | Public School | Private School |
| 3 to 4 Year Olds | 15 (100.0%) | 0 (0.0%) |
| 5 to 9 Year Old | 77 (100.0%) | 0 (0.0%) |
| 10 to 14 Year Olds | 117 (96.7%) | 4 (3.3%) |
| 15 to 17 Year Olds | 57 (87.7%) | 8 (12.3%) |
| 18 to 19 Year Olds | 24 (100.0%) | 0 (0.0%) |
| 20 to 24 Year Olds | 0 (0.0%) | 0 (0.0%) |
| 25 to 34 Year Olds | 15 (100.0%) | 0 (0.0%) |
| 35 Years and over | 0 (0.0%) | 0 (0.0%) |
| Total | 305 (96.2%) | 12 (3.8%) |
Educational Attainment by Field of Study in Calhoun City
Business (60 | 32.6%), education (59 | 32.1%), bio, nature & agricultural (20 | 10.9%), liberal arts & history (18 | 9.8%), and science & technology (11 | 6.0%) are the most common fields of study among 184 individuals in Calhoun City who have obtained a bachelor's degree or higher.
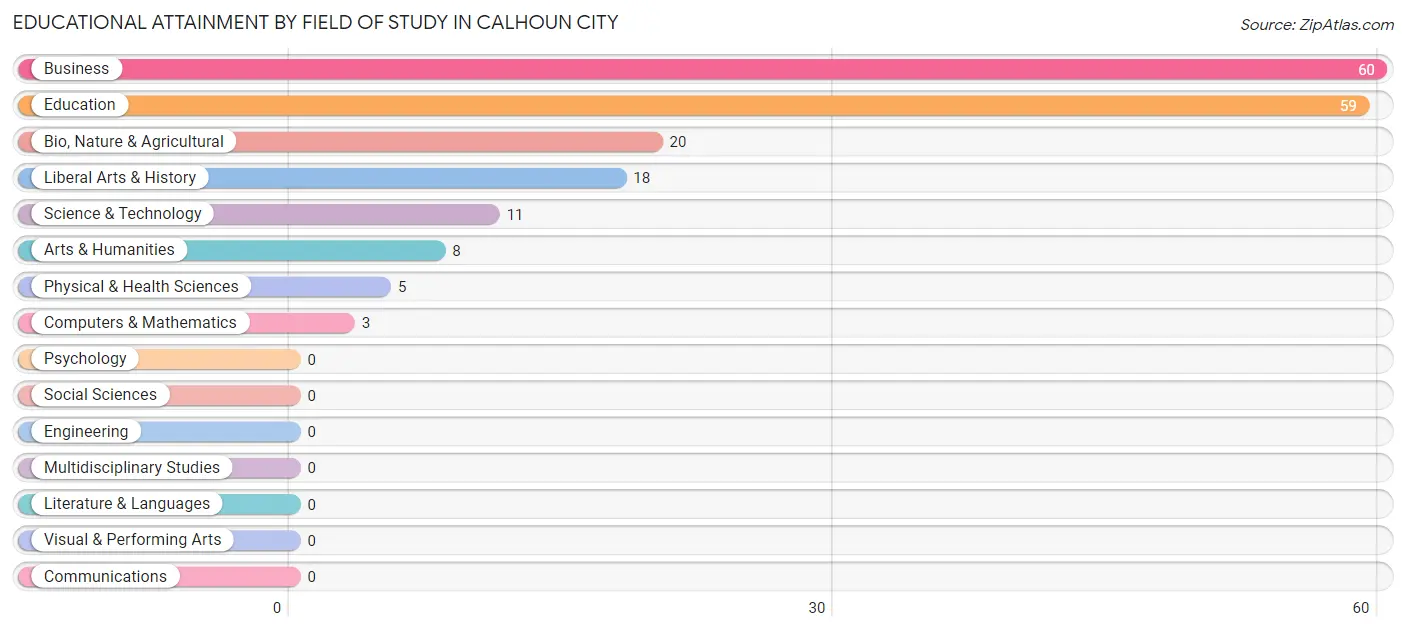
| Field of Study | # Graduates | % Graduates |
| Computers & Mathematics | 3 | 1.6% |
| Bio, Nature & Agricultural | 20 | 10.9% |
| Physical & Health Sciences | 5 | 2.7% |
| Psychology | 0 | 0.0% |
| Social Sciences | 0 | 0.0% |
| Engineering | 0 | 0.0% |
| Multidisciplinary Studies | 0 | 0.0% |
| Science & Technology | 11 | 6.0% |
| Business | 60 | 32.6% |
| Education | 59 | 32.1% |
| Literature & Languages | 0 | 0.0% |
| Liberal Arts & History | 18 | 9.8% |
| Visual & Performing Arts | 0 | 0.0% |
| Communications | 0 | 0.0% |
| Arts & Humanities | 8 | 4.3% |
| Total | 184 | 100.0% |
Transportation & Commute in Calhoun City
Vehicle Availability by Sex in Calhoun City
The most prevalent vehicle ownership categories in Calhoun City are males with 2 vehicles (210, accounting for 59.5%) and females with 2 vehicles (133, making up 63.8%).
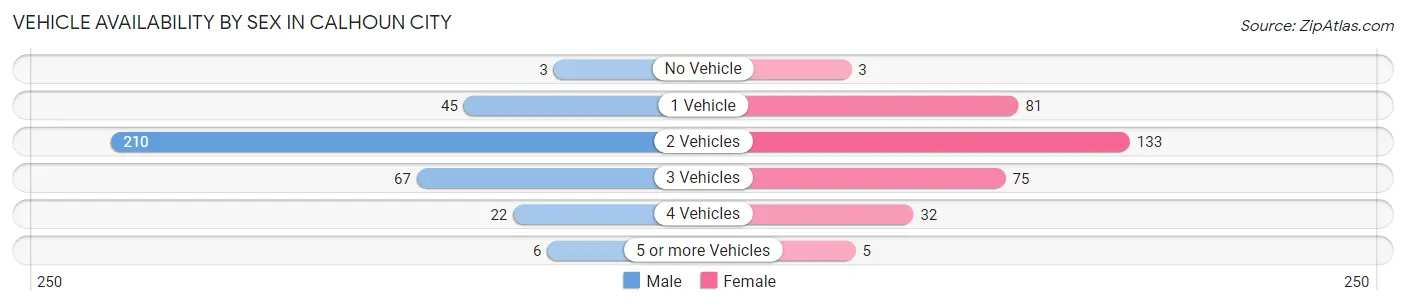
| Vehicles Available | Male | Female |
| No Vehicle | 3 (0.9%) | 3 (0.9%) |
| 1 Vehicle | 45 (12.8%) | 81 (24.6%) |
| 2 Vehicles | 210 (59.5%) | 133 (40.4%) |
| 3 Vehicles | 67 (19.0%) | 75 (22.8%) |
| 4 Vehicles | 22 (6.2%) | 32 (9.7%) |
| 5 or more Vehicles | 6 (1.7%) | 5 (1.5%) |
| Total | 353 (100.0%) | 329 (100.0%) |
Commute Time in Calhoun City
The most frequently occuring commute durations in Calhoun City are 5 to 9 minutes (151 commuters, 22.2%), 60 to 89 minutes (126 commuters, 18.5%), and 45 to 59 minutes (88 commuters, 12.9%).
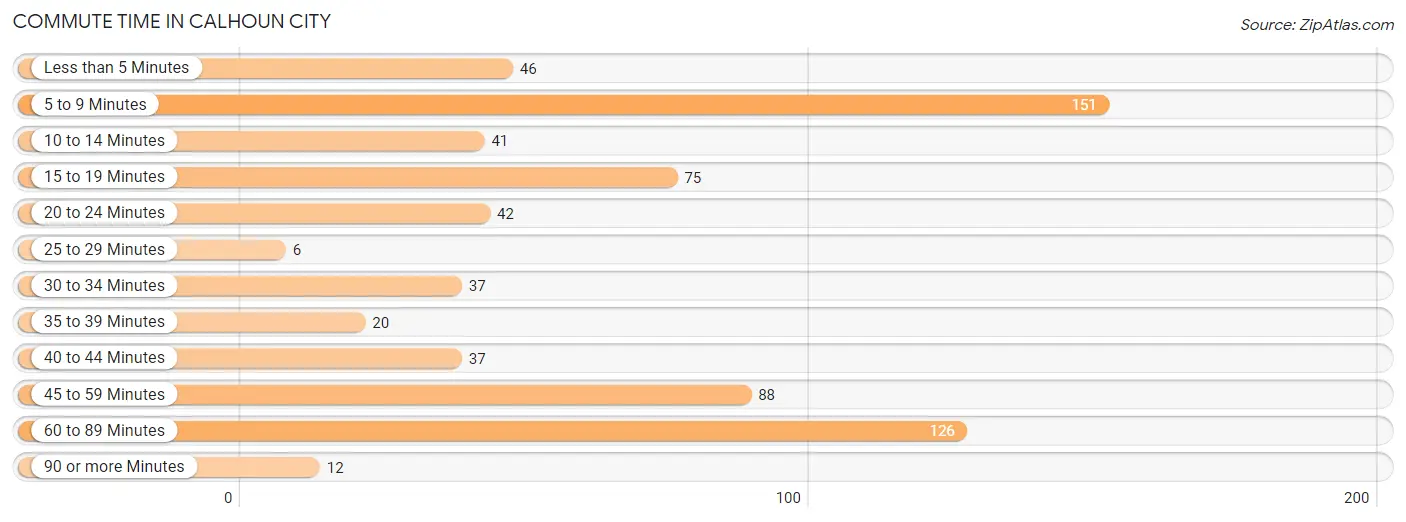
| Commute Time | # Commuters | % Commuters |
| Less than 5 Minutes | 46 | 6.8% |
| 5 to 9 Minutes | 151 | 22.2% |
| 10 to 14 Minutes | 41 | 6.0% |
| 15 to 19 Minutes | 75 | 11.0% |
| 20 to 24 Minutes | 42 | 6.2% |
| 25 to 29 Minutes | 6 | 0.9% |
| 30 to 34 Minutes | 37 | 5.4% |
| 35 to 39 Minutes | 20 | 2.9% |
| 40 to 44 Minutes | 37 | 5.4% |
| 45 to 59 Minutes | 88 | 12.9% |
| 60 to 89 Minutes | 126 | 18.5% |
| 90 or more Minutes | 12 | 1.8% |
Commute Time by Sex in Calhoun City
The most common commute times in Calhoun City are 60 to 89 minutes (107 commuters, 30.4%) for males and 5 to 9 minutes (96 commuters, 29.2%) for females.
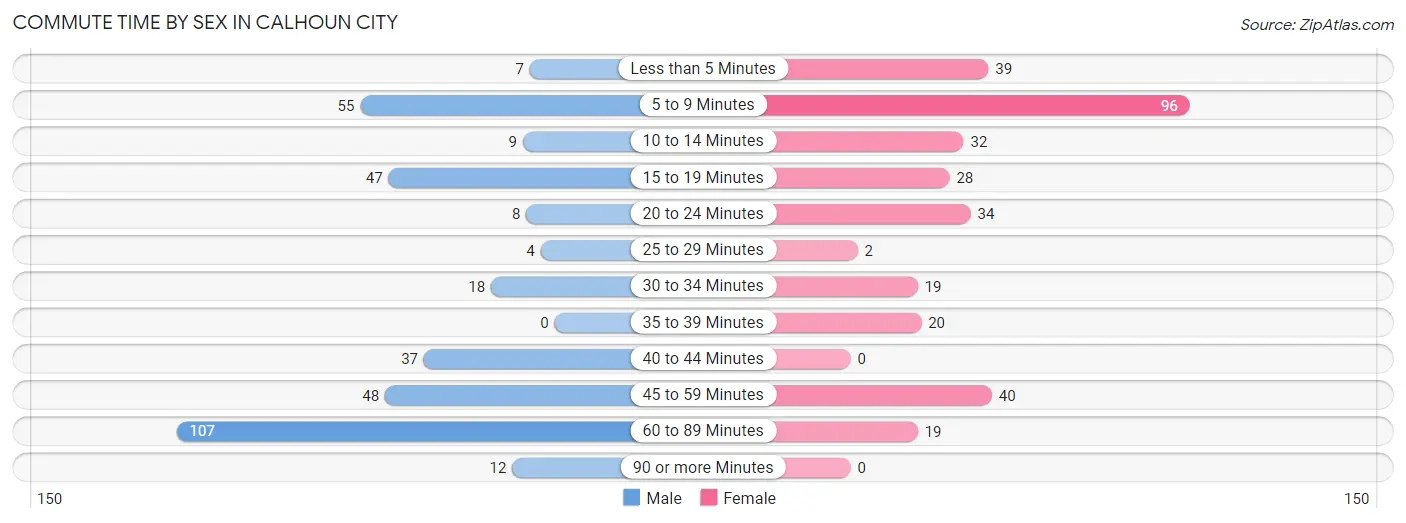
| Commute Time | Male | Female |
| Less than 5 Minutes | 7 (2.0%) | 39 (11.8%) |
| 5 to 9 Minutes | 55 (15.6%) | 96 (29.2%) |
| 10 to 14 Minutes | 9 (2.6%) | 32 (9.7%) |
| 15 to 19 Minutes | 47 (13.4%) | 28 (8.5%) |
| 20 to 24 Minutes | 8 (2.3%) | 34 (10.3%) |
| 25 to 29 Minutes | 4 (1.1%) | 2 (0.6%) |
| 30 to 34 Minutes | 18 (5.1%) | 19 (5.8%) |
| 35 to 39 Minutes | 0 (0.0%) | 20 (6.1%) |
| 40 to 44 Minutes | 37 (10.5%) | 0 (0.0%) |
| 45 to 59 Minutes | 48 (13.6%) | 40 (12.2%) |
| 60 to 89 Minutes | 107 (30.4%) | 19 (5.8%) |
| 90 or more Minutes | 12 (3.4%) | 0 (0.0%) |
Time of Departure to Work by Sex in Calhoun City
The most frequent times of departure to work in Calhoun City are 5:00 AM to 5:29 AM (110, 31.2%) for males and 7:30 AM to 7:59 AM (74, 22.5%) for females.
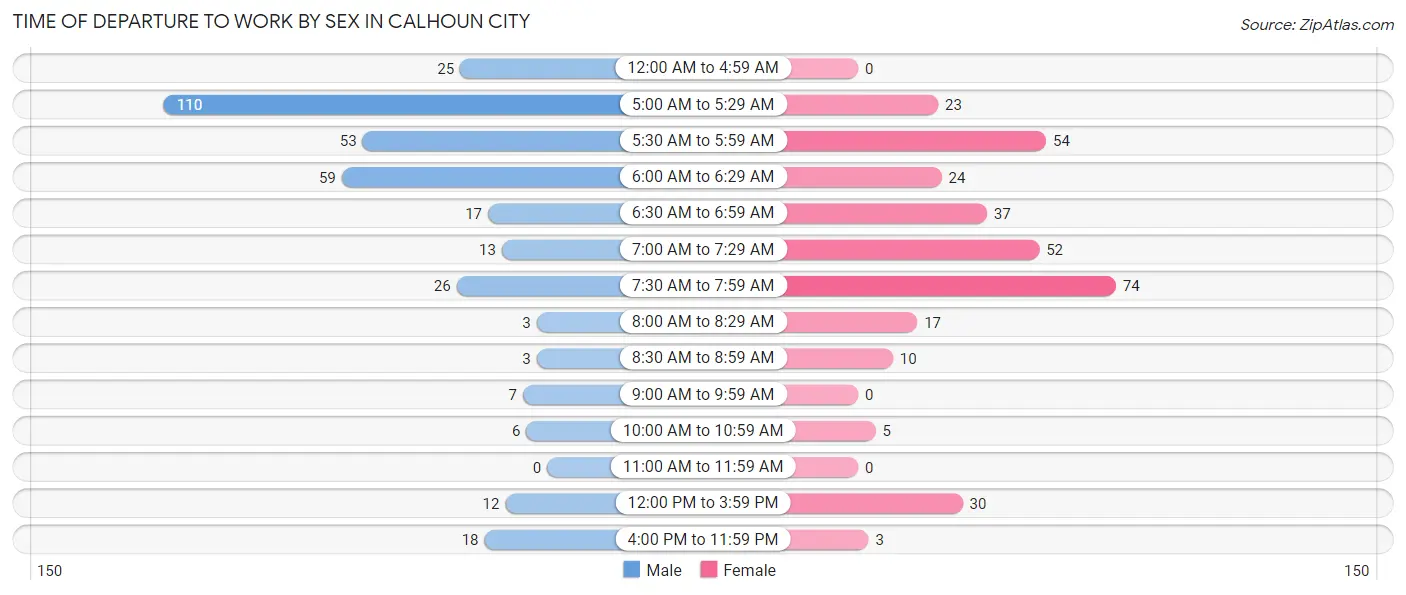
| Time of Departure | Male | Female |
| 12:00 AM to 4:59 AM | 25 (7.1%) | 0 (0.0%) |
| 5:00 AM to 5:29 AM | 110 (31.2%) | 23 (7.0%) |
| 5:30 AM to 5:59 AM | 53 (15.1%) | 54 (16.4%) |
| 6:00 AM to 6:29 AM | 59 (16.8%) | 24 (7.3%) |
| 6:30 AM to 6:59 AM | 17 (4.8%) | 37 (11.3%) |
| 7:00 AM to 7:29 AM | 13 (3.7%) | 52 (15.8%) |
| 7:30 AM to 7:59 AM | 26 (7.4%) | 74 (22.5%) |
| 8:00 AM to 8:29 AM | 3 (0.9%) | 17 (5.2%) |
| 8:30 AM to 8:59 AM | 3 (0.9%) | 10 (3.0%) |
| 9:00 AM to 9:59 AM | 7 (2.0%) | 0 (0.0%) |
| 10:00 AM to 10:59 AM | 6 (1.7%) | 5 (1.5%) |
| 11:00 AM to 11:59 AM | 0 (0.0%) | 0 (0.0%) |
| 12:00 PM to 3:59 PM | 12 (3.4%) | 30 (9.1%) |
| 4:00 PM to 11:59 PM | 18 (5.1%) | 3 (0.9%) |
| Total | 352 (100.0%) | 329 (100.0%) |
Housing Occupancy in Calhoun City
Occupancy by Ownership in Calhoun City
Of the total 731 dwellings in Calhoun City, owner-occupied units account for 434 (59.4%), while renter-occupied units make up 297 (40.6%).
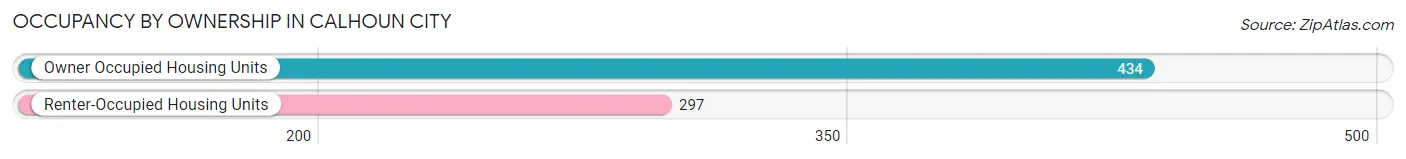
| Occupancy | # Housing Units | % Housing Units |
| Owner Occupied Housing Units | 434 | 59.4% |
| Renter-Occupied Housing Units | 297 | 40.6% |
| Total Occupied Housing Units | 731 | 100.0% |
Occupancy by Household Size in Calhoun City
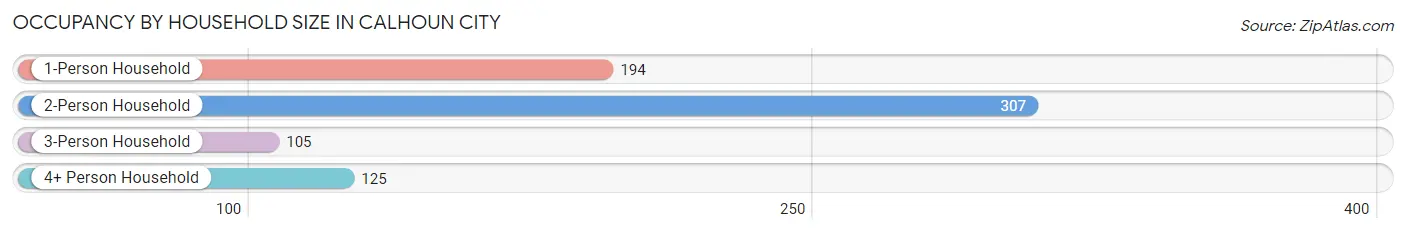
| Household Size | # Housing Units | % Housing Units |
| 1-Person Household | 194 | 26.5% |
| 2-Person Household | 307 | 42.0% |
| 3-Person Household | 105 | 14.4% |
| 4+ Person Household | 125 | 17.1% |
| Total Housing Units | 731 | 100.0% |
Occupancy by Ownership by Household Size in Calhoun City
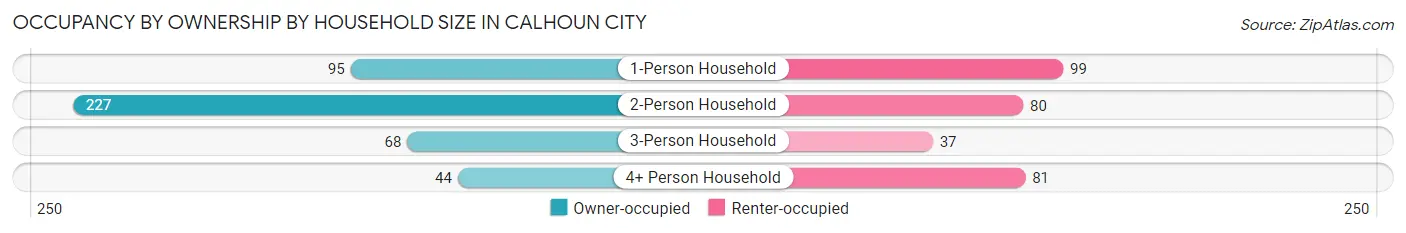
| Household Size | Owner-occupied | Renter-occupied |
| 1-Person Household | 95 (49.0%) | 99 (51.0%) |
| 2-Person Household | 227 (73.9%) | 80 (26.1%) |
| 3-Person Household | 68 (64.8%) | 37 (35.2%) |
| 4+ Person Household | 44 (35.2%) | 81 (64.8%) |
| Total Housing Units | 434 (59.4%) | 297 (40.6%) |
Occupancy by Educational Attainment in Calhoun City
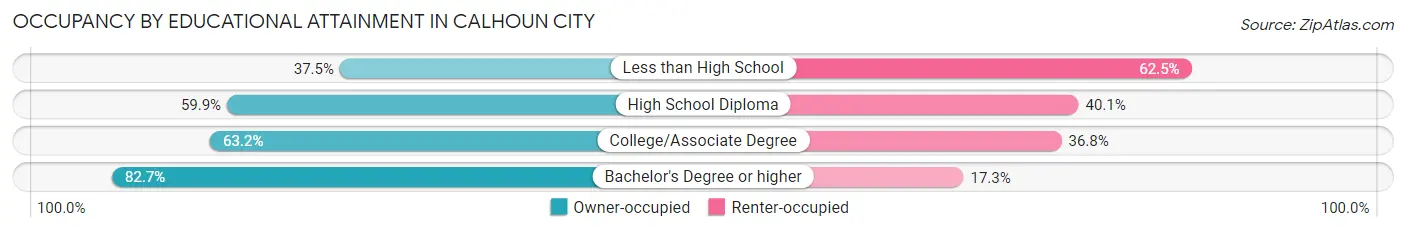
| Household Size | Owner-occupied | Renter-occupied |
| Less than High School | 69 (37.5%) | 115 (62.5%) |
| High School Diploma | 100 (59.9%) | 67 (40.1%) |
| College/Associate Degree | 160 (63.2%) | 93 (36.8%) |
| Bachelor's Degree or higher | 105 (82.7%) | 22 (17.3%) |
Occupancy by Age of Householder in Calhoun City
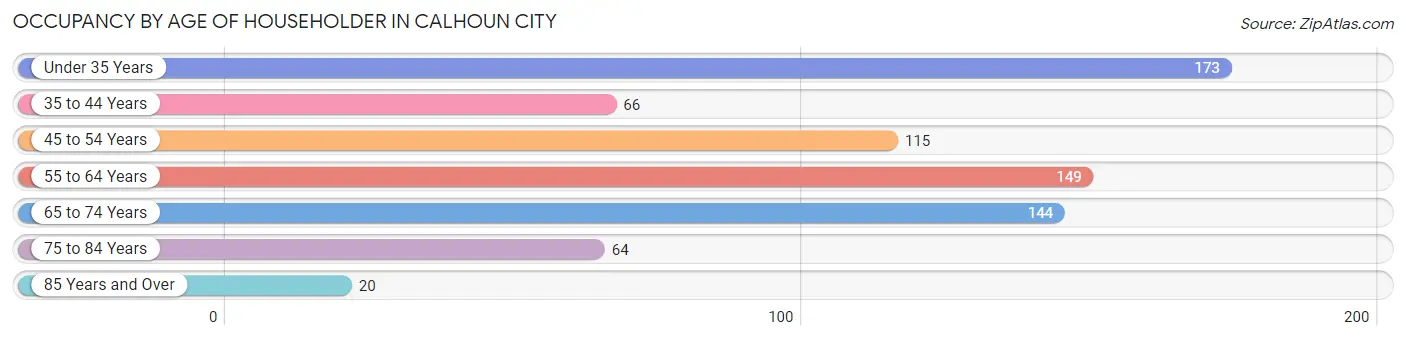
| Age Bracket | # Households | % Households |
| Under 35 Years | 173 | 23.7% |
| 35 to 44 Years | 66 | 9.0% |
| 45 to 54 Years | 115 | 15.7% |
| 55 to 64 Years | 149 | 20.4% |
| 65 to 74 Years | 144 | 19.7% |
| 75 to 84 Years | 64 | 8.8% |
| 85 Years and Over | 20 | 2.7% |
| Total | 731 | 100.0% |
Housing Finances in Calhoun City
Median Income by Occupancy in Calhoun City
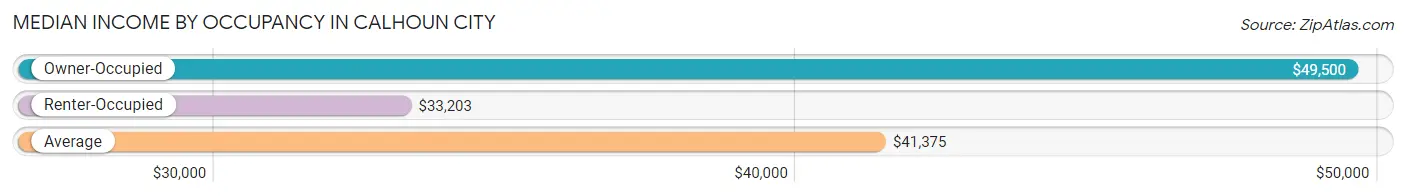
| Occupancy Type | # Households | Median Income |
| Owner-Occupied | 434 (59.4%) | $49,500 |
| Renter-Occupied | 297 (40.6%) | $33,203 |
| Average | 731 (100.0%) | $41,375 |
Occupancy by Householder Income Bracket in Calhoun City
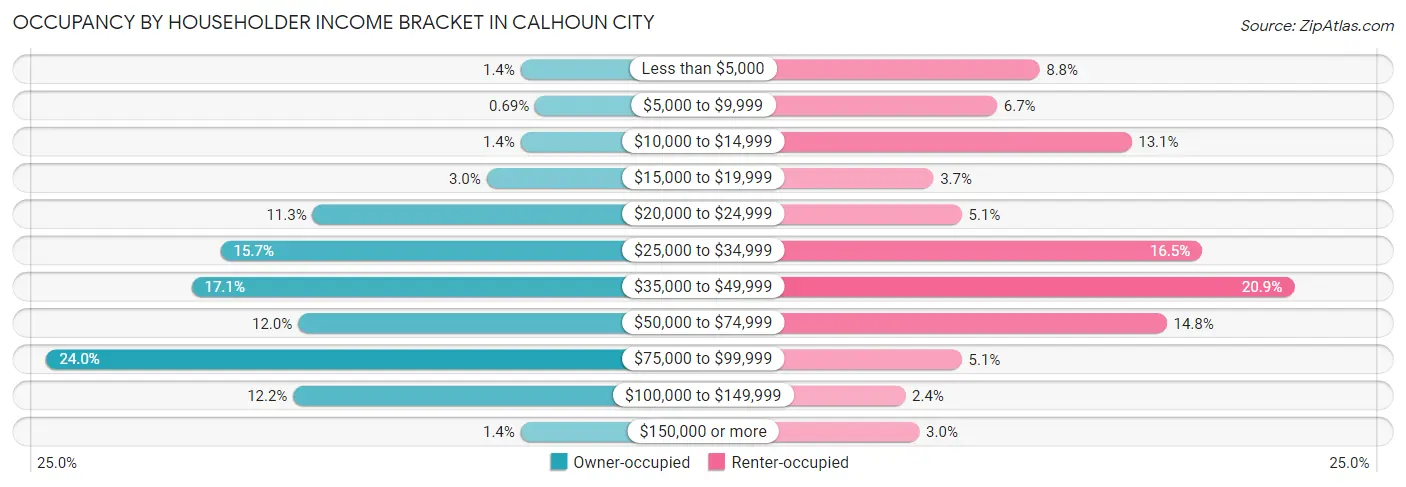
| Income Bracket | Owner-occupied | Renter-occupied |
| Less than $5,000 | 6 (1.4%) | 26 (8.7%) |
| $5,000 to $9,999 | 3 (0.7%) | 20 (6.7%) |
| $10,000 to $14,999 | 6 (1.4%) | 39 (13.1%) |
| $15,000 to $19,999 | 13 (3.0%) | 11 (3.7%) |
| $20,000 to $24,999 | 49 (11.3%) | 15 (5.1%) |
| $25,000 to $34,999 | 68 (15.7%) | 49 (16.5%) |
| $35,000 to $49,999 | 74 (17.1%) | 62 (20.9%) |
| $50,000 to $74,999 | 52 (12.0%) | 44 (14.8%) |
| $75,000 to $99,999 | 104 (24.0%) | 15 (5.1%) |
| $100,000 to $149,999 | 53 (12.2%) | 7 (2.4%) |
| $150,000 or more | 6 (1.4%) | 9 (3.0%) |
| Total | 434 (100.0%) | 297 (100.0%) |
Monthly Housing Cost Tiers in Calhoun City
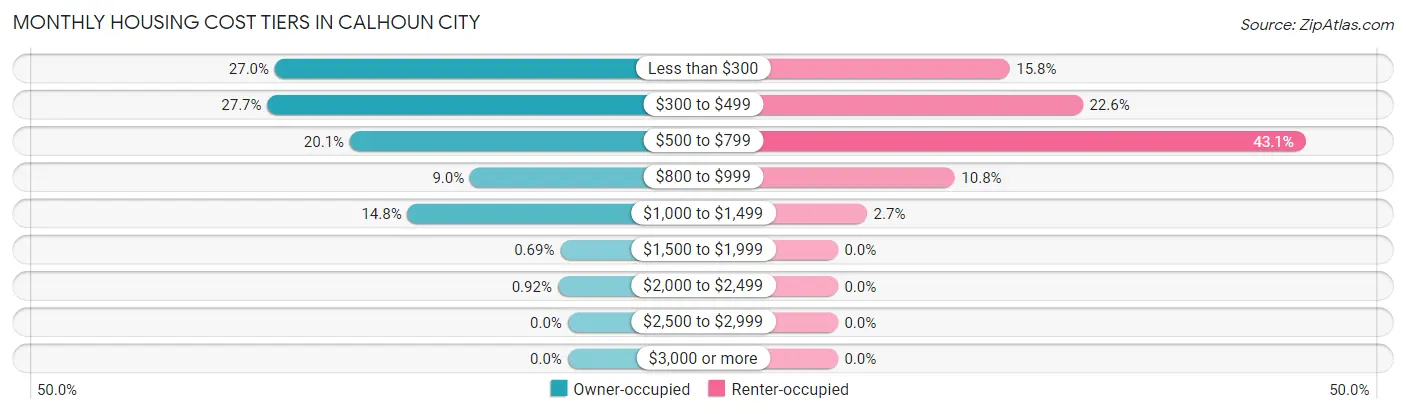
| Monthly Cost | Owner-occupied | Renter-occupied |
| Less than $300 | 117 (27.0%) | 47 (15.8%) |
| $300 to $499 | 120 (27.7%) | 67 (22.6%) |
| $500 to $799 | 87 (20.1%) | 128 (43.1%) |
| $800 to $999 | 39 (9.0%) | 32 (10.8%) |
| $1,000 to $1,499 | 64 (14.7%) | 8 (2.7%) |
| $1,500 to $1,999 | 3 (0.7%) | 0 (0.0%) |
| $2,000 to $2,499 | 4 (0.9%) | 0 (0.0%) |
| $2,500 to $2,999 | 0 (0.0%) | 0 (0.0%) |
| $3,000 or more | 0 (0.0%) | 0 (0.0%) |
| Total | 434 (100.0%) | 297 (100.0%) |
Physical Housing Characteristics in Calhoun City
Housing Structures in Calhoun City
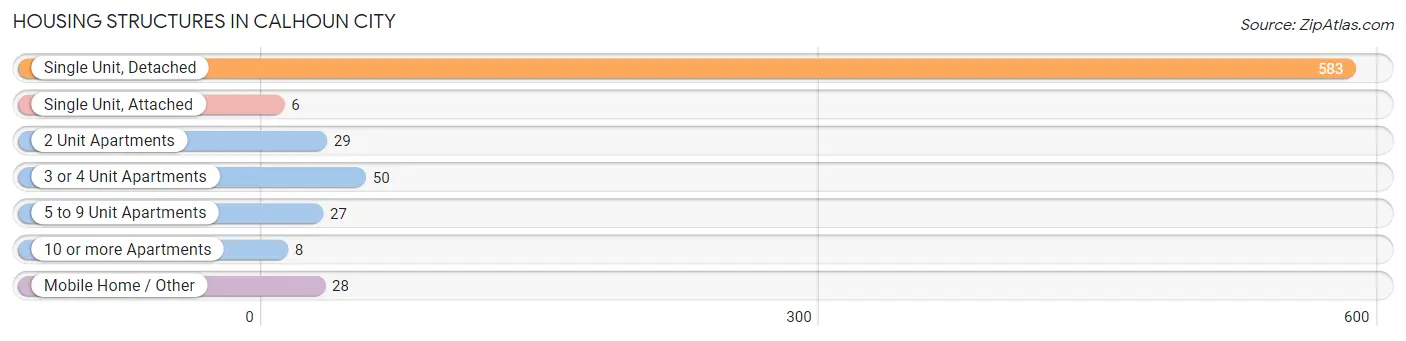
| Structure Type | # Housing Units | % Housing Units |
| Single Unit, Detached | 583 | 79.7% |
| Single Unit, Attached | 6 | 0.8% |
| 2 Unit Apartments | 29 | 4.0% |
| 3 or 4 Unit Apartments | 50 | 6.8% |
| 5 to 9 Unit Apartments | 27 | 3.7% |
| 10 or more Apartments | 8 | 1.1% |
| Mobile Home / Other | 28 | 3.8% |
| Total | 731 | 100.0% |
Housing Structures by Occupancy in Calhoun City
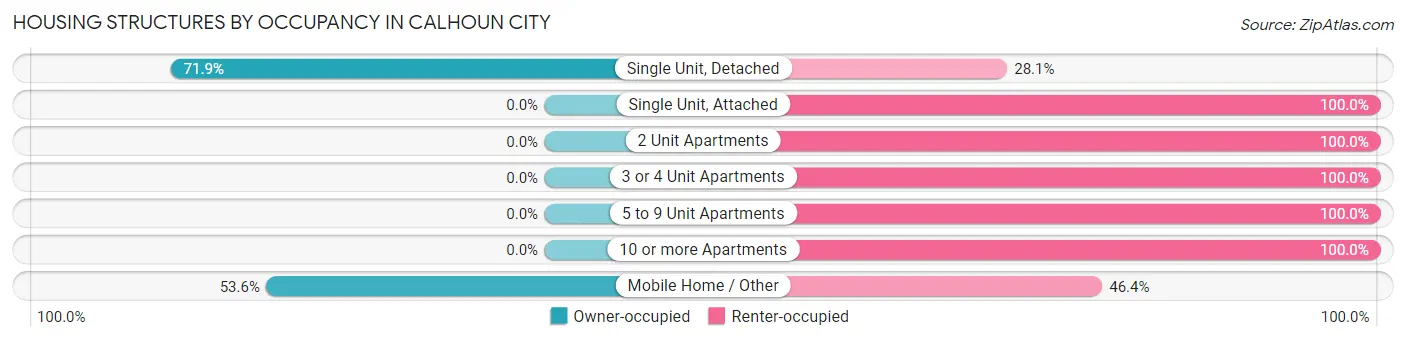
| Structure Type | Owner-occupied | Renter-occupied |
| Single Unit, Detached | 419 (71.9%) | 164 (28.1%) |
| Single Unit, Attached | 0 (0.0%) | 6 (100.0%) |
| 2 Unit Apartments | 0 (0.0%) | 29 (100.0%) |
| 3 or 4 Unit Apartments | 0 (0.0%) | 50 (100.0%) |
| 5 to 9 Unit Apartments | 0 (0.0%) | 27 (100.0%) |
| 10 or more Apartments | 0 (0.0%) | 8 (100.0%) |
| Mobile Home / Other | 15 (53.6%) | 13 (46.4%) |
| Total | 434 (59.4%) | 297 (40.6%) |
Housing Structures by Number of Rooms in Calhoun City
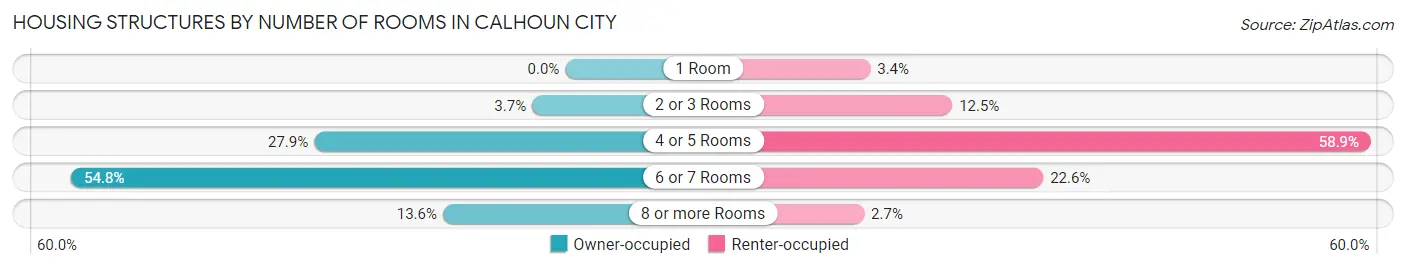
| Number of Rooms | Owner-occupied | Renter-occupied |
| 1 Room | 0 (0.0%) | 10 (3.4%) |
| 2 or 3 Rooms | 16 (3.7%) | 37 (12.5%) |
| 4 or 5 Rooms | 121 (27.9%) | 175 (58.9%) |
| 6 or 7 Rooms | 238 (54.8%) | 67 (22.6%) |
| 8 or more Rooms | 59 (13.6%) | 8 (2.7%) |
| Total | 434 (100.0%) | 297 (100.0%) |
Housing Structure by Heating Type in Calhoun City
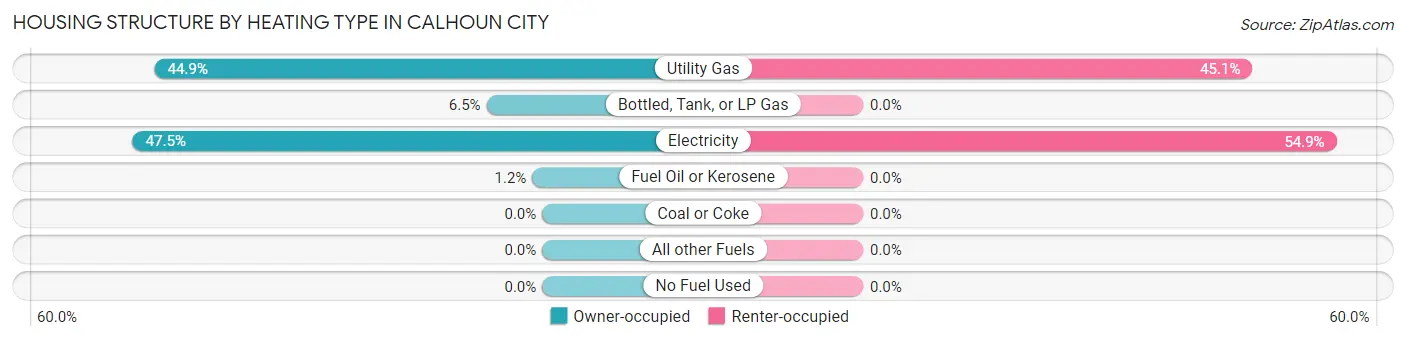
| Heating Type | Owner-occupied | Renter-occupied |
| Utility Gas | 195 (44.9%) | 134 (45.1%) |
| Bottled, Tank, or LP Gas | 28 (6.5%) | 0 (0.0%) |
| Electricity | 206 (47.5%) | 163 (54.9%) |
| Fuel Oil or Kerosene | 5 (1.1%) | 0 (0.0%) |
| Coal or Coke | 0 (0.0%) | 0 (0.0%) |
| All other Fuels | 0 (0.0%) | 0 (0.0%) |
| No Fuel Used | 0 (0.0%) | 0 (0.0%) |
| Total | 434 (100.0%) | 297 (100.0%) |
Household Vehicle Usage in Calhoun City
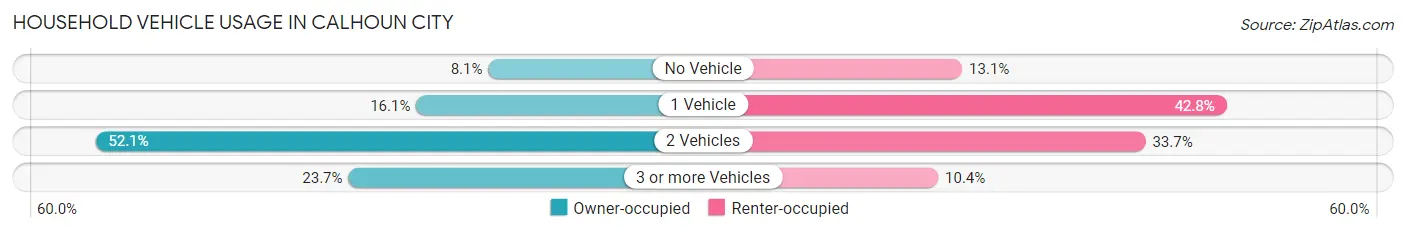
| Vehicles per Household | Owner-occupied | Renter-occupied |
| No Vehicle | 35 (8.1%) | 39 (13.1%) |
| 1 Vehicle | 70 (16.1%) | 127 (42.8%) |
| 2 Vehicles | 226 (52.1%) | 100 (33.7%) |
| 3 or more Vehicles | 103 (23.7%) | 31 (10.4%) |
| Total | 434 (100.0%) | 297 (100.0%) |
Real Estate & Mortgages in Calhoun City
Real Estate and Mortgage Overview in Calhoun City
| Characteristic | Without Mortgage | With Mortgage |
| Housing Units | 257 | 177 |
| Median Property Value | $67,300 | $103,700 |
| Median Household Income | $41,458 | $3 |
| Monthly Housing Costs | $320 | $0 |
| Real Estate Taxes | $574 | $32 |
Property Value by Mortgage Status in Calhoun City
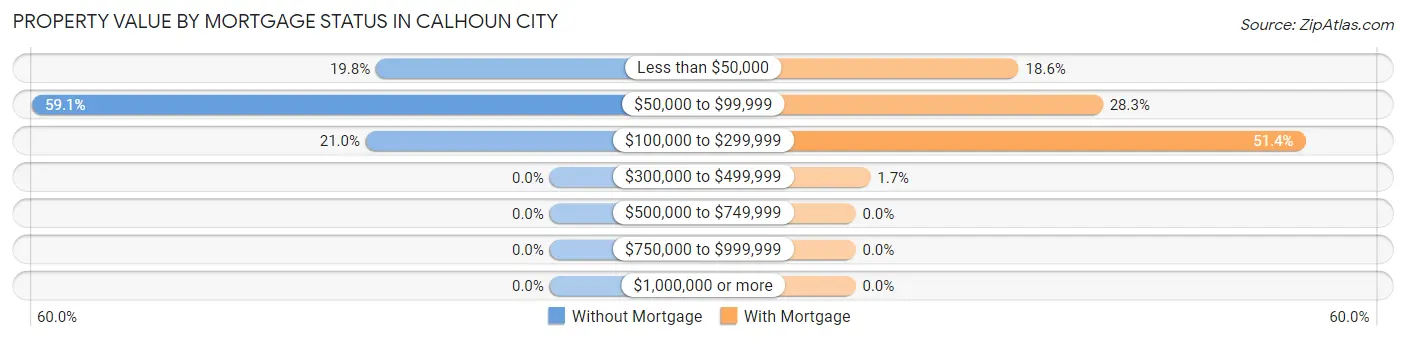
| Property Value | Without Mortgage | With Mortgage |
| Less than $50,000 | 51 (19.8%) | 33 (18.6%) |
| $50,000 to $99,999 | 152 (59.1%) | 50 (28.2%) |
| $100,000 to $299,999 | 54 (21.0%) | 91 (51.4%) |
| $300,000 to $499,999 | 0 (0.0%) | 3 (1.7%) |
| $500,000 to $749,999 | 0 (0.0%) | 0 (0.0%) |
| $750,000 to $999,999 | 0 (0.0%) | 0 (0.0%) |
| $1,000,000 or more | 0 (0.0%) | 0 (0.0%) |
| Total | 257 (100.0%) | 177 (100.0%) |
Household Income by Mortgage Status in Calhoun City
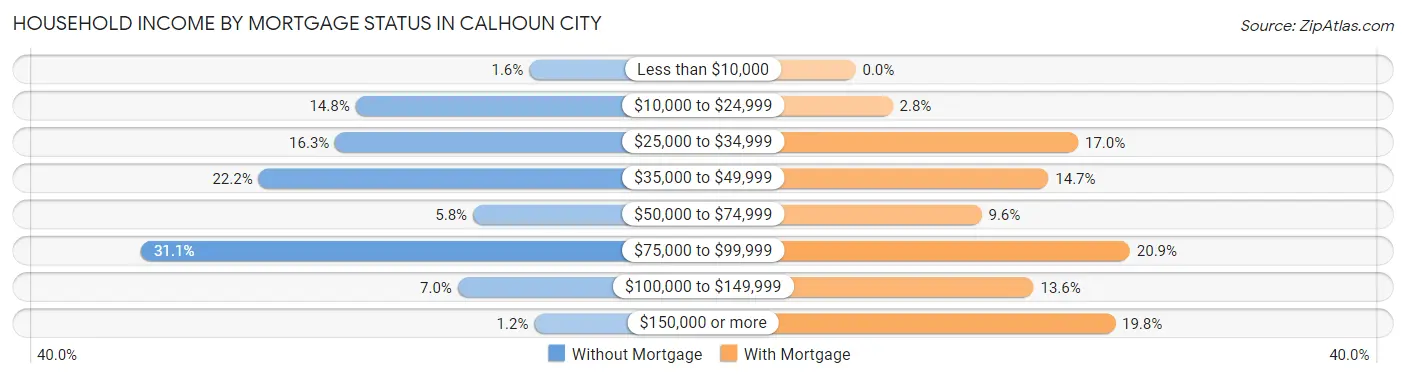
| Household Income | Without Mortgage | With Mortgage |
| Less than $10,000 | 4 (1.6%) | 0 (0.0%) |
| $10,000 to $24,999 | 38 (14.8%) | 5 (2.8%) |
| $25,000 to $34,999 | 42 (16.3%) | 30 (17.0%) |
| $35,000 to $49,999 | 57 (22.2%) | 26 (14.7%) |
| $50,000 to $74,999 | 15 (5.8%) | 17 (9.6%) |
| $75,000 to $99,999 | 80 (31.1%) | 37 (20.9%) |
| $100,000 to $149,999 | 18 (7.0%) | 24 (13.6%) |
| $150,000 or more | 3 (1.2%) | 35 (19.8%) |
| Total | 257 (100.0%) | 177 (100.0%) |
Property Value to Household Income Ratio in Calhoun City
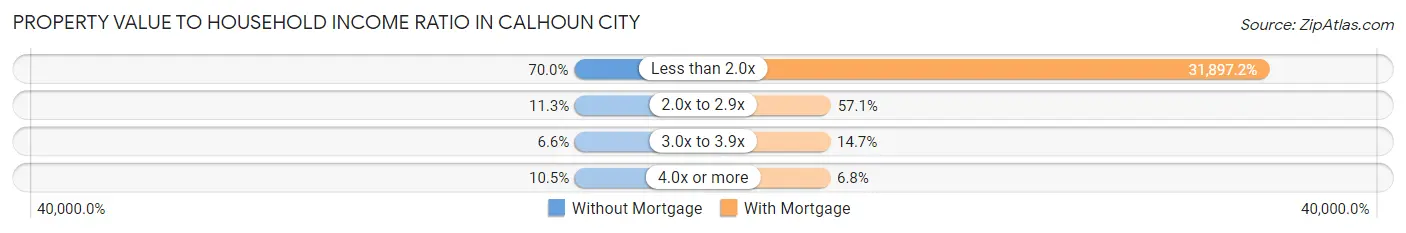
| Value-to-Income Ratio | Without Mortgage | With Mortgage |
| Less than 2.0x | 180 (70.0%) | 56,458 (31,897.2%) |
| 2.0x to 2.9x | 29 (11.3%) | 101 (57.1%) |
| 3.0x to 3.9x | 17 (6.6%) | 26 (14.7%) |
| 4.0x or more | 27 (10.5%) | 12 (6.8%) |
| Total | 257 (100.0%) | 177 (100.0%) |
Real Estate Taxes by Mortgage Status in Calhoun City
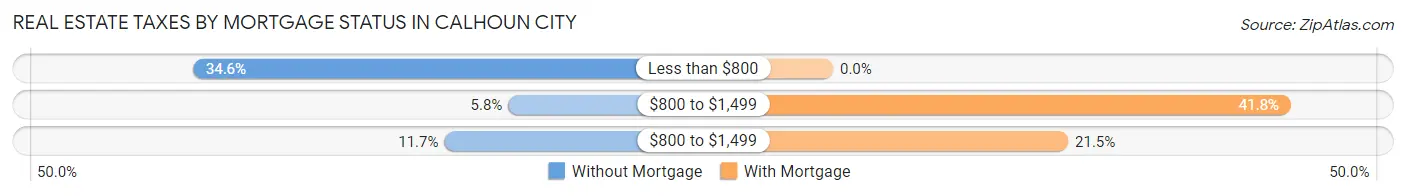
| Property Taxes | Without Mortgage | With Mortgage |
| Less than $800 | 89 (34.6%) | 0 (0.0%) |
| $800 to $1,499 | 15 (5.8%) | 74 (41.8%) |
| $800 to $1,499 | 30 (11.7%) | 38 (21.5%) |
| Total | 257 (100.0%) | 177 (100.0%) |
Health & Disability in Calhoun City
Health Insurance Coverage by Age in Calhoun City
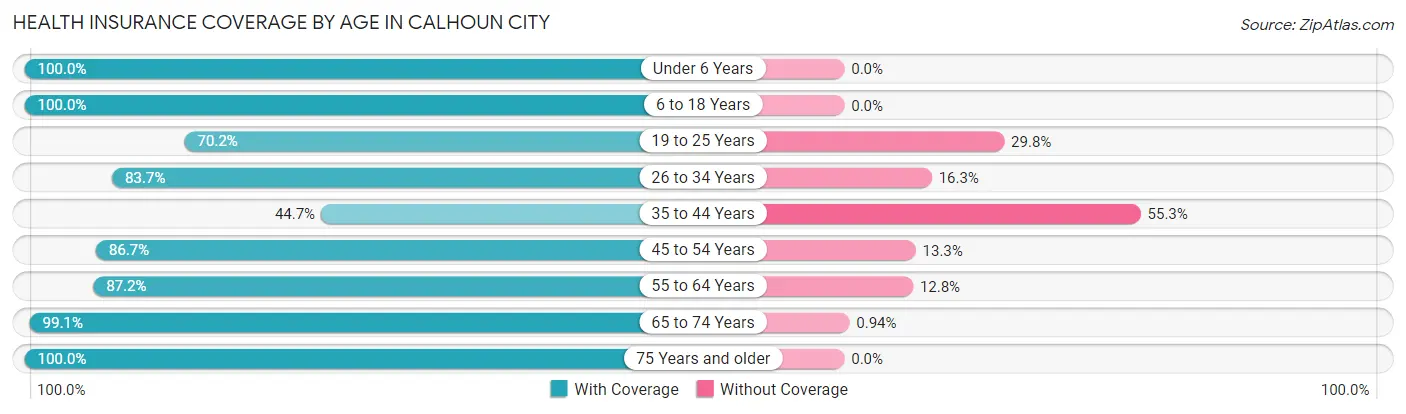
| Age Bracket | With Coverage | Without Coverage |
| Under 6 Years | 152 (100.0%) | 0 (0.0%) |
| 6 to 18 Years | 288 (100.0%) | 0 (0.0%) |
| 19 to 25 Years | 73 (70.2%) | 31 (29.8%) |
| 26 to 34 Years | 190 (83.7%) | 37 (16.3%) |
| 35 to 44 Years | 102 (44.7%) | 126 (55.3%) |
| 45 to 54 Years | 163 (86.7%) | 25 (13.3%) |
| 55 to 64 Years | 184 (87.2%) | 27 (12.8%) |
| 65 to 74 Years | 211 (99.1%) | 2 (0.9%) |
| 75 Years and older | 110 (100.0%) | 0 (0.0%) |
| Total | 1,473 (85.6%) | 248 (14.4%) |
Health Insurance Coverage by Citizenship Status in Calhoun City
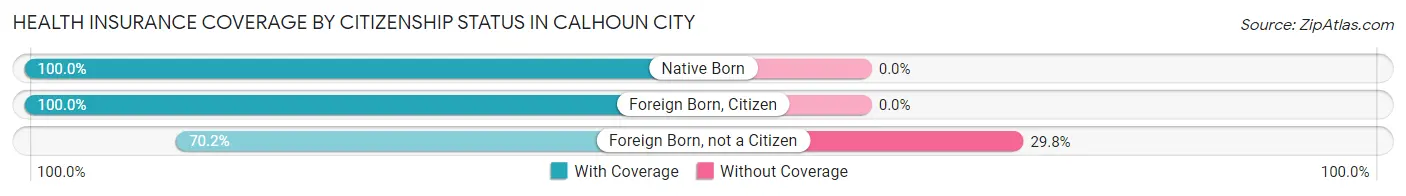
| Citizenship Status | With Coverage | Without Coverage |
| Native Born | 152 (100.0%) | 0 (0.0%) |
| Foreign Born, Citizen | 288 (100.0%) | 0 (0.0%) |
| Foreign Born, not a Citizen | 73 (70.2%) | 31 (29.8%) |
Health Insurance Coverage by Household Income in Calhoun City
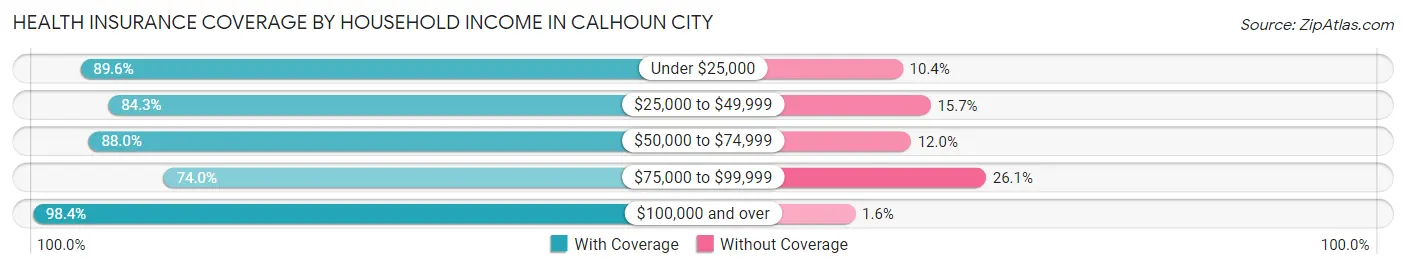
| Household Income | With Coverage | Without Coverage |
| Under $25,000 | 266 (89.6%) | 31 (10.4%) |
| $25,000 to $49,999 | 522 (84.3%) | 97 (15.7%) |
| $50,000 to $74,999 | 169 (88.0%) | 23 (12.0%) |
| $75,000 to $99,999 | 264 (74.0%) | 93 (26.1%) |
| $100,000 and over | 252 (98.4%) | 4 (1.6%) |
Public vs Private Health Insurance Coverage by Age in Calhoun City
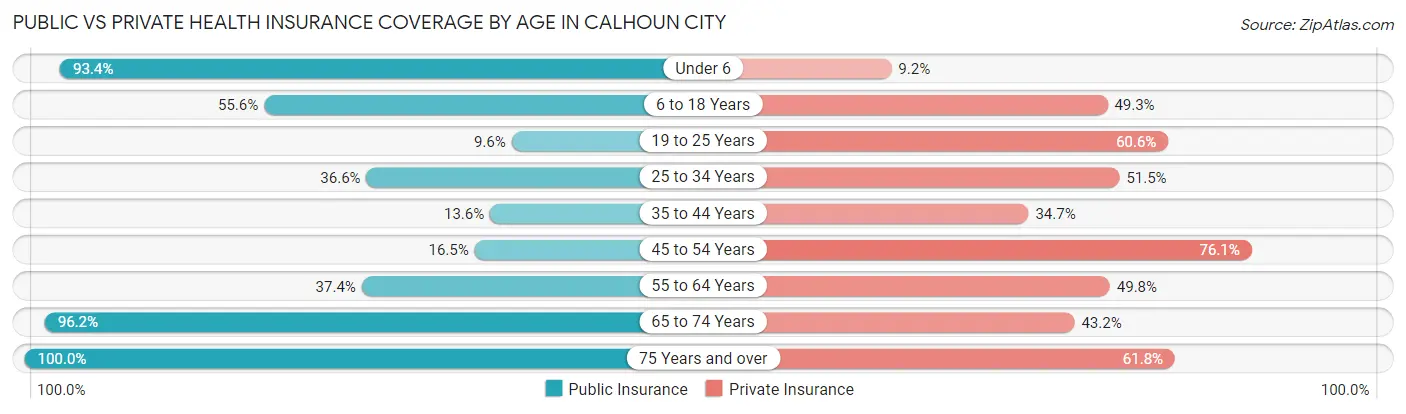
| Age Bracket | Public Insurance | Private Insurance |
| Under 6 | 142 (93.4%) | 14 (9.2%) |
| 6 to 18 Years | 160 (55.6%) | 142 (49.3%) |
| 19 to 25 Years | 10 (9.6%) | 63 (60.6%) |
| 25 to 34 Years | 83 (36.6%) | 117 (51.5%) |
| 35 to 44 Years | 31 (13.6%) | 79 (34.6%) |
| 45 to 54 Years | 31 (16.5%) | 143 (76.1%) |
| 55 to 64 Years | 79 (37.4%) | 105 (49.8%) |
| 65 to 74 Years | 205 (96.2%) | 92 (43.2%) |
| 75 Years and over | 110 (100.0%) | 68 (61.8%) |
| Total | 851 (49.4%) | 823 (47.8%) |
Disability Status by Sex by Age in Calhoun City
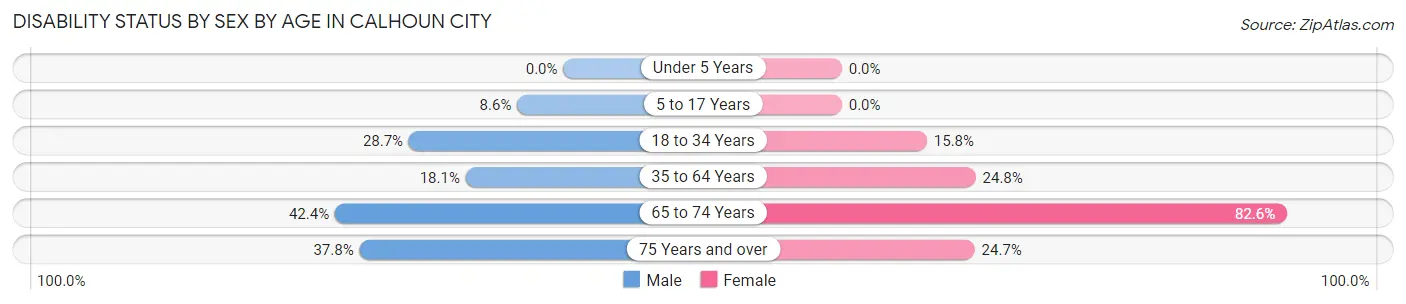
| Age Bracket | Male | Female |
| Under 5 Years | 0 (0.0%) | 0 (0.0%) |
| 5 to 17 Years | 16 (8.6%) | 0 (0.0%) |
| 18 to 34 Years | 45 (28.7%) | 30 (15.8%) |
| 35 to 64 Years | 56 (18.1%) | 79 (24.8%) |
| 65 to 74 Years | 39 (42.4%) | 100 (82.6%) |
| 75 Years and over | 14 (37.8%) | 18 (24.7%) |
Disability Class by Sex by Age in Calhoun City
Disability Class: Hearing Difficulty
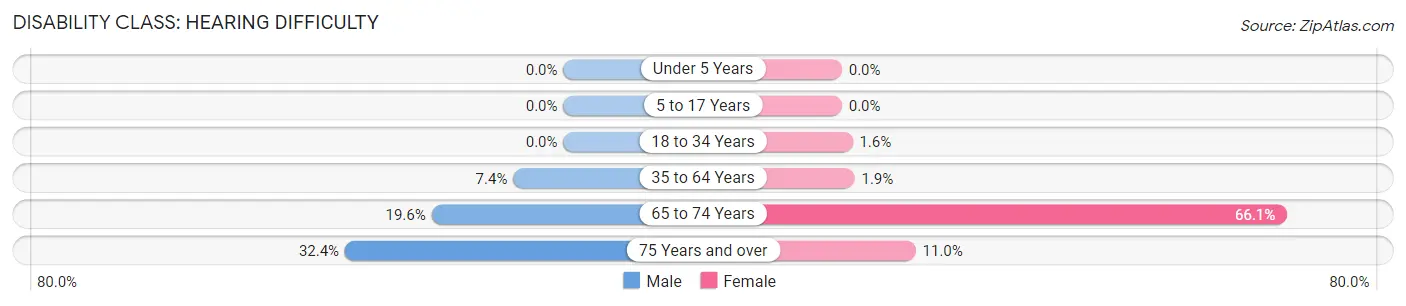
| Age Bracket | Male | Female |
| Under 5 Years | 0 (0.0%) | 0 (0.0%) |
| 5 to 17 Years | 0 (0.0%) | 0 (0.0%) |
| 18 to 34 Years | 0 (0.0%) | 3 (1.6%) |
| 35 to 64 Years | 23 (7.4%) | 6 (1.9%) |
| 65 to 74 Years | 18 (19.6%) | 80 (66.1%) |
| 75 Years and over | 12 (32.4%) | 8 (11.0%) |
Disability Class: Vision Difficulty
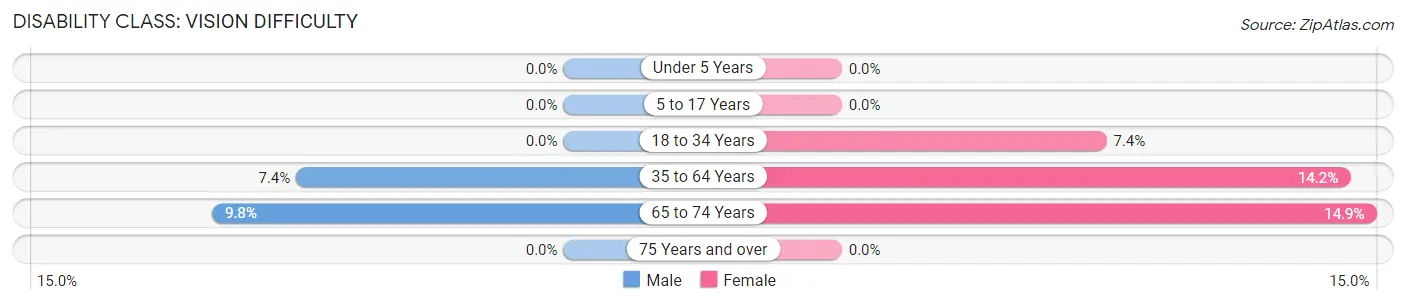
| Age Bracket | Male | Female |
| Under 5 Years | 0 (0.0%) | 0 (0.0%) |
| 5 to 17 Years | 0 (0.0%) | 0 (0.0%) |
| 18 to 34 Years | 0 (0.0%) | 14 (7.4%) |
| 35 to 64 Years | 23 (7.4%) | 45 (14.1%) |
| 65 to 74 Years | 9 (9.8%) | 18 (14.9%) |
| 75 Years and over | 0 (0.0%) | 0 (0.0%) |
Disability Class: Cognitive Difficulty
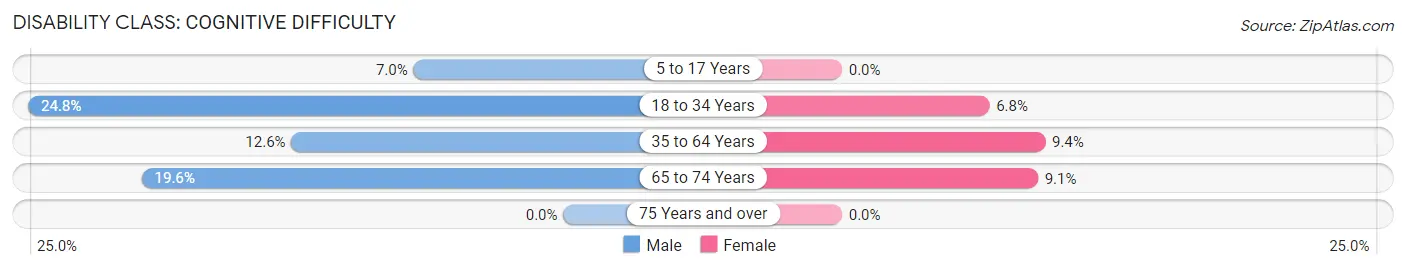
| Age Bracket | Male | Female |
| 5 to 17 Years | 13 (7.0%) | 0 (0.0%) |
| 18 to 34 Years | 39 (24.8%) | 13 (6.8%) |
| 35 to 64 Years | 39 (12.6%) | 30 (9.4%) |
| 65 to 74 Years | 18 (19.6%) | 11 (9.1%) |
| 75 Years and over | 0 (0.0%) | 0 (0.0%) |
Disability Class: Ambulatory Difficulty
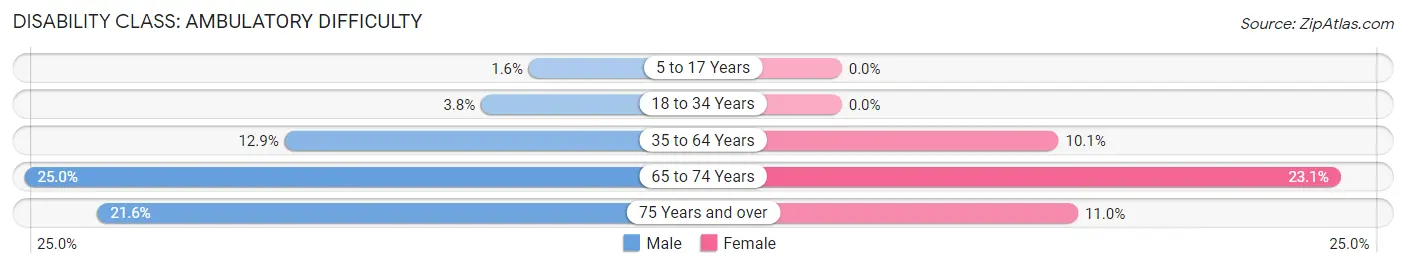
| Age Bracket | Male | Female |
| 5 to 17 Years | 3 (1.6%) | 0 (0.0%) |
| 18 to 34 Years | 6 (3.8%) | 0 (0.0%) |
| 35 to 64 Years | 40 (12.9%) | 32 (10.1%) |
| 65 to 74 Years | 23 (25.0%) | 28 (23.1%) |
| 75 Years and over | 8 (21.6%) | 8 (11.0%) |
Disability Class: Self-Care Difficulty
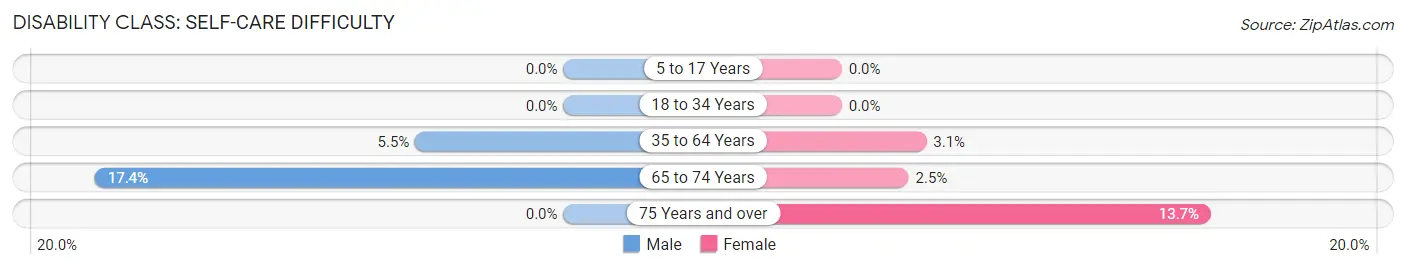
| Age Bracket | Male | Female |
| 5 to 17 Years | 0 (0.0%) | 0 (0.0%) |
| 18 to 34 Years | 0 (0.0%) | 0 (0.0%) |
| 35 to 64 Years | 17 (5.5%) | 10 (3.1%) |
| 65 to 74 Years | 16 (17.4%) | 3 (2.5%) |
| 75 Years and over | 0 (0.0%) | 10 (13.7%) |
Technology Access in Calhoun City
Computing Device Access in Calhoun City
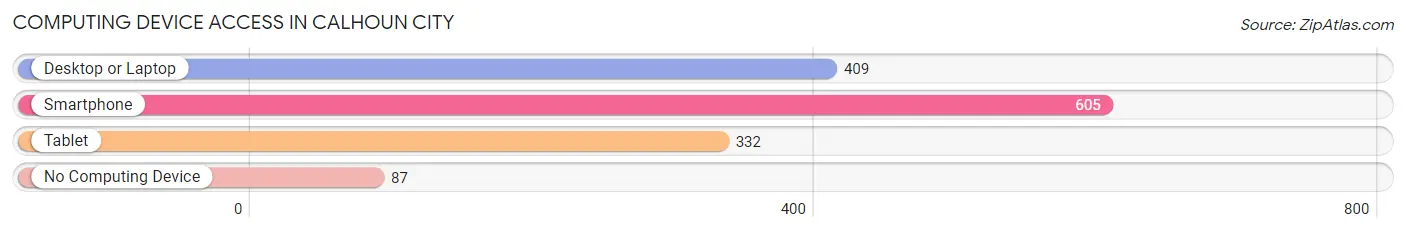
| Device Type | # Households | % Households |
| Desktop or Laptop | 409 | 55.9% |
| Smartphone | 605 | 82.8% |
| Tablet | 332 | 45.4% |
| No Computing Device | 87 | 11.9% |
| Total | 731 | 100.0% |
Internet Access in Calhoun City
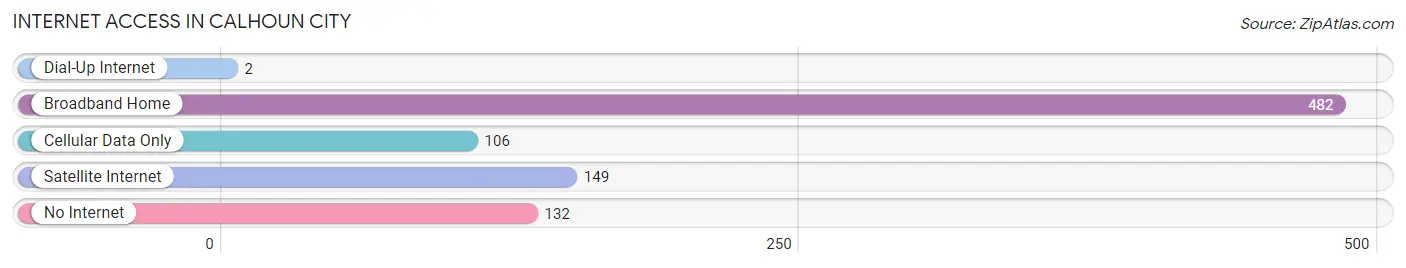
| Internet Type | # Households | % Households |
| Dial-Up Internet | 2 | 0.3% |
| Broadband Home | 482 | 65.9% |
| Cellular Data Only | 106 | 14.5% |
| Satellite Internet | 149 | 20.4% |
| No Internet | 132 | 18.1% |
| Total | 731 | 100.0% |
Calhoun City Summary
Calhoun City is a small town located in the northern part of Mississippi, in the United States. It is situated in Calhoun County, and is the county seat. The town has a population of 1,717 people, according to the 2010 census.
History
Calhoun City was founded in 1837, and was named after John C. Calhoun, a prominent politician from South Carolina. The town was originally known as Calhoun Court House, and was the county seat of Calhoun County. The town was incorporated in 1848, and the first mayor was elected in 1849.
The town was a major center of the cotton industry in the 19th century, and was home to several cotton mills. The town was also a major railroad hub, with the Mobile and Ohio Railroad running through it.
In the early 20th century, the town was a major center of the timber industry, and was home to several sawmills. The town was also home to several manufacturing plants, including a furniture factory and a canning factory.
Geography
Calhoun City is located in the northern part of Mississippi, in the United States. It is situated in Calhoun County, and is the county seat. The town is located at the intersection of U.S. Route 45 and Mississippi Highway 8.
The town is situated on the banks of the Yalobusha River, and is surrounded by rolling hills and forests. The town is located about 50 miles south of Memphis, Tennessee, and about 100 miles north of Jackson, Mississippi.
Economy
Calhoun City is a small town with a population of 1,717 people, according to the 2010 census. The town is home to several small businesses, including restaurants, retail stores, and service providers. The town is also home to several manufacturing plants, including a furniture factory and a canning factory.
The town is also home to several agricultural businesses, including cotton farms, timber farms, and cattle farms. The town is also home to several sawmills, which process the timber harvested from the surrounding forests.
Demographics
According to the 2010 census, the population of Calhoun City was 1,717 people. The racial makeup of the town was 79.3% White, 19.2% African American, 0.2% Native American, 0.2% Asian, and 0.9% from other races. The median household income was $25,938, and the median family income was $32,813.
The town is home to several churches, including Baptist, Methodist, and Presbyterian churches. The town is also home to several schools, including Calhoun City High School, Calhoun City Elementary School, and Calhoun City Middle School.
Conclusion
Calhoun City is a small town located in the northern part of Mississippi, in the United States. It is situated in Calhoun County, and is the county seat. The town has a population of 1,717 people, according to the 2010 census. The town is home to several small businesses, including restaurants, retail stores, and service providers. The town is also home to several manufacturing plants, including a furniture factory and a canning factory. The town is also home to several agricultural businesses, including cotton farms, timber farms, and cattle farms. The town is also home to several churches, including Baptist, Methodist, and Presbyterian churches. The town is also home to several schools, including Calhoun City High School, Calhoun City Elementary School, and Calhoun City Middle School.
Common Questions
What is Per Capita Income in Calhoun City?
Per Capita income in Calhoun City is $21,954.
What is the Median Family Income in Calhoun City?
Median Family Income in Calhoun City is $50,875.
What is the Median Household income in Calhoun City?
Median Household Income in Calhoun City is $41,375.
What is Income or Wage Gap in Calhoun City?
Income or Wage Gap in Calhoun City is 42.9%.
Women in Calhoun City earn 57.1 cents for every dollar earned by a man.
What is Inequality or Gini Index in Calhoun City?
Inequality or Gini Index in Calhoun City is 0.39.
What is the Total Population of Calhoun City?
Total Population of Calhoun City is 1,853.
What is the Total Male Population of Calhoun City?
Total Male Population of Calhoun City is 881.
What is the Total Female Population of Calhoun City?
Total Female Population of Calhoun City is 972.
What is the Ratio of Males per 100 Females in Calhoun City?
There are 90.64 Males per 100 Females in Calhoun City.
What is the Ratio of Females per 100 Males in Calhoun City?
There are 110.33 Females per 100 Males in Calhoun City.
What is the Median Population Age in Calhoun City?
Median Population Age in Calhoun City is 44.1 Years.
What is the Average Family Size in Calhoun City
Average Family Size in Calhoun City is 2.9 People.
What is the Average Household Size in Calhoun City
Average Household Size in Calhoun City is 2.4 People.
How Large is the Labor Force in Calhoun City?
There are 736 People in the Labor Forcein in Calhoun City.
What is the Percentage of People in the Labor Force in Calhoun City?
49.7% of People are in the Labor Force in Calhoun City.
What is the Unemployment Rate in Calhoun City?
Unemployment Rate in Calhoun City is 7.2%.