Mount Olive, MS Map & Demographics
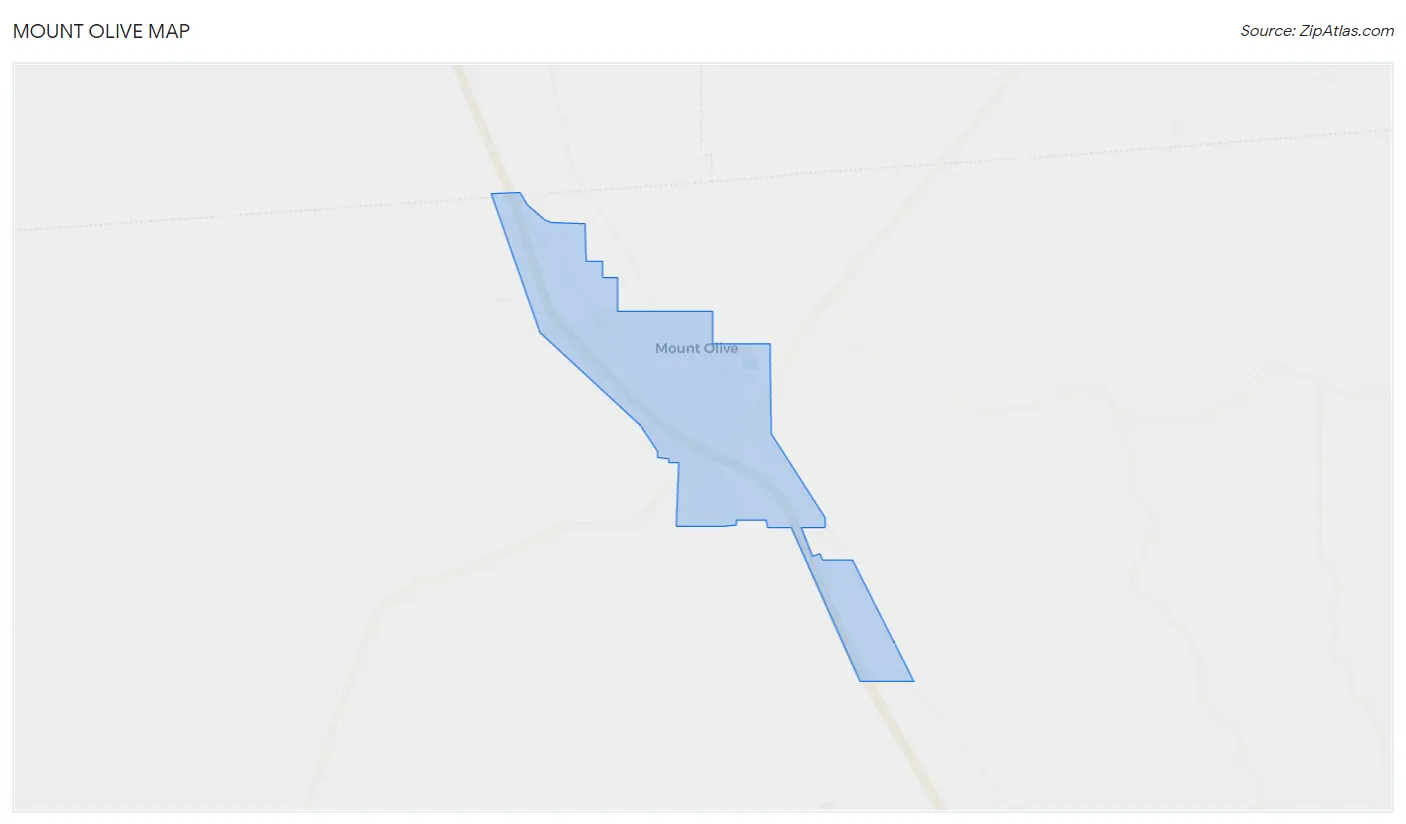
Mount Olive Map
Mount Olive Overview
$22,393
PER CAPITA INCOME
$112,781
AVG FAMILY INCOME
58.1%
WAGE / INCOME GAP [ % ]
41.9¢/ $1
WAGE / INCOME GAP [ $ ]
0.40
INEQUALITY / GINI INDEX
1,405
TOTAL POPULATION
697
MALE POPULATION
708
FEMALE POPULATION
98.45
MALES / 100 FEMALES
101.58
FEMALES / 100 MALES
31.7
MEDIAN AGE
3.4
AVG FAMILY SIZE
2.8
AVG HOUSEHOLD SIZE
666
LABOR FORCE [ PEOPLE ]
68.0%
PERCENT IN LABOR FORCE
3.2%
UNEMPLOYMENT RATE
Mount Olive Zip Codes
Income in Mount Olive
Income Overview in Mount Olive
| Characteristic | Number | Measure |
| Per Capita Income | 1,405 | $22,393 |
| Median Family Income | 372 | $112,781 |
| Mean Family Income | 372 | $82,525 |
| Median Household Income | 500 | $0 |
| Mean Household Income | 500 | $67,909 |
| Income Deficit | 372 | $0 |
| Wage / Income Gap (%) | 1,405 | 58.07% |
| Wage / Income Gap ($) | 1,405 | 41.93¢ per $1 |
| Gini / Inequality Index | 1,405 | 0.40 |
Earnings by Sex in Mount Olive
Average Earnings in Mount Olive are $40,417, $57,941 for men and $24,297 for women, a difference of 58.1%.
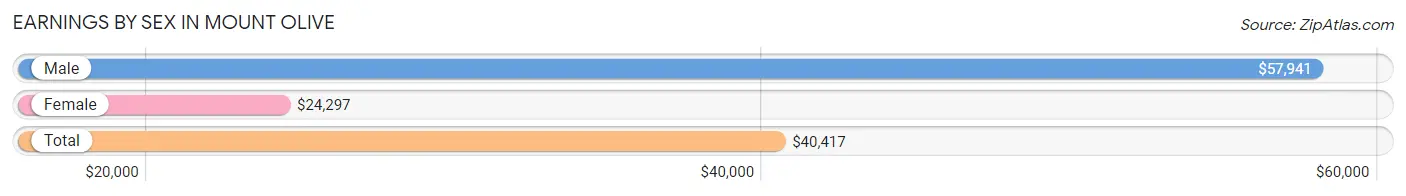
| Sex | Number | Average Earnings |
| Male | 372 (54.9%) | $57,941 |
| Female | 305 (45.1%) | $24,297 |
| Total | 677 (100.0%) | $40,417 |
Earnings by Sex by Income Bracket in Mount Olive
The most common earnings brackets in Mount Olive are $65,000 to $74,999 for men (169 | 45.4%) and $45,000 to $49,999 for women (53 | 17.4%).
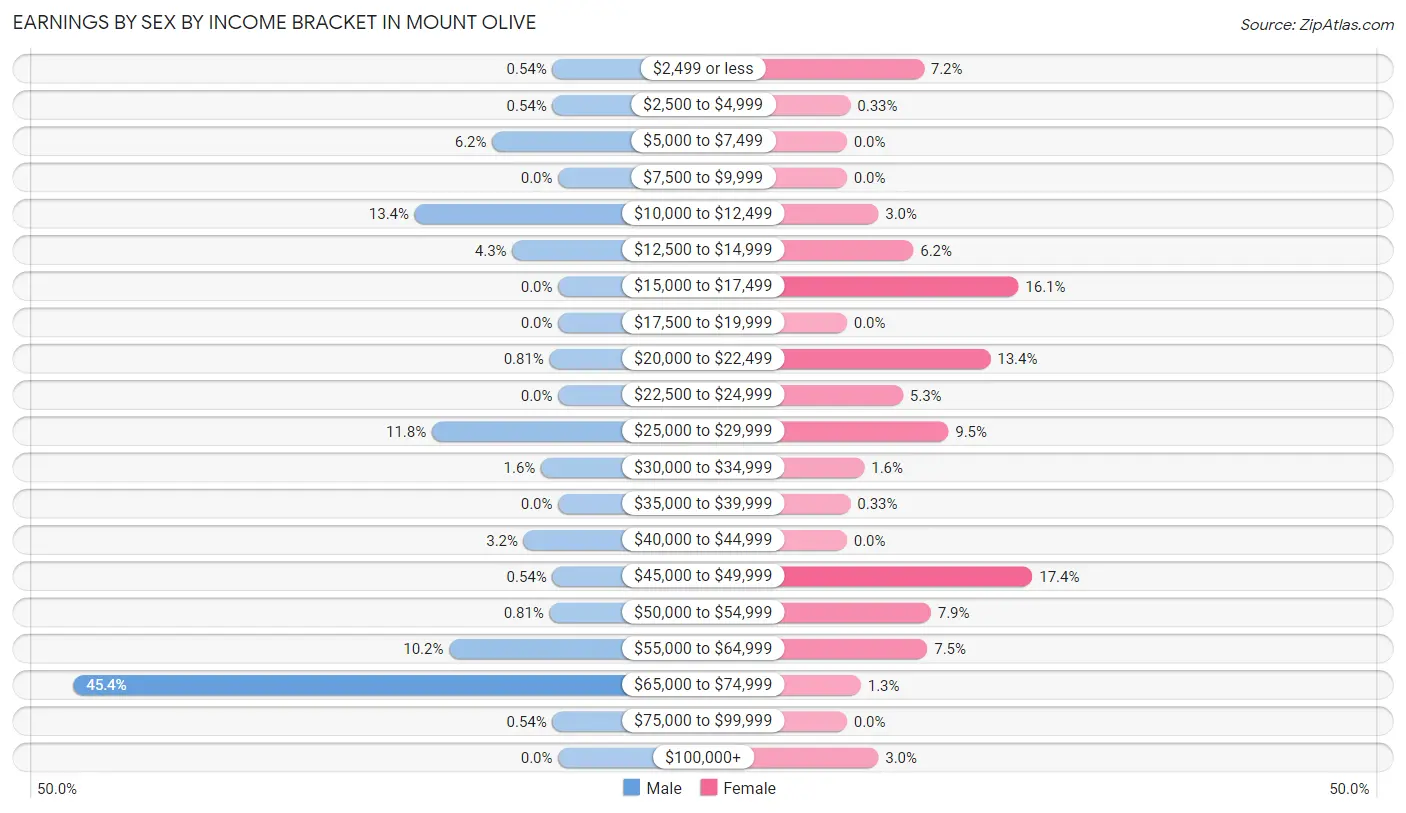
| Income | Male | Female |
| $2,499 or less | 2 (0.5%) | 22 (7.2%) |
| $2,500 to $4,999 | 2 (0.5%) | 1 (0.3%) |
| $5,000 to $7,499 | 23 (6.2%) | 0 (0.0%) |
| $7,500 to $9,999 | 0 (0.0%) | 0 (0.0%) |
| $10,000 to $12,499 | 50 (13.4%) | 9 (2.9%) |
| $12,500 to $14,999 | 16 (4.3%) | 19 (6.2%) |
| $15,000 to $17,499 | 0 (0.0%) | 49 (16.1%) |
| $17,500 to $19,999 | 0 (0.0%) | 0 (0.0%) |
| $20,000 to $22,499 | 3 (0.8%) | 41 (13.4%) |
| $22,500 to $24,999 | 0 (0.0%) | 16 (5.2%) |
| $25,000 to $29,999 | 44 (11.8%) | 29 (9.5%) |
| $30,000 to $34,999 | 6 (1.6%) | 5 (1.6%) |
| $35,000 to $39,999 | 0 (0.0%) | 1 (0.3%) |
| $40,000 to $44,999 | 12 (3.2%) | 0 (0.0%) |
| $45,000 to $49,999 | 2 (0.5%) | 53 (17.4%) |
| $50,000 to $54,999 | 3 (0.8%) | 24 (7.9%) |
| $55,000 to $64,999 | 38 (10.2%) | 23 (7.5%) |
| $65,000 to $74,999 | 169 (45.4%) | 4 (1.3%) |
| $75,000 to $99,999 | 2 (0.5%) | 0 (0.0%) |
| $100,000+ | 0 (0.0%) | 9 (2.9%) |
| Total | 372 (100.0%) | 305 (100.0%) |
Earnings by Sex by Educational Attainment in Mount Olive
Average earnings in Mount Olive are $68,173 for men and $28,147 for women, a difference of 58.7%. Men with an educational attainment of college or associate's degree enjoy the highest average annual earnings of $68,669, while those with college or associate's degree education earn the least with $68,669. Women with an educational attainment of graduate degree earn the most with the average annual earnings of $57,663, while those with college or associate's degree education have the smallest earnings of $22,393.
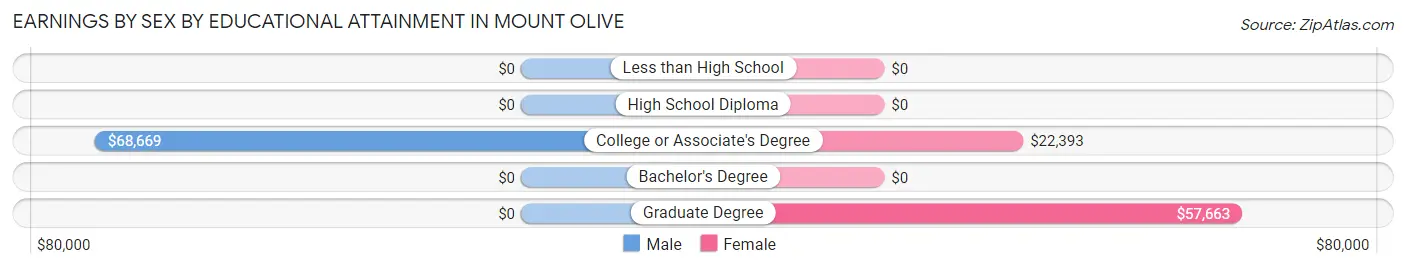
| Educational Attainment | Male Income | Female Income |
| Less than High School | - | - |
| High School Diploma | - | - |
| College or Associate's Degree | $68,669 | $22,393 |
| Bachelor's Degree | - | - |
| Graduate Degree | - | - |
| Total | $68,173 | $28,147 |
Family Income in Mount Olive
Family Income Brackets in Mount Olive
According to the Mount Olive family income data, there are 192 families falling into the $100,000 to $149,999 income range, which is the most common income bracket and makes up 51.6% of all families.
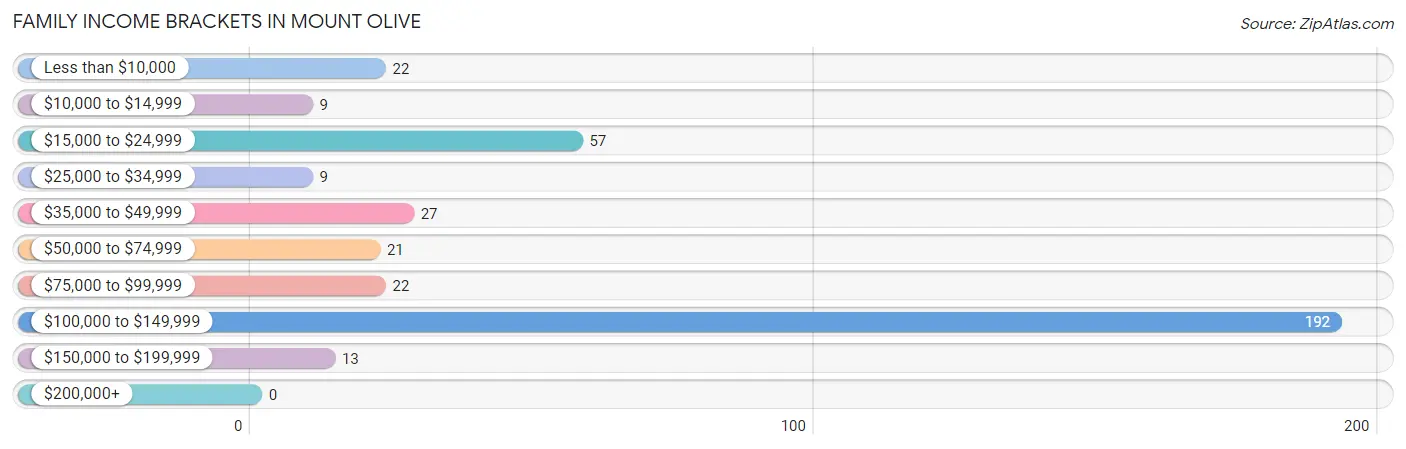
| Income Bracket | # Families | % Families |
| Less than $10,000 | 22 | 5.9% |
| $10,000 to $14,999 | 9 | 2.4% |
| $15,000 to $24,999 | 57 | 15.3% |
| $25,000 to $34,999 | 9 | 2.4% |
| $35,000 to $49,999 | 27 | 7.3% |
| $50,000 to $74,999 | 21 | 5.6% |
| $75,000 to $99,999 | 22 | 5.9% |
| $100,000 to $149,999 | 192 | 51.6% |
| $150,000 to $199,999 | 13 | 3.5% |
| $200,000+ | 0 | 0.0% |
Family Income by Famaliy Size in Mount Olive
4-person families (208 | 55.9%) account for the highest median family income in Mount Olive with $113,728 per family, while 4-person families (208 | 55.9%) have the highest median income of $28,432 per family member.
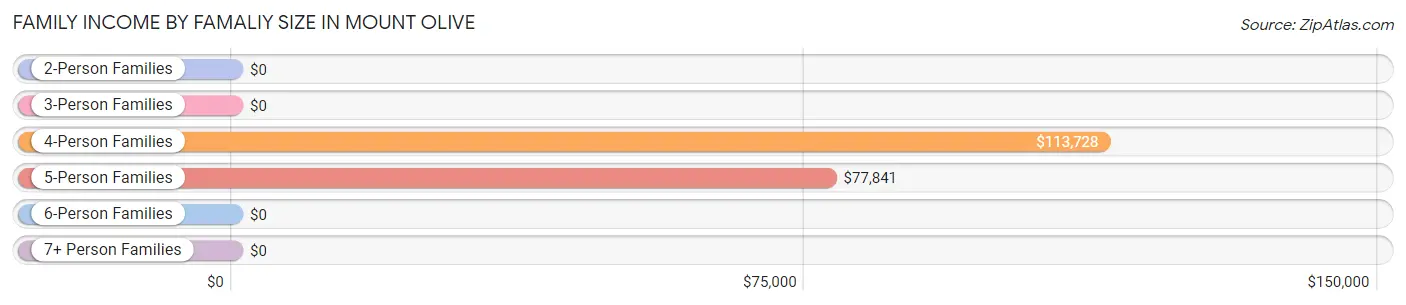
| Income Bracket | # Families | Median Income |
| 2-Person Families | 54 (14.5%) | $0 |
| 3-Person Families | 70 (18.8%) | $0 |
| 4-Person Families | 208 (55.9%) | $113,728 |
| 5-Person Families | 19 (5.1%) | $77,841 |
| 6-Person Families | 21 (5.7%) | $0 |
| 7+ Person Families | 0 (0.0%) | $0 |
| Total | 372 (100.0%) | $112,781 |
Family Income by Number of Earners in Mount Olive
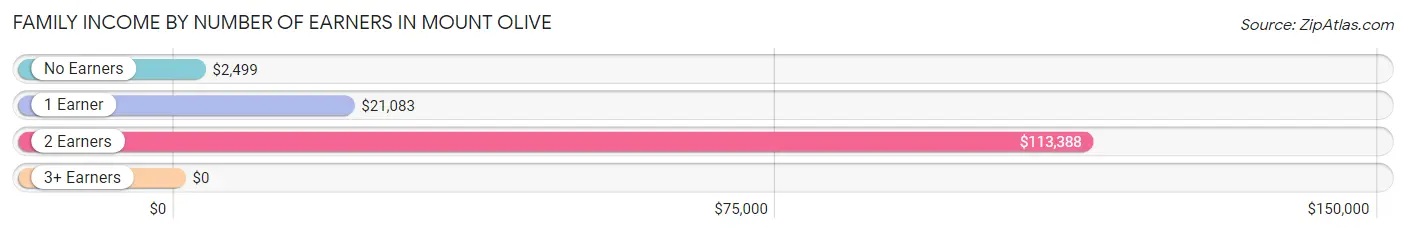
| Number of Earners | # Families | Median Income |
| No Earners | 30 (8.1%) | $2,499 |
| 1 Earner | 89 (23.9%) | $21,083 |
| 2 Earners | 226 (60.8%) | $113,388 |
| 3+ Earners | 27 (7.3%) | $0 |
| Total | 372 (100.0%) | $112,781 |
Household Income in Mount Olive
Household Income Brackets in Mount Olive
With 192 households falling in the category, the $100,000 to $149,999 income range is the most frequent in Mount Olive, accounting for 38.4% of all households.
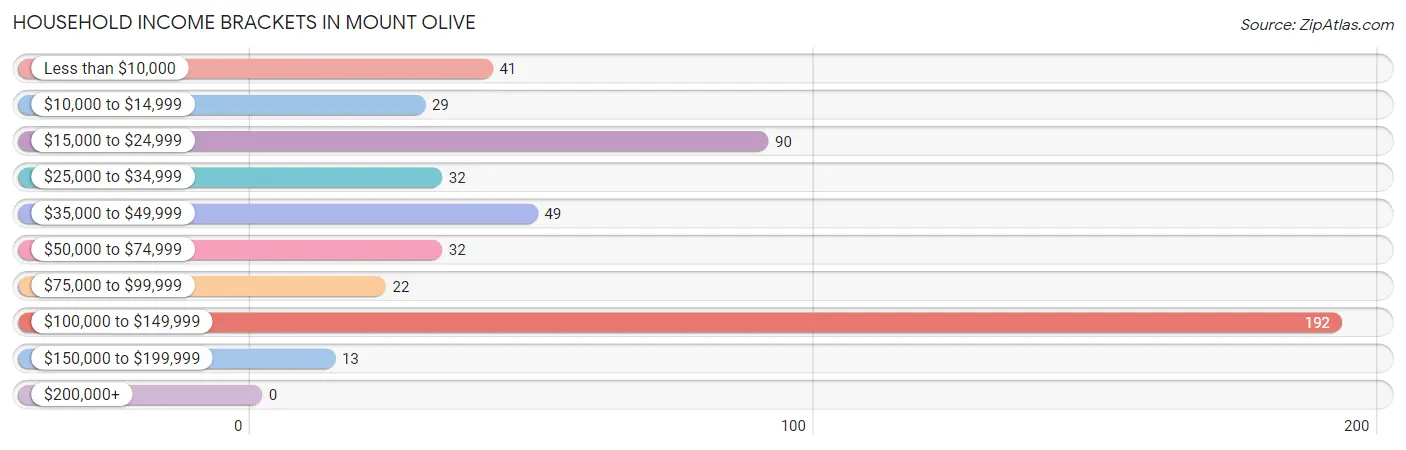
| Income Bracket | # Households | % Households |
| Less than $10,000 | 41 | 8.2% |
| $10,000 to $14,999 | 29 | 5.8% |
| $15,000 to $24,999 | 90 | 18.0% |
| $25,000 to $34,999 | 32 | 6.4% |
| $35,000 to $49,999 | 49 | 9.8% |
| $50,000 to $74,999 | 32 | 6.4% |
| $75,000 to $99,999 | 22 | 4.4% |
| $100,000 to $149,999 | 192 | 38.4% |
| $150,000 to $199,999 | 13 | 2.6% |
| $200,000+ | 0 | 0.0% |
Household Income by Householder Age in Mount Olive
The median household income in Mount Olive is $0, with the highest median household income of $112,936 found in the 25 to 44 years age bracket for the primary householder. A total of 279 households (55.8%) fall into this category.
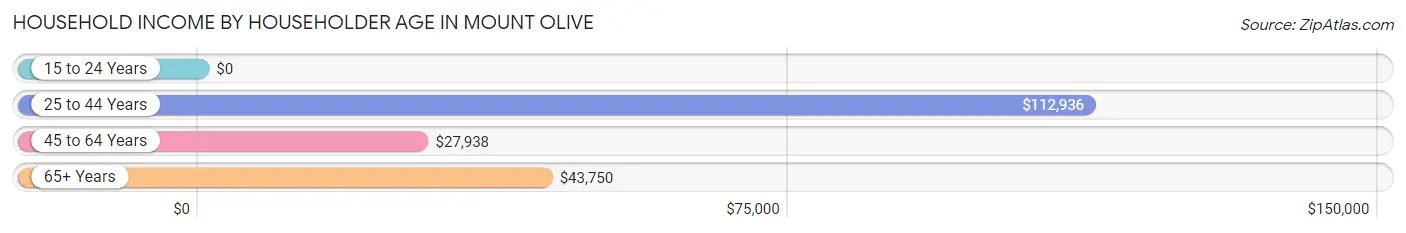
| Income Bracket | # Households | Median Income |
| 15 to 24 Years | 0 (0.0%) | $0 |
| 25 to 44 Years | 279 (55.8%) | $112,936 |
| 45 to 64 Years | 147 (29.4%) | $27,938 |
| 65+ Years | 74 (14.8%) | $43,750 |
| Total | 500 (100.0%) | $0 |
Poverty in Mount Olive
Income Below Poverty by Sex and Age in Mount Olive
With 16.9% poverty level for males and 31.1% for females among the residents of Mount Olive, 15 year old males and 5 year old females are the most vulnerable to poverty, with 4 males (100.0%) and 47 females (100.0%) in their respective age groups living below the poverty level.
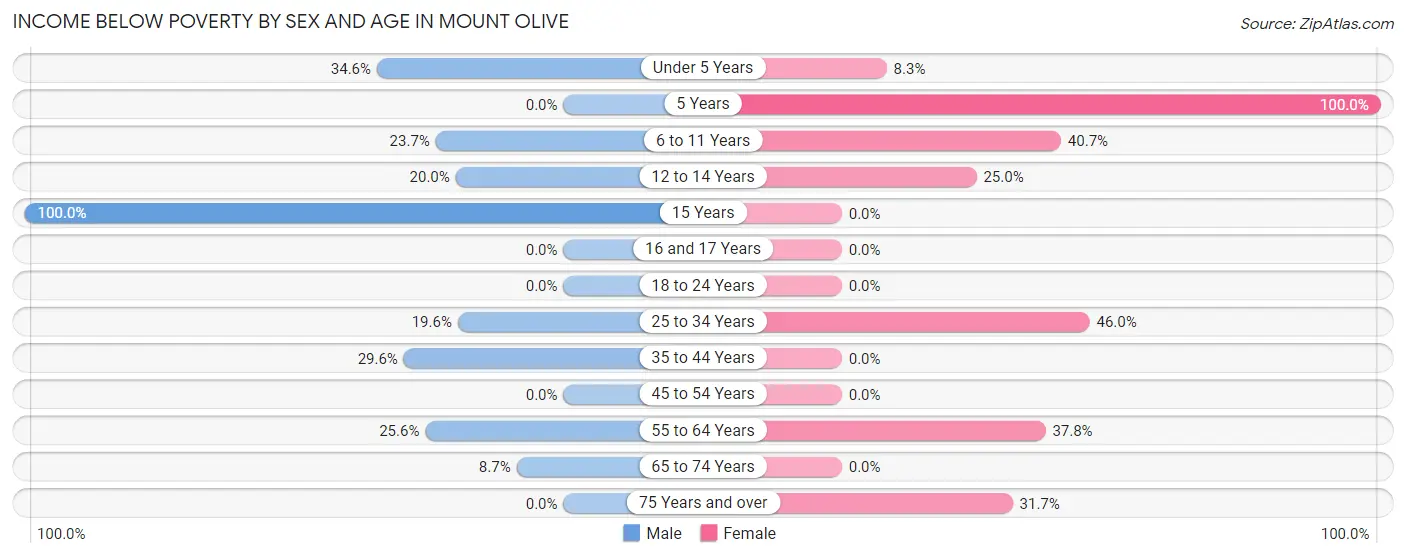
| Age Bracket | Male | Female |
| Under 5 Years | 9 (34.6%) | 3 (8.3%) |
| 5 Years | 0 (0.0%) | 47 (100.0%) |
| 6 to 11 Years | 32 (23.7%) | 61 (40.7%) |
| 12 to 14 Years | 4 (20.0%) | 2 (25.0%) |
| 15 Years | 4 (100.0%) | 0 (0.0%) |
| 16 and 17 Years | 0 (0.0%) | 0 (0.0%) |
| 18 to 24 Years | 0 (0.0%) | 0 (0.0%) |
| 25 to 34 Years | 49 (19.6%) | 63 (46.0%) |
| 35 to 44 Years | 8 (29.6%) | 0 (0.0%) |
| 45 to 54 Years | 0 (0.0%) | 0 (0.0%) |
| 55 to 64 Years | 10 (25.6%) | 31 (37.8%) |
| 65 to 74 Years | 2 (8.7%) | 0 (0.0%) |
| 75 Years and over | 0 (0.0%) | 13 (31.7%) |
| Total | 118 (16.9%) | 220 (31.1%) |
Income Above Poverty by Sex and Age in Mount Olive
According to the poverty statistics in Mount Olive, males aged 18 to 24 years and females aged 18 to 24 years are the age groups that are most secure financially, with 100.0% of males and 100.0% of females in these age groups living above the poverty line.
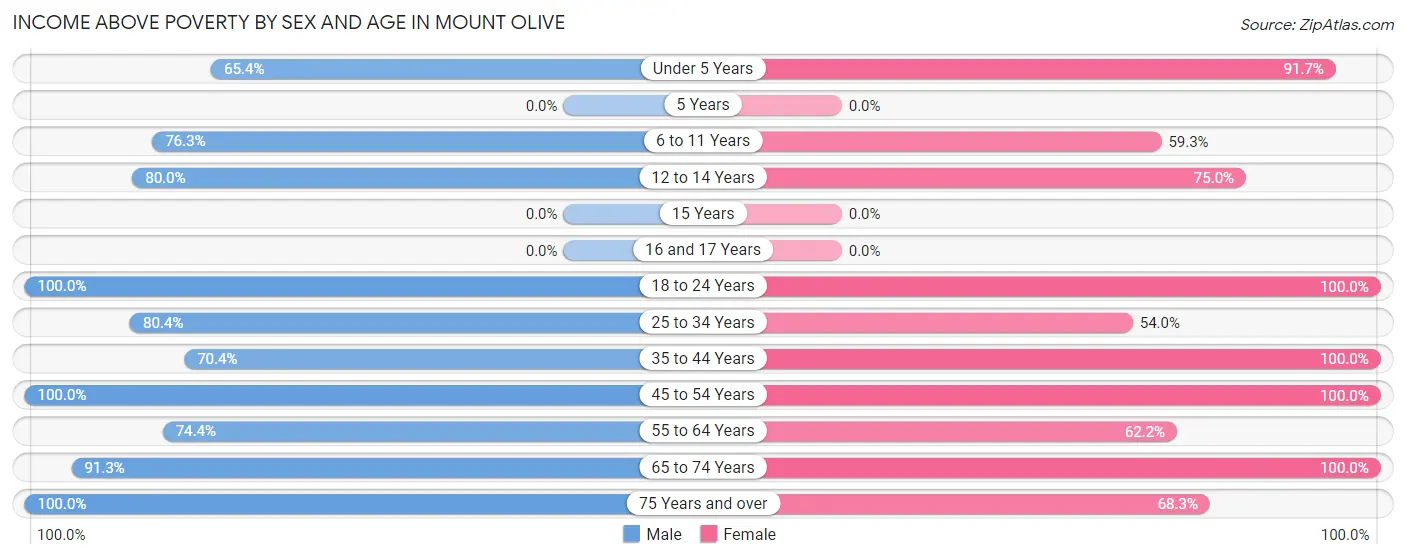
| Age Bracket | Male | Female |
| Under 5 Years | 17 (65.4%) | 33 (91.7%) |
| 5 Years | 0 (0.0%) | 0 (0.0%) |
| 6 to 11 Years | 103 (76.3%) | 89 (59.3%) |
| 12 to 14 Years | 16 (80.0%) | 6 (75.0%) |
| 15 Years | 0 (0.0%) | 0 (0.0%) |
| 16 and 17 Years | 0 (0.0%) | 0 (0.0%) |
| 18 to 24 Years | 121 (100.0%) | 24 (100.0%) |
| 25 to 34 Years | 201 (80.4%) | 74 (54.0%) |
| 35 to 44 Years | 19 (70.4%) | 87 (100.0%) |
| 45 to 54 Years | 44 (100.0%) | 66 (100.0%) |
| 55 to 64 Years | 29 (74.4%) | 51 (62.2%) |
| 65 to 74 Years | 21 (91.3%) | 30 (100.0%) |
| 75 Years and over | 8 (100.0%) | 28 (68.3%) |
| Total | 579 (83.1%) | 488 (68.9%) |
Income Below Poverty Among Married-Couple Families in Mount Olive
The poverty statistics for married-couple families in Mount Olive show that 0.7% or 2 of the total 271 families live below the poverty line. Families with 1 or 2 children have the highest poverty rate of 1.0%, comprising of 2 families. On the other hand, families with no children have the lowest poverty rate of 0.0%, which includes 0 families.
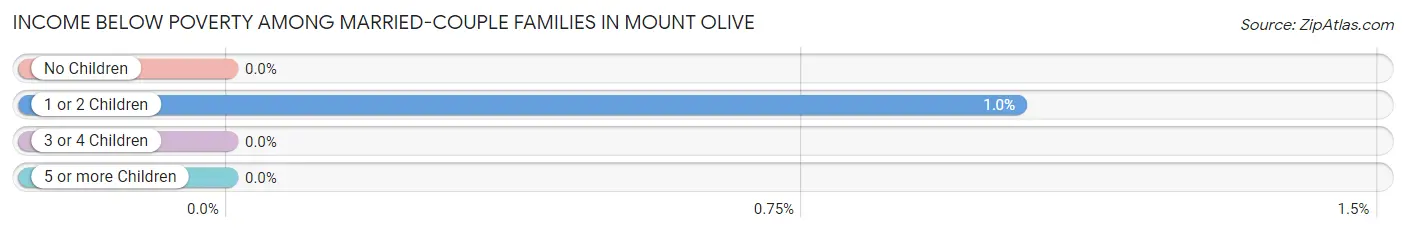
| Children | Above Poverty | Below Poverty |
| No Children | 53 (100.0%) | 0 (0.0%) |
| 1 or 2 Children | 193 (99.0%) | 2 (1.0%) |
| 3 or 4 Children | 23 (100.0%) | 0 (0.0%) |
| 5 or more Children | 0 (0.0%) | 0 (0.0%) |
| Total | 269 (99.3%) | 2 (0.7%) |
Income Below Poverty Among Single-Parent Households in Mount Olive
According to the poverty data in Mount Olive, 62.5% or 5 single-father households and 68.8% or 64 single-mother households are living below the poverty line. Among single-father households, those with 1 or 2 children have the highest poverty rate, with 5 households (100.0%) experiencing poverty. Likewise, among single-mother households, those with 1 or 2 children have the highest poverty rate, with 43 households (100.0%) falling below the poverty line.
| Children | Single Father | Single Mother |
| No Children | 0 (0.0%) | 9 (31.0%) |
| 1 or 2 Children | 5 (100.0%) | 43 (100.0%) |
| 3 or 4 Children | 0 (0.0%) | 12 (57.1%) |
| 5 or more Children | 0 (0.0%) | 0 (0.0%) |
| Total | 5 (62.5%) | 64 (68.8%) |
Income Below Poverty Among Married-Couple vs Single-Parent Households in Mount Olive
The poverty data for Mount Olive shows that 2 of the married-couple family households (0.7%) and 69 of the single-parent households (68.3%) are living below the poverty level. Within the married-couple family households, those with 1 or 2 children have the highest poverty rate, with 2 households (1.0%) falling below the poverty line. Among the single-parent households, those with 1 or 2 children have the highest poverty rate, with 48 household (100.0%) living below poverty.
| Children | Married-Couple Families | Single-Parent Households |
| No Children | 0 (0.0%) | 9 (28.1%) |
| 1 or 2 Children | 2 (1.0%) | 48 (100.0%) |
| 3 or 4 Children | 0 (0.0%) | 12 (57.1%) |
| 5 or more Children | 0 (0.0%) | 0 (0.0%) |
| Total | 2 (0.7%) | 69 (68.3%) |
Race in Mount Olive
The most populous races in Mount Olive are Black / African American (1,051 | 74.8%), White / Caucasian (337 | 24.0%), and Asian (17 | 1.2%).
| Race | # Population | % Population |
| Asian | 17 | 1.2% |
| Black / African American | 1,051 | 74.8% |
| Hawaiian / Pacific | 0 | 0.0% |
| Hispanic or Latino | 0 | 0.0% |
| Native / Alaskan | 0 | 0.0% |
| White / Caucasian | 337 | 24.0% |
| Two or more Races | 0 | 0.0% |
| Some other Race | 0 | 0.0% |
| Total | 1,405 | 100.0% |
Ancestry in Mount Olive
The most populous ancestries reported in Mount Olive are Irish (104 | 7.4%), American (54 | 3.8%), Italian (18 | 1.3%), Indian (Asian) (17 | 1.2%), and Scottish (15 | 1.1%), together accounting for 14.8% of all Mount Olive residents.
| Ancestry | # Population | % Population |
| African | 4 | 0.3% |
| American | 54 | 3.8% |
| English | 8 | 0.6% |
| French | 8 | 0.6% |
| Indian (Asian) | 17 | 1.2% |
| Irish | 104 | 7.4% |
| Italian | 18 | 1.3% |
| Scotch-Irish | 12 | 0.9% |
| Scottish | 15 | 1.1% |
| Subsaharan African | 4 | 0.3% | View All 10 Rows |
Immigrants in Mount Olive

| Immigration Origin | # Population | % Population | View All 0 Rows |
Sex and Age in Mount Olive
Sex and Age in Mount Olive
The most populous age groups in Mount Olive are 30 to 34 Years (233 | 33.4%) for men and 5 to 9 Years (187 | 26.4%) for women.
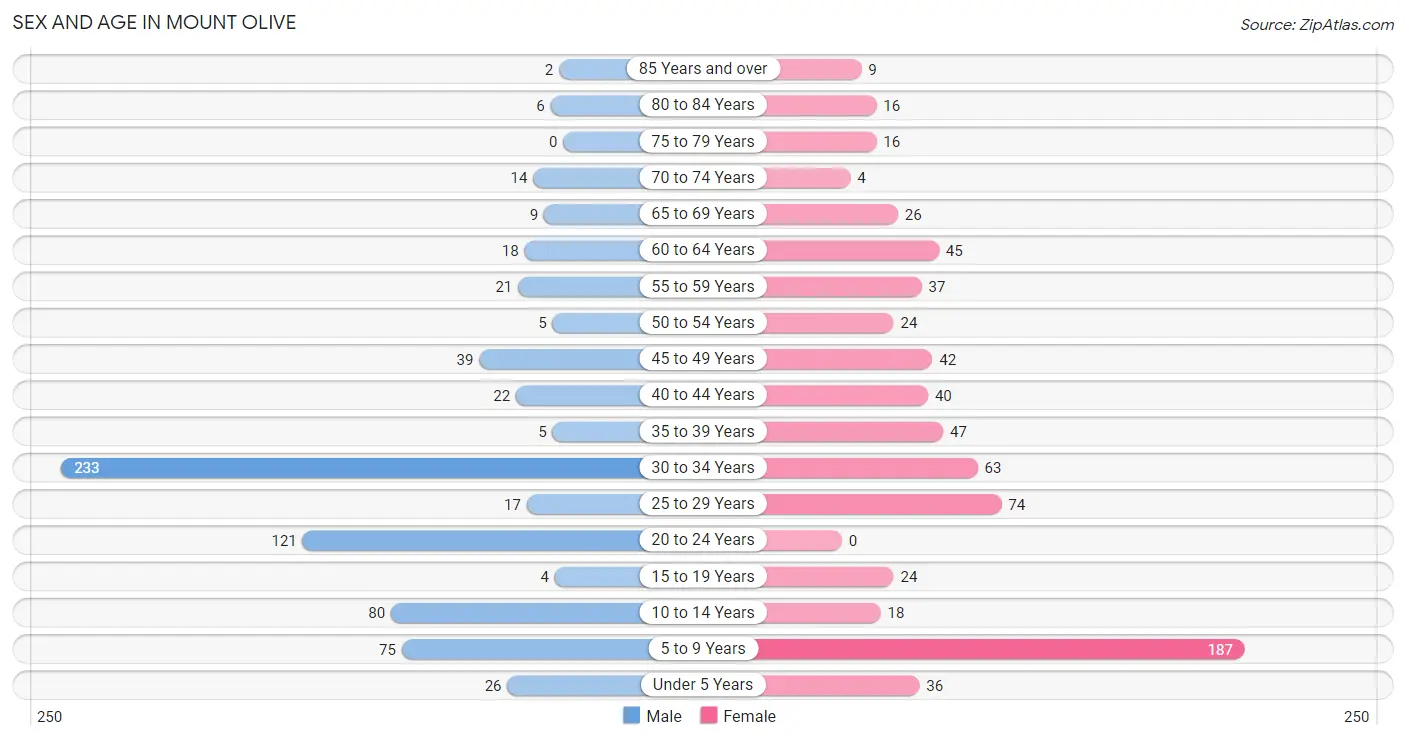
| Age Bracket | Male | Female |
| Under 5 Years | 26 (3.7%) | 36 (5.1%) |
| 5 to 9 Years | 75 (10.8%) | 187 (26.4%) |
| 10 to 14 Years | 80 (11.5%) | 18 (2.5%) |
| 15 to 19 Years | 4 (0.6%) | 24 (3.4%) |
| 20 to 24 Years | 121 (17.4%) | 0 (0.0%) |
| 25 to 29 Years | 17 (2.4%) | 74 (10.4%) |
| 30 to 34 Years | 233 (33.4%) | 63 (8.9%) |
| 35 to 39 Years | 5 (0.7%) | 47 (6.6%) |
| 40 to 44 Years | 22 (3.2%) | 40 (5.7%) |
| 45 to 49 Years | 39 (5.6%) | 42 (5.9%) |
| 50 to 54 Years | 5 (0.7%) | 24 (3.4%) |
| 55 to 59 Years | 21 (3.0%) | 37 (5.2%) |
| 60 to 64 Years | 18 (2.6%) | 45 (6.4%) |
| 65 to 69 Years | 9 (1.3%) | 26 (3.7%) |
| 70 to 74 Years | 14 (2.0%) | 4 (0.6%) |
| 75 to 79 Years | 0 (0.0%) | 16 (2.3%) |
| 80 to 84 Years | 6 (0.9%) | 16 (2.3%) |
| 85 Years and over | 2 (0.3%) | 9 (1.3%) |
| Total | 697 (100.0%) | 708 (100.0%) |
Families and Households in Mount Olive
Median Family Size in Mount Olive
The median family size in Mount Olive is 3.41 persons per family, with single female/mother families (93 | 25.0%) accounting for the largest median family size of 4.51 persons per family. On the other hand, single male/father families (8 | 2.1%) represent the smallest median family size with 2.88 persons per family.
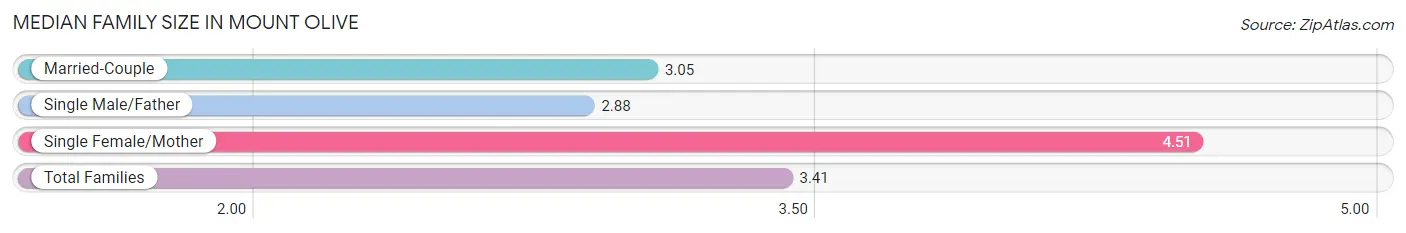
| Family Type | # Families | Family Size |
| Married-Couple | 271 (72.9%) | 3.05 |
| Single Male/Father | 8 (2.1%) | 2.88 |
| Single Female/Mother | 93 (25.0%) | 4.51 |
| Total Families | 372 (100.0%) | 3.41 |
Median Household Size in Mount Olive
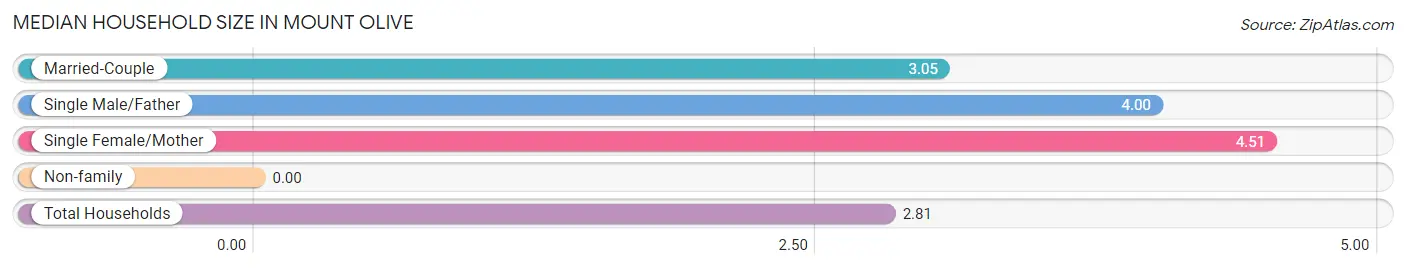
| Household Type | # Households | Household Size |
| Married-Couple | 271 (54.2%) | 3.05 |
| Single Male/Father | 8 (1.6%) | 4.00 |
| Single Female/Mother | 93 (18.6%) | 4.51 |
| Non-family | 128 (25.6%) | - |
| Total Households | 500 (100.0%) | 2.81 |
Household Size by Marriage Status in Mount Olive
Out of a total of 500 households in Mount Olive, 372 (74.4%) are family households, while 128 (25.6%) are nonfamily households. The most numerous type of family households are 4-person households, comprising 213, and the most common type of nonfamily households are 1-person households, comprising 128.
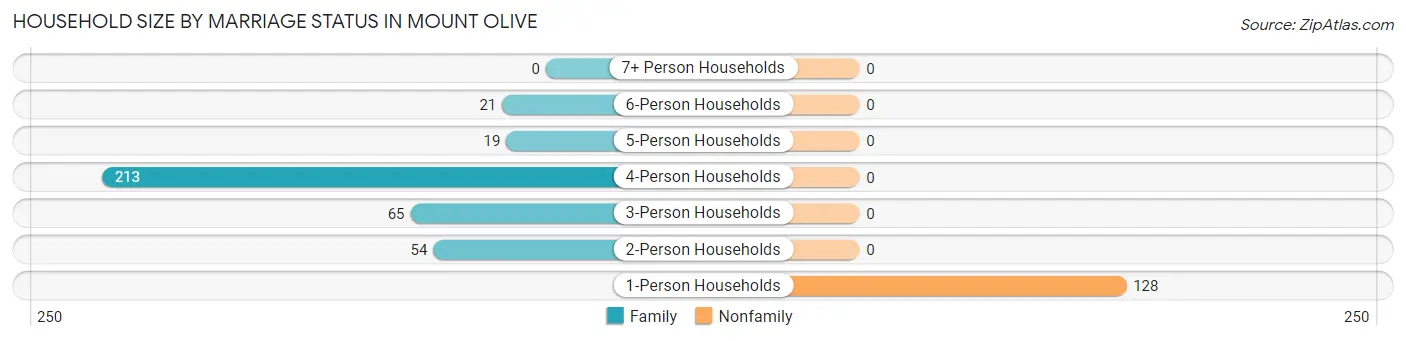
| Household Size | Family Households | Nonfamily Households |
| 1-Person Households | - | 128 (25.6%) |
| 2-Person Households | 54 (10.8%) | 0 (0.0%) |
| 3-Person Households | 65 (13.0%) | 0 (0.0%) |
| 4-Person Households | 213 (42.6%) | 0 (0.0%) |
| 5-Person Households | 19 (3.8%) | 0 (0.0%) |
| 6-Person Households | 21 (4.2%) | 0 (0.0%) |
| 7+ Person Households | 0 (0.0%) | 0 (0.0%) |
| Total | 372 (74.4%) | 128 (25.6%) |
Female Fertility in Mount Olive
Fertility by Age in Mount Olive
Average fertility rate in Mount Olive is 7.0 births per 1,000 women. Women in the age bracket of 20 to 34 years have the highest fertility rate with 15.0 births per 1,000 women. Women in the age bracket of 20 to 34 years acount for 100.0% of all women with births.
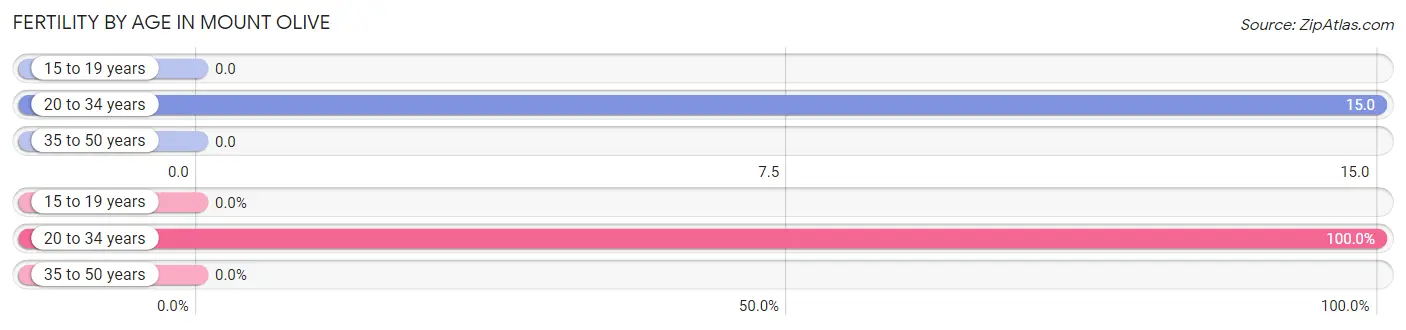
| Age Bracket | Women with Births | Births / 1,000 Women |
| 15 to 19 years | 0 (0.0%) | 0.0 |
| 20 to 34 years | 2 (100.0%) | 15.0 |
| 35 to 50 years | 0 (0.0%) | 0.0 |
| Total | 2 (100.0%) | 7.0 |
Fertility by Age by Marriage Status in Mount Olive
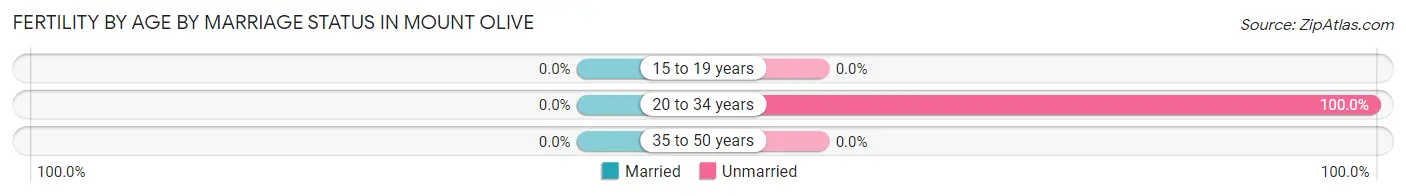
| Age Bracket | Married | Unmarried |
| 15 to 19 years | 0 (0.0%) | 0 (0.0%) |
| 20 to 34 years | 0 (0.0%) | 2 (100.0%) |
| 35 to 50 years | 0 (0.0%) | 0 (0.0%) |
| Total | 0 (0.0%) | 2 (100.0%) |
Fertility by Education in Mount Olive
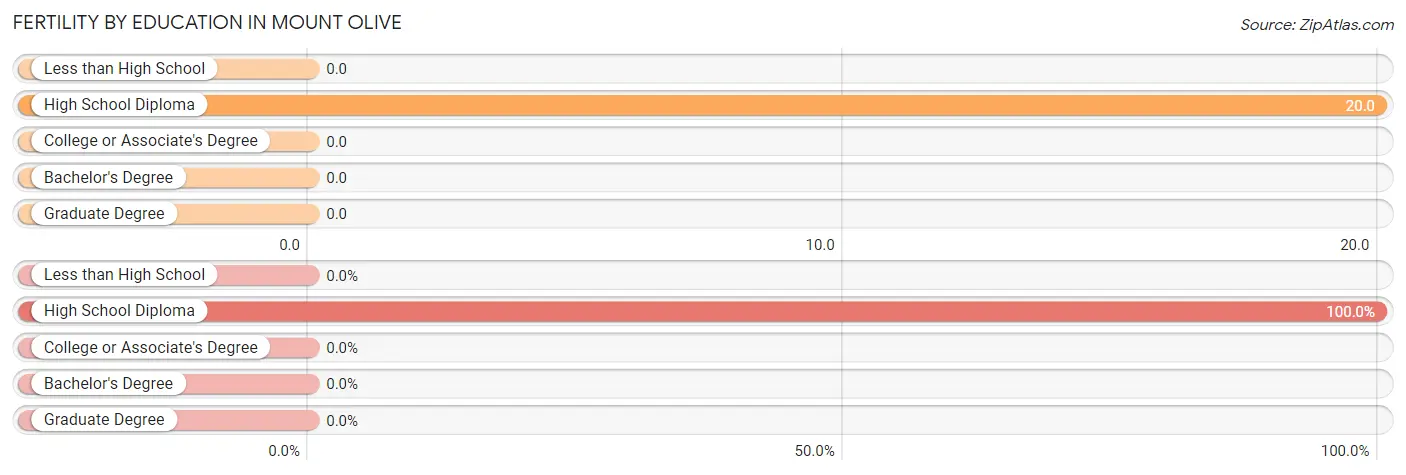
| Educational Attainment | Women with Births | Births / 1,000 Women |
| Less than High School | 0 (0.0%) | 0.0 |
| High School Diploma | 2 (100.0%) | 20.0 |
| College or Associate's Degree | 0 (0.0%) | 0.0 |
| Bachelor's Degree | 0 (0.0%) | 0.0 |
| Graduate Degree | 0 (0.0%) | 0.0 |
| Total | 2 (100.0%) | 7.0 |
Fertility by Education by Marriage Status in Mount Olive
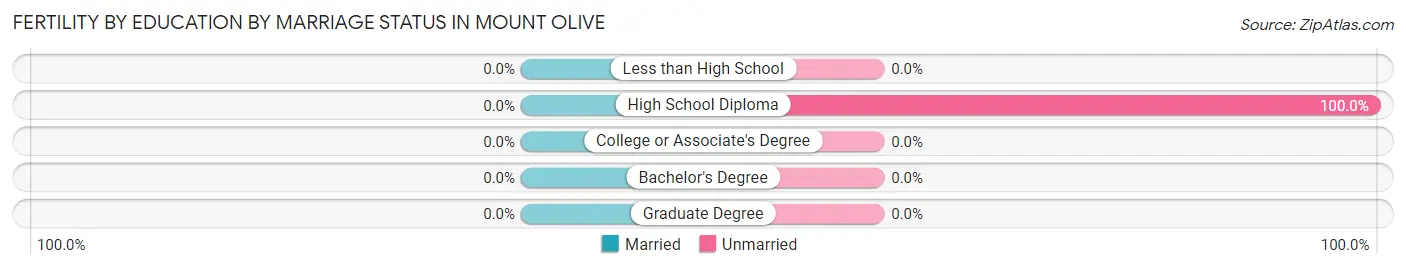
| Educational Attainment | Married | Unmarried |
| Less than High School | 0 (0.0%) | 0 (0.0%) |
| High School Diploma | 0 (0.0%) | 2 (100.0%) |
| College or Associate's Degree | 0 (0.0%) | 0 (0.0%) |
| Bachelor's Degree | 0 (0.0%) | 0 (0.0%) |
| Graduate Degree | 0 (0.0%) | 0 (0.0%) |
| Total | 0 (0.0%) | 2 (100.0%) |
Employment Characteristics in Mount Olive
Employment by Class of Employer in Mount Olive
Among the 645 employed individuals in Mount Olive, private company employees (426 | 66.0%), state government employees (137 | 21.2%), and federal government employees (28 | 4.3%) make up the most common classes of employment.
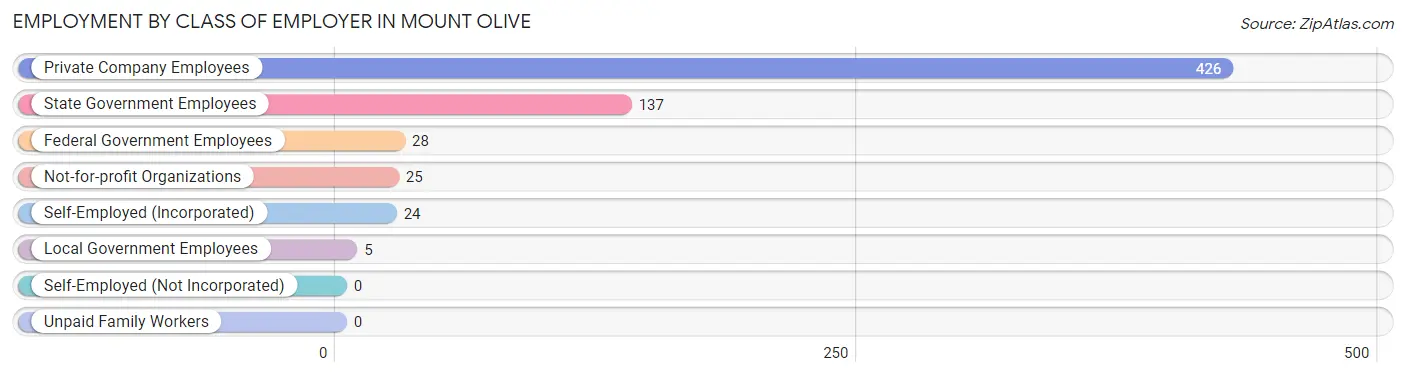
| Employer Class | # Employees | % Employees |
| Private Company Employees | 426 | 66.0% |
| Self-Employed (Incorporated) | 24 | 3.7% |
| Self-Employed (Not Incorporated) | 0 | 0.0% |
| Not-for-profit Organizations | 25 | 3.9% |
| Local Government Employees | 5 | 0.8% |
| State Government Employees | 137 | 21.2% |
| Federal Government Employees | 28 | 4.3% |
| Unpaid Family Workers | 0 | 0.0% |
| Total | 645 | 100.0% |
Employment Status by Age in Mount Olive
According to the labor force statistics for Mount Olive, out of the total population over 16 years of age (979), 68.0% or 666 individuals are in the labor force, with 3.2% or 21 of them unemployed. The age group with the highest labor force participation rate is 16 to 19 years, with 100.0% or 24 individuals in the labor force. Within the labor force, the 35 to 44 years age range has the highest percentage of unemployed individuals, with 25.9% or 21 of them being unemployed.
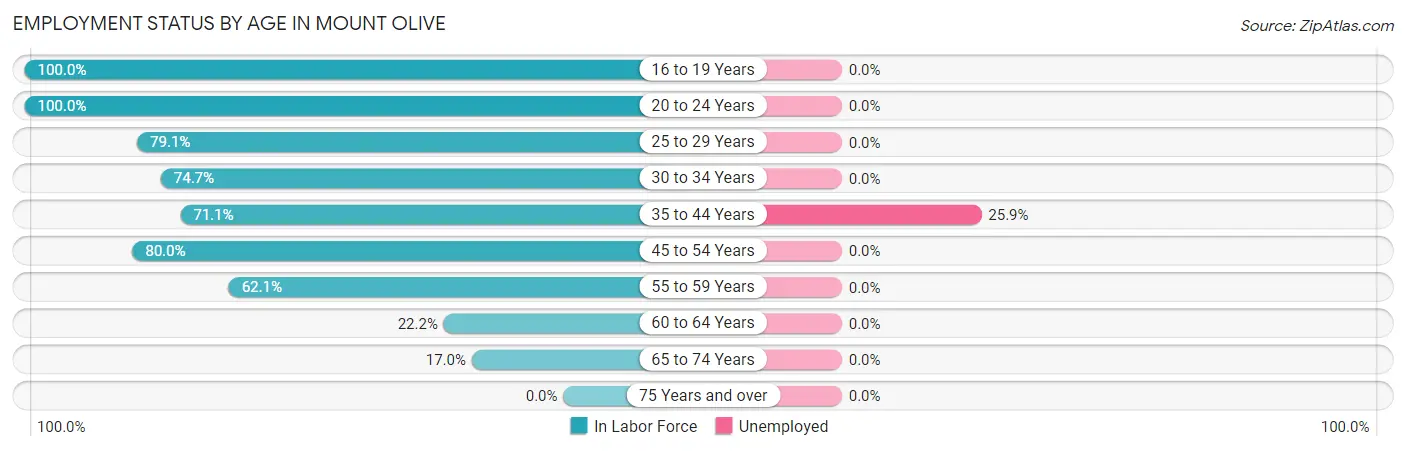
| Age Bracket | In Labor Force | Unemployed |
| 16 to 19 Years | 24 (100.0%) | 0 (0.0%) |
| 20 to 24 Years | 121 (100.0%) | 0 (0.0%) |
| 25 to 29 Years | 72 (79.1%) | 0 (0.0%) |
| 30 to 34 Years | 221 (74.7%) | 0 (0.0%) |
| 35 to 44 Years | 81 (71.1%) | 21 (25.9%) |
| 45 to 54 Years | 88 (80.0%) | 0 (0.0%) |
| 55 to 59 Years | 36 (62.1%) | 0 (0.0%) |
| 60 to 64 Years | 14 (22.2%) | 0 (0.0%) |
| 65 to 74 Years | 9 (17.0%) | 0 (0.0%) |
| 75 Years and over | 0 (0.0%) | 0 (0.0%) |
| Total | 666 (68.0%) | 21 (3.2%) |
Employment Status by Educational Attainment in Mount Olive
According to labor force statistics for Mount Olive, 69.9% of individuals (512) out of the total population between 25 and 64 years of age (732) are in the labor force, with 4.1% or 21 of them being unemployed. The group with the highest labor force participation rate are those with the educational attainment of college / associate degree, with 92.0% or 288 individuals in the labor force. Within the labor force, individuals with high school diploma education have the highest percentage of unemployment, with 15.4% or 21 of them being unemployed.
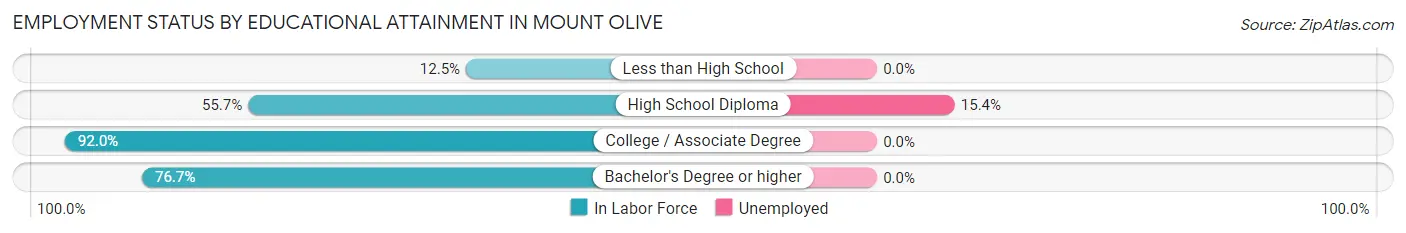
| Educational Attainment | In Labor Force | Unemployed |
| Less than High School | 9 (12.5%) | 0 (0.0%) |
| High School Diploma | 136 (55.7%) | 38 (15.4%) |
| College / Associate Degree | 288 (92.0%) | 0 (0.0%) |
| Bachelor's Degree or higher | 79 (76.7%) | 0 (0.0%) |
| Total | 512 (69.9%) | 30 (4.1%) |
Employment Occupations by Sex in Mount Olive
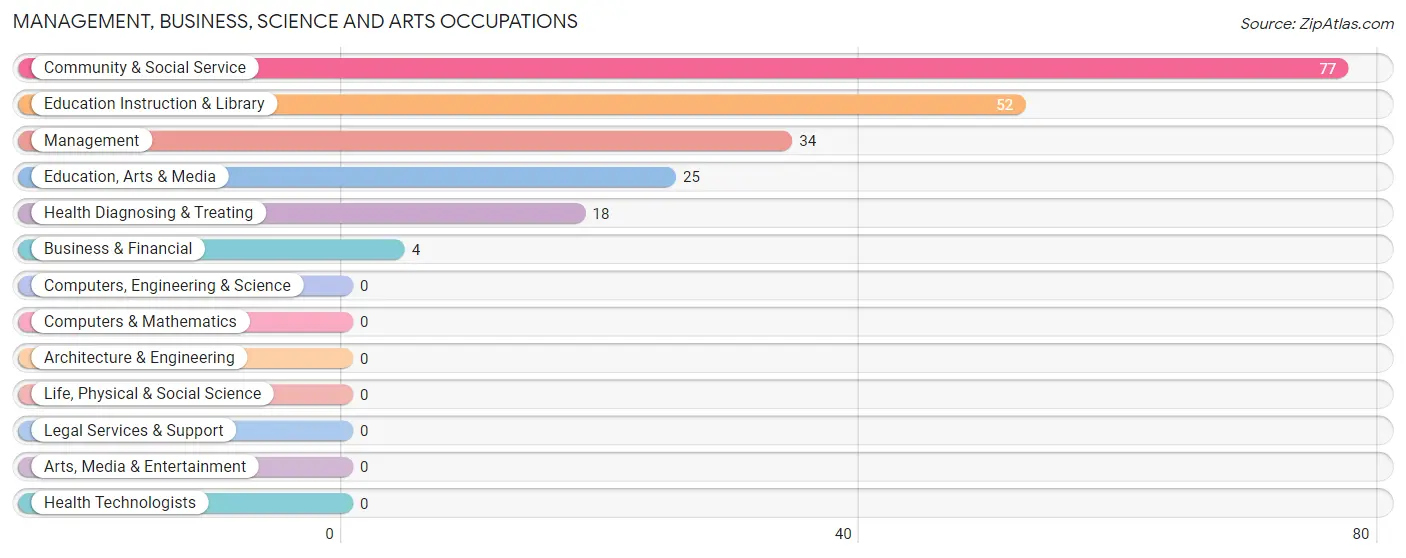
Management, Business, Science and Arts Occupations
The most common Management, Business, Science and Arts occupations in Mount Olive are Community & Social Service (77 | 11.9%), Education Instruction & Library (52 | 8.1%), Management (34 | 5.3%), Education, Arts & Media (25 | 3.9%), and Health Diagnosing & Treating (18 | 2.8%).
Management, Business, Science and Arts Occupations by Sex
Within the Management, Business, Science and Arts occupations in Mount Olive, the most male-oriented occupations are Education Instruction & Library (32.7%), Community & Social Service (22.1%), and Management (14.7%), while the most female-oriented occupations are Business & Financial (100.0%), Education, Arts & Media (100.0%), and Health Diagnosing & Treating (100.0%).
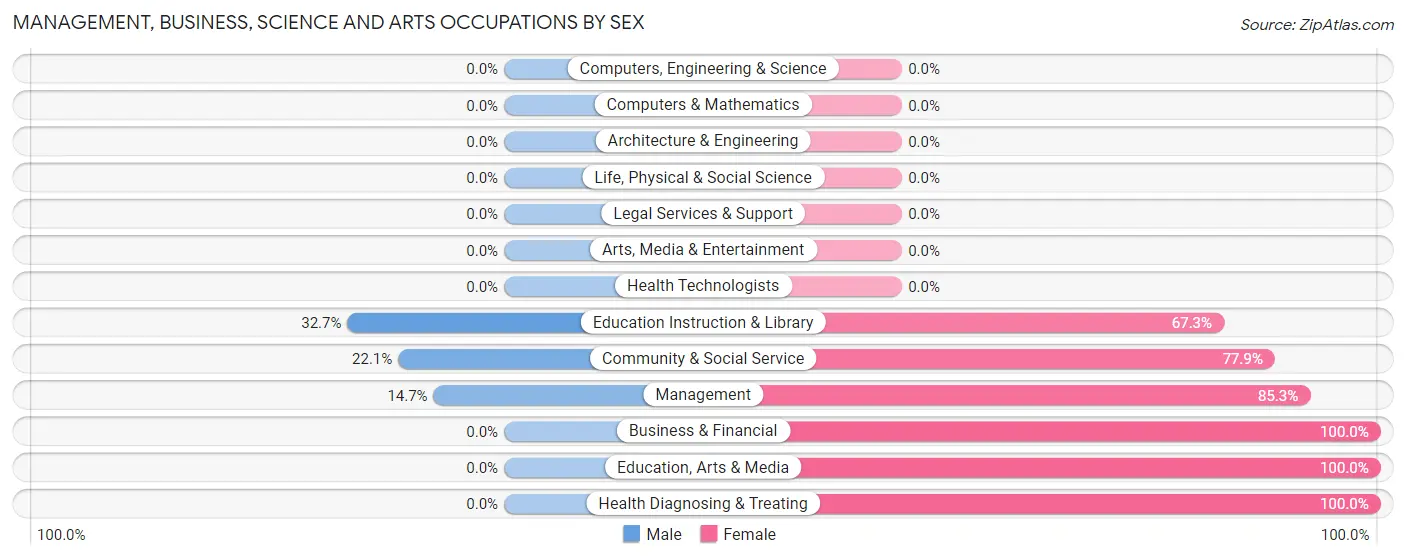
| Occupation | Male | Female |
| Management | 5 (14.7%) | 29 (85.3%) |
| Business & Financial | 0 (0.0%) | 4 (100.0%) |
| Computers, Engineering & Science | 0 (0.0%) | 0 (0.0%) |
| Computers & Mathematics | 0 (0.0%) | 0 (0.0%) |
| Architecture & Engineering | 0 (0.0%) | 0 (0.0%) |
| Life, Physical & Social Science | 0 (0.0%) | 0 (0.0%) |
| Community & Social Service | 17 (22.1%) | 60 (77.9%) |
| Education, Arts & Media | 0 (0.0%) | 25 (100.0%) |
| Legal Services & Support | 0 (0.0%) | 0 (0.0%) |
| Education Instruction & Library | 17 (32.7%) | 35 (67.3%) |
| Arts, Media & Entertainment | 0 (0.0%) | 0 (0.0%) |
| Health Diagnosing & Treating | 0 (0.0%) | 18 (100.0%) |
| Health Technologists | 0 (0.0%) | 0 (0.0%) |
| Total (Category) | 22 (16.5%) | 111 (83.5%) |
| Total (Overall) | 351 (54.4%) | 294 (45.6%) |
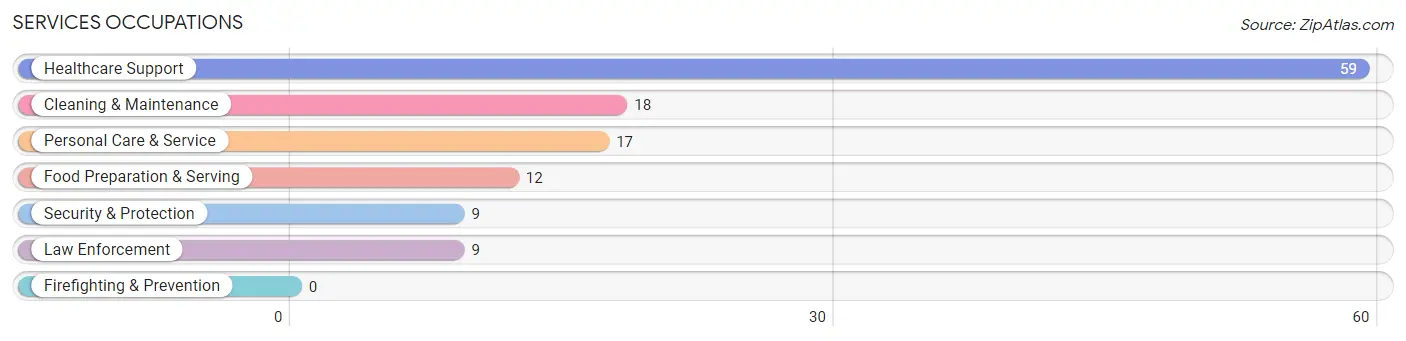
Services Occupations
The most common Services occupations in Mount Olive are Healthcare Support (59 | 9.1%), Cleaning & Maintenance (18 | 2.8%), Personal Care & Service (17 | 2.6%), Food Preparation & Serving (12 | 1.9%), and Security & Protection (9 | 1.4%).
Services Occupations by Sex
Within the Services occupations in Mount Olive, the most male-oriented occupations are Healthcare Support (74.6%), Food Preparation & Serving (16.7%), and Cleaning & Maintenance (11.1%), while the most female-oriented occupations are Security & Protection (100.0%), Law Enforcement (100.0%), and Personal Care & Service (100.0%).
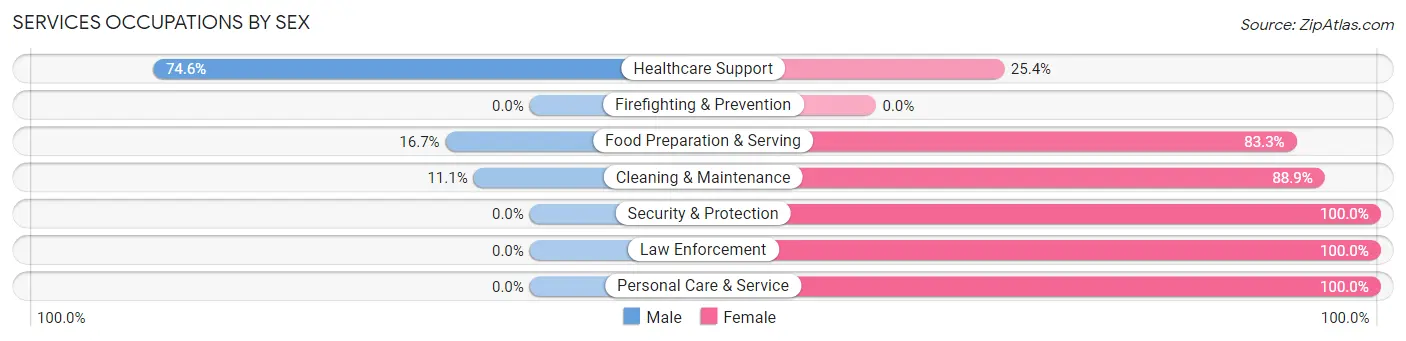
| Occupation | Male | Female |
| Healthcare Support | 44 (74.6%) | 15 (25.4%) |
| Security & Protection | 0 (0.0%) | 9 (100.0%) |
| Firefighting & Prevention | 0 (0.0%) | 0 (0.0%) |
| Law Enforcement | 0 (0.0%) | 9 (100.0%) |
| Food Preparation & Serving | 2 (16.7%) | 10 (83.3%) |
| Cleaning & Maintenance | 2 (11.1%) | 16 (88.9%) |
| Personal Care & Service | 0 (0.0%) | 17 (100.0%) |
| Total (Category) | 48 (41.7%) | 67 (58.3%) |
| Total (Overall) | 351 (54.4%) | 294 (45.6%) |
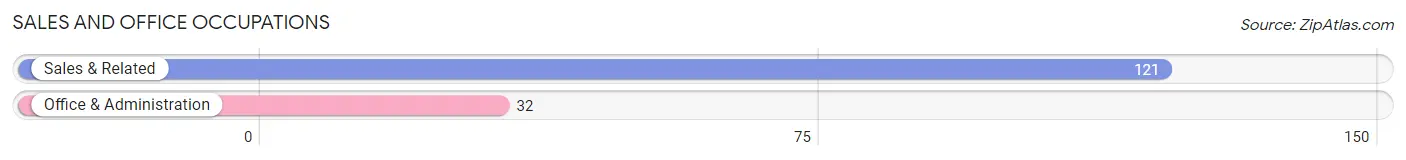
Sales and Office Occupations
The most common Sales and Office occupations in Mount Olive are Sales & Related (121 | 18.8%), and Office & Administration (32 | 5.0%).
Sales and Office Occupations by Sex
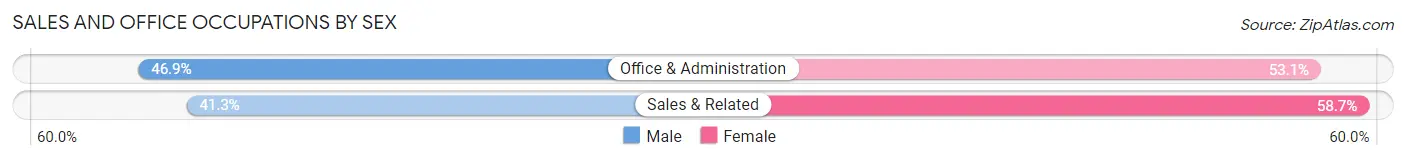
| Occupation | Male | Female |
| Sales & Related | 50 (41.3%) | 71 (58.7%) |
| Office & Administration | 15 (46.9%) | 17 (53.1%) |
| Total (Category) | 65 (42.5%) | 88 (57.5%) |
| Total (Overall) | 351 (54.4%) | 294 (45.6%) |
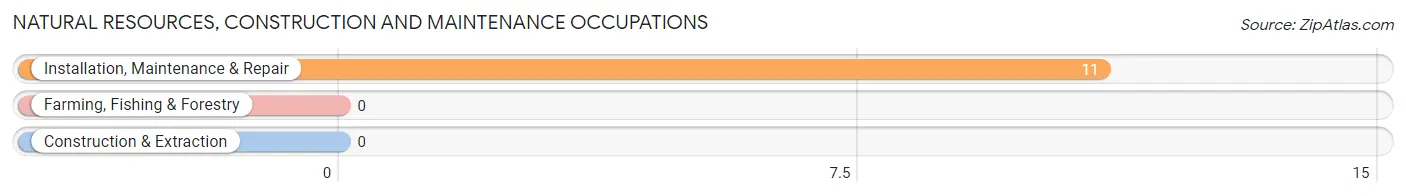
Natural Resources, Construction and Maintenance Occupations
The most common Natural Resources, Construction and Maintenance occupations in Mount Olive are , and Installation, Maintenance & Repair (11 | 1.7%).
Natural Resources, Construction and Maintenance Occupations by Sex
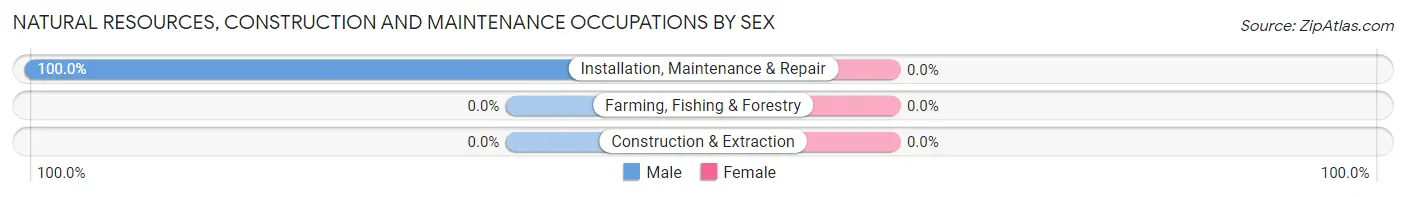
| Occupation | Male | Female |
| Farming, Fishing & Forestry | 0 (0.0%) | 0 (0.0%) |
| Construction & Extraction | 0 (0.0%) | 0 (0.0%) |
| Installation, Maintenance & Repair | 11 (100.0%) | 0 (0.0%) |
| Total (Category) | 11 (100.0%) | 0 (0.0%) |
| Total (Overall) | 351 (54.4%) | 294 (45.6%) |
Production, Transportation and Moving Occupations
The most common Production, Transportation and Moving occupations in Mount Olive are Material Moving (178 | 27.6%), and Production (55 | 8.5%).
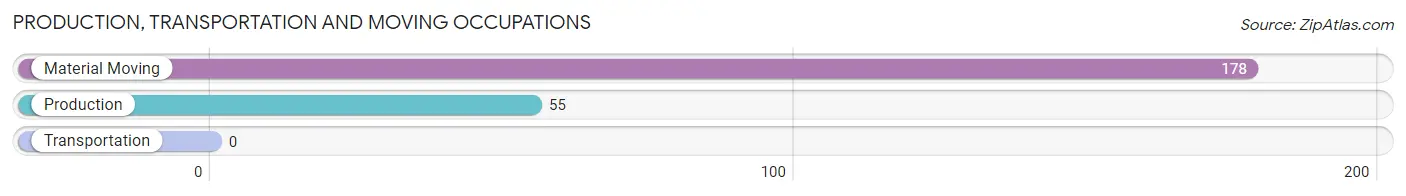
Production, Transportation and Moving Occupations by Sex
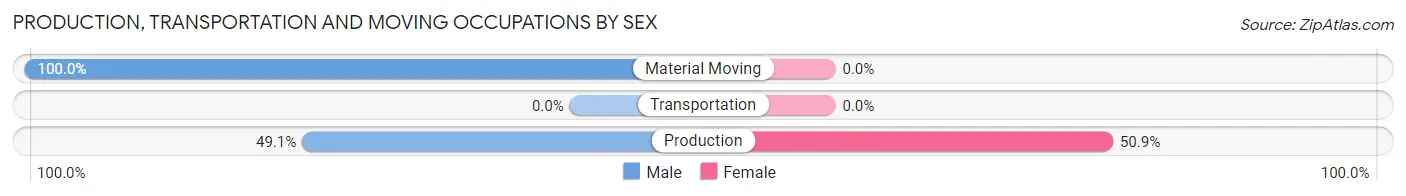
| Occupation | Male | Female |
| Production | 27 (49.1%) | 28 (50.9%) |
| Transportation | 0 (0.0%) | 0 (0.0%) |
| Material Moving | 178 (100.0%) | 0 (0.0%) |
| Total (Category) | 205 (88.0%) | 28 (12.0%) |
| Total (Overall) | 351 (54.4%) | 294 (45.6%) |
Employment Industries by Sex in Mount Olive
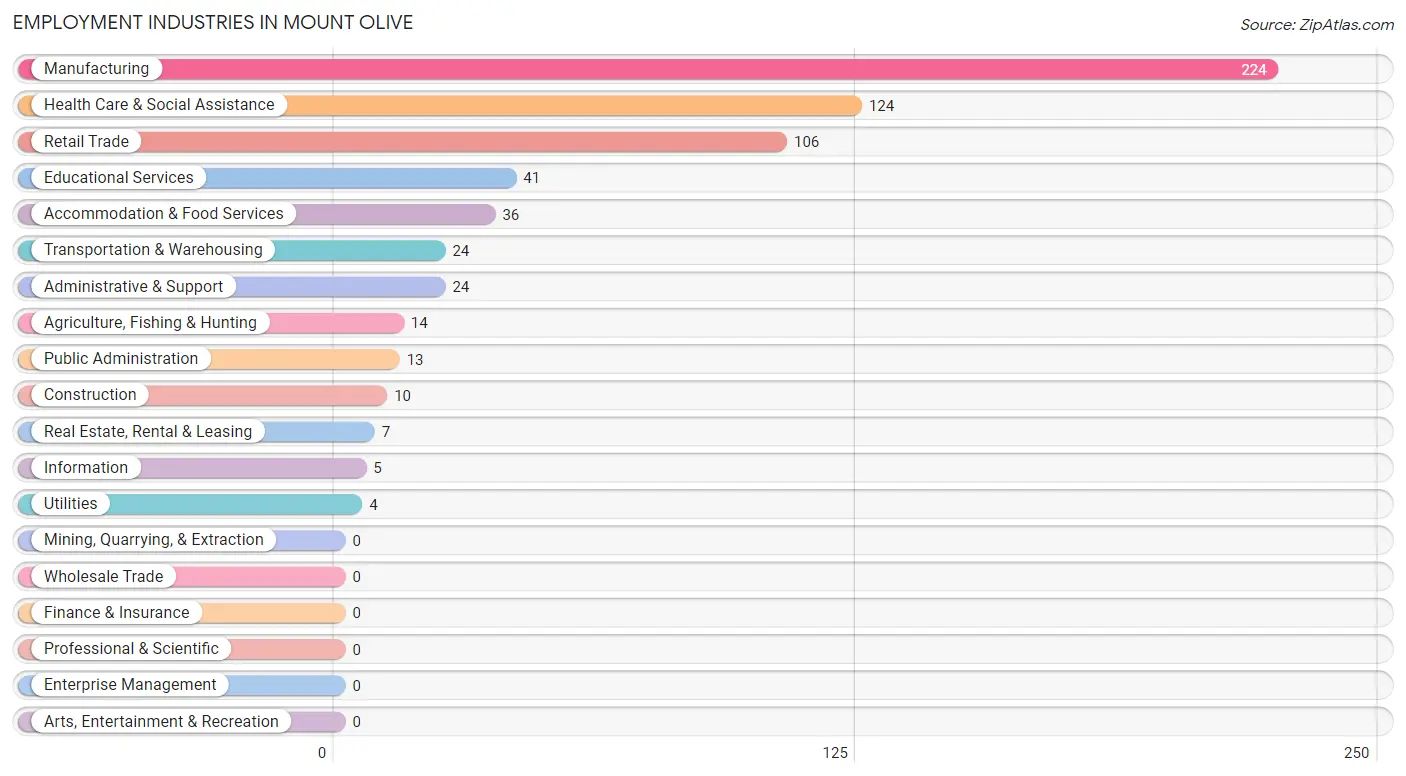
Employment Industries in Mount Olive
The major employment industries in Mount Olive include Manufacturing (224 | 34.7%), Health Care & Social Assistance (124 | 19.2%), Retail Trade (106 | 16.4%), Educational Services (41 | 6.4%), and Accommodation & Food Services (36 | 5.6%).
Employment Industries by Sex in Mount Olive
The Mount Olive industries that see more men than women are Construction (100.0%), Utilities (100.0%), and Manufacturing (87.5%), whereas the industries that tend to have a higher number of women are Information (100.0%), Real Estate, Rental & Leasing (100.0%), and Administrative & Support (100.0%).
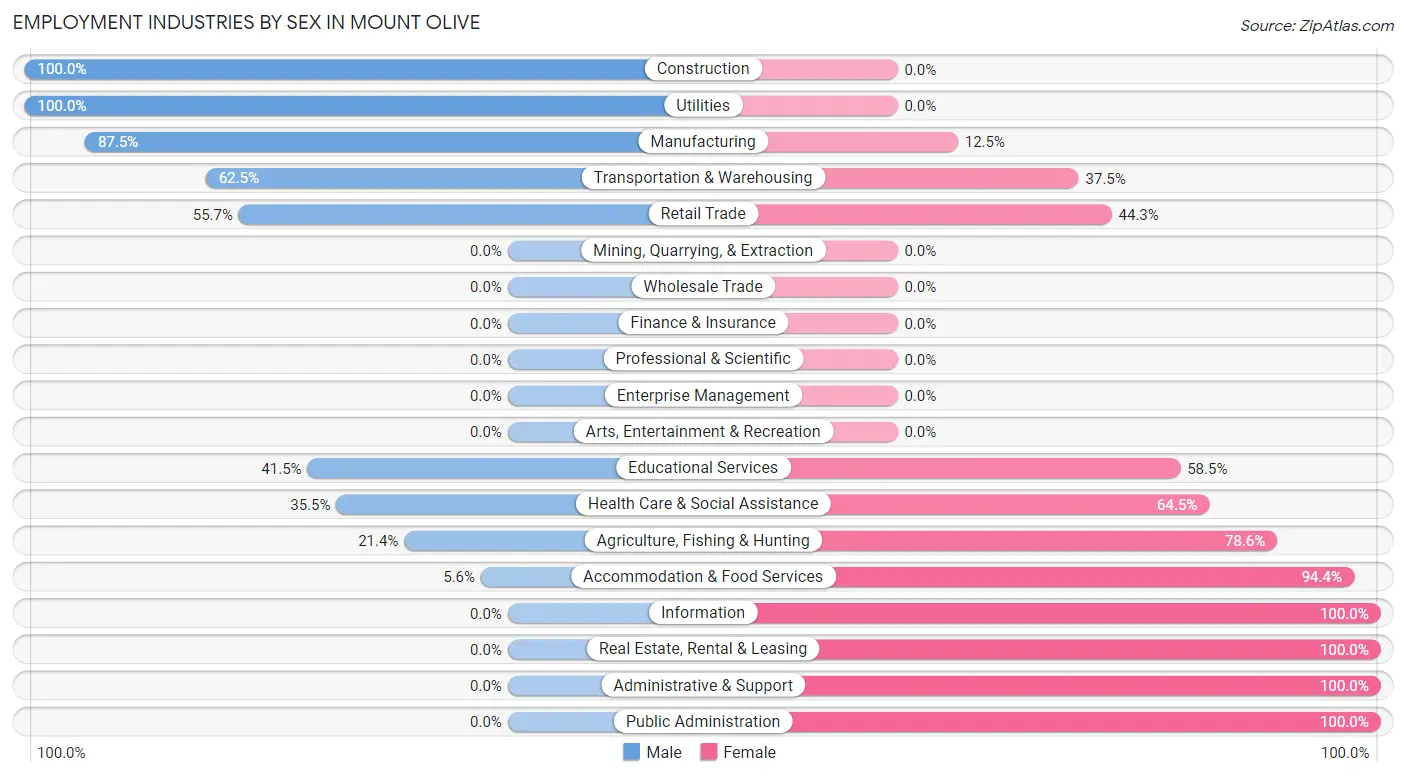
| Industry | Male | Female |
| Agriculture, Fishing & Hunting | 3 (21.4%) | 11 (78.6%) |
| Mining, Quarrying, & Extraction | 0 (0.0%) | 0 (0.0%) |
| Construction | 10 (100.0%) | 0 (0.0%) |
| Manufacturing | 196 (87.5%) | 28 (12.5%) |
| Wholesale Trade | 0 (0.0%) | 0 (0.0%) |
| Retail Trade | 59 (55.7%) | 47 (44.3%) |
| Transportation & Warehousing | 15 (62.5%) | 9 (37.5%) |
| Utilities | 4 (100.0%) | 0 (0.0%) |
| Information | 0 (0.0%) | 5 (100.0%) |
| Finance & Insurance | 0 (0.0%) | 0 (0.0%) |
| Real Estate, Rental & Leasing | 0 (0.0%) | 7 (100.0%) |
| Professional & Scientific | 0 (0.0%) | 0 (0.0%) |
| Enterprise Management | 0 (0.0%) | 0 (0.0%) |
| Administrative & Support | 0 (0.0%) | 24 (100.0%) |
| Educational Services | 17 (41.5%) | 24 (58.5%) |
| Health Care & Social Assistance | 44 (35.5%) | 80 (64.5%) |
| Arts, Entertainment & Recreation | 0 (0.0%) | 0 (0.0%) |
| Accommodation & Food Services | 2 (5.6%) | 34 (94.4%) |
| Public Administration | 0 (0.0%) | 13 (100.0%) |
| Total | 351 (54.4%) | 294 (45.6%) |
Education in Mount Olive
School Enrollment in Mount Olive
The most common levels of schooling among the 410 students in Mount Olive are elementary school (184 | 44.9%), college / undergraduate (80 | 19.5%), and middle school (45 | 11.0%).
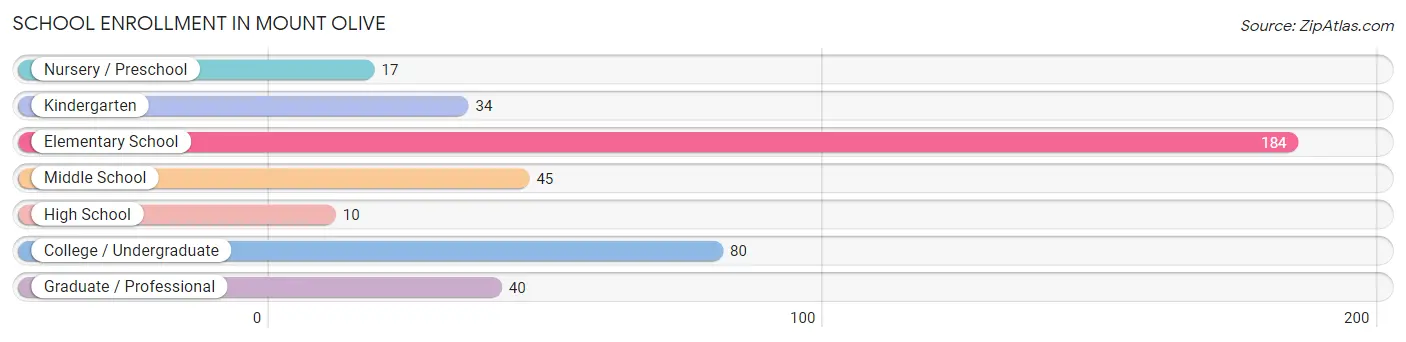
| School Level | # Students | % Students |
| Nursery / Preschool | 17 | 4.2% |
| Kindergarten | 34 | 8.3% |
| Elementary School | 184 | 44.9% |
| Middle School | 45 | 11.0% |
| High School | 10 | 2.4% |
| College / Undergraduate | 80 | 19.5% |
| Graduate / Professional | 40 | 9.8% |
| Total | 410 | 100.0% |
School Enrollment by Age by Funding Source in Mount Olive
Out of a total of 410 students who are enrolled in schools in Mount Olive, 151 (36.8%) attend a private institution, while the remaining 259 (63.2%) are enrolled in public schools. The age group of 35 years and over has the highest likelihood of being enrolled in private schools, with 23 (100.0% in the age bracket) enrolled. Conversely, the age group of 3 to 4 year olds has the lowest likelihood of being enrolled in a private school, with 17 (100.0% in the age bracket) attending a public institution.
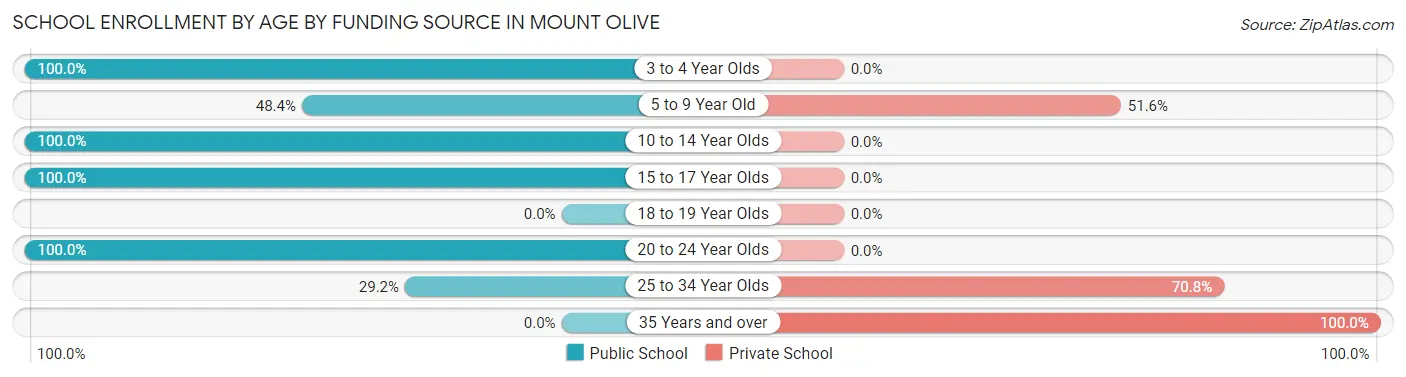
| Age Bracket | Public School | Private School |
| 3 to 4 Year Olds | 17 (100.0%) | 0 (0.0%) |
| 5 to 9 Year Old | 104 (48.4%) | 111 (51.6%) |
| 10 to 14 Year Olds | 54 (100.0%) | 0 (0.0%) |
| 15 to 17 Year Olds | 4 (100.0%) | 0 (0.0%) |
| 18 to 19 Year Olds | 0 (0.0%) | 0 (0.0%) |
| 20 to 24 Year Olds | 73 (100.0%) | 0 (0.0%) |
| 25 to 34 Year Olds | 7 (29.2%) | 17 (70.8%) |
| 35 Years and over | 0 (0.0%) | 23 (100.0%) |
| Total | 259 (63.2%) | 151 (36.8%) |
Educational Attainment by Field of Study in Mount Olive
Education (46 | 38.0%), business (31 | 25.6%), arts & humanities (20 | 16.5%), bio, nature & agricultural (17 | 14.1%), and computers & mathematics (7 | 5.8%) are the most common fields of study among 121 individuals in Mount Olive who have obtained a bachelor's degree or higher.
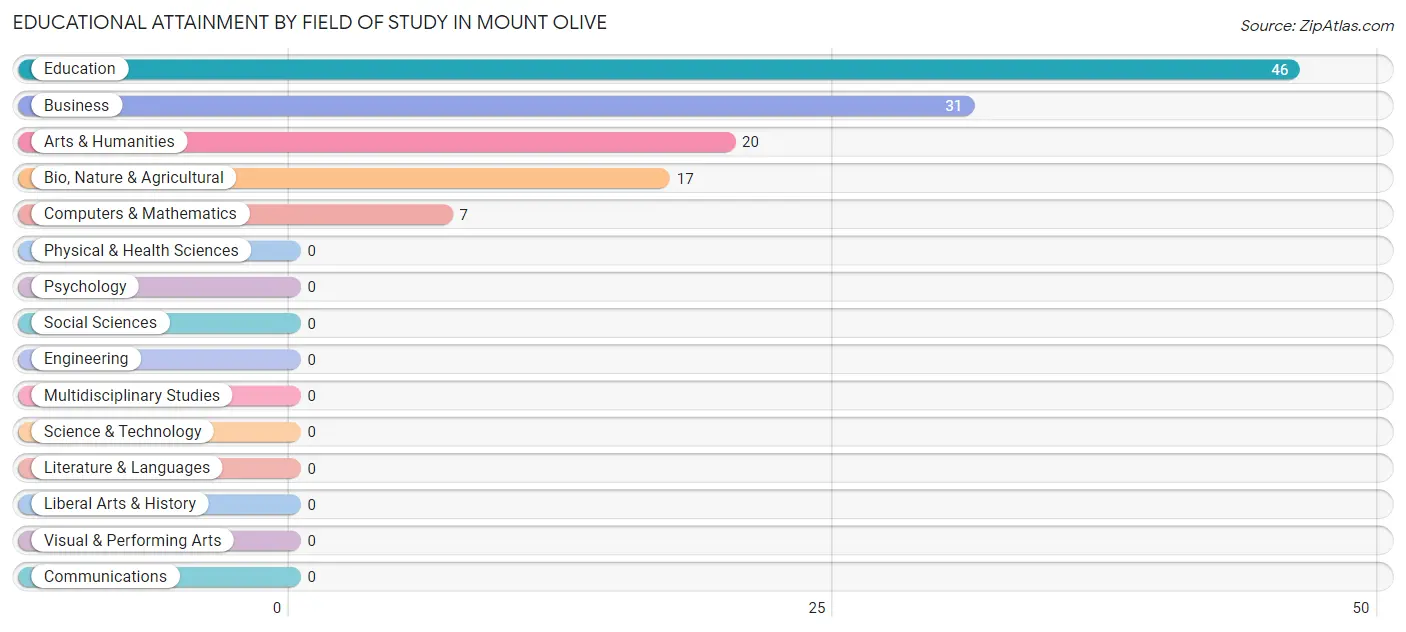
| Field of Study | # Graduates | % Graduates |
| Computers & Mathematics | 7 | 5.8% |
| Bio, Nature & Agricultural | 17 | 14.1% |
| Physical & Health Sciences | 0 | 0.0% |
| Psychology | 0 | 0.0% |
| Social Sciences | 0 | 0.0% |
| Engineering | 0 | 0.0% |
| Multidisciplinary Studies | 0 | 0.0% |
| Science & Technology | 0 | 0.0% |
| Business | 31 | 25.6% |
| Education | 46 | 38.0% |
| Literature & Languages | 0 | 0.0% |
| Liberal Arts & History | 0 | 0.0% |
| Visual & Performing Arts | 0 | 0.0% |
| Communications | 0 | 0.0% |
| Arts & Humanities | 20 | 16.5% |
| Total | 121 | 100.0% |
Transportation & Commute in Mount Olive
Vehicle Availability by Sex in Mount Olive
The most prevalent vehicle ownership categories in Mount Olive are males with 2 vehicles (184, accounting for 52.4%) and females with 2 vehicles (57, making up 62.6%).
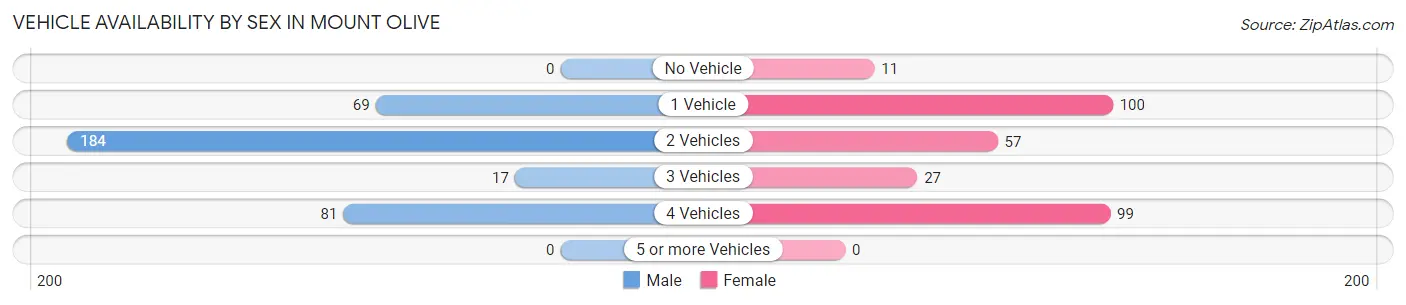
| Vehicles Available | Male | Female |
| No Vehicle | 0 (0.0%) | 11 (3.7%) |
| 1 Vehicle | 69 (19.7%) | 100 (34.0%) |
| 2 Vehicles | 184 (52.4%) | 57 (19.4%) |
| 3 Vehicles | 17 (4.8%) | 27 (9.2%) |
| 4 Vehicles | 81 (23.1%) | 99 (33.7%) |
| 5 or more Vehicles | 0 (0.0%) | 0 (0.0%) |
| Total | 351 (100.0%) | 294 (100.0%) |
Commute Time in Mount Olive
The most frequently occuring commute durations in Mount Olive are 30 to 34 minutes (259 commuters, 40.7%), 20 to 24 minutes (109 commuters, 17.1%), and 5 to 9 minutes (74 commuters, 11.6%).
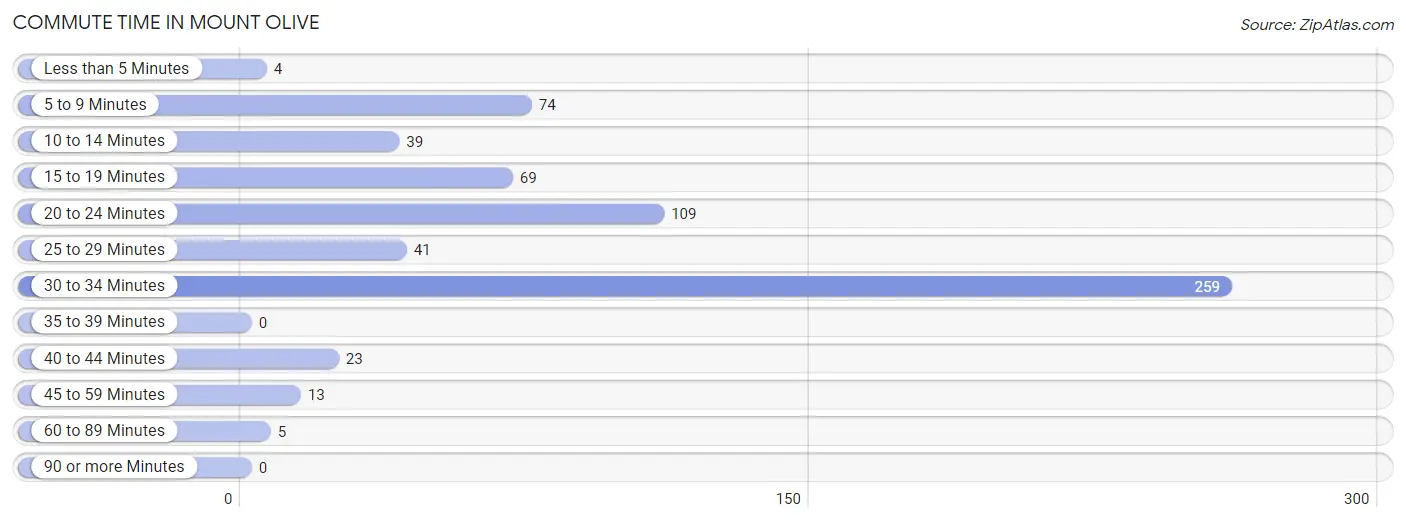
| Commute Time | # Commuters | % Commuters |
| Less than 5 Minutes | 4 | 0.6% |
| 5 to 9 Minutes | 74 | 11.6% |
| 10 to 14 Minutes | 39 | 6.1% |
| 15 to 19 Minutes | 69 | 10.8% |
| 20 to 24 Minutes | 109 | 17.1% |
| 25 to 29 Minutes | 41 | 6.5% |
| 30 to 34 Minutes | 259 | 40.7% |
| 35 to 39 Minutes | 0 | 0.0% |
| 40 to 44 Minutes | 23 | 3.6% |
| 45 to 59 Minutes | 13 | 2.0% |
| 60 to 89 Minutes | 5 | 0.8% |
| 90 or more Minutes | 0 | 0.0% |
Commute Time by Sex in Mount Olive
The most common commute times in Mount Olive are 30 to 34 minutes (184 commuters, 53.2%) for males and 30 to 34 minutes (75 commuters, 25.9%) for females.
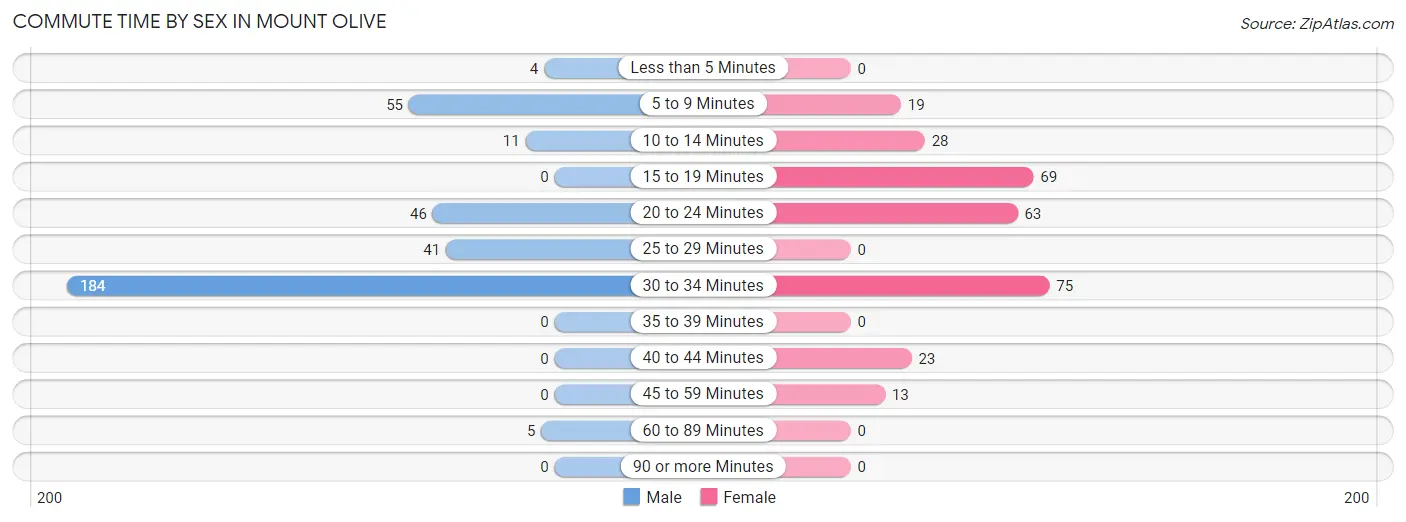
| Commute Time | Male | Female |
| Less than 5 Minutes | 4 (1.2%) | 0 (0.0%) |
| 5 to 9 Minutes | 55 (15.9%) | 19 (6.6%) |
| 10 to 14 Minutes | 11 (3.2%) | 28 (9.7%) |
| 15 to 19 Minutes | 0 (0.0%) | 69 (23.8%) |
| 20 to 24 Minutes | 46 (13.3%) | 63 (21.7%) |
| 25 to 29 Minutes | 41 (11.8%) | 0 (0.0%) |
| 30 to 34 Minutes | 184 (53.2%) | 75 (25.9%) |
| 35 to 39 Minutes | 0 (0.0%) | 0 (0.0%) |
| 40 to 44 Minutes | 0 (0.0%) | 23 (7.9%) |
| 45 to 59 Minutes | 0 (0.0%) | 13 (4.5%) |
| 60 to 89 Minutes | 5 (1.5%) | 0 (0.0%) |
| 90 or more Minutes | 0 (0.0%) | 0 (0.0%) |
Time of Departure to Work by Sex in Mount Olive
The most frequent times of departure to work in Mount Olive are 6:00 AM to 6:29 AM (173, 50.0%) for males and 6:00 AM to 6:29 AM (76, 26.2%) for females.
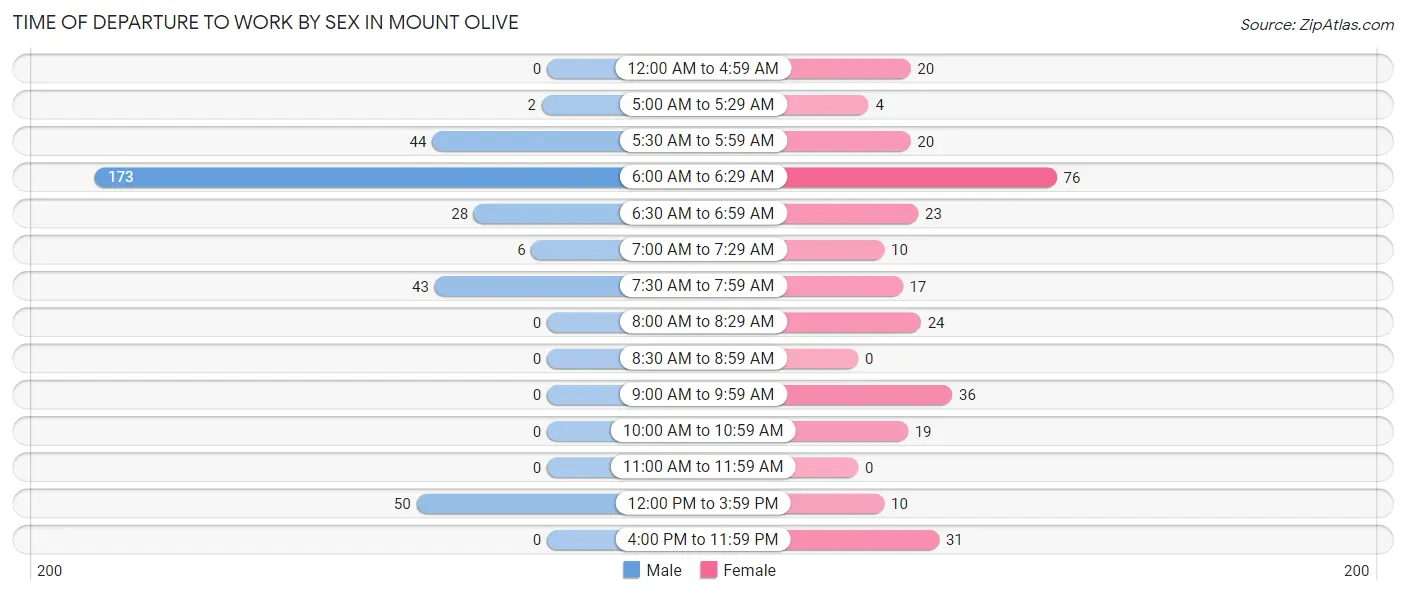
| Time of Departure | Male | Female |
| 12:00 AM to 4:59 AM | 0 (0.0%) | 20 (6.9%) |
| 5:00 AM to 5:29 AM | 2 (0.6%) | 4 (1.4%) |
| 5:30 AM to 5:59 AM | 44 (12.7%) | 20 (6.9%) |
| 6:00 AM to 6:29 AM | 173 (50.0%) | 76 (26.2%) |
| 6:30 AM to 6:59 AM | 28 (8.1%) | 23 (7.9%) |
| 7:00 AM to 7:29 AM | 6 (1.7%) | 10 (3.5%) |
| 7:30 AM to 7:59 AM | 43 (12.4%) | 17 (5.9%) |
| 8:00 AM to 8:29 AM | 0 (0.0%) | 24 (8.3%) |
| 8:30 AM to 8:59 AM | 0 (0.0%) | 0 (0.0%) |
| 9:00 AM to 9:59 AM | 0 (0.0%) | 36 (12.4%) |
| 10:00 AM to 10:59 AM | 0 (0.0%) | 19 (6.6%) |
| 11:00 AM to 11:59 AM | 0 (0.0%) | 0 (0.0%) |
| 12:00 PM to 3:59 PM | 50 (14.4%) | 10 (3.5%) |
| 4:00 PM to 11:59 PM | 0 (0.0%) | 31 (10.7%) |
| Total | 346 (100.0%) | 290 (100.0%) |
Housing Occupancy in Mount Olive
Occupancy by Ownership in Mount Olive
Of the total 500 dwellings in Mount Olive, owner-occupied units account for 353 (70.6%), while renter-occupied units make up 147 (29.4%).
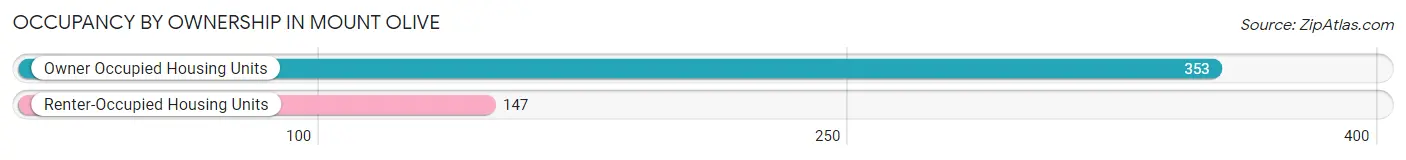
| Occupancy | # Housing Units | % Housing Units |
| Owner Occupied Housing Units | 353 | 70.6% |
| Renter-Occupied Housing Units | 147 | 29.4% |
| Total Occupied Housing Units | 500 | 100.0% |
Occupancy by Household Size in Mount Olive
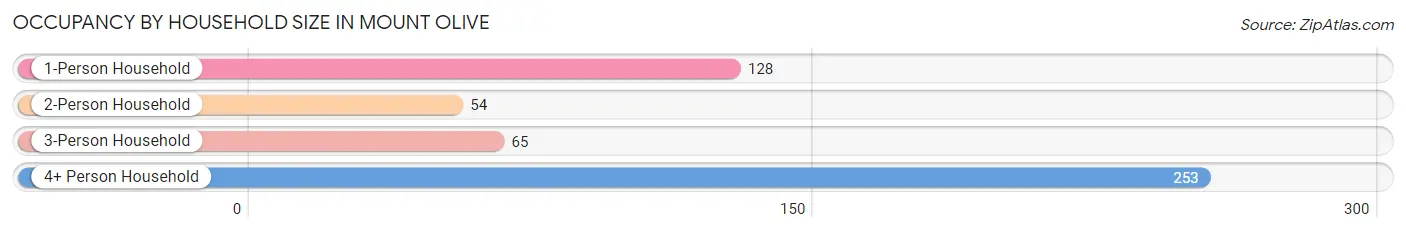
| Household Size | # Housing Units | % Housing Units |
| 1-Person Household | 128 | 25.6% |
| 2-Person Household | 54 | 10.8% |
| 3-Person Household | 65 | 13.0% |
| 4+ Person Household | 253 | 50.6% |
| Total Housing Units | 500 | 100.0% |
Occupancy by Ownership by Household Size in Mount Olive
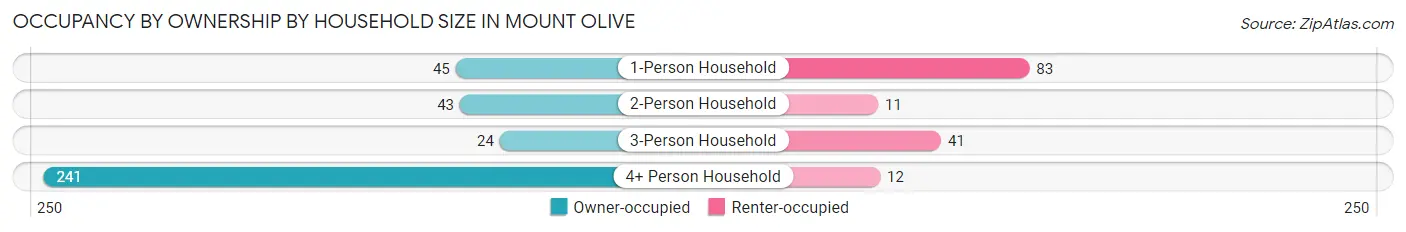
| Household Size | Owner-occupied | Renter-occupied |
| 1-Person Household | 45 (35.2%) | 83 (64.8%) |
| 2-Person Household | 43 (79.6%) | 11 (20.4%) |
| 3-Person Household | 24 (36.9%) | 41 (63.1%) |
| 4+ Person Household | 241 (95.3%) | 12 (4.7%) |
| Total Housing Units | 353 (70.6%) | 147 (29.4%) |
Occupancy by Educational Attainment in Mount Olive
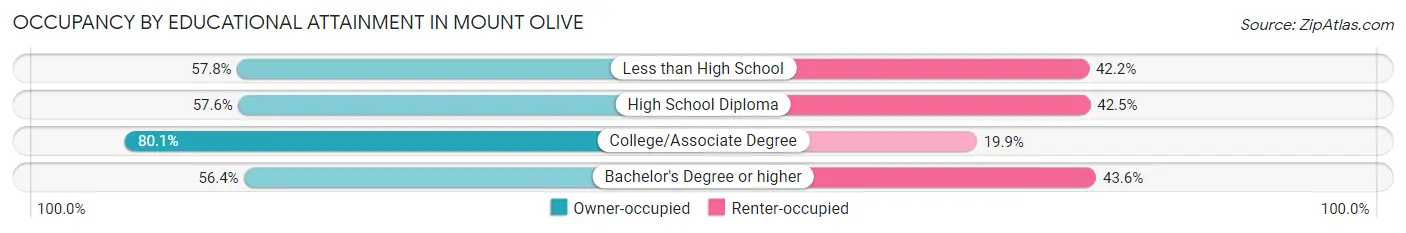
| Household Size | Owner-occupied | Renter-occupied |
| Less than High School | 37 (57.8%) | 27 (42.2%) |
| High School Diploma | 61 (57.6%) | 45 (42.4%) |
| College/Associate Degree | 233 (80.1%) | 58 (19.9%) |
| Bachelor's Degree or higher | 22 (56.4%) | 17 (43.6%) |
Occupancy by Age of Householder in Mount Olive
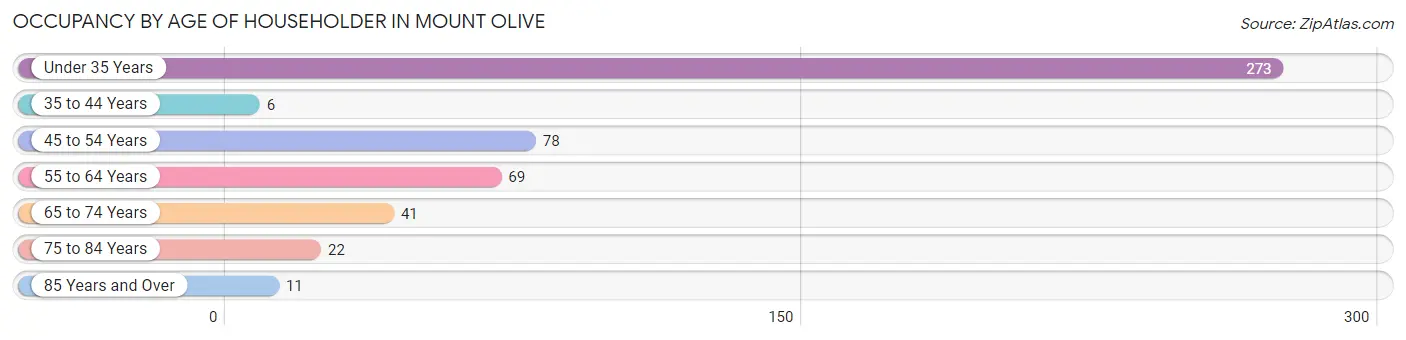
| Age Bracket | # Households | % Households |
| Under 35 Years | 273 | 54.6% |
| 35 to 44 Years | 6 | 1.2% |
| 45 to 54 Years | 78 | 15.6% |
| 55 to 64 Years | 69 | 13.8% |
| 65 to 74 Years | 41 | 8.2% |
| 75 to 84 Years | 22 | 4.4% |
| 85 Years and Over | 11 | 2.2% |
| Total | 500 | 100.0% |
Housing Finances in Mount Olive
Median Income by Occupancy in Mount Olive
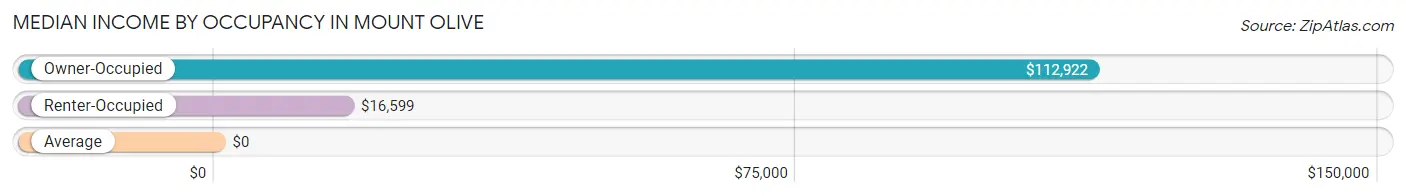
| Occupancy Type | # Households | Median Income |
| Owner-Occupied | 353 (70.6%) | $112,922 |
| Renter-Occupied | 147 (29.4%) | $16,599 |
| Average | 500 (100.0%) | $0 |
Occupancy by Householder Income Bracket in Mount Olive
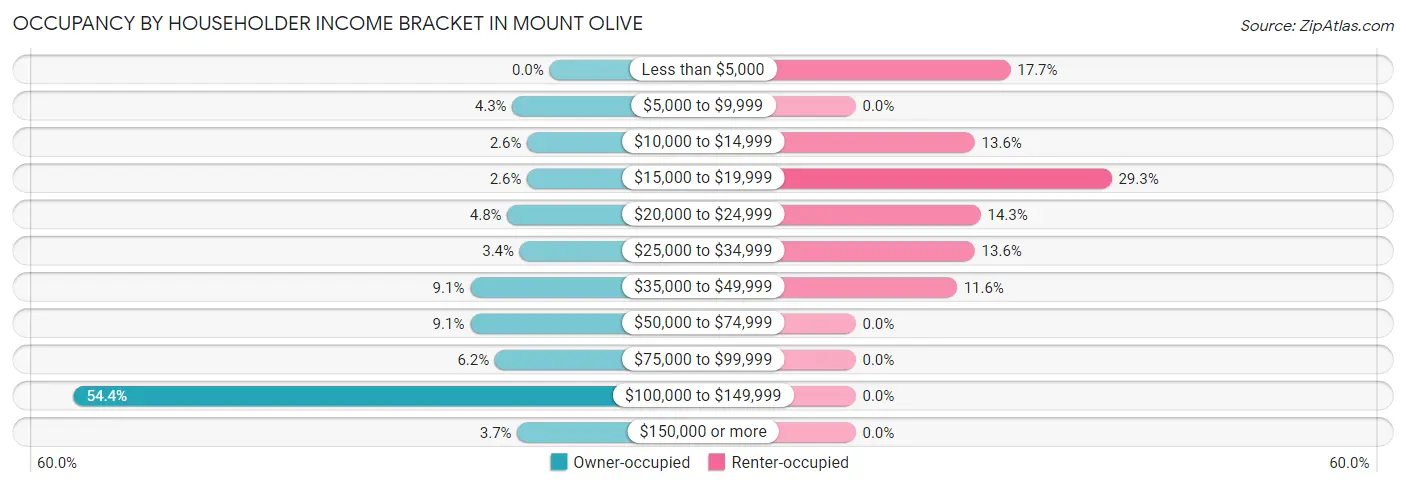
| Income Bracket | Owner-occupied | Renter-occupied |
| Less than $5,000 | 0 (0.0%) | 26 (17.7%) |
| $5,000 to $9,999 | 15 (4.3%) | 0 (0.0%) |
| $10,000 to $14,999 | 9 (2.5%) | 20 (13.6%) |
| $15,000 to $19,999 | 9 (2.5%) | 43 (29.2%) |
| $20,000 to $24,999 | 17 (4.8%) | 21 (14.3%) |
| $25,000 to $34,999 | 12 (3.4%) | 20 (13.6%) |
| $35,000 to $49,999 | 32 (9.1%) | 17 (11.6%) |
| $50,000 to $74,999 | 32 (9.1%) | 0 (0.0%) |
| $75,000 to $99,999 | 22 (6.2%) | 0 (0.0%) |
| $100,000 to $149,999 | 192 (54.4%) | 0 (0.0%) |
| $150,000 or more | 13 (3.7%) | 0 (0.0%) |
| Total | 353 (100.0%) | 147 (100.0%) |
Monthly Housing Cost Tiers in Mount Olive
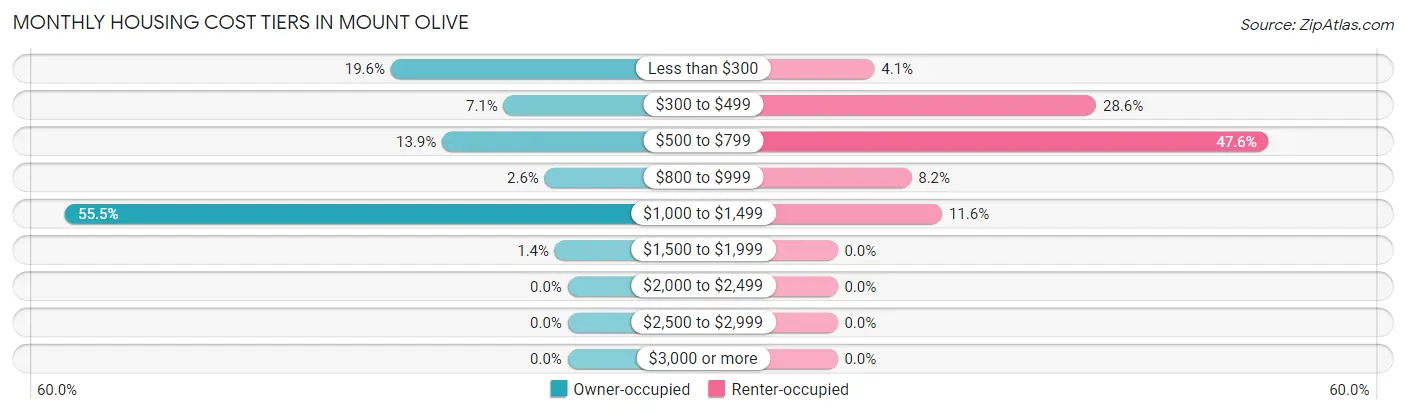
| Monthly Cost | Owner-occupied | Renter-occupied |
| Less than $300 | 69 (19.6%) | 6 (4.1%) |
| $300 to $499 | 25 (7.1%) | 42 (28.6%) |
| $500 to $799 | 49 (13.9%) | 70 (47.6%) |
| $800 to $999 | 9 (2.5%) | 12 (8.2%) |
| $1,000 to $1,499 | 196 (55.5%) | 17 (11.6%) |
| $1,500 to $1,999 | 5 (1.4%) | 0 (0.0%) |
| $2,000 to $2,499 | 0 (0.0%) | 0 (0.0%) |
| $2,500 to $2,999 | 0 (0.0%) | 0 (0.0%) |
| $3,000 or more | 0 (0.0%) | 0 (0.0%) |
| Total | 353 (100.0%) | 147 (100.0%) |
Physical Housing Characteristics in Mount Olive
Housing Structures in Mount Olive
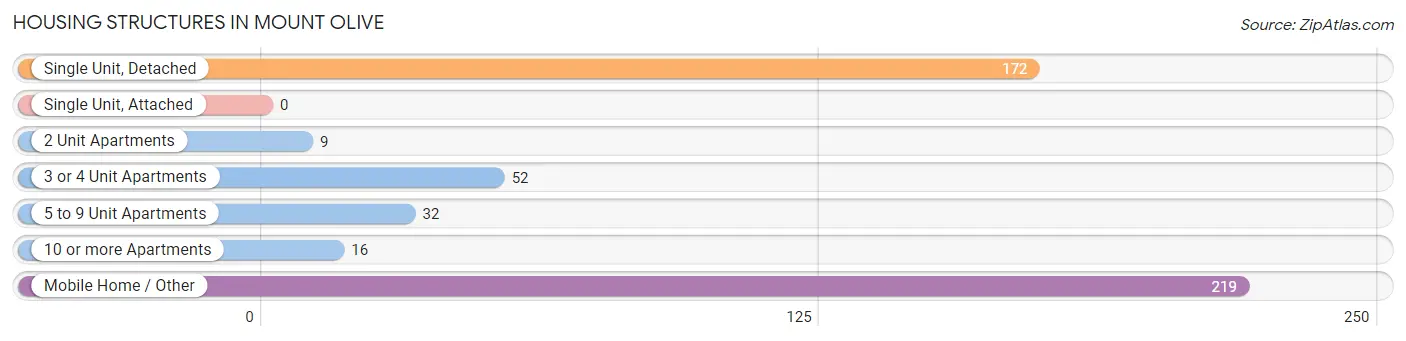
| Structure Type | # Housing Units | % Housing Units |
| Single Unit, Detached | 172 | 34.4% |
| Single Unit, Attached | 0 | 0.0% |
| 2 Unit Apartments | 9 | 1.8% |
| 3 or 4 Unit Apartments | 52 | 10.4% |
| 5 to 9 Unit Apartments | 32 | 6.4% |
| 10 or more Apartments | 16 | 3.2% |
| Mobile Home / Other | 219 | 43.8% |
| Total | 500 | 100.0% |
Housing Structures by Occupancy in Mount Olive
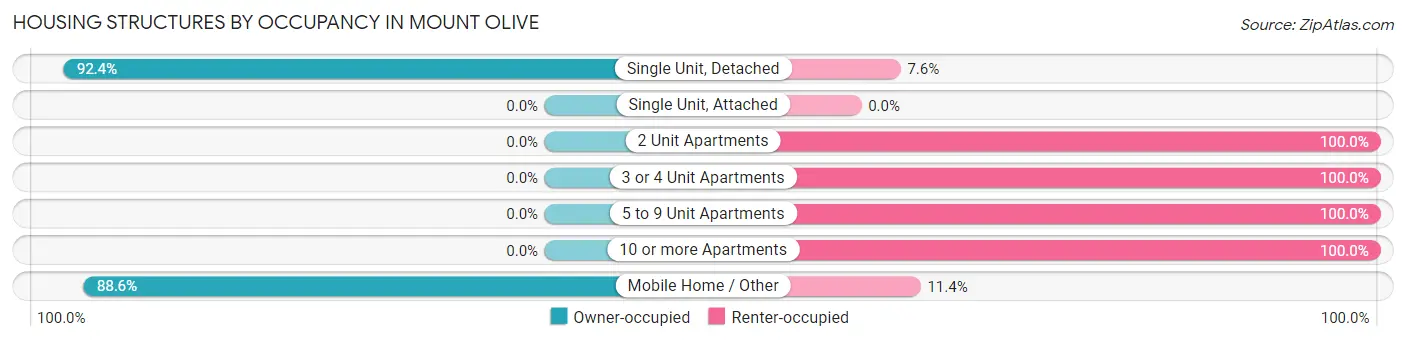
| Structure Type | Owner-occupied | Renter-occupied |
| Single Unit, Detached | 159 (92.4%) | 13 (7.6%) |
| Single Unit, Attached | 0 (0.0%) | 0 (0.0%) |
| 2 Unit Apartments | 0 (0.0%) | 9 (100.0%) |
| 3 or 4 Unit Apartments | 0 (0.0%) | 52 (100.0%) |
| 5 to 9 Unit Apartments | 0 (0.0%) | 32 (100.0%) |
| 10 or more Apartments | 0 (0.0%) | 16 (100.0%) |
| Mobile Home / Other | 194 (88.6%) | 25 (11.4%) |
| Total | 353 (70.6%) | 147 (29.4%) |
Housing Structures by Number of Rooms in Mount Olive
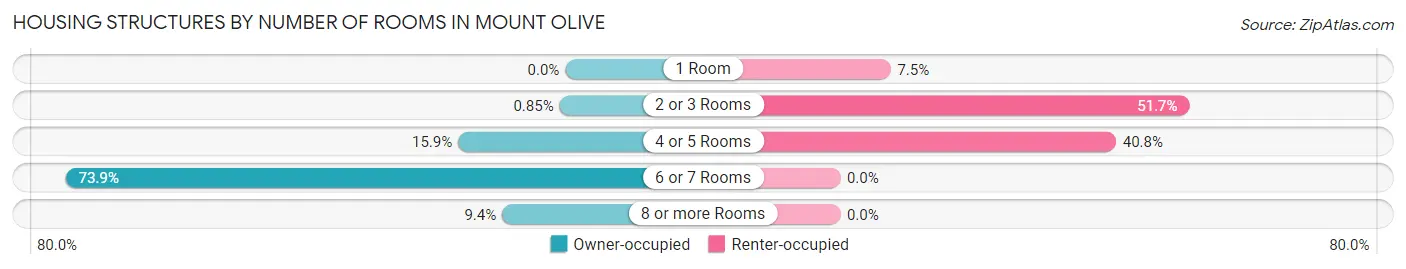
| Number of Rooms | Owner-occupied | Renter-occupied |
| 1 Room | 0 (0.0%) | 11 (7.5%) |
| 2 or 3 Rooms | 3 (0.9%) | 76 (51.7%) |
| 4 or 5 Rooms | 56 (15.9%) | 60 (40.8%) |
| 6 or 7 Rooms | 261 (73.9%) | 0 (0.0%) |
| 8 or more Rooms | 33 (9.3%) | 0 (0.0%) |
| Total | 353 (100.0%) | 147 (100.0%) |
Housing Structure by Heating Type in Mount Olive
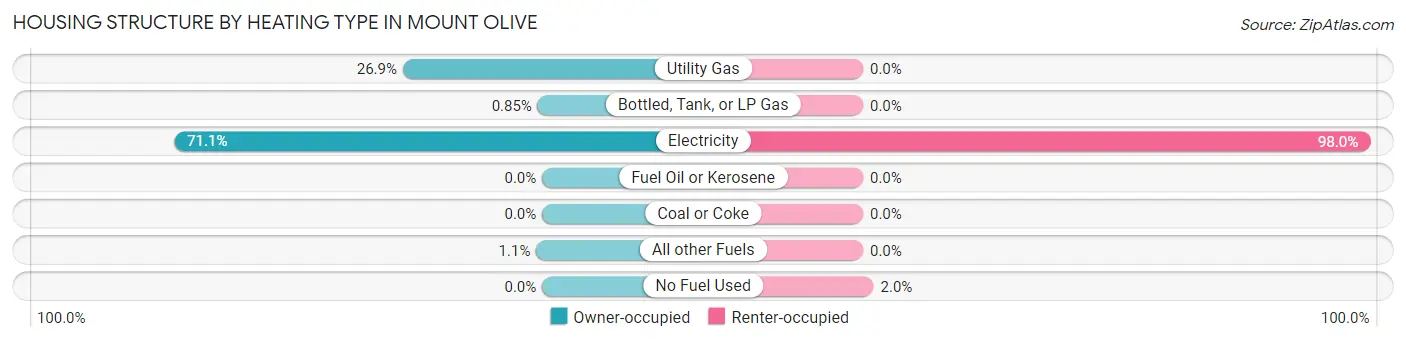
| Heating Type | Owner-occupied | Renter-occupied |
| Utility Gas | 95 (26.9%) | 0 (0.0%) |
| Bottled, Tank, or LP Gas | 3 (0.9%) | 0 (0.0%) |
| Electricity | 251 (71.1%) | 144 (98.0%) |
| Fuel Oil or Kerosene | 0 (0.0%) | 0 (0.0%) |
| Coal or Coke | 0 (0.0%) | 0 (0.0%) |
| All other Fuels | 4 (1.1%) | 0 (0.0%) |
| No Fuel Used | 0 (0.0%) | 3 (2.0%) |
| Total | 353 (100.0%) | 147 (100.0%) |
Household Vehicle Usage in Mount Olive
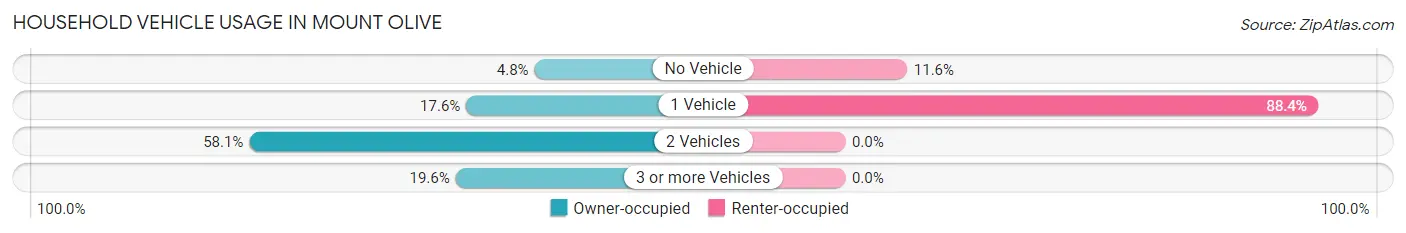
| Vehicles per Household | Owner-occupied | Renter-occupied |
| No Vehicle | 17 (4.8%) | 17 (11.6%) |
| 1 Vehicle | 62 (17.6%) | 130 (88.4%) |
| 2 Vehicles | 205 (58.1%) | 0 (0.0%) |
| 3 or more Vehicles | 69 (19.6%) | 0 (0.0%) |
| Total | 353 (100.0%) | 147 (100.0%) |
Real Estate & Mortgages in Mount Olive
Real Estate and Mortgage Overview in Mount Olive
| Characteristic | Without Mortgage | With Mortgage |
| Housing Units | 119 | 234 |
| Median Property Value | $125,400 | $55,200 |
| Median Household Income | $33,750 | $4 |
| Monthly Housing Costs | $288 | $0 |
| Real Estate Taxes | - | - |
Property Value by Mortgage Status in Mount Olive
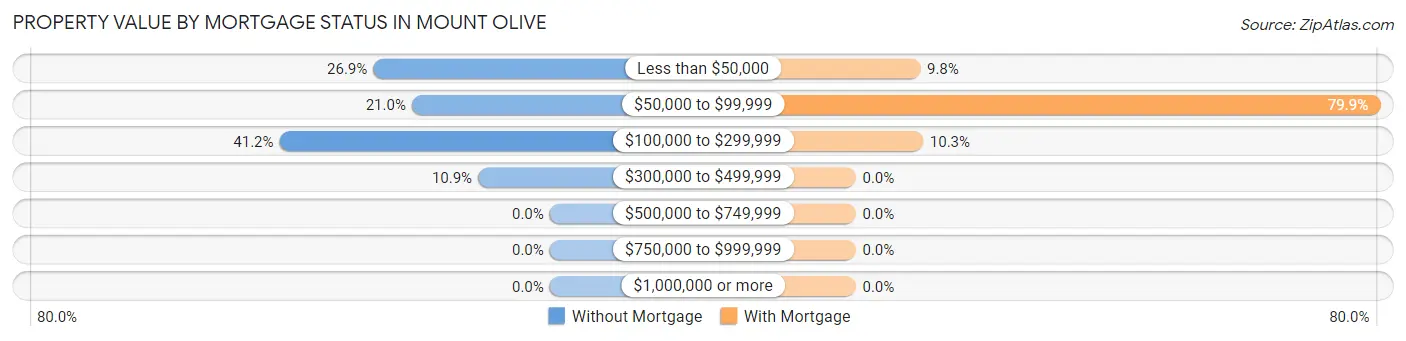
| Property Value | Without Mortgage | With Mortgage |
| Less than $50,000 | 32 (26.9%) | 23 (9.8%) |
| $50,000 to $99,999 | 25 (21.0%) | 187 (79.9%) |
| $100,000 to $299,999 | 49 (41.2%) | 24 (10.3%) |
| $300,000 to $499,999 | 13 (10.9%) | 0 (0.0%) |
| $500,000 to $749,999 | 0 (0.0%) | 0 (0.0%) |
| $750,000 to $999,999 | 0 (0.0%) | 0 (0.0%) |
| $1,000,000 or more | 0 (0.0%) | 0 (0.0%) |
| Total | 119 (100.0%) | 234 (100.0%) |
Household Income by Mortgage Status in Mount Olive
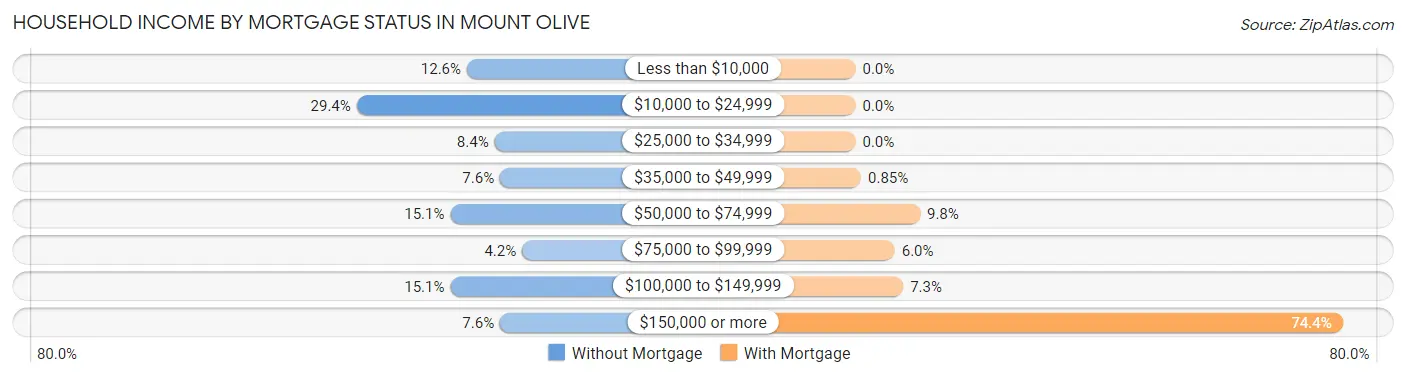
| Household Income | Without Mortgage | With Mortgage |
| Less than $10,000 | 15 (12.6%) | 0 (0.0%) |
| $10,000 to $24,999 | 35 (29.4%) | 0 (0.0%) |
| $25,000 to $34,999 | 10 (8.4%) | 0 (0.0%) |
| $35,000 to $49,999 | 9 (7.6%) | 2 (0.9%) |
| $50,000 to $74,999 | 18 (15.1%) | 23 (9.8%) |
| $75,000 to $99,999 | 5 (4.2%) | 14 (6.0%) |
| $100,000 to $149,999 | 18 (15.1%) | 17 (7.3%) |
| $150,000 or more | 9 (7.6%) | 174 (74.4%) |
| Total | 119 (100.0%) | 234 (100.0%) |
Property Value to Household Income Ratio in Mount Olive
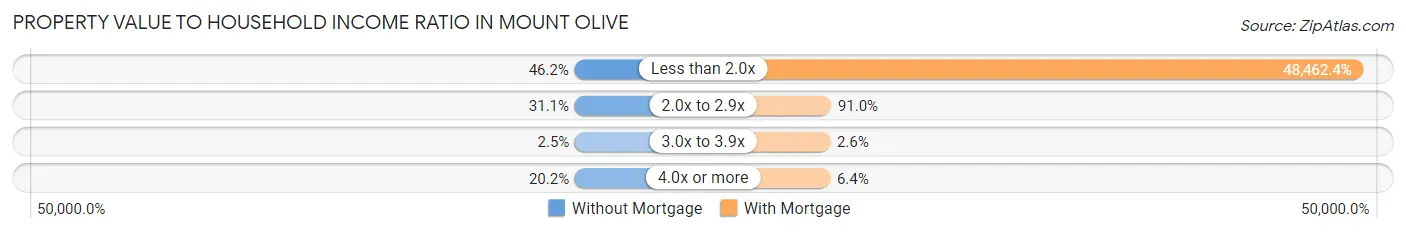
| Value-to-Income Ratio | Without Mortgage | With Mortgage |
| Less than 2.0x | 55 (46.2%) | 113,402 (48,462.4%) |
| 2.0x to 2.9x | 37 (31.1%) | 213 (91.0%) |
| 3.0x to 3.9x | 3 (2.5%) | 6 (2.6%) |
| 4.0x or more | 24 (20.2%) | 15 (6.4%) |
| Total | 119 (100.0%) | 234 (100.0%) |
Real Estate Taxes by Mortgage Status in Mount Olive
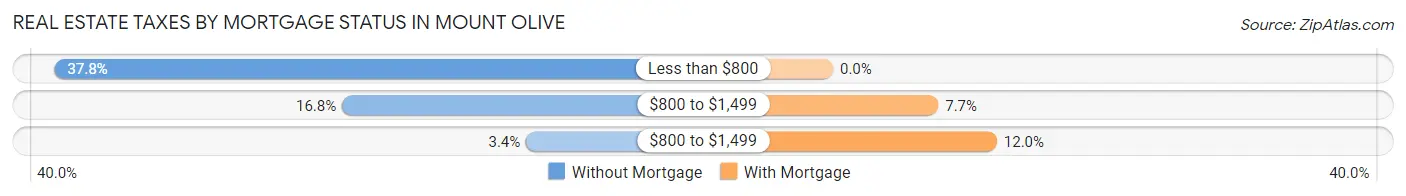
| Property Taxes | Without Mortgage | With Mortgage |
| Less than $800 | 45 (37.8%) | 0 (0.0%) |
| $800 to $1,499 | 20 (16.8%) | 18 (7.7%) |
| $800 to $1,499 | 4 (3.4%) | 28 (12.0%) |
| Total | 119 (100.0%) | 234 (100.0%) |
Health & Disability in Mount Olive
Health Insurance Coverage by Age in Mount Olive
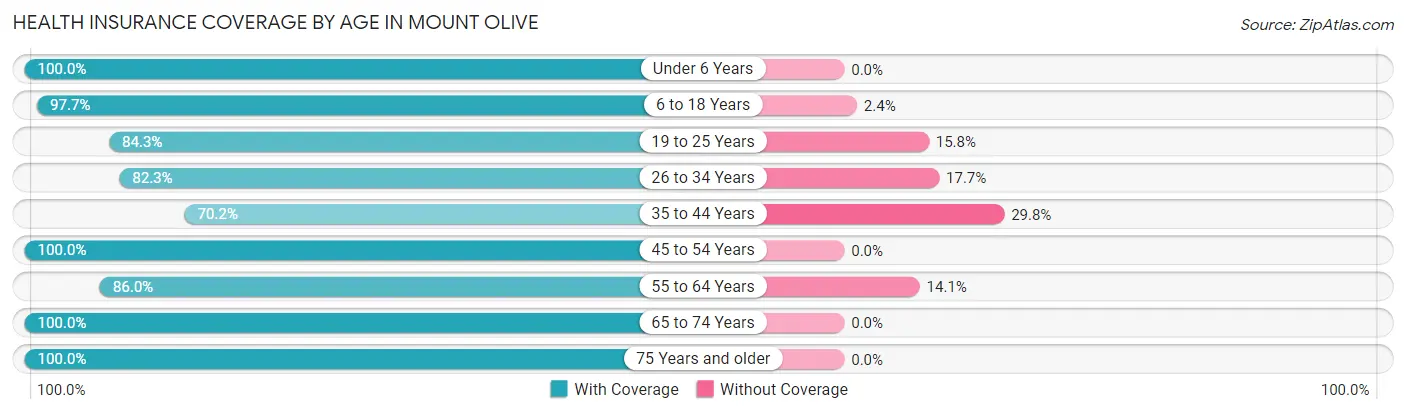
| Age Bracket | With Coverage | Without Coverage |
| Under 6 Years | 109 (100.0%) | 0 (0.0%) |
| 6 to 18 Years | 333 (97.7%) | 8 (2.4%) |
| 19 to 25 Years | 123 (84.3%) | 23 (15.8%) |
| 26 to 34 Years | 298 (82.3%) | 64 (17.7%) |
| 35 to 44 Years | 80 (70.2%) | 34 (29.8%) |
| 45 to 54 Years | 110 (100.0%) | 0 (0.0%) |
| 55 to 64 Years | 104 (86.0%) | 17 (14.1%) |
| 65 to 74 Years | 53 (100.0%) | 0 (0.0%) |
| 75 Years and older | 49 (100.0%) | 0 (0.0%) |
| Total | 1,259 (89.6%) | 146 (10.4%) |
Health Insurance Coverage by Citizenship Status in Mount Olive
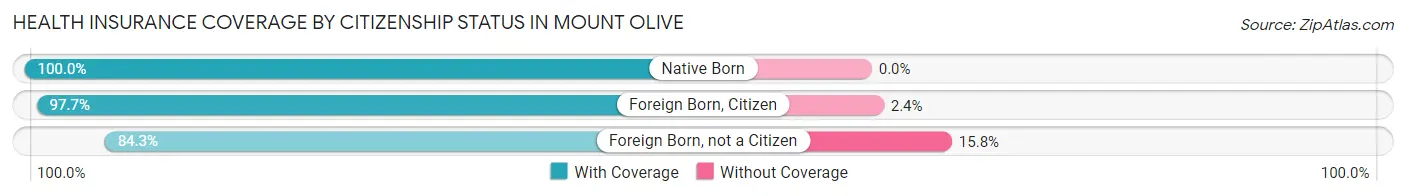
| Citizenship Status | With Coverage | Without Coverage |
| Native Born | 109 (100.0%) | 0 (0.0%) |
| Foreign Born, Citizen | 333 (97.7%) | 8 (2.4%) |
| Foreign Born, not a Citizen | 123 (84.3%) | 23 (15.8%) |
Health Insurance Coverage by Household Income in Mount Olive
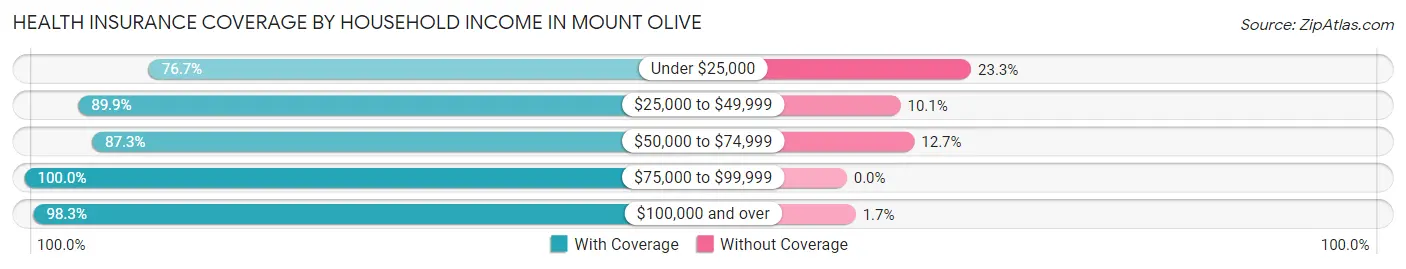
| Household Income | With Coverage | Without Coverage |
| Under $25,000 | 326 (76.7%) | 99 (23.3%) |
| $25,000 to $49,999 | 250 (89.9%) | 28 (10.1%) |
| $50,000 to $74,999 | 69 (87.3%) | 10 (12.7%) |
| $75,000 to $99,999 | 84 (100.0%) | 0 (0.0%) |
| $100,000 and over | 530 (98.3%) | 9 (1.7%) |
Public vs Private Health Insurance Coverage by Age in Mount Olive
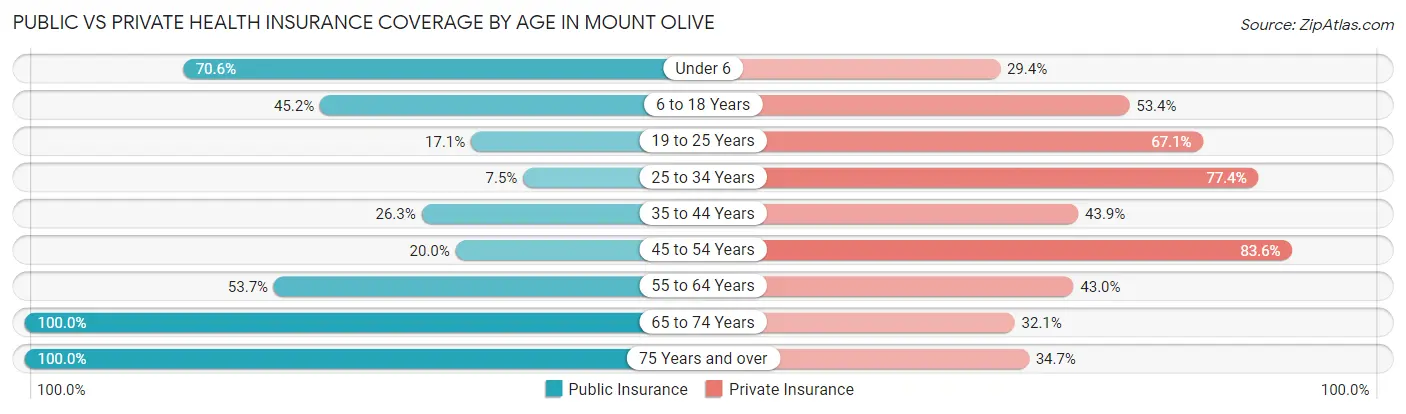
| Age Bracket | Public Insurance | Private Insurance |
| Under 6 | 77 (70.6%) | 32 (29.4%) |
| 6 to 18 Years | 154 (45.2%) | 182 (53.4%) |
| 19 to 25 Years | 25 (17.1%) | 98 (67.1%) |
| 25 to 34 Years | 27 (7.5%) | 280 (77.3%) |
| 35 to 44 Years | 30 (26.3%) | 50 (43.9%) |
| 45 to 54 Years | 22 (20.0%) | 92 (83.6%) |
| 55 to 64 Years | 65 (53.7%) | 52 (43.0%) |
| 65 to 74 Years | 53 (100.0%) | 17 (32.1%) |
| 75 Years and over | 49 (100.0%) | 17 (34.7%) |
| Total | 502 (35.7%) | 820 (58.4%) |
Disability Status by Sex by Age in Mount Olive
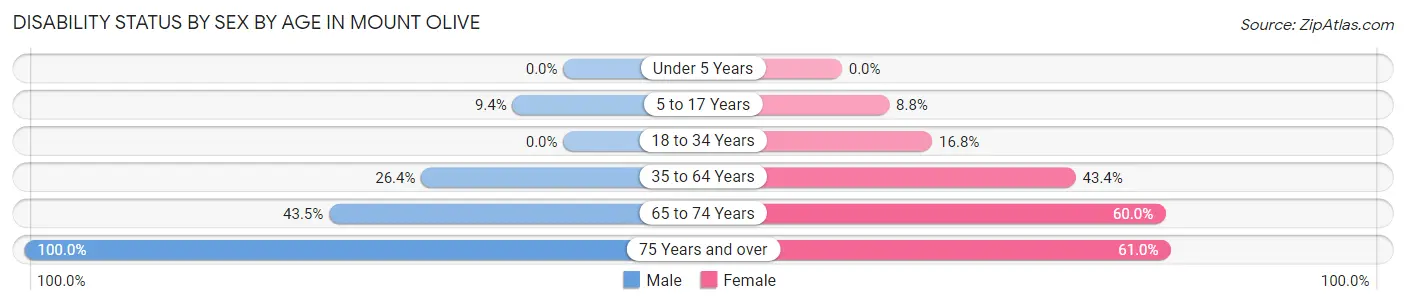
| Age Bracket | Male | Female |
| Under 5 Years | 0 (0.0%) | 0 (0.0%) |
| 5 to 17 Years | 15 (9.4%) | 18 (8.8%) |
| 18 to 34 Years | 0 (0.0%) | 27 (16.8%) |
| 35 to 64 Years | 29 (26.4%) | 102 (43.4%) |
| 65 to 74 Years | 10 (43.5%) | 18 (60.0%) |
| 75 Years and over | 8 (100.0%) | 25 (61.0%) |
Disability Class by Sex by Age in Mount Olive
Disability Class: Hearing Difficulty
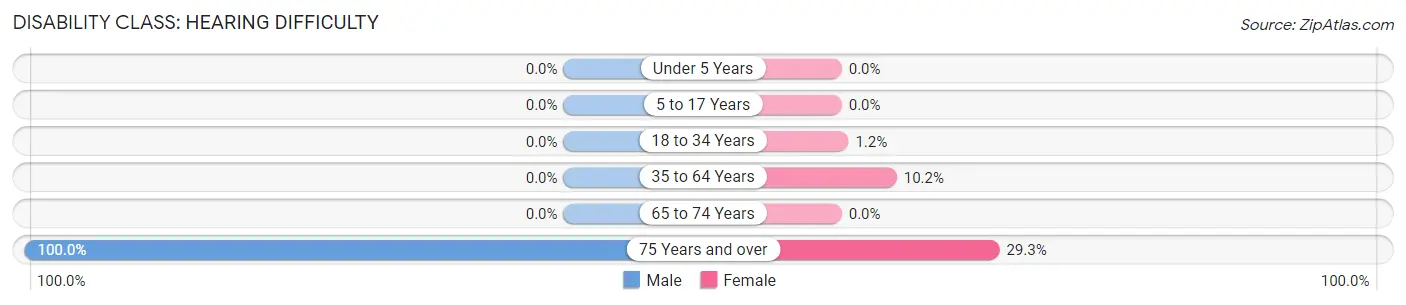
| Age Bracket | Male | Female |
| Under 5 Years | 0 (0.0%) | 0 (0.0%) |
| 5 to 17 Years | 0 (0.0%) | 0 (0.0%) |
| 18 to 34 Years | 0 (0.0%) | 2 (1.2%) |
| 35 to 64 Years | 0 (0.0%) | 24 (10.2%) |
| 65 to 74 Years | 0 (0.0%) | 0 (0.0%) |
| 75 Years and over | 8 (100.0%) | 12 (29.3%) |
Disability Class: Vision Difficulty
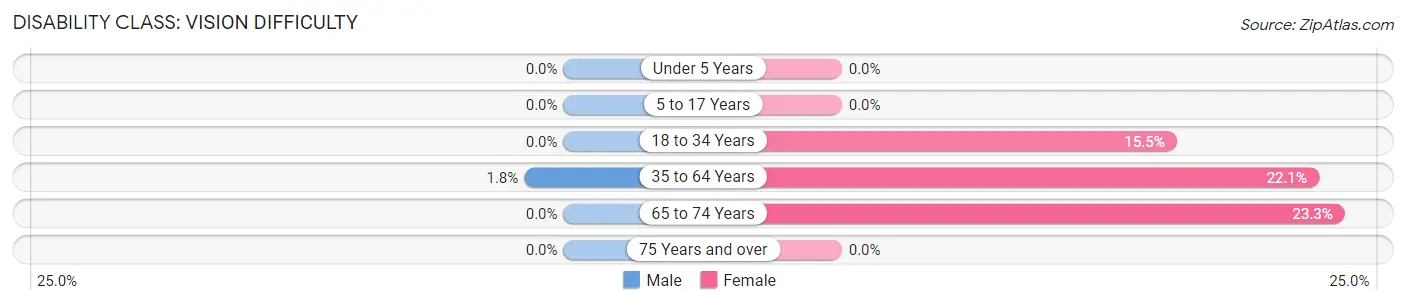
| Age Bracket | Male | Female |
| Under 5 Years | 0 (0.0%) | 0 (0.0%) |
| 5 to 17 Years | 0 (0.0%) | 0 (0.0%) |
| 18 to 34 Years | 0 (0.0%) | 25 (15.5%) |
| 35 to 64 Years | 2 (1.8%) | 52 (22.1%) |
| 65 to 74 Years | 0 (0.0%) | 7 (23.3%) |
| 75 Years and over | 0 (0.0%) | 0 (0.0%) |
Disability Class: Cognitive Difficulty
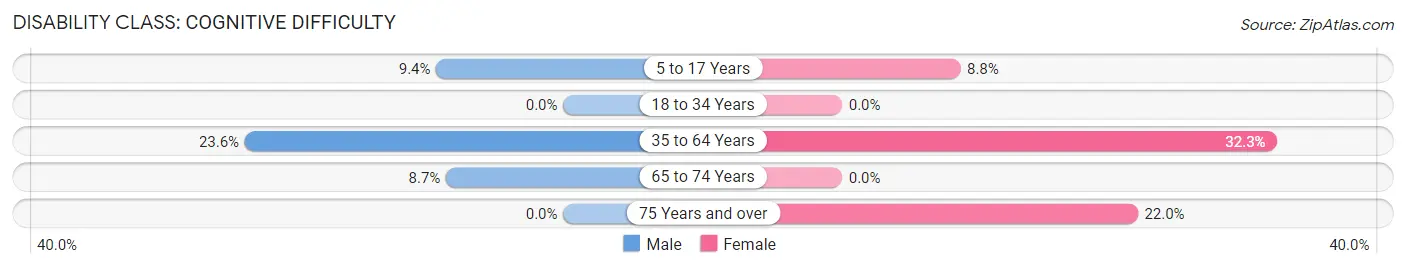
| Age Bracket | Male | Female |
| 5 to 17 Years | 15 (9.4%) | 18 (8.8%) |
| 18 to 34 Years | 0 (0.0%) | 0 (0.0%) |
| 35 to 64 Years | 26 (23.6%) | 76 (32.3%) |
| 65 to 74 Years | 2 (8.7%) | 0 (0.0%) |
| 75 Years and over | 0 (0.0%) | 9 (22.0%) |
Disability Class: Ambulatory Difficulty
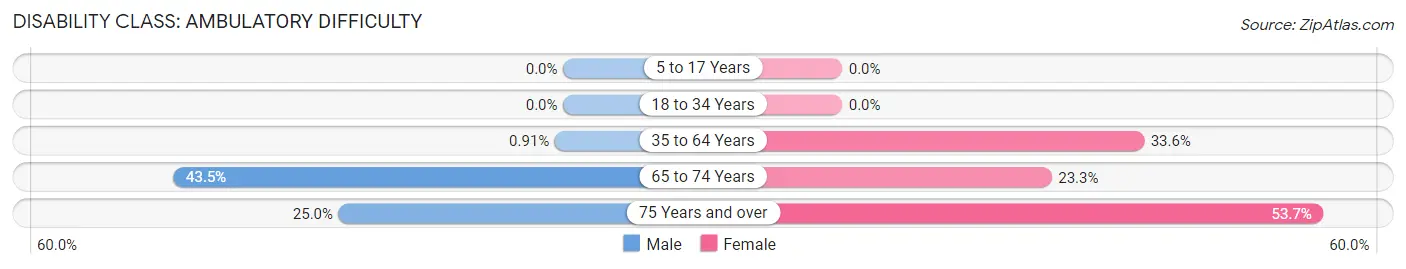
| Age Bracket | Male | Female |
| 5 to 17 Years | 0 (0.0%) | 0 (0.0%) |
| 18 to 34 Years | 0 (0.0%) | 0 (0.0%) |
| 35 to 64 Years | 1 (0.9%) | 79 (33.6%) |
| 65 to 74 Years | 10 (43.5%) | 7 (23.3%) |
| 75 Years and over | 2 (25.0%) | 22 (53.7%) |
Disability Class: Self-Care Difficulty
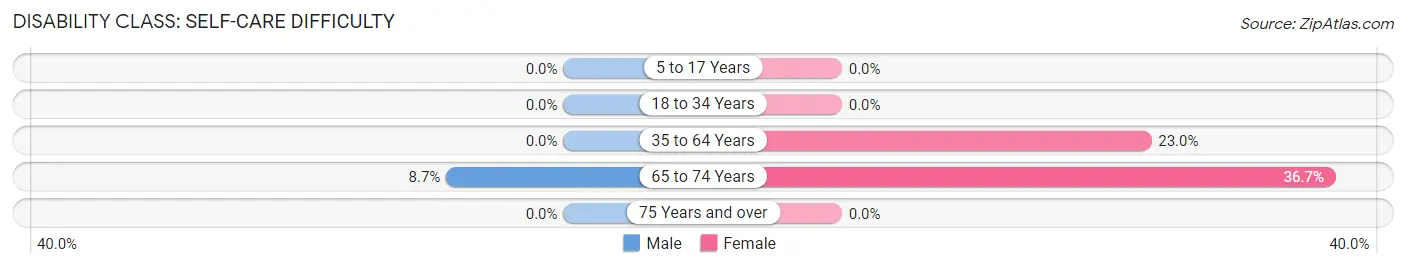
| Age Bracket | Male | Female |
| 5 to 17 Years | 0 (0.0%) | 0 (0.0%) |
| 18 to 34 Years | 0 (0.0%) | 0 (0.0%) |
| 35 to 64 Years | 0 (0.0%) | 54 (23.0%) |
| 65 to 74 Years | 2 (8.7%) | 11 (36.7%) |
| 75 Years and over | 0 (0.0%) | 0 (0.0%) |
Technology Access in Mount Olive
Computing Device Access in Mount Olive
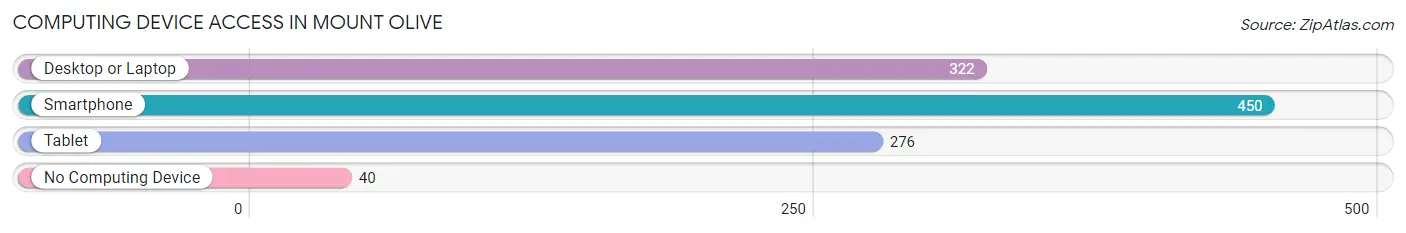
| Device Type | # Households | % Households |
| Desktop or Laptop | 322 | 64.4% |
| Smartphone | 450 | 90.0% |
| Tablet | 276 | 55.2% |
| No Computing Device | 40 | 8.0% |
| Total | 500 | 100.0% |
Internet Access in Mount Olive
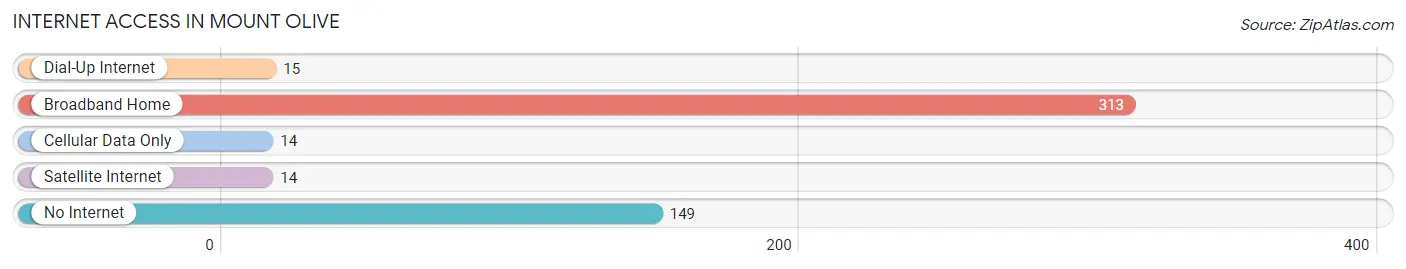
| Internet Type | # Households | % Households |
| Dial-Up Internet | 15 | 3.0% |
| Broadband Home | 313 | 62.6% |
| Cellular Data Only | 14 | 2.8% |
| Satellite Internet | 14 | 2.8% |
| No Internet | 149 | 29.8% |
| Total | 500 | 100.0% |
Mount Olive Summary
Introduction
Mount Olive is a small town located in the state of Mississippi. It is located in the southwestern part of the state, about 25 miles from the state capital of Jackson. The town has a population of just over 1,000 people and is part of the Hattiesburg-Laurel Metropolitan Statistical Area. The town is known for its rich history, its unique geography, and its diverse economy. This paper will explore the history, geography, economy, and demographics of Mount Olive in 2000 words.
History
Mount Olive was founded in 1837 by a group of settlers from North Carolina. The town was named after the biblical Mount of Olives, which is located in Jerusalem. The town was originally a farming community, and the settlers grew cotton, corn, and other crops. The town was also home to a number of sawmills and gristmills.
In the late 19th century, the town began to grow and develop. The railroad was built through the town in 1884, and the town became a major shipping center for the region. The town also became a popular tourist destination, as it was located near the Gulf of Mexico.
In the early 20th century, the town began to decline. The railroad was abandoned in the 1930s, and the town's economy suffered. The town was also hit hard by the Great Depression. However, the town began to recover in the 1950s, and the economy began to grow again.
Geography
Mount Olive is located in the southwestern part of Mississippi, about 25 miles from the state capital of Jackson. The town is located in the Piney Woods region of the state, and is surrounded by forests and rolling hills. The town is located on the banks of the Pearl River, and is home to a number of small lakes and ponds.
The town has a humid subtropical climate, with hot, humid summers and mild winters. The average annual temperature is around 70 degrees Fahrenheit, and the average annual precipitation is around 50 inches.
Economy
The economy of Mount Olive is largely based on agriculture and tourism. The town is home to a number of farms, and the surrounding area is known for its production of cotton, corn, soybeans, and other crops. The town is also home to a number of sawmills and gristmills, which produce lumber and other wood products.
The town is also a popular tourist destination, as it is located near the Gulf of Mexico. The town is home to a number of parks and recreational areas, and is a popular destination for fishing, boating, and other outdoor activities.
Demographics
As of the 2010 census, the population of Mount Olive was 1,072. The town is predominantly white, with a population that is 94.3% white, 2.7% African American, 0.7% Native American, 0.3% Asian, and 1.9% from other races. The median household income is $31,250, and the median home value is $90,000.
Conclusion
Mount Olive is a small town located in the southwestern part of Mississippi. The town has a rich history, a unique geography, and a diverse economy. The town is predominantly white, and the median household income is $31,250. The town is home to a number of farms, sawmills, and gristmills, and is a popular tourist destination.
Common Questions
What is Per Capita Income in Mount Olive?
Per Capita income in Mount Olive is $22,393.
What is the Median Family Income in Mount Olive?
Median Family Income in Mount Olive is $112,781.
What is Income or Wage Gap in Mount Olive?
Income or Wage Gap in Mount Olive is 58.1%.
Women in Mount Olive earn 41.9 cents for every dollar earned by a man.
What is Inequality or Gini Index in Mount Olive?
Inequality or Gini Index in Mount Olive is 0.40.
What is the Total Population of Mount Olive?
Total Population of Mount Olive is 1,405.
What is the Total Male Population of Mount Olive?
Total Male Population of Mount Olive is 697.
What is the Total Female Population of Mount Olive?
Total Female Population of Mount Olive is 708.
What is the Ratio of Males per 100 Females in Mount Olive?
There are 98.45 Males per 100 Females in Mount Olive.
What is the Ratio of Females per 100 Males in Mount Olive?
There are 101.58 Females per 100 Males in Mount Olive.
What is the Median Population Age in Mount Olive?
Median Population Age in Mount Olive is 31.7 Years.
What is the Average Family Size in Mount Olive
Average Family Size in Mount Olive is 3.4 People.
What is the Average Household Size in Mount Olive
Average Household Size in Mount Olive is 2.8 People.
How Large is the Labor Force in Mount Olive?
There are 666 People in the Labor Forcein in Mount Olive.
What is the Percentage of People in the Labor Force in Mount Olive?
68.0% of People are in the Labor Force in Mount Olive.
What is the Unemployment Rate in Mount Olive?
Unemployment Rate in Mount Olive is 3.2%.