Acworth, GA Map & Demographics
Acworth Map
Acworth Overview
$35,413
PER CAPITA INCOME
$85,019
AVG FAMILY INCOME
$74,643
AVG HOUSEHOLD INCOME
21.8%
WAGE / INCOME GAP [ % ]
78.2¢/ $1
WAGE / INCOME GAP [ $ ]
0.46
INEQUALITY / GINI INDEX
22,318
TOTAL POPULATION
10,614
MALE POPULATION
11,704
FEMALE POPULATION
90.69
MALES / 100 FEMALES
110.27
FEMALES / 100 MALES
36.8
MEDIAN AGE
3.5
AVG FAMILY SIZE
2.7
AVG HOUSEHOLD SIZE
12,464
LABOR FORCE [ PEOPLE ]
71.4%
PERCENT IN LABOR FORCE
4.2%
UNEMPLOYMENT RATE
Income in Acworth
Income Overview in Acworth
Per Capita Income in Acworth is $35,413, while median incomes of families and households are $85,019 and $74,643 respectively.
| Characteristic | Number | Measure |
| Per Capita Income | 22,318 | $35,413 |
| Median Family Income | 5,194 | $85,019 |
| Mean Family Income | 5,194 | $110,561 |
| Median Household Income | 8,260 | $74,643 |
| Mean Household Income | 8,260 | $93,761 |
| Income Deficit | 5,194 | $0 |
| Wage / Income Gap (%) | 22,318 | 21.83% |
| Wage / Income Gap ($) | 22,318 | 78.17¢ per $1 |
| Gini / Inequality Index | 22,318 | 0.46 |
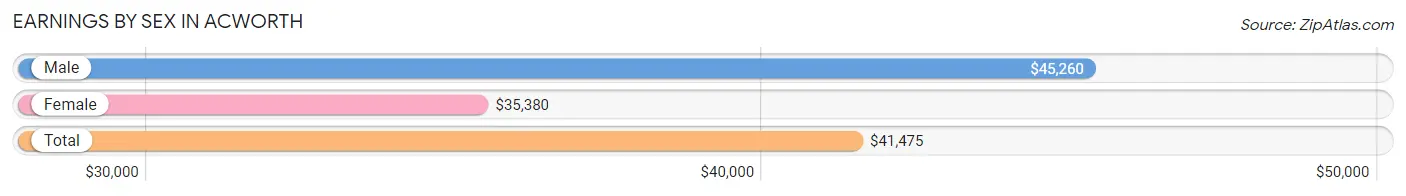
Earnings by Sex in Acworth
Average Earnings in Acworth are $41,475, $45,260 for men and $35,380 for women, a difference of 21.8%.
| Sex | Number | Average Earnings |
| Male | 6,635 (52.9%) | $45,260 |
| Female | 5,901 (47.1%) | $35,380 |
| Total | 12,536 (100.0%) | $41,475 |
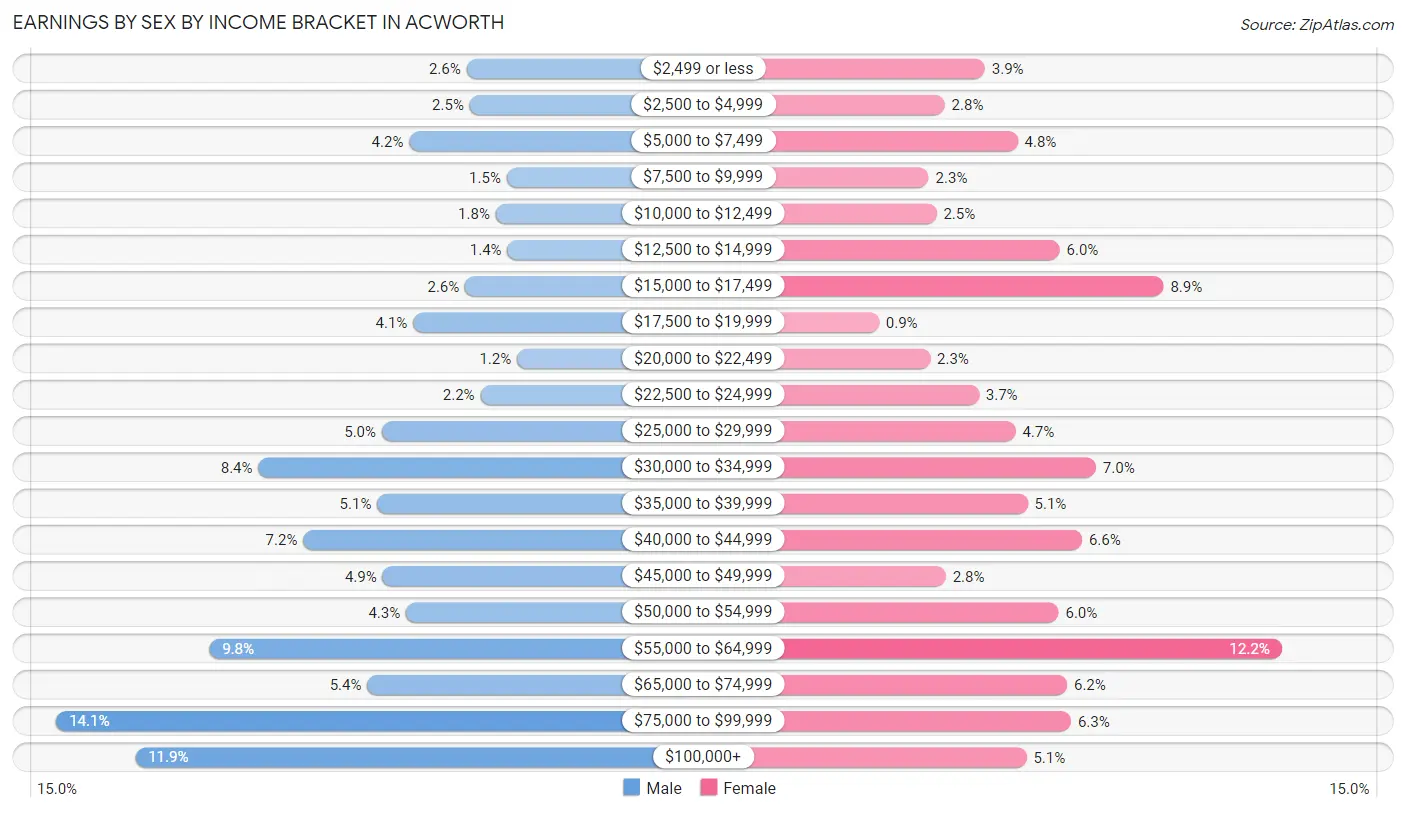
Earnings by Sex by Income Bracket in Acworth
The most common earnings brackets in Acworth are $75,000 to $99,999 for men (936 | 14.1%) and $55,000 to $64,999 for women (721 | 12.2%).
| Income | Male | Female |
| $2,499 or less | 171 (2.6%) | 229 (3.9%) |
| $2,500 to $4,999 | 165 (2.5%) | 162 (2.8%) |
| $5,000 to $7,499 | 278 (4.2%) | 283 (4.8%) |
| $7,500 to $9,999 | 96 (1.5%) | 136 (2.3%) |
| $10,000 to $12,499 | 117 (1.8%) | 149 (2.5%) |
| $12,500 to $14,999 | 95 (1.4%) | 353 (6.0%) |
| $15,000 to $17,499 | 174 (2.6%) | 525 (8.9%) |
| $17,500 to $19,999 | 271 (4.1%) | 53 (0.9%) |
| $20,000 to $22,499 | 77 (1.2%) | 138 (2.3%) |
| $22,500 to $24,999 | 145 (2.2%) | 219 (3.7%) |
| $25,000 to $29,999 | 329 (5.0%) | 280 (4.7%) |
| $30,000 to $34,999 | 559 (8.4%) | 413 (7.0%) |
| $35,000 to $39,999 | 338 (5.1%) | 300 (5.1%) |
| $40,000 to $44,999 | 476 (7.2%) | 390 (6.6%) |
| $45,000 to $49,999 | 328 (4.9%) | 164 (2.8%) |
| $50,000 to $54,999 | 284 (4.3%) | 351 (5.9%) |
| $55,000 to $64,999 | 651 (9.8%) | 721 (12.2%) |
| $65,000 to $74,999 | 356 (5.4%) | 365 (6.2%) |
| $75,000 to $99,999 | 936 (14.1%) | 372 (6.3%) |
| $100,000+ | 789 (11.9%) | 298 (5.1%) |
| Total | 6,635 (100.0%) | 5,901 (100.0%) |
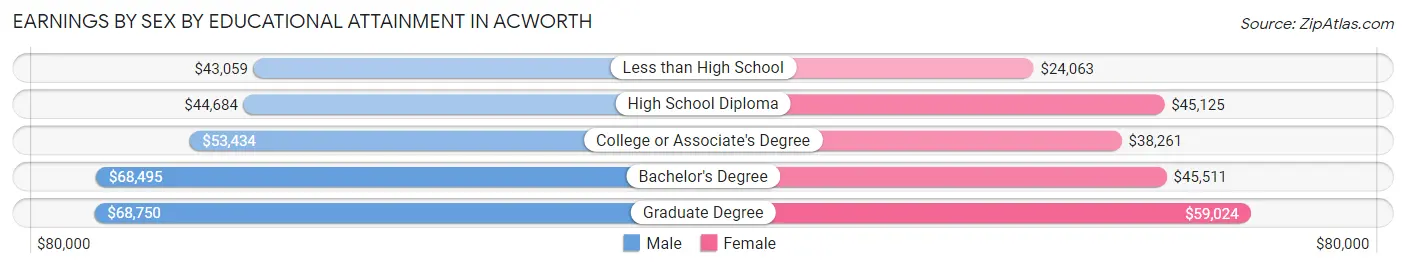
Earnings by Sex by Educational Attainment in Acworth
Average earnings in Acworth are $53,656 for men and $42,749 for women, a difference of 20.3%. Men with an educational attainment of graduate degree enjoy the highest average annual earnings of $68,750, while those with less than high school education earn the least with $43,059. Women with an educational attainment of graduate degree earn the most with the average annual earnings of $59,024, while those with less than high school education have the smallest earnings of $24,063.
| Educational Attainment | Male Income | Female Income |
| Less than High School | $43,059 | $24,063 |
| High School Diploma | $44,684 | $45,125 |
| College or Associate's Degree | $53,434 | $38,261 |
| Bachelor's Degree | $68,495 | $45,511 |
| Graduate Degree | $68,750 | $59,024 |
| Total | $53,656 | $42,749 |
Family Income in Acworth
Family Income Brackets in Acworth
According to the Acworth family income data, there are 1,205 families falling into the $100,000 to $149,999 income range, which is the most common income bracket and makes up 23.2% of all families. Conversely, the less than $10,000 income bracket is the least frequent group with only 104 families (2.0%) belonging to this category.
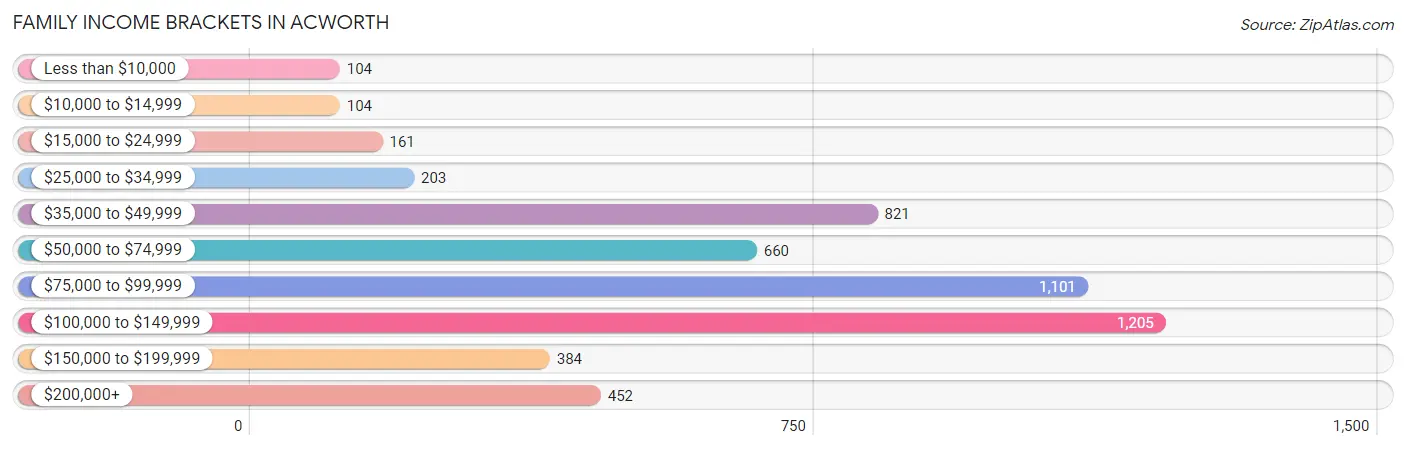
| Income Bracket | # Families | % Families |
| Less than $10,000 | 104 | 2.0% |
| $10,000 to $14,999 | 104 | 2.0% |
| $15,000 to $24,999 | 161 | 3.1% |
| $25,000 to $34,999 | 203 | 3.9% |
| $35,000 to $49,999 | 821 | 15.8% |
| $50,000 to $74,999 | 660 | 12.7% |
| $75,000 to $99,999 | 1,101 | 21.2% |
| $100,000 to $149,999 | 1,205 | 23.2% |
| $150,000 to $199,999 | 384 | 7.4% |
| $200,000+ | 452 | 8.7% |
Family Income by Famaliy Size in Acworth
7+ person families (50 | 1.0%) account for the highest median family income in Acworth with $173,875 per family, while 2-person families (2,097 | 40.4%) have the highest median income of $38,348 per family member.
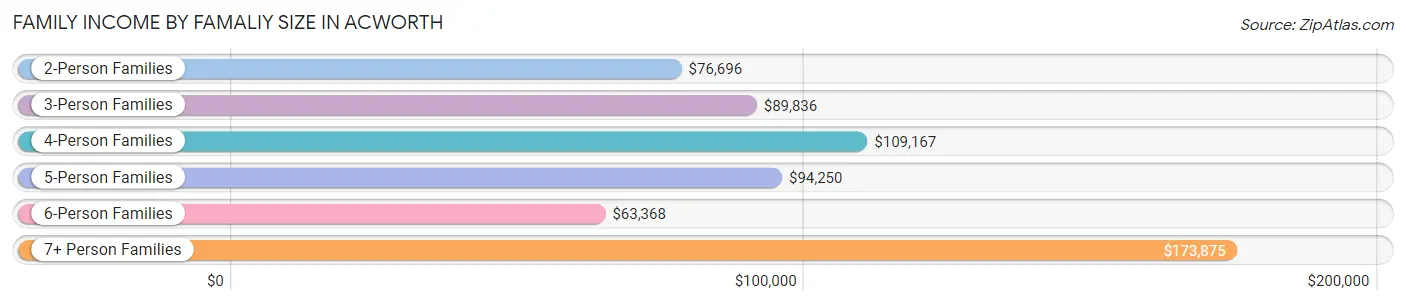
| Income Bracket | # Families | Median Income |
| 2-Person Families | 2,097 (40.4%) | $76,696 |
| 3-Person Families | 1,311 (25.2%) | $89,836 |
| 4-Person Families | 820 (15.8%) | $109,167 |
| 5-Person Families | 549 (10.6%) | $94,250 |
| 6-Person Families | 367 (7.1%) | $63,368 |
| 7+ Person Families | 50 (1.0%) | $173,875 |
| Total | 5,194 (100.0%) | $85,019 |
Family Income by Number of Earners in Acworth
The median family income in Acworth is $85,019, with families comprising 3+ earners (950) having the highest median family income of $120,625, while families with no earners (468) have the lowest median family income of $38,214, accounting for 18.3% and 9.0% of families, respectively.
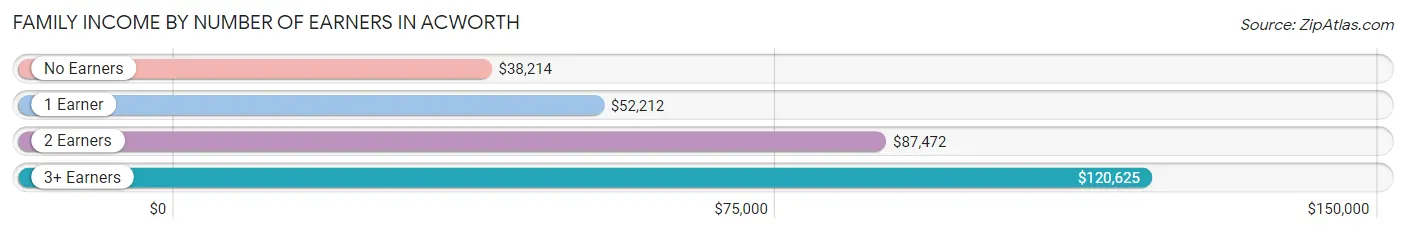
| Number of Earners | # Families | Median Income |
| No Earners | 468 (9.0%) | $38,214 |
| 1 Earner | 1,596 (30.7%) | $52,212 |
| 2 Earners | 2,180 (42.0%) | $87,472 |
| 3+ Earners | 950 (18.3%) | $120,625 |
| Total | 5,194 (100.0%) | $85,019 |
Household Income in Acworth
Household Income Brackets in Acworth
With 1,710 households falling in the category, the $100,000 to $149,999 income range is the most frequent in Acworth, accounting for 20.7% of all households. In contrast, only 347 households (4.2%) fall into the $10,000 to $14,999 income bracket, making it the least populous group.
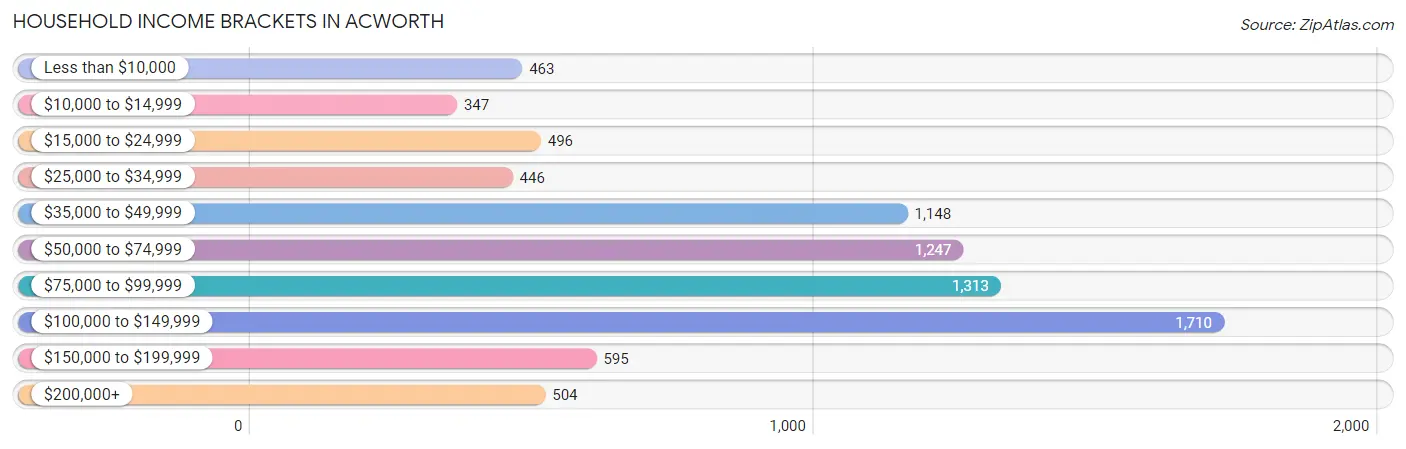
| Income Bracket | # Households | % Households |
| Less than $10,000 | 463 | 5.6% |
| $10,000 to $14,999 | 347 | 4.2% |
| $15,000 to $24,999 | 496 | 6.0% |
| $25,000 to $34,999 | 446 | 5.4% |
| $35,000 to $49,999 | 1,148 | 13.9% |
| $50,000 to $74,999 | 1,247 | 15.1% |
| $75,000 to $99,999 | 1,313 | 15.9% |
| $100,000 to $149,999 | 1,710 | 20.7% |
| $150,000 to $199,999 | 595 | 7.2% |
| $200,000+ | 504 | 6.1% |
Household Income by Householder Age in Acworth
The median household income in Acworth is $74,643, with the highest median household income of $85,603 found in the 25 to 44 years age bracket for the primary householder. A total of 2,414 households (29.2%) fall into this category. Meanwhile, the 65+ years age bracket for the primary householder has the lowest median household income of $36,773, with 1,907 households (23.1%) in this group.
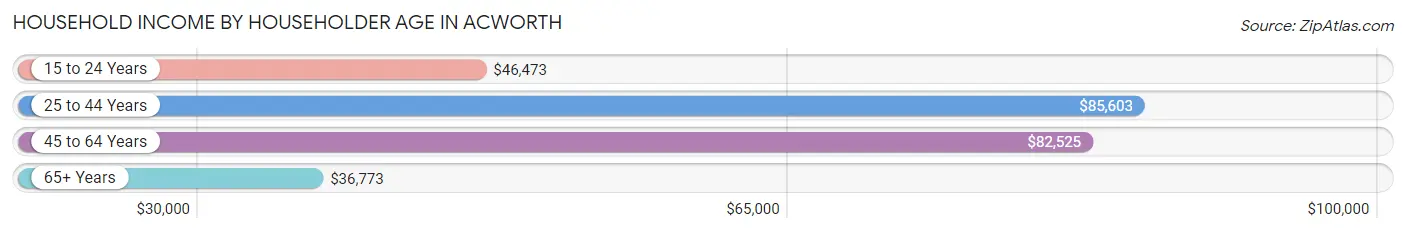
| Income Bracket | # Households | Median Income |
| 15 to 24 Years | 337 (4.1%) | $46,473 |
| 25 to 44 Years | 2,414 (29.2%) | $85,603 |
| 45 to 64 Years | 3,602 (43.6%) | $82,525 |
| 65+ Years | 1,907 (23.1%) | $36,773 |
| Total | 8,260 (100.0%) | $74,643 |
Poverty in Acworth
Income Below Poverty by Sex and Age in Acworth
With 6.9% poverty level for males and 9.3% for females among the residents of Acworth, 75 year old and over males and 75 year old and over females are the most vulnerable to poverty, with 94 males (28.1%) and 297 females (28.9%) in their respective age groups living below the poverty level.
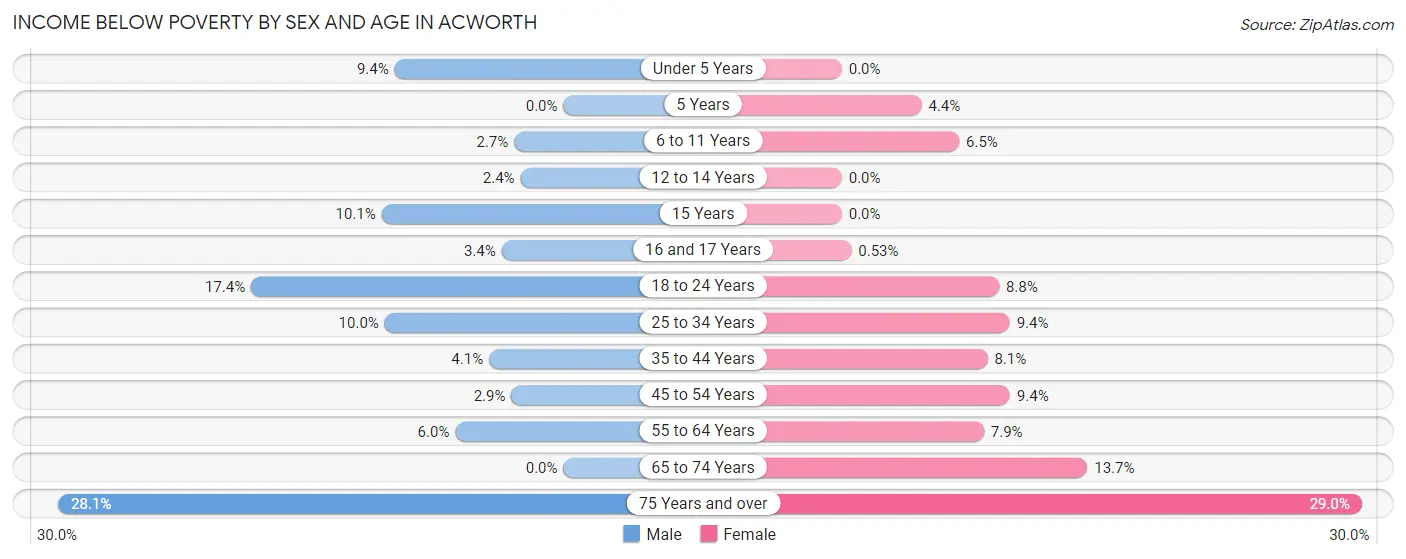
| Age Bracket | Male | Female |
| Under 5 Years | 61 (9.4%) | 0 (0.0%) |
| 5 Years | 0 (0.0%) | 2 (4.4%) |
| 6 to 11 Years | 30 (2.7%) | 69 (6.5%) |
| 12 to 14 Years | 13 (2.4%) | 0 (0.0%) |
| 15 Years | 25 (10.1%) | 0 (0.0%) |
| 16 and 17 Years | 14 (3.4%) | 4 (0.5%) |
| 18 to 24 Years | 173 (17.4%) | 70 (8.7%) |
| 25 to 34 Years | 130 (10.0%) | 133 (9.3%) |
| 35 to 44 Years | 55 (4.1%) | 113 (8.1%) |
| 45 to 54 Years | 52 (2.9%) | 199 (9.4%) |
| 55 to 64 Years | 80 (6.0%) | 93 (7.9%) |
| 65 to 74 Years | 0 (0.0%) | 104 (13.7%) |
| 75 Years and over | 94 (28.1%) | 297 (28.9%) |
| Total | 727 (6.9%) | 1,084 (9.3%) |
Income Above Poverty by Sex and Age in Acworth
According to the poverty statistics in Acworth, males aged 5 years and females aged under 5 years are the age groups that are most secure financially, with 100.0% of males and 100.0% of females in these age groups living above the poverty line.
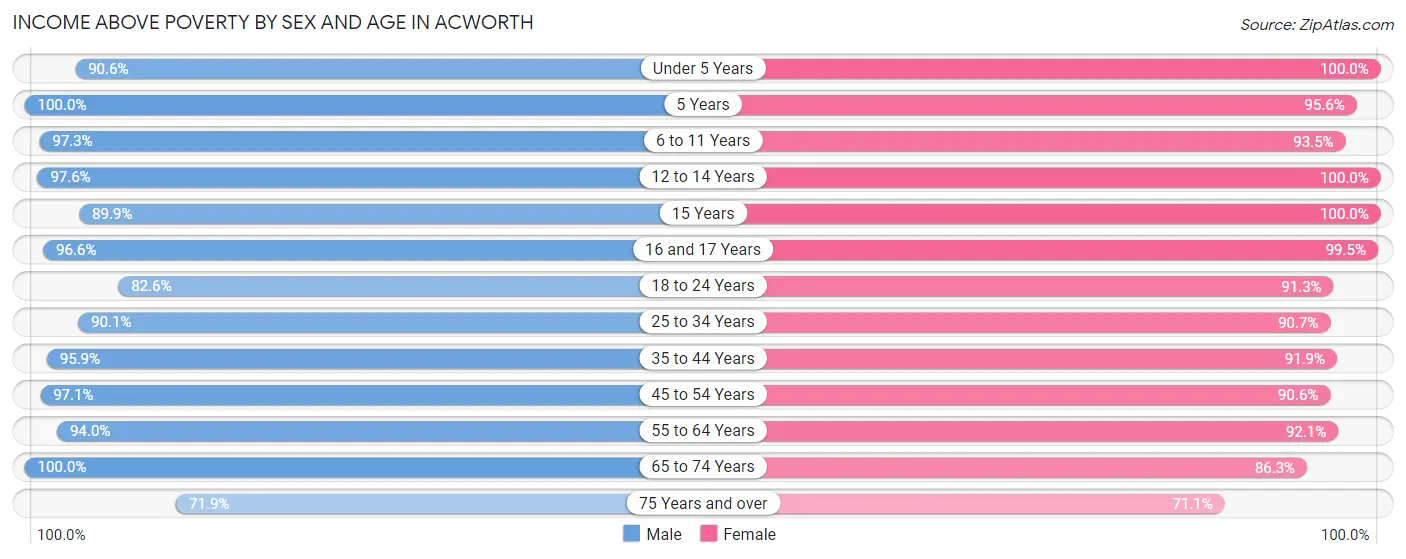
| Age Bracket | Male | Female |
| Under 5 Years | 588 (90.6%) | 444 (100.0%) |
| 5 Years | 87 (100.0%) | 43 (95.6%) |
| 6 to 11 Years | 1,064 (97.3%) | 988 (93.5%) |
| 12 to 14 Years | 531 (97.6%) | 518 (100.0%) |
| 15 Years | 222 (89.9%) | 151 (100.0%) |
| 16 and 17 Years | 393 (96.6%) | 757 (99.5%) |
| 18 to 24 Years | 822 (82.6%) | 730 (91.2%) |
| 25 to 34 Years | 1,177 (90.0%) | 1,289 (90.6%) |
| 35 to 44 Years | 1,272 (95.9%) | 1,280 (91.9%) |
| 45 to 54 Years | 1,743 (97.1%) | 1,927 (90.6%) |
| 55 to 64 Years | 1,248 (94.0%) | 1,082 (92.1%) |
| 65 to 74 Years | 463 (100.0%) | 657 (86.3%) |
| 75 Years and over | 240 (71.9%) | 729 (71.1%) |
| Total | 9,850 (93.1%) | 10,595 (90.7%) |
Income Below Poverty Among Married-Couple Families in Acworth
The poverty statistics for married-couple families in Acworth show that 2.9% or 108 of the total 3,767 families live below the poverty line. Families with no children have the highest poverty rate of 6.5%, comprising of 108 families. On the other hand, families with 1 or 2 children have the lowest poverty rate of 0.0%, which includes 0 families.
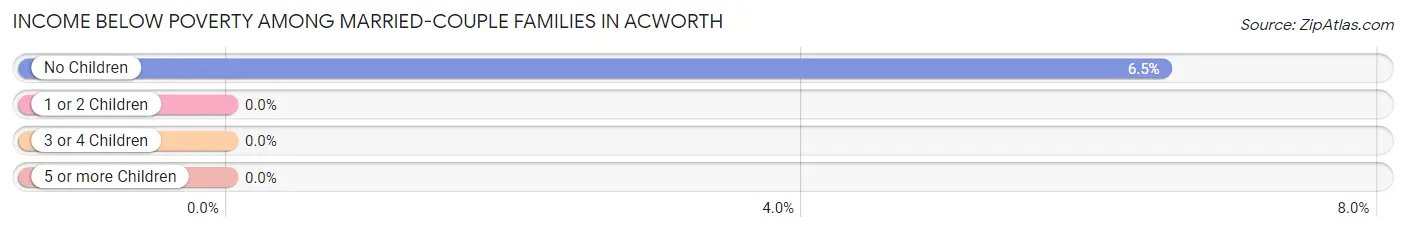
| Children | Above Poverty | Below Poverty |
| No Children | 1,554 (93.5%) | 108 (6.5%) |
| 1 or 2 Children | 1,381 (100.0%) | 0 (0.0%) |
| 3 or 4 Children | 698 (100.0%) | 0 (0.0%) |
| 5 or more Children | 26 (100.0%) | 0 (0.0%) |
| Total | 3,659 (97.1%) | 108 (2.9%) |
Income Below Poverty Among Single-Parent Households in Acworth
According to the poverty data in Acworth, 9.7% or 41 single-father households and 18.3% or 183 single-mother households are living below the poverty line. Among single-father households, those with no children have the highest poverty rate, with 41 households (34.7%) experiencing poverty. Likewise, among single-mother households, those with 3 or 4 children have the highest poverty rate, with 28 households (44.4%) falling below the poverty line.
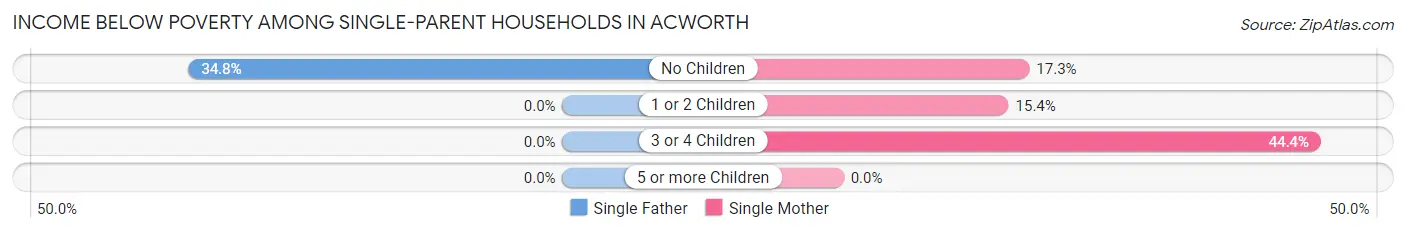
| Children | Single Father | Single Mother |
| No Children | 41 (34.7%) | 96 (17.3%) |
| 1 or 2 Children | 0 (0.0%) | 59 (15.4%) |
| 3 or 4 Children | 0 (0.0%) | 28 (44.4%) |
| 5 or more Children | 0 (0.0%) | 0 (0.0%) |
| Total | 41 (9.7%) | 183 (18.3%) |
Income Below Poverty Among Married-Couple vs Single-Parent Households in Acworth
The poverty data for Acworth shows that 108 of the married-couple family households (2.9%) and 224 of the single-parent households (15.7%) are living below the poverty level. Within the married-couple family households, those with no children have the highest poverty rate, with 108 households (6.5%) falling below the poverty line. Among the single-parent households, those with 3 or 4 children have the highest poverty rate, with 28 household (29.5%) living below poverty.
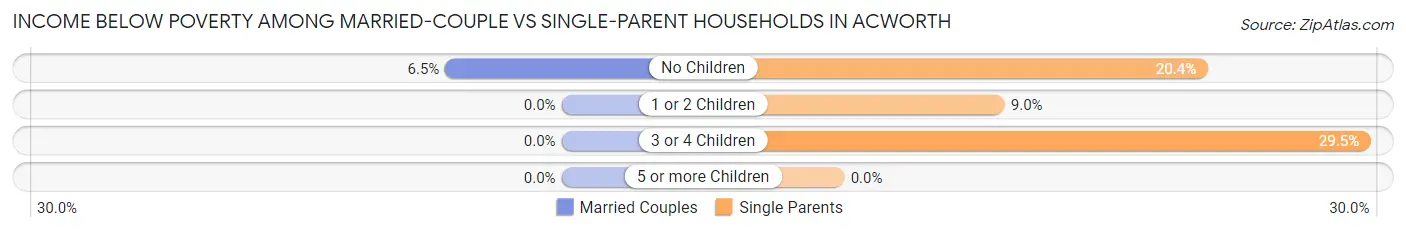
| Children | Married-Couple Families | Single-Parent Households |
| No Children | 108 (6.5%) | 137 (20.4%) |
| 1 or 2 Children | 0 (0.0%) | 59 (8.9%) |
| 3 or 4 Children | 0 (0.0%) | 28 (29.5%) |
| 5 or more Children | 0 (0.0%) | 0 (0.0%) |
| Total | 108 (2.9%) | 224 (15.7%) |
Race in Acworth
The most populous races in Acworth are White / Caucasian (13,170 | 59.0%), Black / African American (5,029 | 22.5%), and Hispanic or Latino (3,796 | 17.0%).
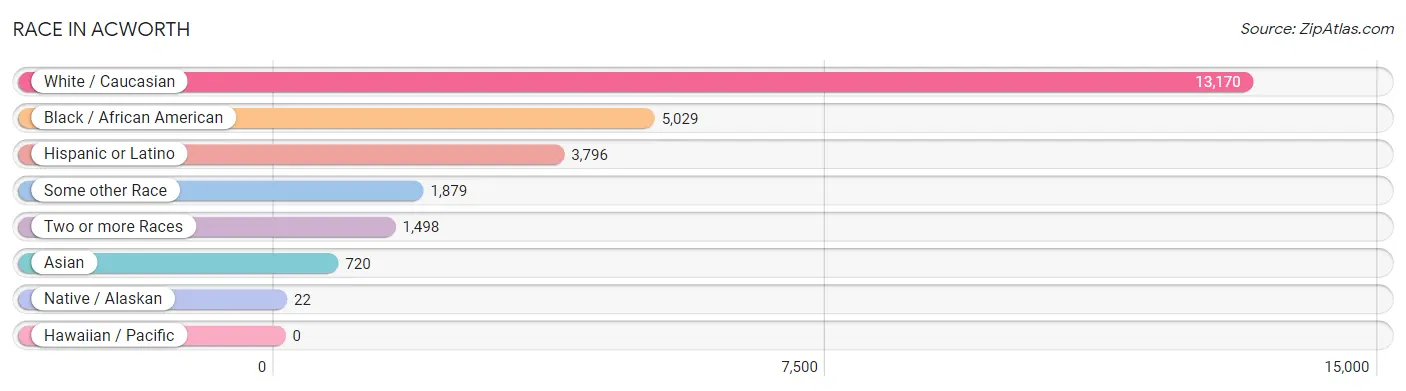
| Race | # Population | % Population |
| Asian | 720 | 3.2% |
| Black / African American | 5,029 | 22.5% |
| Hawaiian / Pacific | 0 | 0.0% |
| Hispanic or Latino | 3,796 | 17.0% |
| Native / Alaskan | 22 | 0.1% |
| White / Caucasian | 13,170 | 59.0% |
| Two or more Races | 1,498 | 6.7% |
| Some other Race | 1,879 | 8.4% |
| Total | 22,318 | 100.0% |
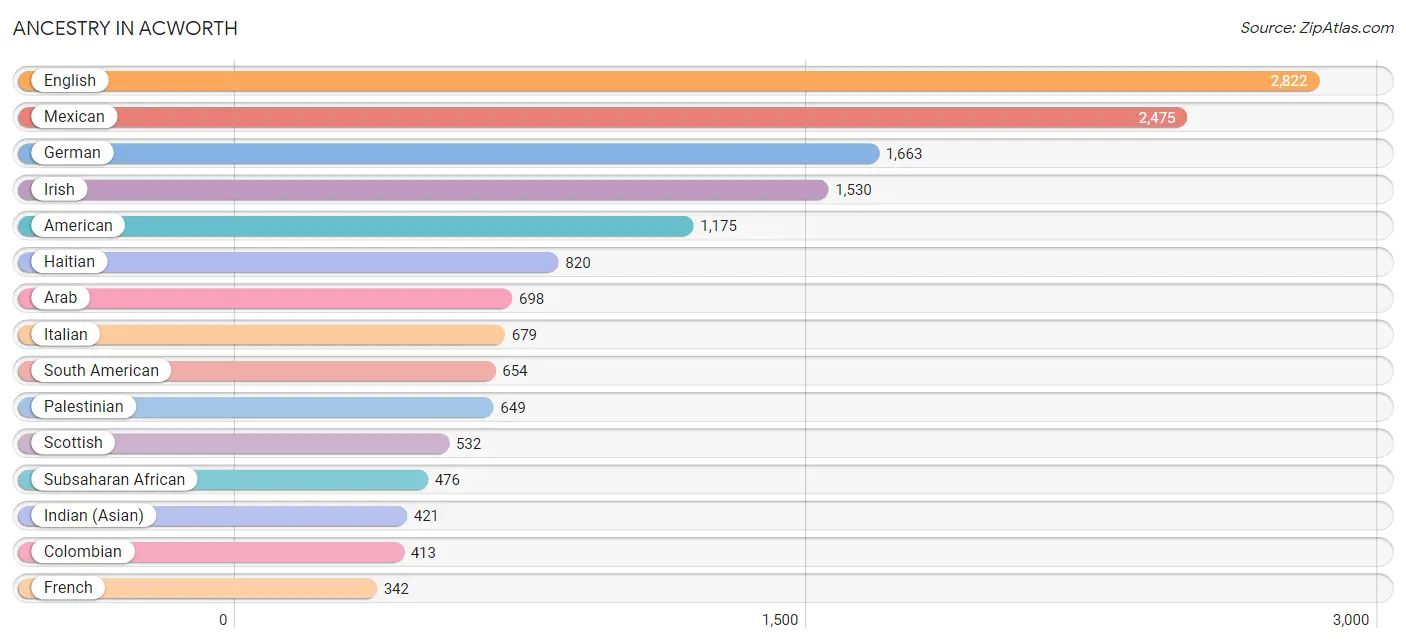
Ancestry in Acworth
The most populous ancestries reported in Acworth are English (2,822 | 12.6%), Mexican (2,475 | 11.1%), German (1,663 | 7.4%), Irish (1,530 | 6.9%), and American (1,175 | 5.3%), together accounting for 43.3% of all Acworth residents.
| Ancestry | # Population | % Population |
| African | 157 | 0.7% |
| American | 1,175 | 5.3% |
| Arab | 698 | 3.1% |
| Belgian | 28 | 0.1% |
| Bhutanese | 41 | 0.2% |
| Brazilian | 59 | 0.3% |
| British | 140 | 0.6% |
| Burmese | 56 | 0.3% |
| Canadian | 51 | 0.2% |
| Central American | 118 | 0.5% |
| Cherokee | 22 | 0.1% |
| Cheyenne | 13 | 0.1% |
| Chilean | 31 | 0.1% |
| Colombian | 413 | 1.8% |
| Croatian | 25 | 0.1% |
| Cuban | 44 | 0.2% |
| Czech | 51 | 0.2% |
| Czechoslovakian | 27 | 0.1% |
| Danish | 42 | 0.2% |
| Delaware | 45 | 0.2% |
| Dutch | 76 | 0.3% |
| Eastern European | 16 | 0.1% |
| Ecuadorian | 9 | 0.0% |
| English | 2,822 | 12.6% |
| Ethiopian | 98 | 0.4% |
| European | 276 | 1.2% |
| French | 342 | 1.5% |
| French Canadian | 10 | 0.0% |
| German | 1,663 | 7.4% |
| Greek | 26 | 0.1% |
| Guatemalan | 19 | 0.1% |
| Haitian | 820 | 3.7% |
| Hungarian | 8 | 0.0% |
| Indian (Asian) | 421 | 1.9% |
| Iranian | 92 | 0.4% |
| Irish | 1,530 | 6.9% |
| Italian | 679 | 3.0% |
| Jamaican | 320 | 1.4% |
| Kenyan | 110 | 0.5% |
| Korean | 152 | 0.7% |
| Lebanese | 15 | 0.1% |
| Lithuanian | 20 | 0.1% |
| Macedonian | 26 | 0.1% |
| Mexican | 2,475 | 11.1% |
| Moroccan | 31 | 0.1% |
| Nicaraguan | 68 | 0.3% |
| Nigerian | 56 | 0.3% |
| Northern European | 12 | 0.1% |
| Norwegian | 30 | 0.1% |
| Palestinian | 649 | 2.9% |
| Peruvian | 78 | 0.4% |
| Polish | 281 | 1.3% |
| Portuguese | 22 | 0.1% |
| Puerto Rican | 281 | 1.3% |
| Russian | 80 | 0.4% |
| Salvadoran | 31 | 0.1% |
| Scandinavian | 17 | 0.1% |
| Scotch-Irish | 199 | 0.9% |
| Scottish | 532 | 2.4% |
| Seminole | 13 | 0.1% |
| Serbian | 7 | 0.0% |
| Slovak | 28 | 0.1% |
| Slovene | 17 | 0.1% |
| South American | 654 | 2.9% |
| Spaniard | 39 | 0.2% |
| Sri Lankan | 106 | 0.5% |
| Subsaharan African | 476 | 2.1% |
| Swedish | 138 | 0.6% |
| Swiss | 53 | 0.2% |
| Thai | 122 | 0.5% |
| Ukrainian | 15 | 0.1% |
| Uruguayan | 27 | 0.1% |
| Venezuelan | 96 | 0.4% |
| Welsh | 81 | 0.4% |
| West Indian | 10 | 0.0% |
| Yaqui | 13 | 0.1% |
| Yugoslavian | 5 | 0.0% | View All 77 Rows |
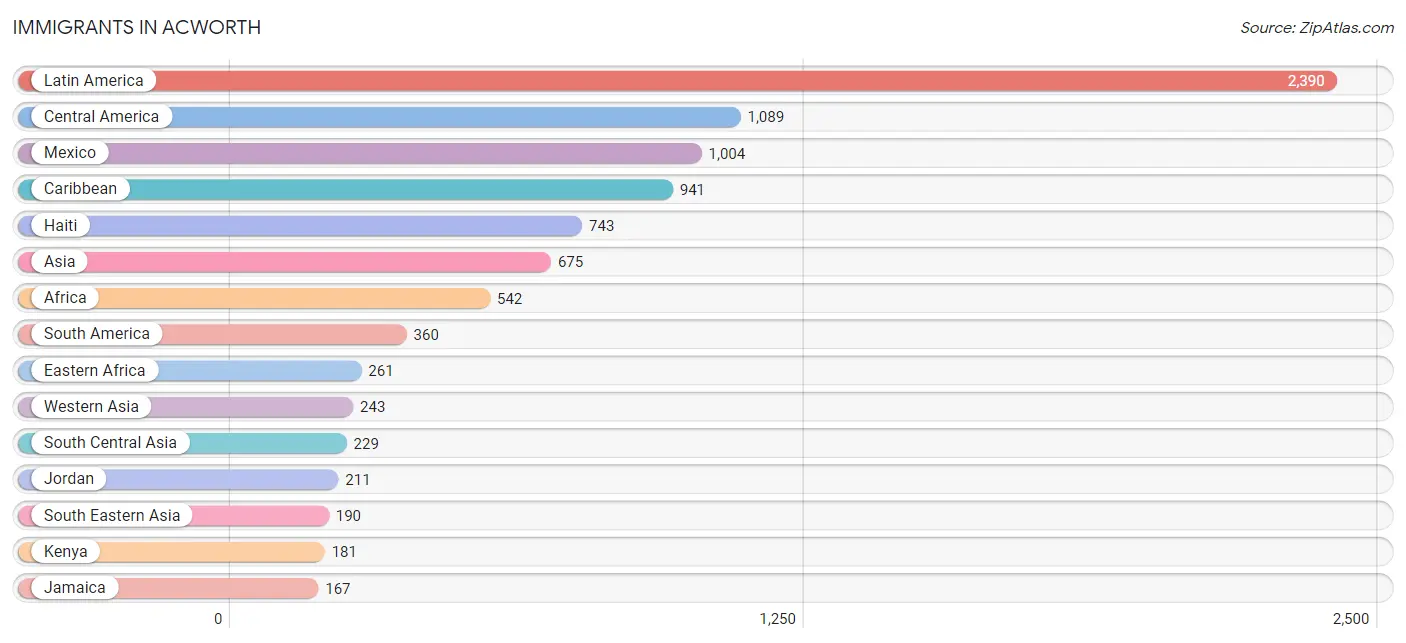
Immigrants in Acworth
The most numerous immigrant groups reported in Acworth came from Latin America (2,390 | 10.7%), Central America (1,089 | 4.9%), Mexico (1,004 | 4.5%), Caribbean (941 | 4.2%), and Haiti (743 | 3.3%), together accounting for 27.6% of all Acworth residents.
| Immigration Origin | # Population | % Population |
| Africa | 542 | 2.4% |
| Asia | 675 | 3.0% |
| Barbados | 10 | 0.0% |
| Belgium | 28 | 0.1% |
| Brazil | 73 | 0.3% |
| Canada | 77 | 0.4% |
| Caribbean | 941 | 4.2% |
| Central America | 1,089 | 4.9% |
| Colombia | 89 | 0.4% |
| Congo | 52 | 0.2% |
| Dominica | 11 | 0.1% |
| Eastern Africa | 261 | 1.2% |
| Eastern Asia | 13 | 0.1% |
| Eastern Europe | 33 | 0.2% |
| El Salvador | 17 | 0.1% |
| England | 23 | 0.1% |
| Ethiopia | 80 | 0.4% |
| Europe | 119 | 0.5% |
| Germany | 24 | 0.1% |
| Haiti | 743 | 3.3% |
| India | 74 | 0.3% |
| Iran | 155 | 0.7% |
| Israel | 27 | 0.1% |
| Jamaica | 167 | 0.7% |
| Jordan | 211 | 0.9% |
| Kenya | 181 | 0.8% |
| Korea | 13 | 0.1% |
| Latin America | 2,390 | 10.7% |
| Malaysia | 17 | 0.1% |
| Mexico | 1,004 | 4.5% |
| Middle Africa | 52 | 0.2% |
| Morocco | 65 | 0.3% |
| Nicaragua | 68 | 0.3% |
| Nigeria | 100 | 0.4% |
| North Macedonia | 26 | 0.1% |
| Northern Africa | 65 | 0.3% |
| Northern Europe | 23 | 0.1% |
| Peru | 68 | 0.3% |
| Philippines | 69 | 0.3% |
| Serbia | 7 | 0.0% |
| South America | 360 | 1.6% |
| South Central Asia | 229 | 1.0% |
| South Eastern Asia | 190 | 0.9% |
| Switzerland | 11 | 0.1% |
| Syria | 5 | 0.0% |
| Trinidad and Tobago | 10 | 0.0% |
| Uruguay | 27 | 0.1% |
| Venezuela | 103 | 0.5% |
| Vietnam | 104 | 0.5% |
| Western Africa | 164 | 0.7% |
| Western Asia | 243 | 1.1% |
| Western Europe | 63 | 0.3% | View All 52 Rows |
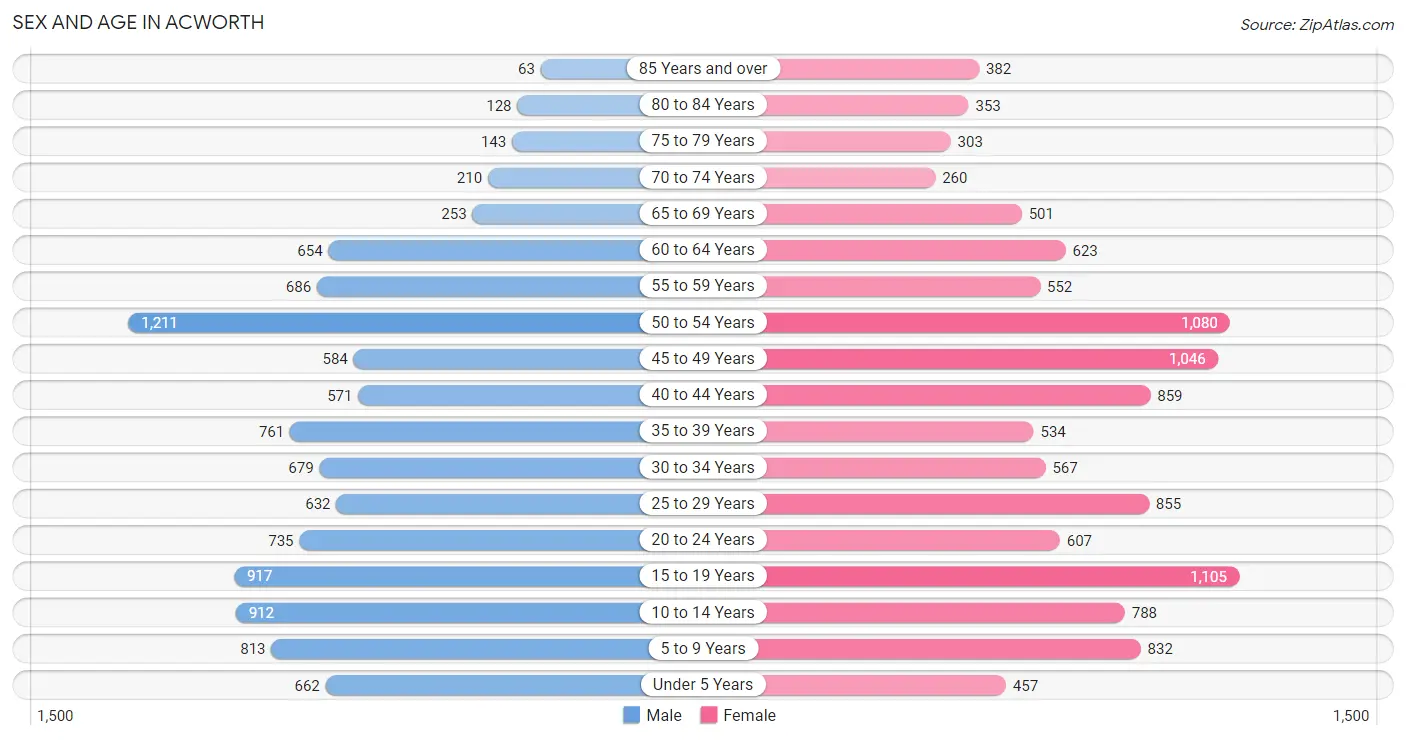
Sex and Age in Acworth
Sex and Age in Acworth
The most populous age groups in Acworth are 50 to 54 Years (1,211 | 11.4%) for men and 15 to 19 Years (1,105 | 9.4%) for women.
| Age Bracket | Male | Female |
| Under 5 Years | 662 (6.2%) | 457 (3.9%) |
| 5 to 9 Years | 813 (7.7%) | 832 (7.1%) |
| 10 to 14 Years | 912 (8.6%) | 788 (6.7%) |
| 15 to 19 Years | 917 (8.6%) | 1,105 (9.4%) |
| 20 to 24 Years | 735 (6.9%) | 607 (5.2%) |
| 25 to 29 Years | 632 (5.9%) | 855 (7.3%) |
| 30 to 34 Years | 679 (6.4%) | 567 (4.8%) |
| 35 to 39 Years | 761 (7.2%) | 534 (4.6%) |
| 40 to 44 Years | 571 (5.4%) | 859 (7.3%) |
| 45 to 49 Years | 584 (5.5%) | 1,046 (8.9%) |
| 50 to 54 Years | 1,211 (11.4%) | 1,080 (9.2%) |
| 55 to 59 Years | 686 (6.5%) | 552 (4.7%) |
| 60 to 64 Years | 654 (6.2%) | 623 (5.3%) |
| 65 to 69 Years | 253 (2.4%) | 501 (4.3%) |
| 70 to 74 Years | 210 (2.0%) | 260 (2.2%) |
| 75 to 79 Years | 143 (1.3%) | 303 (2.6%) |
| 80 to 84 Years | 128 (1.2%) | 353 (3.0%) |
| 85 Years and over | 63 (0.6%) | 382 (3.3%) |
| Total | 10,614 (100.0%) | 11,704 (100.0%) |
Families and Households in Acworth
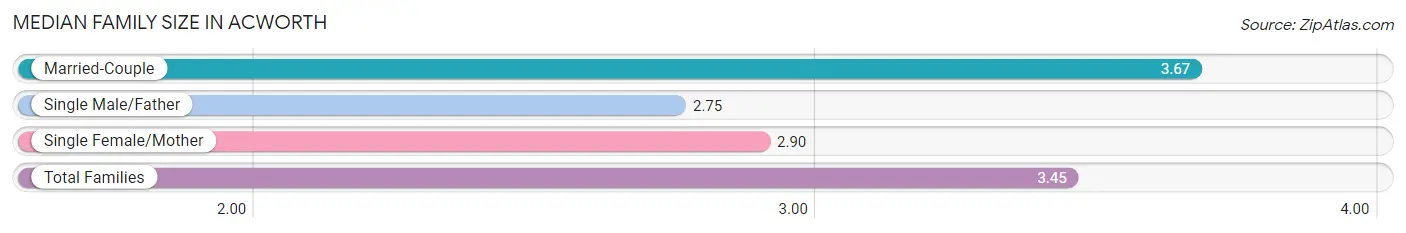
Median Family Size in Acworth
The median family size in Acworth is 3.45 persons per family, with married-couple families (3,767 | 72.5%) accounting for the largest median family size of 3.67 persons per family. On the other hand, single male/father families (425 | 8.2%) represent the smallest median family size with 2.75 persons per family.
| Family Type | # Families | Family Size |
| Married-Couple | 3,767 (72.5%) | 3.67 |
| Single Male/Father | 425 (8.2%) | 2.75 |
| Single Female/Mother | 1,002 (19.3%) | 2.90 |
| Total Families | 5,194 (100.0%) | 3.45 |
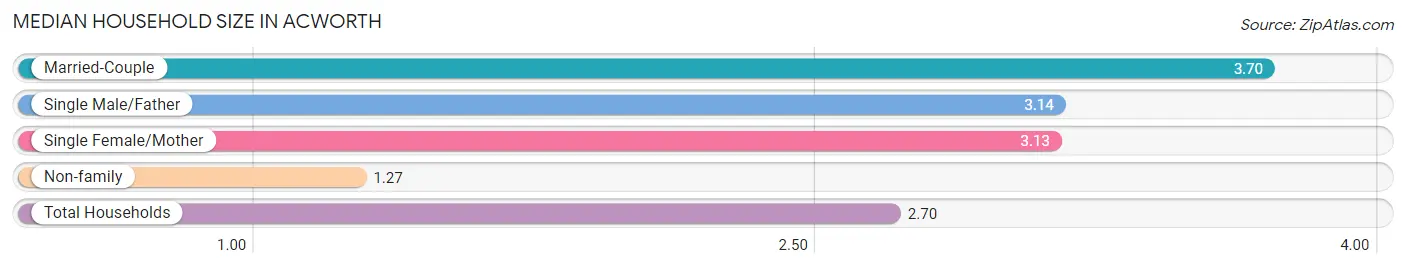
Median Household Size in Acworth
The median household size in Acworth is 2.70 persons per household, with married-couple households (3,767 | 45.6%) accounting for the largest median household size of 3.7 persons per household. non-family households (3,066 | 37.1%) represent the smallest median household size with 1.27 persons per household.
| Household Type | # Households | Household Size |
| Married-Couple | 3,767 (45.6%) | 3.70 |
| Single Male/Father | 425 (5.1%) | 3.14 |
| Single Female/Mother | 1,002 (12.1%) | 3.13 |
| Non-family | 3,066 (37.1%) | 1.27 |
| Total Households | 8,260 (100.0%) | 2.70 |
Household Size by Marriage Status in Acworth
Out of a total of 8,260 households in Acworth, 5,194 (62.9%) are family households, while 3,066 (37.1%) are nonfamily households. The most numerous type of family households are 2-person households, comprising 1,871, and the most common type of nonfamily households are 1-person households, comprising 2,580.
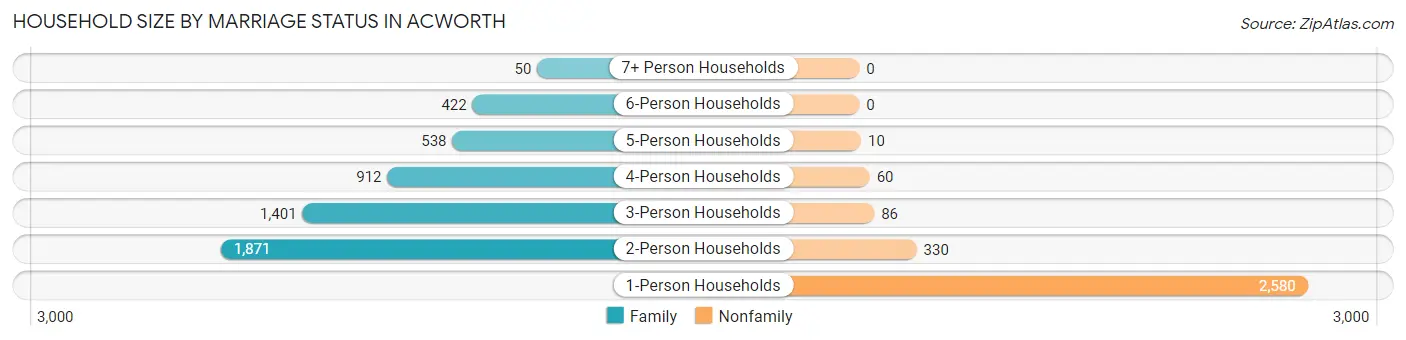
| Household Size | Family Households | Nonfamily Households |
| 1-Person Households | - | 2,580 (31.2%) |
| 2-Person Households | 1,871 (22.7%) | 330 (4.0%) |
| 3-Person Households | 1,401 (17.0%) | 86 (1.0%) |
| 4-Person Households | 912 (11.0%) | 60 (0.7%) |
| 5-Person Households | 538 (6.5%) | 10 (0.1%) |
| 6-Person Households | 422 (5.1%) | 0 (0.0%) |
| 7+ Person Households | 50 (0.6%) | 0 (0.0%) |
| Total | 5,194 (62.9%) | 3,066 (37.1%) |
Female Fertility in Acworth
Fertility by Age in Acworth
Average fertility rate in Acworth is 54.0 births per 1,000 women. Women in the age bracket of 20 to 34 years have the highest fertility rate with 76.0 births per 1,000 women. Women in the age bracket of 20 to 34 years acount for 50.2% of all women with births.
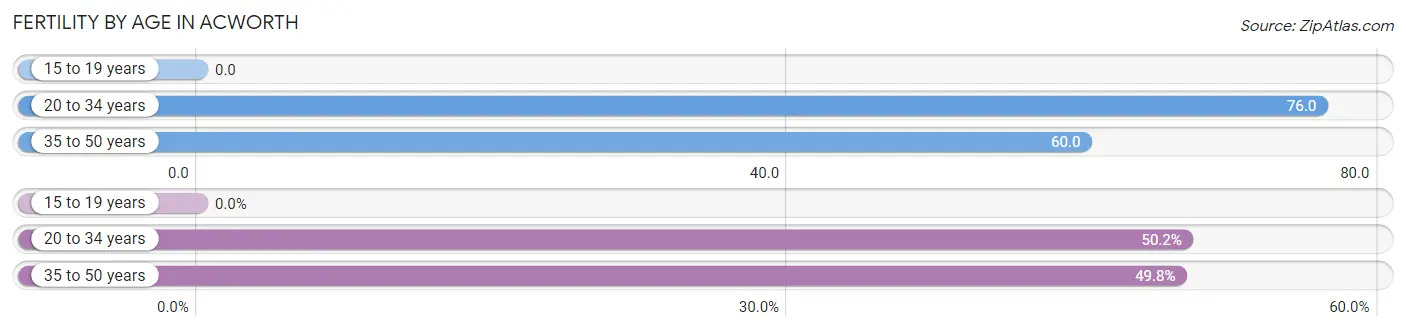
| Age Bracket | Women with Births | Births / 1,000 Women |
| 15 to 19 years | 0 (0.0%) | 0.0 |
| 20 to 34 years | 154 (50.2%) | 76.0 |
| 35 to 50 years | 153 (49.8%) | 60.0 |
| Total | 307 (100.0%) | 54.0 |
Fertility by Age by Marriage Status in Acworth
97.1% of women with births (307) in Acworth are married. The highest percentage of unmarried women with births falls into 20 to 34 years age bracket with 5.8% of them unmarried at the time of birth, while the lowest percentage of unmarried women with births belong to 35 to 50 years age bracket with 0.0% of them unmarried.
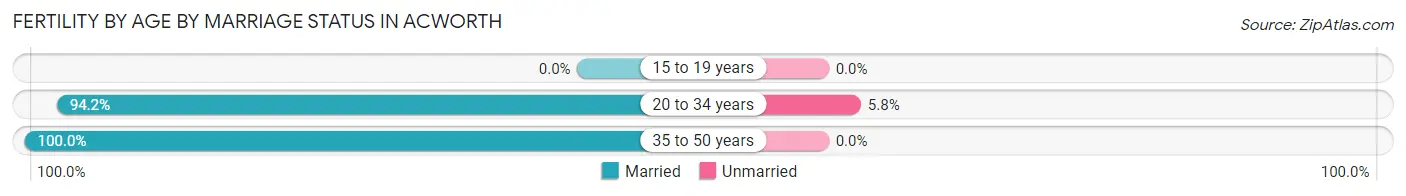
| Age Bracket | Married | Unmarried |
| 15 to 19 years | 0 (0.0%) | 0 (0.0%) |
| 20 to 34 years | 145 (94.2%) | 9 (5.8%) |
| 35 to 50 years | 153 (100.0%) | 0 (0.0%) |
| Total | 298 (97.1%) | 9 (2.9%) |
Fertility by Education in Acworth
Average fertility rate in Acworth is 54.0 births per 1,000 women. Women with the education attainment of graduate degree have the highest fertility rate of 241.0 births per 1,000 women, while women with the education attainment of less than high school have the lowest fertility at 9.0 births per 1,000 women. Women with the education attainment of bachelor's degree represent 37.8% of all women with births.
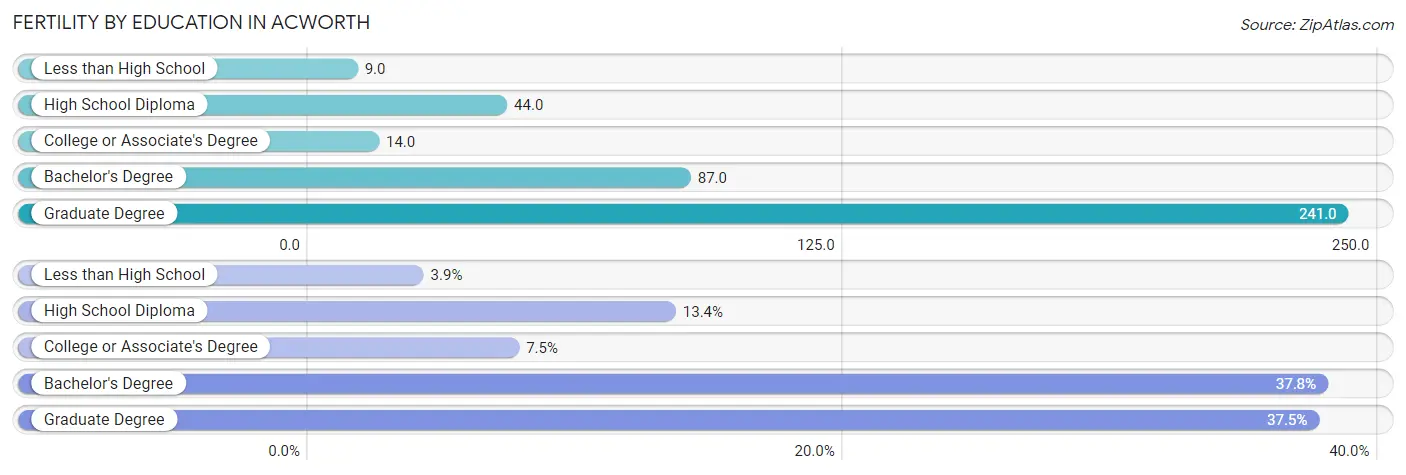
| Educational Attainment | Women with Births | Births / 1,000 Women |
| Less than High School | 12 (3.9%) | 9.0 |
| High School Diploma | 41 (13.4%) | 44.0 |
| College or Associate's Degree | 23 (7.5%) | 14.0 |
| Bachelor's Degree | 116 (37.8%) | 87.0 |
| Graduate Degree | 115 (37.5%) | 241.0 |
| Total | 307 (100.0%) | 54.0 |
Fertility by Education by Marriage Status in Acworth
2.9% of women with births in Acworth are unmarried. Women with the educational attainment of less than high school are most likely to be married with 100.0% of them married at childbirth, while women with the educational attainment of college or associate's degree are least likely to be married with 39.1% of them unmarried at childbirth.
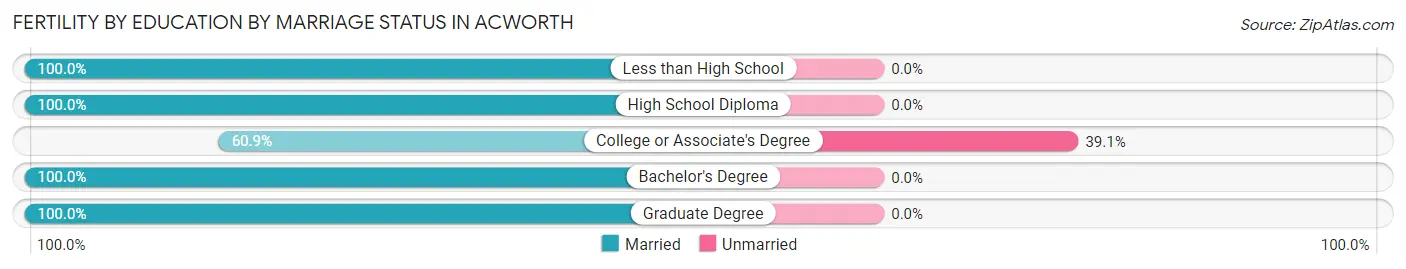
| Educational Attainment | Married | Unmarried |
| Less than High School | 12 (100.0%) | 0 (0.0%) |
| High School Diploma | 41 (100.0%) | 0 (0.0%) |
| College or Associate's Degree | 14 (60.9%) | 9 (39.1%) |
| Bachelor's Degree | 116 (100.0%) | 0 (0.0%) |
| Graduate Degree | 115 (100.0%) | 0 (0.0%) |
| Total | 298 (97.1%) | 9 (2.9%) |
Employment Characteristics in Acworth
Employment by Class of Employer in Acworth
Among the 11,757 employed individuals in Acworth, private company employees (8,405 | 71.5%), self-employed (not incorporated) (884 | 7.5%), and not-for-profit organizations (821 | 7.0%) make up the most common classes of employment.
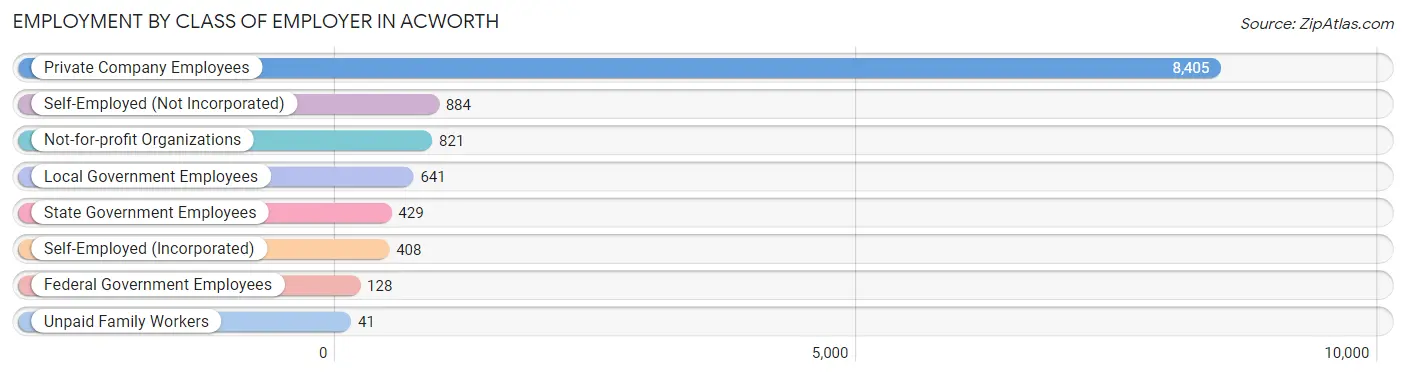
| Employer Class | # Employees | % Employees |
| Private Company Employees | 8,405 | 71.5% |
| Self-Employed (Incorporated) | 408 | 3.5% |
| Self-Employed (Not Incorporated) | 884 | 7.5% |
| Not-for-profit Organizations | 821 | 7.0% |
| Local Government Employees | 641 | 5.4% |
| State Government Employees | 429 | 3.6% |
| Federal Government Employees | 128 | 1.1% |
| Unpaid Family Workers | 41 | 0.4% |
| Total | 11,757 | 100.0% |
Employment Status by Age in Acworth
According to the labor force statistics for Acworth, out of the total population over 16 years of age (17,456), 71.4% or 12,464 individuals are in the labor force, with 4.2% or 523 of them unemployed. The age group with the highest labor force participation rate is 30 to 34 years, with 90.4% or 1,126 individuals in the labor force. Within the labor force, the 75 years and over age range has the highest percentage of unemployed individuals, with 23.7% or 9 of them being unemployed.
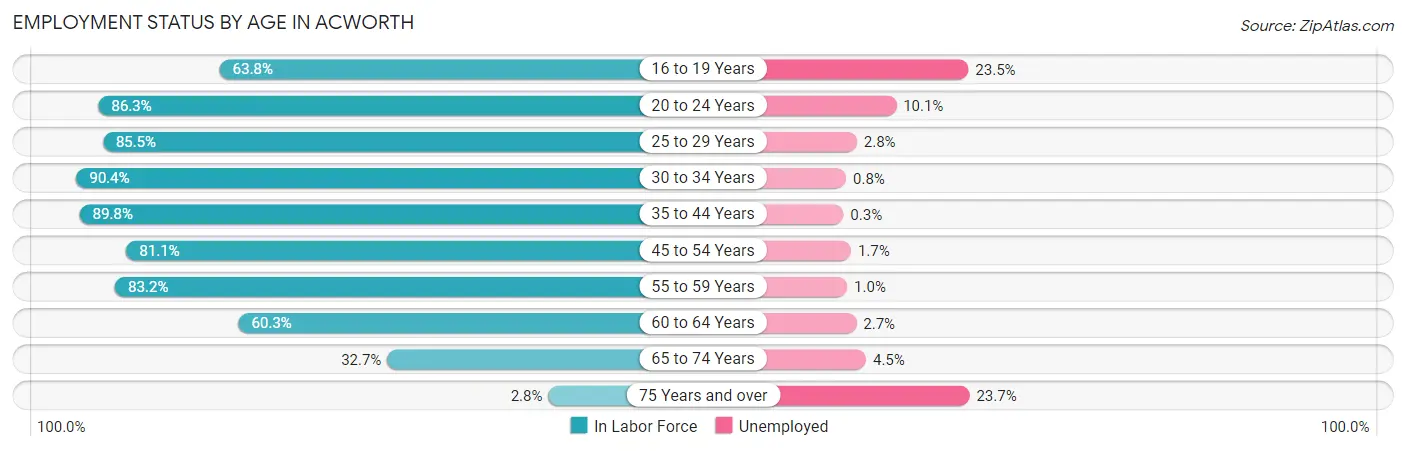
| Age Bracket | In Labor Force | Unemployed |
| 16 to 19 Years | 1,036 (63.8%) | 243 (23.5%) |
| 20 to 24 Years | 1,158 (86.3%) | 117 (10.1%) |
| 25 to 29 Years | 1,271 (85.5%) | 36 (2.8%) |
| 30 to 34 Years | 1,126 (90.4%) | 9 (0.8%) |
| 35 to 44 Years | 2,447 (89.8%) | 7 (0.3%) |
| 45 to 54 Years | 3,180 (81.1%) | 54 (1.7%) |
| 55 to 59 Years | 1,030 (83.2%) | 10 (1.0%) |
| 60 to 64 Years | 770 (60.3%) | 21 (2.7%) |
| 65 to 74 Years | 400 (32.7%) | 18 (4.5%) |
| 75 Years and over | 38 (2.8%) | 9 (23.7%) |
| Total | 12,464 (71.4%) | 523 (4.2%) |
Employment Status by Educational Attainment in Acworth
According to labor force statistics for Acworth, 82.6% of individuals (9,824) out of the total population between 25 and 64 years of age (11,894) are in the labor force, with 1.4% or 138 of them being unemployed. The group with the highest labor force participation rate are those with the educational attainment of bachelor's degree or higher, with 87.9% or 3,451 individuals in the labor force. Within the labor force, individuals with high school diploma education have the highest percentage of unemployment, with 1.9% or 45 of them being unemployed.
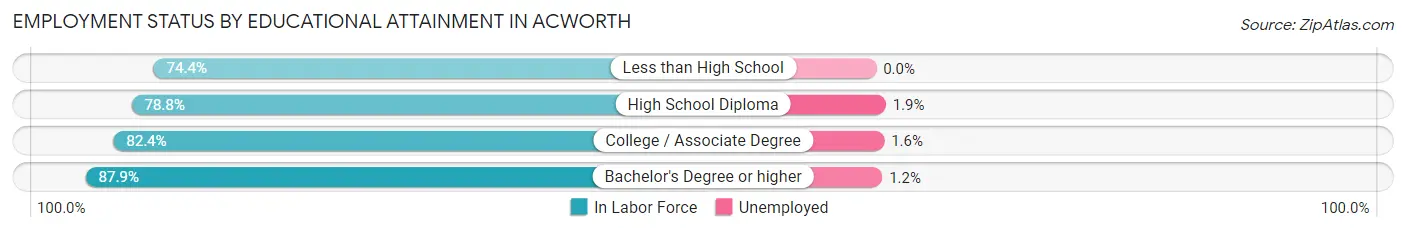
| Educational Attainment | In Labor Force | Unemployed |
| Less than High School | 775 (74.4%) | 0 (0.0%) |
| High School Diploma | 2,382 (78.8%) | 57 (1.9%) |
| College / Associate Degree | 3,217 (82.4%) | 62 (1.6%) |
| Bachelor's Degree or higher | 3,451 (87.9%) | 47 (1.2%) |
| Total | 9,824 (82.6%) | 167 (1.4%) |
Employment Occupations by Sex in Acworth
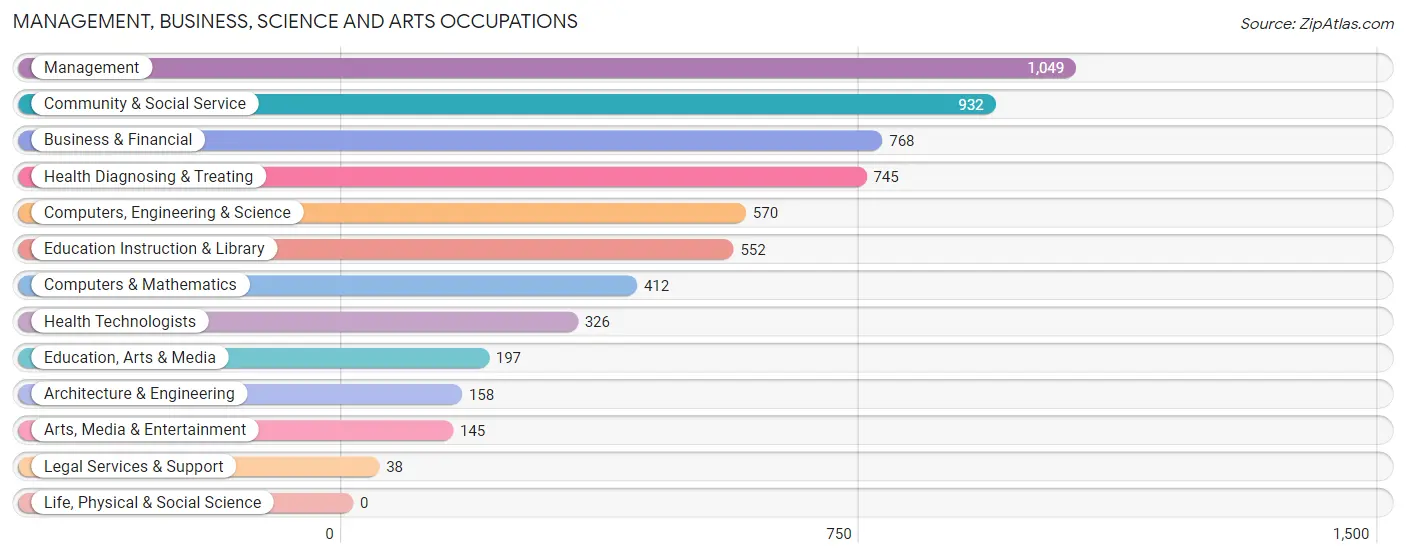
Management, Business, Science and Arts Occupations
The most common Management, Business, Science and Arts occupations in Acworth are Management (1,049 | 8.8%), Community & Social Service (932 | 7.8%), Business & Financial (768 | 6.4%), Health Diagnosing & Treating (745 | 6.2%), and Computers, Engineering & Science (570 | 4.8%).
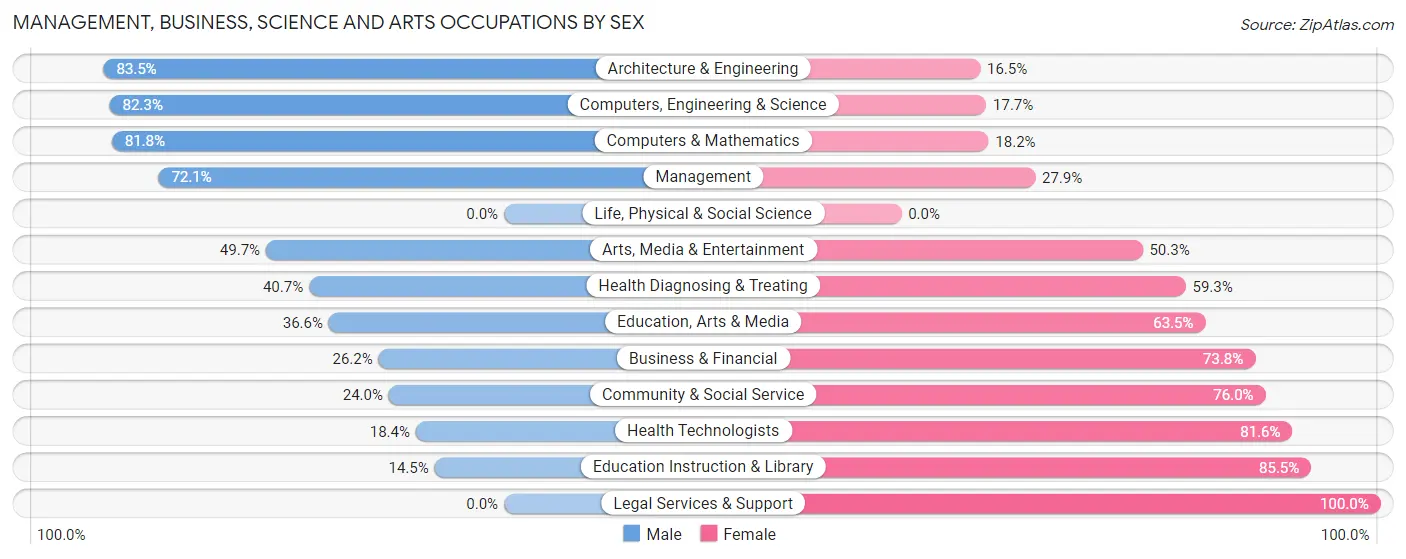
Management, Business, Science and Arts Occupations by Sex
Within the Management, Business, Science and Arts occupations in Acworth, the most male-oriented occupations are Architecture & Engineering (83.5%), Computers, Engineering & Science (82.3%), and Computers & Mathematics (81.8%), while the most female-oriented occupations are Legal Services & Support (100.0%), Education Instruction & Library (85.5%), and Health Technologists (81.6%).
| Occupation | Male | Female |
| Management | 756 (72.1%) | 293 (27.9%) |
| Business & Financial | 201 (26.2%) | 567 (73.8%) |
| Computers, Engineering & Science | 469 (82.3%) | 101 (17.7%) |
| Computers & Mathematics | 337 (81.8%) | 75 (18.2%) |
| Architecture & Engineering | 132 (83.5%) | 26 (16.5%) |
| Life, Physical & Social Science | 0 (0.0%) | 0 (0.0%) |
| Community & Social Service | 224 (24.0%) | 708 (76.0%) |
| Education, Arts & Media | 72 (36.5%) | 125 (63.4%) |
| Legal Services & Support | 0 (0.0%) | 38 (100.0%) |
| Education Instruction & Library | 80 (14.5%) | 472 (85.5%) |
| Arts, Media & Entertainment | 72 (49.7%) | 73 (50.3%) |
| Health Diagnosing & Treating | 303 (40.7%) | 442 (59.3%) |
| Health Technologists | 60 (18.4%) | 266 (81.6%) |
| Total (Category) | 1,953 (48.1%) | 2,111 (51.9%) |
| Total (Overall) | 6,269 (52.5%) | 5,664 (47.5%) |
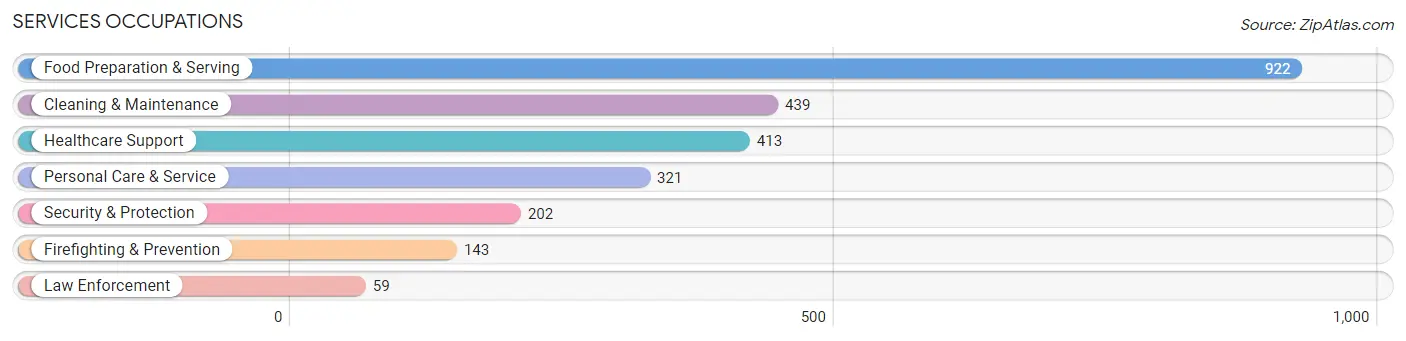
Services Occupations
The most common Services occupations in Acworth are Food Preparation & Serving (922 | 7.7%), Cleaning & Maintenance (439 | 3.7%), Healthcare Support (413 | 3.5%), Personal Care & Service (321 | 2.7%), and Security & Protection (202 | 1.7%).
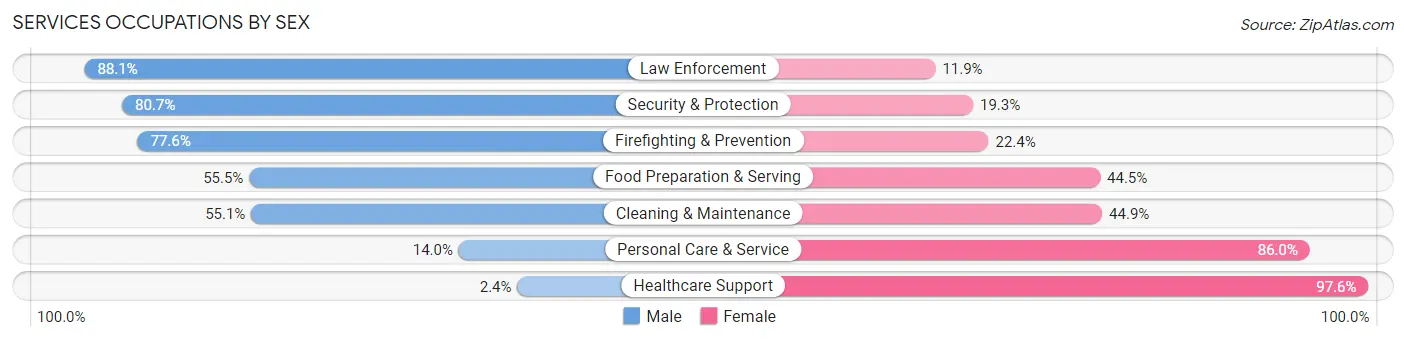
Services Occupations by Sex
Within the Services occupations in Acworth, the most male-oriented occupations are Law Enforcement (88.1%), Security & Protection (80.7%), and Firefighting & Prevention (77.6%), while the most female-oriented occupations are Healthcare Support (97.6%), Personal Care & Service (86.0%), and Cleaning & Maintenance (44.9%).
| Occupation | Male | Female |
| Healthcare Support | 10 (2.4%) | 403 (97.6%) |
| Security & Protection | 163 (80.7%) | 39 (19.3%) |
| Firefighting & Prevention | 111 (77.6%) | 32 (22.4%) |
| Law Enforcement | 52 (88.1%) | 7 (11.9%) |
| Food Preparation & Serving | 512 (55.5%) | 410 (44.5%) |
| Cleaning & Maintenance | 242 (55.1%) | 197 (44.9%) |
| Personal Care & Service | 45 (14.0%) | 276 (86.0%) |
| Total (Category) | 972 (42.3%) | 1,325 (57.7%) |
| Total (Overall) | 6,269 (52.5%) | 5,664 (47.5%) |
Sales and Office Occupations
The most common Sales and Office occupations in Acworth are Sales & Related (1,503 | 12.6%), and Office & Administration (1,270 | 10.6%).
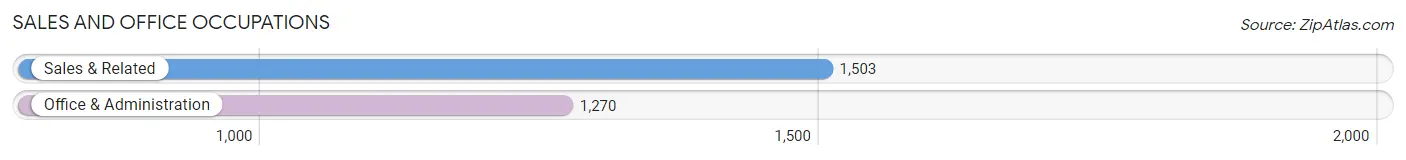
Sales and Office Occupations by Sex
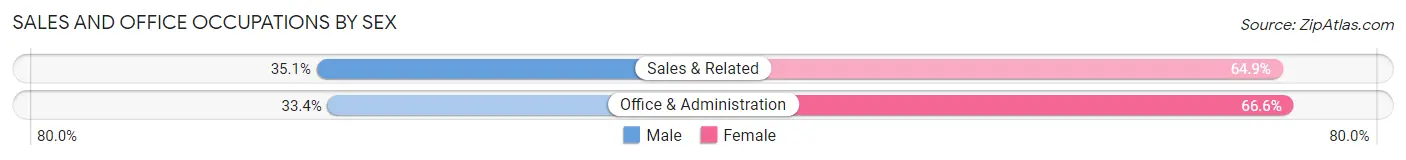
| Occupation | Male | Female |
| Sales & Related | 527 (35.1%) | 976 (64.9%) |
| Office & Administration | 424 (33.4%) | 846 (66.6%) |
| Total (Category) | 951 (34.3%) | 1,822 (65.7%) |
| Total (Overall) | 6,269 (52.5%) | 5,664 (47.5%) |
Natural Resources, Construction and Maintenance Occupations
The most common Natural Resources, Construction and Maintenance occupations in Acworth are Construction & Extraction (538 | 4.5%), and Installation, Maintenance & Repair (378 | 3.2%).
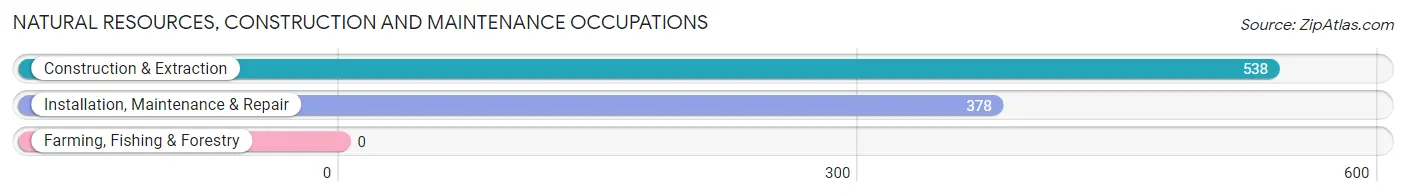
Natural Resources, Construction and Maintenance Occupations by Sex
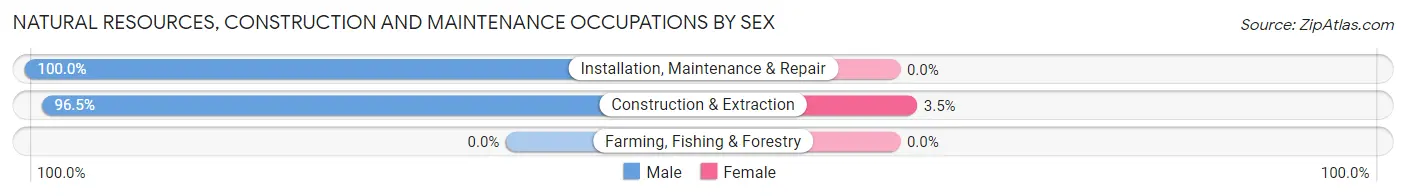
| Occupation | Male | Female |
| Farming, Fishing & Forestry | 0 (0.0%) | 0 (0.0%) |
| Construction & Extraction | 519 (96.5%) | 19 (3.5%) |
| Installation, Maintenance & Repair | 378 (100.0%) | 0 (0.0%) |
| Total (Category) | 897 (97.9%) | 19 (2.1%) |
| Total (Overall) | 6,269 (52.5%) | 5,664 (47.5%) |
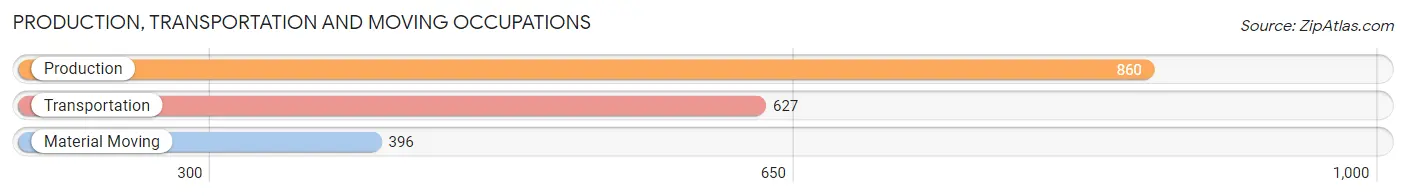
Production, Transportation and Moving Occupations
The most common Production, Transportation and Moving occupations in Acworth are Production (860 | 7.2%), Transportation (627 | 5.2%), and Material Moving (396 | 3.3%).
Production, Transportation and Moving Occupations by Sex
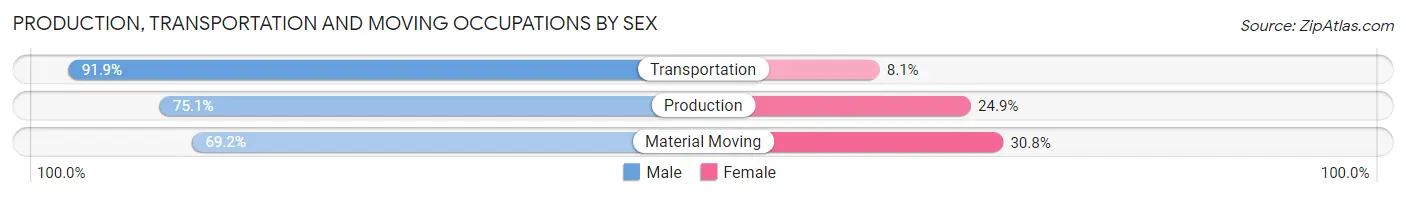
| Occupation | Male | Female |
| Production | 646 (75.1%) | 214 (24.9%) |
| Transportation | 576 (91.9%) | 51 (8.1%) |
| Material Moving | 274 (69.2%) | 122 (30.8%) |
| Total (Category) | 1,496 (79.4%) | 387 (20.5%) |
| Total (Overall) | 6,269 (52.5%) | 5,664 (47.5%) |
Employment Industries by Sex in Acworth
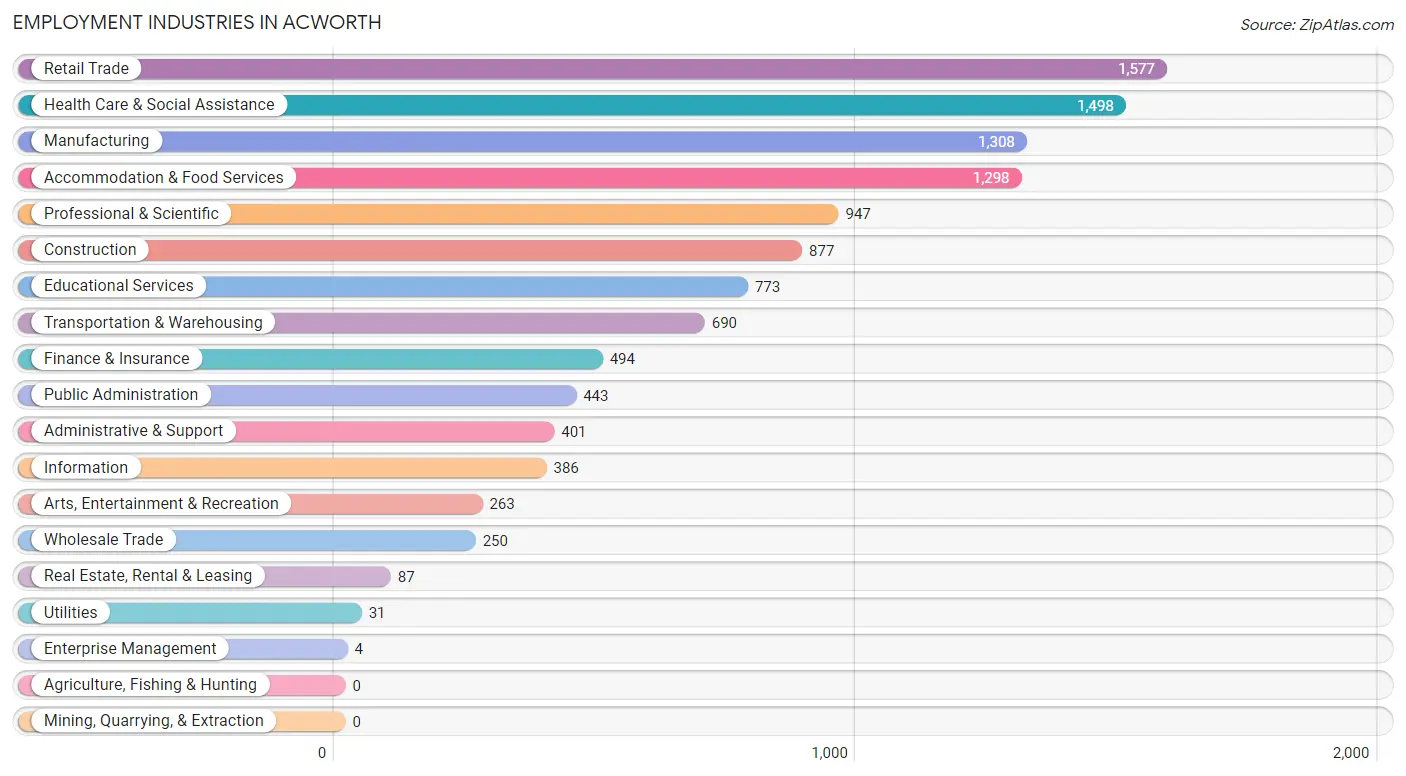
Employment Industries in Acworth
The major employment industries in Acworth include Retail Trade (1,577 | 13.2%), Health Care & Social Assistance (1,498 | 12.6%), Manufacturing (1,308 | 11.0%), Accommodation & Food Services (1,298 | 10.9%), and Professional & Scientific (947 | 7.9%).
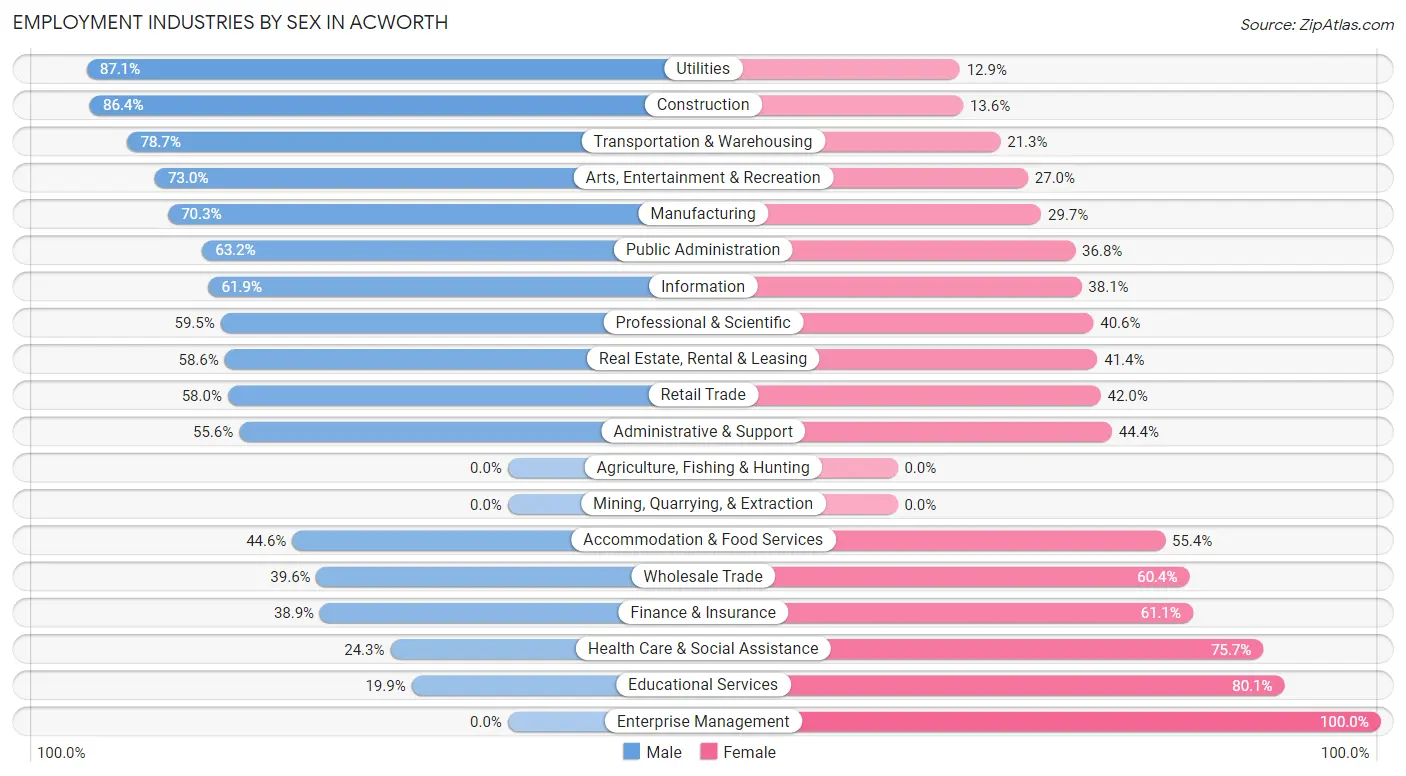
Employment Industries by Sex in Acworth
The Acworth industries that see more men than women are Utilities (87.1%), Construction (86.4%), and Transportation & Warehousing (78.7%), whereas the industries that tend to have a higher number of women are Enterprise Management (100.0%), Educational Services (80.1%), and Health Care & Social Assistance (75.7%).
| Industry | Male | Female |
| Agriculture, Fishing & Hunting | 0 (0.0%) | 0 (0.0%) |
| Mining, Quarrying, & Extraction | 0 (0.0%) | 0 (0.0%) |
| Construction | 758 (86.4%) | 119 (13.6%) |
| Manufacturing | 919 (70.3%) | 389 (29.7%) |
| Wholesale Trade | 99 (39.6%) | 151 (60.4%) |
| Retail Trade | 914 (58.0%) | 663 (42.0%) |
| Transportation & Warehousing | 543 (78.7%) | 147 (21.3%) |
| Utilities | 27 (87.1%) | 4 (12.9%) |
| Information | 239 (61.9%) | 147 (38.1%) |
| Finance & Insurance | 192 (38.9%) | 302 (61.1%) |
| Real Estate, Rental & Leasing | 51 (58.6%) | 36 (41.4%) |
| Professional & Scientific | 563 (59.5%) | 384 (40.6%) |
| Enterprise Management | 0 (0.0%) | 4 (100.0%) |
| Administrative & Support | 223 (55.6%) | 178 (44.4%) |
| Educational Services | 154 (19.9%) | 619 (80.1%) |
| Health Care & Social Assistance | 364 (24.3%) | 1,134 (75.7%) |
| Arts, Entertainment & Recreation | 192 (73.0%) | 71 (27.0%) |
| Accommodation & Food Services | 579 (44.6%) | 719 (55.4%) |
| Public Administration | 280 (63.2%) | 163 (36.8%) |
| Total | 6,269 (52.5%) | 5,664 (47.5%) |
Education in Acworth
School Enrollment in Acworth
The most common levels of schooling among the 6,362 students in Acworth are high school (1,975 | 31.0%), elementary school (1,643 | 25.8%), and college / undergraduate (1,017 | 16.0%).
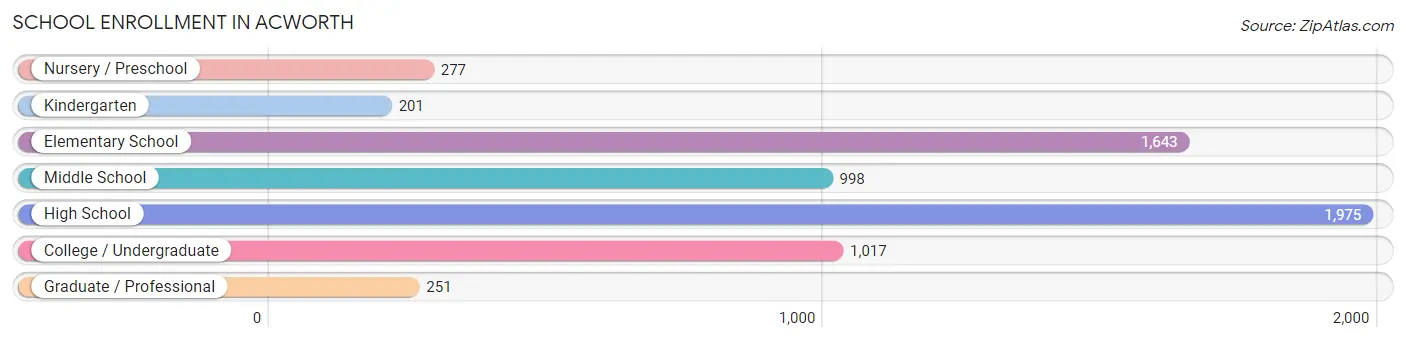
| School Level | # Students | % Students |
| Nursery / Preschool | 277 | 4.3% |
| Kindergarten | 201 | 3.2% |
| Elementary School | 1,643 | 25.8% |
| Middle School | 998 | 15.7% |
| High School | 1,975 | 31.0% |
| College / Undergraduate | 1,017 | 16.0% |
| Graduate / Professional | 251 | 4.0% |
| Total | 6,362 | 100.0% |
School Enrollment by Age by Funding Source in Acworth
Out of a total of 6,362 students who are enrolled in schools in Acworth, 674 (10.6%) attend a private institution, while the remaining 5,688 (89.4%) are enrolled in public schools. The age group of 3 to 4 year olds has the highest likelihood of being enrolled in private schools, with 166 (63.8% in the age bracket) enrolled. Conversely, the age group of 15 to 17 year olds has the lowest likelihood of being enrolled in a private school, with 1,468 (97.8% in the age bracket) attending a public institution.
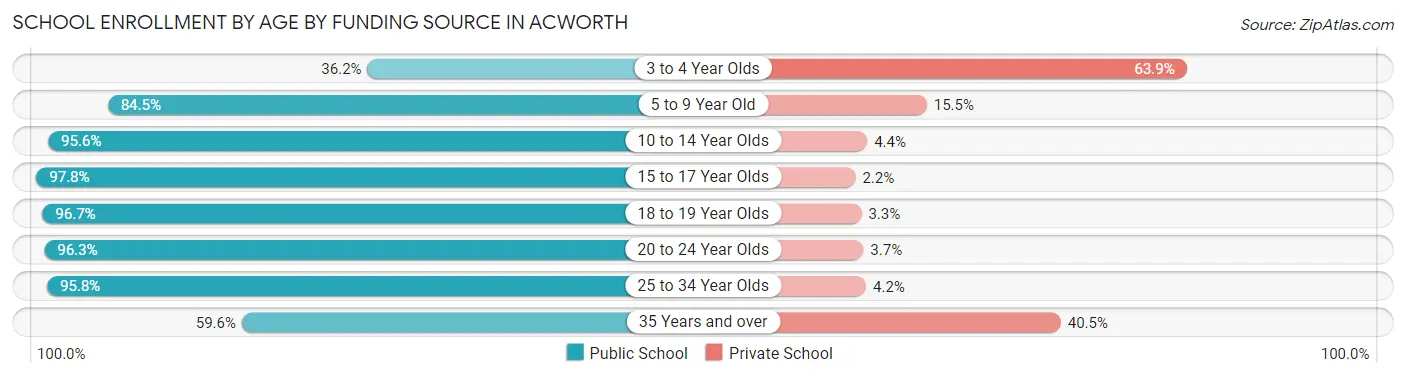
| Age Bracket | Public School | Private School |
| 3 to 4 Year Olds | 94 (36.1%) | 166 (63.8%) |
| 5 to 9 Year Old | 1,386 (84.5%) | 254 (15.5%) |
| 10 to 14 Year Olds | 1,545 (95.6%) | 71 (4.4%) |
| 15 to 17 Year Olds | 1,468 (97.8%) | 33 (2.2%) |
| 18 to 19 Year Olds | 291 (96.7%) | 10 (3.3%) |
| 20 to 24 Year Olds | 471 (96.3%) | 18 (3.7%) |
| 25 to 34 Year Olds | 276 (95.8%) | 12 (4.2%) |
| 35 Years and over | 159 (59.6%) | 108 (40.5%) |
| Total | 5,688 (89.4%) | 674 (10.6%) |
Educational Attainment by Field of Study in Acworth
Business (1,165 | 23.2%), education (680 | 13.5%), social sciences (430 | 8.6%), science & technology (379 | 7.5%), and arts & humanities (346 | 6.9%) are the most common fields of study among 5,026 individuals in Acworth who have obtained a bachelor's degree or higher.
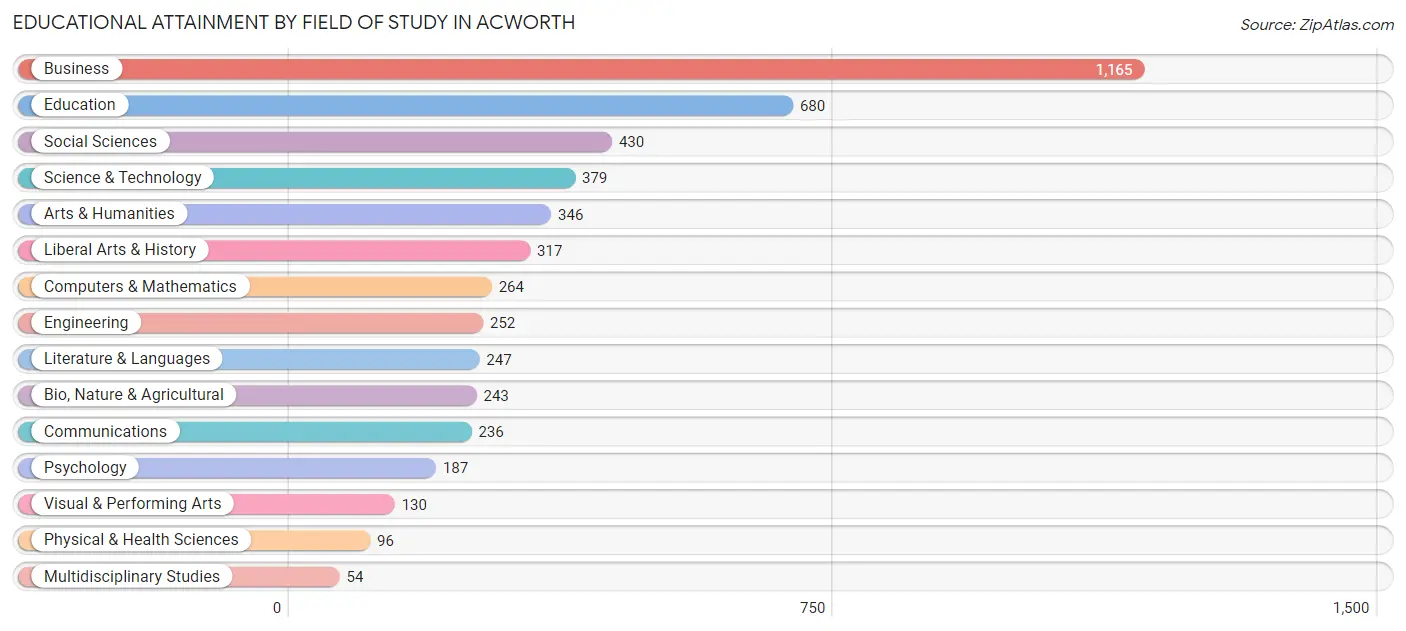
| Field of Study | # Graduates | % Graduates |
| Computers & Mathematics | 264 | 5.2% |
| Bio, Nature & Agricultural | 243 | 4.8% |
| Physical & Health Sciences | 96 | 1.9% |
| Psychology | 187 | 3.7% |
| Social Sciences | 430 | 8.6% |
| Engineering | 252 | 5.0% |
| Multidisciplinary Studies | 54 | 1.1% |
| Science & Technology | 379 | 7.5% |
| Business | 1,165 | 23.2% |
| Education | 680 | 13.5% |
| Literature & Languages | 247 | 4.9% |
| Liberal Arts & History | 317 | 6.3% |
| Visual & Performing Arts | 130 | 2.6% |
| Communications | 236 | 4.7% |
| Arts & Humanities | 346 | 6.9% |
| Total | 5,026 | 100.0% |
Transportation & Commute in Acworth
Vehicle Availability by Sex in Acworth
The most prevalent vehicle ownership categories in Acworth are males with 2 vehicles (2,796, accounting for 44.8%) and females with 2 vehicles (2,759, making up 50.7%).
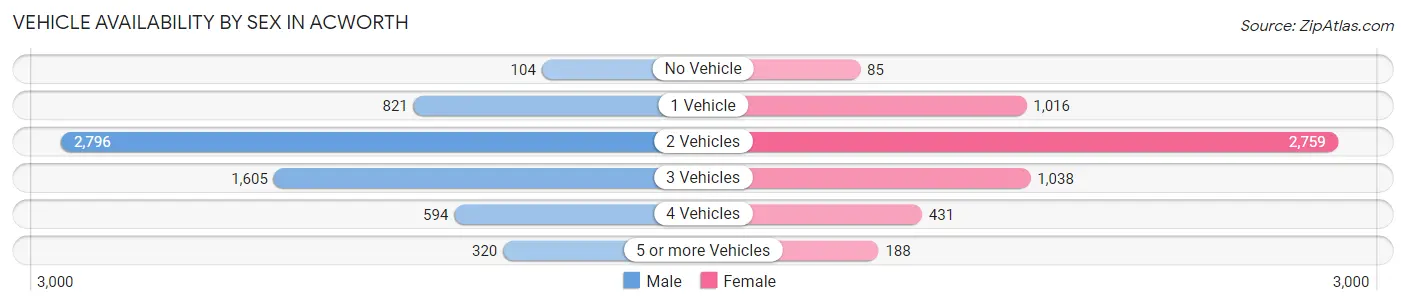
| Vehicles Available | Male | Female |
| No Vehicle | 104 (1.7%) | 85 (1.5%) |
| 1 Vehicle | 821 (13.2%) | 1,016 (18.4%) |
| 2 Vehicles | 2,796 (44.8%) | 2,759 (50.0%) |
| 3 Vehicles | 1,605 (25.7%) | 1,038 (18.8%) |
| 4 Vehicles | 594 (9.5%) | 431 (7.8%) |
| 5 or more Vehicles | 320 (5.1%) | 188 (3.4%) |
| Total | 6,240 (100.0%) | 5,517 (100.0%) |
Commute Time in Acworth
The most frequently occuring commute durations in Acworth are 45 to 59 minutes (1,756 commuters, 16.6%), 30 to 34 minutes (1,738 commuters, 16.5%), and 20 to 24 minutes (1,680 commuters, 15.9%).
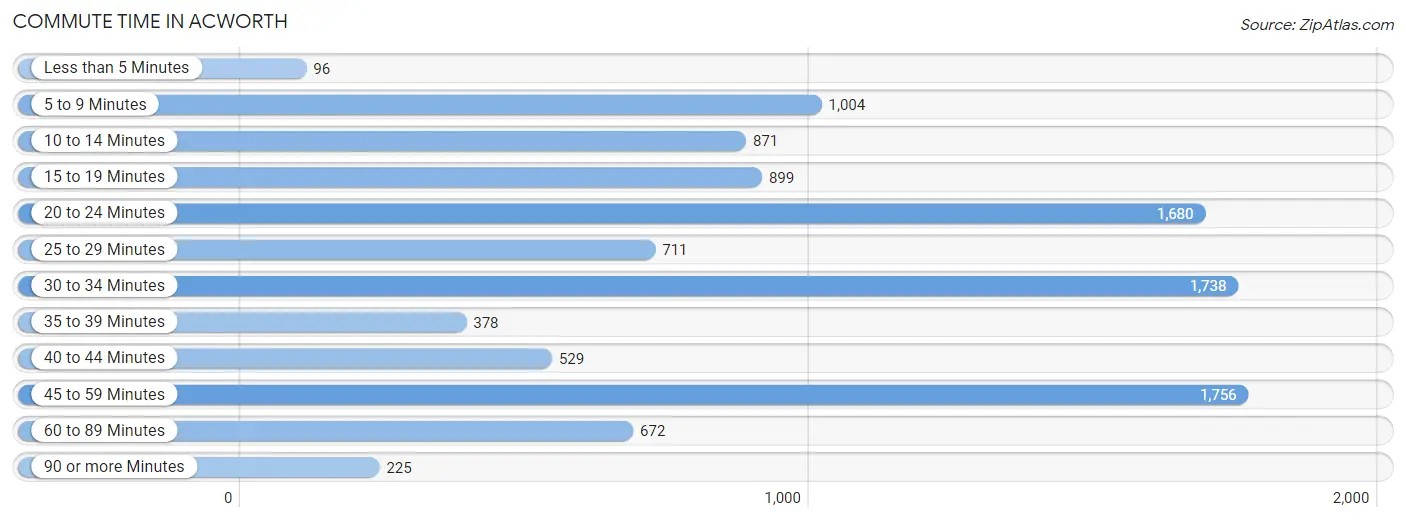
| Commute Time | # Commuters | % Commuters |
| Less than 5 Minutes | 96 | 0.9% |
| 5 to 9 Minutes | 1,004 | 9.5% |
| 10 to 14 Minutes | 871 | 8.3% |
| 15 to 19 Minutes | 899 | 8.5% |
| 20 to 24 Minutes | 1,680 | 15.9% |
| 25 to 29 Minutes | 711 | 6.7% |
| 30 to 34 Minutes | 1,738 | 16.5% |
| 35 to 39 Minutes | 378 | 3.6% |
| 40 to 44 Minutes | 529 | 5.0% |
| 45 to 59 Minutes | 1,756 | 16.6% |
| 60 to 89 Minutes | 672 | 6.4% |
| 90 or more Minutes | 225 | 2.1% |
Commute Time by Sex in Acworth
The most common commute times in Acworth are 45 to 59 minutes (1,004 commuters, 18.3%) for males and 30 to 34 minutes (919 commuters, 18.1%) for females.
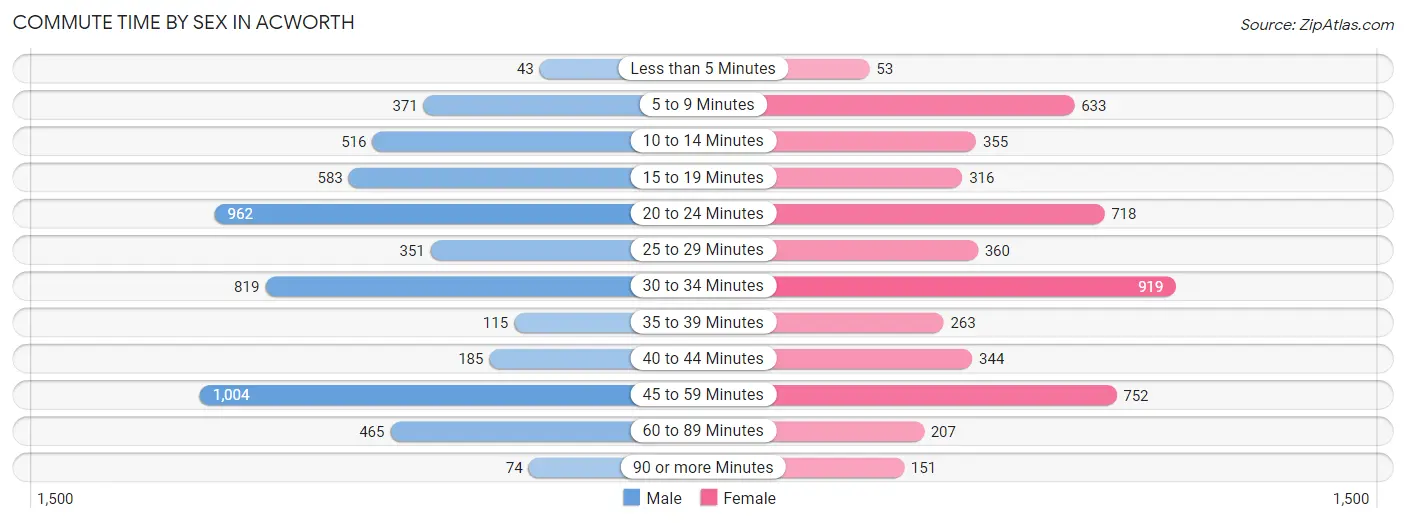
| Commute Time | Male | Female |
| Less than 5 Minutes | 43 (0.8%) | 53 (1.1%) |
| 5 to 9 Minutes | 371 (6.8%) | 633 (12.5%) |
| 10 to 14 Minutes | 516 (9.4%) | 355 (7.0%) |
| 15 to 19 Minutes | 583 (10.6%) | 316 (6.2%) |
| 20 to 24 Minutes | 962 (17.5%) | 718 (14.2%) |
| 25 to 29 Minutes | 351 (6.4%) | 360 (7.1%) |
| 30 to 34 Minutes | 819 (14.9%) | 919 (18.1%) |
| 35 to 39 Minutes | 115 (2.1%) | 263 (5.2%) |
| 40 to 44 Minutes | 185 (3.4%) | 344 (6.8%) |
| 45 to 59 Minutes | 1,004 (18.3%) | 752 (14.8%) |
| 60 to 89 Minutes | 465 (8.5%) | 207 (4.1%) |
| 90 or more Minutes | 74 (1.3%) | 151 (3.0%) |
Time of Departure to Work by Sex in Acworth
The most frequent times of departure to work in Acworth are 7:00 AM to 7:29 AM (1,063, 19.4%) for males and 7:00 AM to 7:29 AM (989, 19.5%) for females.
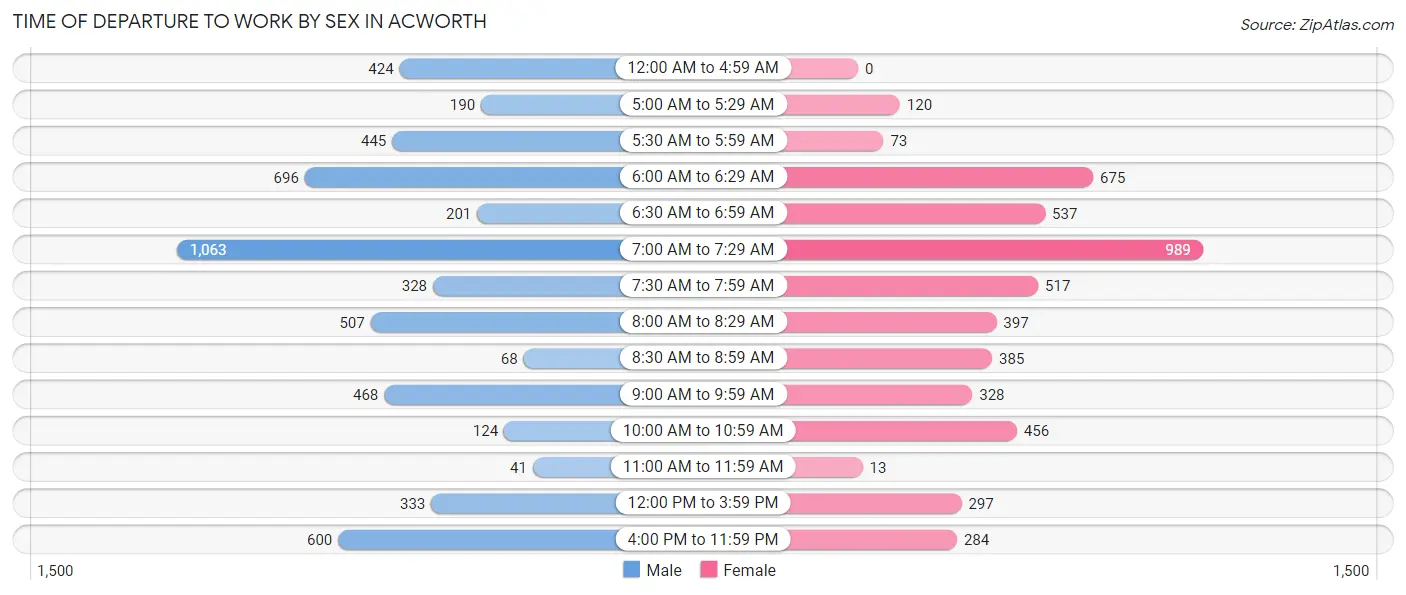
| Time of Departure | Male | Female |
| 12:00 AM to 4:59 AM | 424 (7.7%) | 0 (0.0%) |
| 5:00 AM to 5:29 AM | 190 (3.5%) | 120 (2.4%) |
| 5:30 AM to 5:59 AM | 445 (8.1%) | 73 (1.4%) |
| 6:00 AM to 6:29 AM | 696 (12.7%) | 675 (13.3%) |
| 6:30 AM to 6:59 AM | 201 (3.7%) | 537 (10.6%) |
| 7:00 AM to 7:29 AM | 1,063 (19.4%) | 989 (19.5%) |
| 7:30 AM to 7:59 AM | 328 (6.0%) | 517 (10.2%) |
| 8:00 AM to 8:29 AM | 507 (9.2%) | 397 (7.8%) |
| 8:30 AM to 8:59 AM | 68 (1.2%) | 385 (7.6%) |
| 9:00 AM to 9:59 AM | 468 (8.5%) | 328 (6.5%) |
| 10:00 AM to 10:59 AM | 124 (2.3%) | 456 (9.0%) |
| 11:00 AM to 11:59 AM | 41 (0.7%) | 13 (0.3%) |
| 12:00 PM to 3:59 PM | 333 (6.1%) | 297 (5.9%) |
| 4:00 PM to 11:59 PM | 600 (10.9%) | 284 (5.6%) |
| Total | 5,488 (100.0%) | 5,071 (100.0%) |
Housing Occupancy in Acworth
Occupancy by Ownership in Acworth
Of the total 8,260 dwellings in Acworth, owner-occupied units account for 5,142 (62.3%), while renter-occupied units make up 3,118 (37.8%).
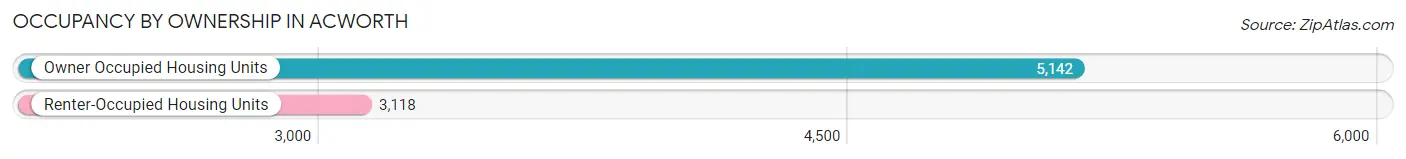
| Occupancy | # Housing Units | % Housing Units |
| Owner Occupied Housing Units | 5,142 | 62.3% |
| Renter-Occupied Housing Units | 3,118 | 37.8% |
| Total Occupied Housing Units | 8,260 | 100.0% |
Occupancy by Household Size in Acworth
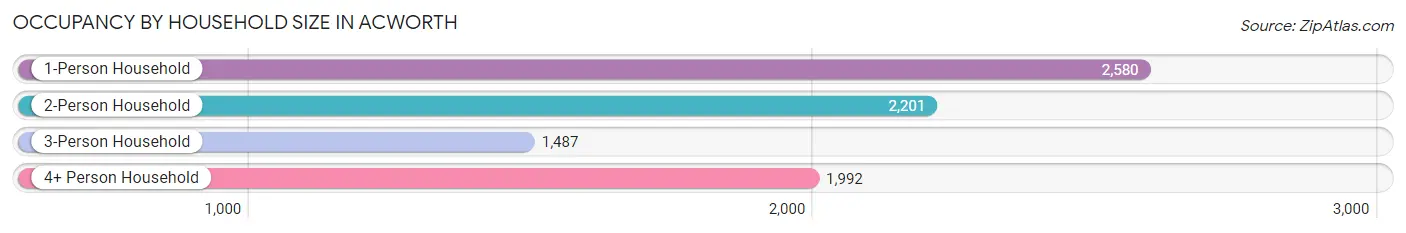
| Household Size | # Housing Units | % Housing Units |
| 1-Person Household | 2,580 | 31.2% |
| 2-Person Household | 2,201 | 26.7% |
| 3-Person Household | 1,487 | 18.0% |
| 4+ Person Household | 1,992 | 24.1% |
| Total Housing Units | 8,260 | 100.0% |
Occupancy by Ownership by Household Size in Acworth
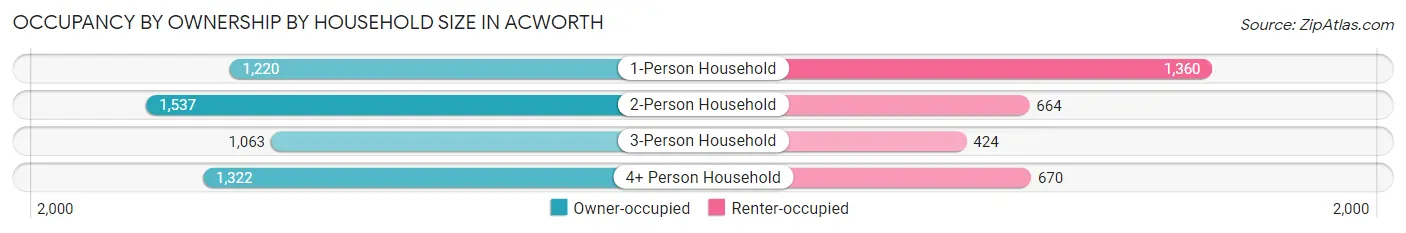
| Household Size | Owner-occupied | Renter-occupied |
| 1-Person Household | 1,220 (47.3%) | 1,360 (52.7%) |
| 2-Person Household | 1,537 (69.8%) | 664 (30.2%) |
| 3-Person Household | 1,063 (71.5%) | 424 (28.5%) |
| 4+ Person Household | 1,322 (66.4%) | 670 (33.6%) |
| Total Housing Units | 5,142 (62.3%) | 3,118 (37.8%) |
Occupancy by Educational Attainment in Acworth
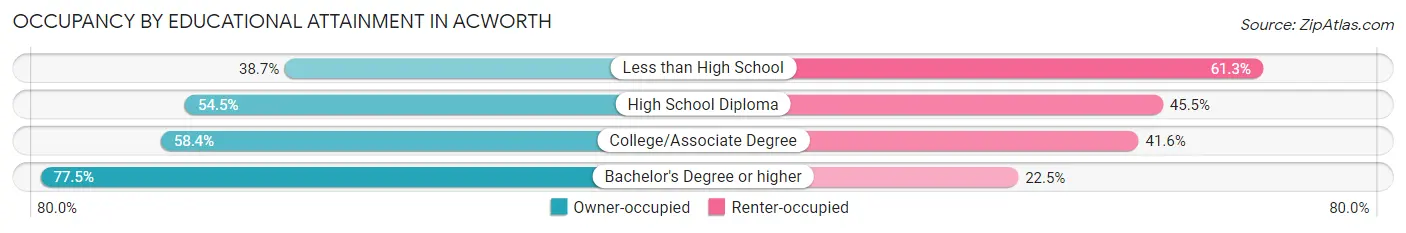
| Household Size | Owner-occupied | Renter-occupied |
| Less than High School | 272 (38.7%) | 431 (61.3%) |
| High School Diploma | 999 (54.5%) | 833 (45.5%) |
| College/Associate Degree | 1,725 (58.4%) | 1,230 (41.6%) |
| Bachelor's Degree or higher | 2,146 (77.5%) | 624 (22.5%) |
Occupancy by Age of Householder in Acworth
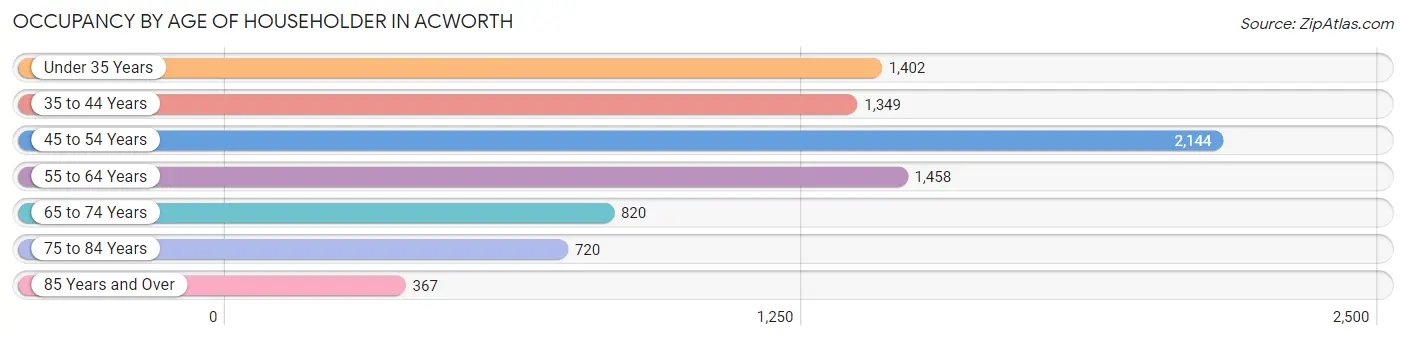
| Age Bracket | # Households | % Households |
| Under 35 Years | 1,402 | 17.0% |
| 35 to 44 Years | 1,349 | 16.3% |
| 45 to 54 Years | 2,144 | 26.0% |
| 55 to 64 Years | 1,458 | 17.6% |
| 65 to 74 Years | 820 | 9.9% |
| 75 to 84 Years | 720 | 8.7% |
| 85 Years and Over | 367 | 4.4% |
| Total | 8,260 | 100.0% |
Housing Finances in Acworth
Median Income by Occupancy in Acworth
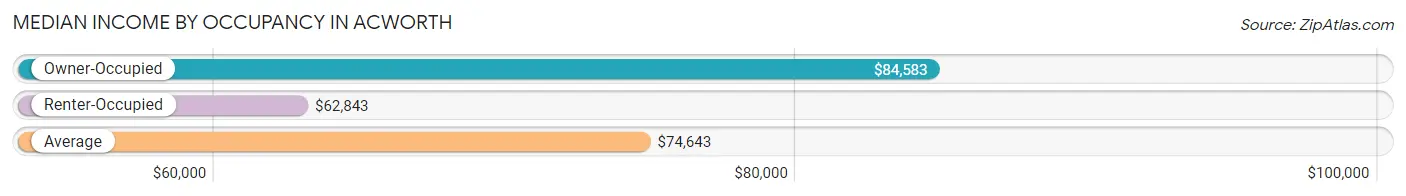
| Occupancy Type | # Households | Median Income |
| Owner-Occupied | 5,142 (62.3%) | $84,583 |
| Renter-Occupied | 3,118 (37.8%) | $62,843 |
| Average | 8,260 (100.0%) | $74,643 |
Occupancy by Householder Income Bracket in Acworth
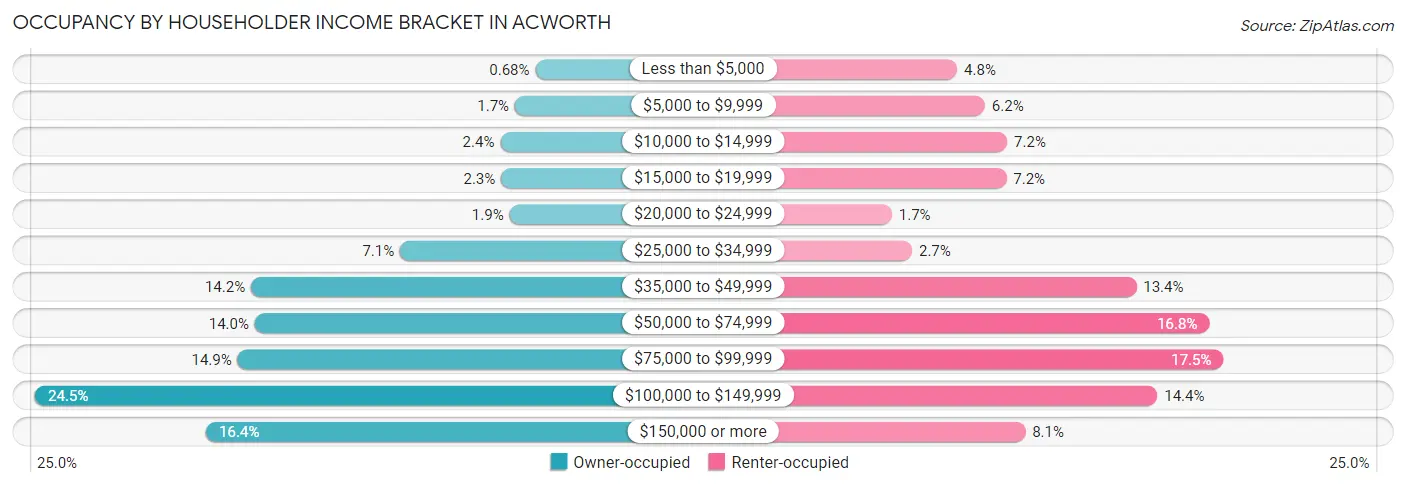
| Income Bracket | Owner-occupied | Renter-occupied |
| Less than $5,000 | 35 (0.7%) | 151 (4.8%) |
| $5,000 to $9,999 | 85 (1.7%) | 192 (6.2%) |
| $10,000 to $14,999 | 121 (2.4%) | 225 (7.2%) |
| $15,000 to $19,999 | 119 (2.3%) | 224 (7.2%) |
| $20,000 to $24,999 | 98 (1.9%) | 54 (1.7%) |
| $25,000 to $34,999 | 366 (7.1%) | 84 (2.7%) |
| $35,000 to $49,999 | 731 (14.2%) | 417 (13.4%) |
| $50,000 to $74,999 | 722 (14.0%) | 525 (16.8%) |
| $75,000 to $99,999 | 764 (14.9%) | 546 (17.5%) |
| $100,000 to $149,999 | 1,260 (24.5%) | 448 (14.4%) |
| $150,000 or more | 841 (16.4%) | 252 (8.1%) |
| Total | 5,142 (100.0%) | 3,118 (100.0%) |
Monthly Housing Cost Tiers in Acworth
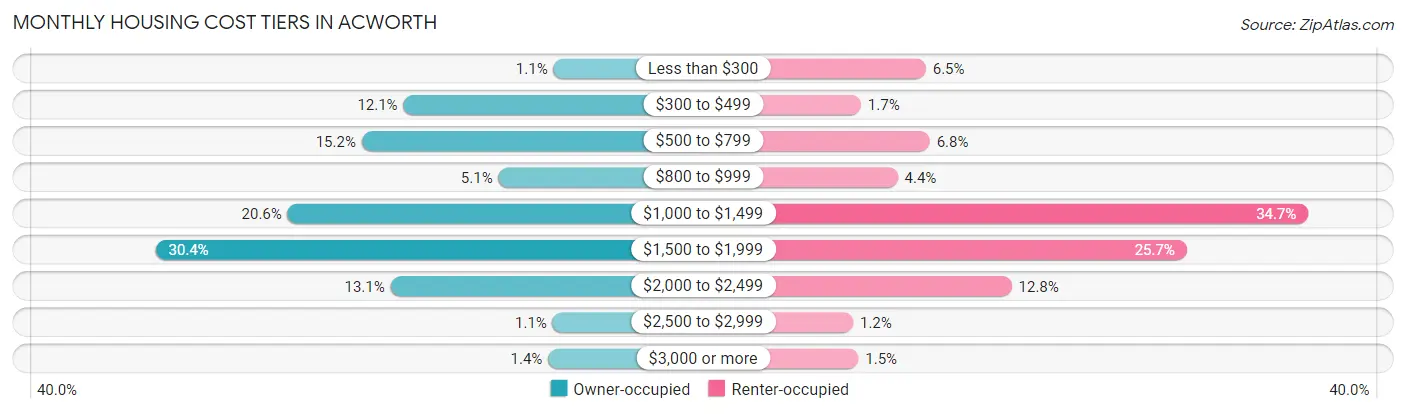
| Monthly Cost | Owner-occupied | Renter-occupied |
| Less than $300 | 54 (1.1%) | 203 (6.5%) |
| $300 to $499 | 622 (12.1%) | 54 (1.7%) |
| $500 to $799 | 780 (15.2%) | 212 (6.8%) |
| $800 to $999 | 262 (5.1%) | 138 (4.4%) |
| $1,000 to $1,499 | 1,061 (20.6%) | 1,081 (34.7%) |
| $1,500 to $1,999 | 1,561 (30.4%) | 802 (25.7%) |
| $2,000 to $2,499 | 671 (13.1%) | 400 (12.8%) |
| $2,500 to $2,999 | 57 (1.1%) | 36 (1.1%) |
| $3,000 or more | 74 (1.4%) | 48 (1.5%) |
| Total | 5,142 (100.0%) | 3,118 (100.0%) |
Physical Housing Characteristics in Acworth
Housing Structures in Acworth
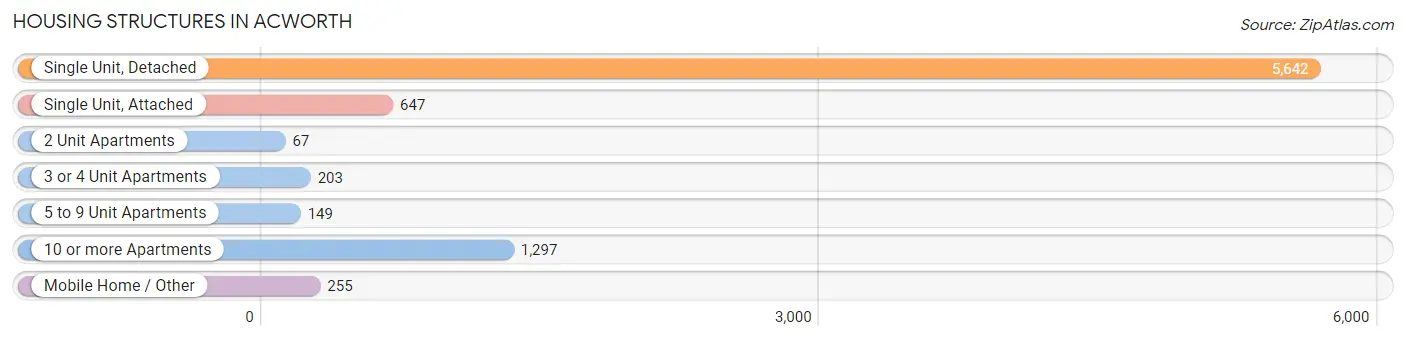
| Structure Type | # Housing Units | % Housing Units |
| Single Unit, Detached | 5,642 | 68.3% |
| Single Unit, Attached | 647 | 7.8% |
| 2 Unit Apartments | 67 | 0.8% |
| 3 or 4 Unit Apartments | 203 | 2.5% |
| 5 to 9 Unit Apartments | 149 | 1.8% |
| 10 or more Apartments | 1,297 | 15.7% |
| Mobile Home / Other | 255 | 3.1% |
| Total | 8,260 | 100.0% |
Housing Structures by Occupancy in Acworth
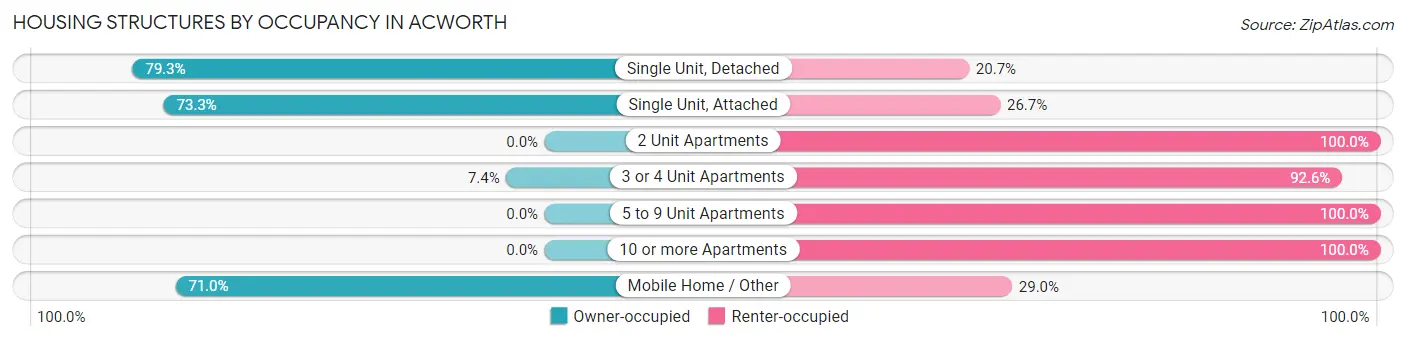
| Structure Type | Owner-occupied | Renter-occupied |
| Single Unit, Detached | 4,472 (79.3%) | 1,170 (20.7%) |
| Single Unit, Attached | 474 (73.3%) | 173 (26.7%) |
| 2 Unit Apartments | 0 (0.0%) | 67 (100.0%) |
| 3 or 4 Unit Apartments | 15 (7.4%) | 188 (92.6%) |
| 5 to 9 Unit Apartments | 0 (0.0%) | 149 (100.0%) |
| 10 or more Apartments | 0 (0.0%) | 1,297 (100.0%) |
| Mobile Home / Other | 181 (71.0%) | 74 (29.0%) |
| Total | 5,142 (62.3%) | 3,118 (37.8%) |
Housing Structures by Number of Rooms in Acworth
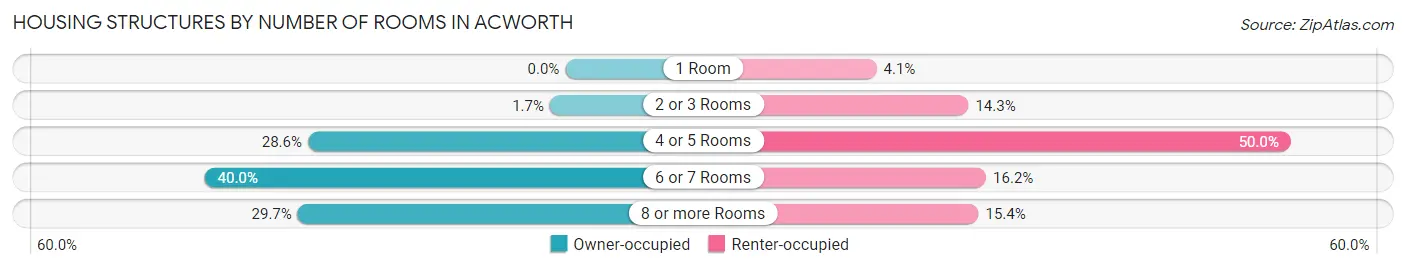
| Number of Rooms | Owner-occupied | Renter-occupied |
| 1 Room | 0 (0.0%) | 127 (4.1%) |
| 2 or 3 Rooms | 88 (1.7%) | 445 (14.3%) |
| 4 or 5 Rooms | 1,469 (28.6%) | 1,560 (50.0%) |
| 6 or 7 Rooms | 2,058 (40.0%) | 506 (16.2%) |
| 8 or more Rooms | 1,527 (29.7%) | 480 (15.4%) |
| Total | 5,142 (100.0%) | 3,118 (100.0%) |
Housing Structure by Heating Type in Acworth
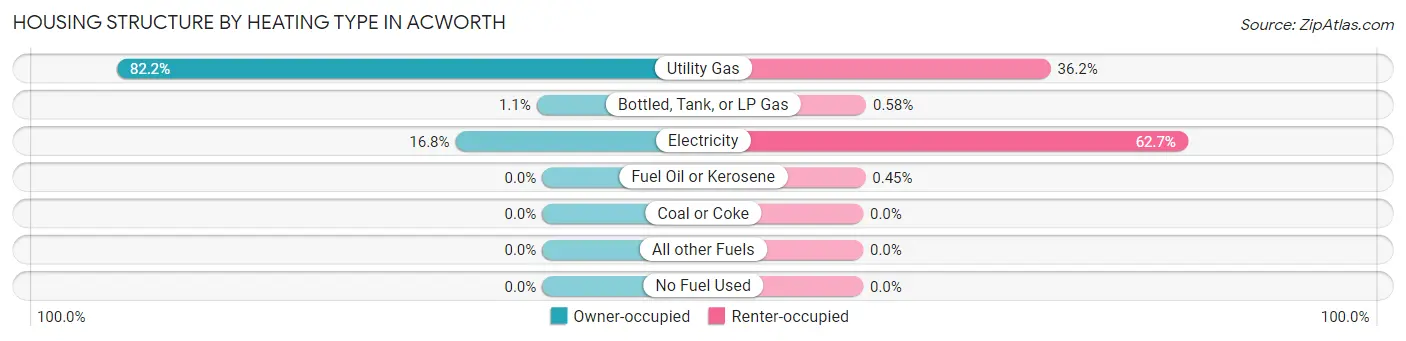
| Heating Type | Owner-occupied | Renter-occupied |
| Utility Gas | 4,225 (82.2%) | 1,130 (36.2%) |
| Bottled, Tank, or LP Gas | 55 (1.1%) | 18 (0.6%) |
| Electricity | 862 (16.8%) | 1,956 (62.7%) |
| Fuel Oil or Kerosene | 0 (0.0%) | 14 (0.4%) |
| Coal or Coke | 0 (0.0%) | 0 (0.0%) |
| All other Fuels | 0 (0.0%) | 0 (0.0%) |
| No Fuel Used | 0 (0.0%) | 0 (0.0%) |
| Total | 5,142 (100.0%) | 3,118 (100.0%) |
Household Vehicle Usage in Acworth
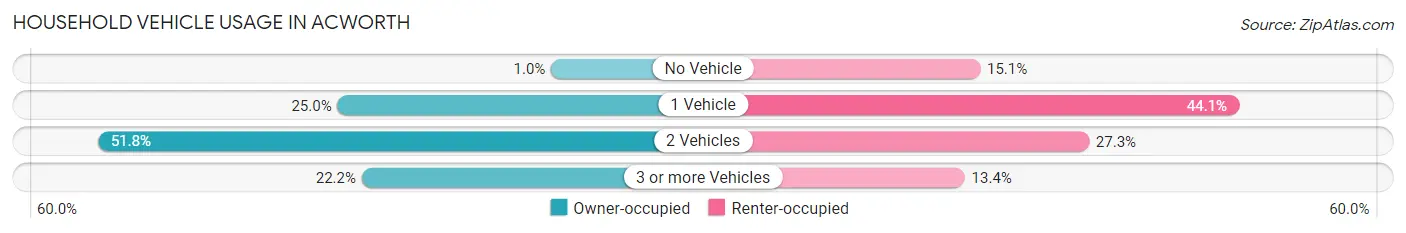
| Vehicles per Household | Owner-occupied | Renter-occupied |
| No Vehicle | 52 (1.0%) | 472 (15.1%) |
| 1 Vehicle | 1,283 (24.9%) | 1,376 (44.1%) |
| 2 Vehicles | 2,664 (51.8%) | 852 (27.3%) |
| 3 or more Vehicles | 1,143 (22.2%) | 418 (13.4%) |
| Total | 5,142 (100.0%) | 3,118 (100.0%) |
Real Estate & Mortgages in Acworth
Real Estate and Mortgage Overview in Acworth
| Characteristic | Without Mortgage | With Mortgage |
| Housing Units | 1,427 | 3,715 |
| Median Property Value | $260,800 | $273,700 |
| Median Household Income | $88,727 | $575 |
| Monthly Housing Costs | $517 | $74 |
| Real Estate Taxes | $2,002 | $49 |
Property Value by Mortgage Status in Acworth
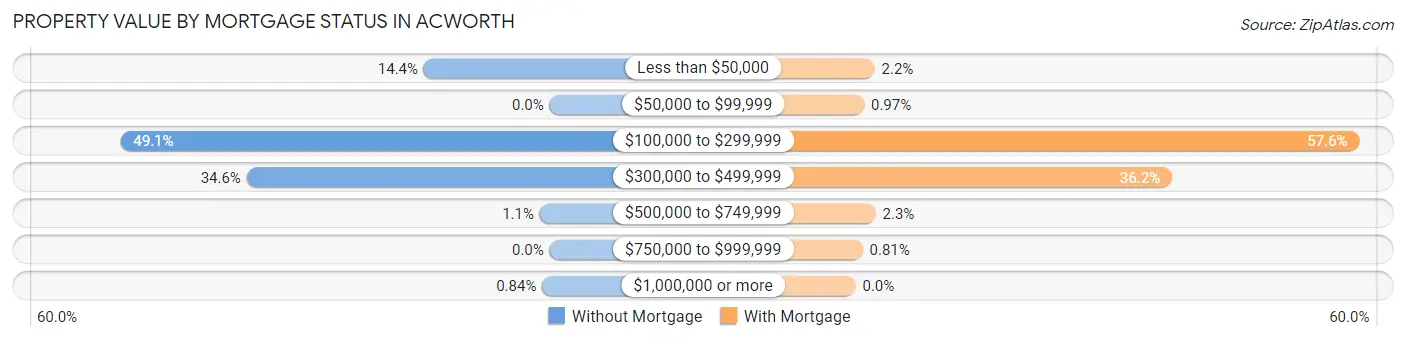
| Property Value | Without Mortgage | With Mortgage |
| Less than $50,000 | 205 (14.4%) | 81 (2.2%) |
| $50,000 to $99,999 | 0 (0.0%) | 36 (1.0%) |
| $100,000 to $299,999 | 700 (49.0%) | 2,139 (57.6%) |
| $300,000 to $499,999 | 494 (34.6%) | 1,344 (36.2%) |
| $500,000 to $749,999 | 16 (1.1%) | 85 (2.3%) |
| $750,000 to $999,999 | 0 (0.0%) | 30 (0.8%) |
| $1,000,000 or more | 12 (0.8%) | 0 (0.0%) |
| Total | 1,427 (100.0%) | 3,715 (100.0%) |
Household Income by Mortgage Status in Acworth
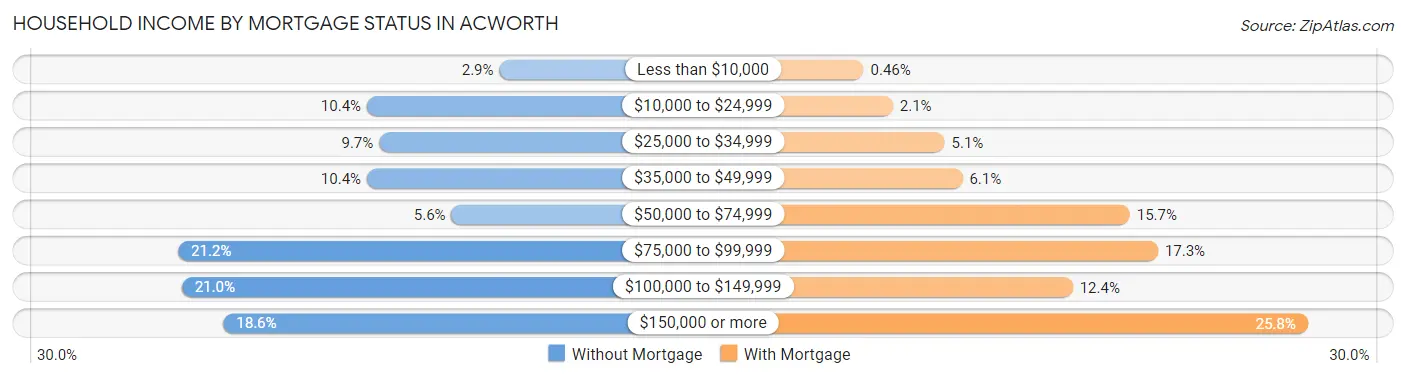
| Household Income | Without Mortgage | With Mortgage |
| Less than $10,000 | 41 (2.9%) | 17 (0.5%) |
| $10,000 to $24,999 | 149 (10.4%) | 79 (2.1%) |
| $25,000 to $34,999 | 139 (9.7%) | 189 (5.1%) |
| $35,000 to $49,999 | 149 (10.4%) | 227 (6.1%) |
| $50,000 to $74,999 | 80 (5.6%) | 582 (15.7%) |
| $75,000 to $99,999 | 303 (21.2%) | 642 (17.3%) |
| $100,000 to $149,999 | 300 (21.0%) | 461 (12.4%) |
| $150,000 or more | 266 (18.6%) | 960 (25.8%) |
| Total | 1,427 (100.0%) | 3,715 (100.0%) |
Property Value to Household Income Ratio in Acworth
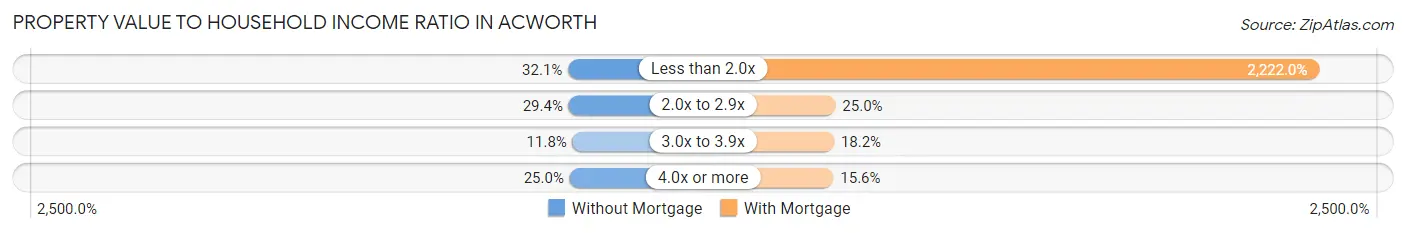
| Value-to-Income Ratio | Without Mortgage | With Mortgage |
| Less than 2.0x | 458 (32.1%) | 82,548 (2,222.0%) |
| 2.0x to 2.9x | 420 (29.4%) | 928 (25.0%) |
| 3.0x to 3.9x | 168 (11.8%) | 677 (18.2%) |
| 4.0x or more | 356 (24.9%) | 581 (15.6%) |
| Total | 1,427 (100.0%) | 3,715 (100.0%) |
Real Estate Taxes by Mortgage Status in Acworth
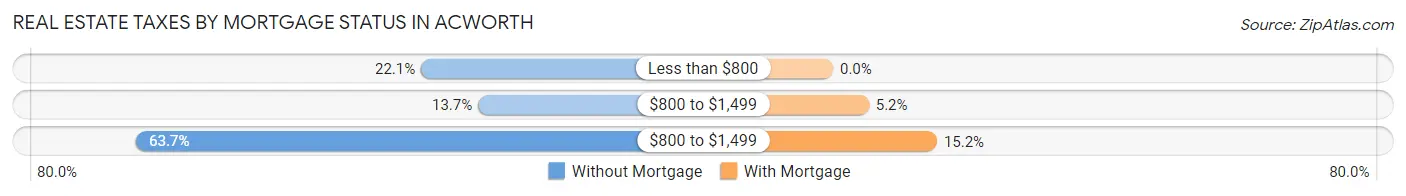
| Property Taxes | Without Mortgage | With Mortgage |
| Less than $800 | 315 (22.1%) | 0 (0.0%) |
| $800 to $1,499 | 196 (13.7%) | 194 (5.2%) |
| $800 to $1,499 | 909 (63.7%) | 564 (15.2%) |
| Total | 1,427 (100.0%) | 3,715 (100.0%) |
Health & Disability in Acworth
Health Insurance Coverage by Age in Acworth
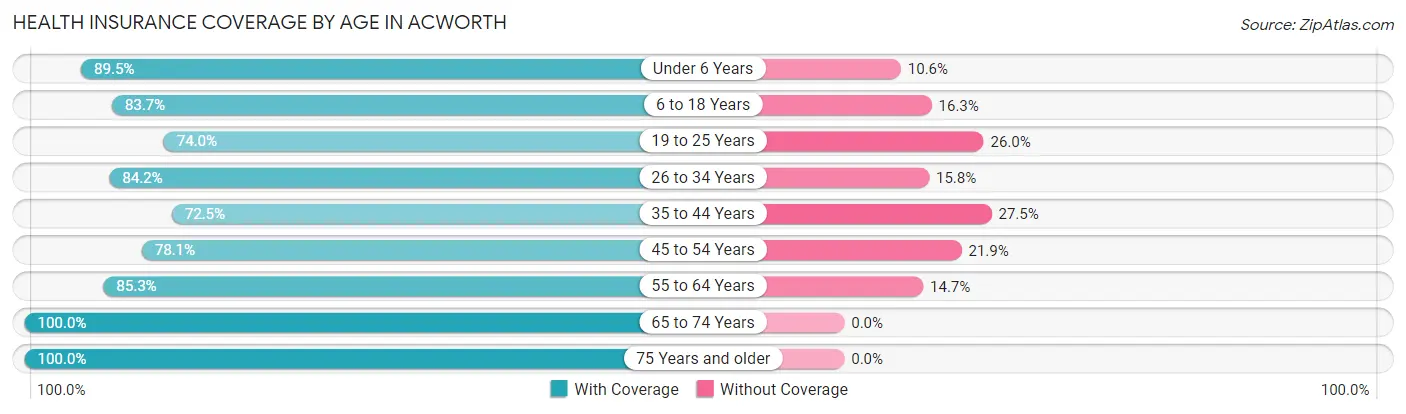
| Age Bracket | With Coverage | Without Coverage |
| Under 6 Years | 1,119 (89.4%) | 132 (10.5%) |
| 6 to 18 Years | 4,195 (83.7%) | 816 (16.3%) |
| 19 to 25 Years | 1,417 (74.0%) | 497 (26.0%) |
| 26 to 34 Years | 2,002 (84.2%) | 376 (15.8%) |
| 35 to 44 Years | 1,973 (72.5%) | 747 (27.5%) |
| 45 to 54 Years | 3,064 (78.1%) | 857 (21.9%) |
| 55 to 64 Years | 2,135 (85.3%) | 368 (14.7%) |
| 65 to 74 Years | 1,224 (100.0%) | 0 (0.0%) |
| 75 Years and older | 1,360 (100.0%) | 0 (0.0%) |
| Total | 18,489 (83.0%) | 3,793 (17.0%) |
Health Insurance Coverage by Citizenship Status in Acworth
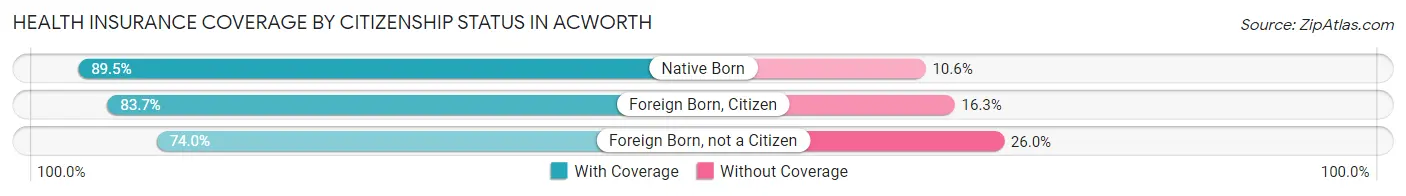
| Citizenship Status | With Coverage | Without Coverage |
| Native Born | 1,119 (89.4%) | 132 (10.5%) |
| Foreign Born, Citizen | 4,195 (83.7%) | 816 (16.3%) |
| Foreign Born, not a Citizen | 1,417 (74.0%) | 497 (26.0%) |
Health Insurance Coverage by Household Income in Acworth
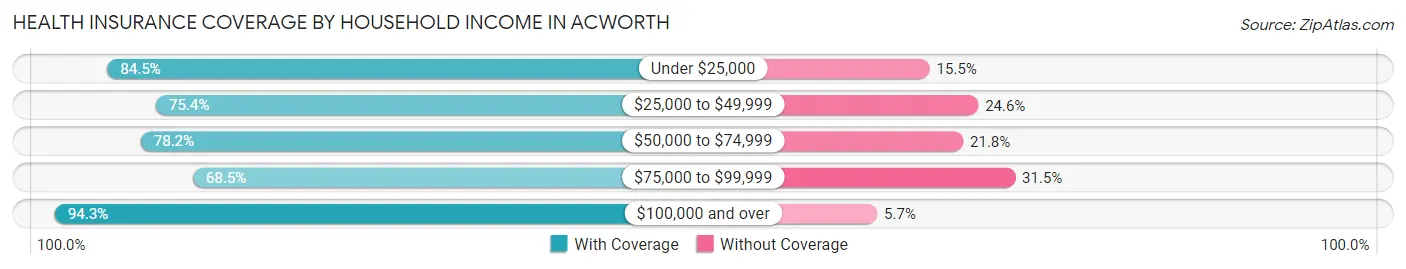
| Household Income | With Coverage | Without Coverage |
| Under $25,000 | 1,589 (84.5%) | 292 (15.5%) |
| $25,000 to $49,999 | 3,034 (75.4%) | 991 (24.6%) |
| $50,000 to $74,999 | 2,624 (78.2%) | 731 (21.8%) |
| $75,000 to $99,999 | 2,750 (68.5%) | 1,267 (31.5%) |
| $100,000 and over | 8,492 (94.3%) | 512 (5.7%) |
Public vs Private Health Insurance Coverage by Age in Acworth
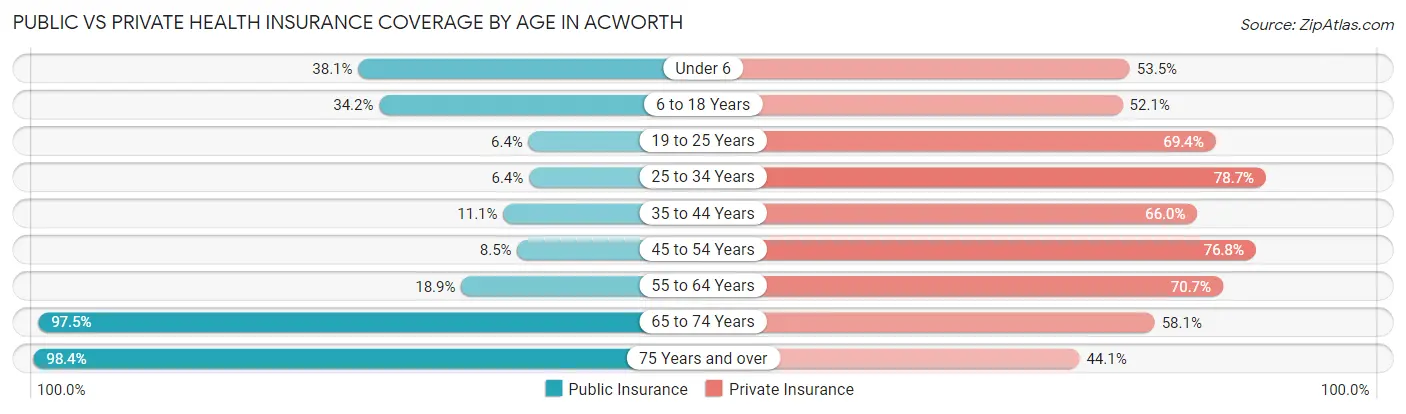
| Age Bracket | Public Insurance | Private Insurance |
| Under 6 | 476 (38.1%) | 669 (53.5%) |
| 6 to 18 Years | 1,712 (34.2%) | 2,612 (52.1%) |
| 19 to 25 Years | 123 (6.4%) | 1,328 (69.4%) |
| 25 to 34 Years | 151 (6.4%) | 1,872 (78.7%) |
| 35 to 44 Years | 303 (11.1%) | 1,795 (66.0%) |
| 45 to 54 Years | 334 (8.5%) | 3,013 (76.8%) |
| 55 to 64 Years | 474 (18.9%) | 1,770 (70.7%) |
| 65 to 74 Years | 1,193 (97.5%) | 711 (58.1%) |
| 75 Years and over | 1,338 (98.4%) | 600 (44.1%) |
| Total | 6,104 (27.4%) | 14,370 (64.5%) |
Disability Status by Sex by Age in Acworth
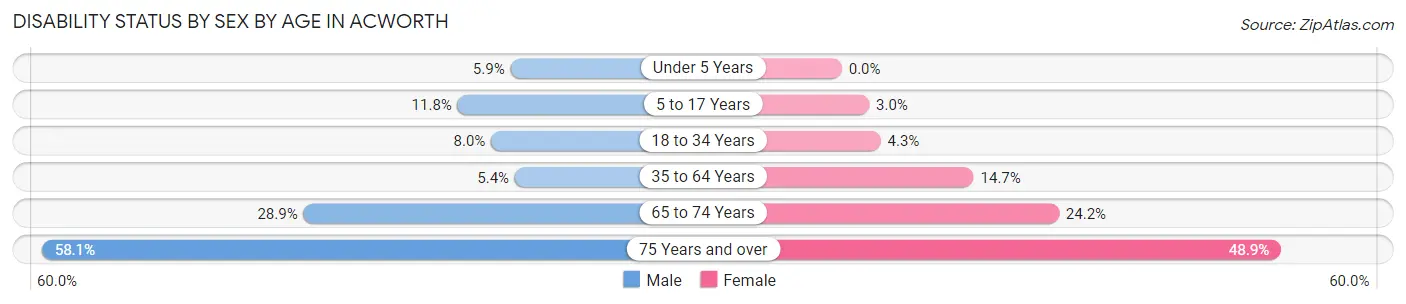
| Age Bracket | Male | Female |
| Under 5 Years | 39 (5.9%) | 0 (0.0%) |
| 5 to 17 Years | 280 (11.8%) | 77 (3.0%) |
| 18 to 34 Years | 185 (8.0%) | 96 (4.3%) |
| 35 to 64 Years | 240 (5.4%) | 689 (14.7%) |
| 65 to 74 Years | 134 (28.9%) | 184 (24.2%) |
| 75 Years and over | 194 (58.1%) | 502 (48.9%) |
Disability Class by Sex by Age in Acworth
Disability Class: Hearing Difficulty
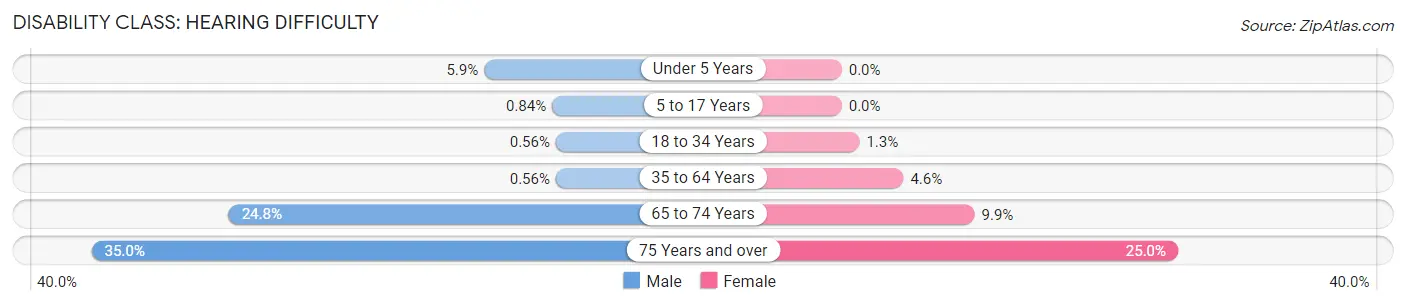
| Age Bracket | Male | Female |
| Under 5 Years | 39 (5.9%) | 0 (0.0%) |
| 5 to 17 Years | 20 (0.8%) | 0 (0.0%) |
| 18 to 34 Years | 13 (0.6%) | 29 (1.3%) |
| 35 to 64 Years | 25 (0.6%) | 215 (4.6%) |
| 65 to 74 Years | 115 (24.8%) | 75 (9.9%) |
| 75 Years and over | 117 (35.0%) | 256 (24.9%) |
Disability Class: Vision Difficulty
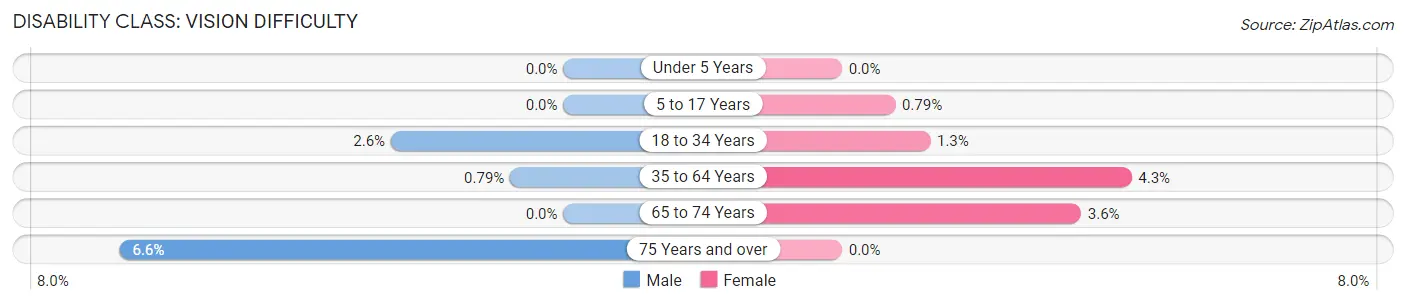
| Age Bracket | Male | Female |
| Under 5 Years | 0 (0.0%) | 0 (0.0%) |
| 5 to 17 Years | 0 (0.0%) | 20 (0.8%) |
| 18 to 34 Years | 59 (2.6%) | 29 (1.3%) |
| 35 to 64 Years | 35 (0.8%) | 202 (4.3%) |
| 65 to 74 Years | 0 (0.0%) | 27 (3.5%) |
| 75 Years and over | 22 (6.6%) | 0 (0.0%) |
Disability Class: Cognitive Difficulty
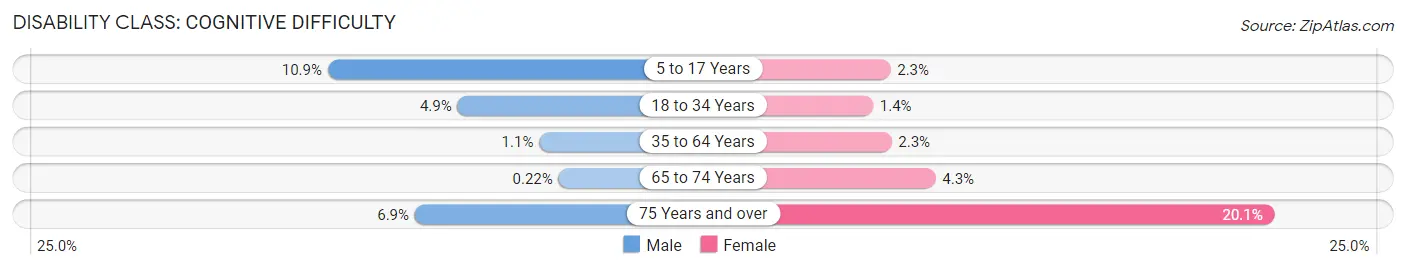
| Age Bracket | Male | Female |
| 5 to 17 Years | 260 (10.9%) | 57 (2.2%) |
| 18 to 34 Years | 113 (4.9%) | 32 (1.4%) |
| 35 to 64 Years | 50 (1.1%) | 108 (2.3%) |
| 65 to 74 Years | 1 (0.2%) | 33 (4.3%) |
| 75 Years and over | 23 (6.9%) | 206 (20.1%) |
Disability Class: Ambulatory Difficulty
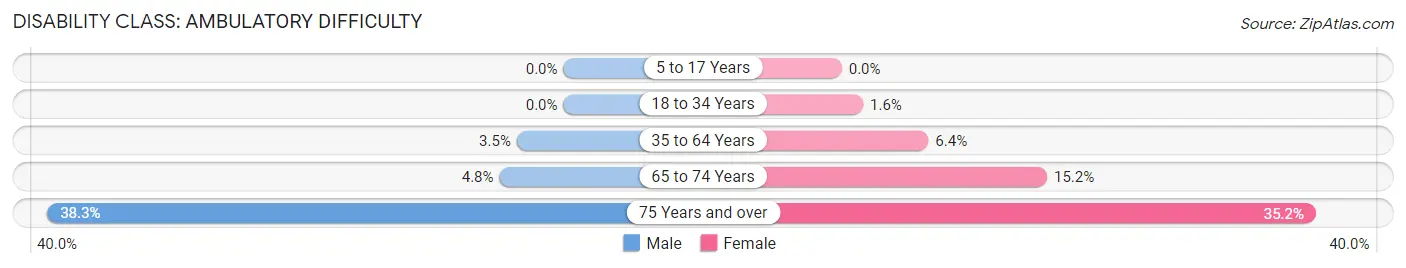
| Age Bracket | Male | Female |
| 5 to 17 Years | 0 (0.0%) | 0 (0.0%) |
| 18 to 34 Years | 0 (0.0%) | 35 (1.6%) |
| 35 to 64 Years | 154 (3.5%) | 302 (6.4%) |
| 65 to 74 Years | 22 (4.8%) | 116 (15.2%) |
| 75 Years and over | 128 (38.3%) | 361 (35.2%) |
Disability Class: Self-Care Difficulty
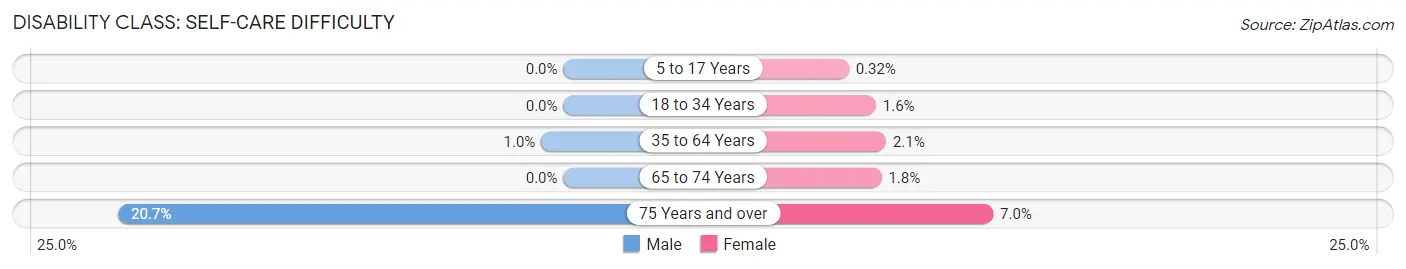
| Age Bracket | Male | Female |
| 5 to 17 Years | 0 (0.0%) | 8 (0.3%) |
| 18 to 34 Years | 0 (0.0%) | 35 (1.6%) |
| 35 to 64 Years | 46 (1.0%) | 96 (2.1%) |
| 65 to 74 Years | 0 (0.0%) | 14 (1.8%) |
| 75 Years and over | 69 (20.7%) | 72 (7.0%) |
Technology Access in Acworth
Computing Device Access in Acworth
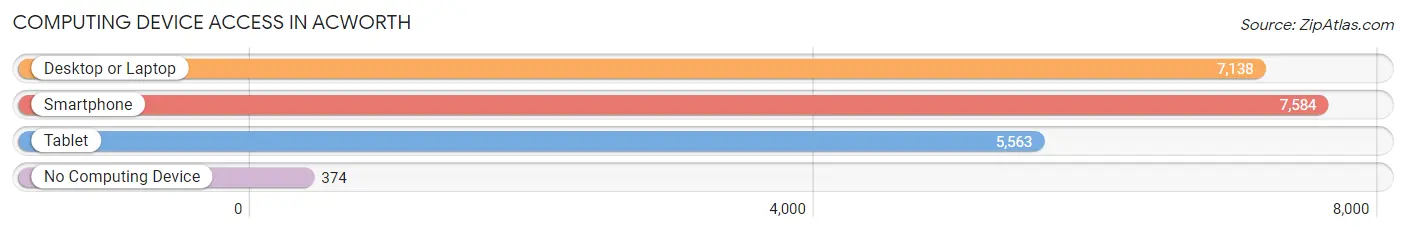
| Device Type | # Households | % Households |
| Desktop or Laptop | 7,138 | 86.4% |
| Smartphone | 7,584 | 91.8% |
| Tablet | 5,563 | 67.3% |
| No Computing Device | 374 | 4.5% |
| Total | 8,260 | 100.0% |
Internet Access in Acworth
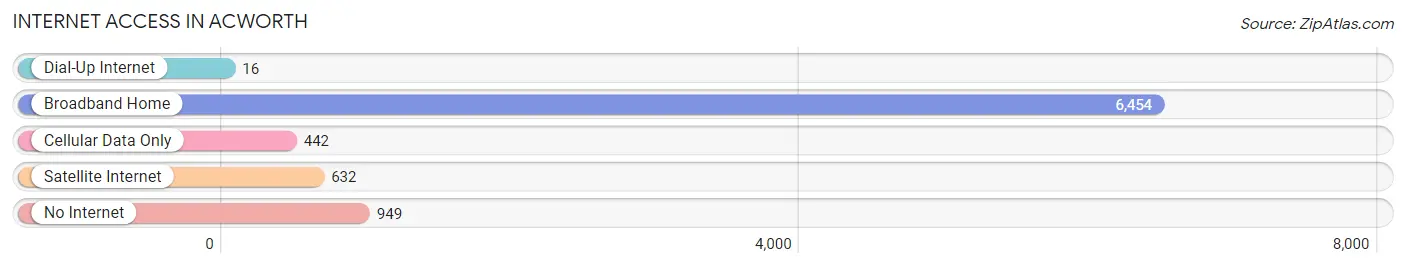
| Internet Type | # Households | % Households |
| Dial-Up Internet | 16 | 0.2% |
| Broadband Home | 6,454 | 78.1% |
| Cellular Data Only | 442 | 5.3% |
| Satellite Internet | 632 | 7.6% |
| No Internet | 949 | 11.5% |
| Total | 8,260 | 100.0% |
Acworth Summary
Acworth, Georgia is a city located in Cobb County, Georgia, United States. It is part of the Atlanta metropolitan area. The population was 20,425 at the 2010 census. Acworth is located in the foothills of the North Georgia Mountains along the southeastern banks of Lake Allatoona on the Etowah River.
History
The area now known as Acworth was first settled by European Americans in the 1830s. The city was named after Acworth, New Hampshire, the hometown of one of the area's earliest settlers, Colonel Lewis T. Moore. The area was originally known as "Dallas," after the nearby town of Dallas, Georgia. In 1859, the Georgia General Assembly changed the name of the town to Acworth.
Acworth was a small agricultural town until the completion of the Western and Atlantic Railroad in 1845. The railroad connected the town to the larger cities of Atlanta and Chattanooga, Tennessee, and allowed for the growth of the city. The city was incorporated in 1860.
During the Civil War, the city was the site of several battles, including the Battle of Allatoona Pass in 1864. The city was occupied by Union forces for the duration of the war. After the war, the city experienced a period of growth and prosperity.
Geography
Acworth is located in northwestern Cobb County at 34°04′N 84°41′W (34.07, -84.68). It is bordered to the north by the city of Kennesaw, to the east by the city of Marietta, to the south by the city of Powder Springs, and to the west by the city of Woodstock.
The city is located in the foothills of the North Georgia Mountains, along the southeastern banks of Lake Allatoona on the Etowah River. The city is located approximately 25 miles northwest of downtown Atlanta.
Economy
Acworth's economy is largely based on tourism and retail. The city is home to several tourist attractions, including the Lake Allatoona Visitors Center, the Acworth Beach, and the Acworth Historic District. The city is also home to several retail stores, including the Acworth Outlet Mall and the Acworth Marketplace.
The city is also home to several manufacturing and industrial companies, including the Acworth Manufacturing Company, the Acworth Tool and Die Company, and the Acworth Textile Company.
Demographics
As of the 2010 census, there were 20,425 people, 7,845 households, and 5,717 families residing in the city. The population density was 1,717.3 people per square mile (662.7/km2). There were 8,541 housing units at an average density of 717.3 per square mile (276.7/km2). The racial makeup of the city was 79.2% White, 11.3% African American, 0.4% Native American, 2.3% Asian, 0.1% Pacific Islander, 4.2% from other races, and 2.5% from two or more races. Hispanic or Latino of any race were 8.7% of the population.
There were 7,845 households, out of which 33.2% had children under the age of 18 living with them, 54.2% were married couples living together, 11.7% had a female householder with no husband present, and 29.3% were non-families. 24.2% of all households were made up of individuals, and 7.2% had someone living alone who was 65 years of age or older. The average household size was 2.58 and the average family size was 3.08.
In the city, the population was spread out, with 25.3% under the age of 18, 8.2% from 18 to 24, 32.2% from 25 to 44, 22.7% from 45 to 64, and 11.6% who were 65 years of age or older. The median age was 35 years. For every 100 females, there were 94.2 males. For every 100 females age 18 and over, there were 90.7 males.
The median income for a household in the city was $50,945, and the median income for a family was $58,945. Males had a median income of $41,845 versus $30,945 for females. The per capita income for the city was $24,945. About 5.2% of families and 7.2% of the population were below the poverty line, including 9.2% of those under age 18 and 8.2% of those age 65 or over.
Common Questions
What is Per Capita Income in Acworth?
Per Capita income in Acworth is $35,413.
What is the Median Family Income in Acworth?
Median Family Income in Acworth is $85,019.
What is the Median Household income in Acworth?
Median Household Income in Acworth is $74,643.
What is Income or Wage Gap in Acworth?
Income or Wage Gap in Acworth is 21.8%.
Women in Acworth earn 78.2 cents for every dollar earned by a man.
What is Inequality or Gini Index in Acworth?
Inequality or Gini Index in Acworth is 0.46.
What is the Total Population of Acworth?
Total Population of Acworth is 22,318.
What is the Total Male Population of Acworth?
Total Male Population of Acworth is 10,614.
What is the Total Female Population of Acworth?
Total Female Population of Acworth is 11,704.
What is the Ratio of Males per 100 Females in Acworth?
There are 90.69 Males per 100 Females in Acworth.
What is the Ratio of Females per 100 Males in Acworth?
There are 110.27 Females per 100 Males in Acworth.
What is the Median Population Age in Acworth?
Median Population Age in Acworth is 36.8 Years.
What is the Average Family Size in Acworth
Average Family Size in Acworth is 3.5 People.
What is the Average Household Size in Acworth
Average Household Size in Acworth is 2.7 People.
How Large is the Labor Force in Acworth?
There are 12,464 People in the Labor Forcein in Acworth.
What is the Percentage of People in the Labor Force in Acworth?
71.4% of People are in the Labor Force in Acworth.
What is the Unemployment Rate in Acworth?
Unemployment Rate in Acworth is 4.2%.