Lumber City, GA Map & Demographics
Lumber City Map
Lumber City Overview
$15,296
PER CAPITA INCOME
$41,000
AVG FAMILY INCOME
$31,429
AVG HOUSEHOLD INCOME
0.40
INEQUALITY / GINI INDEX
1,127
TOTAL POPULATION
440
MALE POPULATION
687
FEMALE POPULATION
64.05
MALES / 100 FEMALES
156.14
FEMALES / 100 MALES
41.2
MEDIAN AGE
5.8
AVG FAMILY SIZE
3.7
AVG HOUSEHOLD SIZE
386
LABOR FORCE [ PEOPLE ]
44.4%
PERCENT IN LABOR FORCE
7.3%
UNEMPLOYMENT RATE
Lumber City Zip Codes
Lumber City Area Codes
Income in Lumber City
Income Overview in Lumber City
Per Capita Income in Lumber City is $15,296, while median incomes of families and households are $41,000 and $31,429 respectively.
| Characteristic | Number | Measure |
| Per Capita Income | 1,127 | $15,296 |
| Median Family Income | 158 | $41,000 |
| Mean Family Income | 158 | $46,661 |
| Median Household Income | 290 | $31,429 |
| Mean Household Income | 290 | $35,701 |
| Income Deficit | 158 | $0 |
| Wage / Income Gap (%) | 1,127 | 0.00% |
| Wage / Income Gap ($) | 1,127 | 100.00¢ per $1 |
| Gini / Inequality Index | 1,127 | 0.40 |
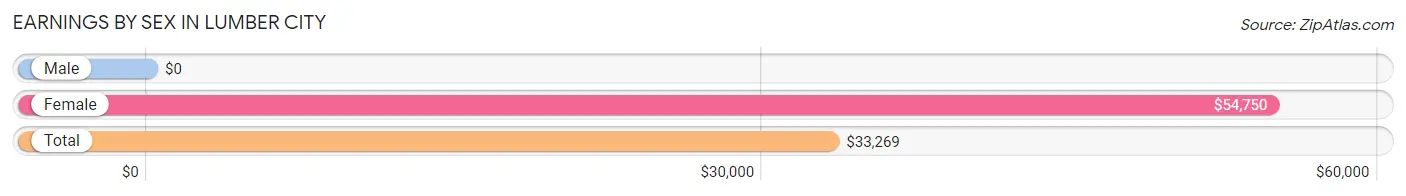
Earnings by Sex in Lumber City
| Sex | Number | Average Earnings |
| Male | 153 (39.0%) | $0 |
| Female | 239 (61.0%) | $54,750 |
| Total | 392 (100.0%) | $33,269 |
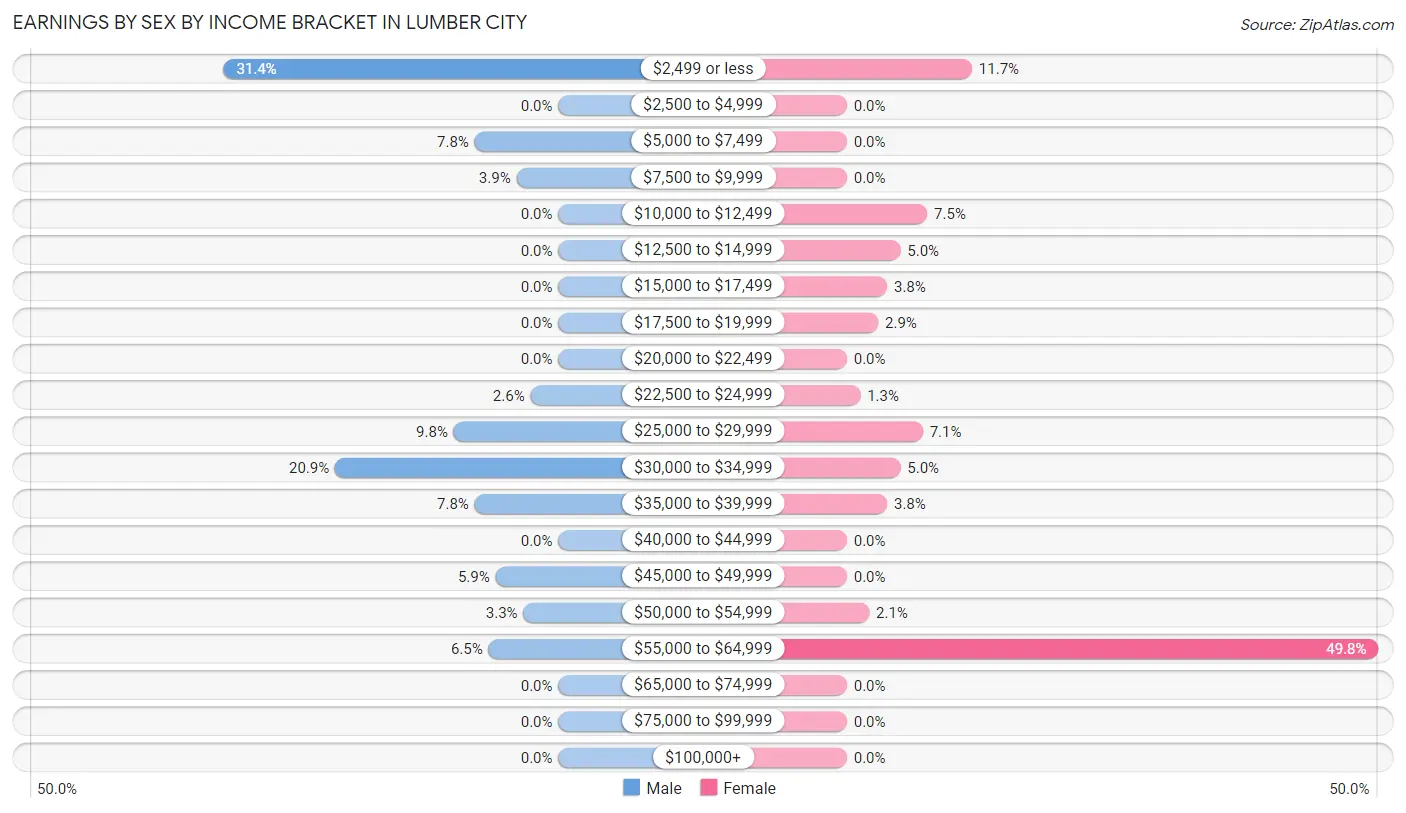
Earnings by Sex by Income Bracket in Lumber City
The most common earnings brackets in Lumber City are $2,499 or less for men (48 | 31.4%) and $55,000 to $64,999 for women (119 | 49.8%).
| Income | Male | Female |
| $2,499 or less | 48 (31.4%) | 28 (11.7%) |
| $2,500 to $4,999 | 0 (0.0%) | 0 (0.0%) |
| $5,000 to $7,499 | 12 (7.8%) | 0 (0.0%) |
| $7,500 to $9,999 | 6 (3.9%) | 0 (0.0%) |
| $10,000 to $12,499 | 0 (0.0%) | 18 (7.5%) |
| $12,500 to $14,999 | 0 (0.0%) | 12 (5.0%) |
| $15,000 to $17,499 | 0 (0.0%) | 9 (3.8%) |
| $17,500 to $19,999 | 0 (0.0%) | 7 (2.9%) |
| $20,000 to $22,499 | 0 (0.0%) | 0 (0.0%) |
| $22,500 to $24,999 | 4 (2.6%) | 3 (1.3%) |
| $25,000 to $29,999 | 15 (9.8%) | 17 (7.1%) |
| $30,000 to $34,999 | 32 (20.9%) | 12 (5.0%) |
| $35,000 to $39,999 | 12 (7.8%) | 9 (3.8%) |
| $40,000 to $44,999 | 0 (0.0%) | 0 (0.0%) |
| $45,000 to $49,999 | 9 (5.9%) | 0 (0.0%) |
| $50,000 to $54,999 | 5 (3.3%) | 5 (2.1%) |
| $55,000 to $64,999 | 10 (6.5%) | 119 (49.8%) |
| $65,000 to $74,999 | 0 (0.0%) | 0 (0.0%) |
| $75,000 to $99,999 | 0 (0.0%) | 0 (0.0%) |
| $100,000+ | 0 (0.0%) | 0 (0.0%) |
| Total | 153 (100.0%) | 239 (100.0%) |
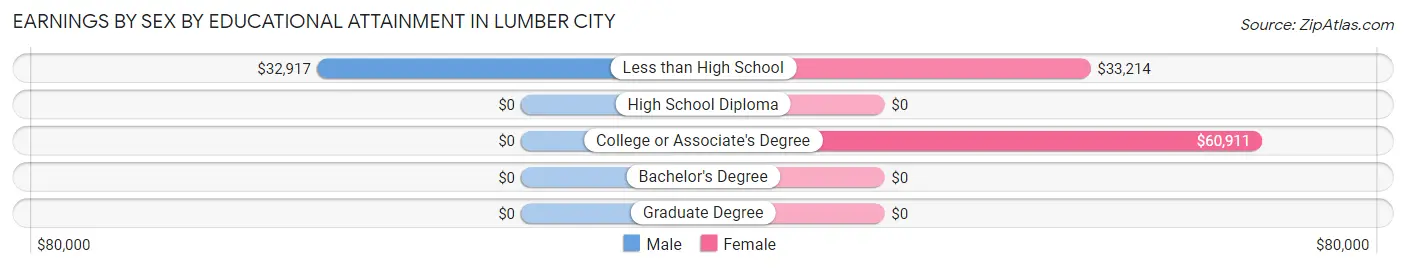
Earnings by Sex by Educational Attainment in Lumber City
Average earnings in Lumber City are $29,286 for men and $60,234 for women, a difference of 51.4%. Men with an educational attainment of less than high school enjoy the highest average annual earnings of $32,917, while those with less than high school education earn the least with $32,917. Women with an educational attainment of college or associate's degree earn the most with the average annual earnings of $60,911, while those with less than high school education have the smallest earnings of $33,214.
| Educational Attainment | Male Income | Female Income |
| Less than High School | $32,917 | $33,214 |
| High School Diploma | - | - |
| College or Associate's Degree | - | - |
| Bachelor's Degree | - | - |
| Graduate Degree | - | - |
| Total | $29,286 | $60,234 |
Family Income in Lumber City
Family Income Brackets in Lumber City
According to the Lumber City family income data, there are 73 families falling into the $35,000 to $49,999 income range, which is the most common income bracket and makes up 46.2% of all families.
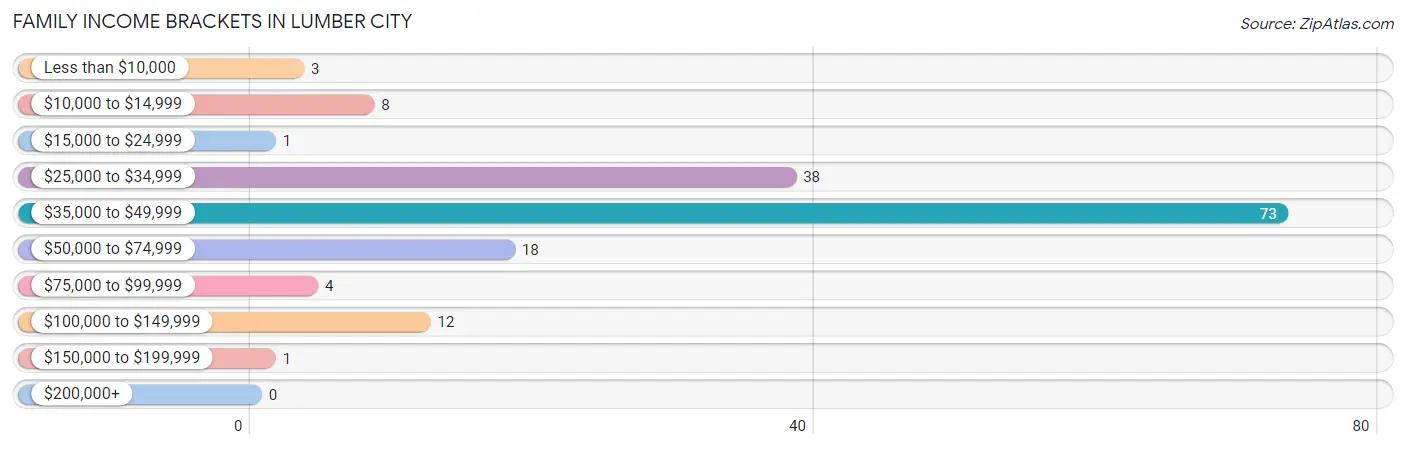
| Income Bracket | # Families | % Families |
| Less than $10,000 | 3 | 1.9% |
| $10,000 to $14,999 | 8 | 5.1% |
| $15,000 to $24,999 | 1 | 0.6% |
| $25,000 to $34,999 | 38 | 24.1% |
| $35,000 to $49,999 | 73 | 46.2% |
| $50,000 to $74,999 | 18 | 11.4% |
| $75,000 to $99,999 | 4 | 2.5% |
| $100,000 to $149,999 | 12 | 7.6% |
| $150,000 to $199,999 | 1 | 0.6% |
| $200,000+ | 0 | 0.0% |
Family Income by Famaliy Size in Lumber City
2-person families (75 | 47.5%) account for the highest median family income in Lumber City with $39,792 per family, while 2-person families (75 | 47.5%) have the highest median income of $19,896 per family member.
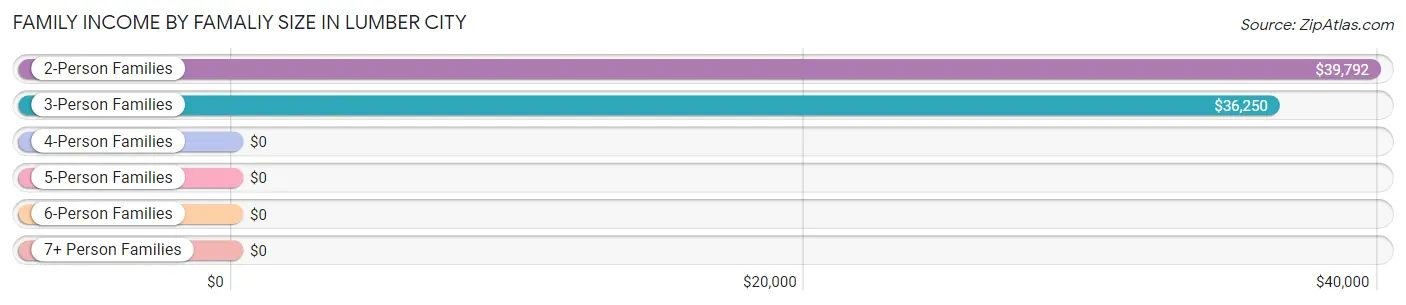
| Income Bracket | # Families | Median Income |
| 2-Person Families | 75 (47.5%) | $39,792 |
| 3-Person Families | 27 (17.1%) | $36,250 |
| 4-Person Families | 34 (21.5%) | $0 |
| 5-Person Families | 3 (1.9%) | $0 |
| 6-Person Families | 3 (1.9%) | $0 |
| 7+ Person Families | 16 (10.1%) | $0 |
| Total | 158 (100.0%) | $41,000 |
Family Income by Number of Earners in Lumber City
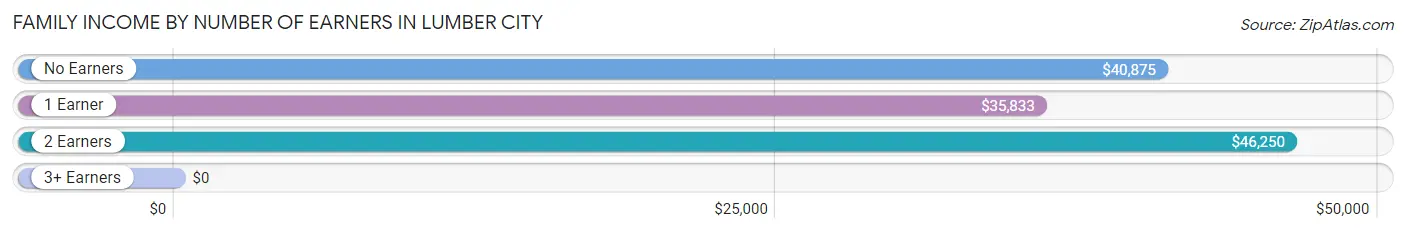
| Number of Earners | # Families | Median Income |
| No Earners | 34 (21.5%) | $40,875 |
| 1 Earner | 60 (38.0%) | $35,833 |
| 2 Earners | 48 (30.4%) | $46,250 |
| 3+ Earners | 16 (10.1%) | $0 |
| Total | 158 (100.0%) | $41,000 |
Household Income in Lumber City
Household Income Brackets in Lumber City
With 75 households falling in the category, the $25,000 to $34,999 income range is the most frequent in Lumber City, accounting for 25.9% of all households.
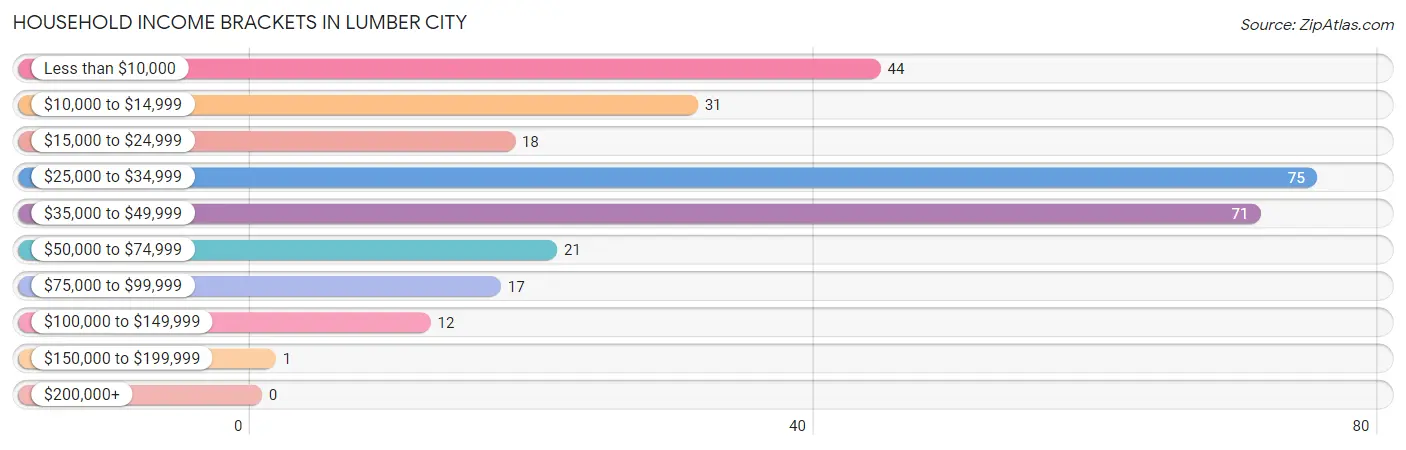
| Income Bracket | # Households | % Households |
| Less than $10,000 | 44 | 15.2% |
| $10,000 to $14,999 | 31 | 10.7% |
| $15,000 to $24,999 | 18 | 6.2% |
| $25,000 to $34,999 | 75 | 25.9% |
| $35,000 to $49,999 | 71 | 24.5% |
| $50,000 to $74,999 | 21 | 7.2% |
| $75,000 to $99,999 | 17 | 5.9% |
| $100,000 to $149,999 | 12 | 4.1% |
| $150,000 to $199,999 | 1 | 0.3% |
| $200,000+ | 0 | 0.0% |
Household Income by Householder Age in Lumber City
The median household income in Lumber City is $31,429, with the highest median household income of $47,679 found in the 25 to 44 years age bracket for the primary householder. A total of 55 households (19.0%) fall into this category. Meanwhile, the 15 to 24 years age bracket for the primary householder has the lowest median household income of $0, with 1 households (0.3%) in this group.
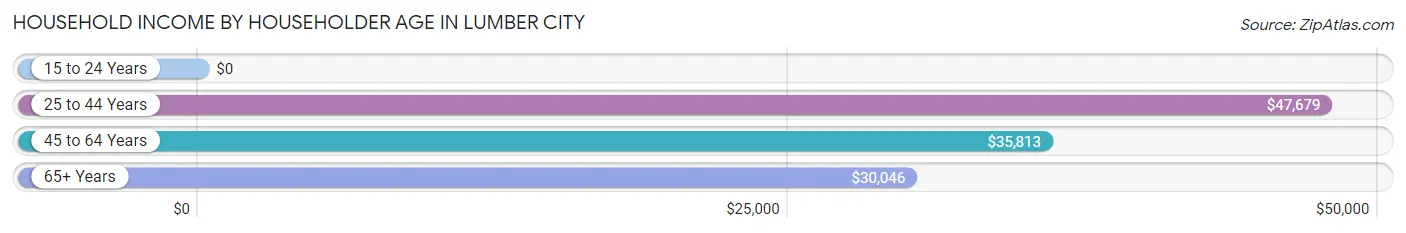
| Income Bracket | # Households | Median Income |
| 15 to 24 Years | 1 (0.3%) | $0 |
| 25 to 44 Years | 55 (19.0%) | $47,679 |
| 45 to 64 Years | 113 (39.0%) | $35,813 |
| 65+ Years | 121 (41.7%) | $30,046 |
| Total | 290 (100.0%) | $31,429 |
Poverty in Lumber City
Income Below Poverty by Sex and Age in Lumber City
With 13.2% poverty level for males and 16.0% for females among the residents of Lumber City, 55 to 64 year old males and under 5 year old females are the most vulnerable to poverty, with 6 males (40.0%) and 2 females (100.0%) in their respective age groups living below the poverty level.
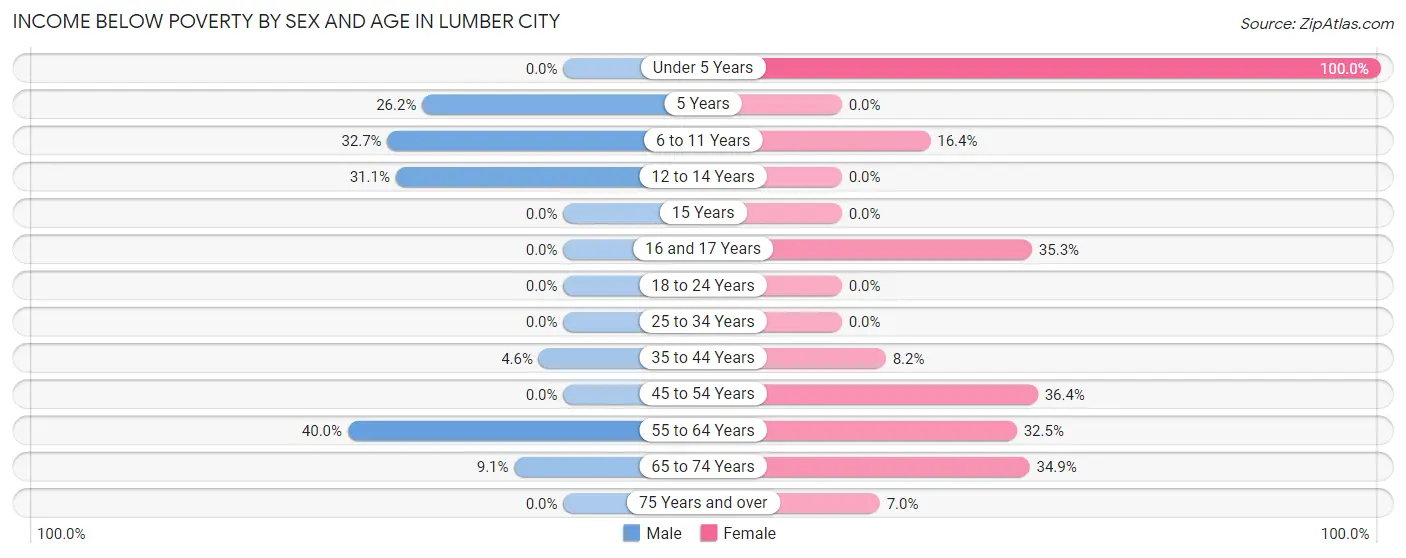
| Age Bracket | Male | Female |
| Under 5 Years | 0 (0.0%) | 2 (100.0%) |
| 5 Years | 11 (26.2%) | 0 (0.0%) |
| 6 to 11 Years | 16 (32.7%) | 11 (16.4%) |
| 12 to 14 Years | 14 (31.1%) | 0 (0.0%) |
| 15 Years | 0 (0.0%) | 0 (0.0%) |
| 16 and 17 Years | 0 (0.0%) | 12 (35.3%) |
| 18 to 24 Years | 0 (0.0%) | 0 (0.0%) |
| 25 to 34 Years | 0 (0.0%) | 0 (0.0%) |
| 35 to 44 Years | 3 (4.5%) | 12 (8.2%) |
| 45 to 54 Years | 0 (0.0%) | 16 (36.4%) |
| 55 to 64 Years | 6 (40.0%) | 25 (32.5%) |
| 65 to 74 Years | 3 (9.1%) | 23 (34.8%) |
| 75 Years and over | 0 (0.0%) | 5 (7.0%) |
| Total | 53 (13.2%) | 106 (16.0%) |
Income Above Poverty by Sex and Age in Lumber City
According to the poverty statistics in Lumber City, males aged under 5 years and females aged 12 to 14 years are the age groups that are most secure financially, with 100.0% of males and 100.0% of females in these age groups living above the poverty line.
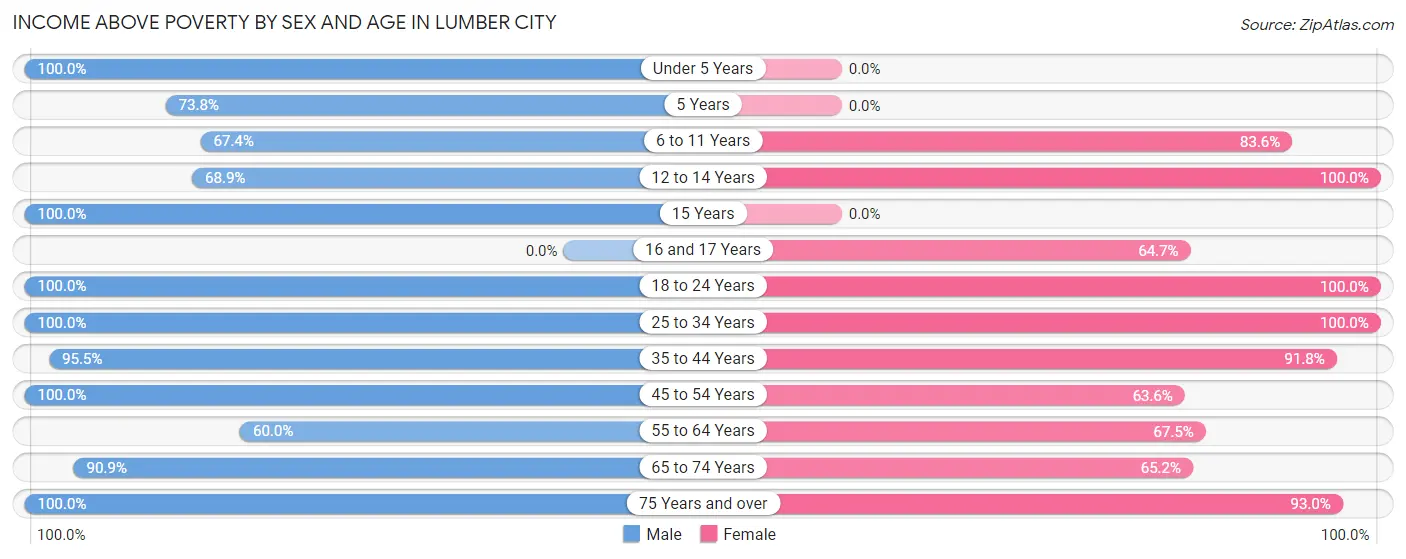
| Age Bracket | Male | Female |
| Under 5 Years | 16 (100.0%) | 0 (0.0%) |
| 5 Years | 31 (73.8%) | 0 (0.0%) |
| 6 to 11 Years | 33 (67.3%) | 56 (83.6%) |
| 12 to 14 Years | 31 (68.9%) | 23 (100.0%) |
| 15 Years | 14 (100.0%) | 0 (0.0%) |
| 16 and 17 Years | 0 (0.0%) | 22 (64.7%) |
| 18 to 24 Years | 29 (100.0%) | 126 (100.0%) |
| 25 to 34 Years | 57 (100.0%) | 5 (100.0%) |
| 35 to 44 Years | 63 (95.5%) | 135 (91.8%) |
| 45 to 54 Years | 19 (100.0%) | 28 (63.6%) |
| 55 to 64 Years | 9 (60.0%) | 52 (67.5%) |
| 65 to 74 Years | 30 (90.9%) | 43 (65.1%) |
| 75 Years and over | 18 (100.0%) | 66 (93.0%) |
| Total | 350 (86.9%) | 556 (84.0%) |
Income Below Poverty Among Married-Couple Families in Lumber City
The poverty statistics for married-couple families in Lumber City show that 11.7% or 9 of the total 77 families live below the poverty line. Families with 3 or 4 children have the highest poverty rate of 100.0%, comprising of 6 families. On the other hand, families with 1 or 2 children have the lowest poverty rate of 0.0%, which includes 0 families.
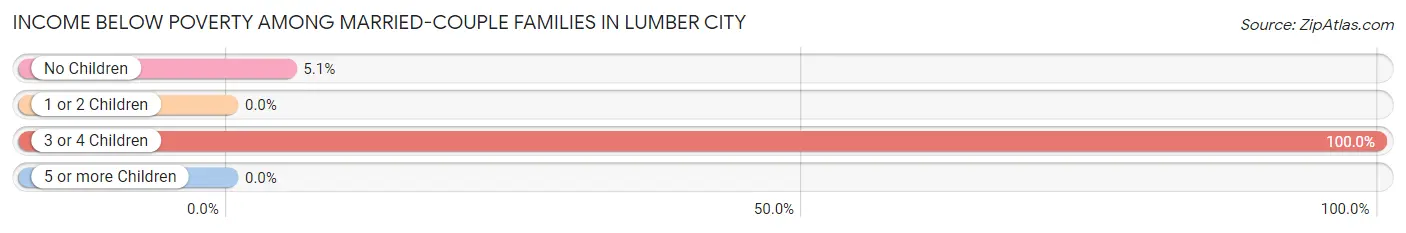
| Children | Above Poverty | Below Poverty |
| No Children | 56 (94.9%) | 3 (5.1%) |
| 1 or 2 Children | 12 (100.0%) | 0 (0.0%) |
| 3 or 4 Children | 0 (0.0%) | 6 (100.0%) |
| 5 or more Children | 0 (0.0%) | 0 (0.0%) |
| Total | 68 (88.3%) | 9 (11.7%) |
Income Below Poverty Among Single-Parent Households in Lumber City
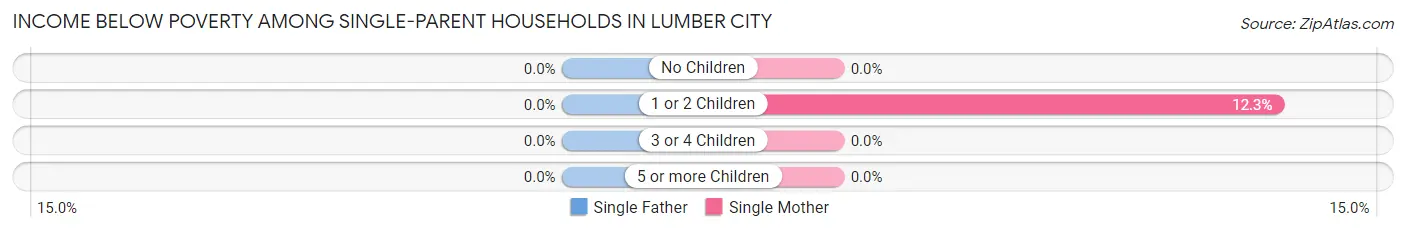
| Children | Single Father | Single Mother |
| No Children | 0 (0.0%) | 0 (0.0%) |
| 1 or 2 Children | 0 (0.0%) | 8 (12.3%) |
| 3 or 4 Children | 0 (0.0%) | 0 (0.0%) |
| 5 or more Children | 0 (0.0%) | 0 (0.0%) |
| Total | 0 (0.0%) | 8 (11.3%) |
Income Below Poverty Among Married-Couple vs Single-Parent Households in Lumber City
The poverty data for Lumber City shows that 9 of the married-couple family households (11.7%) and 8 of the single-parent households (9.9%) are living below the poverty level. Within the married-couple family households, those with 3 or 4 children have the highest poverty rate, with 6 households (100.0%) falling below the poverty line. Among the single-parent households, those with 1 or 2 children have the highest poverty rate, with 8 household (11.8%) living below poverty.
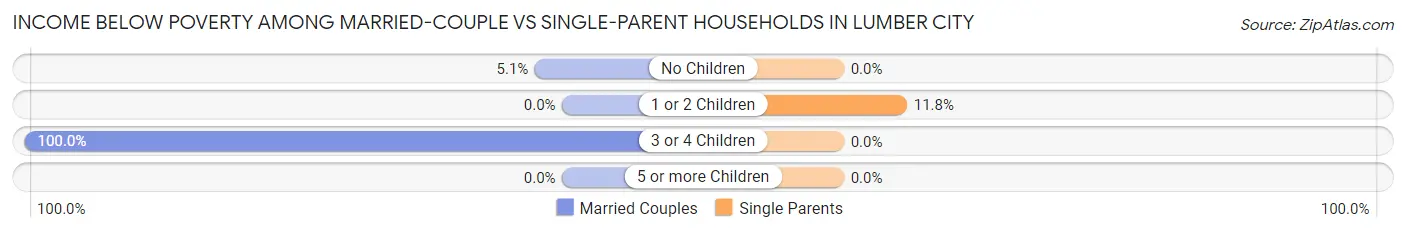
| Children | Married-Couple Families | Single-Parent Households |
| No Children | 3 (5.1%) | 0 (0.0%) |
| 1 or 2 Children | 0 (0.0%) | 8 (11.8%) |
| 3 or 4 Children | 6 (100.0%) | 0 (0.0%) |
| 5 or more Children | 0 (0.0%) | 0 (0.0%) |
| Total | 9 (11.7%) | 8 (9.9%) |
Race in Lumber City
The most populous races in Lumber City are Black / African American (733 | 65.0%), White / Caucasian (304 | 27.0%), and Hispanic or Latino (99 | 8.8%).
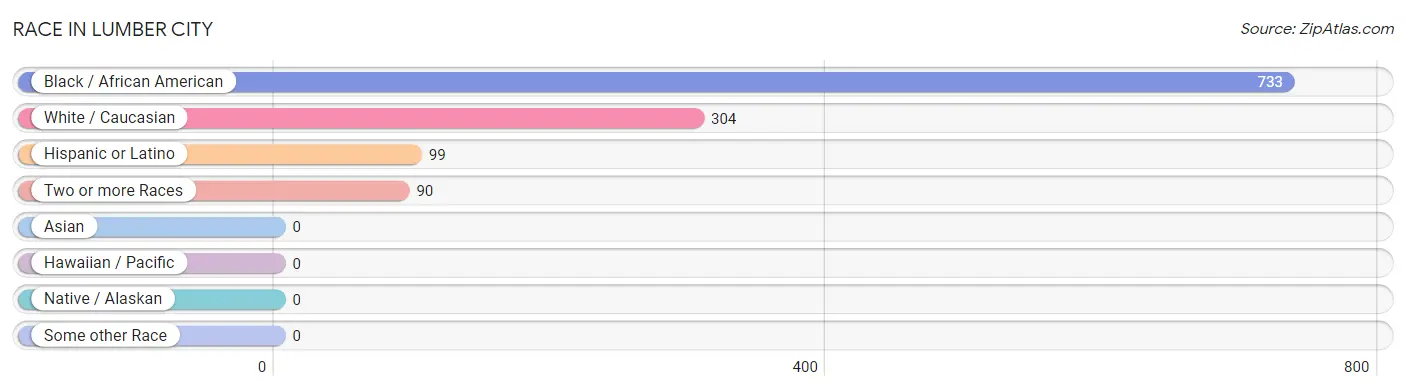
| Race | # Population | % Population |
| Asian | 0 | 0.0% |
| Black / African American | 733 | 65.0% |
| Hawaiian / Pacific | 0 | 0.0% |
| Hispanic or Latino | 99 | 8.8% |
| Native / Alaskan | 0 | 0.0% |
| White / Caucasian | 304 | 27.0% |
| Two or more Races | 90 | 8.0% |
| Some other Race | 0 | 0.0% |
| Total | 1,127 | 100.0% |
Ancestry in Lumber City
The most populous ancestries reported in Lumber City are Puerto Rican (86 | 7.6%), American (41 | 3.6%), Irish (22 | 1.9%), Mexican (13 | 1.1%), and German (7 | 0.6%), together accounting for 15.0% of all Lumber City residents.
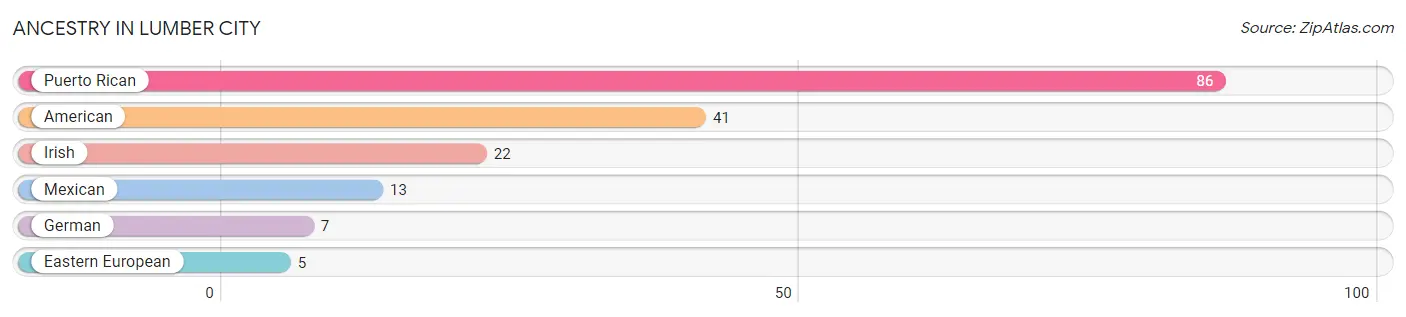
| Ancestry | # Population | % Population |
| American | 41 | 3.6% |
| Eastern European | 5 | 0.4% |
| German | 7 | 0.6% |
| Irish | 22 | 1.9% |
| Mexican | 13 | 1.1% |
| Puerto Rican | 86 | 7.6% | View All 6 Rows |
Immigrants in Lumber City
The most numerous immigrant groups reported in Lumber City came from Central America (13 | 1.1%), Latin America (13 | 1.1%), Mexico (13 | 1.1%), Africa (12 | 1.1%), and South Africa (12 | 1.1%), together accounting for 5.6% of all Lumber City residents.
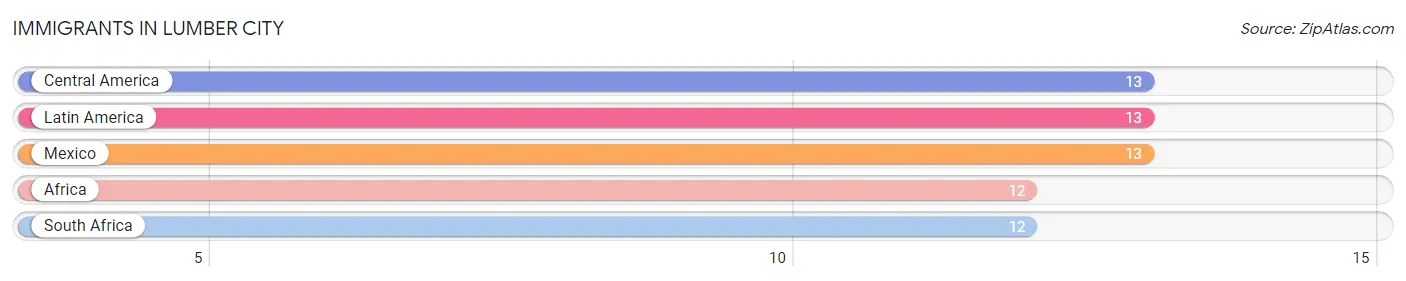
| Immigration Origin | # Population | % Population |
| Africa | 12 | 1.1% |
| Central America | 13 | 1.1% |
| Latin America | 13 | 1.1% |
| Mexico | 13 | 1.1% |
| South Africa | 12 | 1.1% | View All 5 Rows |
Sex and Age in Lumber City
Sex and Age in Lumber City
The most populous age groups in Lumber City are 10 to 14 Years (72 | 16.4%) for men and 40 to 44 Years (135 | 19.7%) for women.
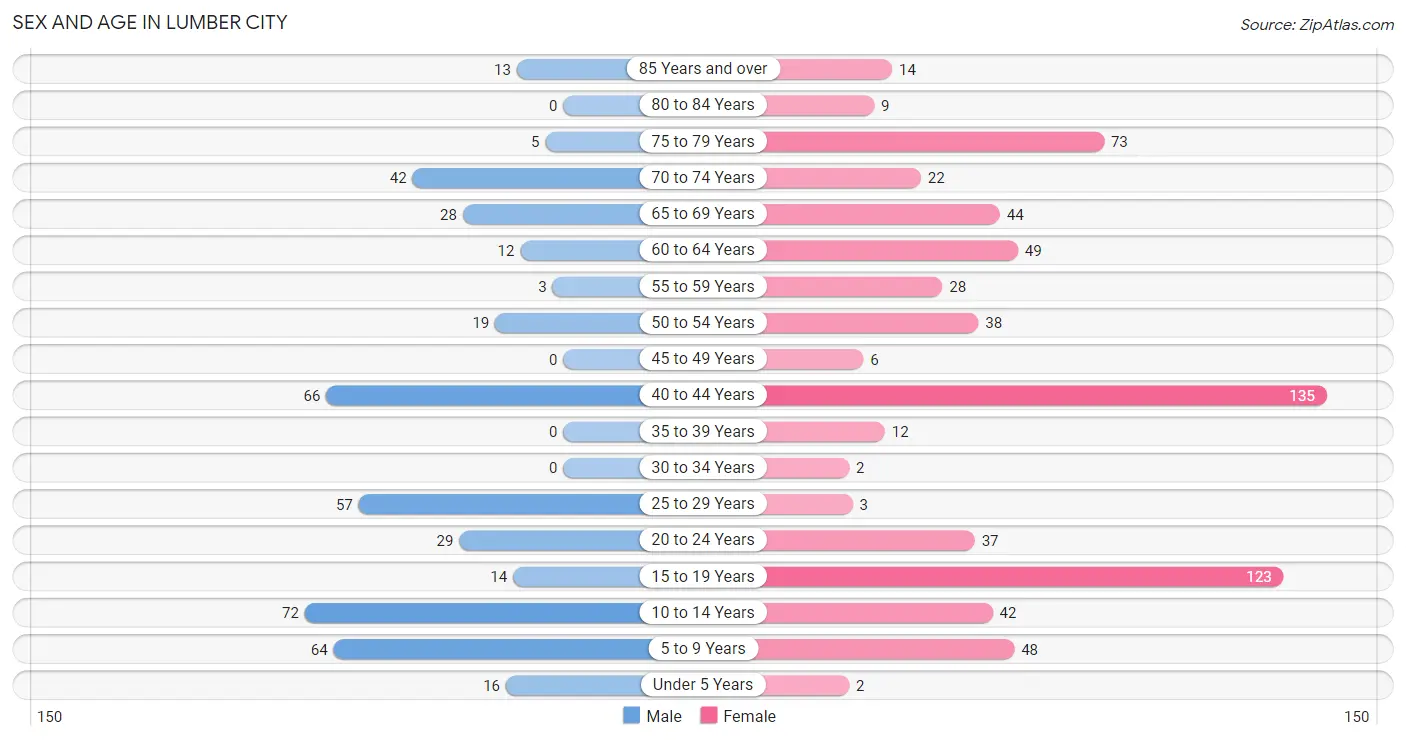
| Age Bracket | Male | Female |
| Under 5 Years | 16 (3.6%) | 2 (0.3%) |
| 5 to 9 Years | 64 (14.5%) | 48 (7.0%) |
| 10 to 14 Years | 72 (16.4%) | 42 (6.1%) |
| 15 to 19 Years | 14 (3.2%) | 123 (17.9%) |
| 20 to 24 Years | 29 (6.6%) | 37 (5.4%) |
| 25 to 29 Years | 57 (13.0%) | 3 (0.4%) |
| 30 to 34 Years | 0 (0.0%) | 2 (0.3%) |
| 35 to 39 Years | 0 (0.0%) | 12 (1.8%) |
| 40 to 44 Years | 66 (15.0%) | 135 (19.7%) |
| 45 to 49 Years | 0 (0.0%) | 6 (0.9%) |
| 50 to 54 Years | 19 (4.3%) | 38 (5.5%) |
| 55 to 59 Years | 3 (0.7%) | 28 (4.1%) |
| 60 to 64 Years | 12 (2.7%) | 49 (7.1%) |
| 65 to 69 Years | 28 (6.4%) | 44 (6.4%) |
| 70 to 74 Years | 42 (9.6%) | 22 (3.2%) |
| 75 to 79 Years | 5 (1.1%) | 73 (10.6%) |
| 80 to 84 Years | 0 (0.0%) | 9 (1.3%) |
| 85 Years and over | 13 (2.9%) | 14 (2.0%) |
| Total | 440 (100.0%) | 687 (100.0%) |
Families and Households in Lumber City
Median Family Size in Lumber City
The median family size in Lumber City is 5.85 persons per family, with single female/mother families (71 | 44.9%) accounting for the largest median family size of 7.58 persons per family. On the other hand, married-couple families (77 | 48.7%) represent the smallest median family size with 4.26 persons per family.
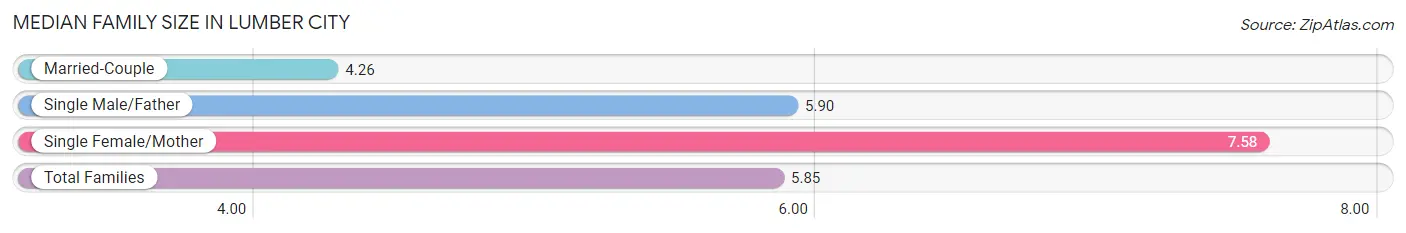
| Family Type | # Families | Family Size |
| Married-Couple | 77 (48.7%) | 4.26 |
| Single Male/Father | 10 (6.3%) | 5.90 |
| Single Female/Mother | 71 (44.9%) | 7.58 |
| Total Families | 158 (100.0%) | 5.85 |
Median Household Size in Lumber City
The median household size in Lumber City is 3.67 persons per household, with single female/mother households (71 | 24.5%) accounting for the largest median household size of 7.66 persons per household. non-family households (132 | 45.5%) represent the smallest median household size with 1.02 persons per household.
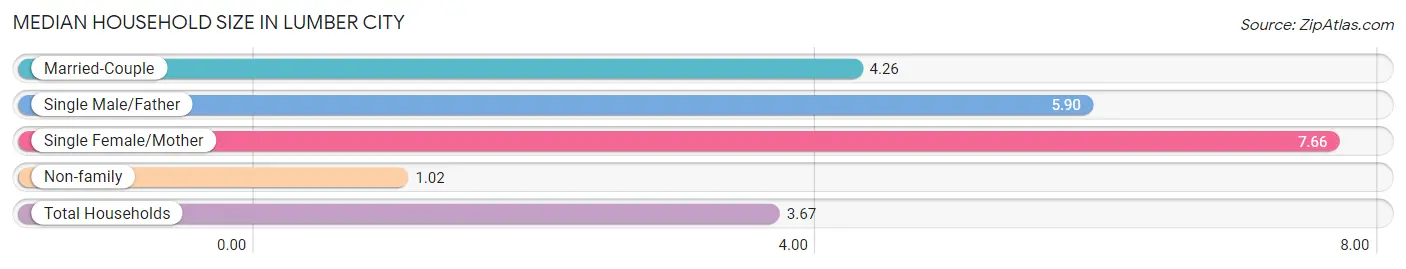
| Household Type | # Households | Household Size |
| Married-Couple | 77 (26.6%) | 4.26 |
| Single Male/Father | 10 (3.5%) | 5.90 |
| Single Female/Mother | 71 (24.5%) | 7.66 |
| Non-family | 132 (45.5%) | 1.02 |
| Total Households | 290 (100.0%) | 3.67 |
Household Size by Marriage Status in Lumber City
Out of a total of 290 households in Lumber City, 158 (54.5%) are family households, while 132 (45.5%) are nonfamily households. The most numerous type of family households are 2-person households, comprising 75, and the most common type of nonfamily households are 1-person households, comprising 128.
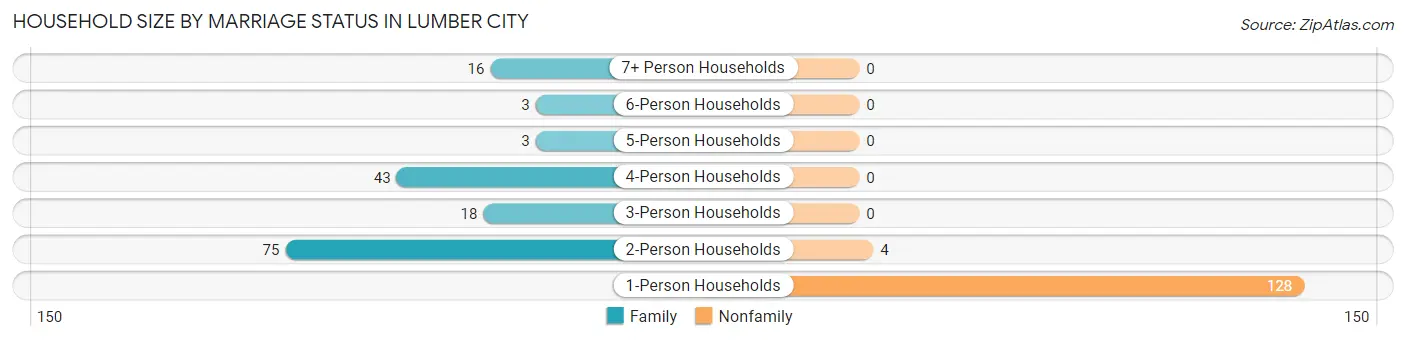
| Household Size | Family Households | Nonfamily Households |
| 1-Person Households | - | 128 (44.1%) |
| 2-Person Households | 75 (25.9%) | 4 (1.4%) |
| 3-Person Households | 18 (6.2%) | 0 (0.0%) |
| 4-Person Households | 43 (14.8%) | 0 (0.0%) |
| 5-Person Households | 3 (1.0%) | 0 (0.0%) |
| 6-Person Households | 3 (1.0%) | 0 (0.0%) |
| 7+ Person Households | 16 (5.5%) | 0 (0.0%) |
| Total | 158 (54.5%) | 132 (45.5%) |
Female Fertility in Lumber City
Fertility by Age in Lumber City
Average fertility rate in Lumber City is 6.0 births per 1,000 women. Women in the age bracket of 20 to 34 years have the highest fertility rate with 48.0 births per 1,000 women. Women in the age bracket of 20 to 34 years acount for 100.0% of all women with births.
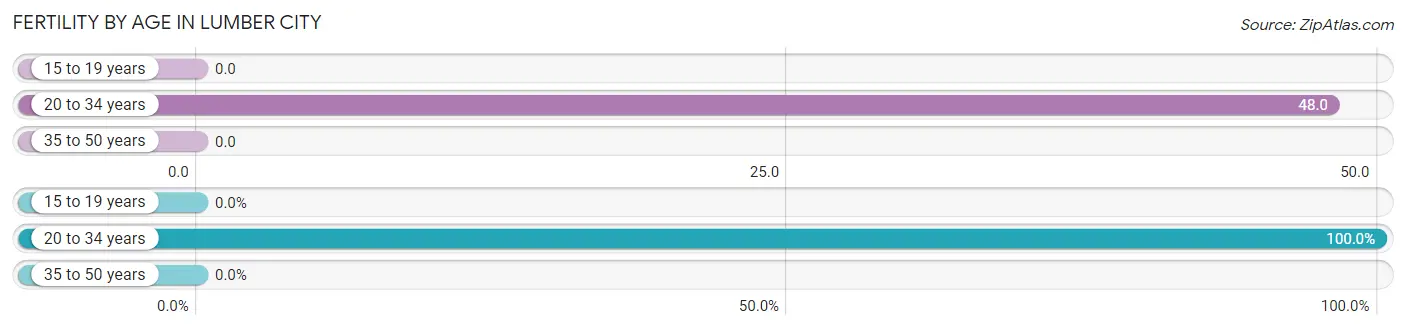
| Age Bracket | Women with Births | Births / 1,000 Women |
| 15 to 19 years | 0 (0.0%) | 0.0 |
| 20 to 34 years | 2 (100.0%) | 48.0 |
| 35 to 50 years | 0 (0.0%) | 0.0 |
| Total | 2 (100.0%) | 6.0 |
Fertility by Age by Marriage Status in Lumber City
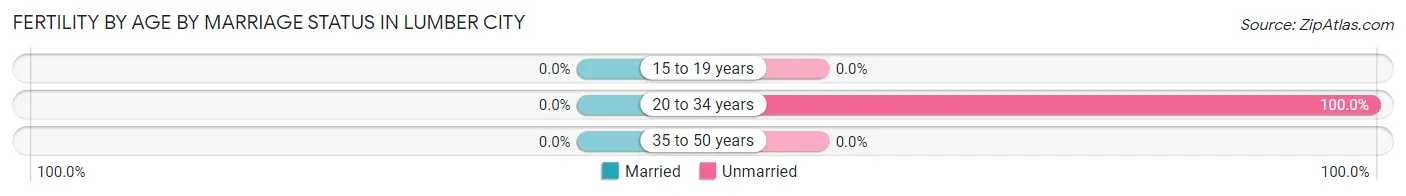
| Age Bracket | Married | Unmarried |
| 15 to 19 years | 0 (0.0%) | 0 (0.0%) |
| 20 to 34 years | 0 (0.0%) | 2 (100.0%) |
| 35 to 50 years | 0 (0.0%) | 0 (0.0%) |
| Total | 0 (0.0%) | 2 (100.0%) |
Fertility by Education in Lumber City
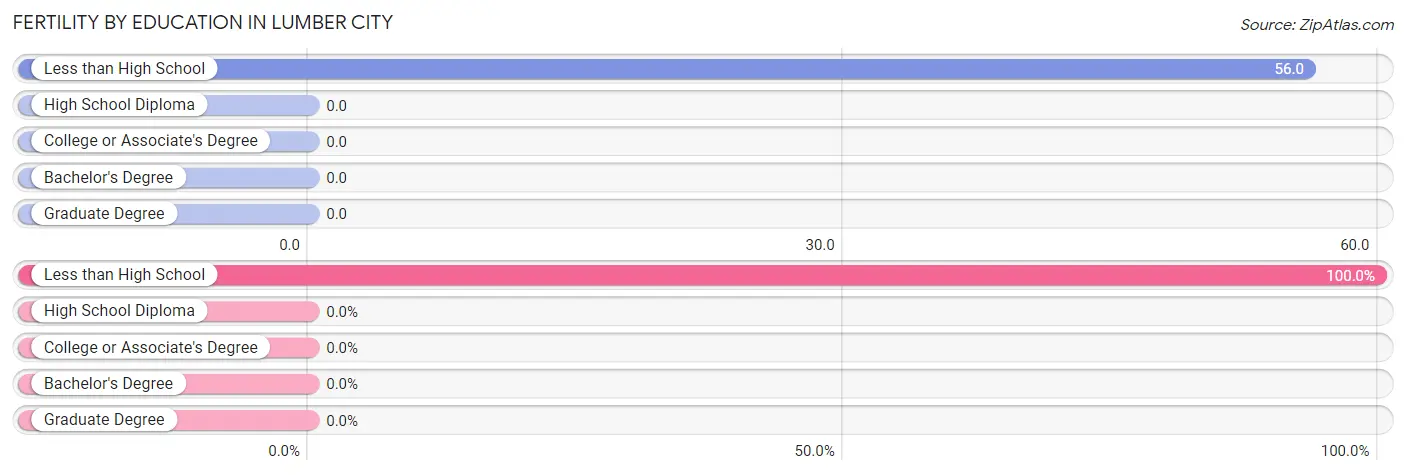
| Educational Attainment | Women with Births | Births / 1,000 Women |
| Less than High School | 2 (100.0%) | 56.0 |
| High School Diploma | 0 (0.0%) | 0.0 |
| College or Associate's Degree | 0 (0.0%) | 0.0 |
| Bachelor's Degree | 0 (0.0%) | 0.0 |
| Graduate Degree | 0 (0.0%) | 0.0 |
| Total | 2 (100.0%) | 6.0 |
Fertility by Education by Marriage Status in Lumber City
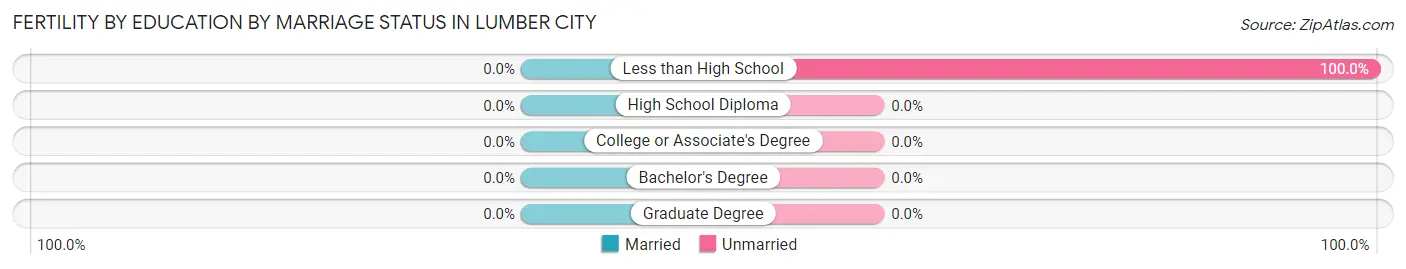
| Educational Attainment | Married | Unmarried |
| Less than High School | 0 (0.0%) | 2 (100.0%) |
| High School Diploma | 0 (0.0%) | 0 (0.0%) |
| College or Associate's Degree | 0 (0.0%) | 0 (0.0%) |
| Bachelor's Degree | 0 (0.0%) | 0 (0.0%) |
| Graduate Degree | 0 (0.0%) | 0 (0.0%) |
| Total | 0 (0.0%) | 2 (100.0%) |
Employment Characteristics in Lumber City
Employment by Class of Employer in Lumber City
Among the 344 employed individuals in Lumber City, private company employees (170 | 49.4%), not-for-profit organizations (148 | 43.0%), and state government employees (13 | 3.8%) make up the most common classes of employment.
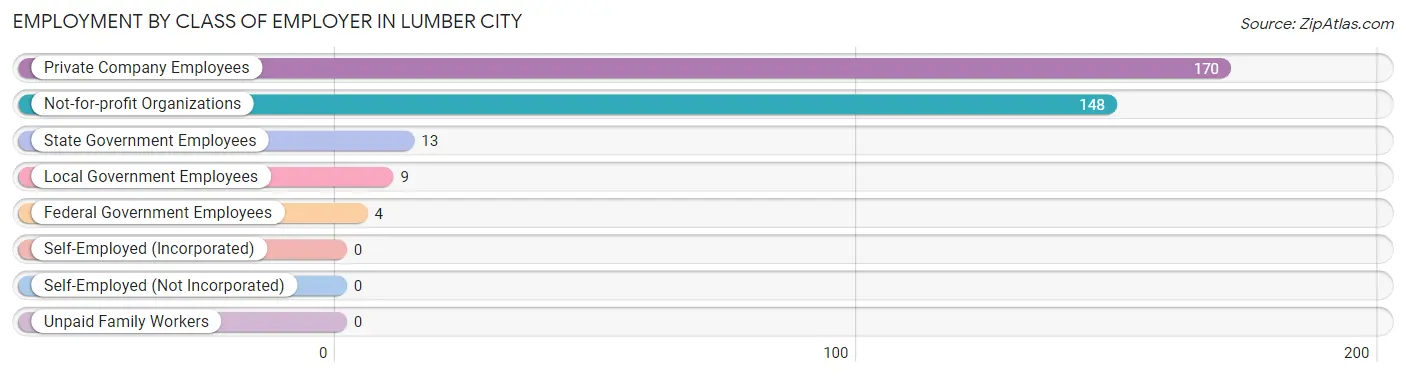
| Employer Class | # Employees | % Employees |
| Private Company Employees | 170 | 49.4% |
| Self-Employed (Incorporated) | 0 | 0.0% |
| Self-Employed (Not Incorporated) | 0 | 0.0% |
| Not-for-profit Organizations | 148 | 43.0% |
| Local Government Employees | 9 | 2.6% |
| State Government Employees | 13 | 3.8% |
| Federal Government Employees | 4 | 1.2% |
| Unpaid Family Workers | 0 | 0.0% |
| Total | 344 | 100.0% |
Employment Status by Age in Lumber City
According to the labor force statistics for Lumber City, out of the total population over 16 years of age (869), 44.4% or 386 individuals are in the labor force, with 7.3% or 28 of them unemployed. The age group with the highest labor force participation rate is 25 to 29 years, with 100.0% or 60 individuals in the labor force. Within the labor force, the 25 to 29 years age range has the highest percentage of unemployed individuals, with 46.7% or 28 of them being unemployed.
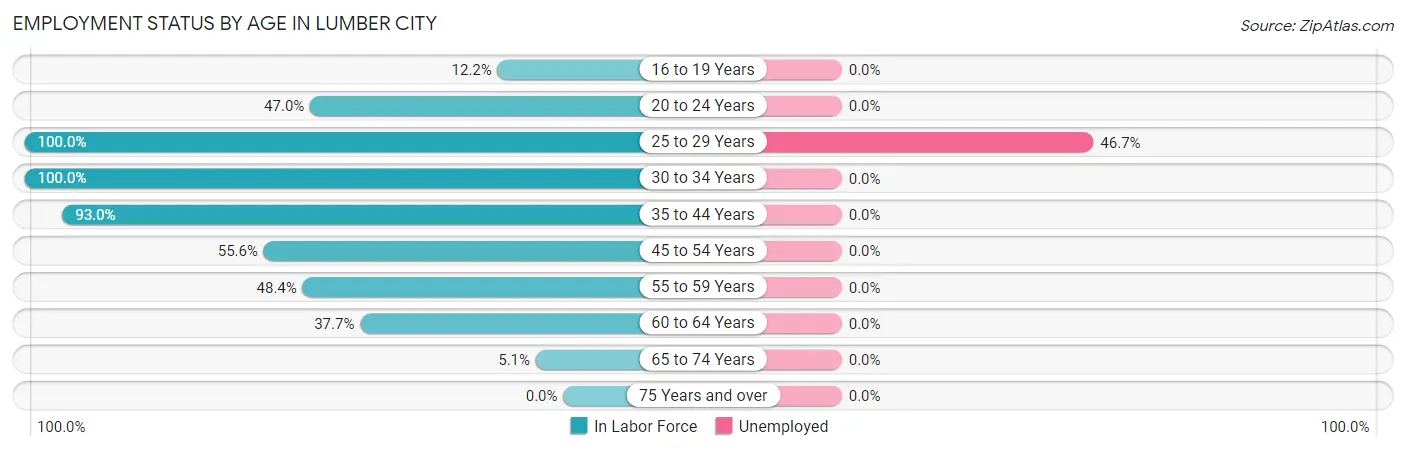
| Age Bracket | In Labor Force | Unemployed |
| 16 to 19 Years | 15 (12.2%) | 0 (0.0%) |
| 20 to 24 Years | 31 (47.0%) | 0 (0.0%) |
| 25 to 29 Years | 60 (100.0%) | 28 (46.7%) |
| 30 to 34 Years | 2 (100.0%) | 0 (0.0%) |
| 35 to 44 Years | 198 (93.0%) | 0 (0.0%) |
| 45 to 54 Years | 35 (55.6%) | 0 (0.0%) |
| 55 to 59 Years | 15 (48.4%) | 0 (0.0%) |
| 60 to 64 Years | 23 (37.7%) | 0 (0.0%) |
| 65 to 74 Years | 7 (5.1%) | 0 (0.0%) |
| 75 Years and over | 0 (0.0%) | 0 (0.0%) |
| Total | 386 (44.4%) | 28 (7.3%) |
Employment Status by Educational Attainment in Lumber City
According to labor force statistics for Lumber City, 77.4% of individuals (333) out of the total population between 25 and 64 years of age (430) are in the labor force, with 8.4% or 28 of them being unemployed. The group with the highest labor force participation rate are those with the educational attainment of college / associate degree, with 89.5% or 128 individuals in the labor force. Within the labor force, individuals with high school diploma education have the highest percentage of unemployment, with 15.6% or 28 of them being unemployed.
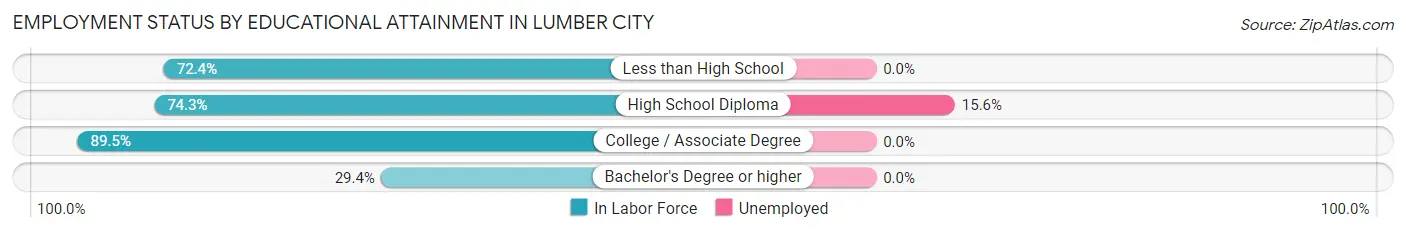
| Educational Attainment | In Labor Force | Unemployed |
| Less than High School | 21 (72.4%) | 0 (0.0%) |
| High School Diploma | 179 (74.3%) | 38 (15.6%) |
| College / Associate Degree | 128 (89.5%) | 0 (0.0%) |
| Bachelor's Degree or higher | 5 (29.4%) | 0 (0.0%) |
| Total | 333 (77.4%) | 36 (8.4%) |
Employment Occupations by Sex in Lumber City
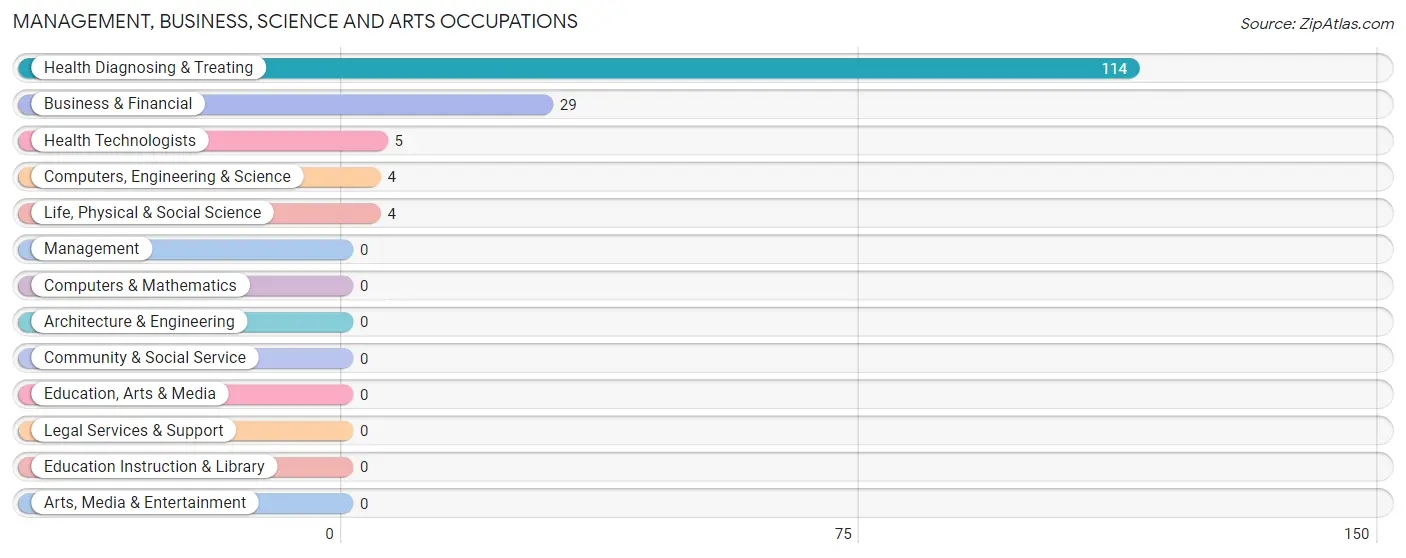
Management, Business, Science and Arts Occupations
The most common Management, Business, Science and Arts occupations in Lumber City are Health Diagnosing & Treating (114 | 31.8%), Business & Financial (29 | 8.1%), Health Technologists (5 | 1.4%), Computers, Engineering & Science (4 | 1.1%), and Life, Physical & Social Science (4 | 1.1%).
Management, Business, Science and Arts Occupations by Sex
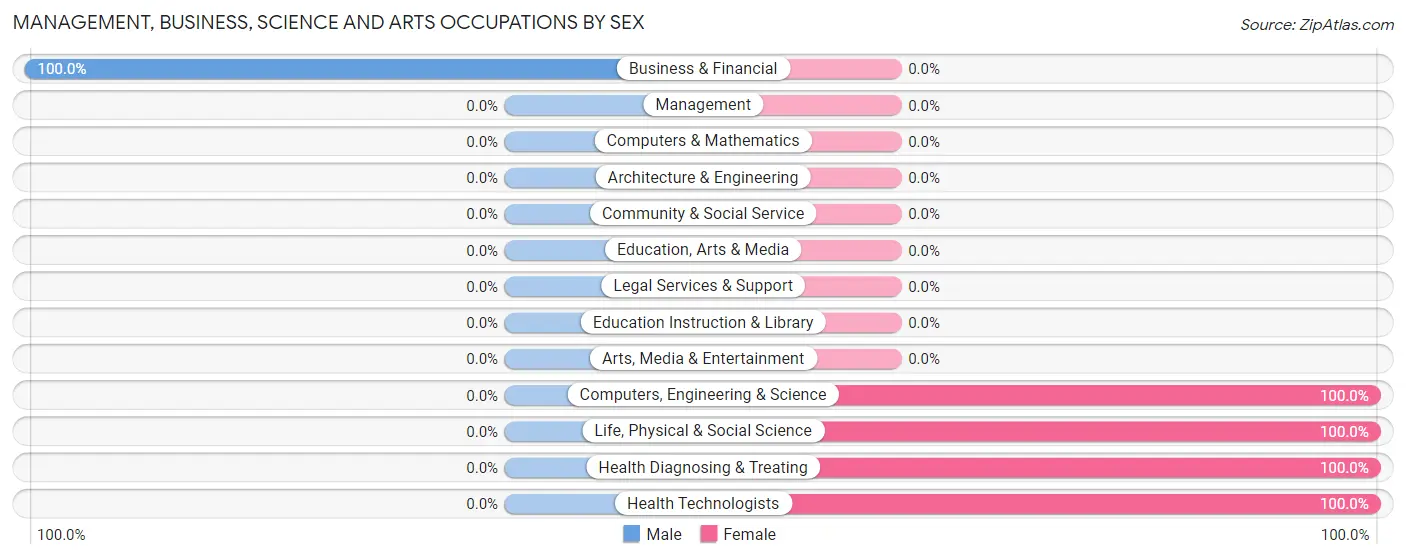
| Occupation | Male | Female |
| Management | 0 (0.0%) | 0 (0.0%) |
| Business & Financial | 29 (100.0%) | 0 (0.0%) |
| Computers, Engineering & Science | 0 (0.0%) | 4 (100.0%) |
| Computers & Mathematics | 0 (0.0%) | 0 (0.0%) |
| Architecture & Engineering | 0 (0.0%) | 0 (0.0%) |
| Life, Physical & Social Science | 0 (0.0%) | 4 (100.0%) |
| Community & Social Service | 0 (0.0%) | 0 (0.0%) |
| Education, Arts & Media | 0 (0.0%) | 0 (0.0%) |
| Legal Services & Support | 0 (0.0%) | 0 (0.0%) |
| Education Instruction & Library | 0 (0.0%) | 0 (0.0%) |
| Arts, Media & Entertainment | 0 (0.0%) | 0 (0.0%) |
| Health Diagnosing & Treating | 0 (0.0%) | 114 (100.0%) |
| Health Technologists | 0 (0.0%) | 5 (100.0%) |
| Total (Category) | 29 (19.7%) | 118 (80.3%) |
| Total (Overall) | 146 (40.8%) | 212 (59.2%) |
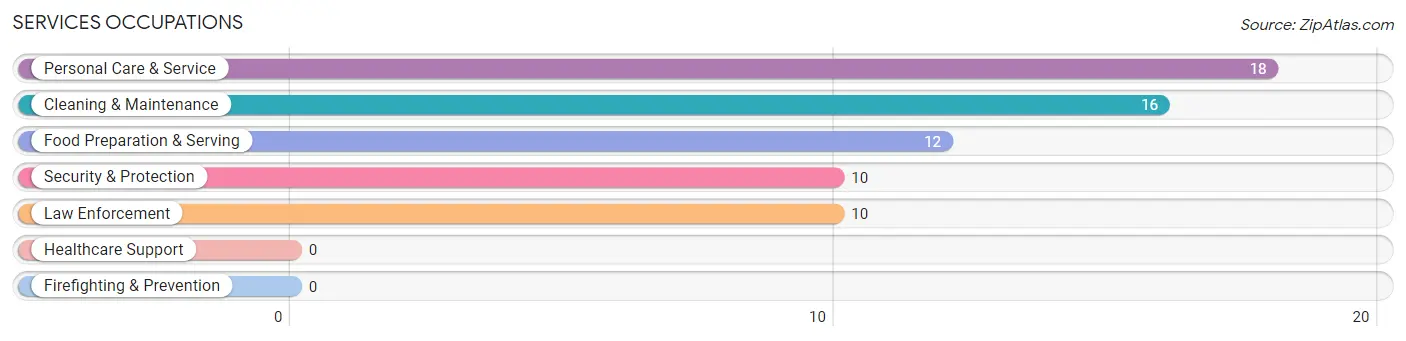
Services Occupations
The most common Services occupations in Lumber City are Personal Care & Service (18 | 5.0%), Cleaning & Maintenance (16 | 4.5%), Food Preparation & Serving (12 | 3.4%), Security & Protection (10 | 2.8%), and Law Enforcement (10 | 2.8%).
Services Occupations by Sex
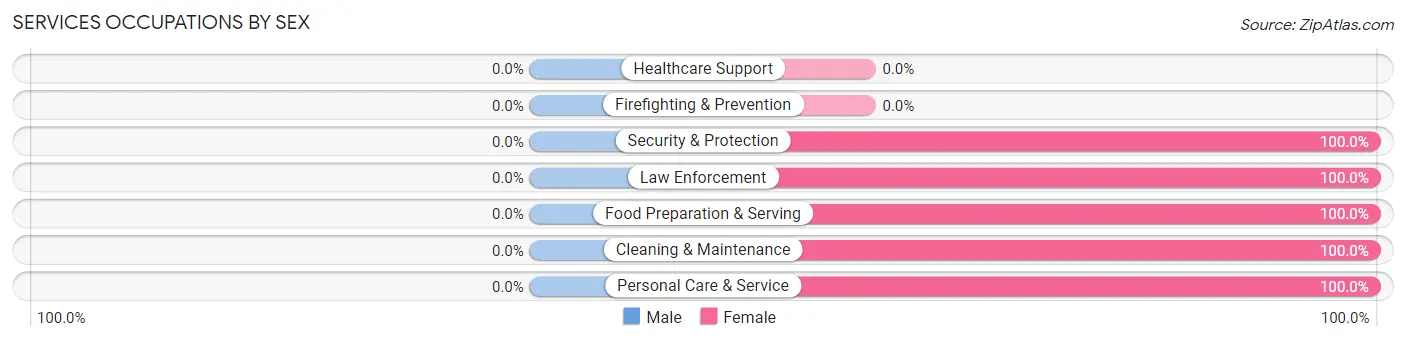
| Occupation | Male | Female |
| Healthcare Support | 0 (0.0%) | 0 (0.0%) |
| Security & Protection | 0 (0.0%) | 10 (100.0%) |
| Firefighting & Prevention | 0 (0.0%) | 0 (0.0%) |
| Law Enforcement | 0 (0.0%) | 10 (100.0%) |
| Food Preparation & Serving | 0 (0.0%) | 12 (100.0%) |
| Cleaning & Maintenance | 0 (0.0%) | 16 (100.0%) |
| Personal Care & Service | 0 (0.0%) | 18 (100.0%) |
| Total (Category) | 0 (0.0%) | 56 (100.0%) |
| Total (Overall) | 146 (40.8%) | 212 (59.2%) |
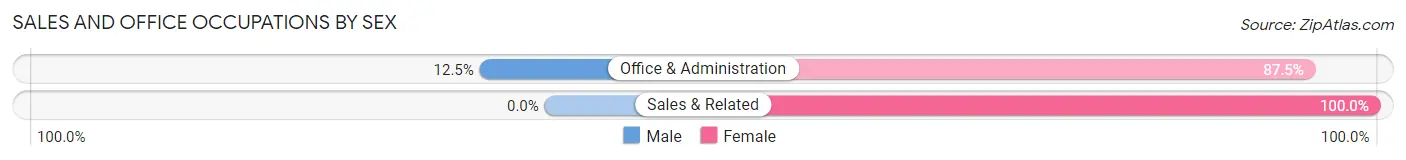
Sales and Office Occupations
The most common Sales and Office occupations in Lumber City are Sales & Related (24 | 6.7%), and Office & Administration (8 | 2.2%).
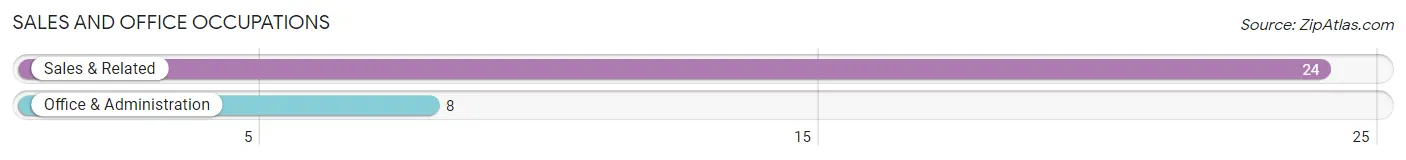
Sales and Office Occupations by Sex
| Occupation | Male | Female |
| Sales & Related | 0 (0.0%) | 24 (100.0%) |
| Office & Administration | 1 (12.5%) | 7 (87.5%) |
| Total (Category) | 1 (3.1%) | 31 (96.9%) |
| Total (Overall) | 146 (40.8%) | 212 (59.2%) |
Natural Resources, Construction and Maintenance Occupations
The most common Natural Resources, Construction and Maintenance occupations in Lumber City are Construction & Extraction (23 | 6.4%), and Farming, Fishing & Forestry (5 | 1.4%).
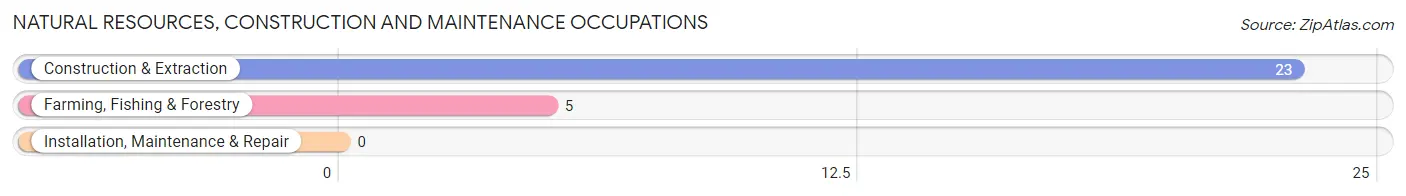
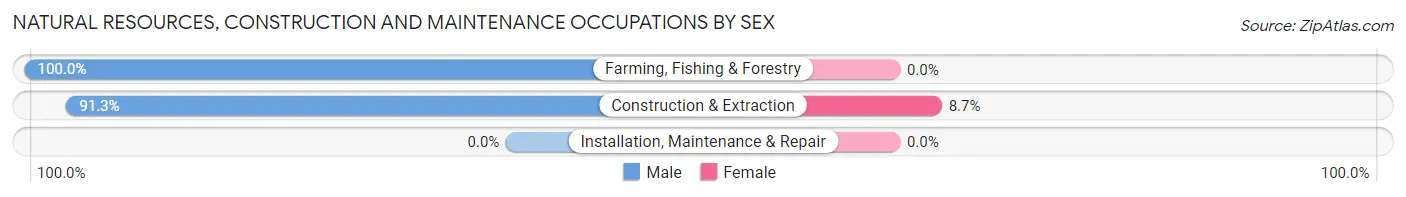
Natural Resources, Construction and Maintenance Occupations by Sex
| Occupation | Male | Female |
| Farming, Fishing & Forestry | 5 (100.0%) | 0 (0.0%) |
| Construction & Extraction | 21 (91.3%) | 2 (8.7%) |
| Installation, Maintenance & Repair | 0 (0.0%) | 0 (0.0%) |
| Total (Category) | 26 (92.9%) | 2 (7.1%) |
| Total (Overall) | 146 (40.8%) | 212 (59.2%) |
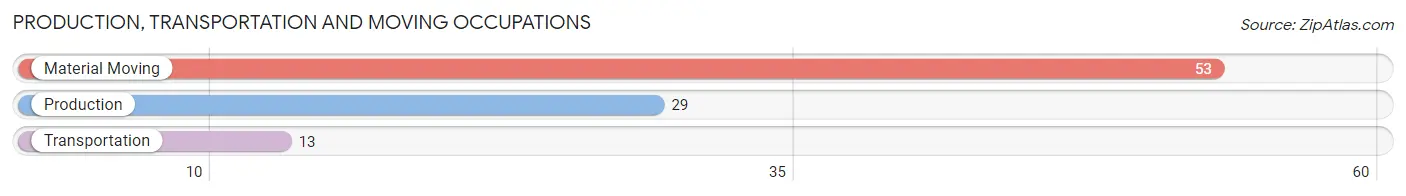
Production, Transportation and Moving Occupations
The most common Production, Transportation and Moving occupations in Lumber City are Material Moving (53 | 14.8%), Production (29 | 8.1%), and Transportation (13 | 3.6%).
Production, Transportation and Moving Occupations by Sex
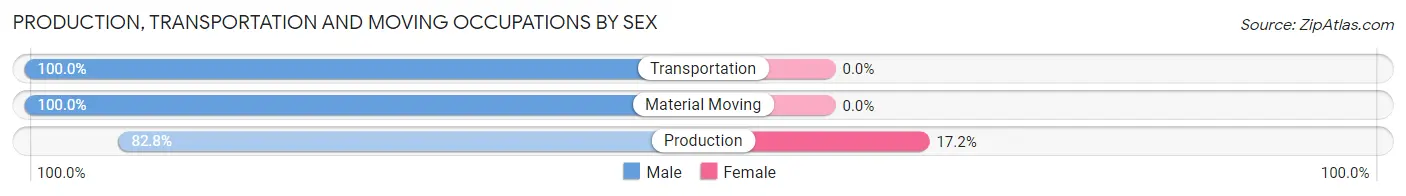
| Occupation | Male | Female |
| Production | 24 (82.8%) | 5 (17.2%) |
| Transportation | 13 (100.0%) | 0 (0.0%) |
| Material Moving | 53 (100.0%) | 0 (0.0%) |
| Total (Category) | 90 (94.7%) | 5 (5.3%) |
| Total (Overall) | 146 (40.8%) | 212 (59.2%) |
Employment Industries by Sex in Lumber City
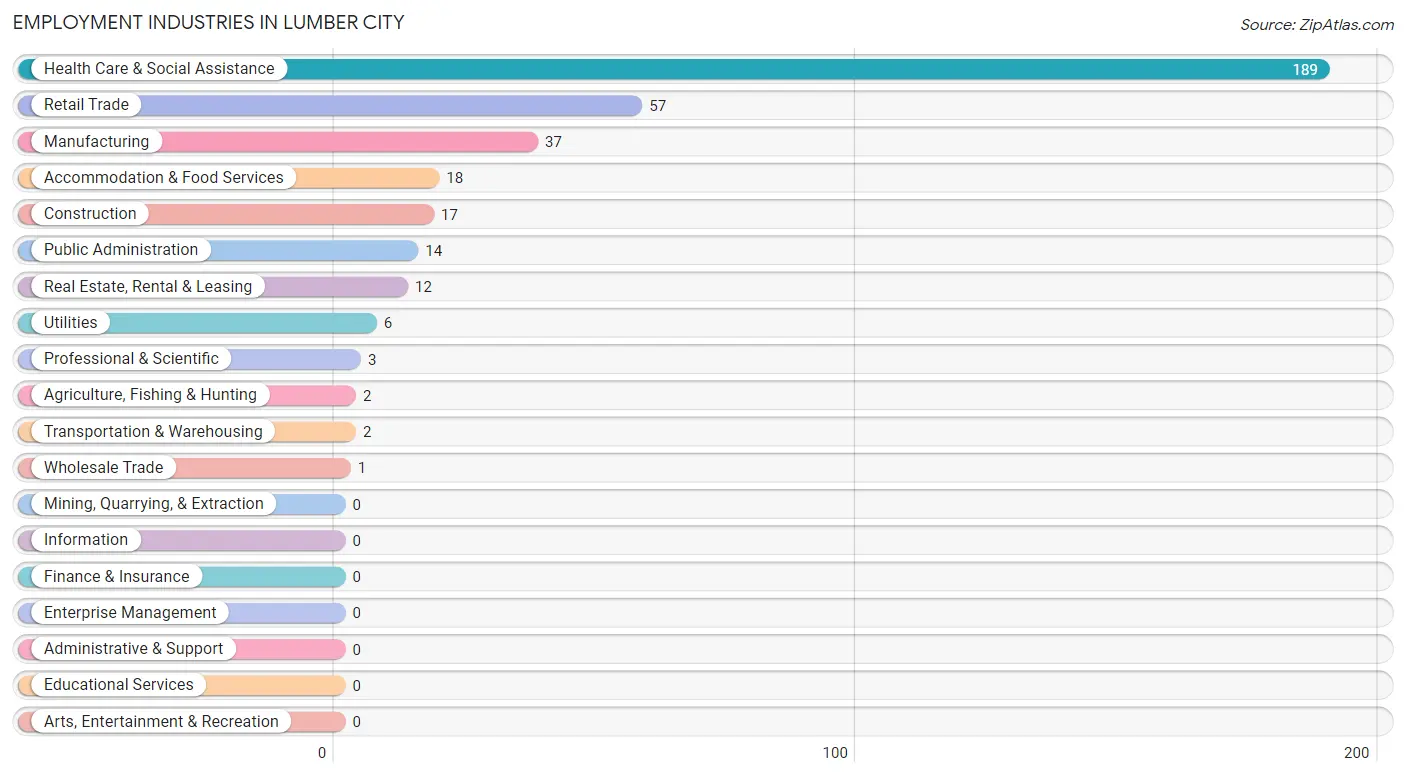
Employment Industries in Lumber City
The major employment industries in Lumber City include Health Care & Social Assistance (189 | 52.8%), Retail Trade (57 | 15.9%), Manufacturing (37 | 10.3%), Accommodation & Food Services (18 | 5.0%), and Construction (17 | 4.8%).
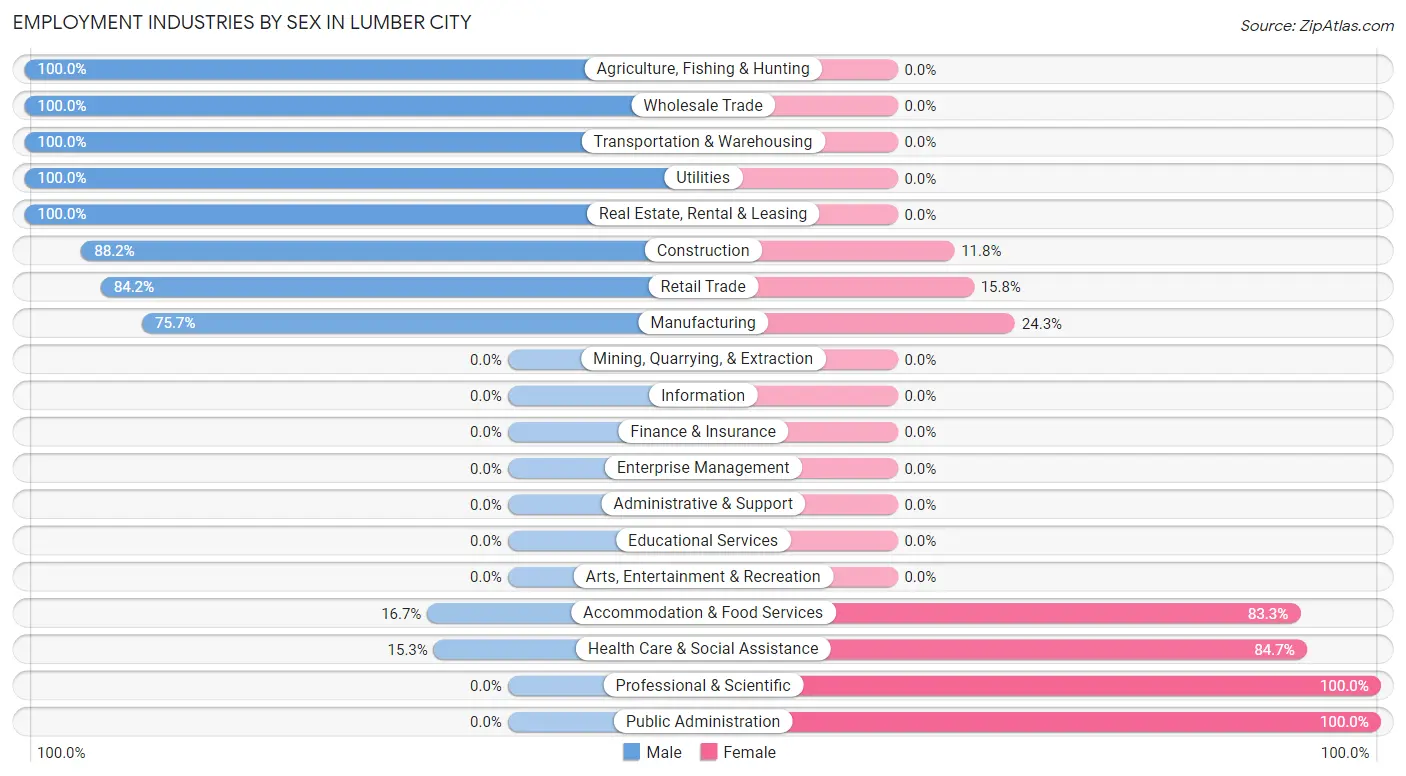
Employment Industries by Sex in Lumber City
The Lumber City industries that see more men than women are Agriculture, Fishing & Hunting (100.0%), Wholesale Trade (100.0%), and Transportation & Warehousing (100.0%), whereas the industries that tend to have a higher number of women are Professional & Scientific (100.0%), Public Administration (100.0%), and Health Care & Social Assistance (84.7%).
| Industry | Male | Female |
| Agriculture, Fishing & Hunting | 2 (100.0%) | 0 (0.0%) |
| Mining, Quarrying, & Extraction | 0 (0.0%) | 0 (0.0%) |
| Construction | 15 (88.2%) | 2 (11.8%) |
| Manufacturing | 28 (75.7%) | 9 (24.3%) |
| Wholesale Trade | 1 (100.0%) | 0 (0.0%) |
| Retail Trade | 48 (84.2%) | 9 (15.8%) |
| Transportation & Warehousing | 2 (100.0%) | 0 (0.0%) |
| Utilities | 6 (100.0%) | 0 (0.0%) |
| Information | 0 (0.0%) | 0 (0.0%) |
| Finance & Insurance | 0 (0.0%) | 0 (0.0%) |
| Real Estate, Rental & Leasing | 12 (100.0%) | 0 (0.0%) |
| Professional & Scientific | 0 (0.0%) | 3 (100.0%) |
| Enterprise Management | 0 (0.0%) | 0 (0.0%) |
| Administrative & Support | 0 (0.0%) | 0 (0.0%) |
| Educational Services | 0 (0.0%) | 0 (0.0%) |
| Health Care & Social Assistance | 29 (15.3%) | 160 (84.7%) |
| Arts, Entertainment & Recreation | 0 (0.0%) | 0 (0.0%) |
| Accommodation & Food Services | 3 (16.7%) | 15 (83.3%) |
| Public Administration | 0 (0.0%) | 14 (100.0%) |
| Total | 146 (40.8%) | 212 (59.2%) |
Education in Lumber City
School Enrollment in Lumber City
The most common levels of schooling among the 363 students in Lumber City are college / undergraduate (112 | 30.8%), elementary school (89 | 24.5%), and middle school (73 | 20.1%).
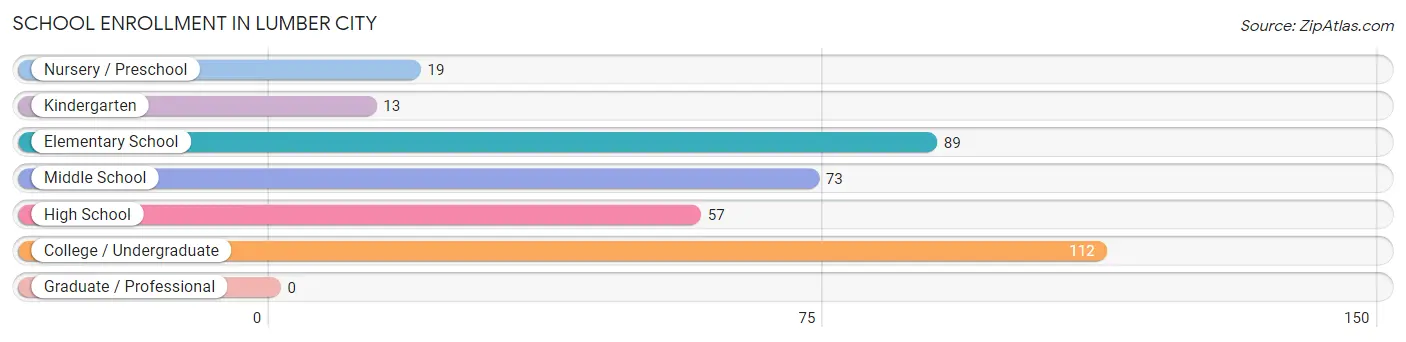
| School Level | # Students | % Students |
| Nursery / Preschool | 19 | 5.2% |
| Kindergarten | 13 | 3.6% |
| Elementary School | 89 | 24.5% |
| Middle School | 73 | 20.1% |
| High School | 57 | 15.7% |
| College / Undergraduate | 112 | 30.8% |
| Graduate / Professional | 0 | 0.0% |
| Total | 363 | 100.0% |
School Enrollment by Age by Funding Source in Lumber City
Out of a total of 363 students who are enrolled in schools in Lumber City, 92 (25.3%) attend a private institution, while the remaining 271 (74.7%) are enrolled in public schools. The age group of 18 to 19 year olds has the highest likelihood of being enrolled in private schools, with 74 (100.0% in the age bracket) enrolled. Conversely, the age group of 5 to 9 year old has the lowest likelihood of being enrolled in a private school, with 89 (100.0% in the age bracket) attending a public institution.
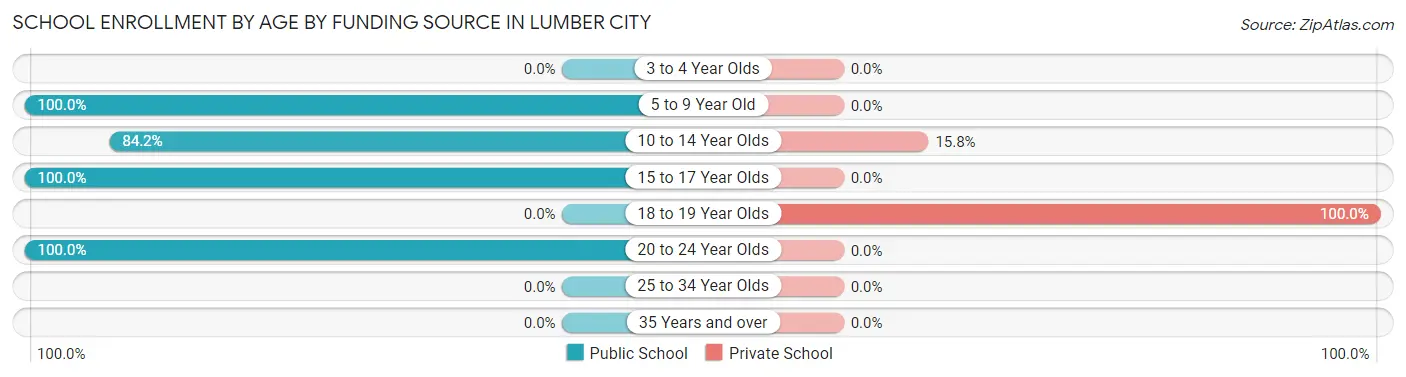
| Age Bracket | Public School | Private School |
| 3 to 4 Year Olds | 0 (0.0%) | 0 (0.0%) |
| 5 to 9 Year Old | 89 (100.0%) | 0 (0.0%) |
| 10 to 14 Year Olds | 96 (84.2%) | 18 (15.8%) |
| 15 to 17 Year Olds | 48 (100.0%) | 0 (0.0%) |
| 18 to 19 Year Olds | 0 (0.0%) | 74 (100.0%) |
| 20 to 24 Year Olds | 38 (100.0%) | 0 (0.0%) |
| 25 to 34 Year Olds | 0 (0.0%) | 0 (0.0%) |
| 35 Years and over | 0 (0.0%) | 0 (0.0%) |
| Total | 271 (74.7%) | 92 (25.3%) |
Educational Attainment by Field of Study in Lumber City
Bio, nature & agricultural (12 | 41.4%), visual & performing arts (10 | 34.5%), science & technology (5 | 17.2%), and social sciences (2 | 6.9%) are the most common fields of study among 29 individuals in Lumber City who have obtained a bachelor's degree or higher.
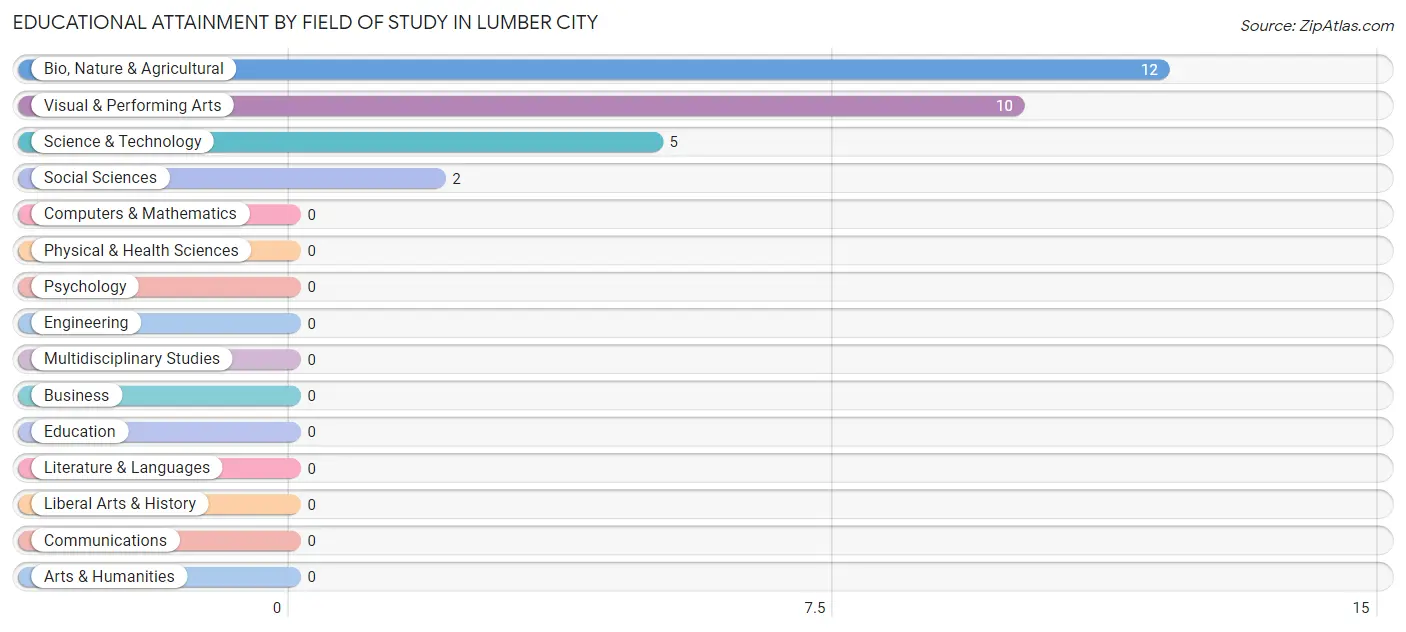
| Field of Study | # Graduates | % Graduates |
| Computers & Mathematics | 0 | 0.0% |
| Bio, Nature & Agricultural | 12 | 41.4% |
| Physical & Health Sciences | 0 | 0.0% |
| Psychology | 0 | 0.0% |
| Social Sciences | 2 | 6.9% |
| Engineering | 0 | 0.0% |
| Multidisciplinary Studies | 0 | 0.0% |
| Science & Technology | 5 | 17.2% |
| Business | 0 | 0.0% |
| Education | 0 | 0.0% |
| Literature & Languages | 0 | 0.0% |
| Liberal Arts & History | 0 | 0.0% |
| Visual & Performing Arts | 10 | 34.5% |
| Communications | 0 | 0.0% |
| Arts & Humanities | 0 | 0.0% |
| Total | 29 | 100.0% |
Transportation & Commute in Lumber City
Vehicle Availability by Sex in Lumber City
The most prevalent vehicle ownership categories in Lumber City are males with 2 vehicles (104, accounting for 77.6%) and females with 2 vehicles (83, making up 49.5%).
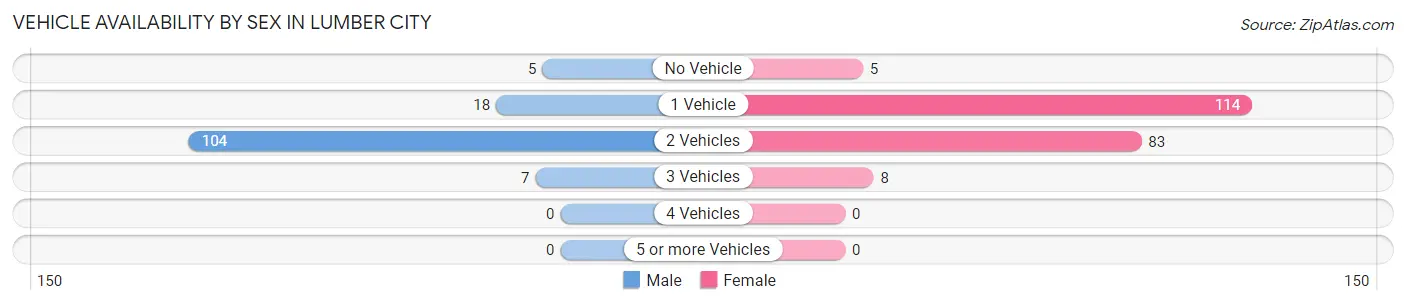
| Vehicles Available | Male | Female |
| No Vehicle | 5 (3.7%) | 5 (2.4%) |
| 1 Vehicle | 18 (13.4%) | 114 (54.3%) |
| 2 Vehicles | 104 (77.6%) | 83 (39.5%) |
| 3 Vehicles | 7 (5.2%) | 8 (3.8%) |
| 4 Vehicles | 0 (0.0%) | 0 (0.0%) |
| 5 or more Vehicles | 0 (0.0%) | 0 (0.0%) |
| Total | 134 (100.0%) | 210 (100.0%) |
Commute Time in Lumber City
The most frequently occuring commute durations in Lumber City are 10 to 14 minutes (161 commuters, 46.8%), 20 to 24 minutes (66 commuters, 19.2%), and 15 to 19 minutes (31 commuters, 9.0%).
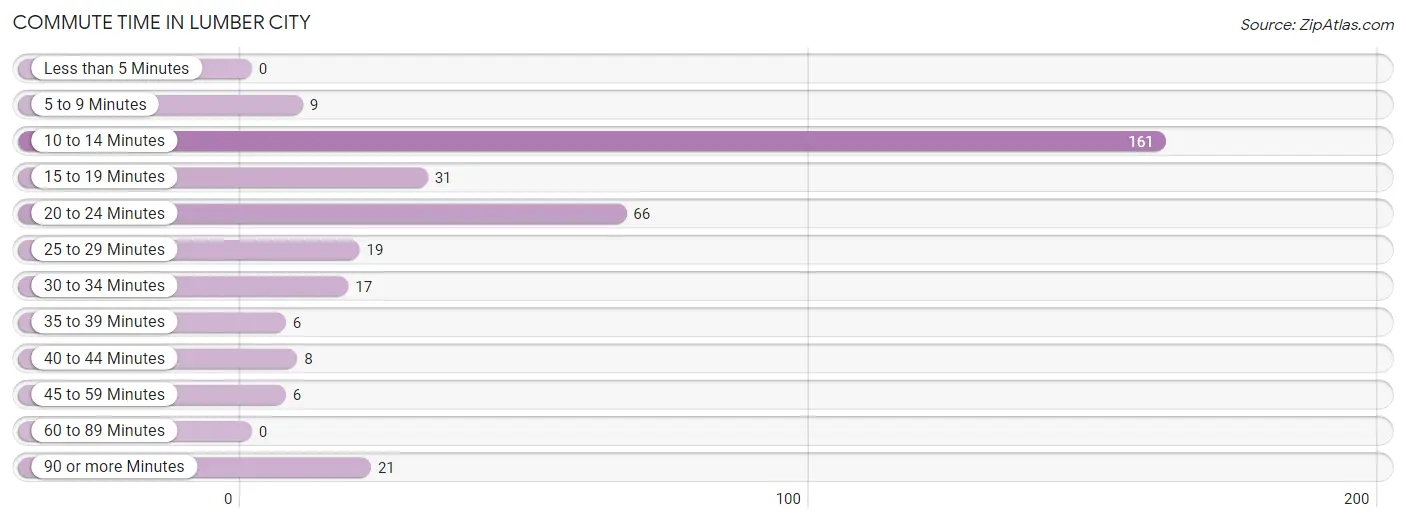
| Commute Time | # Commuters | % Commuters |
| Less than 5 Minutes | 0 | 0.0% |
| 5 to 9 Minutes | 9 | 2.6% |
| 10 to 14 Minutes | 161 | 46.8% |
| 15 to 19 Minutes | 31 | 9.0% |
| 20 to 24 Minutes | 66 | 19.2% |
| 25 to 29 Minutes | 19 | 5.5% |
| 30 to 34 Minutes | 17 | 4.9% |
| 35 to 39 Minutes | 6 | 1.7% |
| 40 to 44 Minutes | 8 | 2.3% |
| 45 to 59 Minutes | 6 | 1.7% |
| 60 to 89 Minutes | 0 | 0.0% |
| 90 or more Minutes | 21 | 6.1% |
Commute Time by Sex in Lumber City
The most common commute times in Lumber City are 20 to 24 minutes (50 commuters, 37.3%) for males and 10 to 14 minutes (116 commuters, 55.2%) for females.
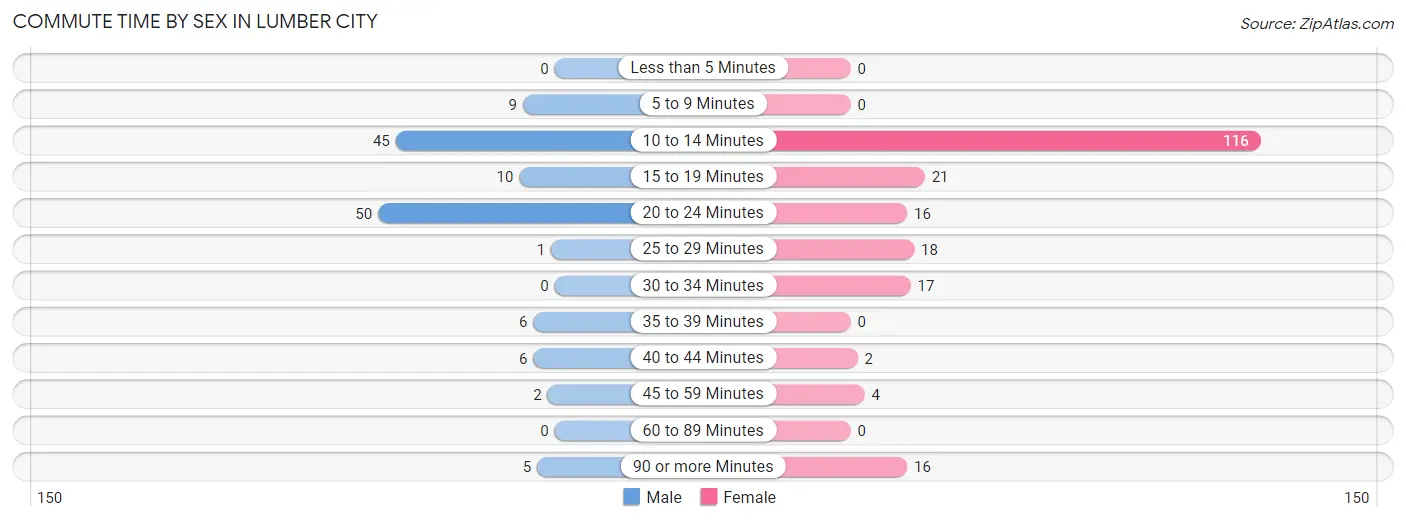
| Commute Time | Male | Female |
| Less than 5 Minutes | 0 (0.0%) | 0 (0.0%) |
| 5 to 9 Minutes | 9 (6.7%) | 0 (0.0%) |
| 10 to 14 Minutes | 45 (33.6%) | 116 (55.2%) |
| 15 to 19 Minutes | 10 (7.5%) | 21 (10.0%) |
| 20 to 24 Minutes | 50 (37.3%) | 16 (7.6%) |
| 25 to 29 Minutes | 1 (0.7%) | 18 (8.6%) |
| 30 to 34 Minutes | 0 (0.0%) | 17 (8.1%) |
| 35 to 39 Minutes | 6 (4.5%) | 0 (0.0%) |
| 40 to 44 Minutes | 6 (4.5%) | 2 (0.9%) |
| 45 to 59 Minutes | 2 (1.5%) | 4 (1.9%) |
| 60 to 89 Minutes | 0 (0.0%) | 0 (0.0%) |
| 90 or more Minutes | 5 (3.7%) | 16 (7.6%) |
Time of Departure to Work by Sex in Lumber City
The most frequent times of departure to work in Lumber City are 12:00 AM to 4:59 AM (55, 41.0%) for males and 7:00 AM to 7:29 AM (116, 55.2%) for females.
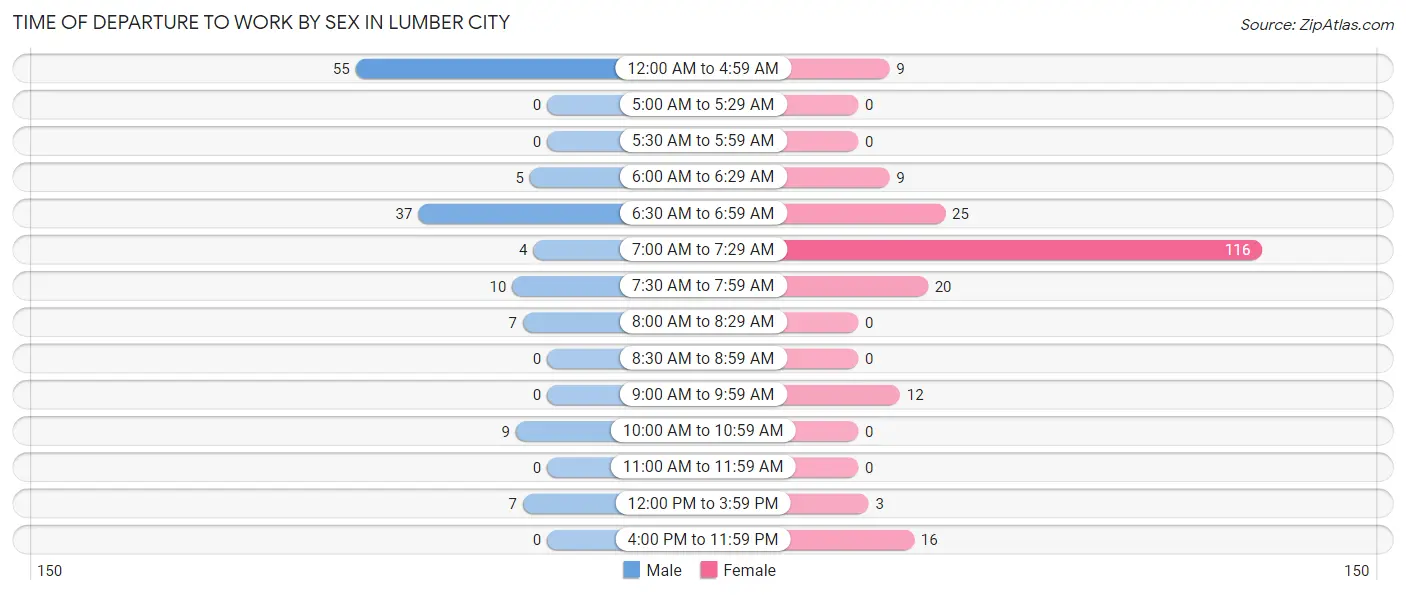
| Time of Departure | Male | Female |
| 12:00 AM to 4:59 AM | 55 (41.0%) | 9 (4.3%) |
| 5:00 AM to 5:29 AM | 0 (0.0%) | 0 (0.0%) |
| 5:30 AM to 5:59 AM | 0 (0.0%) | 0 (0.0%) |
| 6:00 AM to 6:29 AM | 5 (3.7%) | 9 (4.3%) |
| 6:30 AM to 6:59 AM | 37 (27.6%) | 25 (11.9%) |
| 7:00 AM to 7:29 AM | 4 (3.0%) | 116 (55.2%) |
| 7:30 AM to 7:59 AM | 10 (7.5%) | 20 (9.5%) |
| 8:00 AM to 8:29 AM | 7 (5.2%) | 0 (0.0%) |
| 8:30 AM to 8:59 AM | 0 (0.0%) | 0 (0.0%) |
| 9:00 AM to 9:59 AM | 0 (0.0%) | 12 (5.7%) |
| 10:00 AM to 10:59 AM | 9 (6.7%) | 0 (0.0%) |
| 11:00 AM to 11:59 AM | 0 (0.0%) | 0 (0.0%) |
| 12:00 PM to 3:59 PM | 7 (5.2%) | 3 (1.4%) |
| 4:00 PM to 11:59 PM | 0 (0.0%) | 16 (7.6%) |
| Total | 134 (100.0%) | 210 (100.0%) |
Housing Occupancy in Lumber City
Occupancy by Ownership in Lumber City
Of the total 290 dwellings in Lumber City, owner-occupied units account for 149 (51.4%), while renter-occupied units make up 141 (48.6%).
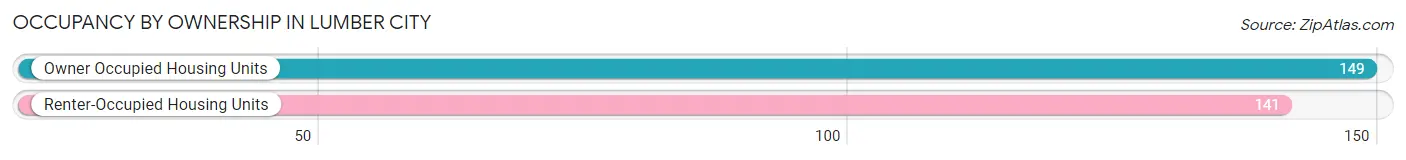
| Occupancy | # Housing Units | % Housing Units |
| Owner Occupied Housing Units | 149 | 51.4% |
| Renter-Occupied Housing Units | 141 | 48.6% |
| Total Occupied Housing Units | 290 | 100.0% |
Occupancy by Household Size in Lumber City
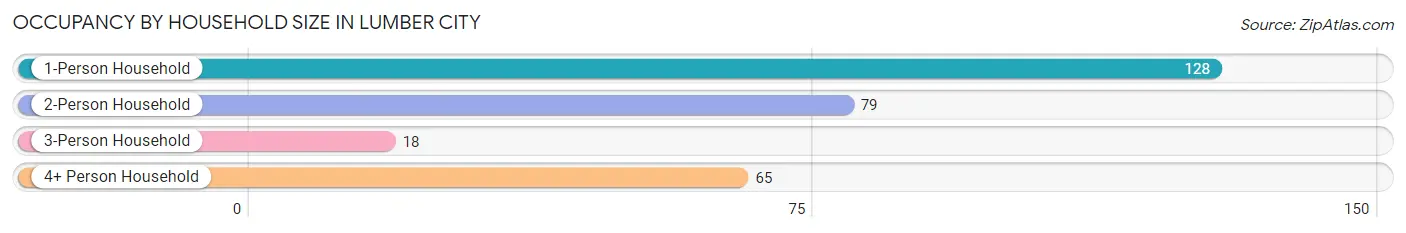
| Household Size | # Housing Units | % Housing Units |
| 1-Person Household | 128 | 44.1% |
| 2-Person Household | 79 | 27.2% |
| 3-Person Household | 18 | 6.2% |
| 4+ Person Household | 65 | 22.4% |
| Total Housing Units | 290 | 100.0% |
Occupancy by Ownership by Household Size in Lumber City
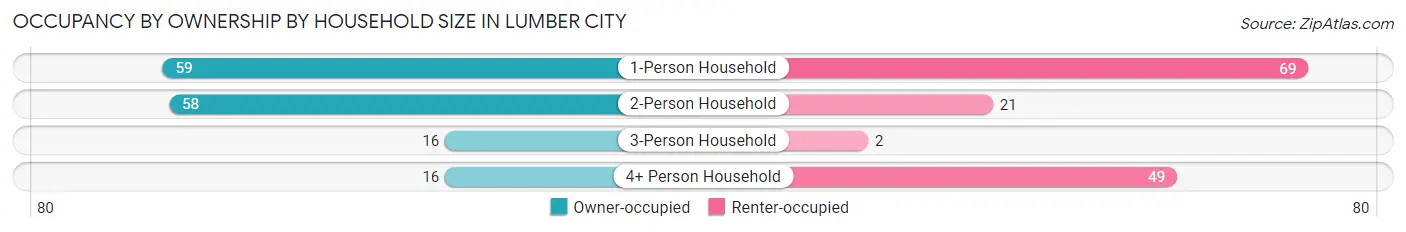
| Household Size | Owner-occupied | Renter-occupied |
| 1-Person Household | 59 (46.1%) | 69 (53.9%) |
| 2-Person Household | 58 (73.4%) | 21 (26.6%) |
| 3-Person Household | 16 (88.9%) | 2 (11.1%) |
| 4+ Person Household | 16 (24.6%) | 49 (75.4%) |
| Total Housing Units | 149 (51.4%) | 141 (48.6%) |
Occupancy by Educational Attainment in Lumber City
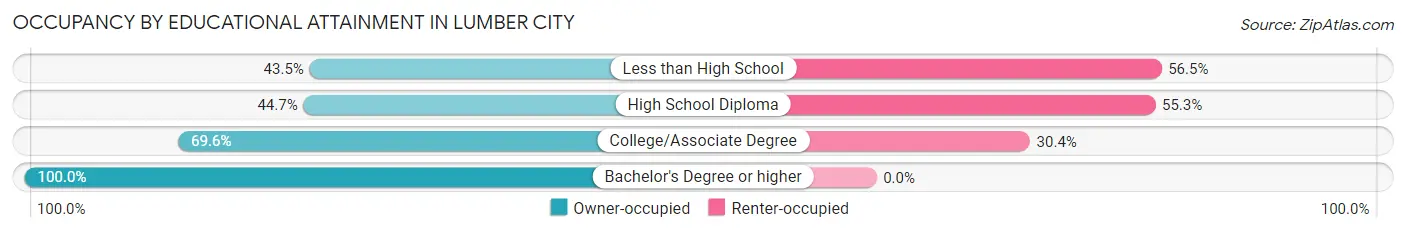
| Household Size | Owner-occupied | Renter-occupied |
| Less than High School | 20 (43.5%) | 26 (56.5%) |
| High School Diploma | 76 (44.7%) | 94 (55.3%) |
| College/Associate Degree | 48 (69.6%) | 21 (30.4%) |
| Bachelor's Degree or higher | 5 (100.0%) | 0 (0.0%) |
Occupancy by Age of Householder in Lumber City
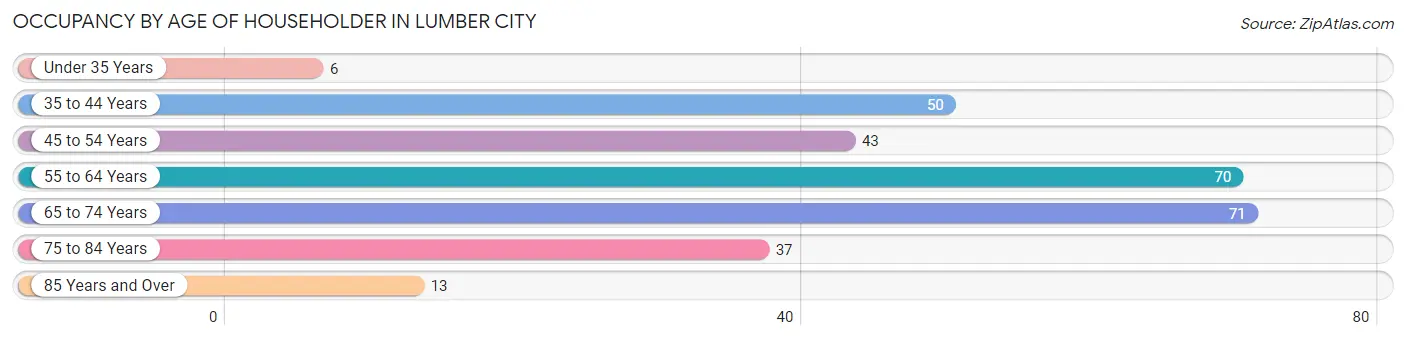
| Age Bracket | # Households | % Households |
| Under 35 Years | 6 | 2.1% |
| 35 to 44 Years | 50 | 17.2% |
| 45 to 54 Years | 43 | 14.8% |
| 55 to 64 Years | 70 | 24.1% |
| 65 to 74 Years | 71 | 24.5% |
| 75 to 84 Years | 37 | 12.8% |
| 85 Years and Over | 13 | 4.5% |
| Total | 290 | 100.0% |
Housing Finances in Lumber City
Median Income by Occupancy in Lumber City
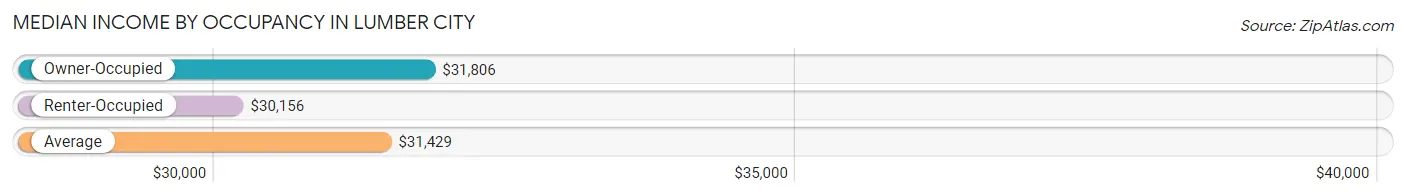
| Occupancy Type | # Households | Median Income |
| Owner-Occupied | 149 (51.4%) | $31,806 |
| Renter-Occupied | 141 (48.6%) | $30,156 |
| Average | 290 (100.0%) | $31,429 |
Occupancy by Householder Income Bracket in Lumber City
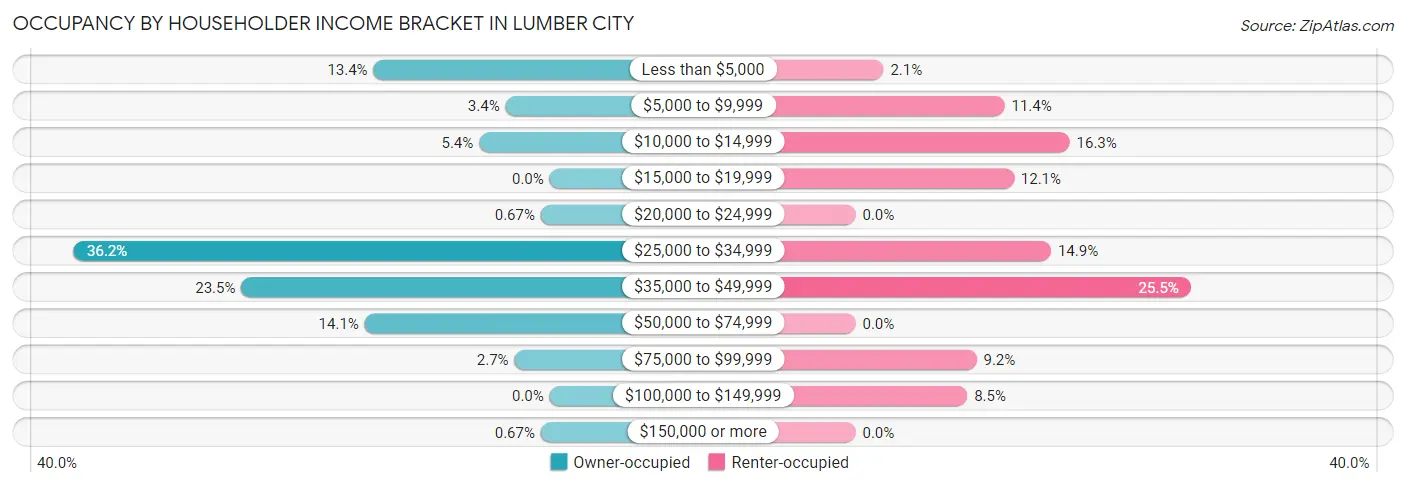
| Income Bracket | Owner-occupied | Renter-occupied |
| Less than $5,000 | 20 (13.4%) | 3 (2.1%) |
| $5,000 to $9,999 | 5 (3.4%) | 16 (11.4%) |
| $10,000 to $14,999 | 8 (5.4%) | 23 (16.3%) |
| $15,000 to $19,999 | 0 (0.0%) | 17 (12.1%) |
| $20,000 to $24,999 | 1 (0.7%) | 0 (0.0%) |
| $25,000 to $34,999 | 54 (36.2%) | 21 (14.9%) |
| $35,000 to $49,999 | 35 (23.5%) | 36 (25.5%) |
| $50,000 to $74,999 | 21 (14.1%) | 0 (0.0%) |
| $75,000 to $99,999 | 4 (2.7%) | 13 (9.2%) |
| $100,000 to $149,999 | 0 (0.0%) | 12 (8.5%) |
| $150,000 or more | 1 (0.7%) | 0 (0.0%) |
| Total | 149 (100.0%) | 141 (100.0%) |
Monthly Housing Cost Tiers in Lumber City
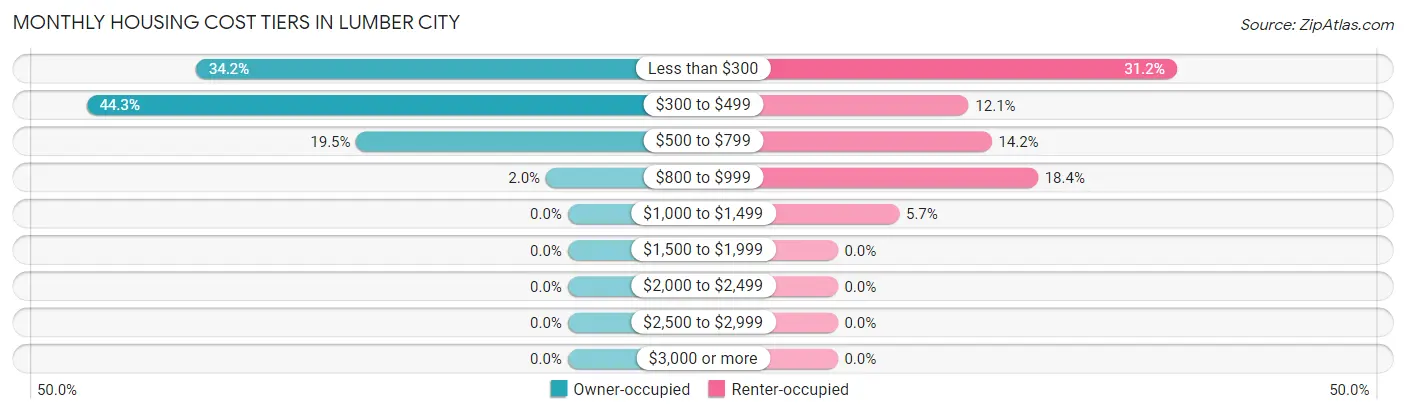
| Monthly Cost | Owner-occupied | Renter-occupied |
| Less than $300 | 51 (34.2%) | 44 (31.2%) |
| $300 to $499 | 66 (44.3%) | 17 (12.1%) |
| $500 to $799 | 29 (19.5%) | 20 (14.2%) |
| $800 to $999 | 3 (2.0%) | 26 (18.4%) |
| $1,000 to $1,499 | 0 (0.0%) | 8 (5.7%) |
| $1,500 to $1,999 | 0 (0.0%) | 0 (0.0%) |
| $2,000 to $2,499 | 0 (0.0%) | 0 (0.0%) |
| $2,500 to $2,999 | 0 (0.0%) | 0 (0.0%) |
| $3,000 or more | 0 (0.0%) | 0 (0.0%) |
| Total | 149 (100.0%) | 141 (100.0%) |
Physical Housing Characteristics in Lumber City
Housing Structures in Lumber City
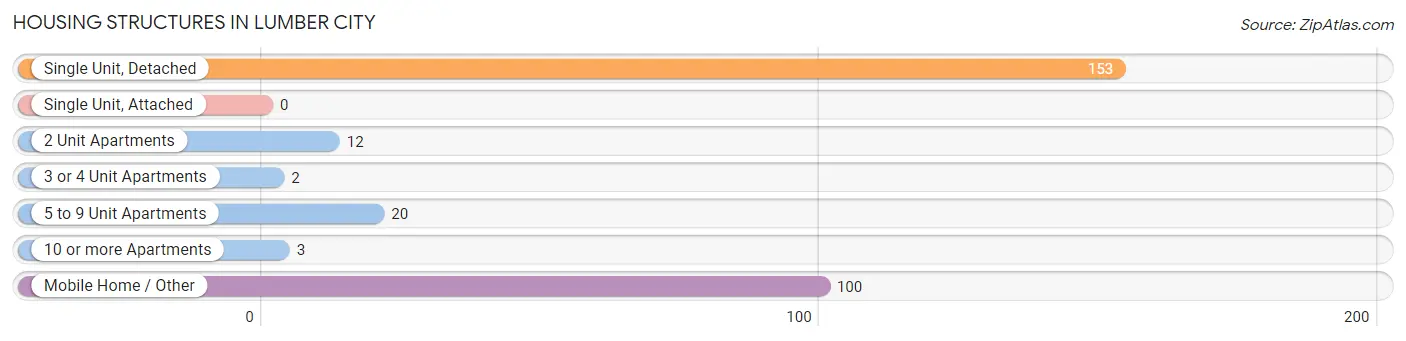
| Structure Type | # Housing Units | % Housing Units |
| Single Unit, Detached | 153 | 52.8% |
| Single Unit, Attached | 0 | 0.0% |
| 2 Unit Apartments | 12 | 4.1% |
| 3 or 4 Unit Apartments | 2 | 0.7% |
| 5 to 9 Unit Apartments | 20 | 6.9% |
| 10 or more Apartments | 3 | 1.0% |
| Mobile Home / Other | 100 | 34.5% |
| Total | 290 | 100.0% |
Housing Structures by Occupancy in Lumber City
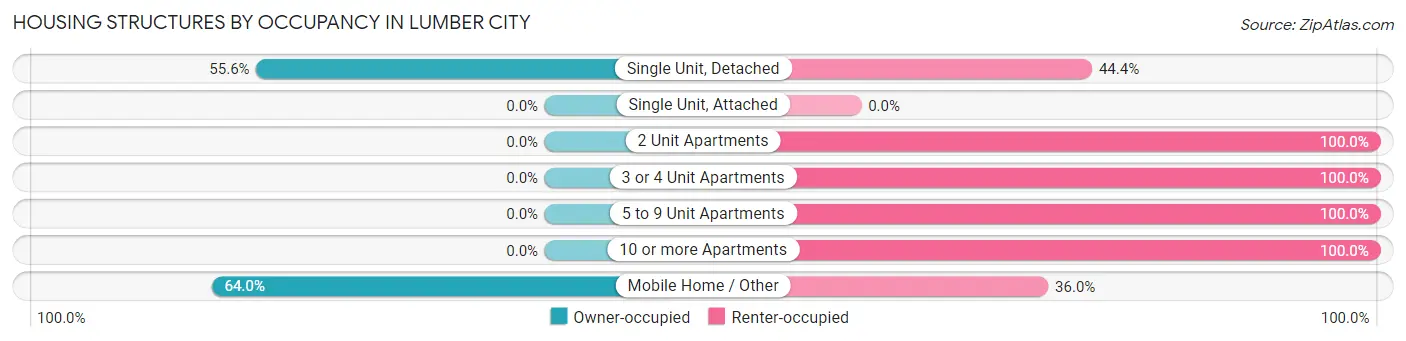
| Structure Type | Owner-occupied | Renter-occupied |
| Single Unit, Detached | 85 (55.6%) | 68 (44.4%) |
| Single Unit, Attached | 0 (0.0%) | 0 (0.0%) |
| 2 Unit Apartments | 0 (0.0%) | 12 (100.0%) |
| 3 or 4 Unit Apartments | 0 (0.0%) | 2 (100.0%) |
| 5 to 9 Unit Apartments | 0 (0.0%) | 20 (100.0%) |
| 10 or more Apartments | 0 (0.0%) | 3 (100.0%) |
| Mobile Home / Other | 64 (64.0%) | 36 (36.0%) |
| Total | 149 (51.4%) | 141 (48.6%) |
Housing Structures by Number of Rooms in Lumber City
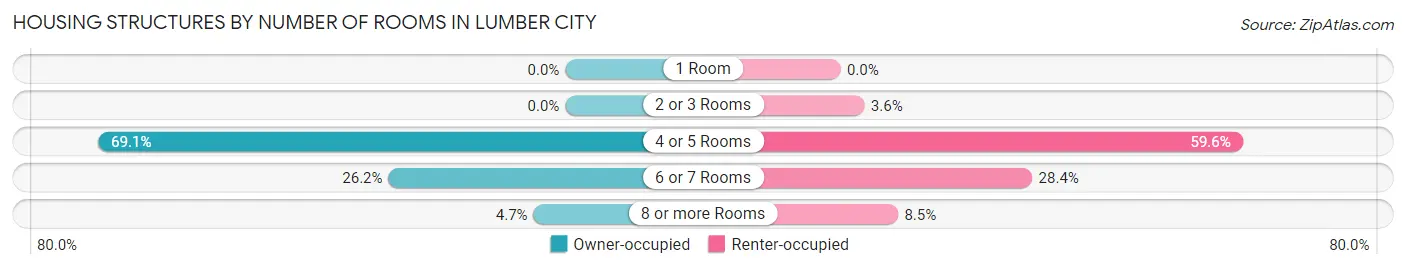
| Number of Rooms | Owner-occupied | Renter-occupied |
| 1 Room | 0 (0.0%) | 0 (0.0%) |
| 2 or 3 Rooms | 0 (0.0%) | 5 (3.5%) |
| 4 or 5 Rooms | 103 (69.1%) | 84 (59.6%) |
| 6 or 7 Rooms | 39 (26.2%) | 40 (28.4%) |
| 8 or more Rooms | 7 (4.7%) | 12 (8.5%) |
| Total | 149 (100.0%) | 141 (100.0%) |
Housing Structure by Heating Type in Lumber City
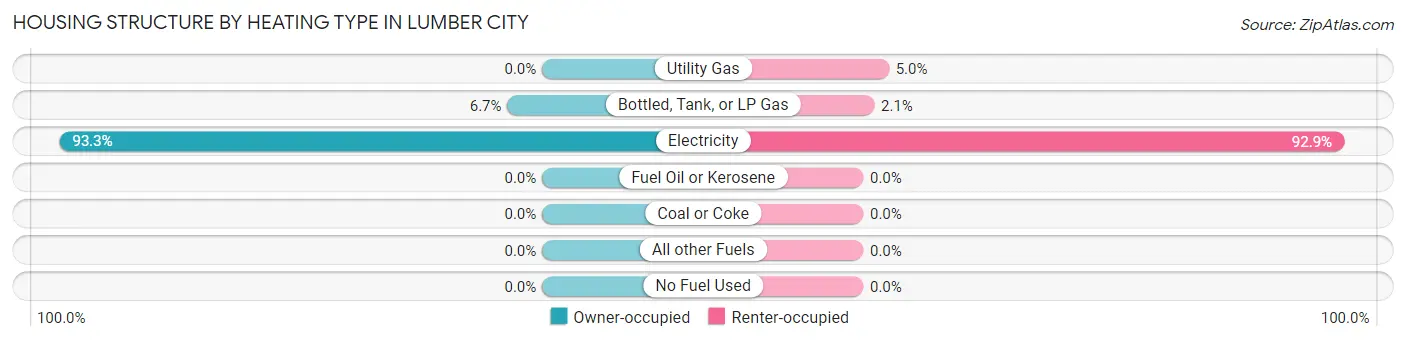
| Heating Type | Owner-occupied | Renter-occupied |
| Utility Gas | 0 (0.0%) | 7 (5.0%) |
| Bottled, Tank, or LP Gas | 10 (6.7%) | 3 (2.1%) |
| Electricity | 139 (93.3%) | 131 (92.9%) |
| Fuel Oil or Kerosene | 0 (0.0%) | 0 (0.0%) |
| Coal or Coke | 0 (0.0%) | 0 (0.0%) |
| All other Fuels | 0 (0.0%) | 0 (0.0%) |
| No Fuel Used | 0 (0.0%) | 0 (0.0%) |
| Total | 149 (100.0%) | 141 (100.0%) |
Household Vehicle Usage in Lumber City
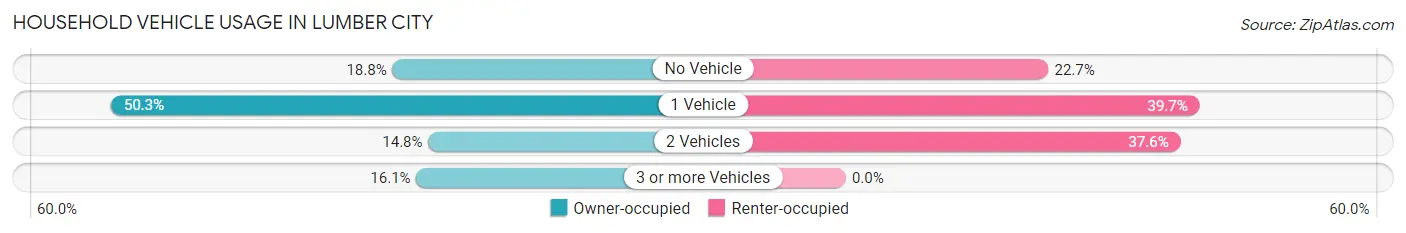
| Vehicles per Household | Owner-occupied | Renter-occupied |
| No Vehicle | 28 (18.8%) | 32 (22.7%) |
| 1 Vehicle | 75 (50.3%) | 56 (39.7%) |
| 2 Vehicles | 22 (14.8%) | 53 (37.6%) |
| 3 or more Vehicles | 24 (16.1%) | 0 (0.0%) |
| Total | 149 (100.0%) | 141 (100.0%) |
Real Estate & Mortgages in Lumber City
Real Estate and Mortgage Overview in Lumber City
| Characteristic | Without Mortgage | With Mortgage |
| Housing Units | 140 | 9 |
| Median Property Value | - | - |
| Median Household Income | $31,389 | $0 |
| Monthly Housing Costs | $329 | $0 |
| Real Estate Taxes | - | - |
Property Value by Mortgage Status in Lumber City
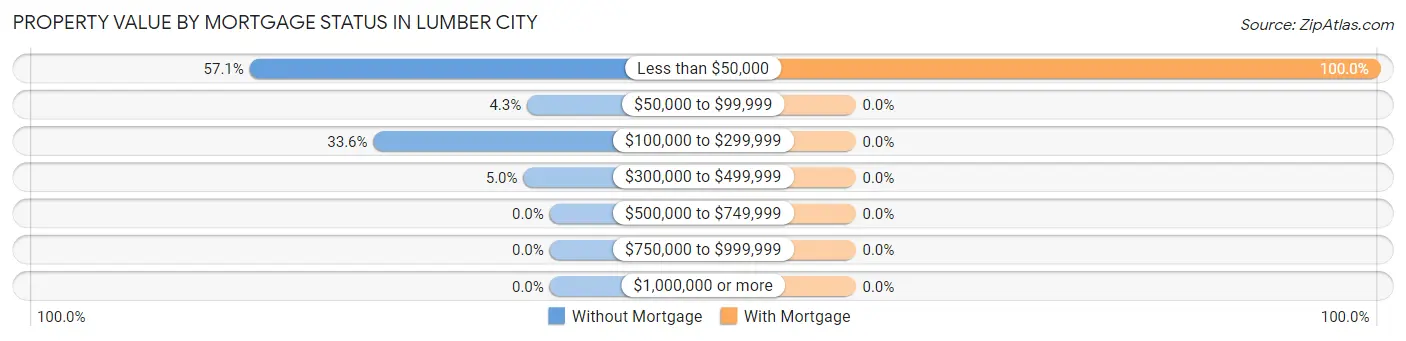
| Property Value | Without Mortgage | With Mortgage |
| Less than $50,000 | 80 (57.1%) | 9 (100.0%) |
| $50,000 to $99,999 | 6 (4.3%) | 0 (0.0%) |
| $100,000 to $299,999 | 47 (33.6%) | 0 (0.0%) |
| $300,000 to $499,999 | 7 (5.0%) | 0 (0.0%) |
| $500,000 to $749,999 | 0 (0.0%) | 0 (0.0%) |
| $750,000 to $999,999 | 0 (0.0%) | 0 (0.0%) |
| $1,000,000 or more | 0 (0.0%) | 0 (0.0%) |
| Total | 140 (100.0%) | 9 (100.0%) |
Household Income by Mortgage Status in Lumber City
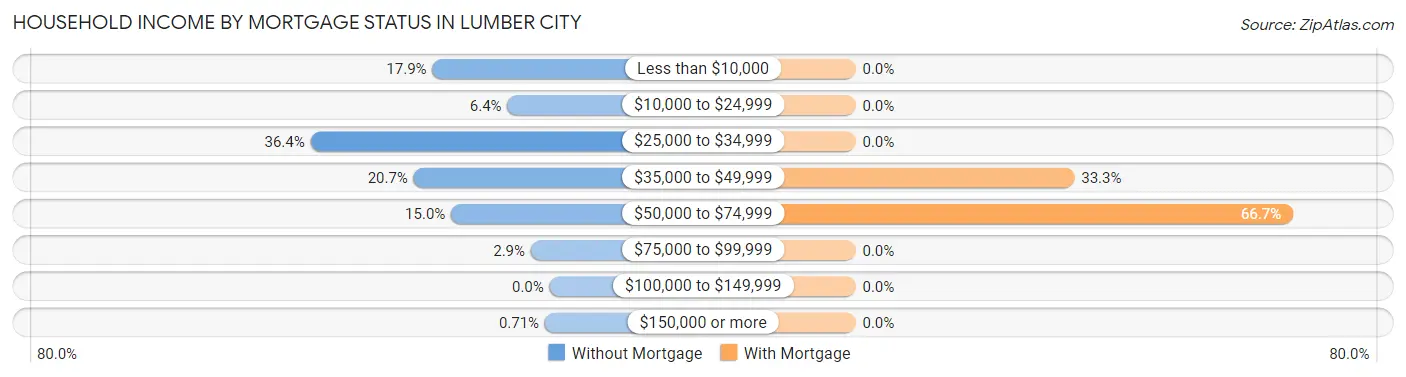
| Household Income | Without Mortgage | With Mortgage |
| Less than $10,000 | 25 (17.9%) | 0 (0.0%) |
| $10,000 to $24,999 | 9 (6.4%) | 0 (0.0%) |
| $25,000 to $34,999 | 51 (36.4%) | 0 (0.0%) |
| $35,000 to $49,999 | 29 (20.7%) | 3 (33.3%) |
| $50,000 to $74,999 | 21 (15.0%) | 6 (66.7%) |
| $75,000 to $99,999 | 4 (2.9%) | 0 (0.0%) |
| $100,000 to $149,999 | 0 (0.0%) | 0 (0.0%) |
| $150,000 or more | 1 (0.7%) | 0 (0.0%) |
| Total | 140 (100.0%) | 9 (100.0%) |
Property Value to Household Income Ratio in Lumber City
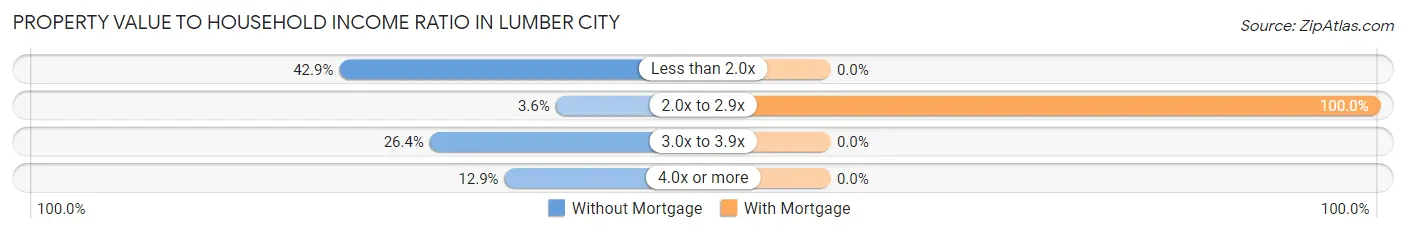
| Value-to-Income Ratio | Without Mortgage | With Mortgage |
| Less than 2.0x | 60 (42.9%) | 0 (0.0%) |
| 2.0x to 2.9x | 5 (3.6%) | 9 (100.0%) |
| 3.0x to 3.9x | 37 (26.4%) | 0 (0.0%) |
| 4.0x or more | 18 (12.9%) | 0 (0.0%) |
| Total | 140 (100.0%) | 9 (100.0%) |
Real Estate Taxes by Mortgage Status in Lumber City
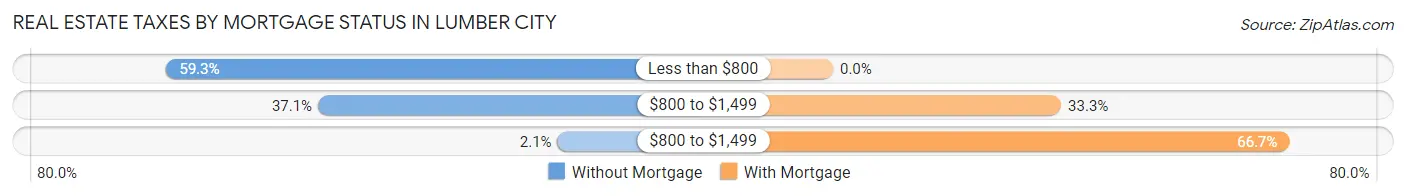
| Property Taxes | Without Mortgage | With Mortgage |
| Less than $800 | 83 (59.3%) | 0 (0.0%) |
| $800 to $1,499 | 52 (37.1%) | 3 (33.3%) |
| $800 to $1,499 | 3 (2.1%) | 6 (66.7%) |
| Total | 140 (100.0%) | 9 (100.0%) |
Health & Disability in Lumber City
Health Insurance Coverage by Age in Lumber City
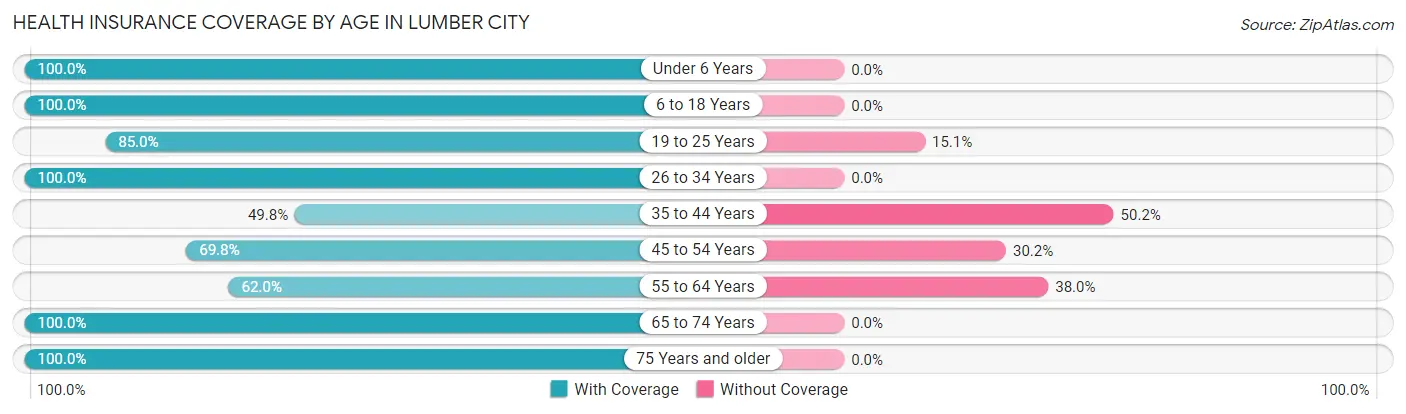
| Age Bracket | With Coverage | Without Coverage |
| Under 6 Years | 60 (100.0%) | 0 (0.0%) |
| 6 to 18 Years | 232 (100.0%) | 0 (0.0%) |
| 19 to 25 Years | 158 (85.0%) | 28 (15.0%) |
| 26 to 34 Years | 31 (100.0%) | 0 (0.0%) |
| 35 to 44 Years | 106 (49.8%) | 107 (50.2%) |
| 45 to 54 Years | 44 (69.8%) | 19 (30.2%) |
| 55 to 64 Years | 57 (62.0%) | 35 (38.0%) |
| 65 to 74 Years | 99 (100.0%) | 0 (0.0%) |
| 75 Years and older | 89 (100.0%) | 0 (0.0%) |
| Total | 876 (82.3%) | 189 (17.7%) |
Health Insurance Coverage by Citizenship Status in Lumber City
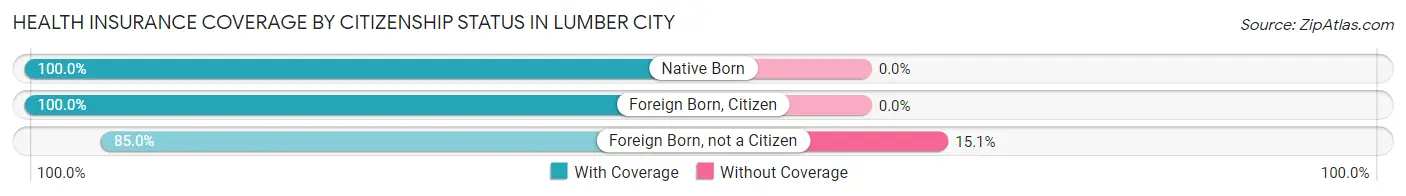
| Citizenship Status | With Coverage | Without Coverage |
| Native Born | 60 (100.0%) | 0 (0.0%) |
| Foreign Born, Citizen | 232 (100.0%) | 0 (0.0%) |
| Foreign Born, not a Citizen | 158 (85.0%) | 28 (15.0%) |
Health Insurance Coverage by Household Income in Lumber City
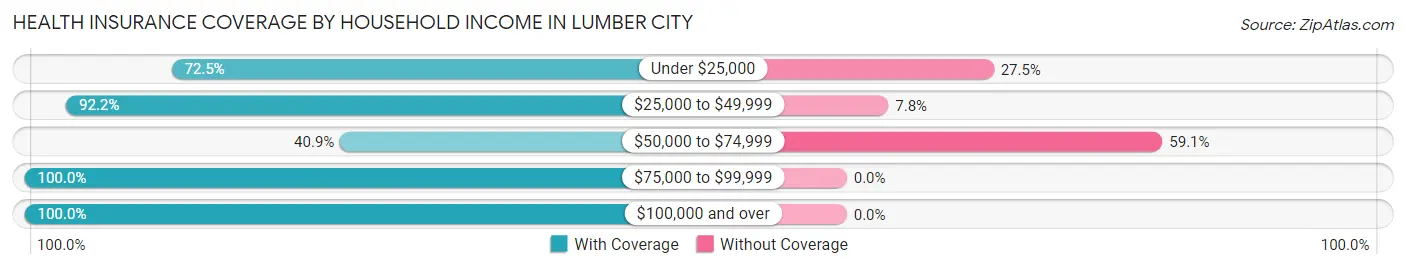
| Household Income | With Coverage | Without Coverage |
| Under $25,000 | 79 (72.5%) | 30 (27.5%) |
| $25,000 to $49,999 | 616 (92.2%) | 52 (7.8%) |
| $50,000 to $74,999 | 74 (40.9%) | 107 (59.1%) |
| $75,000 to $99,999 | 51 (100.0%) | 0 (0.0%) |
| $100,000 and over | 56 (100.0%) | 0 (0.0%) |
Public vs Private Health Insurance Coverage by Age in Lumber City
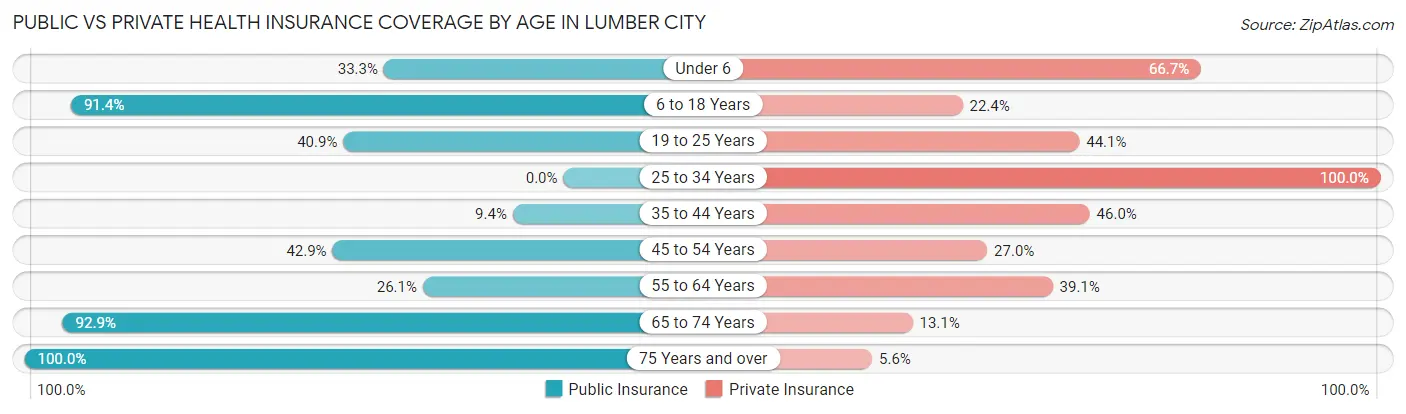
| Age Bracket | Public Insurance | Private Insurance |
| Under 6 | 20 (33.3%) | 40 (66.7%) |
| 6 to 18 Years | 212 (91.4%) | 52 (22.4%) |
| 19 to 25 Years | 76 (40.9%) | 82 (44.1%) |
| 25 to 34 Years | 0 (0.0%) | 31 (100.0%) |
| 35 to 44 Years | 20 (9.4%) | 98 (46.0%) |
| 45 to 54 Years | 27 (42.9%) | 17 (27.0%) |
| 55 to 64 Years | 24 (26.1%) | 36 (39.1%) |
| 65 to 74 Years | 92 (92.9%) | 13 (13.1%) |
| 75 Years and over | 89 (100.0%) | 5 (5.6%) |
| Total | 560 (52.6%) | 374 (35.1%) |
Disability Status by Sex by Age in Lumber City
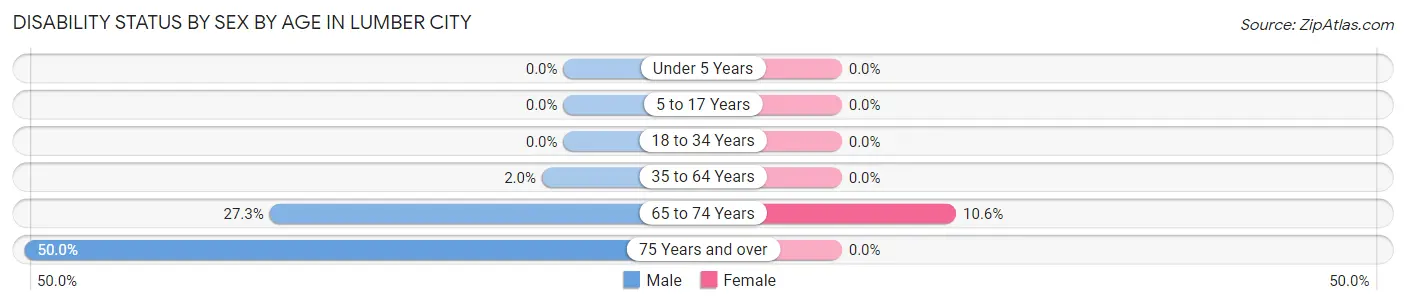
| Age Bracket | Male | Female |
| Under 5 Years | 0 (0.0%) | 0 (0.0%) |
| 5 to 17 Years | 0 (0.0%) | 0 (0.0%) |
| 18 to 34 Years | 0 (0.0%) | 0 (0.0%) |
| 35 to 64 Years | 2 (2.0%) | 0 (0.0%) |
| 65 to 74 Years | 9 (27.3%) | 7 (10.6%) |
| 75 Years and over | 9 (50.0%) | 0 (0.0%) |
Disability Class by Sex by Age in Lumber City
Disability Class: Hearing Difficulty
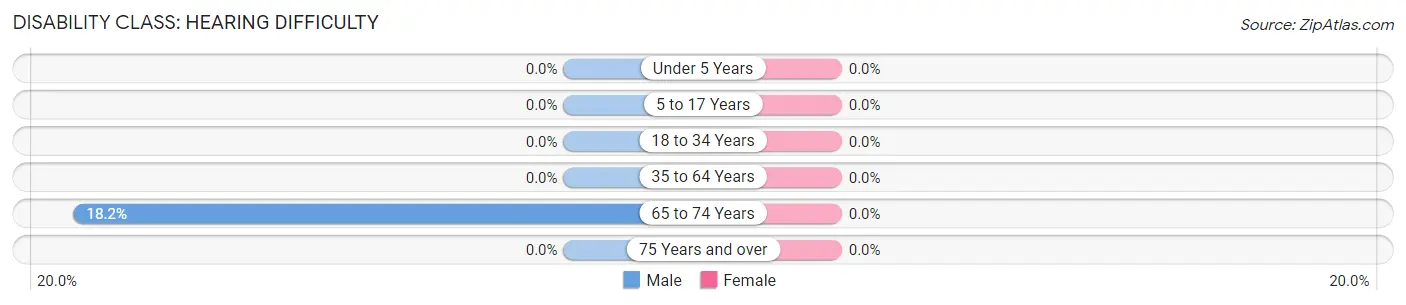
| Age Bracket | Male | Female |
| Under 5 Years | 0 (0.0%) | 0 (0.0%) |
| 5 to 17 Years | 0 (0.0%) | 0 (0.0%) |
| 18 to 34 Years | 0 (0.0%) | 0 (0.0%) |
| 35 to 64 Years | 0 (0.0%) | 0 (0.0%) |
| 65 to 74 Years | 6 (18.2%) | 0 (0.0%) |
| 75 Years and over | 0 (0.0%) | 0 (0.0%) |
Disability Class: Vision Difficulty
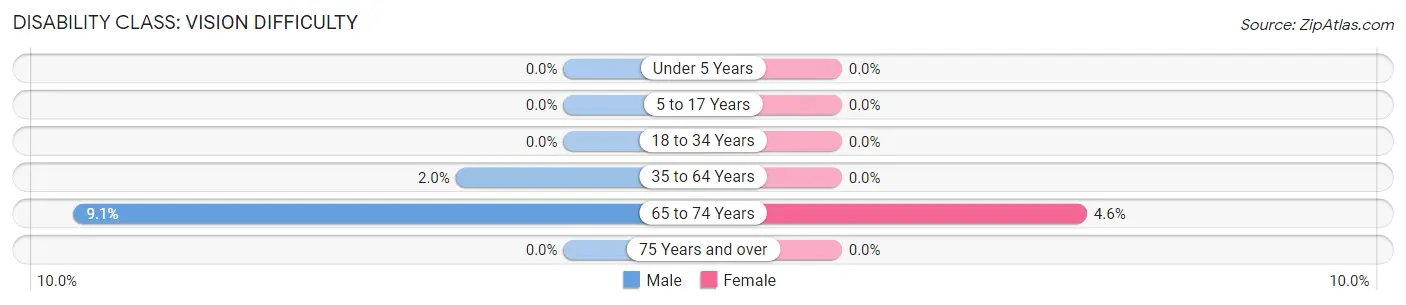
| Age Bracket | Male | Female |
| Under 5 Years | 0 (0.0%) | 0 (0.0%) |
| 5 to 17 Years | 0 (0.0%) | 0 (0.0%) |
| 18 to 34 Years | 0 (0.0%) | 0 (0.0%) |
| 35 to 64 Years | 2 (2.0%) | 0 (0.0%) |
| 65 to 74 Years | 3 (9.1%) | 3 (4.5%) |
| 75 Years and over | 0 (0.0%) | 0 (0.0%) |
Disability Class: Cognitive Difficulty
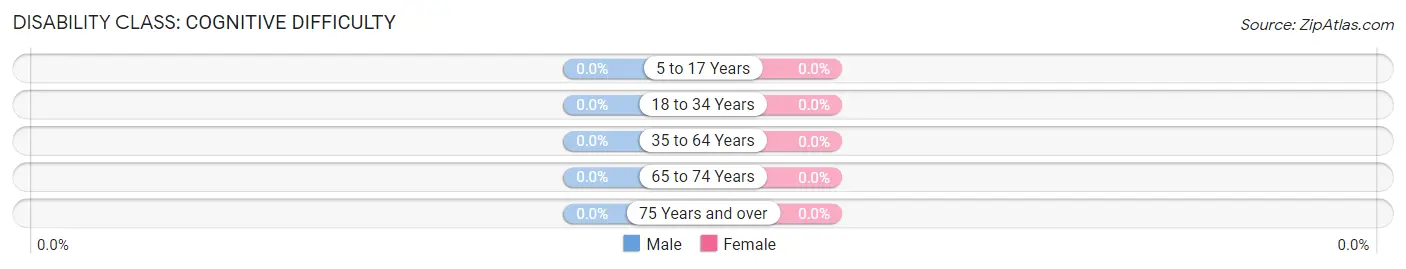
| Age Bracket | Male | Female |
| 5 to 17 Years | 0 (0.0%) | 0 (0.0%) |
| 18 to 34 Years | 0 (0.0%) | 0 (0.0%) |
| 35 to 64 Years | 0 (0.0%) | 0 (0.0%) |
| 65 to 74 Years | 0 (0.0%) | 0 (0.0%) |
| 75 Years and over | 0 (0.0%) | 0 (0.0%) |
Disability Class: Ambulatory Difficulty
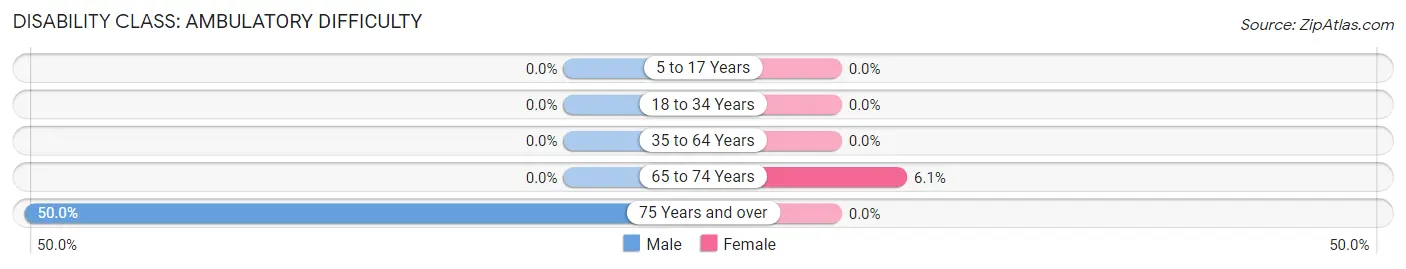
| Age Bracket | Male | Female |
| 5 to 17 Years | 0 (0.0%) | 0 (0.0%) |
| 18 to 34 Years | 0 (0.0%) | 0 (0.0%) |
| 35 to 64 Years | 0 (0.0%) | 0 (0.0%) |
| 65 to 74 Years | 0 (0.0%) | 4 (6.1%) |
| 75 Years and over | 9 (50.0%) | 0 (0.0%) |
Disability Class: Self-Care Difficulty
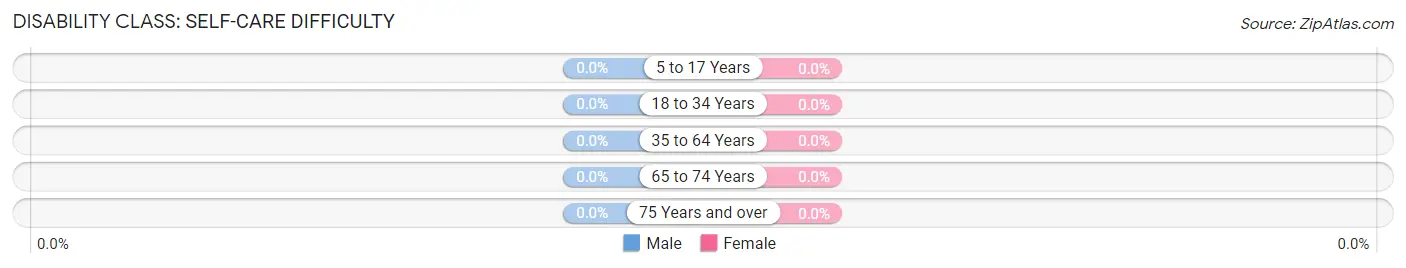
| Age Bracket | Male | Female |
| 5 to 17 Years | 0 (0.0%) | 0 (0.0%) |
| 18 to 34 Years | 0 (0.0%) | 0 (0.0%) |
| 35 to 64 Years | 0 (0.0%) | 0 (0.0%) |
| 65 to 74 Years | 0 (0.0%) | 0 (0.0%) |
| 75 Years and over | 0 (0.0%) | 0 (0.0%) |
Technology Access in Lumber City
Computing Device Access in Lumber City
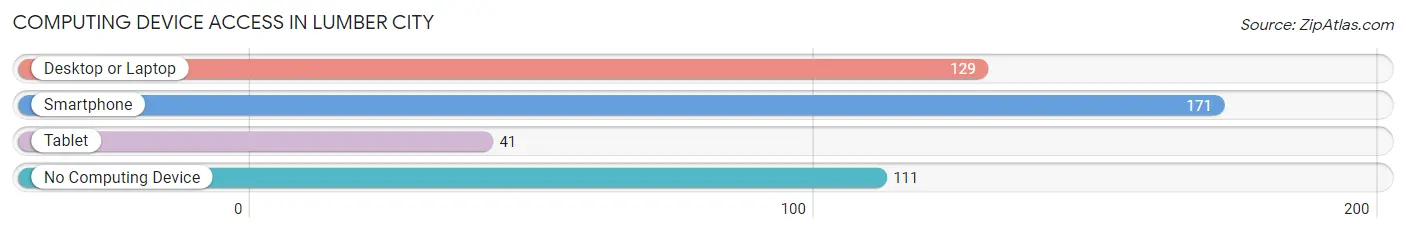
| Device Type | # Households | % Households |
| Desktop or Laptop | 129 | 44.5% |
| Smartphone | 171 | 59.0% |
| Tablet | 41 | 14.1% |
| No Computing Device | 111 | 38.3% |
| Total | 290 | 100.0% |
Internet Access in Lumber City
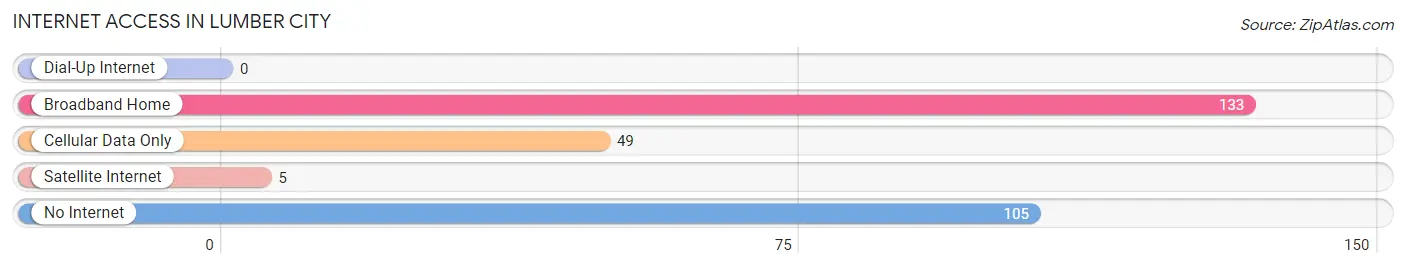
| Internet Type | # Households | % Households |
| Dial-Up Internet | 0 | 0.0% |
| Broadband Home | 133 | 45.9% |
| Cellular Data Only | 49 | 16.9% |
| Satellite Internet | 5 | 1.7% |
| No Internet | 105 | 36.2% |
| Total | 290 | 100.0% |
Lumber City Summary
Lumber City is a small town located in the state of Georgia, in the United States. It is situated in the southeastern corner of the state, in the foothills of the Appalachian Mountains. The town is located in the county of Telfair, and is part of the Dublin-Laurens Metropolitan Statistical Area. The population of Lumber City was estimated to be 1,072 in the year 2020.
History
Lumber City was founded in 1883 by a group of lumbermen from the nearby town of McRae. The town was named after the lumber industry that was the main source of income for the area. The lumber industry was the primary source of employment for the town until the early 20th century, when the industry began to decline. The town was then largely supported by the local farming industry.
In the late 20th century, the town began to experience a resurgence in its economy. This was due to the development of the nearby Lake Sinclair, which provided a new source of recreation and tourism for the area. The town also began to attract new businesses, such as a furniture factory and a sawmill.
Geography
Lumber City is located in the southeastern corner of the state of Georgia, in the foothills of the Appalachian Mountains. The town is situated in the county of Telfair, and is part of the Dublin-Laurens Metropolitan Statistical Area. The town is located at an elevation of 545 feet above sea level.
The town is located in a humid subtropical climate zone, with hot, humid summers and mild winters. The average annual temperature is around 70 degrees Fahrenheit, with an average high of around 90 degrees in the summer and an average low of around 50 degrees in the winter. The average annual precipitation is around 50 inches.
Economy
The economy of Lumber City is largely based on the lumber industry, which is still the primary source of employment for the town. The town is also home to a furniture factory and a sawmill. In addition, the town is home to a number of small businesses, such as restaurants, retail stores, and service providers.
The town is also home to a number of tourist attractions, such as the nearby Lake Sinclair, which provides a variety of recreational activities, including fishing, boating, and swimming. The town is also home to a number of historic sites, such as the Lumber City Historic District, which is listed on the National Register of Historic Places.
Demographics
As of the 2020 census, the population of Lumber City was estimated to be 1,072. The racial makeup of the town was 79.2% White, 17.3% African American, 0.7% Native American, 0.3% Asian, 0.1% Pacific Islander, and 2.4% from other races. The median household income was estimated to be $30,938, and the median home value was estimated to be $90,000. The town has a poverty rate of 22.3%.
Common Questions
What is Per Capita Income in Lumber City?
Per Capita income in Lumber City is $15,296.
What is the Median Family Income in Lumber City?
Median Family Income in Lumber City is $41,000.
What is the Median Household income in Lumber City?
Median Household Income in Lumber City is $31,429.
What is Inequality or Gini Index in Lumber City?
Inequality or Gini Index in Lumber City is 0.40.
What is the Total Population of Lumber City?
Total Population of Lumber City is 1,127.
What is the Total Male Population of Lumber City?
Total Male Population of Lumber City is 440.
What is the Total Female Population of Lumber City?
Total Female Population of Lumber City is 687.
What is the Ratio of Males per 100 Females in Lumber City?
There are 64.05 Males per 100 Females in Lumber City.
What is the Ratio of Females per 100 Males in Lumber City?
There are 156.14 Females per 100 Males in Lumber City.
What is the Median Population Age in Lumber City?
Median Population Age in Lumber City is 41.2 Years.
What is the Average Family Size in Lumber City
Average Family Size in Lumber City is 5.8 People.
What is the Average Household Size in Lumber City
Average Household Size in Lumber City is 3.7 People.
How Large is the Labor Force in Lumber City?
There are 386 People in the Labor Forcein in Lumber City.
What is the Percentage of People in the Labor Force in Lumber City?
44.4% of People are in the Labor Force in Lumber City.
What is the Unemployment Rate in Lumber City?
Unemployment Rate in Lumber City is 7.3%.