Canon, GA Map & Demographics
Canon Map
Canon Overview
$16,321
PER CAPITA INCOME
$37,159
AVG FAMILY INCOME
$37,443
AVG HOUSEHOLD INCOME
27.5%
WAGE / INCOME GAP [ % ]
72.5¢/ $1
WAGE / INCOME GAP [ $ ]
0.50
INEQUALITY / GINI INDEX
912
TOTAL POPULATION
488
MALE POPULATION
424
FEMALE POPULATION
115.09
MALES / 100 FEMALES
86.89
FEMALES / 100 MALES
25.0
MEDIAN AGE
4.7
AVG FAMILY SIZE
3.9
AVG HOUSEHOLD SIZE
270
LABOR FORCE [ PEOPLE ]
54.1%
PERCENT IN LABOR FORCE
0.4%
UNEMPLOYMENT RATE
Canon Zip Codes
Income in Canon
Income Overview in Canon
Per Capita Income in Canon is $16,321, while median incomes of families and households are $37,159 and $37,443 respectively.
| Characteristic | Number | Measure |
| Per Capita Income | 912 | $16,321 |
| Median Family Income | 168 | $37,159 |
| Mean Family Income | 168 | $55,010 |
| Median Household Income | 233 | $37,443 |
| Mean Household Income | 233 | $56,601 |
| Income Deficit | 168 | $0 |
| Wage / Income Gap (%) | 912 | 27.48% |
| Wage / Income Gap ($) | 912 | 72.52¢ per $1 |
| Gini / Inequality Index | 912 | 0.50 |
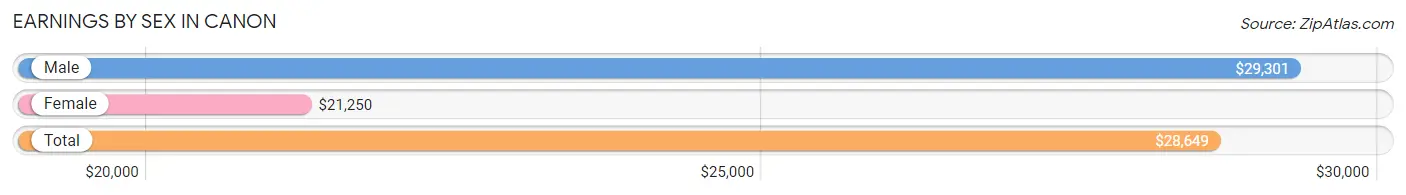
Earnings by Sex in Canon
Average Earnings in Canon are $28,649, $29,301 for men and $21,250 for women, a difference of 27.5%.
| Sex | Number | Average Earnings |
| Male | 185 (66.1%) | $29,301 |
| Female | 95 (33.9%) | $21,250 |
| Total | 280 (100.0%) | $28,649 |
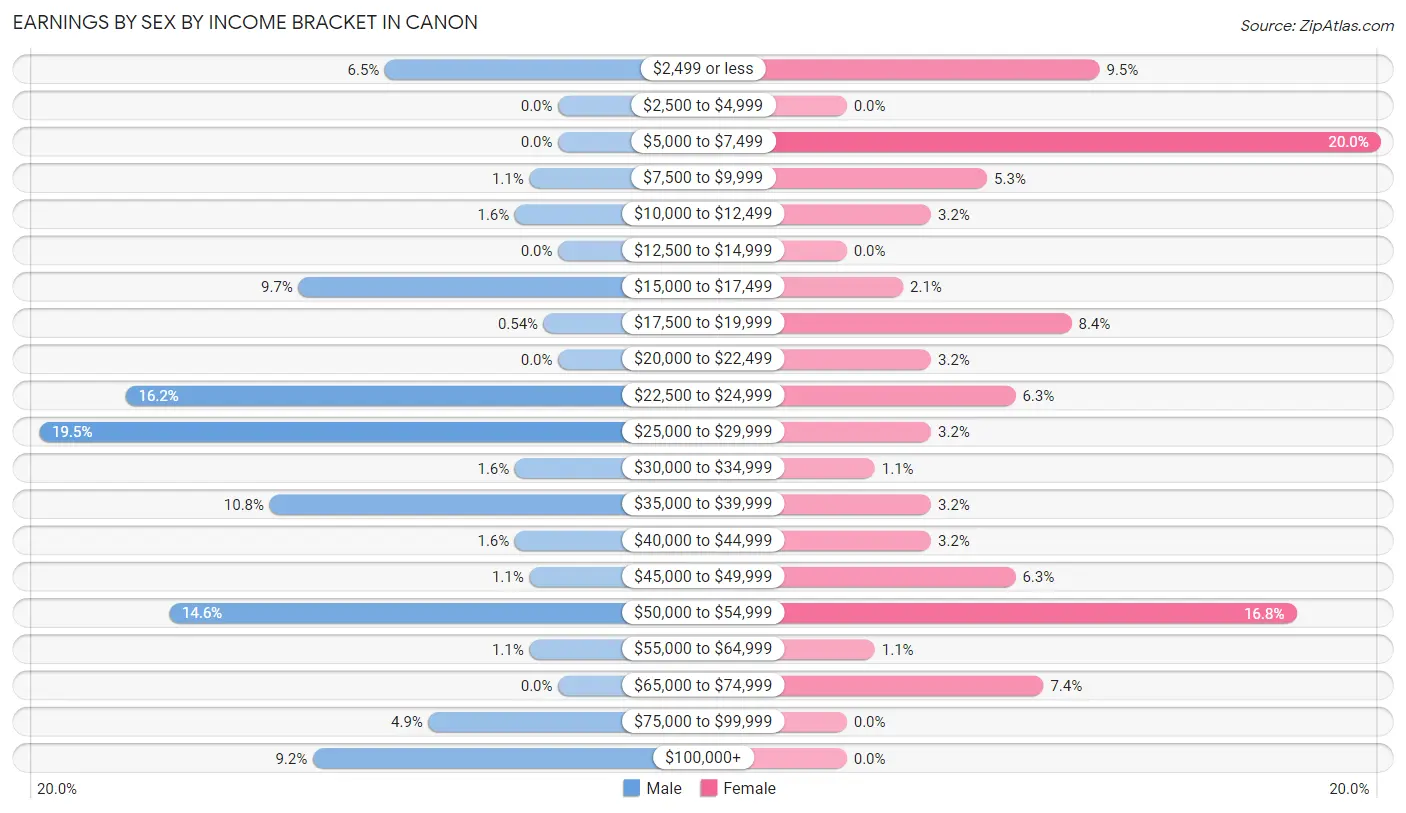
Earnings by Sex by Income Bracket in Canon
The most common earnings brackets in Canon are $25,000 to $29,999 for men (36 | 19.5%) and $5,000 to $7,499 for women (19 | 20.0%).
| Income | Male | Female |
| $2,499 or less | 12 (6.5%) | 9 (9.5%) |
| $2,500 to $4,999 | 0 (0.0%) | 0 (0.0%) |
| $5,000 to $7,499 | 0 (0.0%) | 19 (20.0%) |
| $7,500 to $9,999 | 2 (1.1%) | 5 (5.3%) |
| $10,000 to $12,499 | 3 (1.6%) | 3 (3.2%) |
| $12,500 to $14,999 | 0 (0.0%) | 0 (0.0%) |
| $15,000 to $17,499 | 18 (9.7%) | 2 (2.1%) |
| $17,500 to $19,999 | 1 (0.5%) | 8 (8.4%) |
| $20,000 to $22,499 | 0 (0.0%) | 3 (3.2%) |
| $22,500 to $24,999 | 30 (16.2%) | 6 (6.3%) |
| $25,000 to $29,999 | 36 (19.5%) | 3 (3.2%) |
| $30,000 to $34,999 | 3 (1.6%) | 1 (1.1%) |
| $35,000 to $39,999 | 20 (10.8%) | 3 (3.2%) |
| $40,000 to $44,999 | 3 (1.6%) | 3 (3.2%) |
| $45,000 to $49,999 | 2 (1.1%) | 6 (6.3%) |
| $50,000 to $54,999 | 27 (14.6%) | 16 (16.8%) |
| $55,000 to $64,999 | 2 (1.1%) | 1 (1.1%) |
| $65,000 to $74,999 | 0 (0.0%) | 7 (7.4%) |
| $75,000 to $99,999 | 9 (4.9%) | 0 (0.0%) |
| $100,000+ | 17 (9.2%) | 0 (0.0%) |
| Total | 185 (100.0%) | 95 (100.0%) |
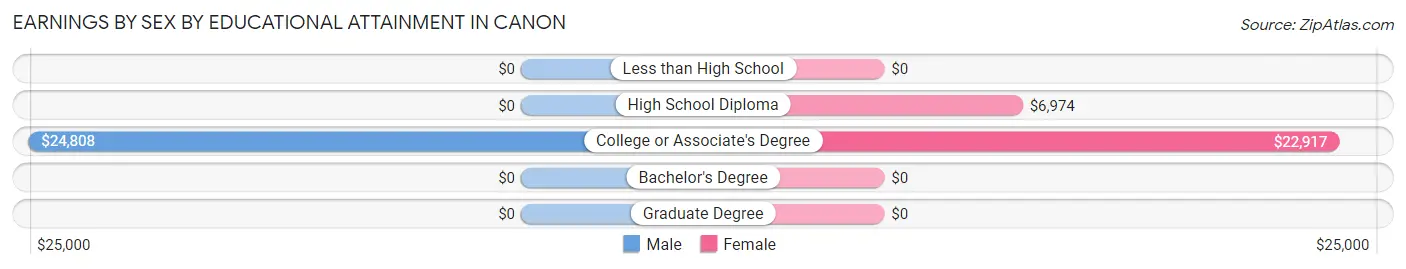
Earnings by Sex by Educational Attainment in Canon
| Educational Attainment | Male Income | Female Income |
| Less than High School | - | - |
| High School Diploma | - | - |
| College or Associate's Degree | $24,808 | $22,917 |
| Bachelor's Degree | - | - |
| Graduate Degree | - | - |
| Total | $29,853 | $0 |
Family Income in Canon
Family Income Brackets in Canon
According to the Canon family income data, there are 38 families falling into the $100,000 to $149,999 income range, which is the most common income bracket and makes up 22.6% of all families.
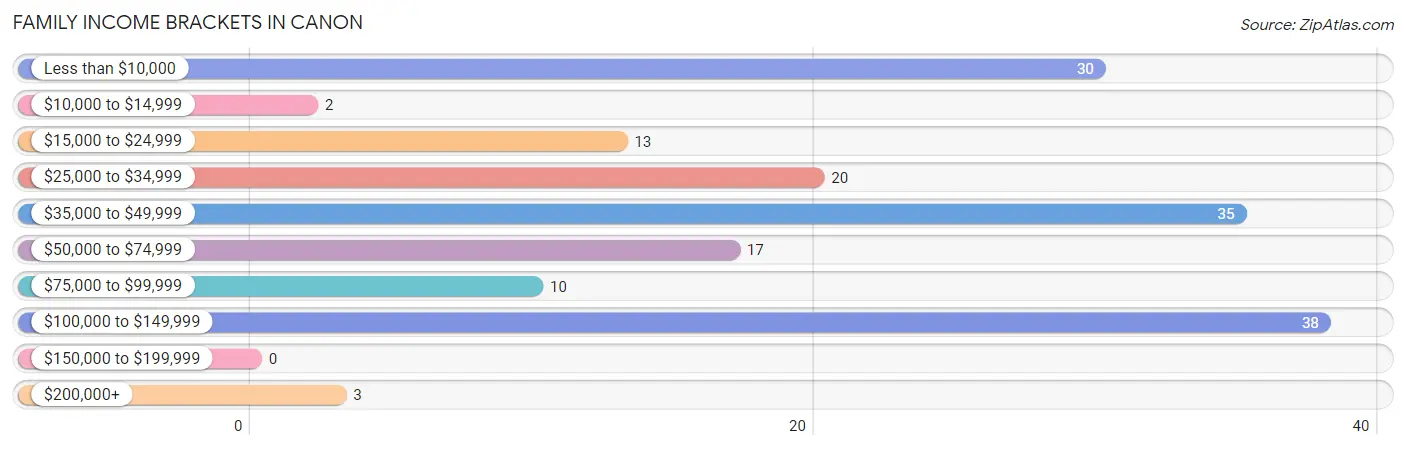
| Income Bracket | # Families | % Families |
| Less than $10,000 | 30 | 17.9% |
| $10,000 to $14,999 | 2 | 1.2% |
| $15,000 to $24,999 | 13 | 7.7% |
| $25,000 to $34,999 | 20 | 11.9% |
| $35,000 to $49,999 | 35 | 20.8% |
| $50,000 to $74,999 | 17 | 10.1% |
| $75,000 to $99,999 | 10 | 6.0% |
| $100,000 to $149,999 | 38 | 22.6% |
| $150,000 to $199,999 | 0 | 0.0% |
| $200,000+ | 3 | 1.8% |
Family Income by Famaliy Size in Canon
4-person families (25 | 14.9%) account for the highest median family income in Canon with $128,047 per family, while 4-person families (25 | 14.9%) have the highest median income of $32,012 per family member.
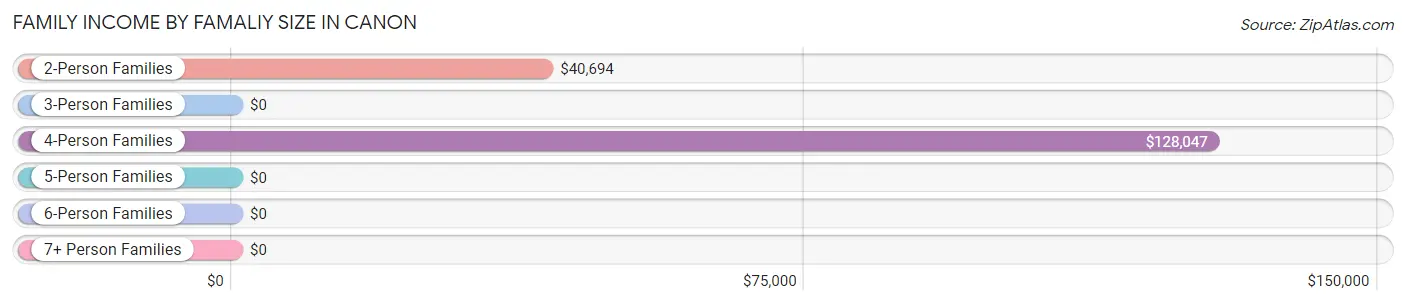
| Income Bracket | # Families | Median Income |
| 2-Person Families | 57 (33.9%) | $40,694 |
| 3-Person Families | 73 (43.4%) | $0 |
| 4-Person Families | 25 (14.9%) | $128,047 |
| 5-Person Families | 1 (0.6%) | $0 |
| 6-Person Families | 1 (0.6%) | $0 |
| 7+ Person Families | 11 (6.6%) | $0 |
| Total | 168 (100.0%) | $37,159 |
Family Income by Number of Earners in Canon
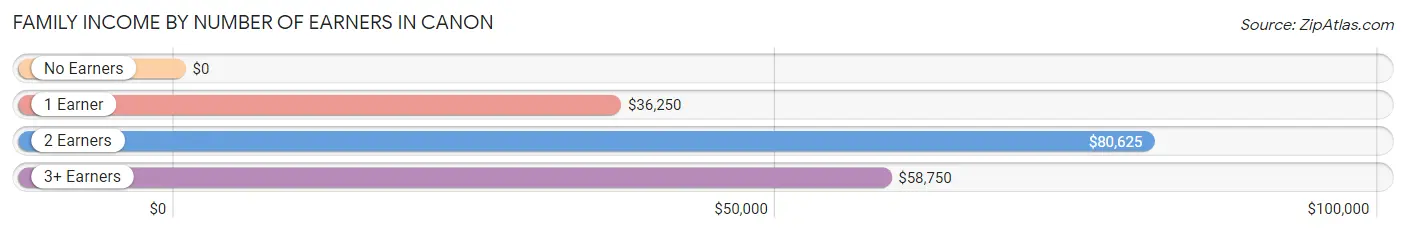
| Number of Earners | # Families | Median Income |
| No Earners | 56 (33.3%) | $0 |
| 1 Earner | 41 (24.4%) | $36,250 |
| 2 Earners | 65 (38.7%) | $80,625 |
| 3+ Earners | 6 (3.6%) | $58,750 |
| Total | 168 (100.0%) | $37,159 |
Household Income in Canon
Household Income Brackets in Canon
With 40 households falling in the category, the $35,000 to $49,999 income range is the most frequent in Canon, accounting for 17.2% of all households.
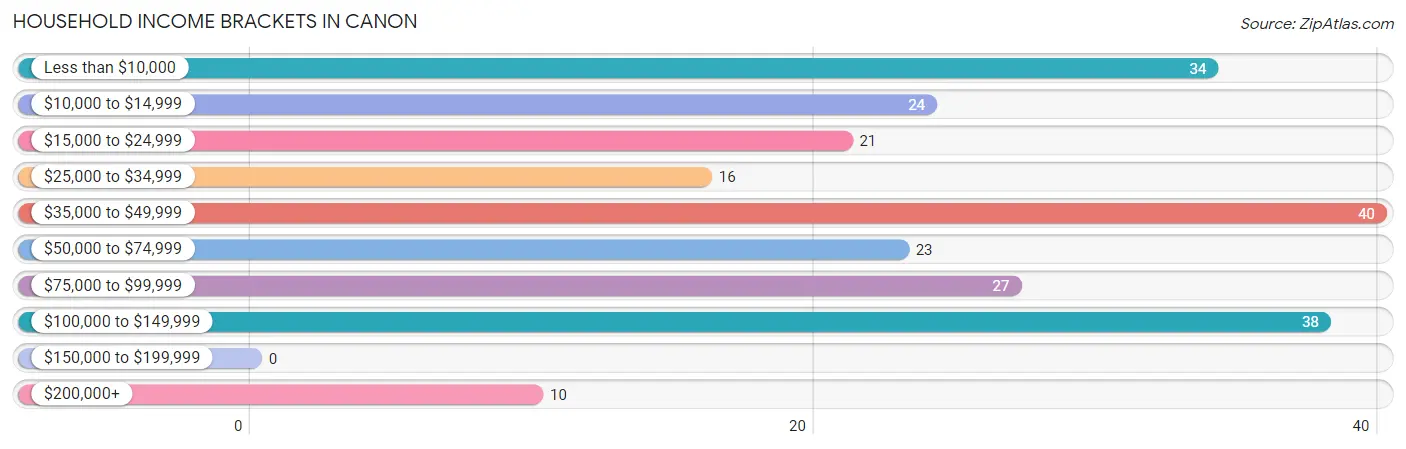
| Income Bracket | # Households | % Households |
| Less than $10,000 | 34 | 14.6% |
| $10,000 to $14,999 | 24 | 10.3% |
| $15,000 to $24,999 | 21 | 9.0% |
| $25,000 to $34,999 | 16 | 6.9% |
| $35,000 to $49,999 | 40 | 17.2% |
| $50,000 to $74,999 | 23 | 9.9% |
| $75,000 to $99,999 | 27 | 11.6% |
| $100,000 to $149,999 | 38 | 16.3% |
| $150,000 to $199,999 | 0 | 0.0% |
| $200,000+ | 10 | 4.3% |
Household Income by Householder Age in Canon
The median household income in Canon is $37,443, with the highest median household income of $40,972 found in the 45 to 64 years age bracket for the primary householder. A total of 61 households (26.2%) fall into this category.
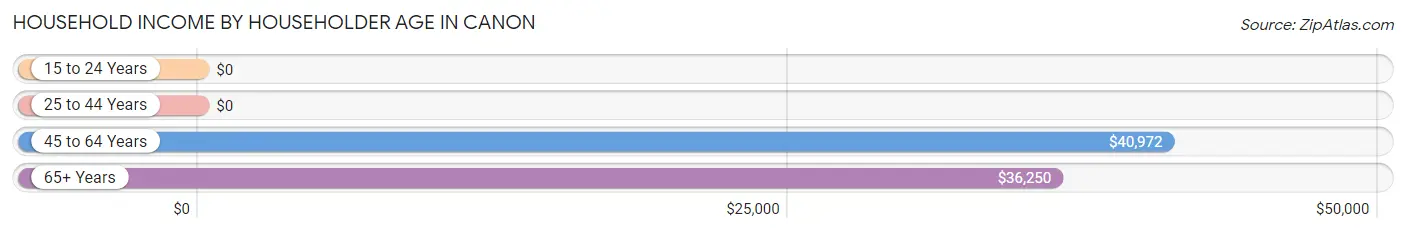
| Income Bracket | # Households | Median Income |
| 15 to 24 Years | 0 (0.0%) | $0 |
| 25 to 44 Years | 99 (42.5%) | $0 |
| 45 to 64 Years | 61 (26.2%) | $40,972 |
| 65+ Years | 73 (31.3%) | $36,250 |
| Total | 233 (100.0%) | $37,443 |
Poverty in Canon
Income Below Poverty by Sex and Age in Canon
With 46.4% poverty level for males and 53.8% for females among the residents of Canon, 5 year old males and 5 year old females are the most vulnerable to poverty, with 28 males (100.0%) and 7 females (100.0%) in their respective age groups living below the poverty level.
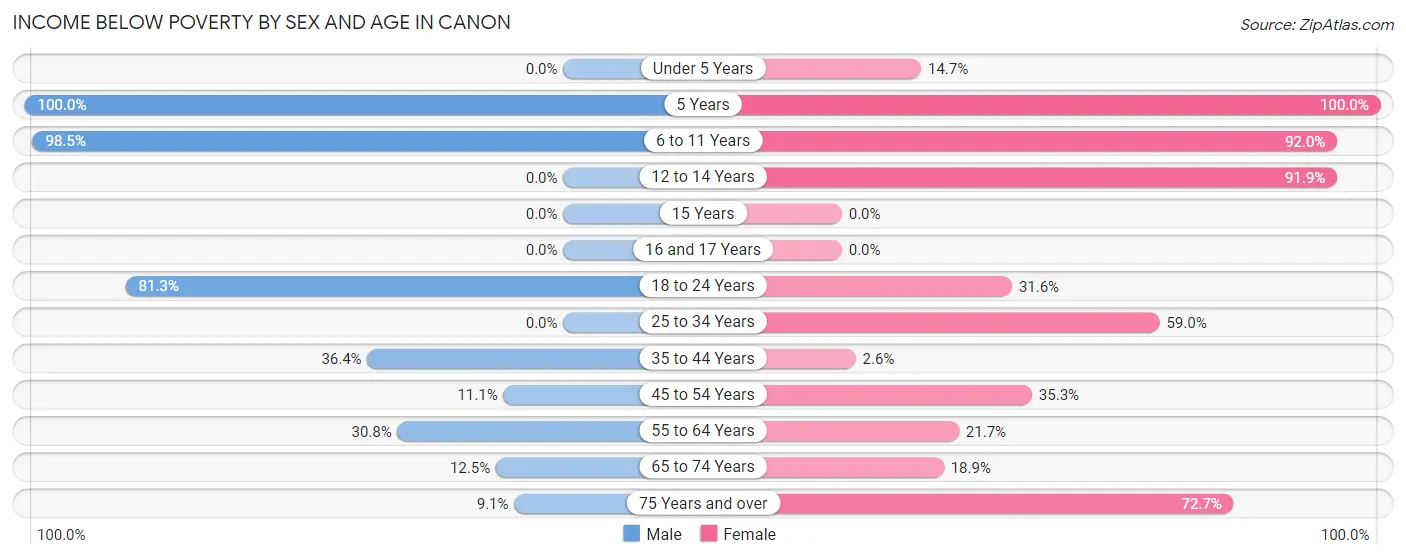
| Age Bracket | Male | Female |
| Under 5 Years | 0 (0.0%) | 5 (14.7%) |
| 5 Years | 28 (100.0%) | 7 (100.0%) |
| 6 to 11 Years | 134 (98.5%) | 80 (91.9%) |
| 12 to 14 Years | 0 (0.0%) | 57 (91.9%) |
| 15 Years | 0 (0.0%) | 0 (0.0%) |
| 16 and 17 Years | 0 (0.0%) | 0 (0.0%) |
| 18 to 24 Years | 13 (81.2%) | 6 (31.6%) |
| 25 to 34 Years | 0 (0.0%) | 46 (59.0%) |
| 35 to 44 Years | 20 (36.4%) | 1 (2.6%) |
| 45 to 54 Years | 3 (11.1%) | 6 (35.3%) |
| 55 to 64 Years | 16 (30.8%) | 5 (21.7%) |
| 65 to 74 Years | 4 (12.5%) | 7 (18.9%) |
| 75 Years and over | 2 (9.1%) | 8 (72.7%) |
| Total | 220 (46.4%) | 228 (53.8%) |
Income Above Poverty by Sex and Age in Canon
According to the poverty statistics in Canon, males aged under 5 years and females aged 15 years are the age groups that are most secure financially, with 100.0% of males and 100.0% of females in these age groups living above the poverty line.
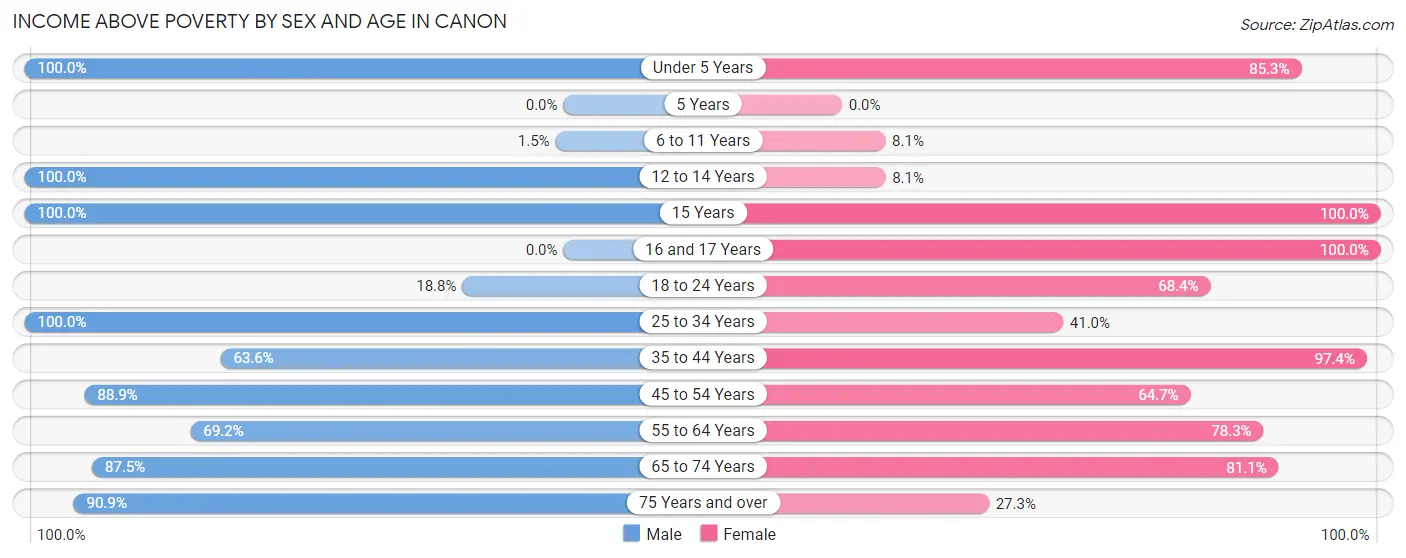
| Age Bracket | Male | Female |
| Under 5 Years | 31 (100.0%) | 29 (85.3%) |
| 5 Years | 0 (0.0%) | 0 (0.0%) |
| 6 to 11 Years | 2 (1.5%) | 7 (8.1%) |
| 12 to 14 Years | 10 (100.0%) | 5 (8.1%) |
| 15 Years | 2 (100.0%) | 2 (100.0%) |
| 16 and 17 Years | 0 (0.0%) | 8 (100.0%) |
| 18 to 24 Years | 3 (18.8%) | 13 (68.4%) |
| 25 to 34 Years | 63 (100.0%) | 32 (41.0%) |
| 35 to 44 Years | 35 (63.6%) | 38 (97.4%) |
| 45 to 54 Years | 24 (88.9%) | 11 (64.7%) |
| 55 to 64 Years | 36 (69.2%) | 18 (78.3%) |
| 65 to 74 Years | 28 (87.5%) | 30 (81.1%) |
| 75 Years and over | 20 (90.9%) | 3 (27.3%) |
| Total | 254 (53.6%) | 196 (46.2%) |
Income Below Poverty Among Married-Couple Families in Canon
The poverty statistics for married-couple families in Canon show that 16.0% or 16 of the total 100 families live below the poverty line. Families with 1 or 2 children have the highest poverty rate of 22.0%, comprising of 9 families. On the other hand, families with 3 or 4 children have the lowest poverty rate of 0.0%, which includes 0 families.
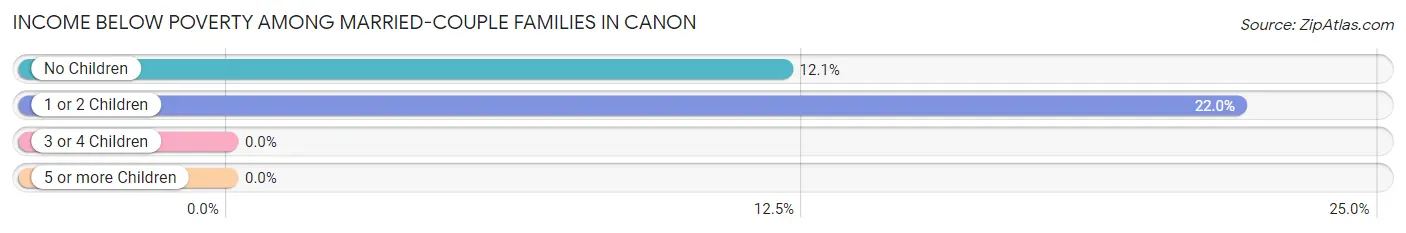
| Children | Above Poverty | Below Poverty |
| No Children | 51 (87.9%) | 7 (12.1%) |
| 1 or 2 Children | 32 (78.0%) | 9 (22.0%) |
| 3 or 4 Children | 1 (100.0%) | 0 (0.0%) |
| 5 or more Children | 0 (0.0%) | 0 (0.0%) |
| Total | 84 (84.0%) | 16 (16.0%) |
Income Below Poverty Among Single-Parent Households in Canon
According to the poverty data in Canon, 36.4% or 12 single-father households and 77.1% or 27 single-mother households are living below the poverty line. Among single-father households, those with 5 or more children have the highest poverty rate, with 10 households (90.9%) experiencing poverty. Likewise, among single-mother households, those with 1 or 2 children have the highest poverty rate, with 25 households (89.3%) falling below the poverty line.
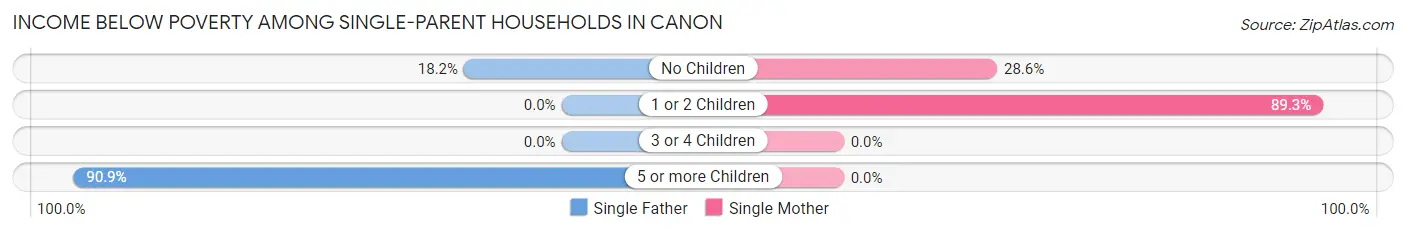
| Children | Single Father | Single Mother |
| No Children | 2 (18.2%) | 2 (28.6%) |
| 1 or 2 Children | 0 (0.0%) | 25 (89.3%) |
| 3 or 4 Children | 0 (0.0%) | 0 (0.0%) |
| 5 or more Children | 10 (90.9%) | 0 (0.0%) |
| Total | 12 (36.4%) | 27 (77.1%) |
Income Below Poverty Among Married-Couple vs Single-Parent Households in Canon
The poverty data for Canon shows that 16 of the married-couple family households (16.0%) and 39 of the single-parent households (57.4%) are living below the poverty level. Within the married-couple family households, those with 1 or 2 children have the highest poverty rate, with 9 households (22.0%) falling below the poverty line. Among the single-parent households, those with 5 or more children have the highest poverty rate, with 10 household (90.9%) living below poverty.
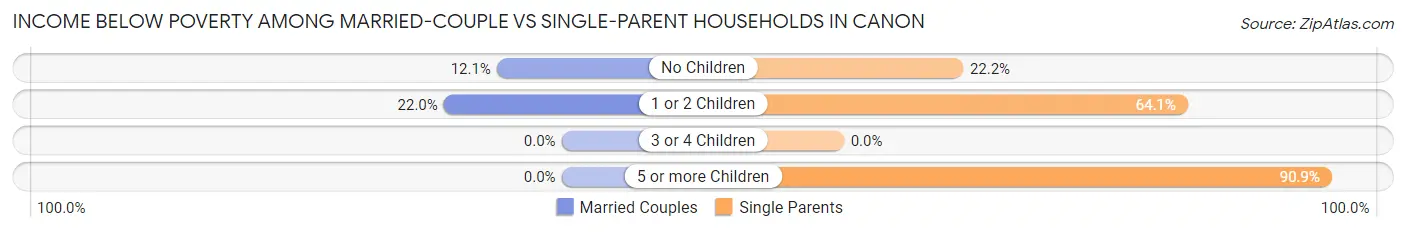
| Children | Married-Couple Families | Single-Parent Households |
| No Children | 7 (12.1%) | 4 (22.2%) |
| 1 or 2 Children | 9 (22.0%) | 25 (64.1%) |
| 3 or 4 Children | 0 (0.0%) | 0 (0.0%) |
| 5 or more Children | 0 (0.0%) | 10 (90.9%) |
| Total | 16 (16.0%) | 39 (57.4%) |
Race in Canon
The most populous races in Canon are White / Caucasian (699 | 76.6%), Hispanic or Latino (199 | 21.8%), and Some other Race (199 | 21.8%).
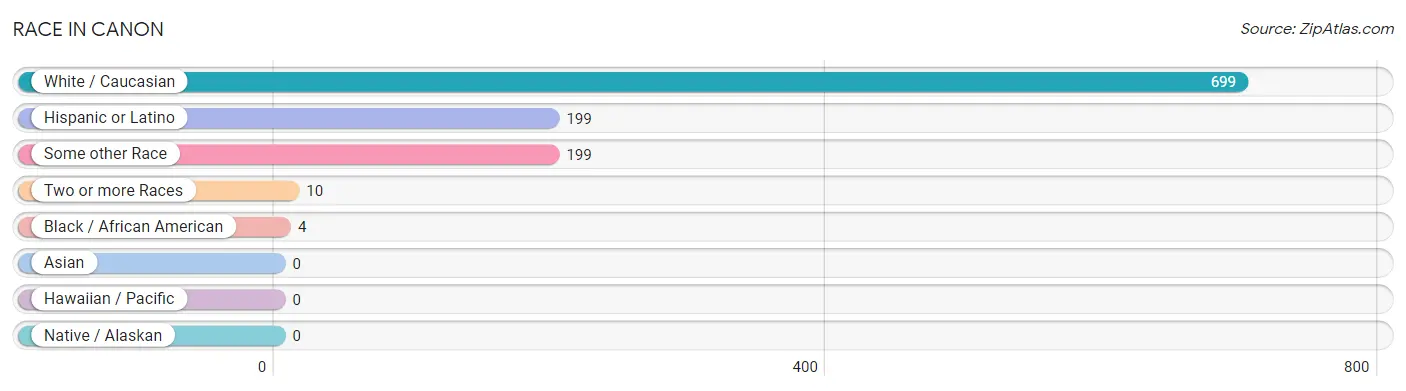
| Race | # Population | % Population |
| Asian | 0 | 0.0% |
| Black / African American | 4 | 0.4% |
| Hawaiian / Pacific | 0 | 0.0% |
| Hispanic or Latino | 199 | 21.8% |
| Native / Alaskan | 0 | 0.0% |
| White / Caucasian | 699 | 76.6% |
| Two or more Races | 10 | 1.1% |
| Some other Race | 199 | 21.8% |
| Total | 912 | 100.0% |
Ancestry in Canon
The most populous ancestries reported in Canon are Mexican (199 | 21.8%), Irish (113 | 12.4%), American (100 | 11.0%), Scottish (61 | 6.7%), and Czechoslovakian (40 | 4.4%), together accounting for 56.2% of all Canon residents.
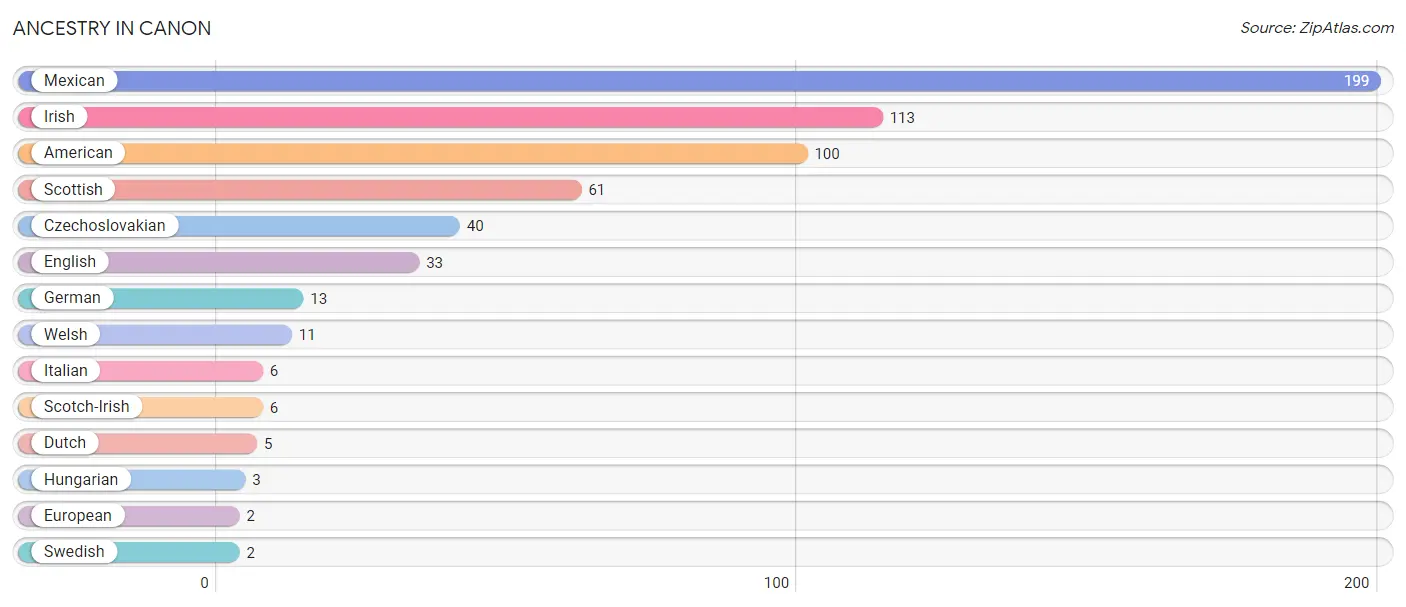
| Ancestry | # Population | % Population |
| American | 100 | 11.0% |
| Czechoslovakian | 40 | 4.4% |
| Dutch | 5 | 0.5% |
| English | 33 | 3.6% |
| European | 2 | 0.2% |
| German | 13 | 1.4% |
| Hungarian | 3 | 0.3% |
| Irish | 113 | 12.4% |
| Italian | 6 | 0.7% |
| Mexican | 199 | 21.8% |
| Scotch-Irish | 6 | 0.7% |
| Scottish | 61 | 6.7% |
| Swedish | 2 | 0.2% |
| Welsh | 11 | 1.2% | View All 14 Rows |
Immigrants in Canon
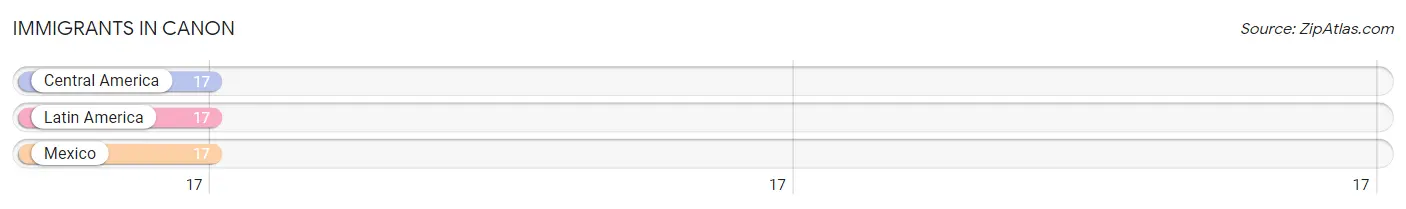
The most numerous immigrant groups reported in Canon came from Central America (17 | 1.9%), Latin America (17 | 1.9%), and Mexico (17 | 1.9%), together accounting for 5.6% of all Canon residents.
| Immigration Origin | # Population | % Population |
| Central America | 17 | 1.9% |
| Latin America | 17 | 1.9% |
| Mexico | 17 | 1.9% | View All 3 Rows |
Sex and Age in Canon
Sex and Age in Canon
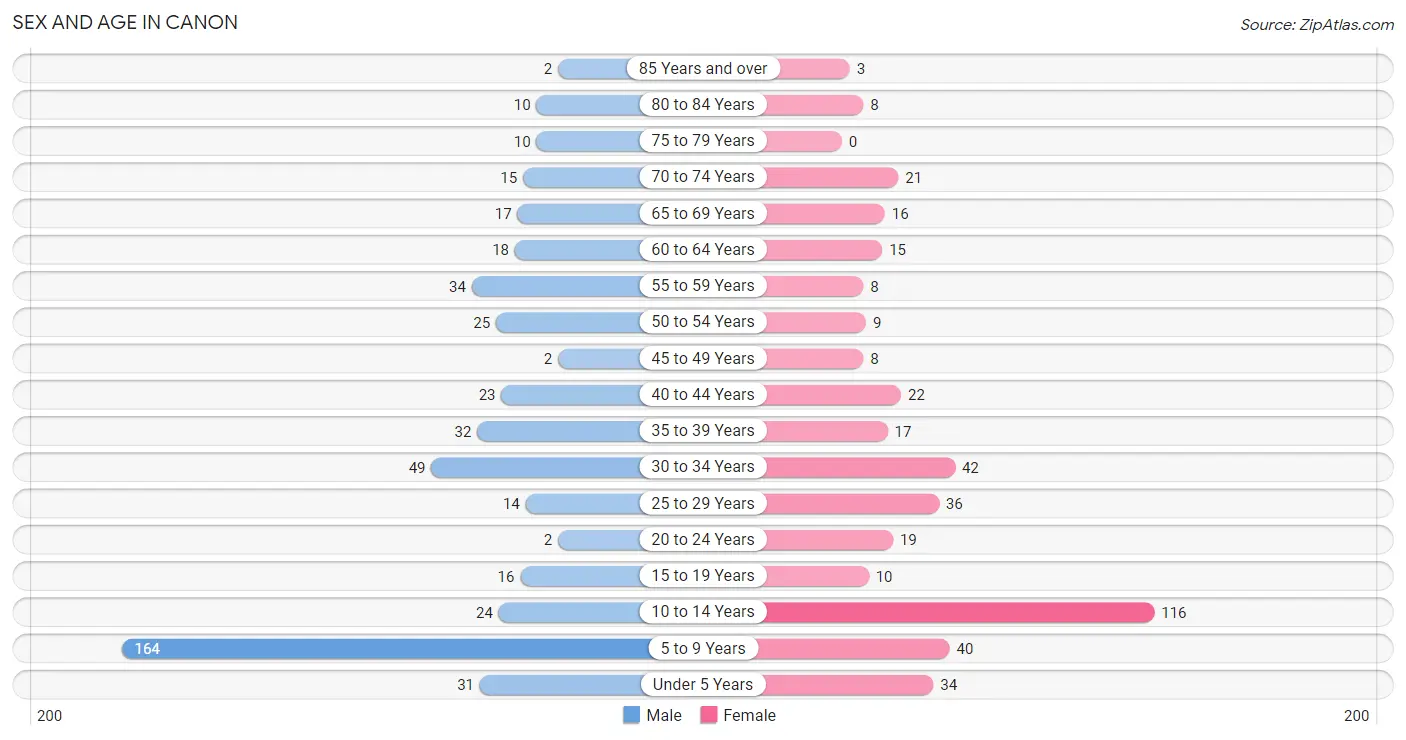
The most populous age groups in Canon are 5 to 9 Years (164 | 33.6%) for men and 10 to 14 Years (116 | 27.4%) for women.
| Age Bracket | Male | Female |
| Under 5 Years | 31 (6.4%) | 34 (8.0%) |
| 5 to 9 Years | 164 (33.6%) | 40 (9.4%) |
| 10 to 14 Years | 24 (4.9%) | 116 (27.4%) |
| 15 to 19 Years | 16 (3.3%) | 10 (2.4%) |
| 20 to 24 Years | 2 (0.4%) | 19 (4.5%) |
| 25 to 29 Years | 14 (2.9%) | 36 (8.5%) |
| 30 to 34 Years | 49 (10.0%) | 42 (9.9%) |
| 35 to 39 Years | 32 (6.6%) | 17 (4.0%) |
| 40 to 44 Years | 23 (4.7%) | 22 (5.2%) |
| 45 to 49 Years | 2 (0.4%) | 8 (1.9%) |
| 50 to 54 Years | 25 (5.1%) | 9 (2.1%) |
| 55 to 59 Years | 34 (7.0%) | 8 (1.9%) |
| 60 to 64 Years | 18 (3.7%) | 15 (3.5%) |
| 65 to 69 Years | 17 (3.5%) | 16 (3.8%) |
| 70 to 74 Years | 15 (3.1%) | 21 (5.0%) |
| 75 to 79 Years | 10 (2.1%) | 0 (0.0%) |
| 80 to 84 Years | 10 (2.1%) | 8 (1.9%) |
| 85 Years and over | 2 (0.4%) | 3 (0.7%) |
| Total | 488 (100.0%) | 424 (100.0%) |
Families and Households in Canon
Median Family Size in Canon
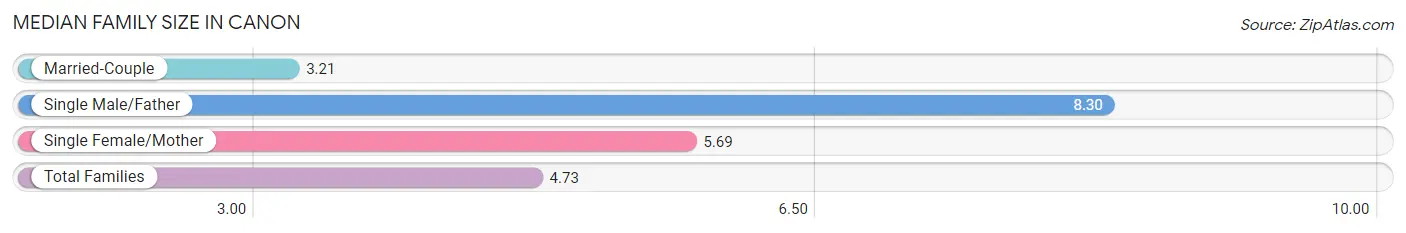
The median family size in Canon is 4.73 persons per family, with single male/father families (33 | 19.6%) accounting for the largest median family size of 8.3 persons per family. On the other hand, married-couple families (100 | 59.5%) represent the smallest median family size with 3.21 persons per family.
| Family Type | # Families | Family Size |
| Married-Couple | 100 (59.5%) | 3.21 |
| Single Male/Father | 33 (19.6%) | 8.30 |
| Single Female/Mother | 35 (20.8%) | 5.69 |
| Total Families | 168 (100.0%) | 4.73 |
Median Household Size in Canon
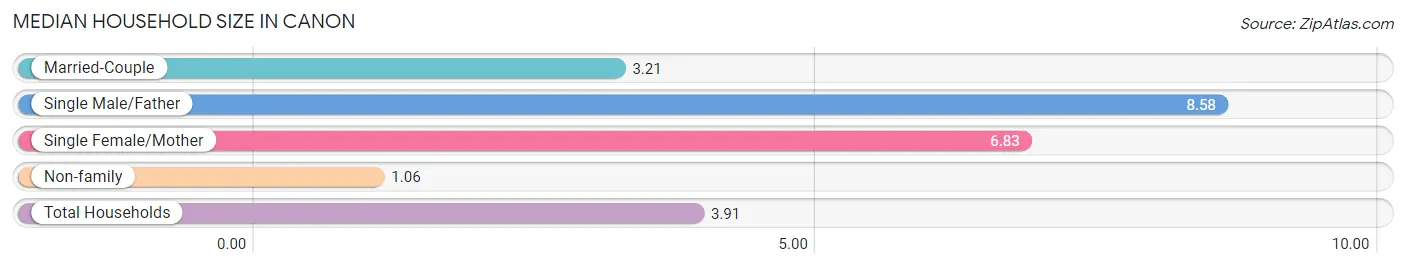
The median household size in Canon is 3.91 persons per household, with single male/father households (33 | 14.2%) accounting for the largest median household size of 8.58 persons per household. non-family households (65 | 27.9%) represent the smallest median household size with 1.06 persons per household.
| Household Type | # Households | Household Size |
| Married-Couple | 100 (42.9%) | 3.21 |
| Single Male/Father | 33 (14.2%) | 8.58 |
| Single Female/Mother | 35 (15.0%) | 6.83 |
| Non-family | 65 (27.9%) | 1.06 |
| Total Households | 233 (100.0%) | 3.91 |
Household Size by Marriage Status in Canon
Out of a total of 233 households in Canon, 168 (72.1%) are family households, while 65 (27.9%) are nonfamily households. The most numerous type of family households are 3-person households, comprising 75, and the most common type of nonfamily households are 1-person households, comprising 62.
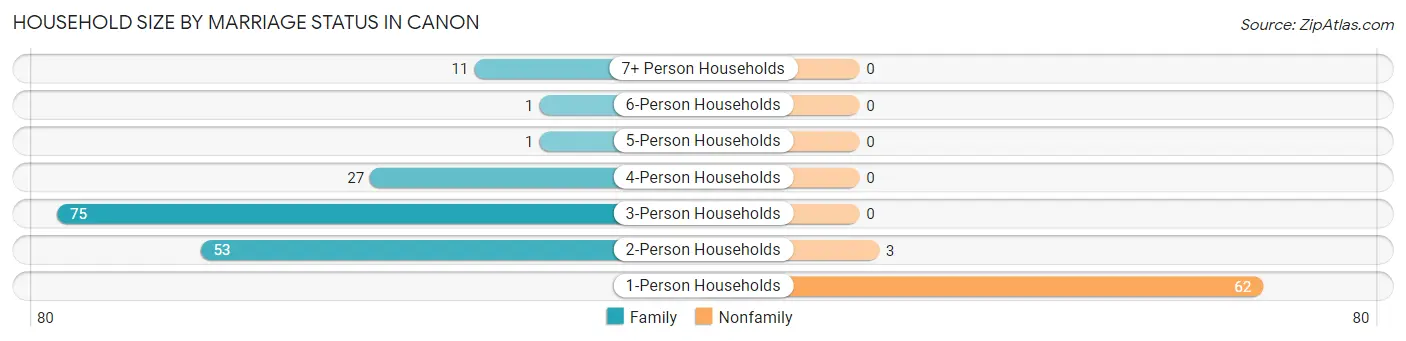
| Household Size | Family Households | Nonfamily Households |
| 1-Person Households | - | 62 (26.6%) |
| 2-Person Households | 53 (22.8%) | 3 (1.3%) |
| 3-Person Households | 75 (32.2%) | 0 (0.0%) |
| 4-Person Households | 27 (11.6%) | 0 (0.0%) |
| 5-Person Households | 1 (0.4%) | 0 (0.0%) |
| 6-Person Households | 1 (0.4%) | 0 (0.0%) |
| 7+ Person Households | 11 (4.7%) | 0 (0.0%) |
| Total | 168 (72.1%) | 65 (27.9%) |
Female Fertility in Canon
Fertility by Age in Canon
Average fertility rate in Canon is 115.0 births per 1,000 women. Women in the age bracket of 20 to 34 years have the highest fertility rate with 175.0 births per 1,000 women. Women in the age bracket of 20 to 34 years acount for 94.4% of all women with births.
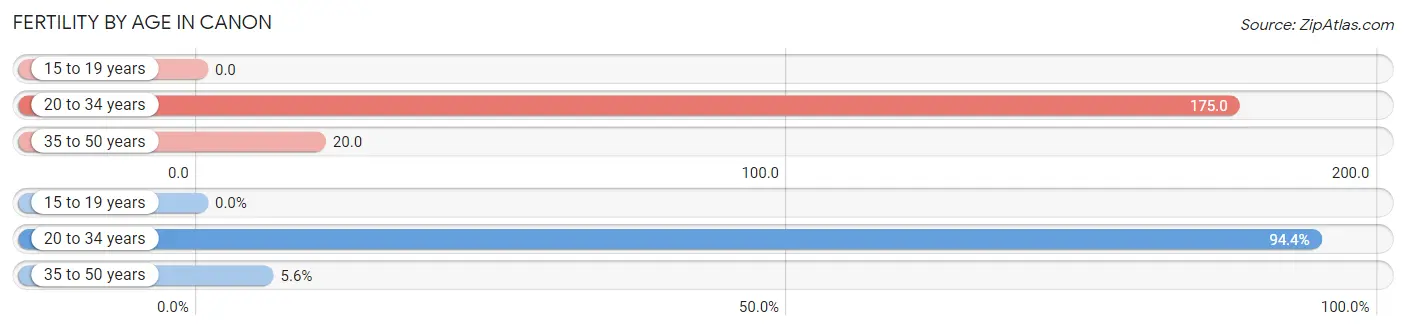
| Age Bracket | Women with Births | Births / 1,000 Women |
| 15 to 19 years | 0 (0.0%) | 0.0 |
| 20 to 34 years | 17 (94.4%) | 175.0 |
| 35 to 50 years | 1 (5.6%) | 20.0 |
| Total | 18 (100.0%) | 115.0 |
Fertility by Age by Marriage Status in Canon
94.4% of women with births (18) in Canon are married. The highest percentage of unmarried women with births falls into 35 to 50 years age bracket with 100.0% of them unmarried at the time of birth, while the lowest percentage of unmarried women with births belong to 20 to 34 years age bracket with 0.0% of them unmarried.
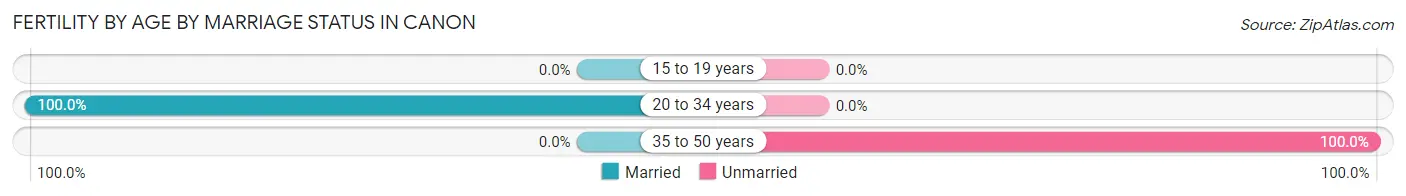
| Age Bracket | Married | Unmarried |
| 15 to 19 years | 0 (0.0%) | 0 (0.0%) |
| 20 to 34 years | 17 (100.0%) | 0 (0.0%) |
| 35 to 50 years | 0 (0.0%) | 1 (100.0%) |
| Total | 17 (94.4%) | 1 (5.6%) |
Fertility by Education in Canon
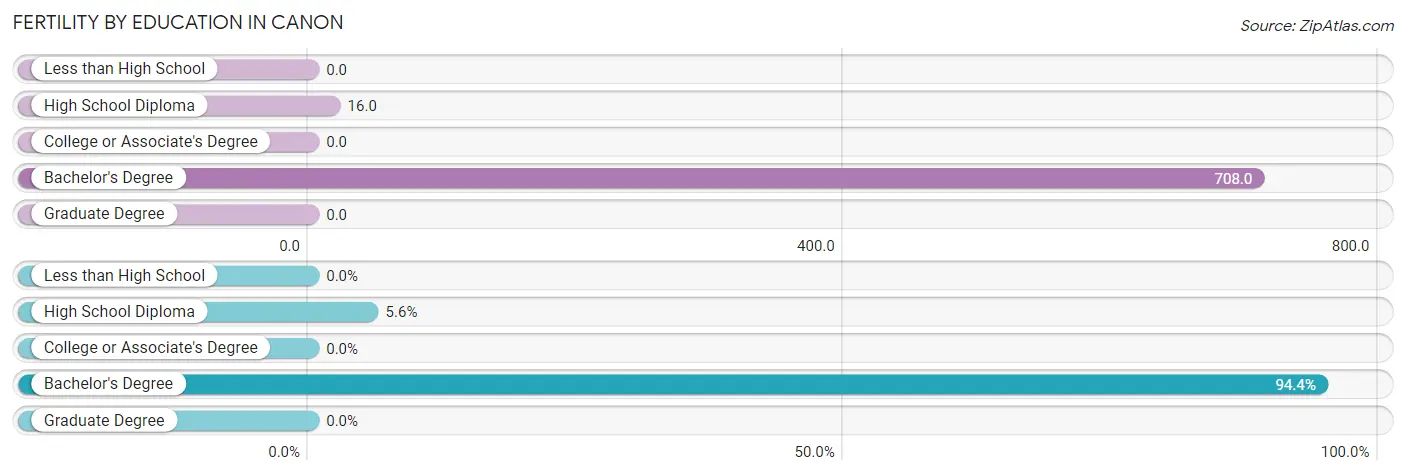
| Educational Attainment | Women with Births | Births / 1,000 Women |
| Less than High School | 0 (0.0%) | 0.0 |
| High School Diploma | 1 (5.6%) | 16.0 |
| College or Associate's Degree | 0 (0.0%) | 0.0 |
| Bachelor's Degree | 17 (94.4%) | 708.0 |
| Graduate Degree | 0 (0.0%) | 0.0 |
| Total | 18 (100.0%) | 115.0 |
Fertility by Education by Marriage Status in Canon
5.6% of women with births in Canon are unmarried. Women with the educational attainment of bachelor's degree are most likely to be married with 100.0% of them married at childbirth, while women with the educational attainment of high school diploma are least likely to be married with 100.0% of them unmarried at childbirth.
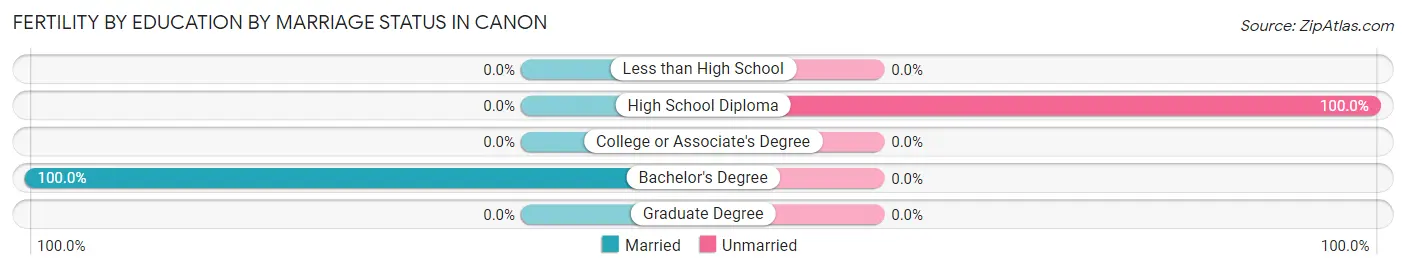
| Educational Attainment | Married | Unmarried |
| Less than High School | 0 (0.0%) | 0 (0.0%) |
| High School Diploma | 0 (0.0%) | 1 (100.0%) |
| College or Associate's Degree | 0 (0.0%) | 0 (0.0%) |
| Bachelor's Degree | 17 (100.0%) | 0 (0.0%) |
| Graduate Degree | 0 (0.0%) | 0 (0.0%) |
| Total | 17 (94.4%) | 1 (5.6%) |
Employment Characteristics in Canon
Employment by Class of Employer in Canon
Among the 264 employed individuals in Canon, private company employees (211 | 79.9%), self-employed (not incorporated) (26 | 9.9%), and not-for-profit organizations (18 | 6.8%) make up the most common classes of employment.
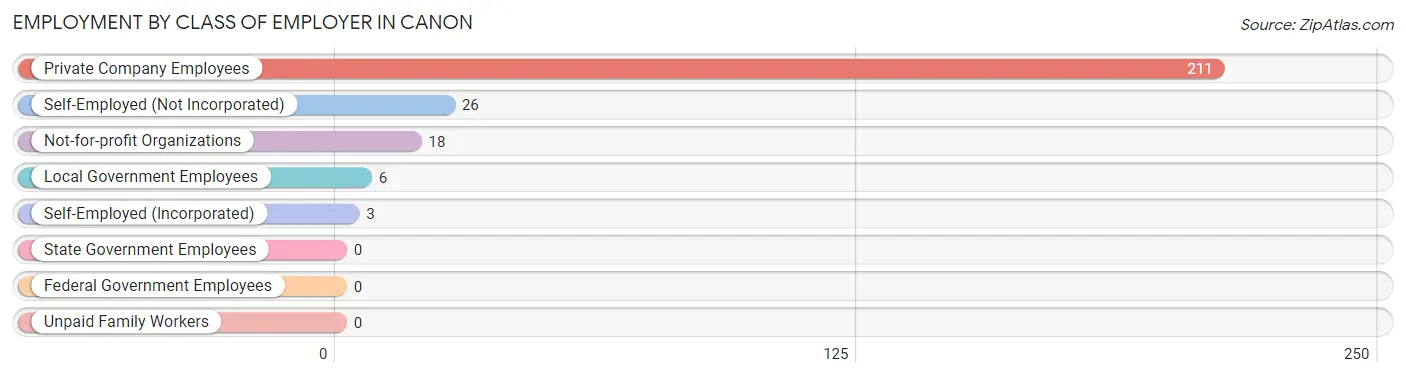
| Employer Class | # Employees | % Employees |
| Private Company Employees | 211 | 79.9% |
| Self-Employed (Incorporated) | 3 | 1.1% |
| Self-Employed (Not Incorporated) | 26 | 9.9% |
| Not-for-profit Organizations | 18 | 6.8% |
| Local Government Employees | 6 | 2.3% |
| State Government Employees | 0 | 0.0% |
| Federal Government Employees | 0 | 0.0% |
| Unpaid Family Workers | 0 | 0.0% |
| Total | 264 | 100.0% |
Employment Status by Age in Canon
According to the labor force statistics for Canon, out of the total population over 16 years of age (499), 54.1% or 270 individuals are in the labor force, with 0.4% or 1 of them unemployed. The age group with the highest labor force participation rate is 30 to 34 years, with 93.4% or 85 individuals in the labor force. Within the labor force, the 35 to 44 years age range has the highest percentage of unemployed individuals, with 1.5% or 1 of them being unemployed.
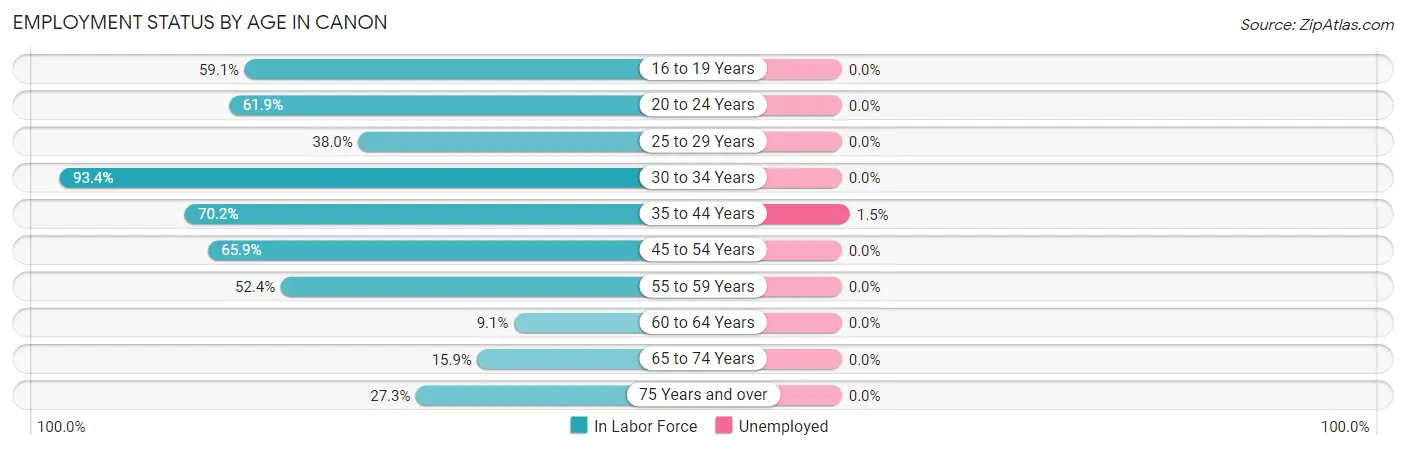
| Age Bracket | In Labor Force | Unemployed |
| 16 to 19 Years | 13 (59.1%) | 0 (0.0%) |
| 20 to 24 Years | 13 (61.9%) | 0 (0.0%) |
| 25 to 29 Years | 19 (38.0%) | 0 (0.0%) |
| 30 to 34 Years | 85 (93.4%) | 0 (0.0%) |
| 35 to 44 Years | 66 (70.2%) | 1 (1.5%) |
| 45 to 54 Years | 29 (65.9%) | 0 (0.0%) |
| 55 to 59 Years | 22 (52.4%) | 0 (0.0%) |
| 60 to 64 Years | 3 (9.1%) | 0 (0.0%) |
| 65 to 74 Years | 11 (15.9%) | 0 (0.0%) |
| 75 Years and over | 9 (27.3%) | 0 (0.0%) |
| Total | 270 (54.1%) | 1 (0.4%) |
Employment Status by Educational Attainment in Canon
According to labor force statistics for Canon, 63.3% of individuals (224) out of the total population between 25 and 64 years of age (354) are in the labor force, with 0.4% or 1 of them being unemployed. The group with the highest labor force participation rate are those with the educational attainment of bachelor's degree or higher, with 81.1% or 30 individuals in the labor force. Within the labor force, individuals with high school diploma education have the highest percentage of unemployment, with 1.2% or 1 of them being unemployed.
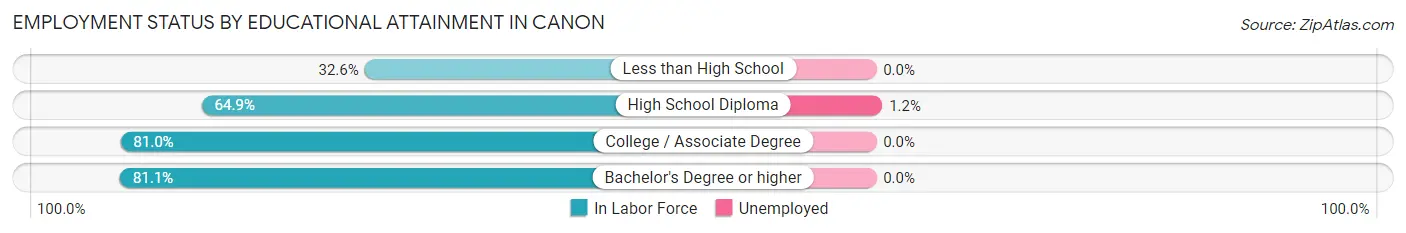
| Educational Attainment | In Labor Force | Unemployed |
| Less than High School | 28 (32.6%) | 0 (0.0%) |
| High School Diploma | 85 (64.9%) | 2 (1.2%) |
| College / Associate Degree | 81 (81.0%) | 0 (0.0%) |
| Bachelor's Degree or higher | 30 (81.1%) | 0 (0.0%) |
| Total | 224 (63.3%) | 1 (0.4%) |
Employment Occupations by Sex in Canon
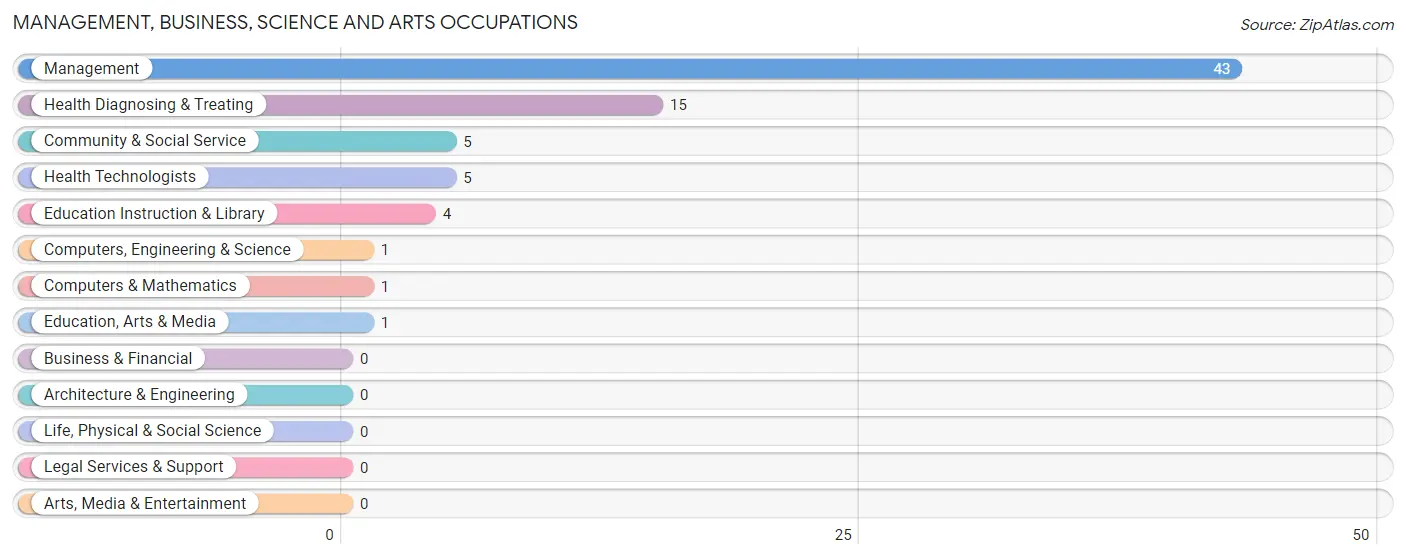
Management, Business, Science and Arts Occupations
The most common Management, Business, Science and Arts occupations in Canon are Management (43 | 16.0%), Health Diagnosing & Treating (15 | 5.6%), Community & Social Service (5 | 1.9%), Health Technologists (5 | 1.9%), and Education Instruction & Library (4 | 1.5%).
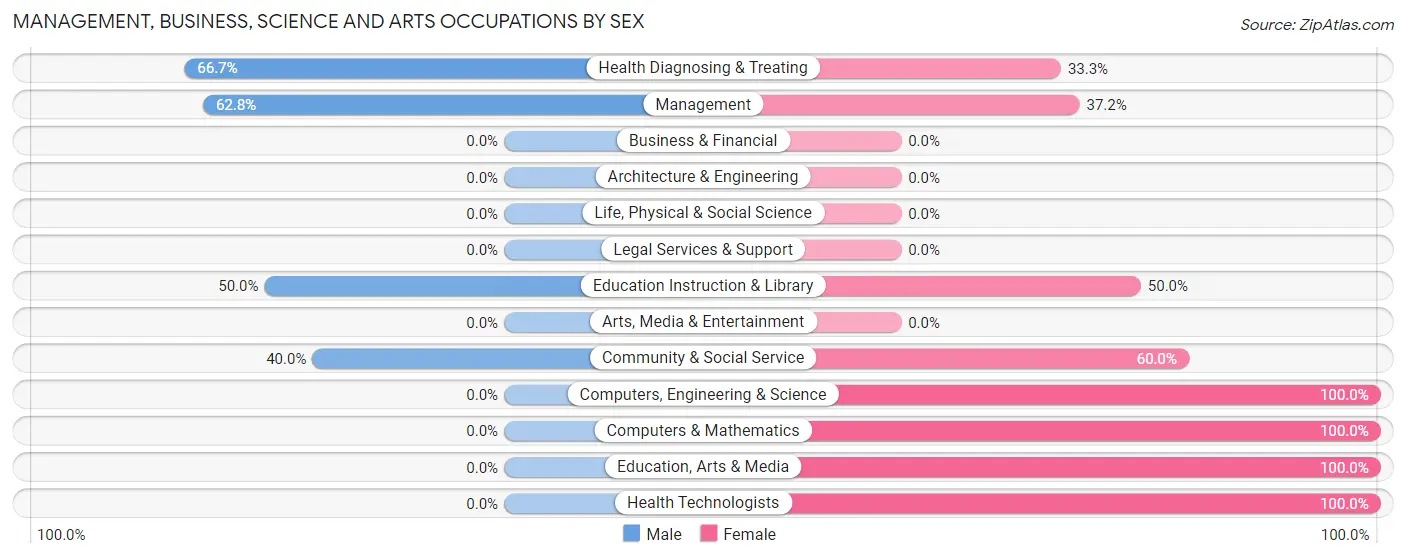
Management, Business, Science and Arts Occupations by Sex
Within the Management, Business, Science and Arts occupations in Canon, the most male-oriented occupations are Health Diagnosing & Treating (66.7%), Management (62.8%), and Education Instruction & Library (50.0%), while the most female-oriented occupations are Computers, Engineering & Science (100.0%), Computers & Mathematics (100.0%), and Education, Arts & Media (100.0%).
| Occupation | Male | Female |
| Management | 27 (62.8%) | 16 (37.2%) |
| Business & Financial | 0 (0.0%) | 0 (0.0%) |
| Computers, Engineering & Science | 0 (0.0%) | 1 (100.0%) |
| Computers & Mathematics | 0 (0.0%) | 1 (100.0%) |
| Architecture & Engineering | 0 (0.0%) | 0 (0.0%) |
| Life, Physical & Social Science | 0 (0.0%) | 0 (0.0%) |
| Community & Social Service | 2 (40.0%) | 3 (60.0%) |
| Education, Arts & Media | 0 (0.0%) | 1 (100.0%) |
| Legal Services & Support | 0 (0.0%) | 0 (0.0%) |
| Education Instruction & Library | 2 (50.0%) | 2 (50.0%) |
| Arts, Media & Entertainment | 0 (0.0%) | 0 (0.0%) |
| Health Diagnosing & Treating | 10 (66.7%) | 5 (33.3%) |
| Health Technologists | 0 (0.0%) | 5 (100.0%) |
| Total (Category) | 39 (60.9%) | 25 (39.1%) |
| Total (Overall) | 182 (67.7%) | 87 (32.3%) |
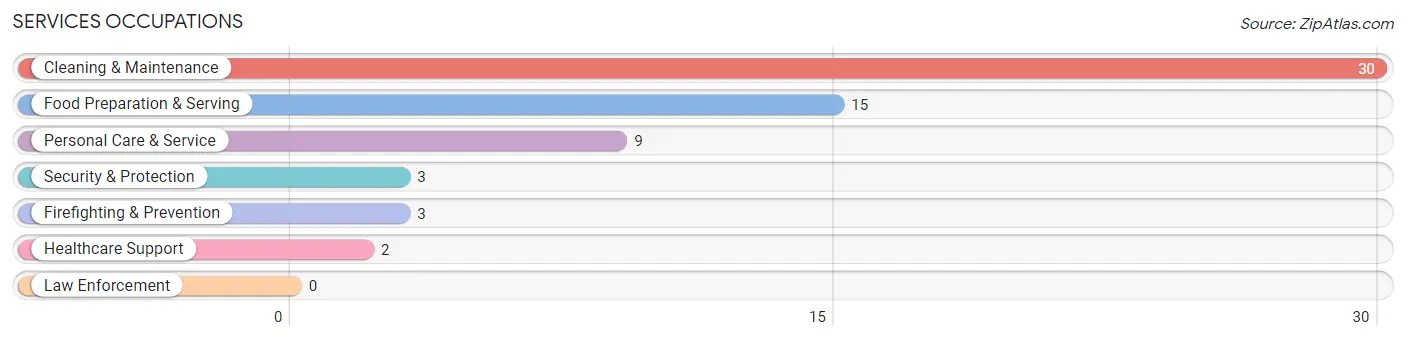
Services Occupations
The most common Services occupations in Canon are Cleaning & Maintenance (30 | 11.2%), Food Preparation & Serving (15 | 5.6%), Personal Care & Service (9 | 3.4%), Security & Protection (3 | 1.1%), and Firefighting & Prevention (3 | 1.1%).
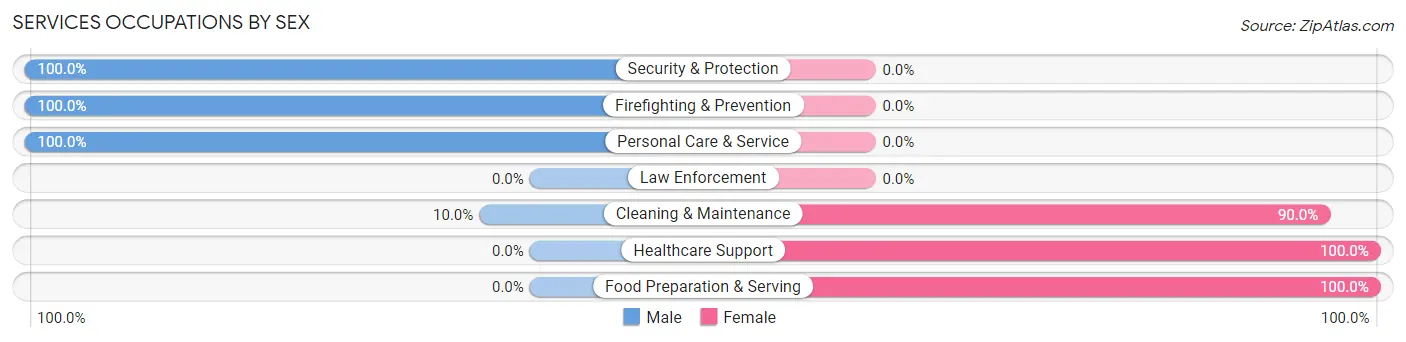
Services Occupations by Sex
Within the Services occupations in Canon, the most male-oriented occupations are Security & Protection (100.0%), Firefighting & Prevention (100.0%), and Personal Care & Service (100.0%), while the most female-oriented occupations are Healthcare Support (100.0%), Food Preparation & Serving (100.0%), and Cleaning & Maintenance (90.0%).
| Occupation | Male | Female |
| Healthcare Support | 0 (0.0%) | 2 (100.0%) |
| Security & Protection | 3 (100.0%) | 0 (0.0%) |
| Firefighting & Prevention | 3 (100.0%) | 0 (0.0%) |
| Law Enforcement | 0 (0.0%) | 0 (0.0%) |
| Food Preparation & Serving | 0 (0.0%) | 15 (100.0%) |
| Cleaning & Maintenance | 3 (10.0%) | 27 (90.0%) |
| Personal Care & Service | 9 (100.0%) | 0 (0.0%) |
| Total (Category) | 15 (25.4%) | 44 (74.6%) |
| Total (Overall) | 182 (67.7%) | 87 (32.3%) |
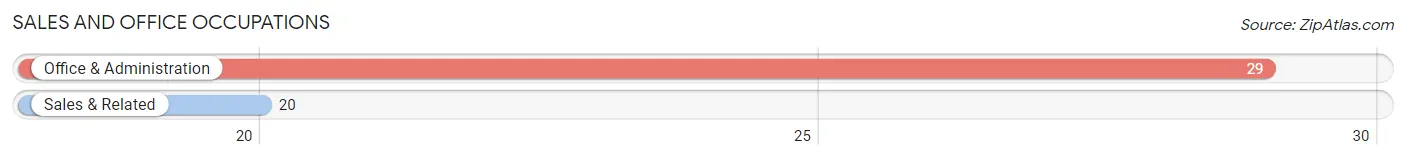
Sales and Office Occupations
The most common Sales and Office occupations in Canon are Office & Administration (29 | 10.8%), and Sales & Related (20 | 7.4%).
Sales and Office Occupations by Sex
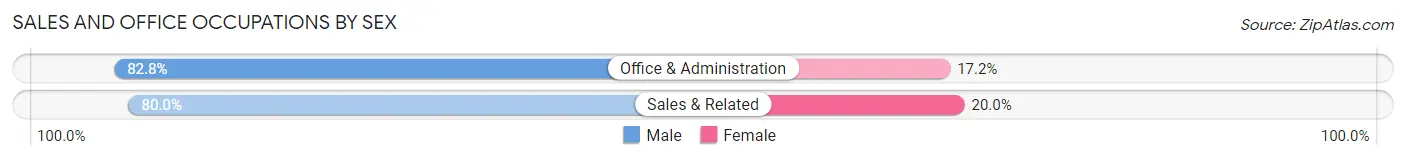
| Occupation | Male | Female |
| Sales & Related | 16 (80.0%) | 4 (20.0%) |
| Office & Administration | 24 (82.8%) | 5 (17.2%) |
| Total (Category) | 40 (81.6%) | 9 (18.4%) |
| Total (Overall) | 182 (67.7%) | 87 (32.3%) |
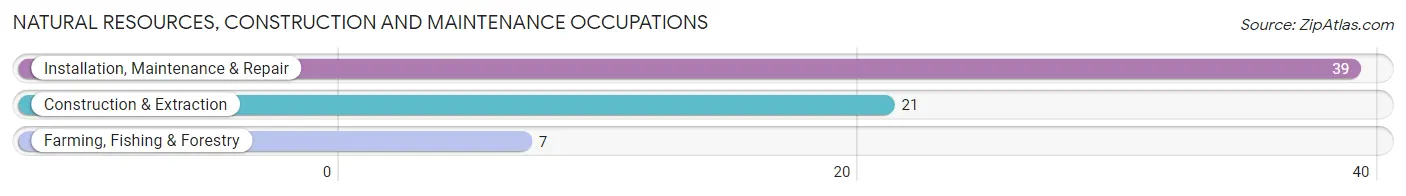
Natural Resources, Construction and Maintenance Occupations
The most common Natural Resources, Construction and Maintenance occupations in Canon are Installation, Maintenance & Repair (39 | 14.5%), Construction & Extraction (21 | 7.8%), and Farming, Fishing & Forestry (7 | 2.6%).
Natural Resources, Construction and Maintenance Occupations by Sex
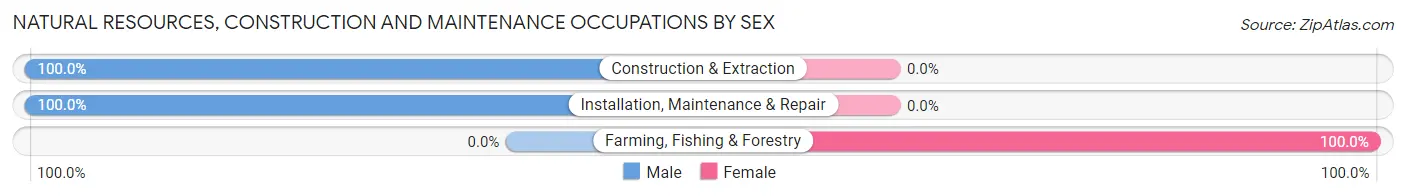
| Occupation | Male | Female |
| Farming, Fishing & Forestry | 0 (0.0%) | 7 (100.0%) |
| Construction & Extraction | 21 (100.0%) | 0 (0.0%) |
| Installation, Maintenance & Repair | 39 (100.0%) | 0 (0.0%) |
| Total (Category) | 60 (89.5%) | 7 (10.4%) |
| Total (Overall) | 182 (67.7%) | 87 (32.3%) |
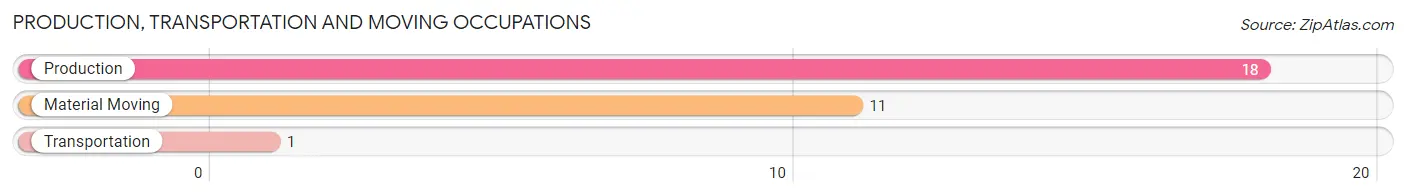
Production, Transportation and Moving Occupations
The most common Production, Transportation and Moving occupations in Canon are Production (18 | 6.7%), Material Moving (11 | 4.1%), and Transportation (1 | 0.4%).
Production, Transportation and Moving Occupations by Sex
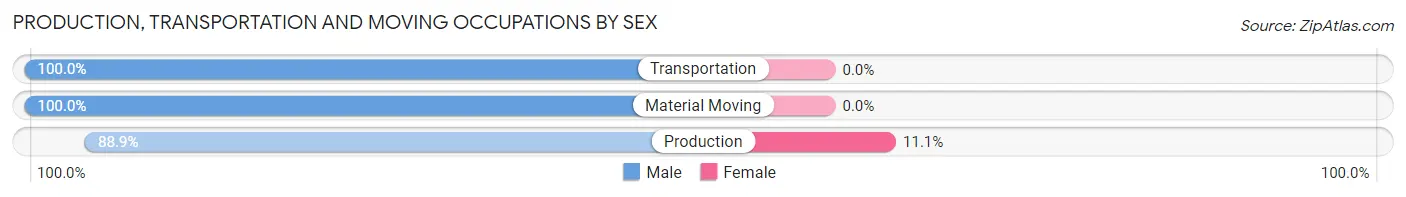
| Occupation | Male | Female |
| Production | 16 (88.9%) | 2 (11.1%) |
| Transportation | 1 (100.0%) | 0 (0.0%) |
| Material Moving | 11 (100.0%) | 0 (0.0%) |
| Total (Category) | 28 (93.3%) | 2 (6.7%) |
| Total (Overall) | 182 (67.7%) | 87 (32.3%) |
Employment Industries by Sex in Canon
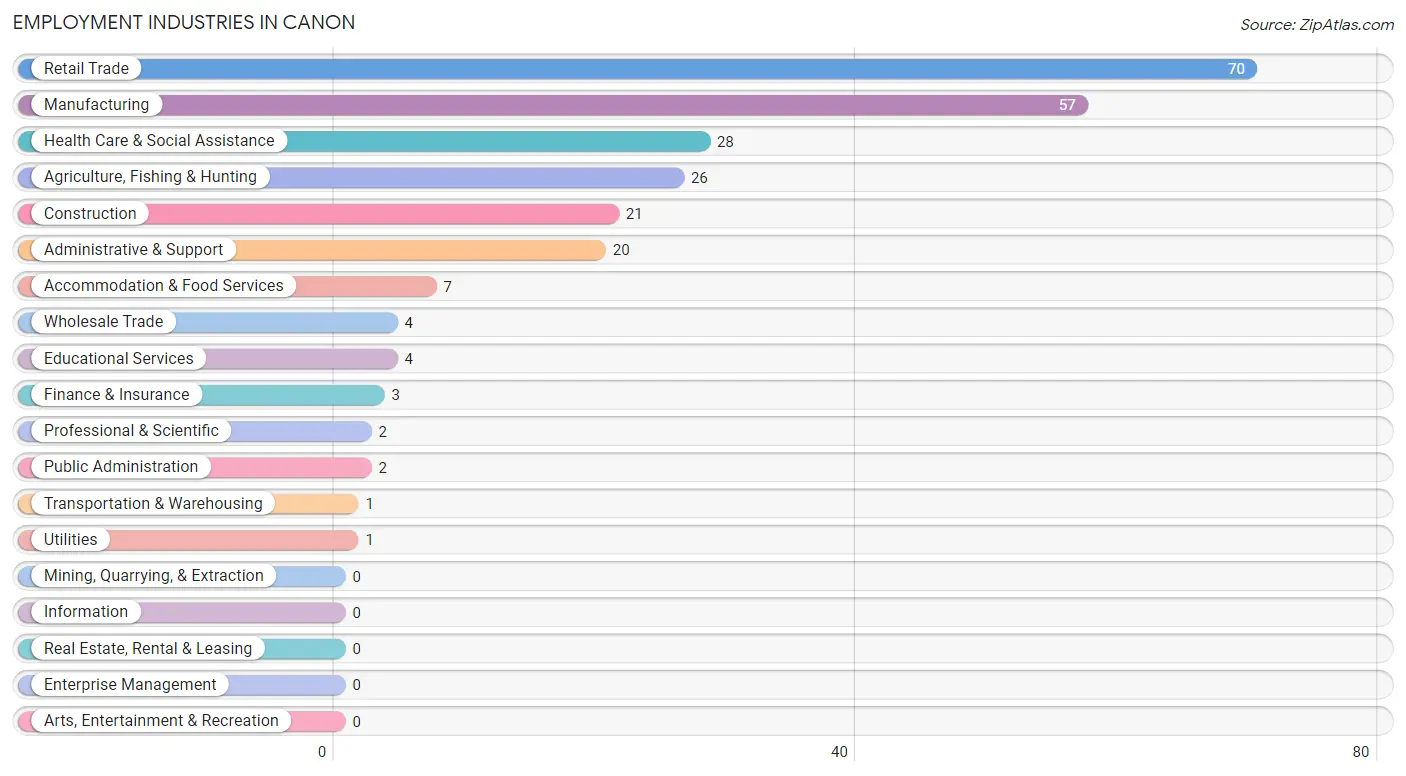
Employment Industries in Canon
The major employment industries in Canon include Retail Trade (70 | 26.0%), Manufacturing (57 | 21.2%), Health Care & Social Assistance (28 | 10.4%), Agriculture, Fishing & Hunting (26 | 9.7%), and Construction (21 | 7.8%).
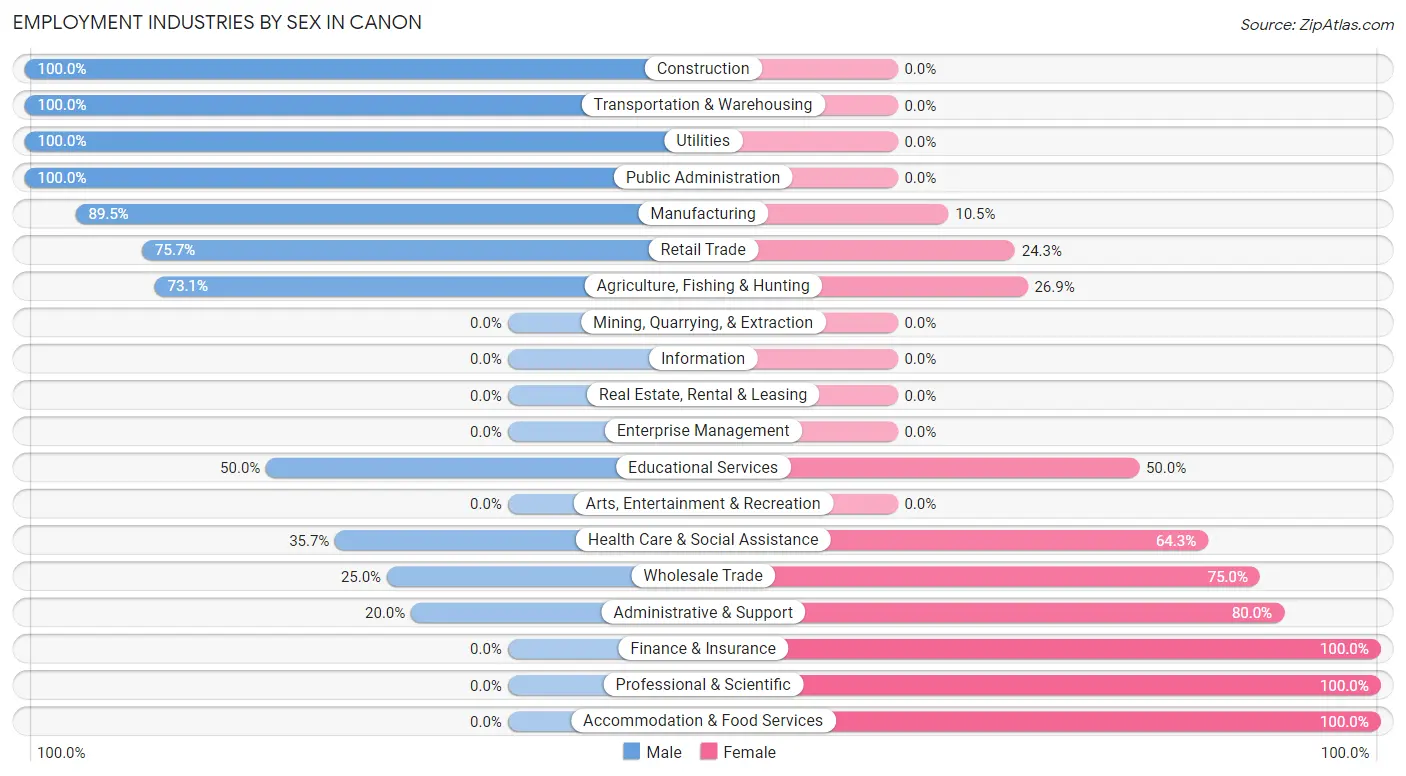
Employment Industries by Sex in Canon
The Canon industries that see more men than women are Construction (100.0%), Transportation & Warehousing (100.0%), and Utilities (100.0%), whereas the industries that tend to have a higher number of women are Finance & Insurance (100.0%), Professional & Scientific (100.0%), and Accommodation & Food Services (100.0%).
| Industry | Male | Female |
| Agriculture, Fishing & Hunting | 19 (73.1%) | 7 (26.9%) |
| Mining, Quarrying, & Extraction | 0 (0.0%) | 0 (0.0%) |
| Construction | 21 (100.0%) | 0 (0.0%) |
| Manufacturing | 51 (89.5%) | 6 (10.5%) |
| Wholesale Trade | 1 (25.0%) | 3 (75.0%) |
| Retail Trade | 53 (75.7%) | 17 (24.3%) |
| Transportation & Warehousing | 1 (100.0%) | 0 (0.0%) |
| Utilities | 1 (100.0%) | 0 (0.0%) |
| Information | 0 (0.0%) | 0 (0.0%) |
| Finance & Insurance | 0 (0.0%) | 3 (100.0%) |
| Real Estate, Rental & Leasing | 0 (0.0%) | 0 (0.0%) |
| Professional & Scientific | 0 (0.0%) | 2 (100.0%) |
| Enterprise Management | 0 (0.0%) | 0 (0.0%) |
| Administrative & Support | 4 (20.0%) | 16 (80.0%) |
| Educational Services | 2 (50.0%) | 2 (50.0%) |
| Health Care & Social Assistance | 10 (35.7%) | 18 (64.3%) |
| Arts, Entertainment & Recreation | 0 (0.0%) | 0 (0.0%) |
| Accommodation & Food Services | 0 (0.0%) | 7 (100.0%) |
| Public Administration | 2 (100.0%) | 0 (0.0%) |
| Total | 182 (67.7%) | 87 (32.3%) |
Education in Canon
School Enrollment in Canon
The most common levels of schooling among the 363 students in Canon are kindergarten (141 | 38.8%), middle school (89 | 24.5%), and elementary school (49 | 13.5%).
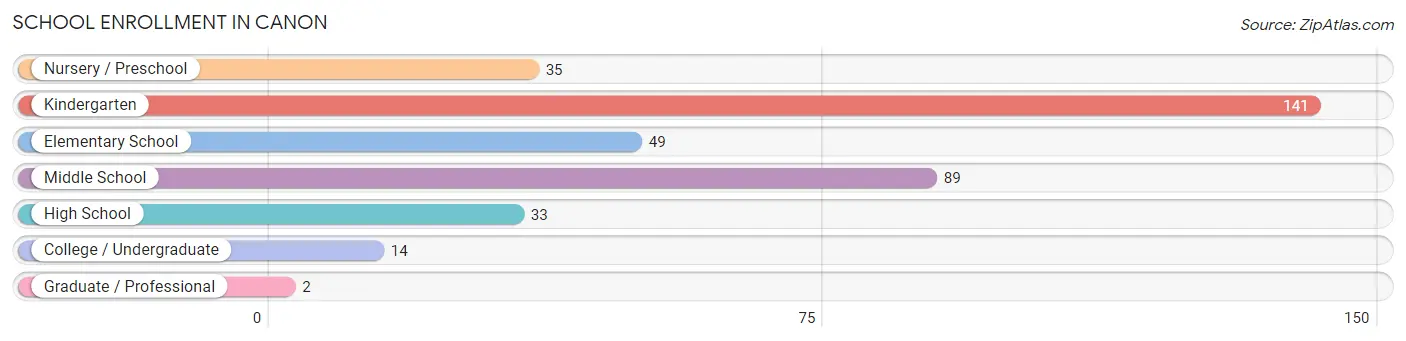
| School Level | # Students | % Students |
| Nursery / Preschool | 35 | 9.6% |
| Kindergarten | 141 | 38.8% |
| Elementary School | 49 | 13.5% |
| Middle School | 89 | 24.5% |
| High School | 33 | 9.1% |
| College / Undergraduate | 14 | 3.9% |
| Graduate / Professional | 2 | 0.5% |
| Total | 363 | 100.0% |
School Enrollment by Age by Funding Source in Canon
Out of a total of 363 students who are enrolled in schools in Canon, 4 (1.1%) attend a private institution, while the remaining 359 (98.9%) are enrolled in public schools. The age group of 15 to 17 year olds has the highest likelihood of being enrolled in private schools, with 1 (8.3% in the age bracket) enrolled. Conversely, the age group of 3 to 4 year olds has the lowest likelihood of being enrolled in a private school, with 7 (100.0% in the age bracket) attending a public institution.
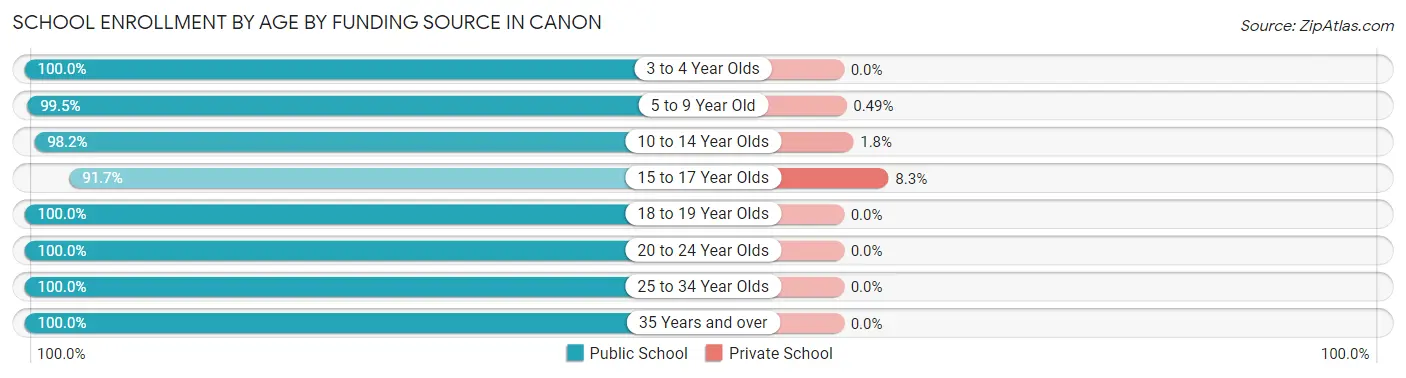
| Age Bracket | Public School | Private School |
| 3 to 4 Year Olds | 7 (100.0%) | 0 (0.0%) |
| 5 to 9 Year Old | 203 (99.5%) | 1 (0.5%) |
| 10 to 14 Year Olds | 110 (98.2%) | 2 (1.8%) |
| 15 to 17 Year Olds | 11 (91.7%) | 1 (8.3%) |
| 18 to 19 Year Olds | 12 (100.0%) | 0 (0.0%) |
| 20 to 24 Year Olds | 10 (100.0%) | 0 (0.0%) |
| 25 to 34 Year Olds | 3 (100.0%) | 0 (0.0%) |
| 35 Years and over | 3 (100.0%) | 0 (0.0%) |
| Total | 359 (98.9%) | 4 (1.1%) |
Educational Attainment by Field of Study in Canon
Social sciences (22 | 51.2%), computers & mathematics (7 | 16.3%), arts & humanities (5 | 11.6%), engineering (3 | 7.0%), and literature & languages (3 | 7.0%) are the most common fields of study among 43 individuals in Canon who have obtained a bachelor's degree or higher.
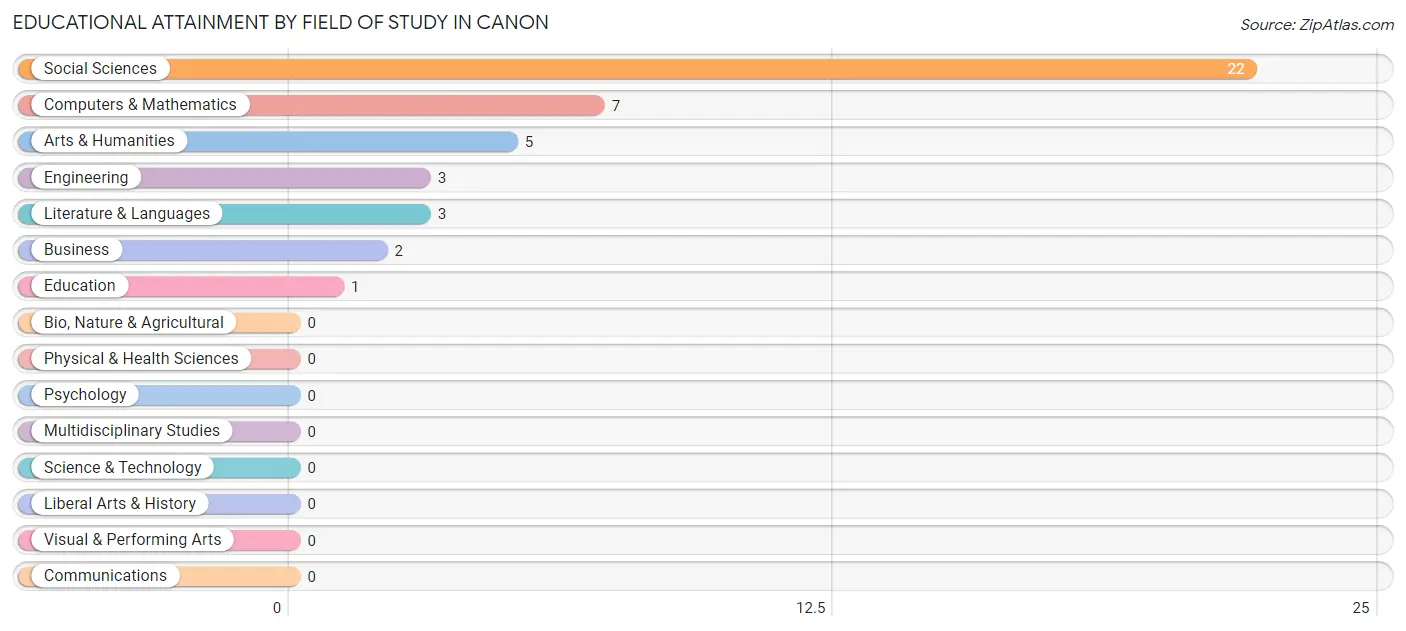
| Field of Study | # Graduates | % Graduates |
| Computers & Mathematics | 7 | 16.3% |
| Bio, Nature & Agricultural | 0 | 0.0% |
| Physical & Health Sciences | 0 | 0.0% |
| Psychology | 0 | 0.0% |
| Social Sciences | 22 | 51.2% |
| Engineering | 3 | 7.0% |
| Multidisciplinary Studies | 0 | 0.0% |
| Science & Technology | 0 | 0.0% |
| Business | 2 | 4.6% |
| Education | 1 | 2.3% |
| Literature & Languages | 3 | 7.0% |
| Liberal Arts & History | 0 | 0.0% |
| Visual & Performing Arts | 0 | 0.0% |
| Communications | 0 | 0.0% |
| Arts & Humanities | 5 | 11.6% |
| Total | 43 | 100.0% |
Transportation & Commute in Canon
Vehicle Availability by Sex in Canon
The most prevalent vehicle ownership categories in Canon are males with 2 vehicles (67, accounting for 37.2%) and females with 2 vehicles (45, making up 79.8%).
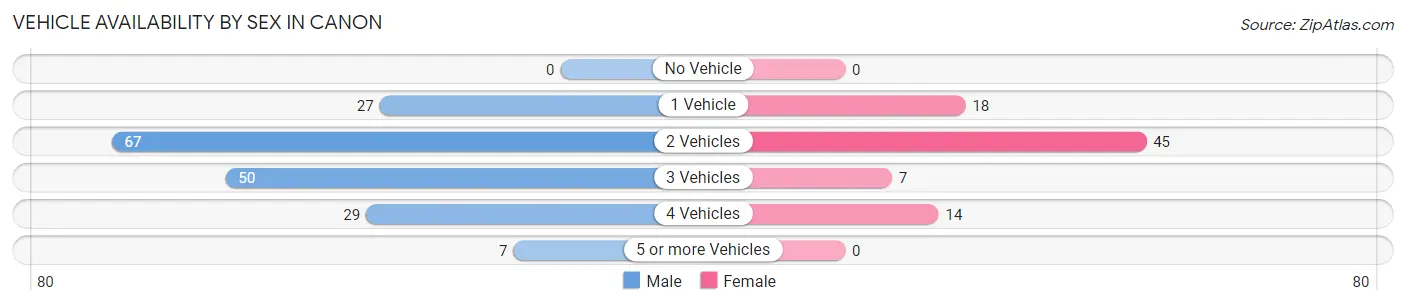
| Vehicles Available | Male | Female |
| No Vehicle | 0 (0.0%) | 0 (0.0%) |
| 1 Vehicle | 27 (15.0%) | 18 (21.4%) |
| 2 Vehicles | 67 (37.2%) | 45 (53.6%) |
| 3 Vehicles | 50 (27.8%) | 7 (8.3%) |
| 4 Vehicles | 29 (16.1%) | 14 (16.7%) |
| 5 or more Vehicles | 7 (3.9%) | 0 (0.0%) |
| Total | 180 (100.0%) | 84 (100.0%) |
Commute Time in Canon
The most frequently occuring commute durations in Canon are 45 to 59 minutes (49 commuters, 19.9%), 5 to 9 minutes (37 commuters, 15.0%), and 15 to 19 minutes (36 commuters, 14.6%).
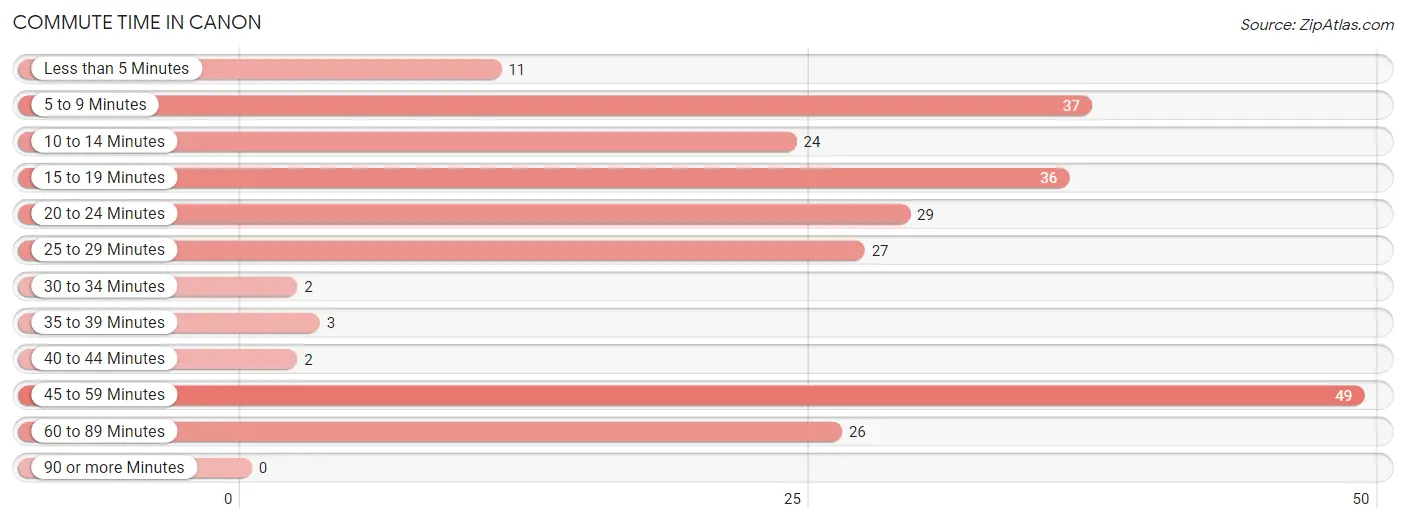
| Commute Time | # Commuters | % Commuters |
| Less than 5 Minutes | 11 | 4.5% |
| 5 to 9 Minutes | 37 | 15.0% |
| 10 to 14 Minutes | 24 | 9.8% |
| 15 to 19 Minutes | 36 | 14.6% |
| 20 to 24 Minutes | 29 | 11.8% |
| 25 to 29 Minutes | 27 | 11.0% |
| 30 to 34 Minutes | 2 | 0.8% |
| 35 to 39 Minutes | 3 | 1.2% |
| 40 to 44 Minutes | 2 | 0.8% |
| 45 to 59 Minutes | 49 | 19.9% |
| 60 to 89 Minutes | 26 | 10.6% |
| 90 or more Minutes | 0 | 0.0% |
Commute Time by Sex in Canon
The most common commute times in Canon are 15 to 19 minutes (32 commuters, 19.5%) for males and 5 to 9 minutes (27 commuters, 32.9%) for females.
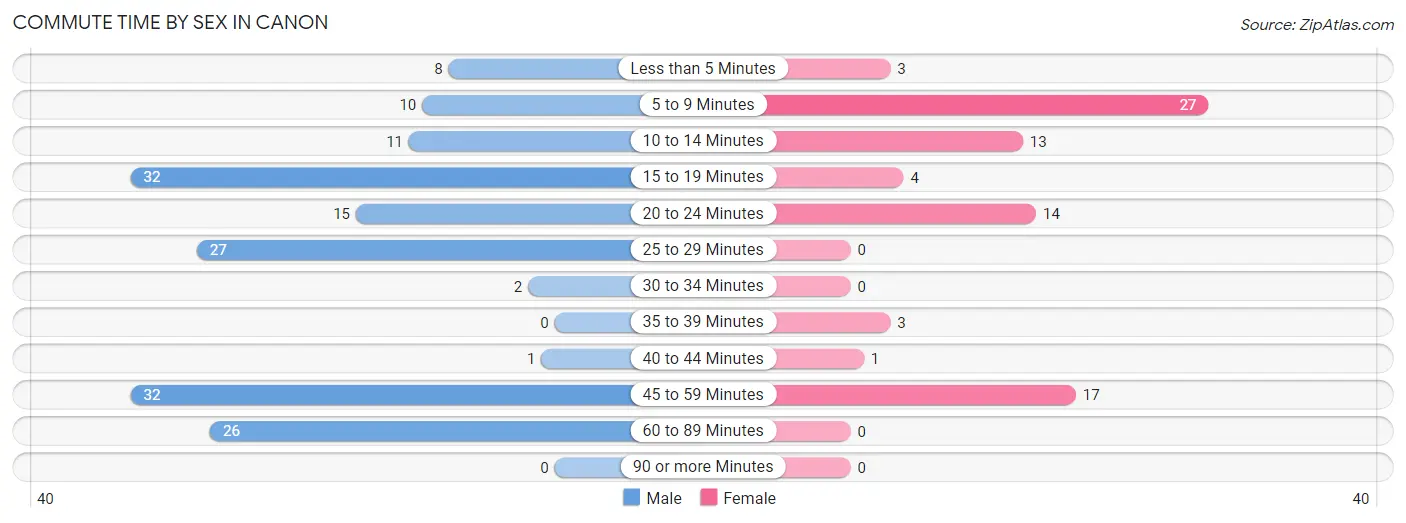
| Commute Time | Male | Female |
| Less than 5 Minutes | 8 (4.9%) | 3 (3.7%) |
| 5 to 9 Minutes | 10 (6.1%) | 27 (32.9%) |
| 10 to 14 Minutes | 11 (6.7%) | 13 (15.9%) |
| 15 to 19 Minutes | 32 (19.5%) | 4 (4.9%) |
| 20 to 24 Minutes | 15 (9.1%) | 14 (17.1%) |
| 25 to 29 Minutes | 27 (16.5%) | 0 (0.0%) |
| 30 to 34 Minutes | 2 (1.2%) | 0 (0.0%) |
| 35 to 39 Minutes | 0 (0.0%) | 3 (3.7%) |
| 40 to 44 Minutes | 1 (0.6%) | 1 (1.2%) |
| 45 to 59 Minutes | 32 (19.5%) | 17 (20.7%) |
| 60 to 89 Minutes | 26 (15.9%) | 0 (0.0%) |
| 90 or more Minutes | 0 (0.0%) | 0 (0.0%) |
Time of Departure to Work by Sex in Canon
The most frequent times of departure to work in Canon are 7:00 AM to 7:29 AM (55, 33.5%) for males and 7:00 AM to 7:29 AM (23, 28.1%) for females.
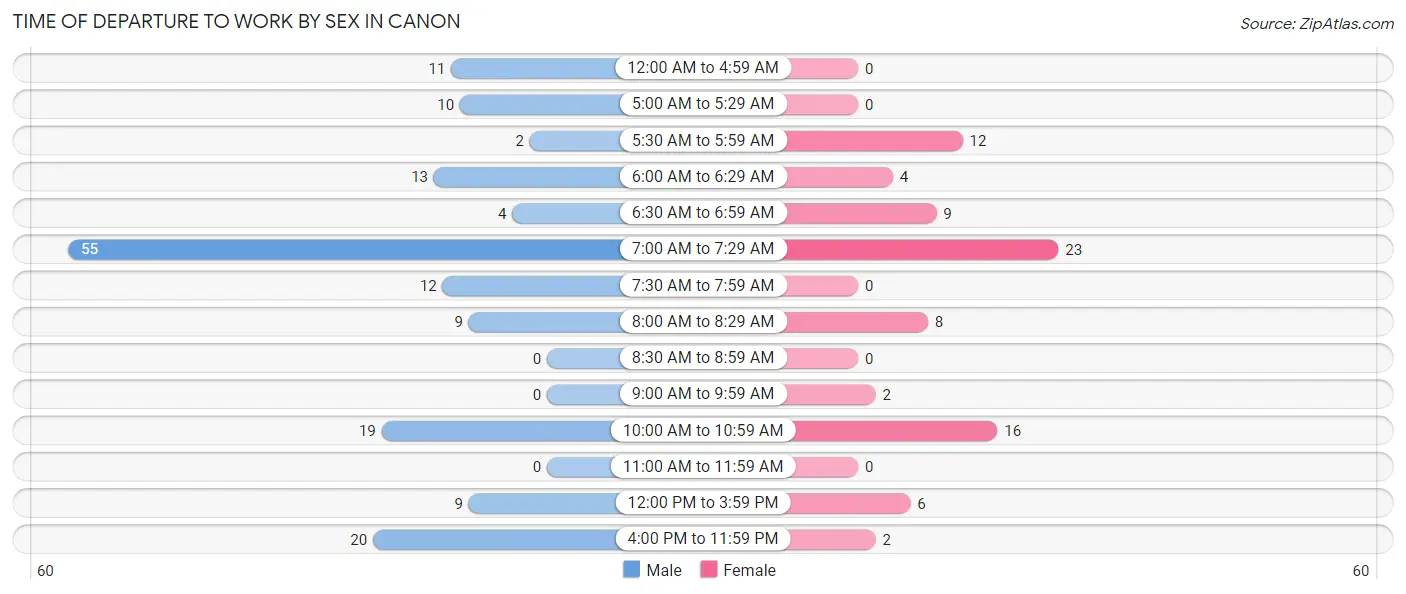
| Time of Departure | Male | Female |
| 12:00 AM to 4:59 AM | 11 (6.7%) | 0 (0.0%) |
| 5:00 AM to 5:29 AM | 10 (6.1%) | 0 (0.0%) |
| 5:30 AM to 5:59 AM | 2 (1.2%) | 12 (14.6%) |
| 6:00 AM to 6:29 AM | 13 (7.9%) | 4 (4.9%) |
| 6:30 AM to 6:59 AM | 4 (2.4%) | 9 (11.0%) |
| 7:00 AM to 7:29 AM | 55 (33.5%) | 23 (28.1%) |
| 7:30 AM to 7:59 AM | 12 (7.3%) | 0 (0.0%) |
| 8:00 AM to 8:29 AM | 9 (5.5%) | 8 (9.8%) |
| 8:30 AM to 8:59 AM | 0 (0.0%) | 0 (0.0%) |
| 9:00 AM to 9:59 AM | 0 (0.0%) | 2 (2.4%) |
| 10:00 AM to 10:59 AM | 19 (11.6%) | 16 (19.5%) |
| 11:00 AM to 11:59 AM | 0 (0.0%) | 0 (0.0%) |
| 12:00 PM to 3:59 PM | 9 (5.5%) | 6 (7.3%) |
| 4:00 PM to 11:59 PM | 20 (12.2%) | 2 (2.4%) |
| Total | 164 (100.0%) | 82 (100.0%) |
Housing Occupancy in Canon
Occupancy by Ownership in Canon
Of the total 233 dwellings in Canon, owner-occupied units account for 140 (60.1%), while renter-occupied units make up 93 (39.9%).
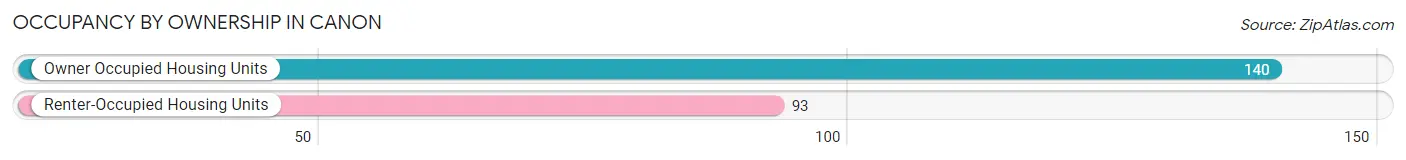
| Occupancy | # Housing Units | % Housing Units |
| Owner Occupied Housing Units | 140 | 60.1% |
| Renter-Occupied Housing Units | 93 | 39.9% |
| Total Occupied Housing Units | 233 | 100.0% |
Occupancy by Household Size in Canon
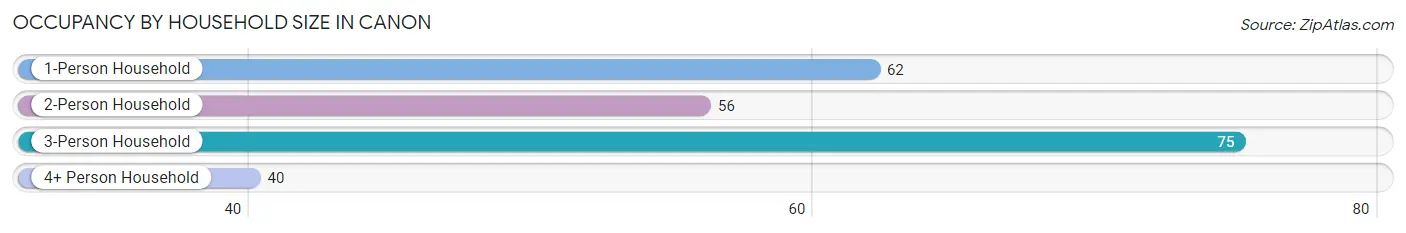
| Household Size | # Housing Units | % Housing Units |
| 1-Person Household | 62 | 26.6% |
| 2-Person Household | 56 | 24.0% |
| 3-Person Household | 75 | 32.2% |
| 4+ Person Household | 40 | 17.2% |
| Total Housing Units | 233 | 100.0% |
Occupancy by Ownership by Household Size in Canon
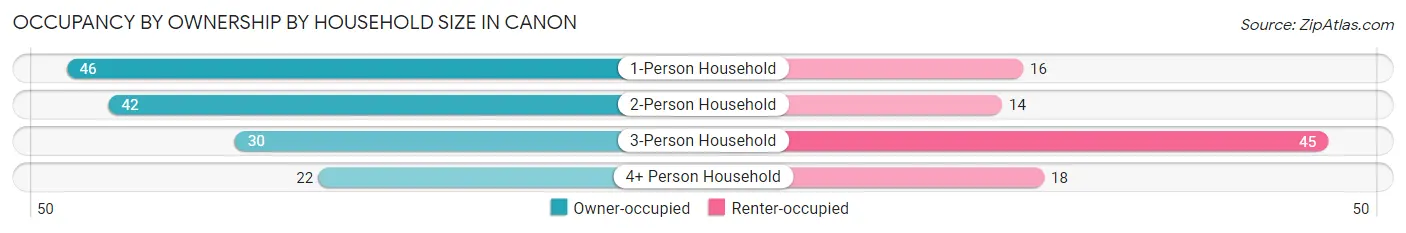
| Household Size | Owner-occupied | Renter-occupied |
| 1-Person Household | 46 (74.2%) | 16 (25.8%) |
| 2-Person Household | 42 (75.0%) | 14 (25.0%) |
| 3-Person Household | 30 (40.0%) | 45 (60.0%) |
| 4+ Person Household | 22 (55.0%) | 18 (45.0%) |
| Total Housing Units | 140 (60.1%) | 93 (39.9%) |
Occupancy by Educational Attainment in Canon
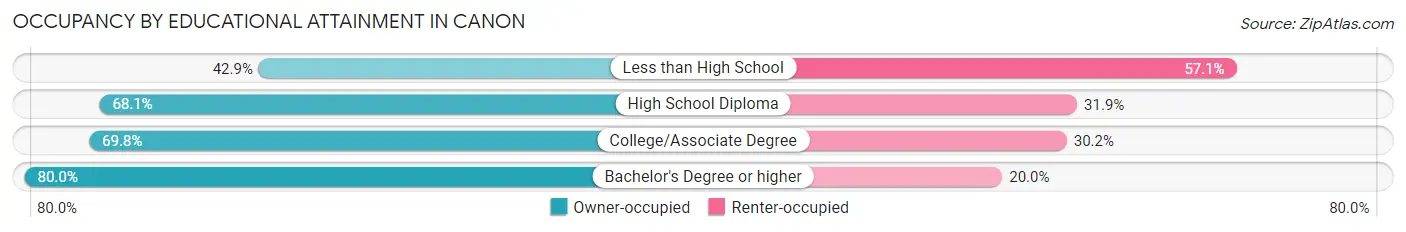
| Household Size | Owner-occupied | Renter-occupied |
| Less than High School | 39 (42.9%) | 52 (57.1%) |
| High School Diploma | 47 (68.1%) | 22 (31.9%) |
| College/Associate Degree | 30 (69.8%) | 13 (30.2%) |
| Bachelor's Degree or higher | 24 (80.0%) | 6 (20.0%) |
Occupancy by Age of Householder in Canon
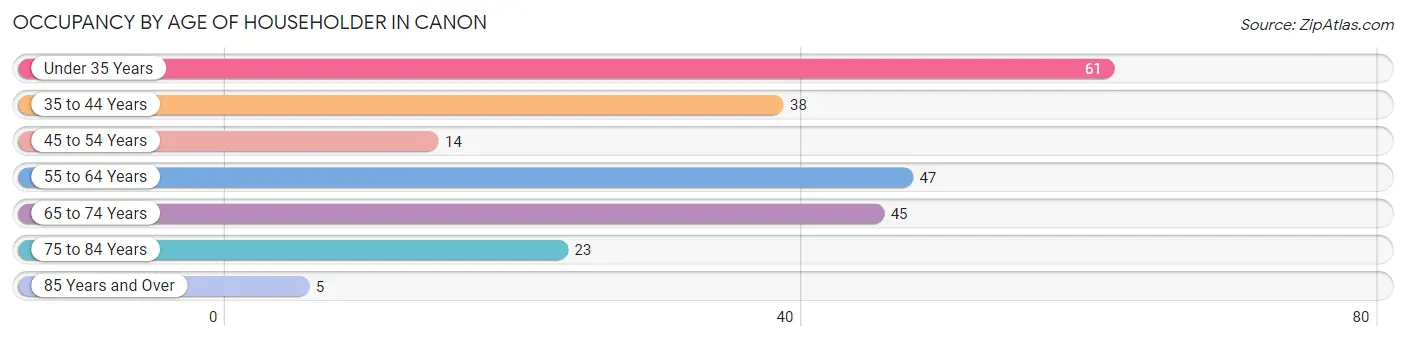
| Age Bracket | # Households | % Households |
| Under 35 Years | 61 | 26.2% |
| 35 to 44 Years | 38 | 16.3% |
| 45 to 54 Years | 14 | 6.0% |
| 55 to 64 Years | 47 | 20.2% |
| 65 to 74 Years | 45 | 19.3% |
| 75 to 84 Years | 23 | 9.9% |
| 85 Years and Over | 5 | 2.1% |
| Total | 233 | 100.0% |
Housing Finances in Canon
Median Income by Occupancy in Canon
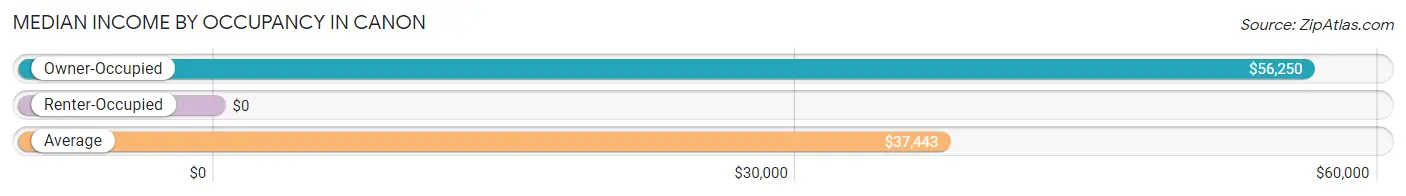
| Occupancy Type | # Households | Median Income |
| Owner-Occupied | 140 (60.1%) | $56,250 |
| Renter-Occupied | 93 (39.9%) | $0 |
| Average | 233 (100.0%) | $37,443 |
Occupancy by Householder Income Bracket in Canon
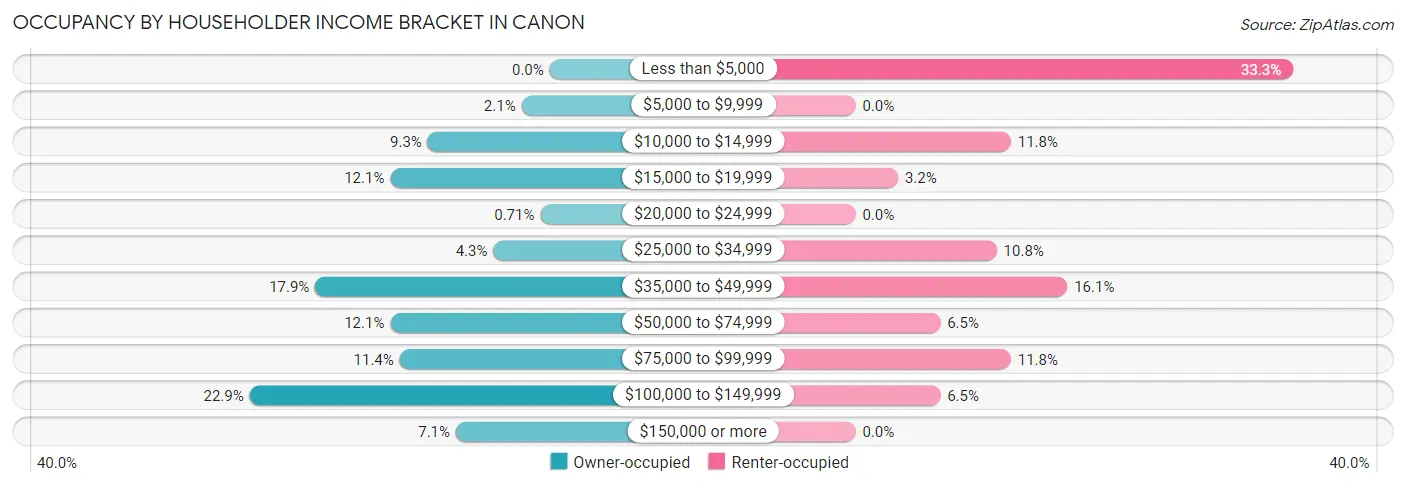
| Income Bracket | Owner-occupied | Renter-occupied |
| Less than $5,000 | 0 (0.0%) | 31 (33.3%) |
| $5,000 to $9,999 | 3 (2.1%) | 0 (0.0%) |
| $10,000 to $14,999 | 13 (9.3%) | 11 (11.8%) |
| $15,000 to $19,999 | 17 (12.1%) | 3 (3.2%) |
| $20,000 to $24,999 | 1 (0.7%) | 0 (0.0%) |
| $25,000 to $34,999 | 6 (4.3%) | 10 (10.7%) |
| $35,000 to $49,999 | 25 (17.9%) | 15 (16.1%) |
| $50,000 to $74,999 | 17 (12.1%) | 6 (6.5%) |
| $75,000 to $99,999 | 16 (11.4%) | 11 (11.8%) |
| $100,000 to $149,999 | 32 (22.9%) | 6 (6.5%) |
| $150,000 or more | 10 (7.1%) | 0 (0.0%) |
| Total | 140 (100.0%) | 93 (100.0%) |
Monthly Housing Cost Tiers in Canon
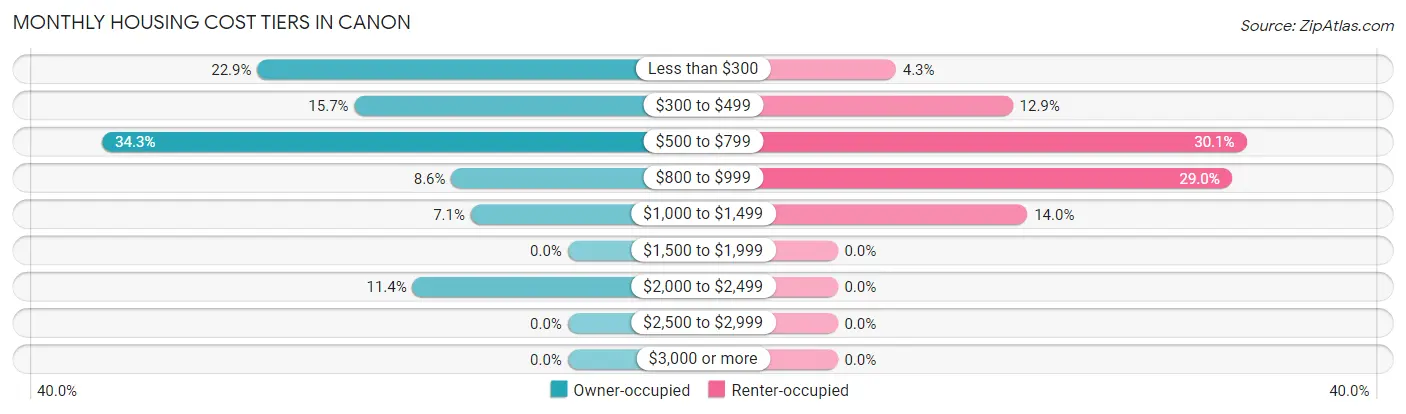
| Monthly Cost | Owner-occupied | Renter-occupied |
| Less than $300 | 32 (22.9%) | 4 (4.3%) |
| $300 to $499 | 22 (15.7%) | 12 (12.9%) |
| $500 to $799 | 48 (34.3%) | 28 (30.1%) |
| $800 to $999 | 12 (8.6%) | 27 (29.0%) |
| $1,000 to $1,499 | 10 (7.1%) | 13 (14.0%) |
| $1,500 to $1,999 | 0 (0.0%) | 0 (0.0%) |
| $2,000 to $2,499 | 16 (11.4%) | 0 (0.0%) |
| $2,500 to $2,999 | 0 (0.0%) | 0 (0.0%) |
| $3,000 or more | 0 (0.0%) | 0 (0.0%) |
| Total | 140 (100.0%) | 93 (100.0%) |
Physical Housing Characteristics in Canon
Housing Structures in Canon
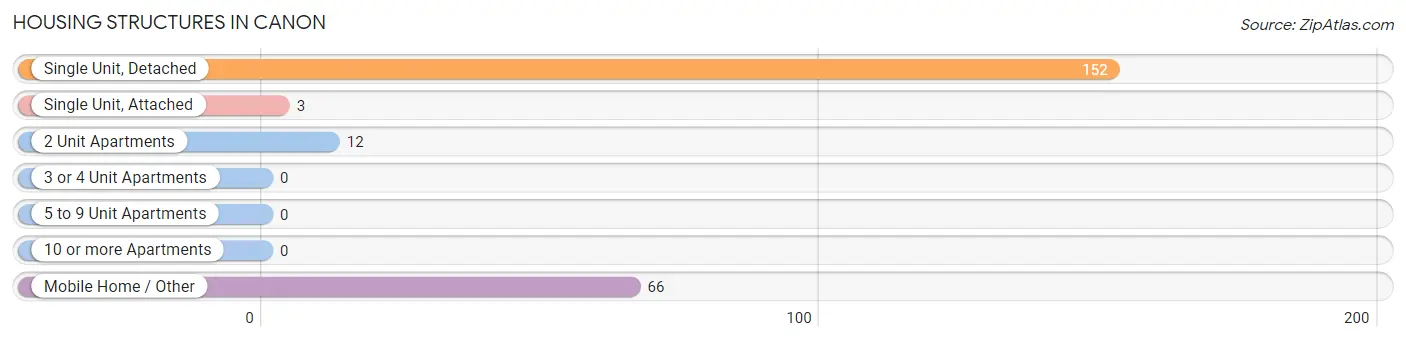
| Structure Type | # Housing Units | % Housing Units |
| Single Unit, Detached | 152 | 65.2% |
| Single Unit, Attached | 3 | 1.3% |
| 2 Unit Apartments | 12 | 5.1% |
| 3 or 4 Unit Apartments | 0 | 0.0% |
| 5 to 9 Unit Apartments | 0 | 0.0% |
| 10 or more Apartments | 0 | 0.0% |
| Mobile Home / Other | 66 | 28.3% |
| Total | 233 | 100.0% |
Housing Structures by Occupancy in Canon
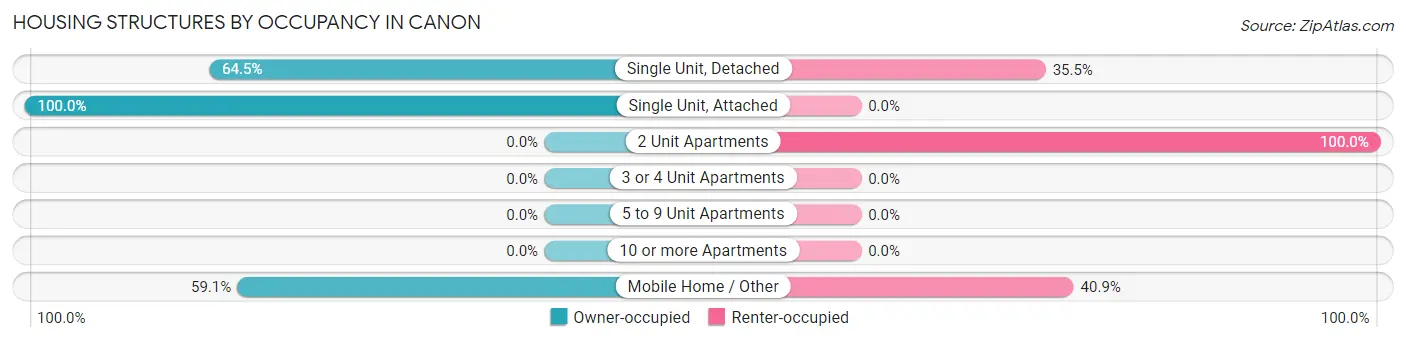
| Structure Type | Owner-occupied | Renter-occupied |
| Single Unit, Detached | 98 (64.5%) | 54 (35.5%) |
| Single Unit, Attached | 3 (100.0%) | 0 (0.0%) |
| 2 Unit Apartments | 0 (0.0%) | 12 (100.0%) |
| 3 or 4 Unit Apartments | 0 (0.0%) | 0 (0.0%) |
| 5 to 9 Unit Apartments | 0 (0.0%) | 0 (0.0%) |
| 10 or more Apartments | 0 (0.0%) | 0 (0.0%) |
| Mobile Home / Other | 39 (59.1%) | 27 (40.9%) |
| Total | 140 (60.1%) | 93 (39.9%) |
Housing Structures by Number of Rooms in Canon
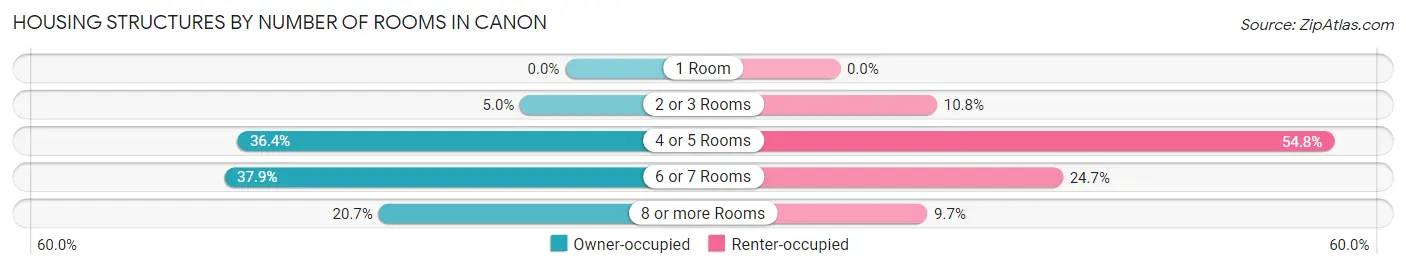
| Number of Rooms | Owner-occupied | Renter-occupied |
| 1 Room | 0 (0.0%) | 0 (0.0%) |
| 2 or 3 Rooms | 7 (5.0%) | 10 (10.7%) |
| 4 or 5 Rooms | 51 (36.4%) | 51 (54.8%) |
| 6 or 7 Rooms | 53 (37.9%) | 23 (24.7%) |
| 8 or more Rooms | 29 (20.7%) | 9 (9.7%) |
| Total | 140 (100.0%) | 93 (100.0%) |
Housing Structure by Heating Type in Canon
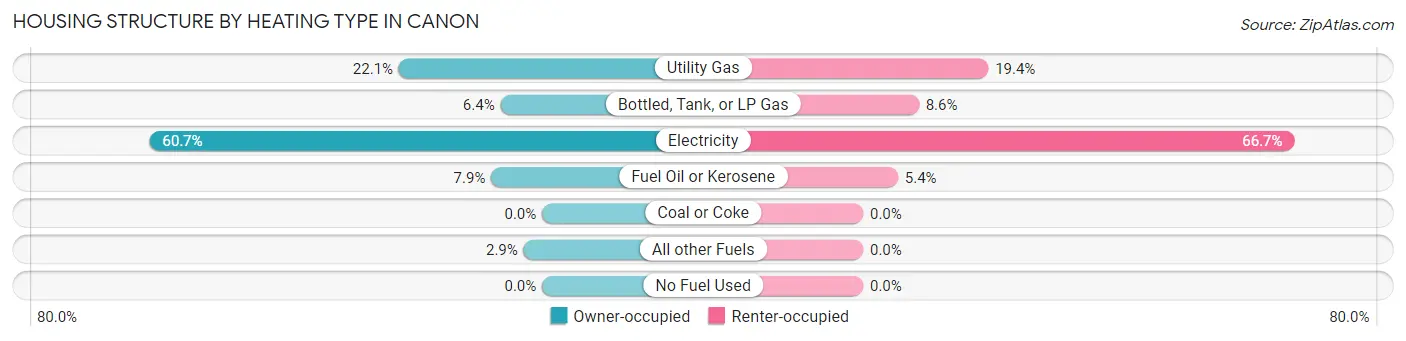
| Heating Type | Owner-occupied | Renter-occupied |
| Utility Gas | 31 (22.1%) | 18 (19.4%) |
| Bottled, Tank, or LP Gas | 9 (6.4%) | 8 (8.6%) |
| Electricity | 85 (60.7%) | 62 (66.7%) |
| Fuel Oil or Kerosene | 11 (7.9%) | 5 (5.4%) |
| Coal or Coke | 0 (0.0%) | 0 (0.0%) |
| All other Fuels | 4 (2.9%) | 0 (0.0%) |
| No Fuel Used | 0 (0.0%) | 0 (0.0%) |
| Total | 140 (100.0%) | 93 (100.0%) |
Household Vehicle Usage in Canon
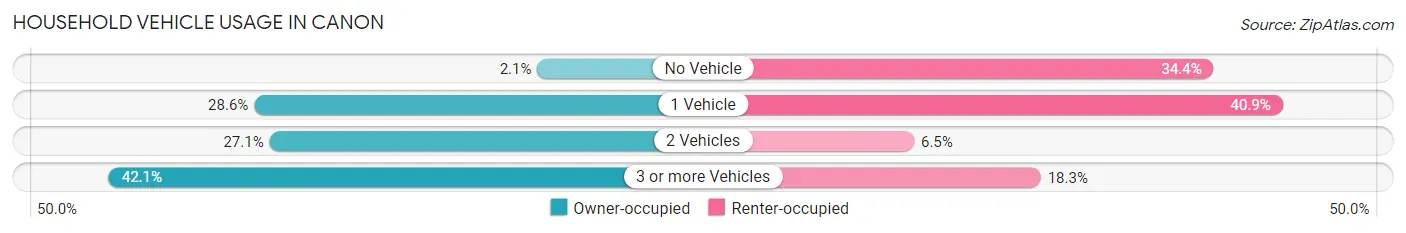
| Vehicles per Household | Owner-occupied | Renter-occupied |
| No Vehicle | 3 (2.1%) | 32 (34.4%) |
| 1 Vehicle | 40 (28.6%) | 38 (40.9%) |
| 2 Vehicles | 38 (27.1%) | 6 (6.5%) |
| 3 or more Vehicles | 59 (42.1%) | 17 (18.3%) |
| Total | 140 (100.0%) | 93 (100.0%) |
Real Estate & Mortgages in Canon
Real Estate and Mortgage Overview in Canon
| Characteristic | Without Mortgage | With Mortgage |
| Housing Units | 70 | 70 |
| Median Property Value | $85,000 | $94,200 |
| Median Household Income | $35,833 | $0 |
| Monthly Housing Costs | $312 | $0 |
| Real Estate Taxes | $464 | $1 |
Property Value by Mortgage Status in Canon
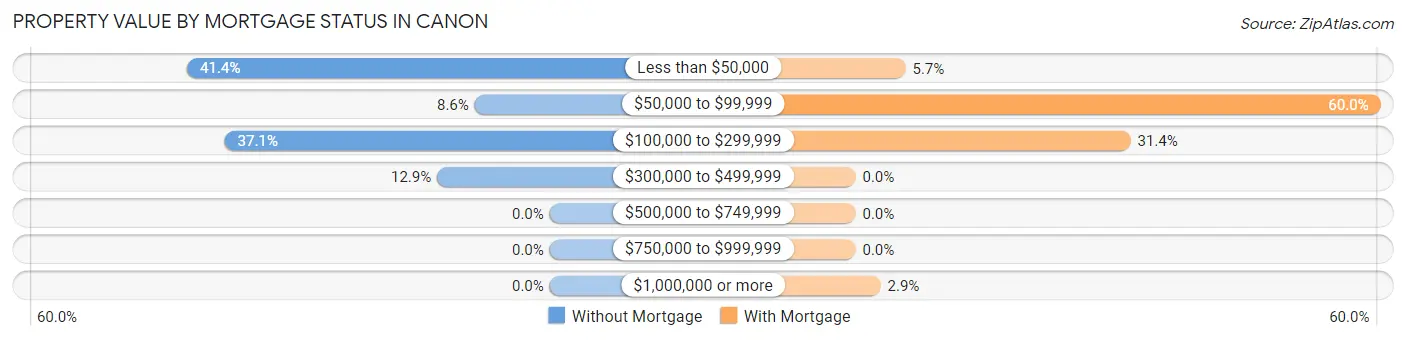
| Property Value | Without Mortgage | With Mortgage |
| Less than $50,000 | 29 (41.4%) | 4 (5.7%) |
| $50,000 to $99,999 | 6 (8.6%) | 42 (60.0%) |
| $100,000 to $299,999 | 26 (37.1%) | 22 (31.4%) |
| $300,000 to $499,999 | 9 (12.9%) | 0 (0.0%) |
| $500,000 to $749,999 | 0 (0.0%) | 0 (0.0%) |
| $750,000 to $999,999 | 0 (0.0%) | 0 (0.0%) |
| $1,000,000 or more | 0 (0.0%) | 2 (2.9%) |
| Total | 70 (100.0%) | 70 (100.0%) |
Household Income by Mortgage Status in Canon
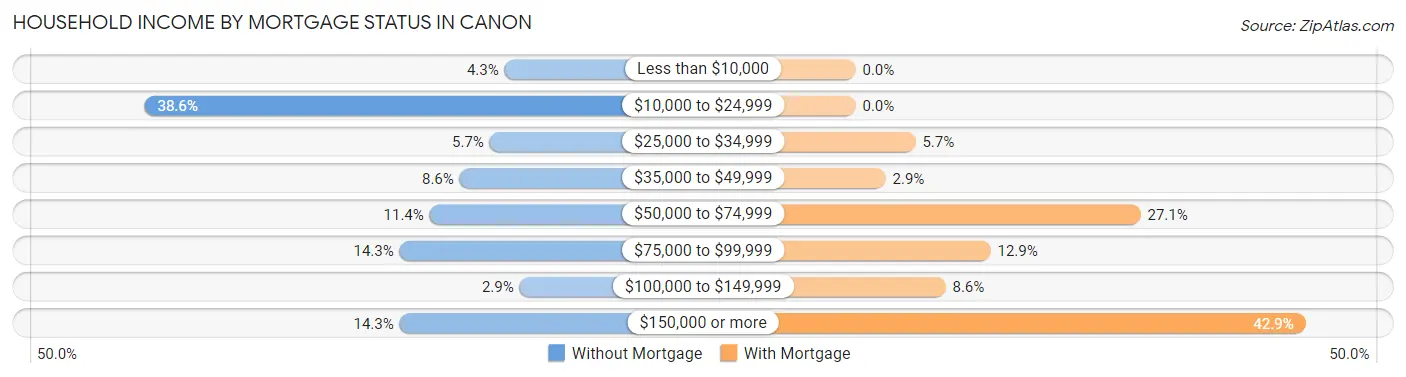
| Household Income | Without Mortgage | With Mortgage |
| Less than $10,000 | 3 (4.3%) | 0 (0.0%) |
| $10,000 to $24,999 | 27 (38.6%) | 0 (0.0%) |
| $25,000 to $34,999 | 4 (5.7%) | 4 (5.7%) |
| $35,000 to $49,999 | 6 (8.6%) | 2 (2.9%) |
| $50,000 to $74,999 | 8 (11.4%) | 19 (27.1%) |
| $75,000 to $99,999 | 10 (14.3%) | 9 (12.9%) |
| $100,000 to $149,999 | 2 (2.9%) | 6 (8.6%) |
| $150,000 or more | 10 (14.3%) | 30 (42.9%) |
| Total | 70 (100.0%) | 70 (100.0%) |
Property Value to Household Income Ratio in Canon
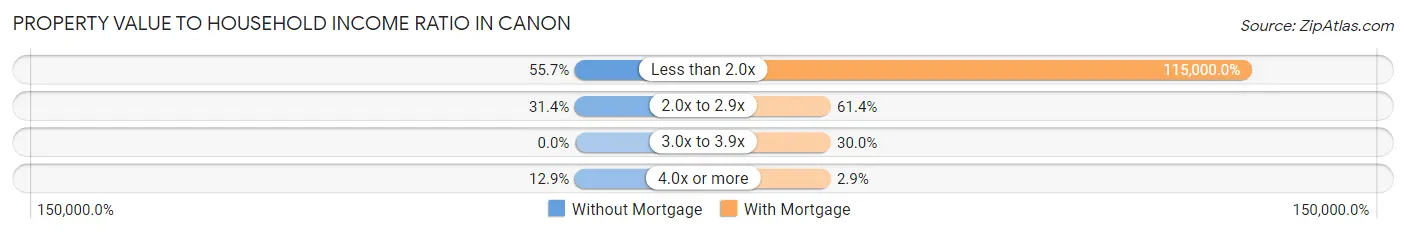
| Value-to-Income Ratio | Without Mortgage | With Mortgage |
| Less than 2.0x | 39 (55.7%) | 80,500 (115,000.0%) |
| 2.0x to 2.9x | 22 (31.4%) | 43 (61.4%) |
| 3.0x to 3.9x | 0 (0.0%) | 21 (30.0%) |
| 4.0x or more | 9 (12.9%) | 2 (2.9%) |
| Total | 70 (100.0%) | 70 (100.0%) |
Real Estate Taxes by Mortgage Status in Canon
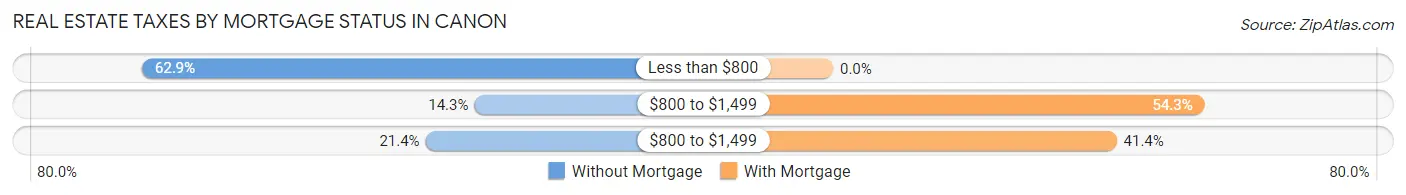
| Property Taxes | Without Mortgage | With Mortgage |
| Less than $800 | 44 (62.9%) | 0 (0.0%) |
| $800 to $1,499 | 10 (14.3%) | 38 (54.3%) |
| $800 to $1,499 | 15 (21.4%) | 29 (41.4%) |
| Total | 70 (100.0%) | 70 (100.0%) |
Health & Disability in Canon
Health Insurance Coverage by Age in Canon
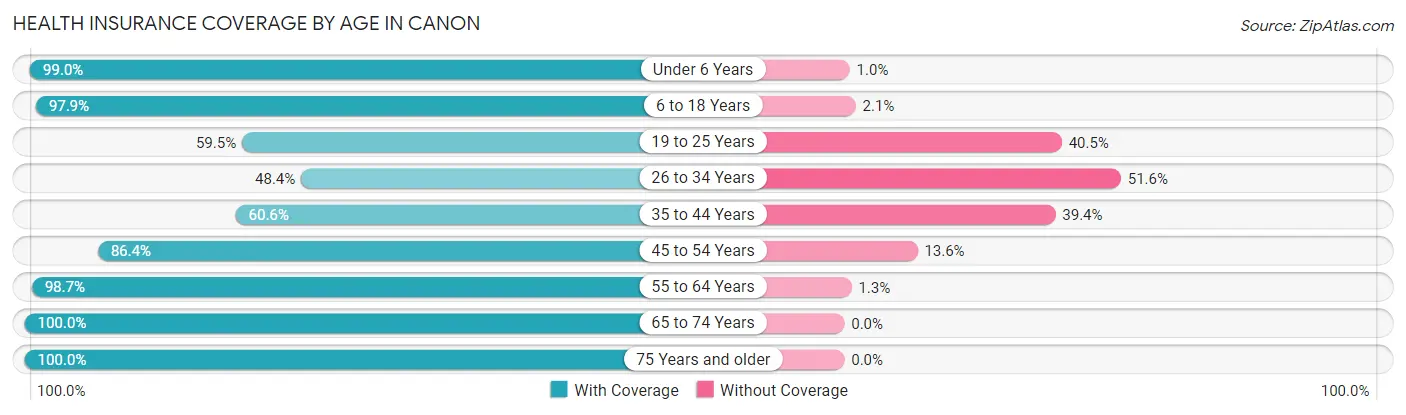
| Age Bracket | With Coverage | Without Coverage |
| Under 6 Years | 99 (99.0%) | 1 (1.0%) |
| 6 to 18 Years | 325 (97.9%) | 7 (2.1%) |
| 19 to 25 Years | 22 (59.5%) | 15 (40.5%) |
| 26 to 34 Years | 62 (48.4%) | 66 (51.6%) |
| 35 to 44 Years | 57 (60.6%) | 37 (39.4%) |
| 45 to 54 Years | 38 (86.4%) | 6 (13.6%) |
| 55 to 64 Years | 74 (98.7%) | 1 (1.3%) |
| 65 to 74 Years | 69 (100.0%) | 0 (0.0%) |
| 75 Years and older | 33 (100.0%) | 0 (0.0%) |
| Total | 779 (85.4%) | 133 (14.6%) |
Health Insurance Coverage by Citizenship Status in Canon
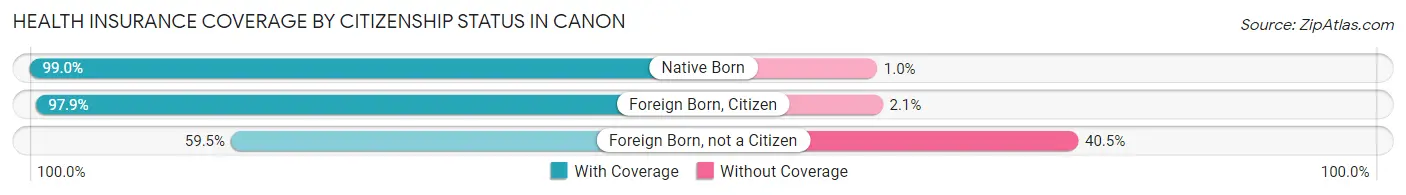
| Citizenship Status | With Coverage | Without Coverage |
| Native Born | 99 (99.0%) | 1 (1.0%) |
| Foreign Born, Citizen | 325 (97.9%) | 7 (2.1%) |
| Foreign Born, not a Citizen | 22 (59.5%) | 15 (40.5%) |
Health Insurance Coverage by Household Income in Canon
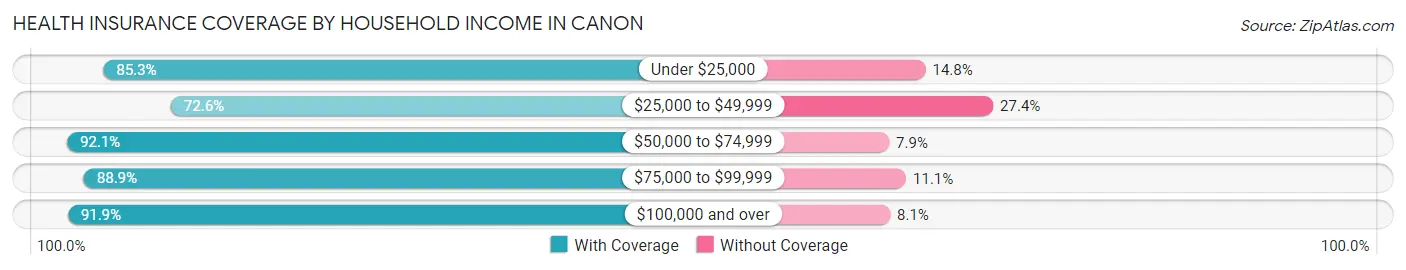
| Household Income | With Coverage | Without Coverage |
| Under $25,000 | 208 (85.3%) | 36 (14.7%) |
| $25,000 to $49,999 | 135 (72.6%) | 51 (27.4%) |
| $50,000 to $74,999 | 58 (92.1%) | 5 (7.9%) |
| $75,000 to $99,999 | 208 (88.9%) | 26 (11.1%) |
| $100,000 and over | 170 (91.9%) | 15 (8.1%) |
Public vs Private Health Insurance Coverage by Age in Canon
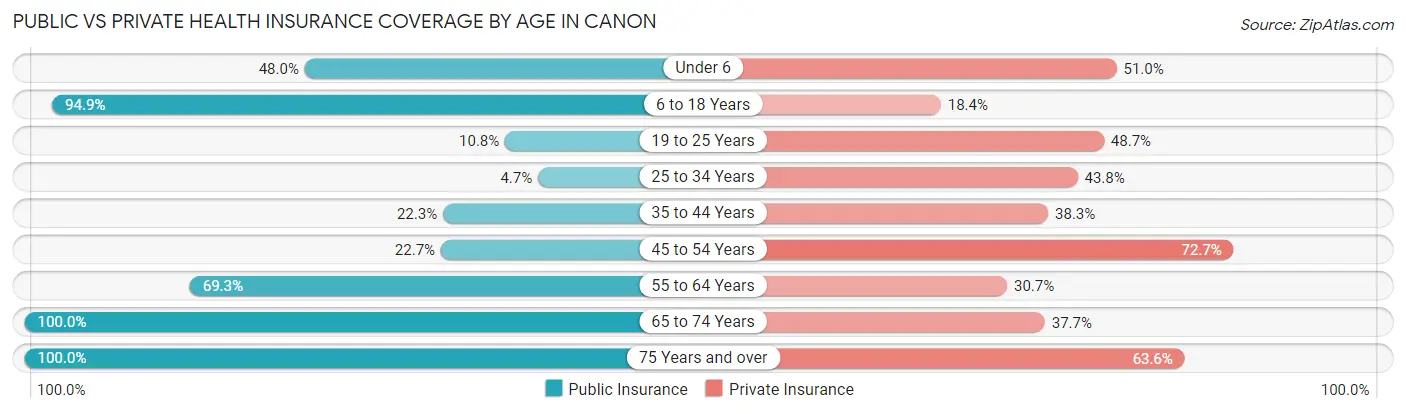
| Age Bracket | Public Insurance | Private Insurance |
| Under 6 | 48 (48.0%) | 51 (51.0%) |
| 6 to 18 Years | 315 (94.9%) | 61 (18.4%) |
| 19 to 25 Years | 4 (10.8%) | 18 (48.6%) |
| 25 to 34 Years | 6 (4.7%) | 56 (43.8%) |
| 35 to 44 Years | 21 (22.3%) | 36 (38.3%) |
| 45 to 54 Years | 10 (22.7%) | 32 (72.7%) |
| 55 to 64 Years | 52 (69.3%) | 23 (30.7%) |
| 65 to 74 Years | 69 (100.0%) | 26 (37.7%) |
| 75 Years and over | 33 (100.0%) | 21 (63.6%) |
| Total | 558 (61.2%) | 324 (35.5%) |
Disability Status by Sex by Age in Canon
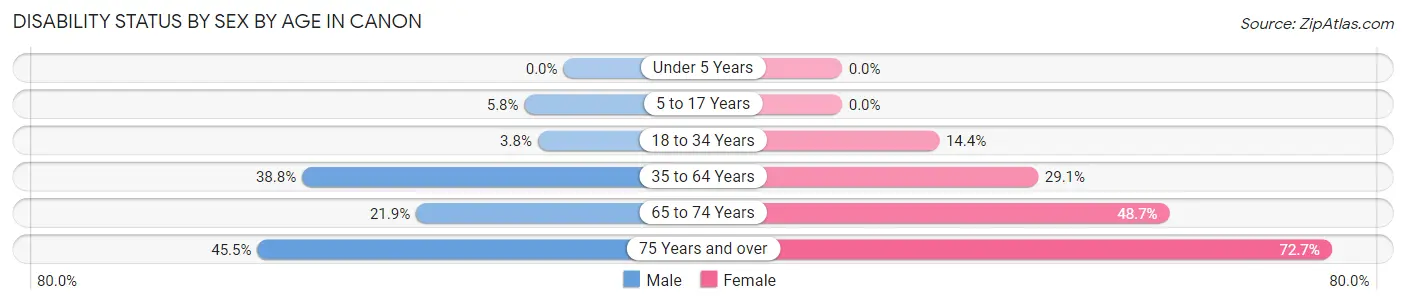
| Age Bracket | Male | Female |
| Under 5 Years | 0 (0.0%) | 0 (0.0%) |
| 5 to 17 Years | 11 (5.8%) | 0 (0.0%) |
| 18 to 34 Years | 3 (3.8%) | 14 (14.4%) |
| 35 to 64 Years | 52 (38.8%) | 23 (29.1%) |
| 65 to 74 Years | 7 (21.9%) | 18 (48.6%) |
| 75 Years and over | 10 (45.5%) | 8 (72.7%) |
Disability Class by Sex by Age in Canon
Disability Class: Hearing Difficulty
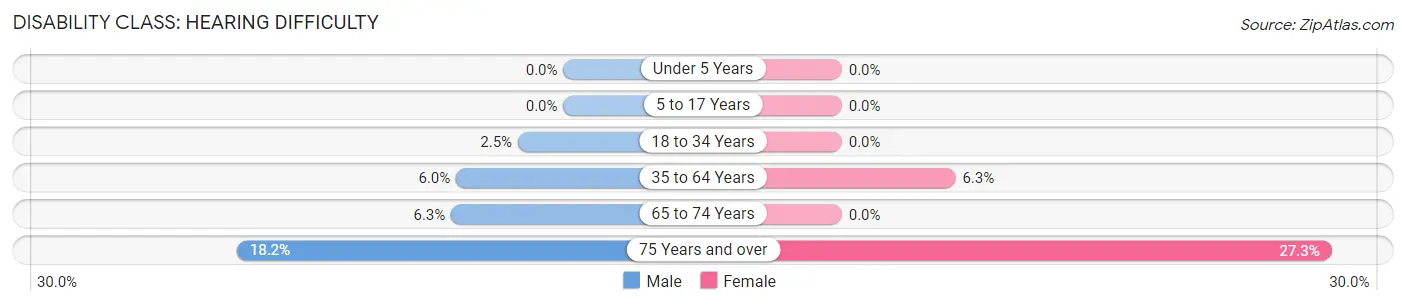
| Age Bracket | Male | Female |
| Under 5 Years | 0 (0.0%) | 0 (0.0%) |
| 5 to 17 Years | 0 (0.0%) | 0 (0.0%) |
| 18 to 34 Years | 2 (2.5%) | 0 (0.0%) |
| 35 to 64 Years | 8 (6.0%) | 5 (6.3%) |
| 65 to 74 Years | 2 (6.2%) | 0 (0.0%) |
| 75 Years and over | 4 (18.2%) | 3 (27.3%) |
Disability Class: Vision Difficulty
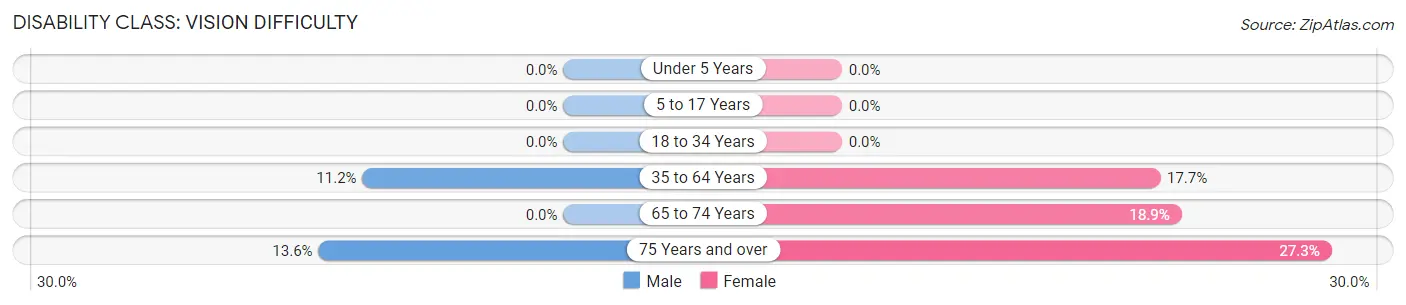
| Age Bracket | Male | Female |
| Under 5 Years | 0 (0.0%) | 0 (0.0%) |
| 5 to 17 Years | 0 (0.0%) | 0 (0.0%) |
| 18 to 34 Years | 0 (0.0%) | 0 (0.0%) |
| 35 to 64 Years | 15 (11.2%) | 14 (17.7%) |
| 65 to 74 Years | 0 (0.0%) | 7 (18.9%) |
| 75 Years and over | 3 (13.6%) | 3 (27.3%) |
Disability Class: Cognitive Difficulty
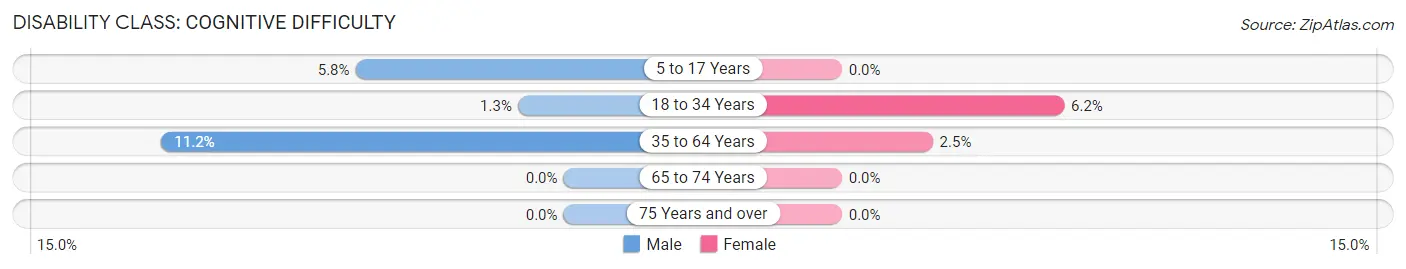
| Age Bracket | Male | Female |
| 5 to 17 Years | 11 (5.8%) | 0 (0.0%) |
| 18 to 34 Years | 1 (1.3%) | 6 (6.2%) |
| 35 to 64 Years | 15 (11.2%) | 2 (2.5%) |
| 65 to 74 Years | 0 (0.0%) | 0 (0.0%) |
| 75 Years and over | 0 (0.0%) | 0 (0.0%) |
Disability Class: Ambulatory Difficulty
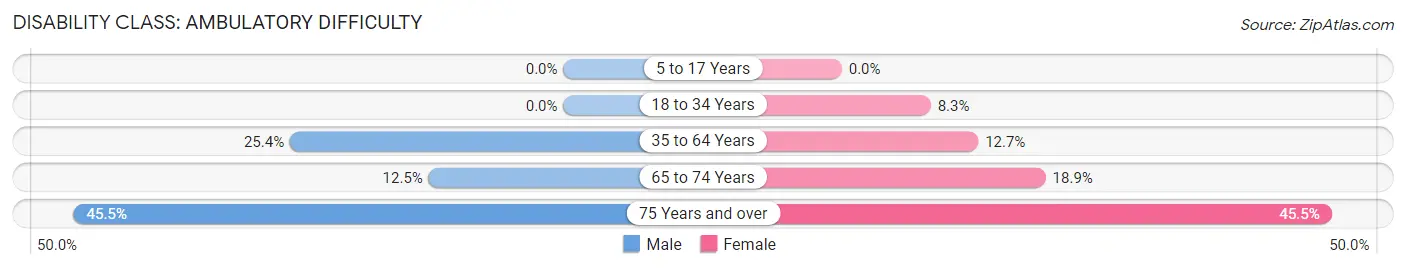
| Age Bracket | Male | Female |
| 5 to 17 Years | 0 (0.0%) | 0 (0.0%) |
| 18 to 34 Years | 0 (0.0%) | 8 (8.3%) |
| 35 to 64 Years | 34 (25.4%) | 10 (12.7%) |
| 65 to 74 Years | 4 (12.5%) | 7 (18.9%) |
| 75 Years and over | 10 (45.5%) | 5 (45.5%) |
Disability Class: Self-Care Difficulty
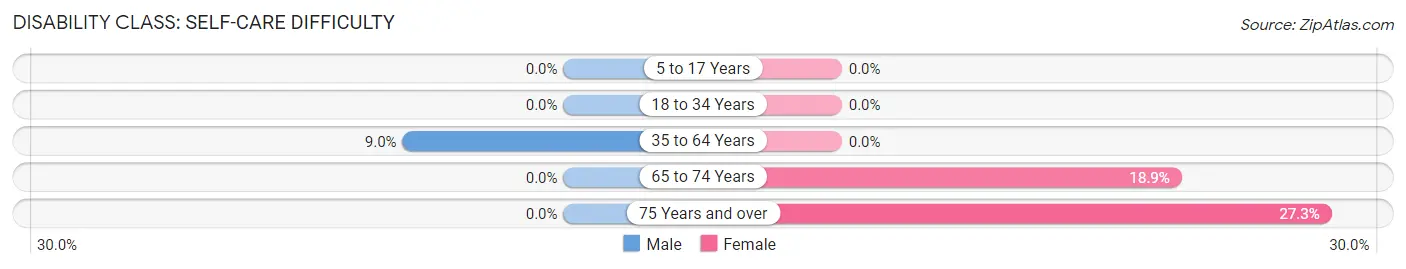
| Age Bracket | Male | Female |
| 5 to 17 Years | 0 (0.0%) | 0 (0.0%) |
| 18 to 34 Years | 0 (0.0%) | 0 (0.0%) |
| 35 to 64 Years | 12 (9.0%) | 0 (0.0%) |
| 65 to 74 Years | 0 (0.0%) | 7 (18.9%) |
| 75 Years and over | 0 (0.0%) | 3 (27.3%) |
Technology Access in Canon
Computing Device Access in Canon
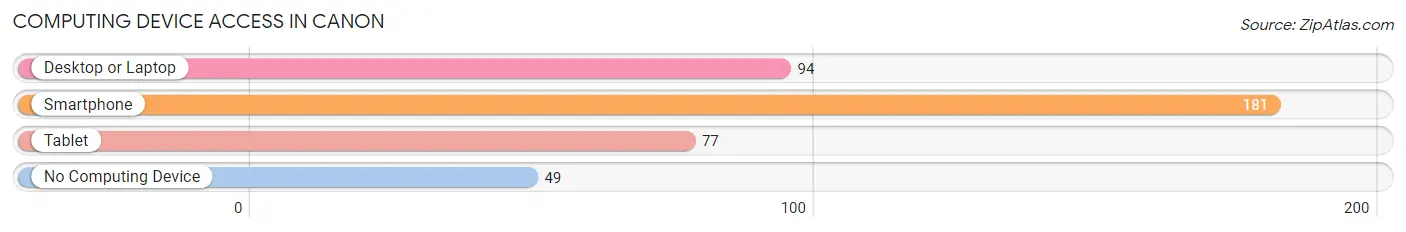
| Device Type | # Households | % Households |
| Desktop or Laptop | 94 | 40.3% |
| Smartphone | 181 | 77.7% |
| Tablet | 77 | 33.1% |
| No Computing Device | 49 | 21.0% |
| Total | 233 | 100.0% |
Internet Access in Canon
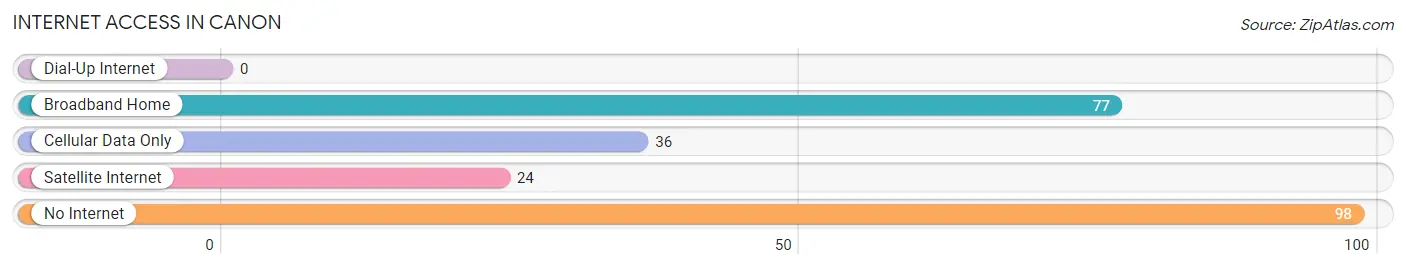
| Internet Type | # Households | % Households |
| Dial-Up Internet | 0 | 0.0% |
| Broadband Home | 77 | 33.1% |
| Cellular Data Only | 36 | 15.4% |
| Satellite Internet | 24 | 10.3% |
| No Internet | 98 | 42.1% |
| Total | 233 | 100.0% |
Canon Summary
Canon, Georgia is a small town located in Franklin County, Georgia. It is situated in the foothills of the Blue Ridge Mountains and is part of the Appalachian region. The town was founded in 1820 and has a population of approximately 1,000 people.
Geography
Canon is located in the foothills of the Blue Ridge Mountains, which are part of the Appalachian Mountains. The town is situated in the Tugaloo River Valley, which is part of the larger Savannah River Valley. The town is located at an elevation of 1,000 feet above sea level. The town is surrounded by rolling hills and is home to several creeks and streams. The town is located approximately 30 miles from the city of Athens, Georgia.
Economy
Canon’s economy is largely based on agriculture. The town is home to several farms, which produce a variety of crops, including corn, soybeans, and cotton. The town is also home to several small businesses, including a grocery store, a hardware store, and a few restaurants. The town is also home to a few manufacturing plants, which produce a variety of products, including furniture and textiles.
Demographics
As of the 2010 census, the population of Canon was 1,000 people. The town is predominantly white, with approximately 95% of the population being Caucasian. The remaining 5% of the population is made up of African Americans, Hispanics, and other ethnicities. The median household income in Canon is approximately $30,000, which is slightly lower than the national average.
History
Canon was founded in 1820 by a group of settlers from North Carolina. The town was named after a nearby creek, which was named after a local Native American chief. The town was originally a farming community, and the main crops grown were corn, cotton, and tobacco. The town was also home to several small businesses, including a general store and a blacksmith shop.
In the late 19th century, the town began to experience a period of growth. Several new businesses were established, including a sawmill, a gristmill, and a cotton gin. The town also became home to several churches, including the First Baptist Church of Canon.
In the early 20th century, the town experienced a period of decline. Several businesses closed, and the population began to decline. However, in the late 20th century, the town began to experience a period of revitalization. Several new businesses were established, and the population began to increase.
Today, Canon is a small, rural town with a population of approximately 1,000 people. The town is home to several small businesses, including a grocery store, a hardware store, and a few restaurants. The town is also home to several churches, including the First Baptist Church of Canon. The town is also home to several farms, which produce a variety of crops, including corn, soybeans, and cotton.
Common Questions
What is Per Capita Income in Canon?
Per Capita income in Canon is $16,321.
What is the Median Family Income in Canon?
Median Family Income in Canon is $37,159.
What is the Median Household income in Canon?
Median Household Income in Canon is $37,443.
What is Income or Wage Gap in Canon?
Income or Wage Gap in Canon is 27.5%.
Women in Canon earn 72.5 cents for every dollar earned by a man.
What is Inequality or Gini Index in Canon?
Inequality or Gini Index in Canon is 0.50.
What is the Total Population of Canon?
Total Population of Canon is 912.
What is the Total Male Population of Canon?
Total Male Population of Canon is 488.
What is the Total Female Population of Canon?
Total Female Population of Canon is 424.
What is the Ratio of Males per 100 Females in Canon?
There are 115.09 Males per 100 Females in Canon.
What is the Ratio of Females per 100 Males in Canon?
There are 86.89 Females per 100 Males in Canon.
What is the Median Population Age in Canon?
Median Population Age in Canon is 25.0 Years.
What is the Average Family Size in Canon
Average Family Size in Canon is 4.7 People.
What is the Average Household Size in Canon
Average Household Size in Canon is 3.9 People.
How Large is the Labor Force in Canon?
There are 270 People in the Labor Forcein in Canon.
What is the Percentage of People in the Labor Force in Canon?
54.1% of People are in the Labor Force in Canon.
What is the Unemployment Rate in Canon?
Unemployment Rate in Canon is 0.4%.