Locust Grove, GA Map & Demographics
Locust Grove Map
Locust Grove Overview
$27,454
PER CAPITA INCOME
$73,430
AVG FAMILY INCOME
$67,143
AVG HOUSEHOLD INCOME
52.2%
WAGE / INCOME GAP [ % ]
47.8¢/ $1
WAGE / INCOME GAP [ $ ]
0.37
INEQUALITY / GINI INDEX
9,367
TOTAL POPULATION
4,479
MALE POPULATION
4,888
FEMALE POPULATION
91.63
MALES / 100 FEMALES
109.13
FEMALES / 100 MALES
33.1
MEDIAN AGE
3.4
AVG FAMILY SIZE
3.2
AVG HOUSEHOLD SIZE
4,916
LABOR FORCE [ PEOPLE ]
68.5%
PERCENT IN LABOR FORCE
8.5%
UNEMPLOYMENT RATE
Locust Grove Zip Codes
Income in Locust Grove
Income Overview in Locust Grove
Per Capita Income in Locust Grove is $27,454, while median incomes of families and households are $73,430 and $67,143 respectively.
| Characteristic | Number | Measure |
| Per Capita Income | 9,367 | $27,454 |
| Median Family Income | 2,284 | $73,430 |
| Mean Family Income | 2,284 | $86,304 |
| Median Household Income | 2,950 | $67,143 |
| Mean Household Income | 2,950 | $84,873 |
| Income Deficit | 2,284 | $0 |
| Wage / Income Gap (%) | 9,367 | 52.18% |
| Wage / Income Gap ($) | 9,367 | 47.82¢ per $1 |
| Gini / Inequality Index | 9,367 | 0.37 |
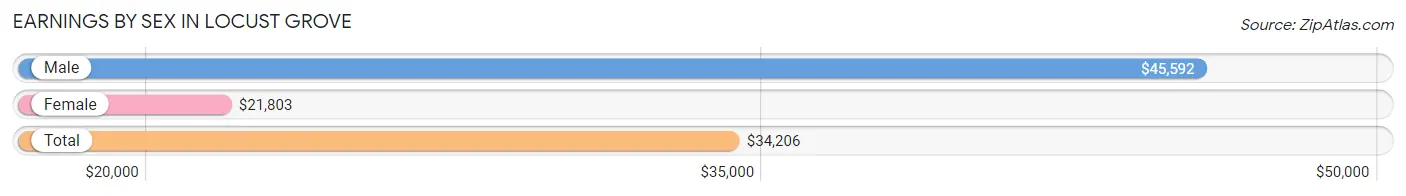
Earnings by Sex in Locust Grove
Average Earnings in Locust Grove are $34,206, $45,592 for men and $21,803 for women, a difference of 52.2%.
| Sex | Number | Average Earnings |
| Male | 2,174 (45.2%) | $45,592 |
| Female | 2,631 (54.8%) | $21,803 |
| Total | 4,805 (100.0%) | $34,206 |
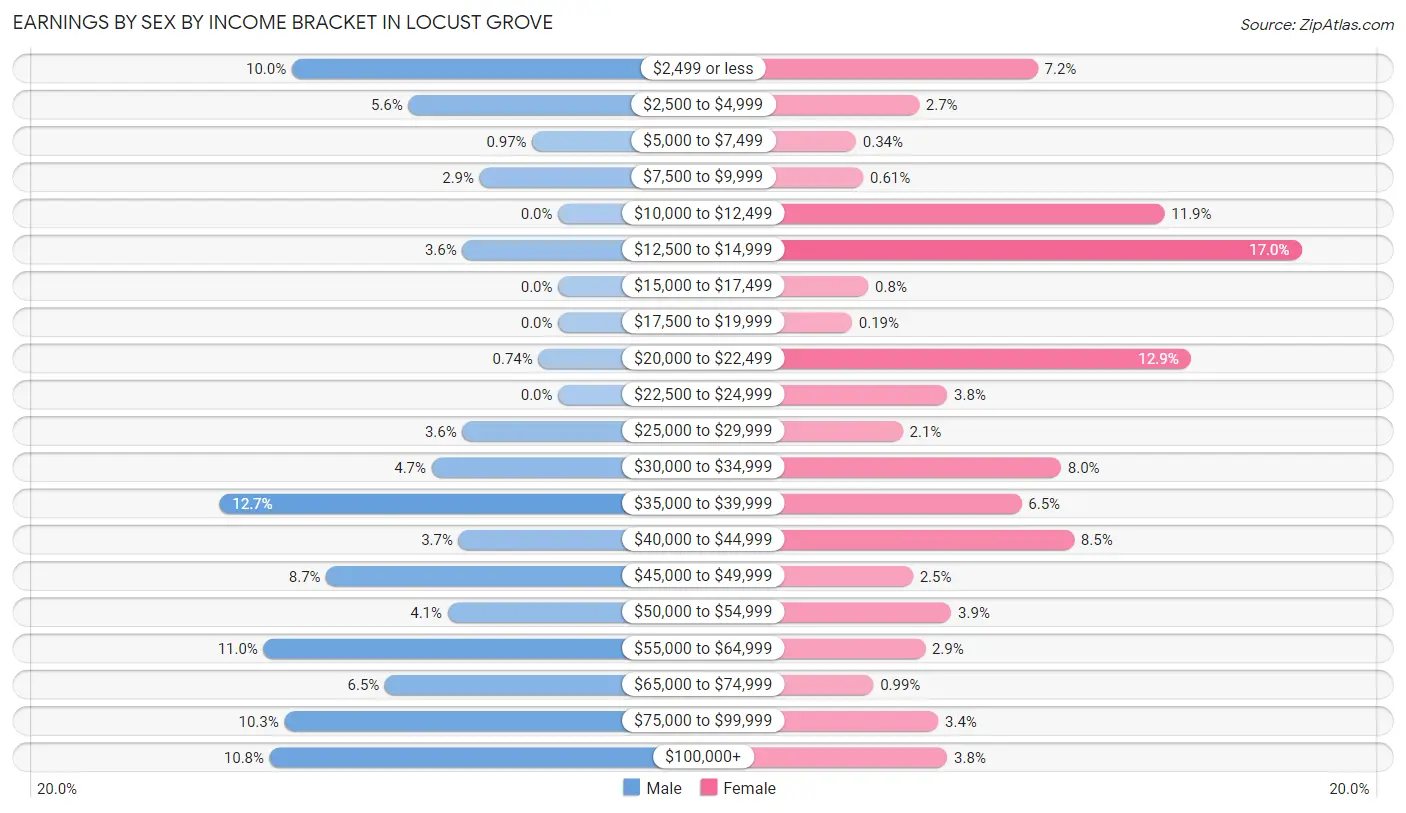
Earnings by Sex by Income Bracket in Locust Grove
The most common earnings brackets in Locust Grove are $35,000 to $39,999 for men (276 | 12.7%) and $12,500 to $14,999 for women (448 | 17.0%).
| Income | Male | Female |
| $2,499 or less | 217 (10.0%) | 188 (7.1%) |
| $2,500 to $4,999 | 122 (5.6%) | 71 (2.7%) |
| $5,000 to $7,499 | 21 (1.0%) | 9 (0.3%) |
| $7,500 to $9,999 | 64 (2.9%) | 16 (0.6%) |
| $10,000 to $12,499 | 0 (0.0%) | 313 (11.9%) |
| $12,500 to $14,999 | 78 (3.6%) | 448 (17.0%) |
| $15,000 to $17,499 | 0 (0.0%) | 21 (0.8%) |
| $17,500 to $19,999 | 0 (0.0%) | 5 (0.2%) |
| $20,000 to $22,499 | 16 (0.7%) | 339 (12.9%) |
| $22,500 to $24,999 | 0 (0.0%) | 99 (3.8%) |
| $25,000 to $29,999 | 78 (3.6%) | 55 (2.1%) |
| $30,000 to $34,999 | 103 (4.7%) | 211 (8.0%) |
| $35,000 to $39,999 | 276 (12.7%) | 172 (6.5%) |
| $40,000 to $44,999 | 81 (3.7%) | 224 (8.5%) |
| $45,000 to $49,999 | 189 (8.7%) | 65 (2.5%) |
| $50,000 to $54,999 | 90 (4.1%) | 103 (3.9%) |
| $55,000 to $64,999 | 240 (11.0%) | 77 (2.9%) |
| $65,000 to $74,999 | 141 (6.5%) | 26 (1.0%) |
| $75,000 to $99,999 | 223 (10.3%) | 90 (3.4%) |
| $100,000+ | 235 (10.8%) | 99 (3.8%) |
| Total | 2,174 (100.0%) | 2,631 (100.0%) |
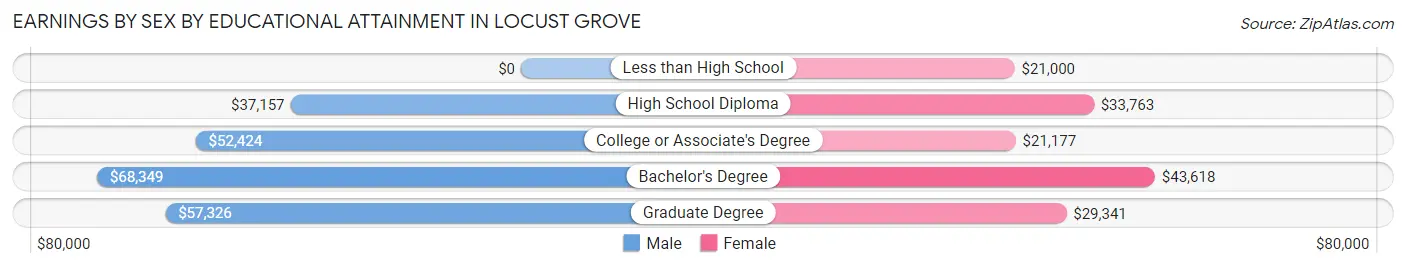
Earnings by Sex by Educational Attainment in Locust Grove
Average earnings in Locust Grove are $51,098 for men and $28,955 for women, a difference of 43.3%. Men with an educational attainment of bachelor's degree enjoy the highest average annual earnings of $68,349, while those with high school diploma education earn the least with $37,157. Women with an educational attainment of bachelor's degree earn the most with the average annual earnings of $43,618, while those with less than high school education have the smallest earnings of $21,000.
| Educational Attainment | Male Income | Female Income |
| Less than High School | - | - |
| High School Diploma | $37,157 | $33,763 |
| College or Associate's Degree | $52,424 | $21,177 |
| Bachelor's Degree | $68,349 | $43,618 |
| Graduate Degree | $57,326 | $29,341 |
| Total | $51,098 | $28,955 |
Family Income in Locust Grove
Family Income Brackets in Locust Grove
According to the Locust Grove family income data, there are 443 families falling into the $75,000 to $99,999 income range, which is the most common income bracket and makes up 19.4% of all families. Conversely, the $10,000 to $14,999 income bracket is the least frequent group with only 14 families (0.6%) belonging to this category.
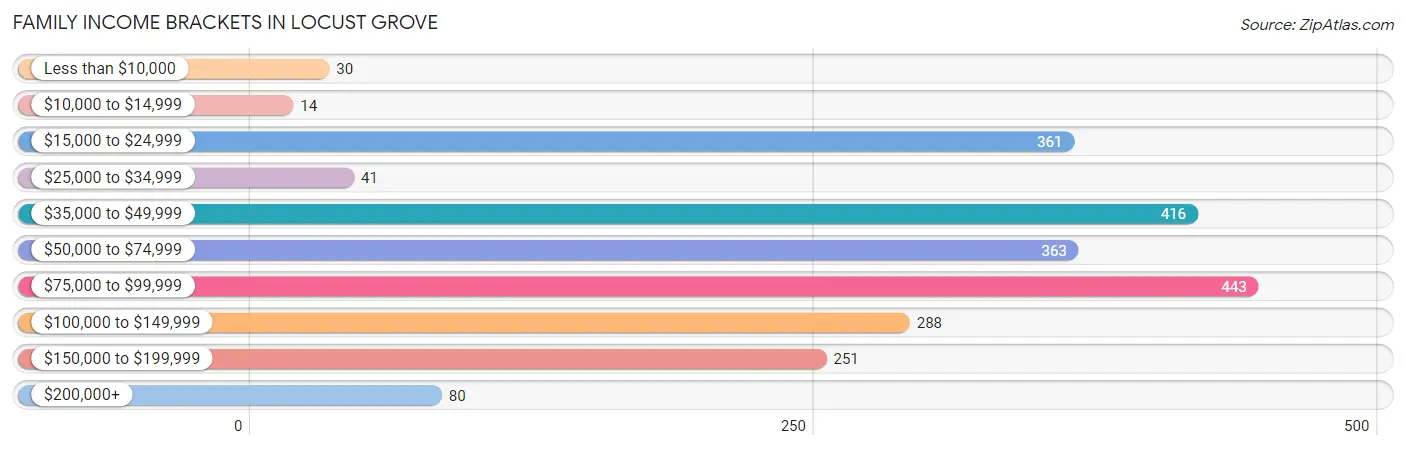
| Income Bracket | # Families | % Families |
| Less than $10,000 | 30 | 1.3% |
| $10,000 to $14,999 | 14 | 0.6% |
| $15,000 to $24,999 | 361 | 15.8% |
| $25,000 to $34,999 | 41 | 1.8% |
| $35,000 to $49,999 | 416 | 18.2% |
| $50,000 to $74,999 | 363 | 15.9% |
| $75,000 to $99,999 | 443 | 19.4% |
| $100,000 to $149,999 | 288 | 12.6% |
| $150,000 to $199,999 | 251 | 11.0% |
| $200,000+ | 80 | 3.5% |
Family Income by Famaliy Size in Locust Grove
2-person families (775 | 33.9%) account for the highest median family income in Locust Grove with $84,950 per family, while 2-person families (775 | 33.9%) have the highest median income of $42,475 per family member.
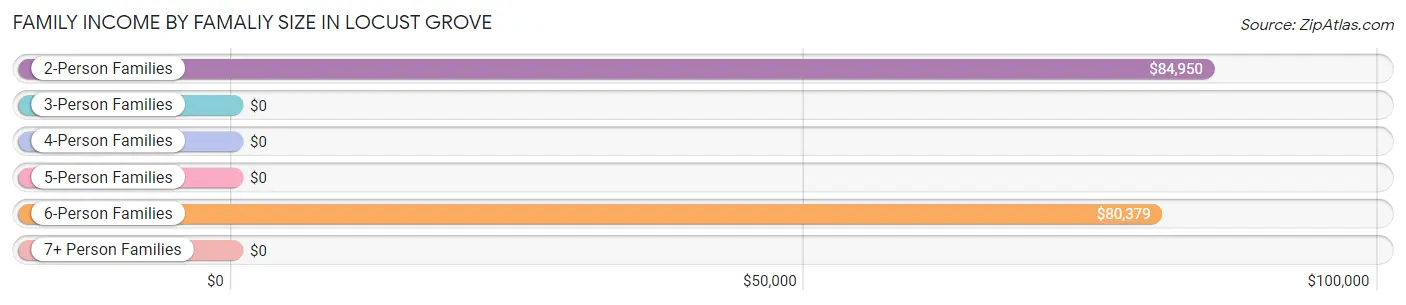
| Income Bracket | # Families | Median Income |
| 2-Person Families | 775 (33.9%) | $84,950 |
| 3-Person Families | 737 (32.3%) | $0 |
| 4-Person Families | 427 (18.7%) | $0 |
| 5-Person Families | 146 (6.4%) | $0 |
| 6-Person Families | 126 (5.5%) | $80,379 |
| 7+ Person Families | 73 (3.2%) | $0 |
| Total | 2,284 (100.0%) | $73,430 |
Family Income by Number of Earners in Locust Grove
The median family income in Locust Grove is $73,430, with families comprising no earners (273) having the highest median family income of $92,707, while families with 1 earner (963) have the lowest median family income of $42,470, accounting for 11.9% and 42.2% of families, respectively.
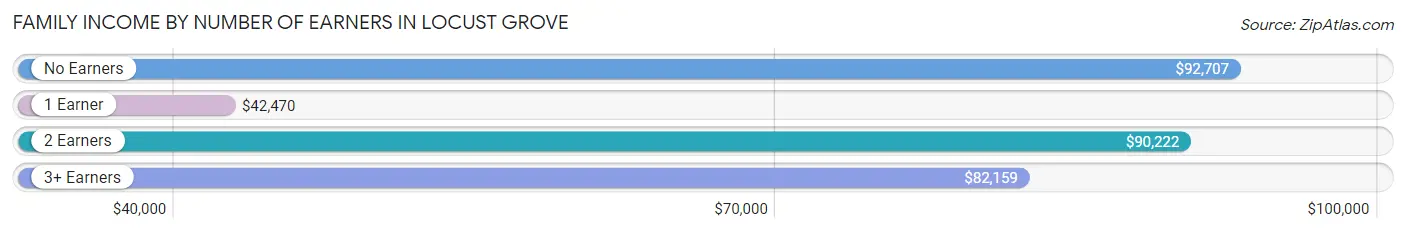
| Number of Earners | # Families | Median Income |
| No Earners | 273 (11.9%) | $92,707 |
| 1 Earner | 963 (42.2%) | $42,470 |
| 2 Earners | 839 (36.7%) | $90,222 |
| 3+ Earners | 209 (9.1%) | $82,159 |
| Total | 2,284 (100.0%) | $73,430 |
Household Income in Locust Grove
Household Income Brackets in Locust Grove
With 867 households falling in the category, the $50,000 to $74,999 income range is the most frequent in Locust Grove, accounting for 29.4% of all households. In contrast, only 32 households (1.1%) fall into the $10,000 to $14,999 income bracket, making it the least populous group.
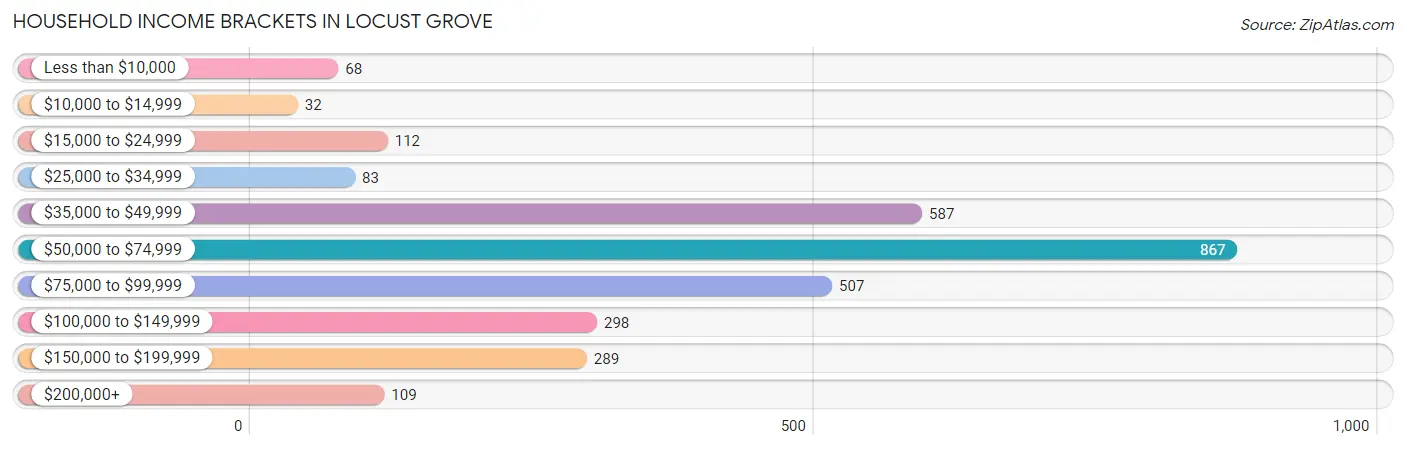
| Income Bracket | # Households | % Households |
| Less than $10,000 | 68 | 2.3% |
| $10,000 to $14,999 | 32 | 1.1% |
| $15,000 to $24,999 | 112 | 3.8% |
| $25,000 to $34,999 | 83 | 2.8% |
| $35,000 to $49,999 | 587 | 19.9% |
| $50,000 to $74,999 | 867 | 29.4% |
| $75,000 to $99,999 | 507 | 17.2% |
| $100,000 to $149,999 | 298 | 10.1% |
| $150,000 to $199,999 | 289 | 9.8% |
| $200,000+ | 109 | 3.7% |
Household Income by Householder Age in Locust Grove
The median household income in Locust Grove is $67,143, with the highest median household income of $73,111 found in the 25 to 44 years age bracket for the primary householder. A total of 1,140 households (38.6%) fall into this category. Meanwhile, the 15 to 24 years age bracket for the primary householder has the lowest median household income of $0, with 19 households (0.6%) in this group.
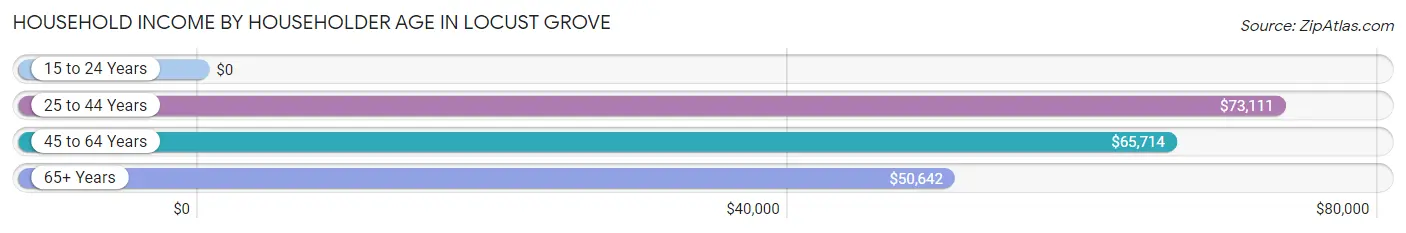
| Income Bracket | # Households | Median Income |
| 15 to 24 Years | 19 (0.6%) | $0 |
| 25 to 44 Years | 1,140 (38.6%) | $73,111 |
| 45 to 64 Years | 1,390 (47.1%) | $65,714 |
| 65+ Years | 401 (13.6%) | $50,642 |
| Total | 2,950 (100.0%) | $67,143 |
Poverty in Locust Grove
Income Below Poverty by Sex and Age in Locust Grove
With 18.6% poverty level for males and 14.9% for females among the residents of Locust Grove, 25 to 34 year old males and 15 year old females are the most vulnerable to poverty, with 312 males (53.8%) and 43 females (62.3%) in their respective age groups living below the poverty level.
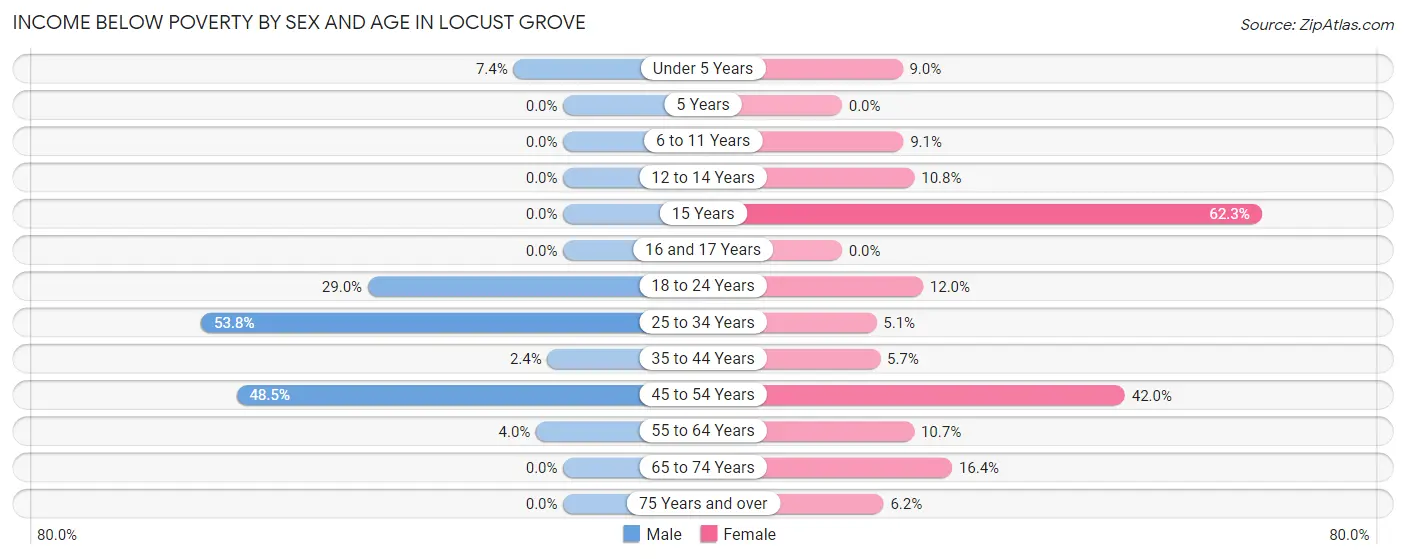
| Age Bracket | Male | Female |
| Under 5 Years | 15 (7.4%) | 20 (9.0%) |
| 5 Years | 0 (0.0%) | 0 (0.0%) |
| 6 to 11 Years | 0 (0.0%) | 27 (9.1%) |
| 12 to 14 Years | 0 (0.0%) | 27 (10.8%) |
| 15 Years | 0 (0.0%) | 43 (62.3%) |
| 16 and 17 Years | 0 (0.0%) | 0 (0.0%) |
| 18 to 24 Years | 130 (29.0%) | 43 (12.0%) |
| 25 to 34 Years | 312 (53.8%) | 43 (5.1%) |
| 35 to 44 Years | 21 (2.4%) | 43 (5.7%) |
| 45 to 54 Years | 346 (48.5%) | 366 (42.0%) |
| 55 to 64 Years | 9 (4.0%) | 46 (10.7%) |
| 65 to 74 Years | 0 (0.0%) | 62 (16.4%) |
| 75 Years and over | 0 (0.0%) | 7 (6.2%) |
| Total | 833 (18.6%) | 727 (14.9%) |
Income Above Poverty by Sex and Age in Locust Grove
According to the poverty statistics in Locust Grove, males aged 5 years and females aged 5 years are the age groups that are most secure financially, with 100.0% of males and 100.0% of females in these age groups living above the poverty line.
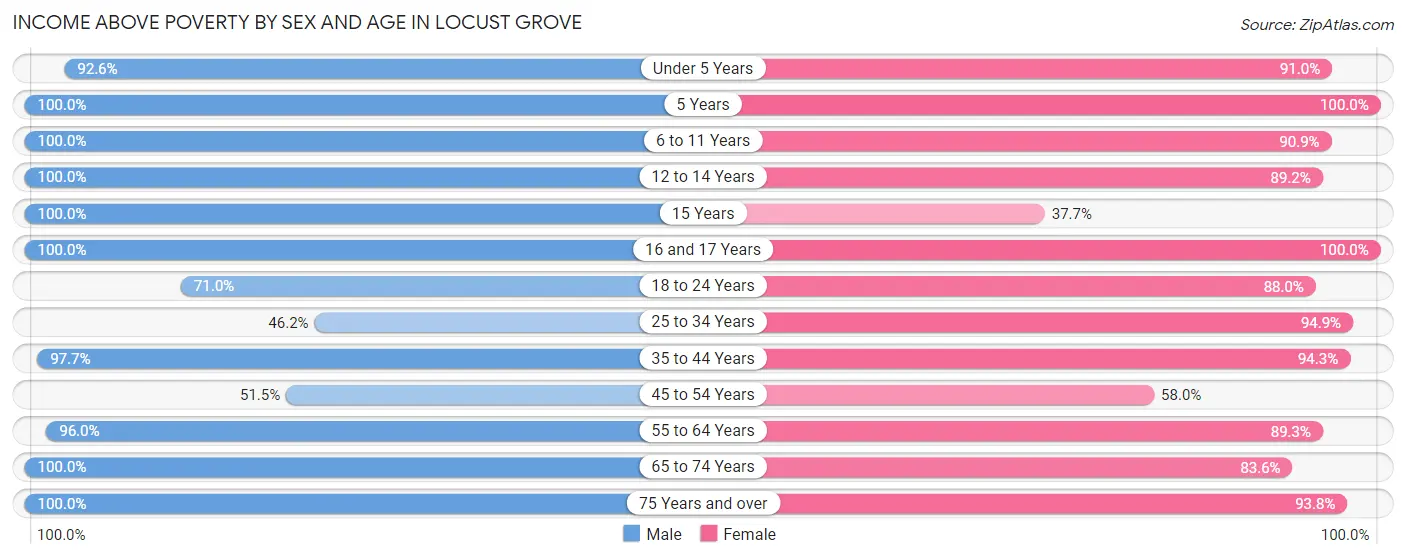
| Age Bracket | Male | Female |
| Under 5 Years | 188 (92.6%) | 202 (91.0%) |
| 5 Years | 36 (100.0%) | 94 (100.0%) |
| 6 to 11 Years | 582 (100.0%) | 269 (90.9%) |
| 12 to 14 Years | 245 (100.0%) | 224 (89.2%) |
| 15 Years | 192 (100.0%) | 26 (37.7%) |
| 16 and 17 Years | 192 (100.0%) | 211 (100.0%) |
| 18 to 24 Years | 318 (71.0%) | 314 (88.0%) |
| 25 to 34 Years | 268 (46.2%) | 796 (94.9%) |
| 35 to 44 Years | 871 (97.7%) | 714 (94.3%) |
| 45 to 54 Years | 367 (51.5%) | 505 (58.0%) |
| 55 to 64 Years | 214 (96.0%) | 383 (89.3%) |
| 65 to 74 Years | 164 (100.0%) | 317 (83.6%) |
| 75 Years and over | 9 (100.0%) | 106 (93.8%) |
| Total | 3,646 (81.4%) | 4,161 (85.1%) |
Income Below Poverty Among Married-Couple Families in Locust Grove
The poverty statistics for married-couple families in Locust Grove show that 0.8% or 9 of the total 1,098 families live below the poverty line. Families with no children have the highest poverty rate of 2.0%, comprising of 9 families. On the other hand, families with 1 or 2 children have the lowest poverty rate of 0.0%, which includes 0 families.
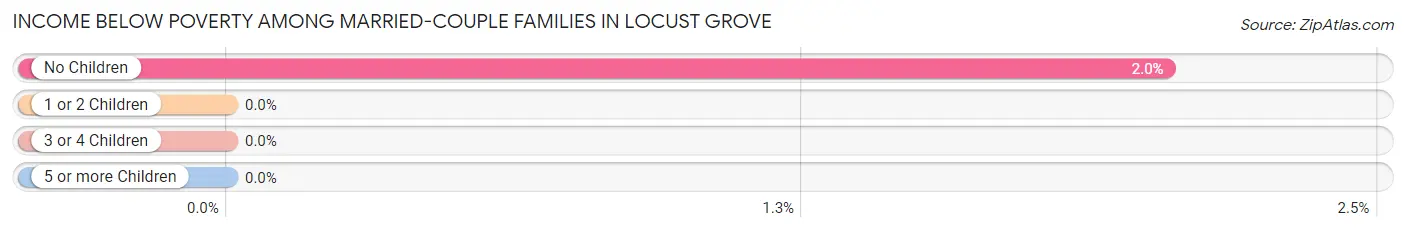
| Children | Above Poverty | Below Poverty |
| No Children | 432 (98.0%) | 9 (2.0%) |
| 1 or 2 Children | 447 (100.0%) | 0 (0.0%) |
| 3 or 4 Children | 157 (100.0%) | 0 (0.0%) |
| 5 or more Children | 53 (100.0%) | 0 (0.0%) |
| Total | 1,089 (99.2%) | 9 (0.8%) |
Income Below Poverty Among Single-Parent Households in Locust Grove
According to the poverty data in Locust Grove, 73.2% or 358 single-father households and 5.2% or 36 single-mother households are living below the poverty line. Among single-father households, those with no children have the highest poverty rate, with 337 households (100.0%) experiencing poverty. Likewise, among single-mother households, those with 1 or 2 children have the highest poverty rate, with 29 households (8.5%) falling below the poverty line.
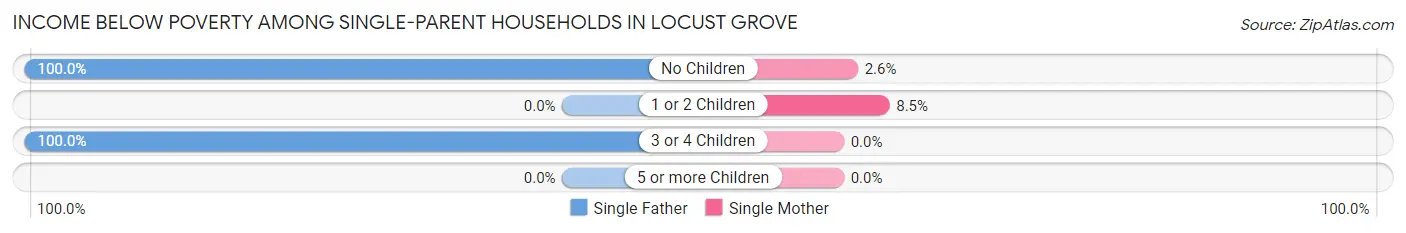
| Children | Single Father | Single Mother |
| No Children | 337 (100.0%) | 7 (2.6%) |
| 1 or 2 Children | 0 (0.0%) | 29 (8.5%) |
| 3 or 4 Children | 21 (100.0%) | 0 (0.0%) |
| 5 or more Children | 0 (0.0%) | 0 (0.0%) |
| Total | 358 (73.2%) | 36 (5.2%) |
Income Below Poverty Among Married-Couple vs Single-Parent Households in Locust Grove
The poverty data for Locust Grove shows that 9 of the married-couple family households (0.8%) and 394 of the single-parent households (33.2%) are living below the poverty level. Within the married-couple family households, those with no children have the highest poverty rate, with 9 households (2.0%) falling below the poverty line. Among the single-parent households, those with no children have the highest poverty rate, with 344 household (57.0%) living below poverty.
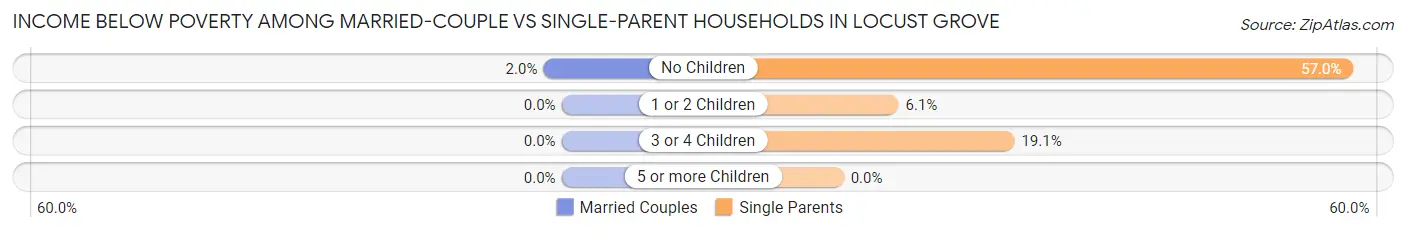
| Children | Married-Couple Families | Single-Parent Households |
| No Children | 9 (2.0%) | 344 (57.0%) |
| 1 or 2 Children | 0 (0.0%) | 29 (6.1%) |
| 3 or 4 Children | 0 (0.0%) | 21 (19.1%) |
| 5 or more Children | 0 (0.0%) | 0 (0.0%) |
| Total | 9 (0.8%) | 394 (33.2%) |
Race in Locust Grove
The most populous races in Locust Grove are White / Caucasian (4,702 | 50.2%), Black / African American (4,022 | 42.9%), and Hispanic or Latino (838 | 8.9%).
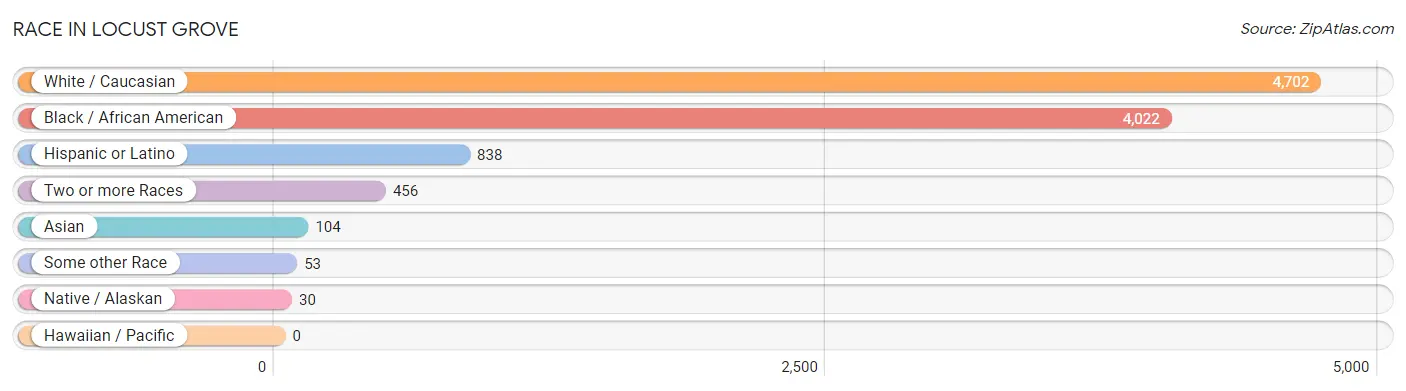
| Race | # Population | % Population |
| Asian | 104 | 1.1% |
| Black / African American | 4,022 | 42.9% |
| Hawaiian / Pacific | 0 | 0.0% |
| Hispanic or Latino | 838 | 8.9% |
| Native / Alaskan | 30 | 0.3% |
| White / Caucasian | 4,702 | 50.2% |
| Two or more Races | 456 | 4.9% |
| Some other Race | 53 | 0.6% |
| Total | 9,367 | 100.0% |
Ancestry in Locust Grove
The most populous ancestries reported in Locust Grove are American (1,946 | 20.8%), English (675 | 7.2%), Mexican (282 | 3.0%), Subsaharan African (270 | 2.9%), and Irish (268 | 2.9%), together accounting for 36.7% of all Locust Grove residents.
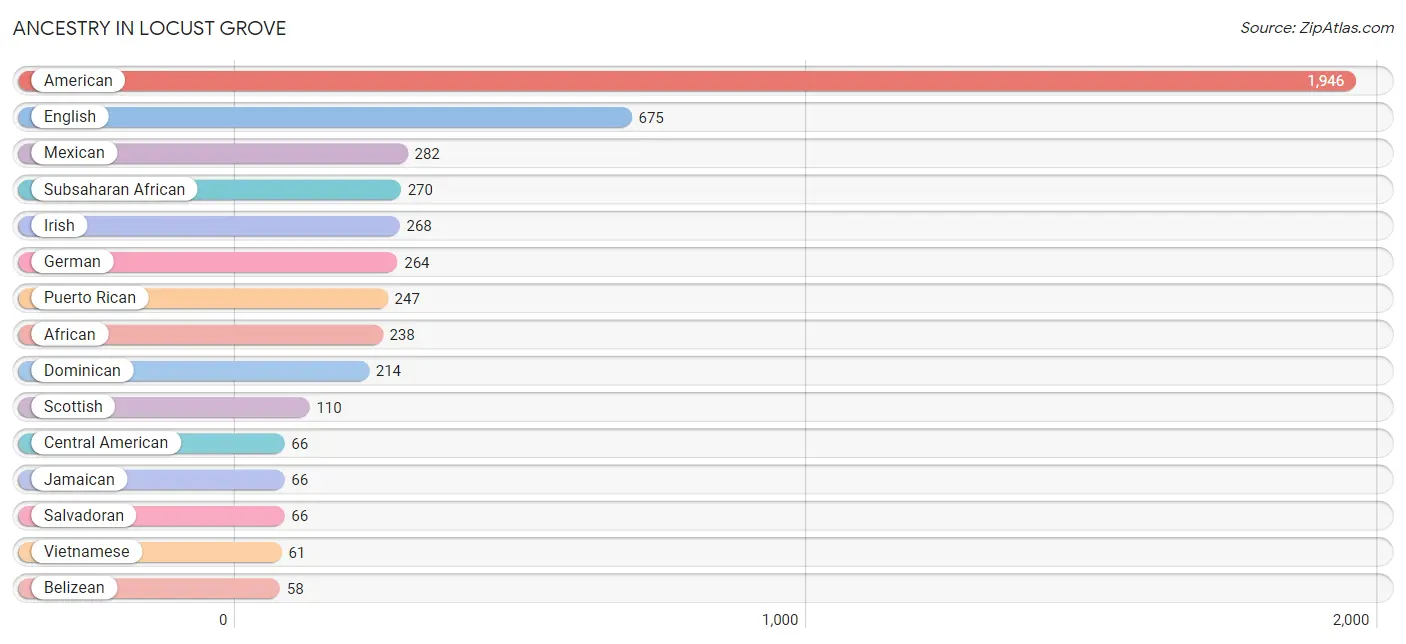
| Ancestry | # Population | % Population |
| African | 238 | 2.5% |
| American | 1,946 | 20.8% |
| Belizean | 58 | 0.6% |
| British | 31 | 0.3% |
| Canadian | 17 | 0.2% |
| Central American | 66 | 0.7% |
| Cherokee | 57 | 0.6% |
| Czechoslovakian | 13 | 0.1% |
| Danish | 10 | 0.1% |
| Dominican | 214 | 2.3% |
| Dutch | 16 | 0.2% |
| English | 675 | 7.2% |
| French | 43 | 0.5% |
| French Canadian | 52 | 0.6% |
| German | 264 | 2.8% |
| Haitian | 42 | 0.4% |
| Irish | 268 | 2.9% |
| Italian | 8 | 0.1% |
| Jamaican | 66 | 0.7% |
| Korean | 43 | 0.5% |
| Mexican | 282 | 3.0% |
| Norwegian | 8 | 0.1% |
| Polish | 16 | 0.2% |
| Puerto Rican | 247 | 2.6% |
| Russian | 24 | 0.3% |
| Salvadoran | 66 | 0.7% |
| Scandinavian | 30 | 0.3% |
| Scottish | 110 | 1.2% |
| Senegalese | 32 | 0.3% |
| Subsaharan African | 270 | 2.9% |
| Trinidadian and Tobagonian | 40 | 0.4% |
| Vietnamese | 61 | 0.6% | View All 32 Rows |
Immigrants in Locust Grove
The most numerous immigrant groups reported in Locust Grove came from Latin America (526 | 5.6%), Caribbean (320 | 3.4%), Dominican Republic (214 | 2.3%), Central America (206 | 2.2%), and Belize (99 | 1.1%), together accounting for 14.6% of all Locust Grove residents.
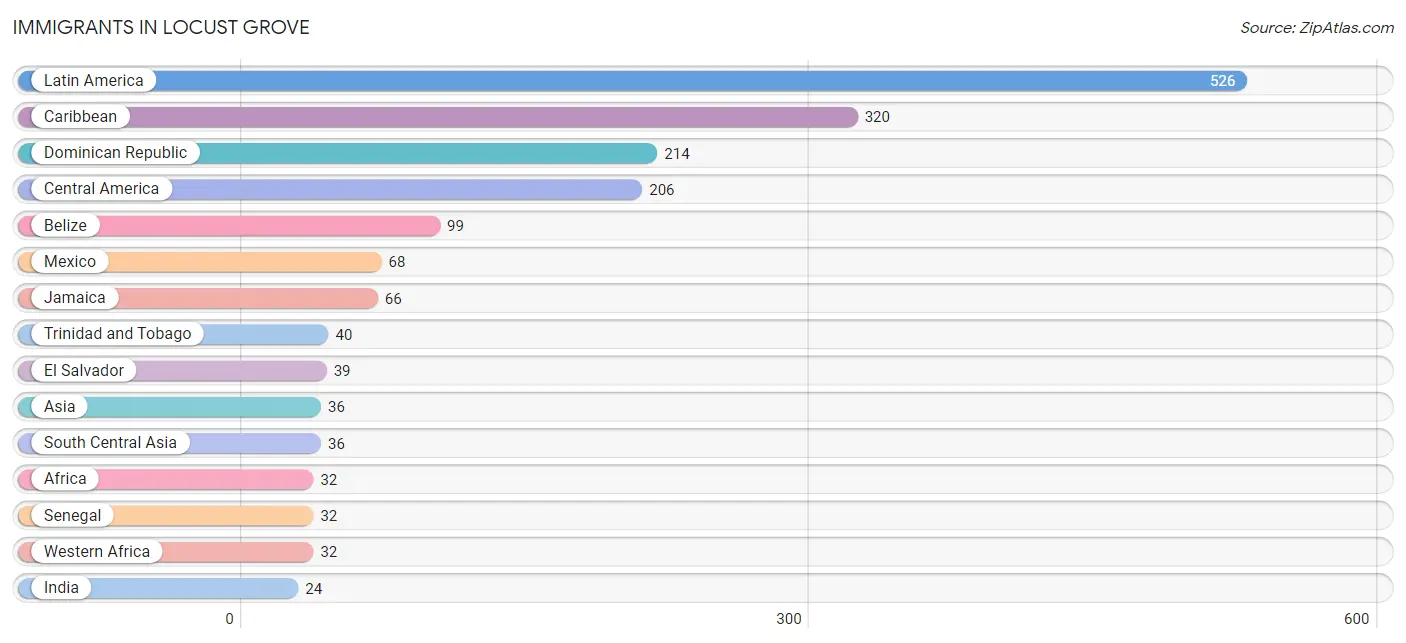
| Immigration Origin | # Population | % Population |
| Africa | 32 | 0.3% |
| Asia | 36 | 0.4% |
| Bangladesh | 12 | 0.1% |
| Belize | 99 | 1.1% |
| Caribbean | 320 | 3.4% |
| Central America | 206 | 2.2% |
| Dominican Republic | 214 | 2.3% |
| El Salvador | 39 | 0.4% |
| India | 24 | 0.3% |
| Jamaica | 66 | 0.7% |
| Latin America | 526 | 5.6% |
| Mexico | 68 | 0.7% |
| Senegal | 32 | 0.3% |
| South Central Asia | 36 | 0.4% |
| Trinidad and Tobago | 40 | 0.4% |
| Western Africa | 32 | 0.3% | View All 16 Rows |
Sex and Age in Locust Grove
Sex and Age in Locust Grove
The most populous age groups in Locust Grove are 45 to 49 Years (550 | 12.3%) for men and 45 to 49 Years (584 | 11.9%) for women.
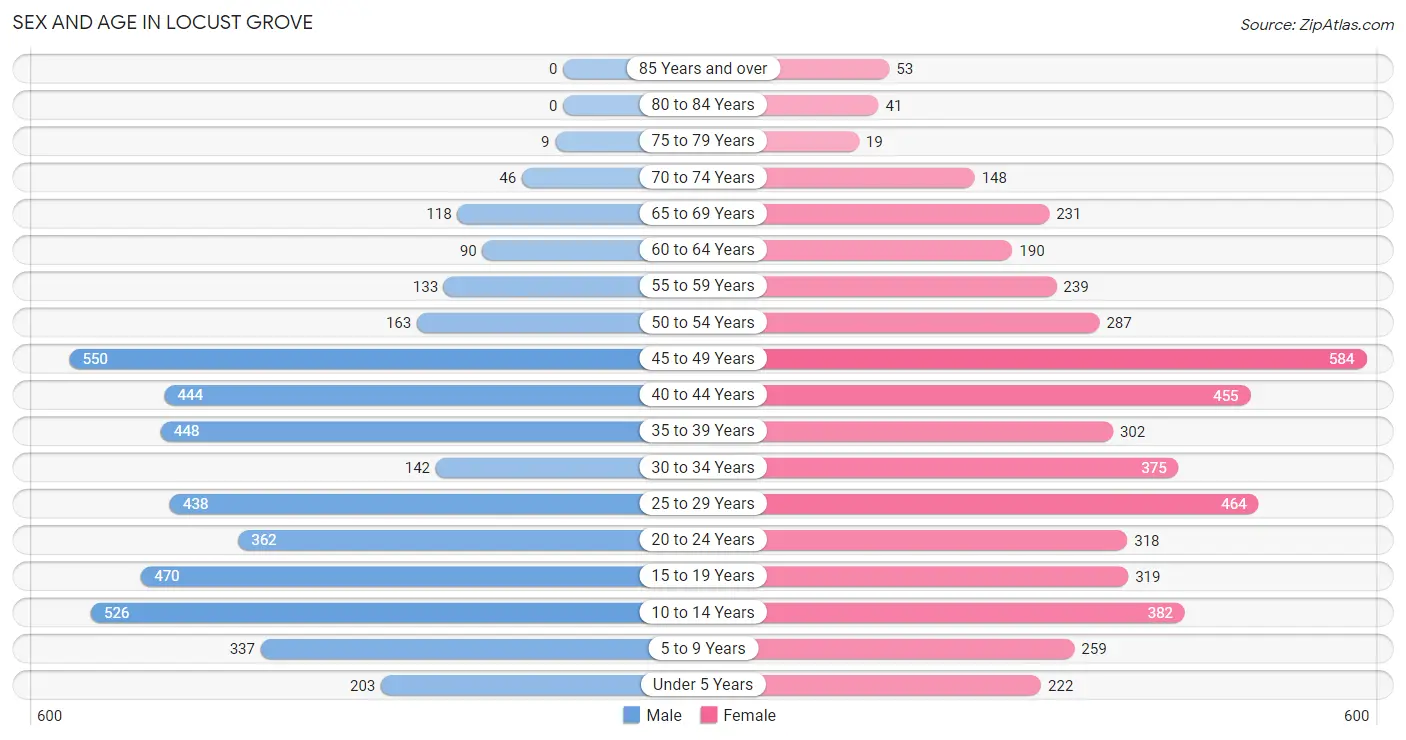
| Age Bracket | Male | Female |
| Under 5 Years | 203 (4.5%) | 222 (4.5%) |
| 5 to 9 Years | 337 (7.5%) | 259 (5.3%) |
| 10 to 14 Years | 526 (11.7%) | 382 (7.8%) |
| 15 to 19 Years | 470 (10.5%) | 319 (6.5%) |
| 20 to 24 Years | 362 (8.1%) | 318 (6.5%) |
| 25 to 29 Years | 438 (9.8%) | 464 (9.5%) |
| 30 to 34 Years | 142 (3.2%) | 375 (7.7%) |
| 35 to 39 Years | 448 (10.0%) | 302 (6.2%) |
| 40 to 44 Years | 444 (9.9%) | 455 (9.3%) |
| 45 to 49 Years | 550 (12.3%) | 584 (11.9%) |
| 50 to 54 Years | 163 (3.6%) | 287 (5.9%) |
| 55 to 59 Years | 133 (3.0%) | 239 (4.9%) |
| 60 to 64 Years | 90 (2.0%) | 190 (3.9%) |
| 65 to 69 Years | 118 (2.6%) | 231 (4.7%) |
| 70 to 74 Years | 46 (1.0%) | 148 (3.0%) |
| 75 to 79 Years | 9 (0.2%) | 19 (0.4%) |
| 80 to 84 Years | 0 (0.0%) | 41 (0.8%) |
| 85 Years and over | 0 (0.0%) | 53 (1.1%) |
| Total | 4,479 (100.0%) | 4,888 (100.0%) |
Families and Households in Locust Grove
Median Family Size in Locust Grove
The median family size in Locust Grove is 3.36 persons per family, with married-couple families (1,098 | 48.1%) accounting for the largest median family size of 4.07 persons per family. On the other hand, single male/father families (489 | 21.4%) represent the smallest median family size with 2.28 persons per family.
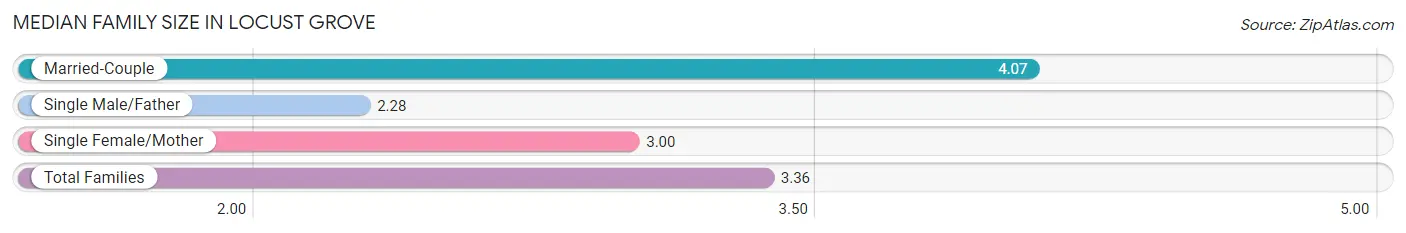
| Family Type | # Families | Family Size |
| Married-Couple | 1,098 (48.1%) | 4.07 |
| Single Male/Father | 489 (21.4%) | 2.28 |
| Single Female/Mother | 697 (30.5%) | 3.00 |
| Total Families | 2,284 (100.0%) | 3.36 |
Median Household Size in Locust Grove
The median household size in Locust Grove is 3.18 persons per household, with married-couple households (1,098 | 37.2%) accounting for the largest median household size of 4.28 persons per household. non-family households (666 | 22.6%) represent the smallest median household size with 1.18 persons per household.
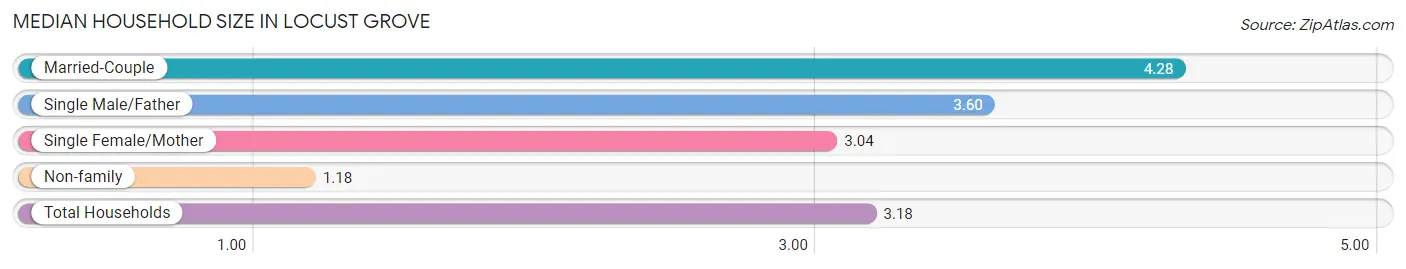
| Household Type | # Households | Household Size |
| Married-Couple | 1,098 (37.2%) | 4.28 |
| Single Male/Father | 489 (16.6%) | 3.60 |
| Single Female/Mother | 697 (23.6%) | 3.04 |
| Non-family | 666 (22.6%) | 1.18 |
| Total Households | 2,950 (100.0%) | 3.18 |
Household Size by Marriage Status in Locust Grove
Out of a total of 2,950 households in Locust Grove, 2,284 (77.4%) are family households, while 666 (22.6%) are nonfamily households. The most numerous type of family households are 2-person households, comprising 749, and the most common type of nonfamily households are 1-person households, comprising 617.
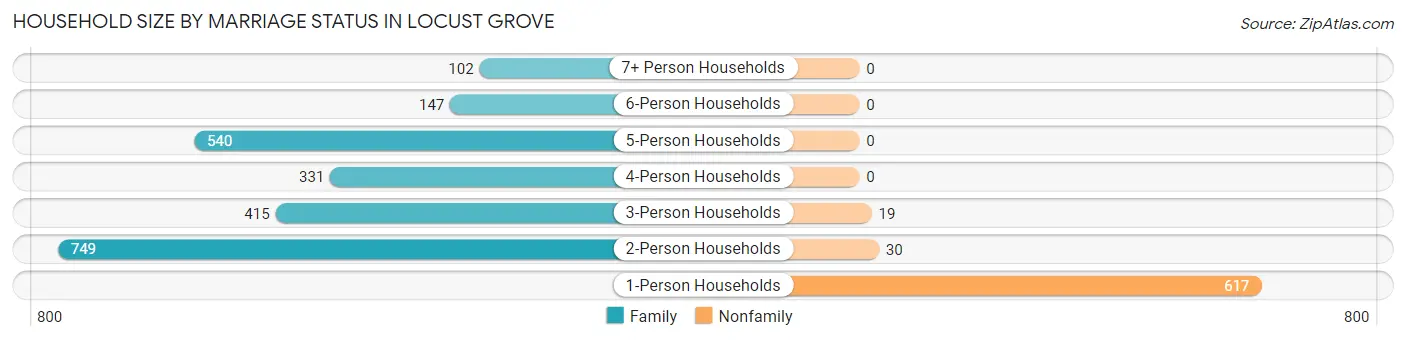
| Household Size | Family Households | Nonfamily Households |
| 1-Person Households | - | 617 (20.9%) |
| 2-Person Households | 749 (25.4%) | 30 (1.0%) |
| 3-Person Households | 415 (14.1%) | 19 (0.6%) |
| 4-Person Households | 331 (11.2%) | 0 (0.0%) |
| 5-Person Households | 540 (18.3%) | 0 (0.0%) |
| 6-Person Households | 147 (5.0%) | 0 (0.0%) |
| 7+ Person Households | 102 (3.5%) | 0 (0.0%) |
| Total | 2,284 (77.4%) | 666 (22.6%) |
Female Fertility in Locust Grove
Fertility by Age in Locust Grove
Average fertility rate in Locust Grove is 47.0 births per 1,000 women. Women in the age bracket of 15 to 19 years have the highest fertility rate with 141.0 births per 1,000 women. Women in the age bracket of 20 to 34 years acount for 57.5% of all women with births.
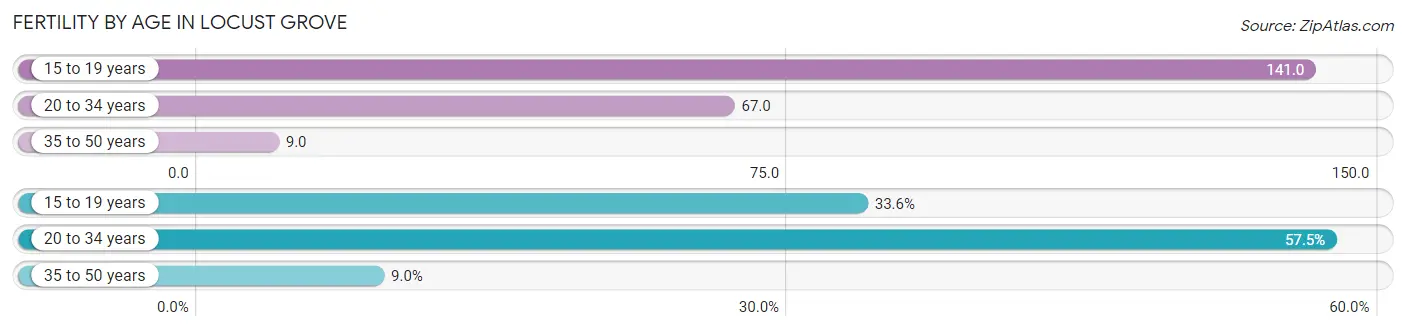
| Age Bracket | Women with Births | Births / 1,000 Women |
| 15 to 19 years | 45 (33.6%) | 141.0 |
| 20 to 34 years | 77 (57.5%) | 67.0 |
| 35 to 50 years | 12 (9.0%) | 9.0 |
| Total | 134 (100.0%) | 47.0 |
Fertility by Age by Marriage Status in Locust Grove
9.0% of women with births (134) in Locust Grove are married. The highest percentage of unmarried women with births falls into 15 to 19 years age bracket with 100.0% of them unmarried at the time of birth, while the lowest percentage of unmarried women with births belong to 35 to 50 years age bracket with 0.0% of them unmarried.
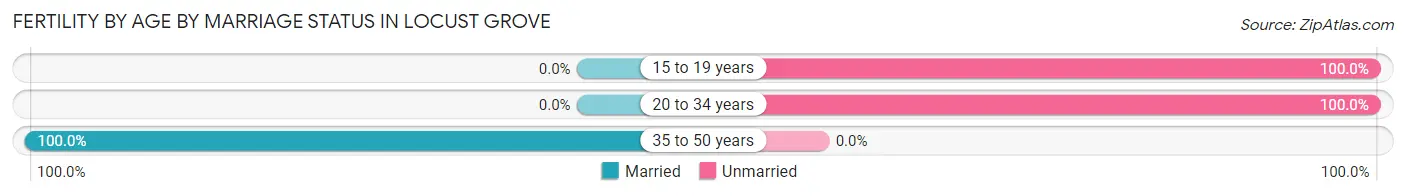
| Age Bracket | Married | Unmarried |
| 15 to 19 years | 0 (0.0%) | 45 (100.0%) |
| 20 to 34 years | 0 (0.0%) | 77 (100.0%) |
| 35 to 50 years | 12 (100.0%) | 0 (0.0%) |
| Total | 12 (9.0%) | 122 (91.0%) |
Fertility by Education in Locust Grove
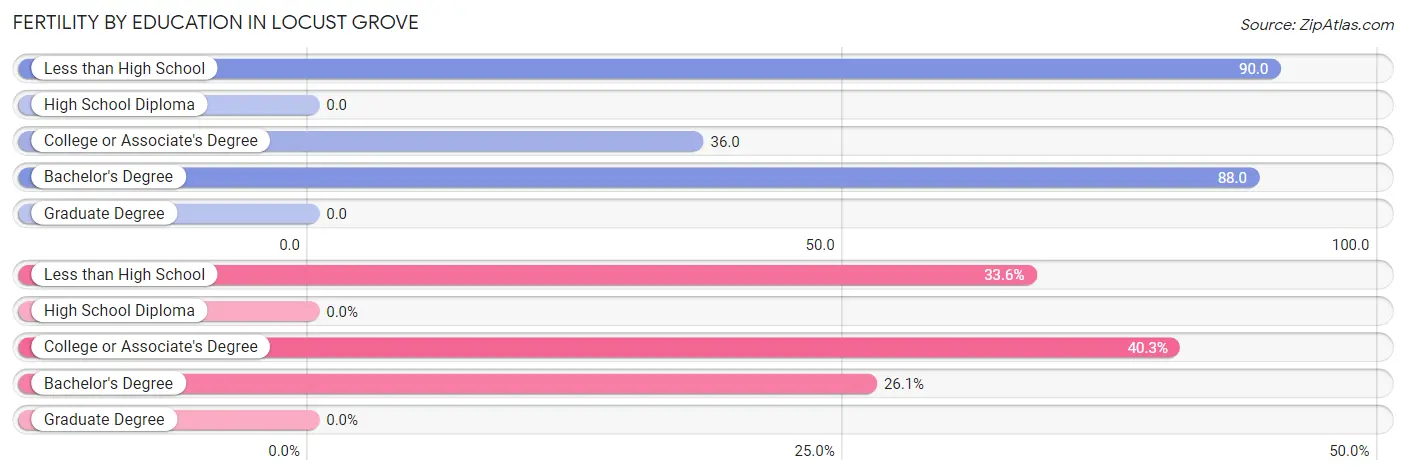
| Educational Attainment | Women with Births | Births / 1,000 Women |
| Less than High School | 45 (33.6%) | 90.0 |
| High School Diploma | 0 (0.0%) | 0.0 |
| College or Associate's Degree | 54 (40.3%) | 36.0 |
| Bachelor's Degree | 35 (26.1%) | 88.0 |
| Graduate Degree | 0 (0.0%) | 0.0 |
| Total | 134 (100.0%) | 47.0 |
Fertility by Education by Marriage Status in Locust Grove
91.0% of women with births in Locust Grove are unmarried. Women with the educational attainment of college or associate's degree are most likely to be married with 22.2% of them married at childbirth, while women with the educational attainment of less than high school are least likely to be married with 100.0% of them unmarried at childbirth.
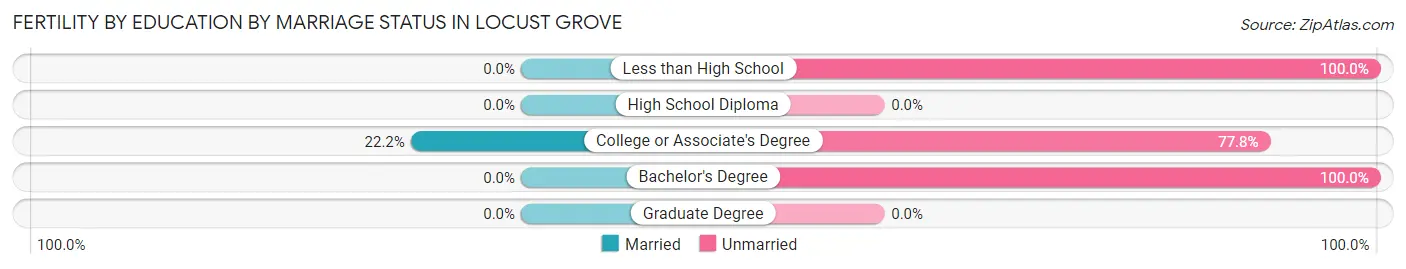
| Educational Attainment | Married | Unmarried |
| Less than High School | 0 (0.0%) | 45 (100.0%) |
| High School Diploma | 0 (0.0%) | 0 (0.0%) |
| College or Associate's Degree | 12 (22.2%) | 42 (77.8%) |
| Bachelor's Degree | 0 (0.0%) | 35 (100.0%) |
| Graduate Degree | 0 (0.0%) | 0 (0.0%) |
| Total | 12 (9.0%) | 122 (91.0%) |
Employment Characteristics in Locust Grove
Employment by Class of Employer in Locust Grove
Among the 4,467 employed individuals in Locust Grove, private company employees (3,119 | 69.8%), local government employees (674 | 15.1%), and self-employed (incorporated) (490 | 11.0%) make up the most common classes of employment.
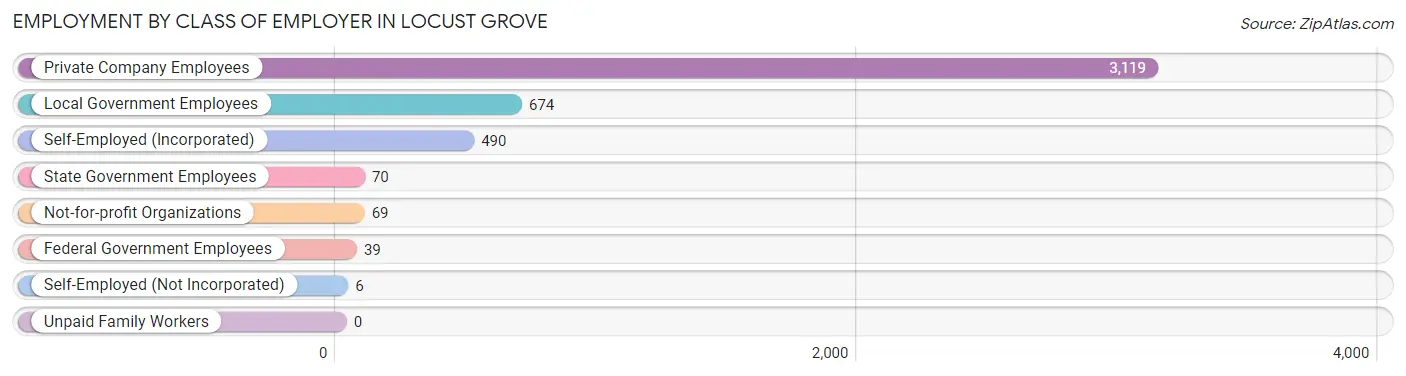
| Employer Class | # Employees | % Employees |
| Private Company Employees | 3,119 | 69.8% |
| Self-Employed (Incorporated) | 490 | 11.0% |
| Self-Employed (Not Incorporated) | 6 | 0.1% |
| Not-for-profit Organizations | 69 | 1.5% |
| Local Government Employees | 674 | 15.1% |
| State Government Employees | 70 | 1.6% |
| Federal Government Employees | 39 | 0.9% |
| Unpaid Family Workers | 0 | 0.0% |
| Total | 4,467 | 100.0% |
Employment Status by Age in Locust Grove
According to the labor force statistics for Locust Grove, out of the total population over 16 years of age (7,177), 68.5% or 4,916 individuals are in the labor force, with 8.5% or 418 of them unemployed. The age group with the highest labor force participation rate is 20 to 24 years, with 96.5% or 656 individuals in the labor force. Within the labor force, the 16 to 19 years age range has the highest percentage of unemployed individuals, with 58.3% or 127 of them being unemployed.
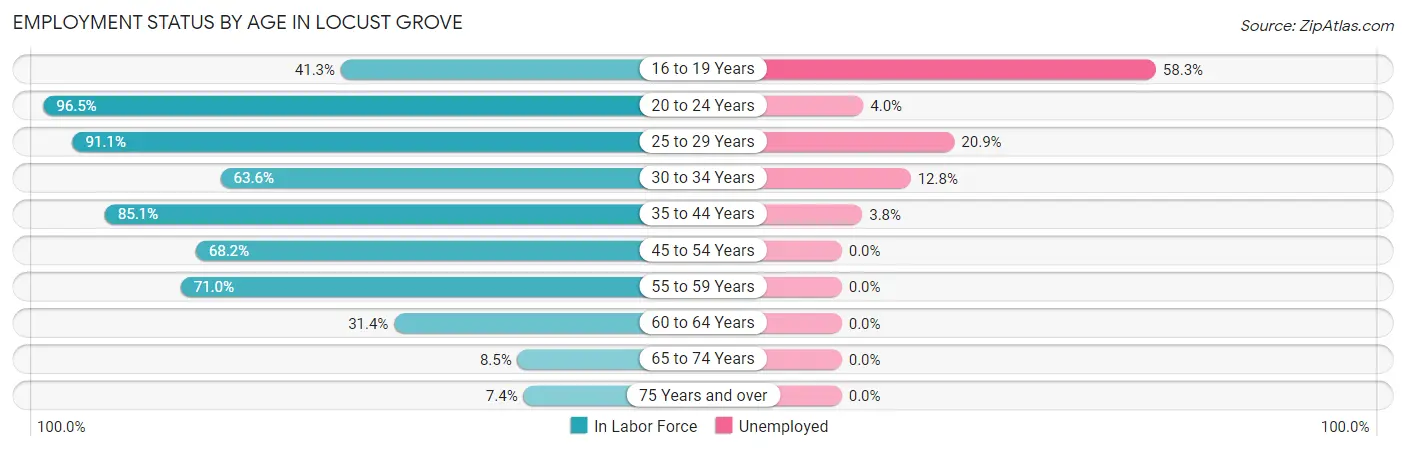
| Age Bracket | In Labor Force | Unemployed |
| 16 to 19 Years | 218 (41.3%) | 127 (58.3%) |
| 20 to 24 Years | 656 (96.5%) | 26 (4.0%) |
| 25 to 29 Years | 822 (91.1%) | 172 (20.9%) |
| 30 to 34 Years | 329 (63.6%) | 42 (12.8%) |
| 35 to 44 Years | 1,403 (85.1%) | 53 (3.8%) |
| 45 to 54 Years | 1,080 (68.2%) | 0 (0.0%) |
| 55 to 59 Years | 264 (71.0%) | 0 (0.0%) |
| 60 to 64 Years | 88 (31.4%) | 0 (0.0%) |
| 65 to 74 Years | 46 (8.5%) | 0 (0.0%) |
| 75 Years and over | 9 (7.4%) | 0 (0.0%) |
| Total | 4,916 (68.5%) | 418 (8.5%) |
Employment Status by Educational Attainment in Locust Grove
According to labor force statistics for Locust Grove, 75.2% of individuals (3,989) out of the total population between 25 and 64 years of age (5,304) are in the labor force, with 6.7% or 267 of them being unemployed. The group with the highest labor force participation rate are those with the educational attainment of bachelor's degree or higher, with 92.0% or 1,223 individuals in the labor force. Within the labor force, individuals with less than high school education have the highest percentage of unemployment, with 18.2% or 20 of them being unemployed.
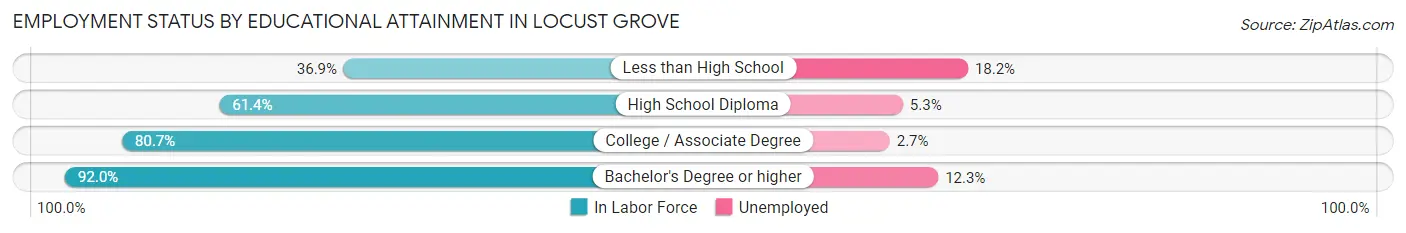
| Educational Attainment | In Labor Force | Unemployed |
| Less than High School | 110 (36.9%) | 54 (18.2%) |
| High School Diploma | 1,001 (61.4%) | 86 (5.3%) |
| College / Associate Degree | 1,651 (80.7%) | 55 (2.7%) |
| Bachelor's Degree or higher | 1,223 (92.0%) | 163 (12.3%) |
| Total | 3,989 (75.2%) | 355 (6.7%) |
Employment Occupations by Sex in Locust Grove
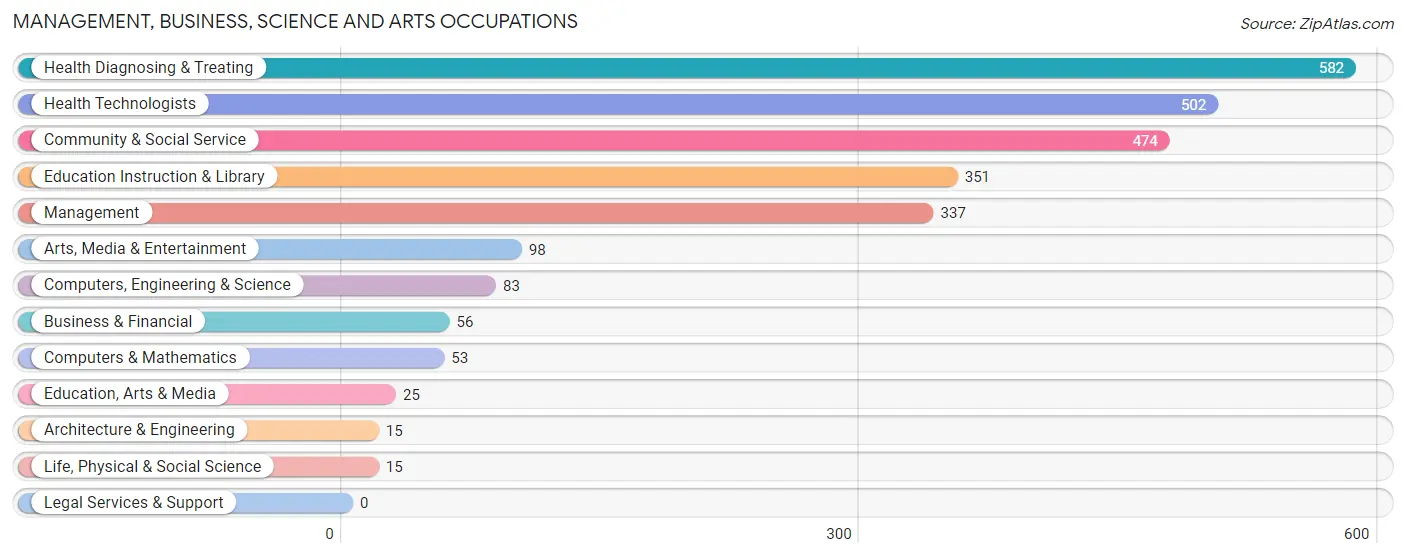
Management, Business, Science and Arts Occupations
The most common Management, Business, Science and Arts occupations in Locust Grove are Health Diagnosing & Treating (582 | 12.9%), Health Technologists (502 | 11.2%), Community & Social Service (474 | 10.5%), Education Instruction & Library (351 | 7.8%), and Management (337 | 7.5%).
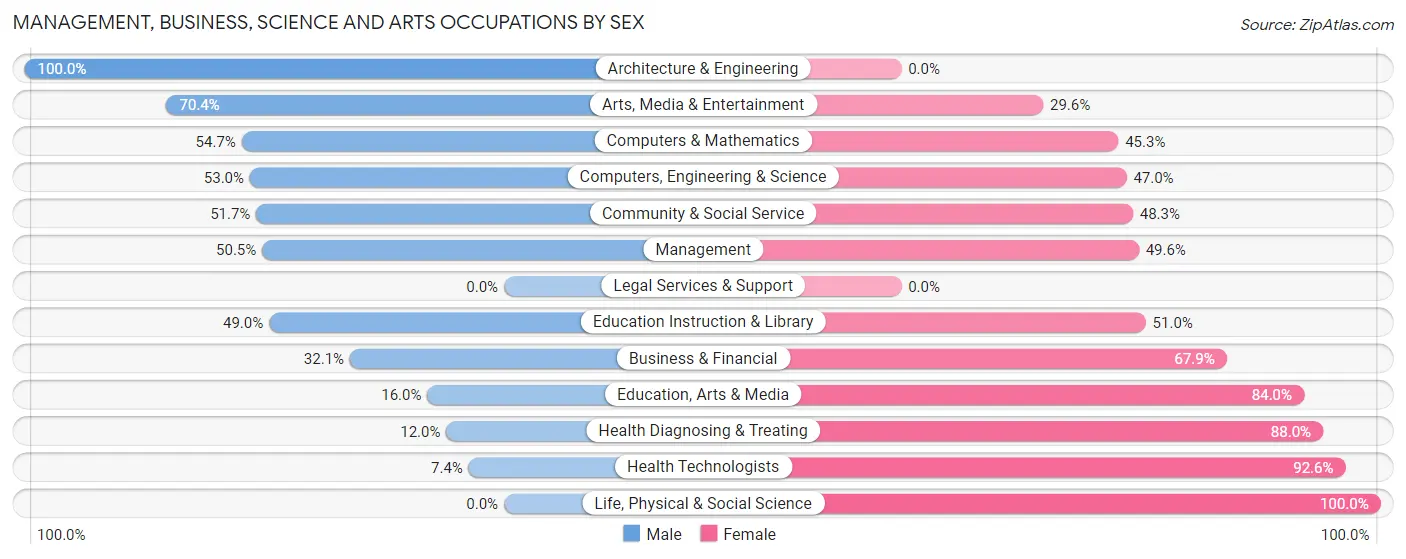
Management, Business, Science and Arts Occupations by Sex
Within the Management, Business, Science and Arts occupations in Locust Grove, the most male-oriented occupations are Architecture & Engineering (100.0%), Arts, Media & Entertainment (70.4%), and Computers & Mathematics (54.7%), while the most female-oriented occupations are Life, Physical & Social Science (100.0%), Health Technologists (92.6%), and Health Diagnosing & Treating (88.0%).
| Occupation | Male | Female |
| Management | 170 (50.4%) | 167 (49.5%) |
| Business & Financial | 18 (32.1%) | 38 (67.9%) |
| Computers, Engineering & Science | 44 (53.0%) | 39 (47.0%) |
| Computers & Mathematics | 29 (54.7%) | 24 (45.3%) |
| Architecture & Engineering | 15 (100.0%) | 0 (0.0%) |
| Life, Physical & Social Science | 0 (0.0%) | 15 (100.0%) |
| Community & Social Service | 245 (51.7%) | 229 (48.3%) |
| Education, Arts & Media | 4 (16.0%) | 21 (84.0%) |
| Legal Services & Support | 0 (0.0%) | 0 (0.0%) |
| Education Instruction & Library | 172 (49.0%) | 179 (51.0%) |
| Arts, Media & Entertainment | 69 (70.4%) | 29 (29.6%) |
| Health Diagnosing & Treating | 70 (12.0%) | 512 (88.0%) |
| Health Technologists | 37 (7.4%) | 465 (92.6%) |
| Total (Category) | 547 (35.7%) | 985 (64.3%) |
| Total (Overall) | 2,069 (46.0%) | 2,427 (54.0%) |
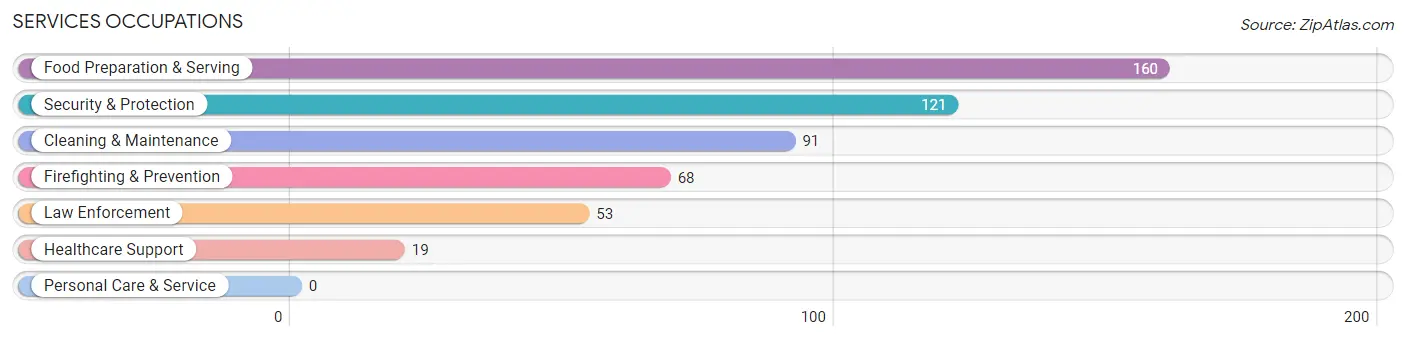
Services Occupations
The most common Services occupations in Locust Grove are Food Preparation & Serving (160 | 3.6%), Security & Protection (121 | 2.7%), Cleaning & Maintenance (91 | 2.0%), Firefighting & Prevention (68 | 1.5%), and Law Enforcement (53 | 1.2%).
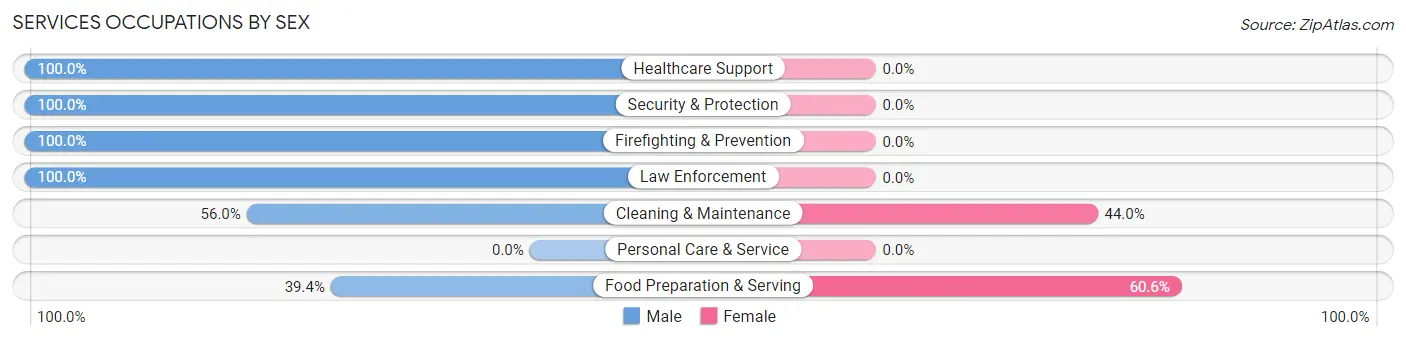
Services Occupations by Sex
Within the Services occupations in Locust Grove, the most male-oriented occupations are Healthcare Support (100.0%), Security & Protection (100.0%), and Firefighting & Prevention (100.0%), while the most female-oriented occupations are Food Preparation & Serving (60.6%), and Cleaning & Maintenance (44.0%).
| Occupation | Male | Female |
| Healthcare Support | 19 (100.0%) | 0 (0.0%) |
| Security & Protection | 121 (100.0%) | 0 (0.0%) |
| Firefighting & Prevention | 68 (100.0%) | 0 (0.0%) |
| Law Enforcement | 53 (100.0%) | 0 (0.0%) |
| Food Preparation & Serving | 63 (39.4%) | 97 (60.6%) |
| Cleaning & Maintenance | 51 (56.0%) | 40 (44.0%) |
| Personal Care & Service | 0 (0.0%) | 0 (0.0%) |
| Total (Category) | 254 (65.0%) | 137 (35.0%) |
| Total (Overall) | 2,069 (46.0%) | 2,427 (54.0%) |
Sales and Office Occupations
The most common Sales and Office occupations in Locust Grove are Sales & Related (1,054 | 23.4%), and Office & Administration (714 | 15.9%).

Sales and Office Occupations by Sex
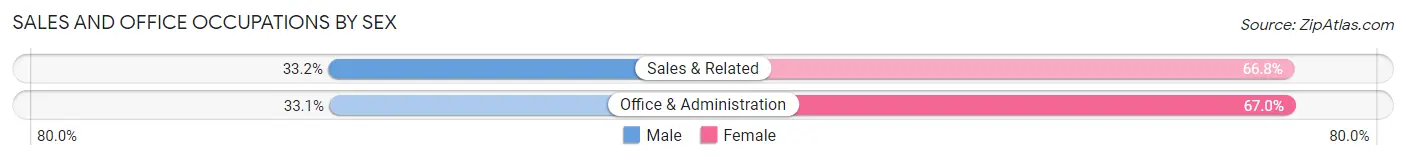
| Occupation | Male | Female |
| Sales & Related | 350 (33.2%) | 704 (66.8%) |
| Office & Administration | 236 (33.1%) | 478 (66.9%) |
| Total (Category) | 586 (33.1%) | 1,182 (66.9%) |
| Total (Overall) | 2,069 (46.0%) | 2,427 (54.0%) |
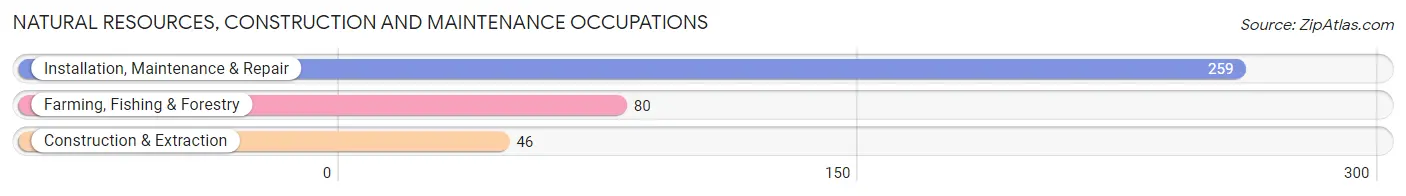
Natural Resources, Construction and Maintenance Occupations
The most common Natural Resources, Construction and Maintenance occupations in Locust Grove are Installation, Maintenance & Repair (259 | 5.8%), Farming, Fishing & Forestry (80 | 1.8%), and Construction & Extraction (46 | 1.0%).
Natural Resources, Construction and Maintenance Occupations by Sex
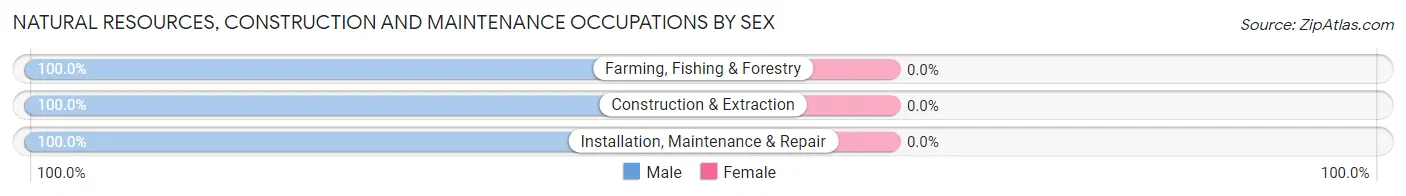
| Occupation | Male | Female |
| Farming, Fishing & Forestry | 80 (100.0%) | 0 (0.0%) |
| Construction & Extraction | 46 (100.0%) | 0 (0.0%) |
| Installation, Maintenance & Repair | 259 (100.0%) | 0 (0.0%) |
| Total (Category) | 385 (100.0%) | 0 (0.0%) |
| Total (Overall) | 2,069 (46.0%) | 2,427 (54.0%) |
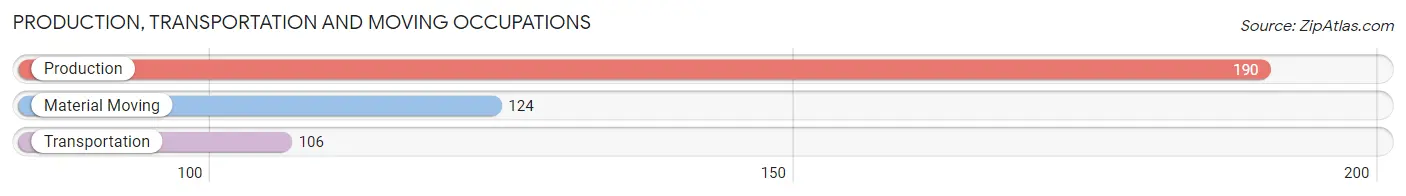
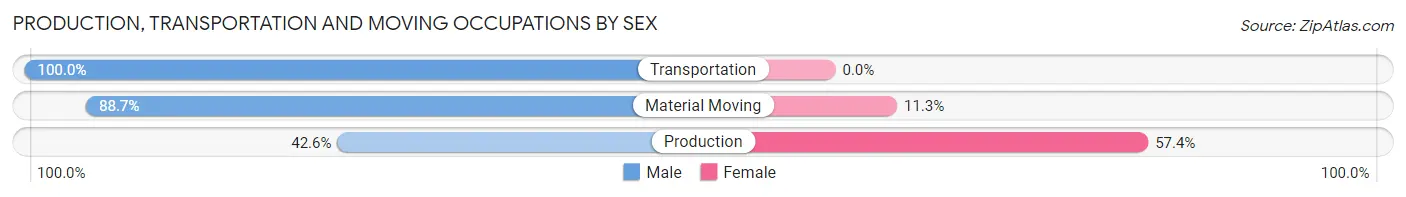
Production, Transportation and Moving Occupations
The most common Production, Transportation and Moving occupations in Locust Grove are Production (190 | 4.2%), Material Moving (124 | 2.8%), and Transportation (106 | 2.4%).
Production, Transportation and Moving Occupations by Sex
| Occupation | Male | Female |
| Production | 81 (42.6%) | 109 (57.4%) |
| Transportation | 106 (100.0%) | 0 (0.0%) |
| Material Moving | 110 (88.7%) | 14 (11.3%) |
| Total (Category) | 297 (70.7%) | 123 (29.3%) |
| Total (Overall) | 2,069 (46.0%) | 2,427 (54.0%) |
Employment Industries by Sex in Locust Grove
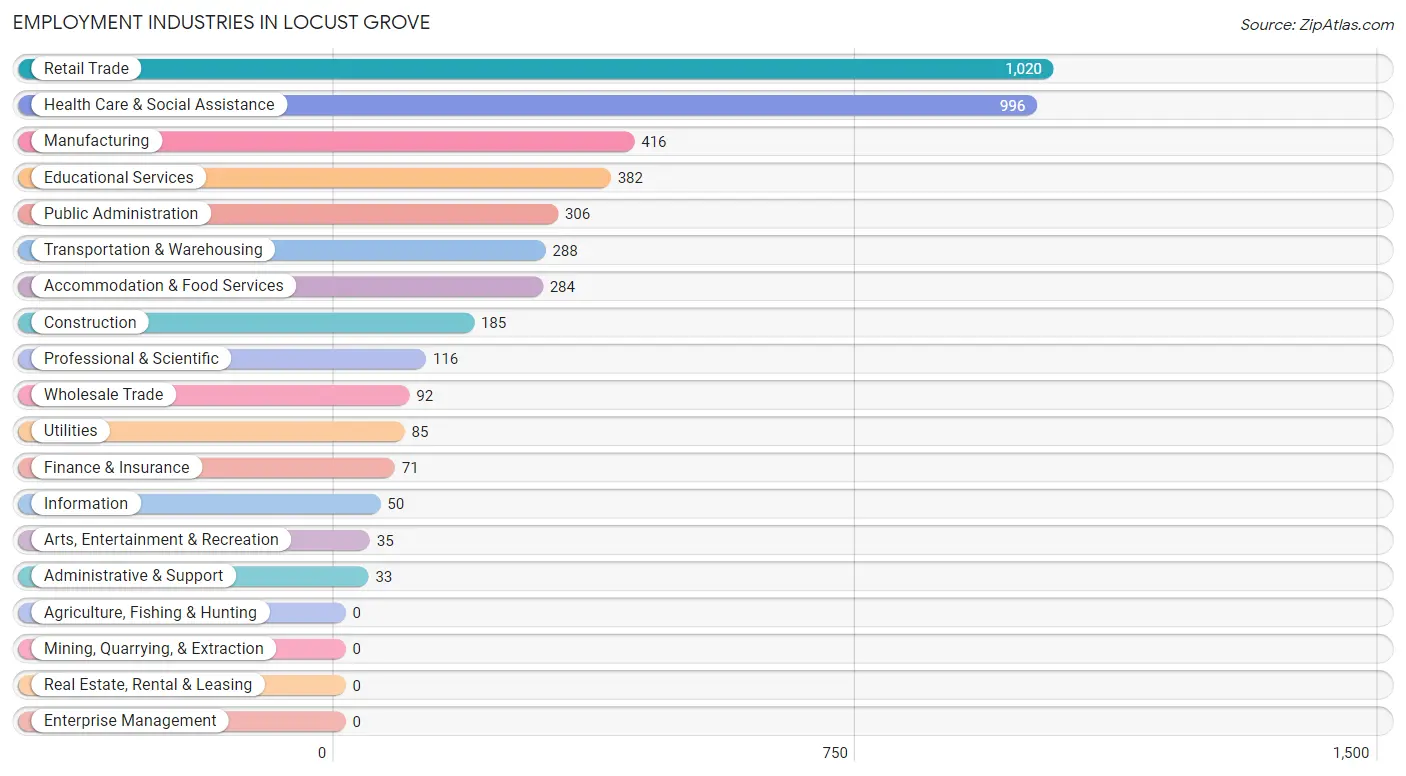
Employment Industries in Locust Grove
The major employment industries in Locust Grove include Retail Trade (1,020 | 22.7%), Health Care & Social Assistance (996 | 22.2%), Manufacturing (416 | 9.2%), Educational Services (382 | 8.5%), and Public Administration (306 | 6.8%).
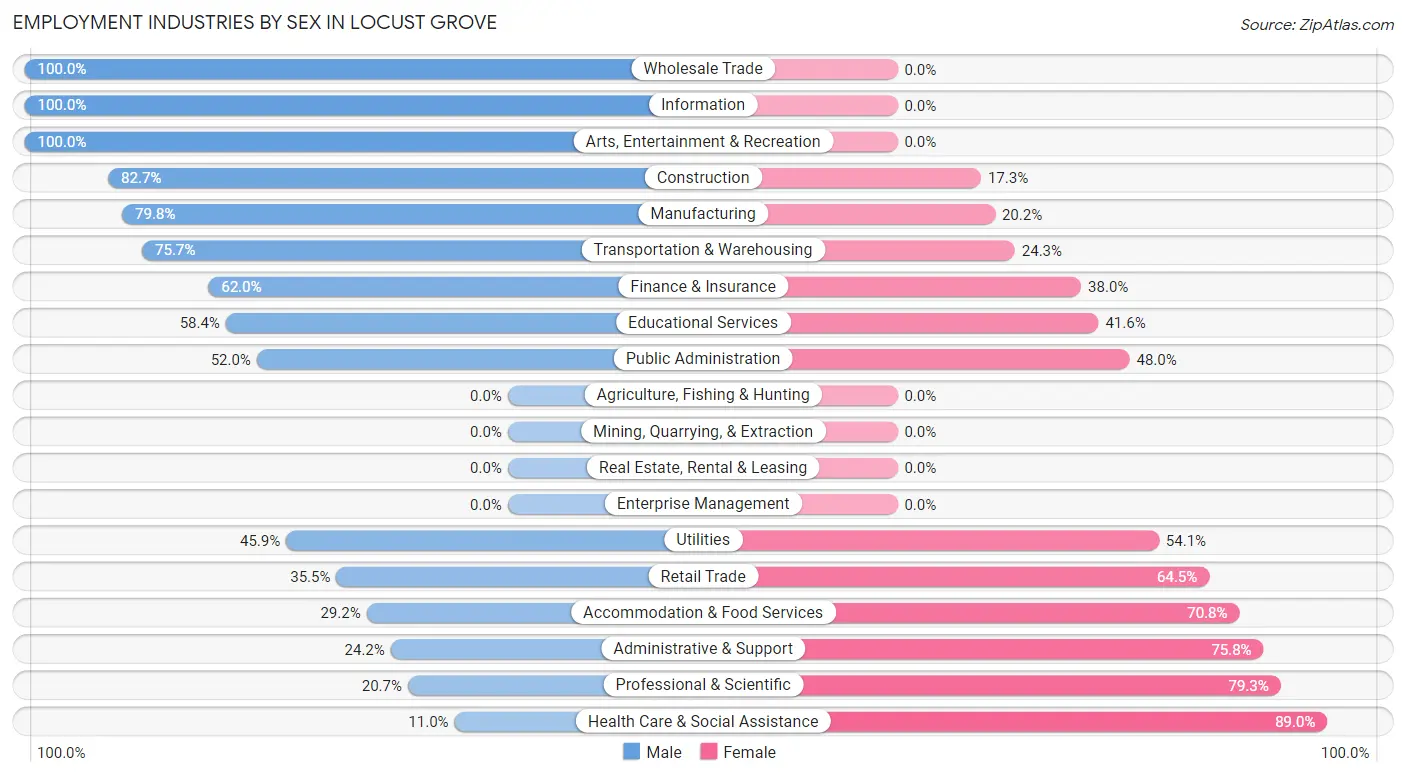
Employment Industries by Sex in Locust Grove
The Locust Grove industries that see more men than women are Wholesale Trade (100.0%), Information (100.0%), and Arts, Entertainment & Recreation (100.0%), whereas the industries that tend to have a higher number of women are Health Care & Social Assistance (89.0%), Professional & Scientific (79.3%), and Administrative & Support (75.8%).
| Industry | Male | Female |
| Agriculture, Fishing & Hunting | 0 (0.0%) | 0 (0.0%) |
| Mining, Quarrying, & Extraction | 0 (0.0%) | 0 (0.0%) |
| Construction | 153 (82.7%) | 32 (17.3%) |
| Manufacturing | 332 (79.8%) | 84 (20.2%) |
| Wholesale Trade | 92 (100.0%) | 0 (0.0%) |
| Retail Trade | 362 (35.5%) | 658 (64.5%) |
| Transportation & Warehousing | 218 (75.7%) | 70 (24.3%) |
| Utilities | 39 (45.9%) | 46 (54.1%) |
| Information | 50 (100.0%) | 0 (0.0%) |
| Finance & Insurance | 44 (62.0%) | 27 (38.0%) |
| Real Estate, Rental & Leasing | 0 (0.0%) | 0 (0.0%) |
| Professional & Scientific | 24 (20.7%) | 92 (79.3%) |
| Enterprise Management | 0 (0.0%) | 0 (0.0%) |
| Administrative & Support | 8 (24.2%) | 25 (75.8%) |
| Educational Services | 223 (58.4%) | 159 (41.6%) |
| Health Care & Social Assistance | 110 (11.0%) | 886 (89.0%) |
| Arts, Entertainment & Recreation | 35 (100.0%) | 0 (0.0%) |
| Accommodation & Food Services | 83 (29.2%) | 201 (70.8%) |
| Public Administration | 159 (52.0%) | 147 (48.0%) |
| Total | 2,069 (46.0%) | 2,427 (54.0%) |
Education in Locust Grove
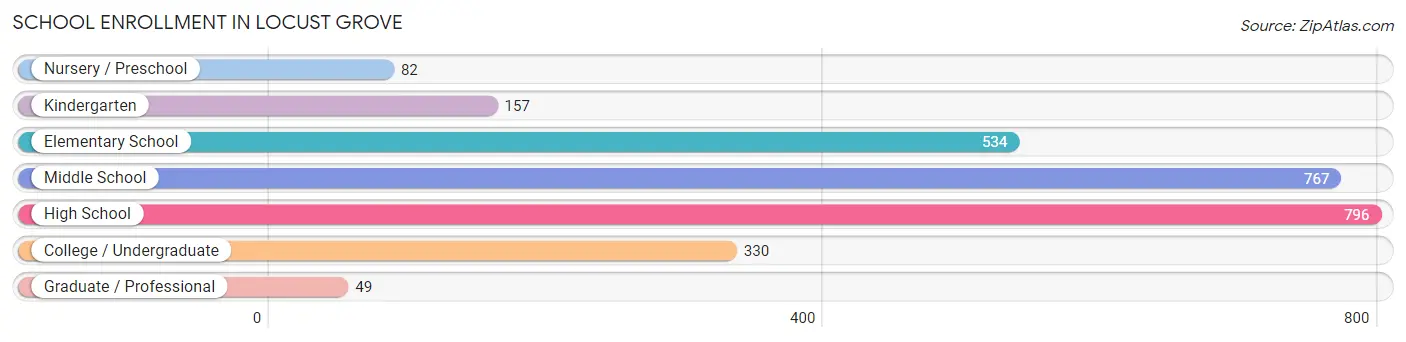
School Enrollment in Locust Grove
The most common levels of schooling among the 2,715 students in Locust Grove are high school (796 | 29.3%), middle school (767 | 28.2%), and elementary school (534 | 19.7%).
| School Level | # Students | % Students |
| Nursery / Preschool | 82 | 3.0% |
| Kindergarten | 157 | 5.8% |
| Elementary School | 534 | 19.7% |
| Middle School | 767 | 28.2% |
| High School | 796 | 29.3% |
| College / Undergraduate | 330 | 12.1% |
| Graduate / Professional | 49 | 1.8% |
| Total | 2,715 | 100.0% |
School Enrollment by Age by Funding Source in Locust Grove
Out of a total of 2,715 students who are enrolled in schools in Locust Grove, 98 (3.6%) attend a private institution, while the remaining 2,617 (96.4%) are enrolled in public schools. The age group of 25 to 34 year olds has the highest likelihood of being enrolled in private schools, with 35 (54.7% in the age bracket) enrolled. Conversely, the age group of 5 to 9 year old has the lowest likelihood of being enrolled in a private school, with 596 (100.0% in the age bracket) attending a public institution.
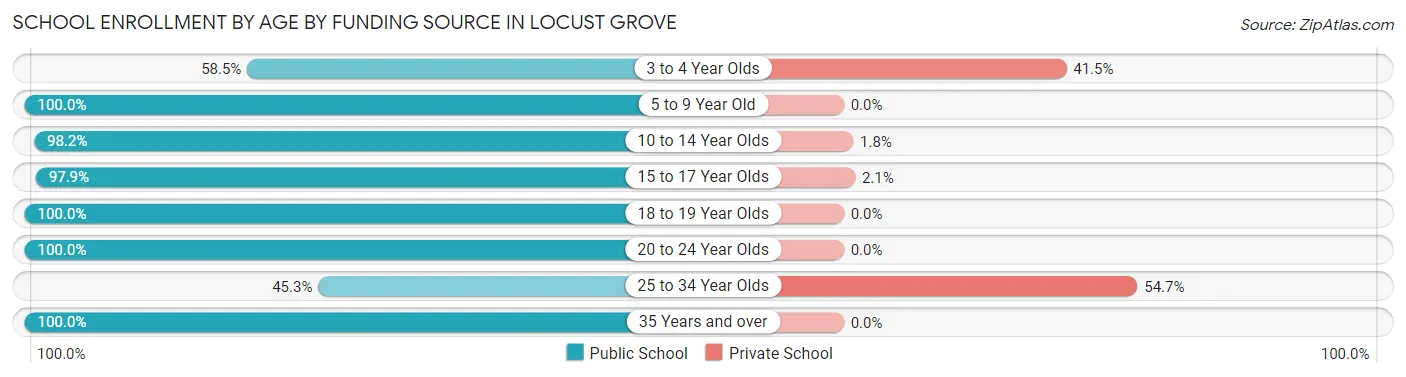
| Age Bracket | Public School | Private School |
| 3 to 4 Year Olds | 48 (58.5%) | 34 (41.5%) |
| 5 to 9 Year Old | 596 (100.0%) | 0 (0.0%) |
| 10 to 14 Year Olds | 892 (98.2%) | 16 (1.8%) |
| 15 to 17 Year Olds | 650 (97.9%) | 14 (2.1%) |
| 18 to 19 Year Olds | 86 (100.0%) | 0 (0.0%) |
| 20 to 24 Year Olds | 271 (100.0%) | 0 (0.0%) |
| 25 to 34 Year Olds | 29 (45.3%) | 35 (54.7%) |
| 35 Years and over | 44 (100.0%) | 0 (0.0%) |
| Total | 2,617 (96.4%) | 98 (3.6%) |
Educational Attainment by Field of Study in Locust Grove
Psychology (252 | 17.8%), business (243 | 17.2%), arts & humanities (162 | 11.5%), science & technology (125 | 8.8%), and education (109 | 7.7%) are the most common fields of study among 1,414 individuals in Locust Grove who have obtained a bachelor's degree or higher.
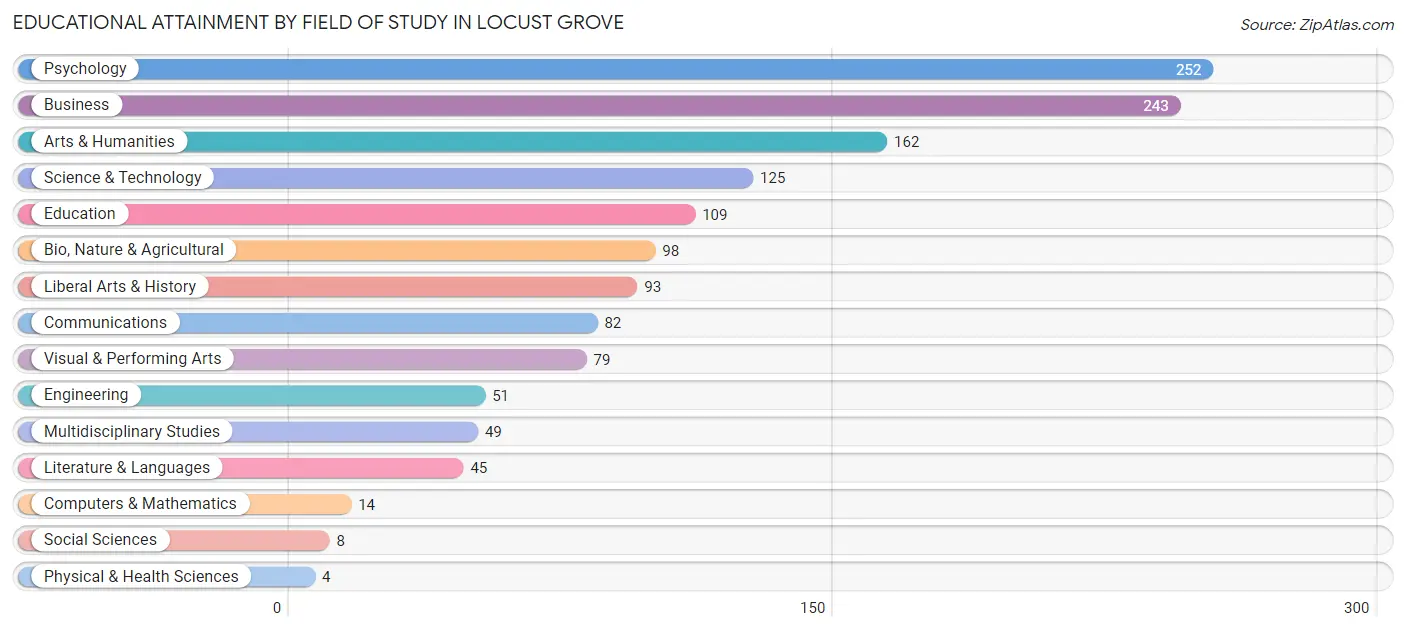
| Field of Study | # Graduates | % Graduates |
| Computers & Mathematics | 14 | 1.0% |
| Bio, Nature & Agricultural | 98 | 6.9% |
| Physical & Health Sciences | 4 | 0.3% |
| Psychology | 252 | 17.8% |
| Social Sciences | 8 | 0.6% |
| Engineering | 51 | 3.6% |
| Multidisciplinary Studies | 49 | 3.5% |
| Science & Technology | 125 | 8.8% |
| Business | 243 | 17.2% |
| Education | 109 | 7.7% |
| Literature & Languages | 45 | 3.2% |
| Liberal Arts & History | 93 | 6.6% |
| Visual & Performing Arts | 79 | 5.6% |
| Communications | 82 | 5.8% |
| Arts & Humanities | 162 | 11.5% |
| Total | 1,414 | 100.0% |
Transportation & Commute in Locust Grove
Vehicle Availability by Sex in Locust Grove
The most prevalent vehicle ownership categories in Locust Grove are males with 1 vehicle (678, accounting for 33.0%) and females with 1 vehicle (841, making up 28.1%).
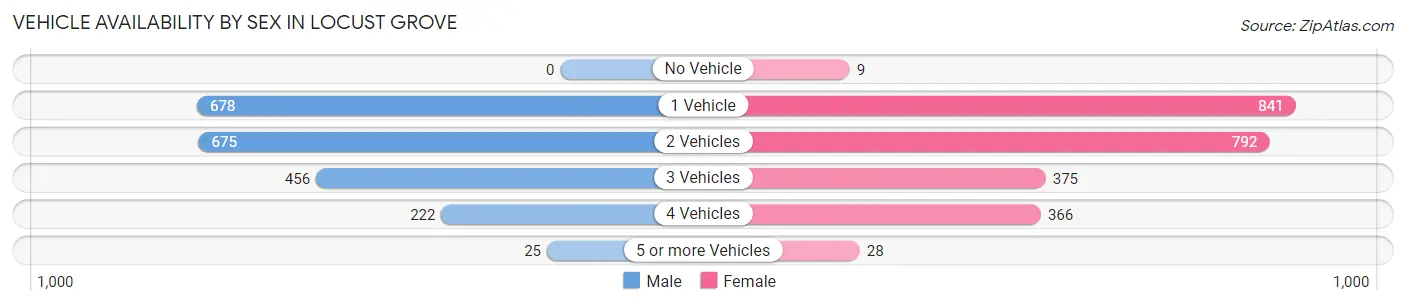
| Vehicles Available | Male | Female |
| No Vehicle | 0 (0.0%) | 9 (0.4%) |
| 1 Vehicle | 678 (33.0%) | 841 (34.9%) |
| 2 Vehicles | 675 (32.8%) | 792 (32.9%) |
| 3 Vehicles | 456 (22.2%) | 375 (15.5%) |
| 4 Vehicles | 222 (10.8%) | 366 (15.2%) |
| 5 or more Vehicles | 25 (1.2%) | 28 (1.2%) |
| Total | 2,056 (100.0%) | 2,411 (100.0%) |
Commute Time in Locust Grove
The most frequently occuring commute durations in Locust Grove are 15 to 19 minutes (1,001 commuters, 24.3%), 30 to 34 minutes (597 commuters, 14.5%), and 60 to 89 minutes (562 commuters, 13.7%).
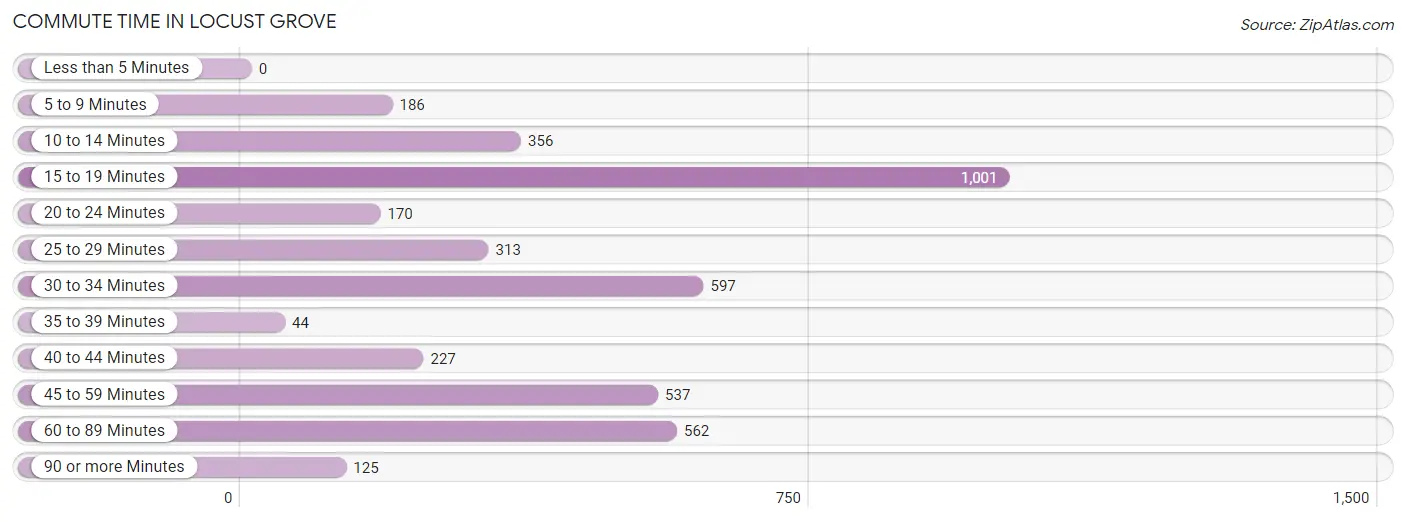
| Commute Time | # Commuters | % Commuters |
| Less than 5 Minutes | 0 | 0.0% |
| 5 to 9 Minutes | 186 | 4.5% |
| 10 to 14 Minutes | 356 | 8.6% |
| 15 to 19 Minutes | 1,001 | 24.3% |
| 20 to 24 Minutes | 170 | 4.1% |
| 25 to 29 Minutes | 313 | 7.6% |
| 30 to 34 Minutes | 597 | 14.5% |
| 35 to 39 Minutes | 44 | 1.1% |
| 40 to 44 Minutes | 227 | 5.5% |
| 45 to 59 Minutes | 537 | 13.0% |
| 60 to 89 Minutes | 562 | 13.7% |
| 90 or more Minutes | 125 | 3.0% |
Commute Time by Sex in Locust Grove
The most common commute times in Locust Grove are 60 to 89 minutes (429 commuters, 22.9%) for males and 15 to 19 minutes (850 commuters, 37.9%) for females.
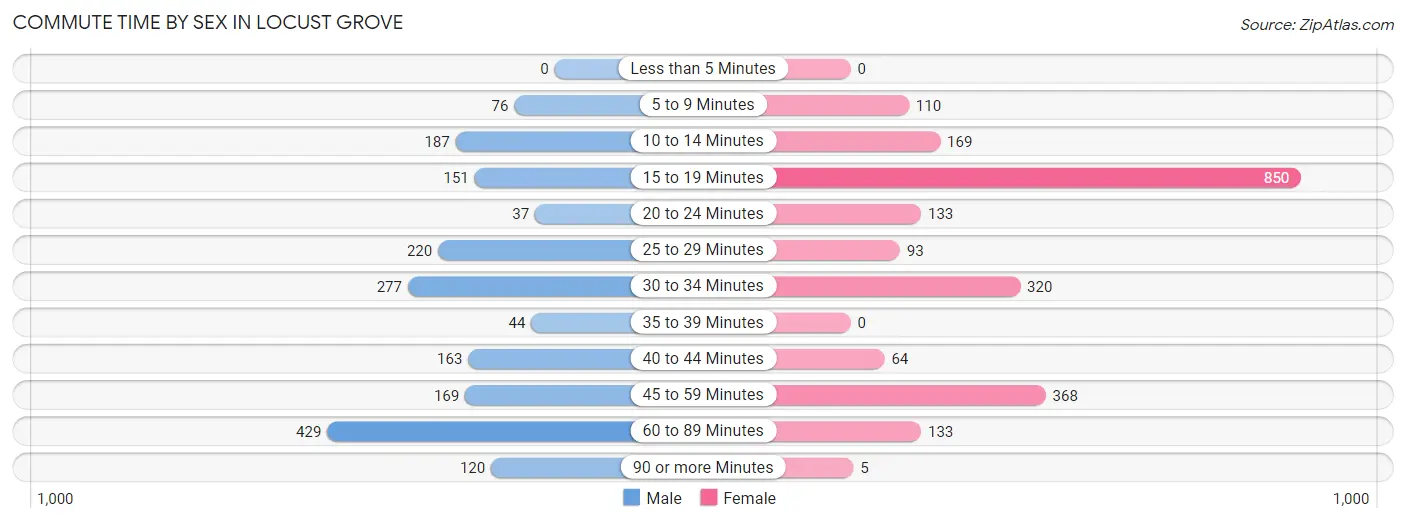
| Commute Time | Male | Female |
| Less than 5 Minutes | 0 (0.0%) | 0 (0.0%) |
| 5 to 9 Minutes | 76 (4.1%) | 110 (4.9%) |
| 10 to 14 Minutes | 187 (10.0%) | 169 (7.5%) |
| 15 to 19 Minutes | 151 (8.1%) | 850 (37.9%) |
| 20 to 24 Minutes | 37 (2.0%) | 133 (5.9%) |
| 25 to 29 Minutes | 220 (11.7%) | 93 (4.1%) |
| 30 to 34 Minutes | 277 (14.8%) | 320 (14.2%) |
| 35 to 39 Minutes | 44 (2.4%) | 0 (0.0%) |
| 40 to 44 Minutes | 163 (8.7%) | 64 (2.9%) |
| 45 to 59 Minutes | 169 (9.0%) | 368 (16.4%) |
| 60 to 89 Minutes | 429 (22.9%) | 133 (5.9%) |
| 90 or more Minutes | 120 (6.4%) | 5 (0.2%) |
Time of Departure to Work by Sex in Locust Grove
The most frequent times of departure to work in Locust Grove are 6:00 AM to 6:29 AM (485, 25.9%) for males and 7:30 AM to 7:59 AM (615, 27.4%) for females.
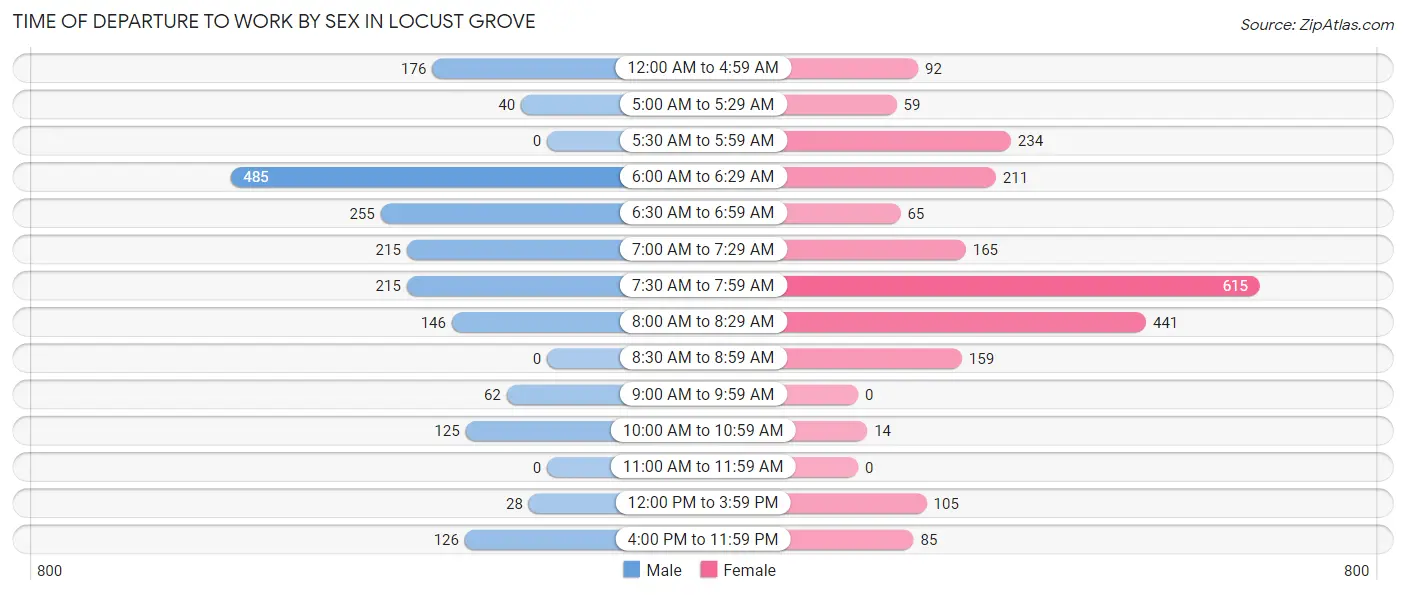
| Time of Departure | Male | Female |
| 12:00 AM to 4:59 AM | 176 (9.4%) | 92 (4.1%) |
| 5:00 AM to 5:29 AM | 40 (2.1%) | 59 (2.6%) |
| 5:30 AM to 5:59 AM | 0 (0.0%) | 234 (10.4%) |
| 6:00 AM to 6:29 AM | 485 (25.9%) | 211 (9.4%) |
| 6:30 AM to 6:59 AM | 255 (13.6%) | 65 (2.9%) |
| 7:00 AM to 7:29 AM | 215 (11.5%) | 165 (7.3%) |
| 7:30 AM to 7:59 AM | 215 (11.5%) | 615 (27.4%) |
| 8:00 AM to 8:29 AM | 146 (7.8%) | 441 (19.6%) |
| 8:30 AM to 8:59 AM | 0 (0.0%) | 159 (7.1%) |
| 9:00 AM to 9:59 AM | 62 (3.3%) | 0 (0.0%) |
| 10:00 AM to 10:59 AM | 125 (6.7%) | 14 (0.6%) |
| 11:00 AM to 11:59 AM | 0 (0.0%) | 0 (0.0%) |
| 12:00 PM to 3:59 PM | 28 (1.5%) | 105 (4.7%) |
| 4:00 PM to 11:59 PM | 126 (6.7%) | 85 (3.8%) |
| Total | 1,873 (100.0%) | 2,245 (100.0%) |
Housing Occupancy in Locust Grove
Occupancy by Ownership in Locust Grove
Of the total 2,950 dwellings in Locust Grove, owner-occupied units account for 2,339 (79.3%), while renter-occupied units make up 611 (20.7%).
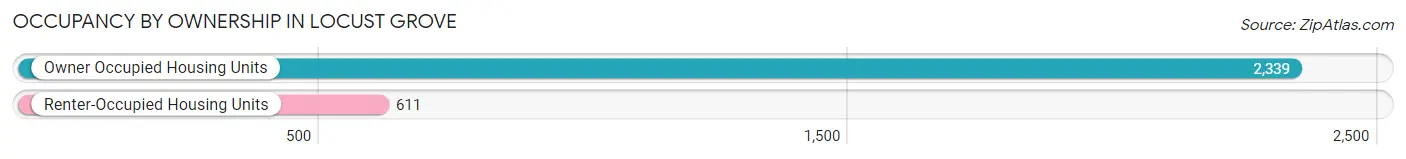
| Occupancy | # Housing Units | % Housing Units |
| Owner Occupied Housing Units | 2,339 | 79.3% |
| Renter-Occupied Housing Units | 611 | 20.7% |
| Total Occupied Housing Units | 2,950 | 100.0% |
Occupancy by Household Size in Locust Grove
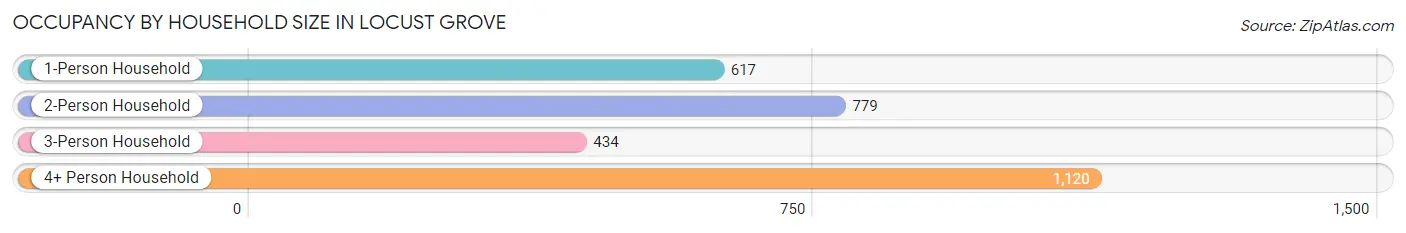
| Household Size | # Housing Units | % Housing Units |
| 1-Person Household | 617 | 20.9% |
| 2-Person Household | 779 | 26.4% |
| 3-Person Household | 434 | 14.7% |
| 4+ Person Household | 1,120 | 38.0% |
| Total Housing Units | 2,950 | 100.0% |
Occupancy by Ownership by Household Size in Locust Grove
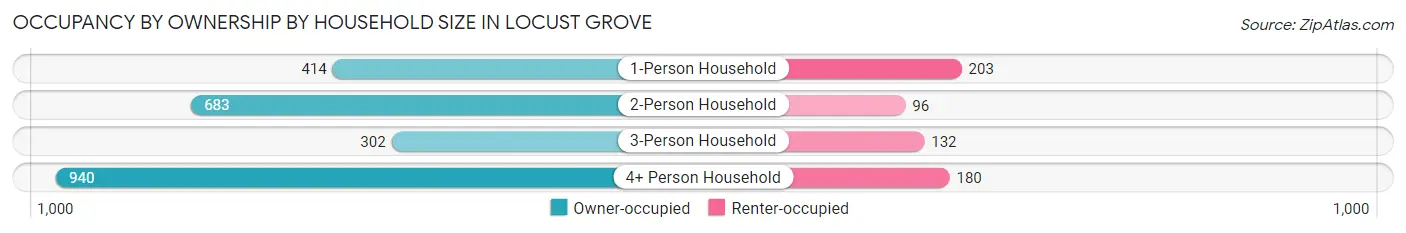
| Household Size | Owner-occupied | Renter-occupied |
| 1-Person Household | 414 (67.1%) | 203 (32.9%) |
| 2-Person Household | 683 (87.7%) | 96 (12.3%) |
| 3-Person Household | 302 (69.6%) | 132 (30.4%) |
| 4+ Person Household | 940 (83.9%) | 180 (16.1%) |
| Total Housing Units | 2,339 (79.3%) | 611 (20.7%) |
Occupancy by Educational Attainment in Locust Grove
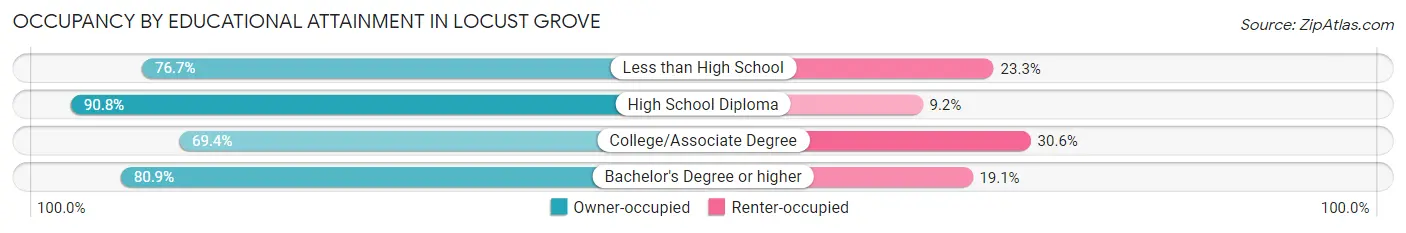
| Household Size | Owner-occupied | Renter-occupied |
| Less than High School | 191 (76.7%) | 58 (23.3%) |
| High School Diploma | 860 (90.8%) | 87 (9.2%) |
| College/Associate Degree | 788 (69.4%) | 348 (30.6%) |
| Bachelor's Degree or higher | 500 (80.9%) | 118 (19.1%) |
Occupancy by Age of Householder in Locust Grove
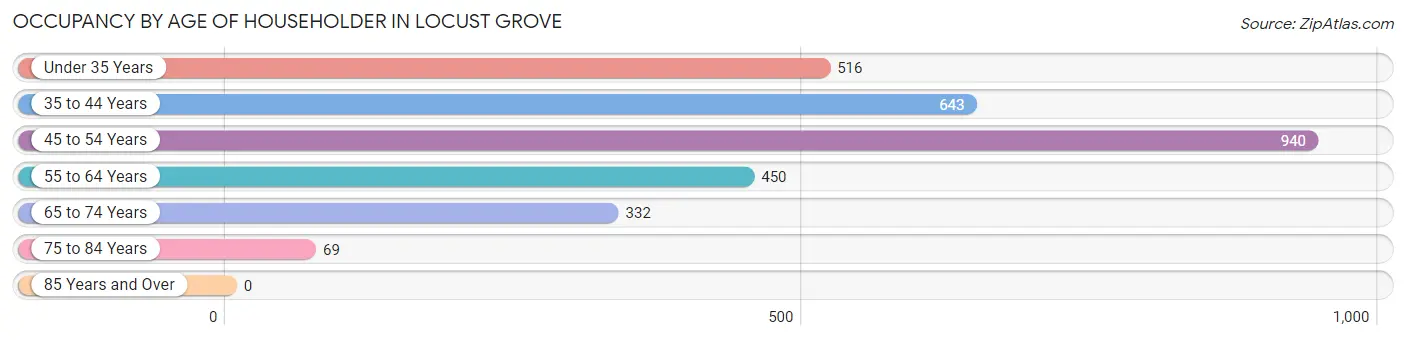
| Age Bracket | # Households | % Households |
| Under 35 Years | 516 | 17.5% |
| 35 to 44 Years | 643 | 21.8% |
| 45 to 54 Years | 940 | 31.9% |
| 55 to 64 Years | 450 | 15.2% |
| 65 to 74 Years | 332 | 11.3% |
| 75 to 84 Years | 69 | 2.3% |
| 85 Years and Over | 0 | 0.0% |
| Total | 2,950 | 100.0% |
Housing Finances in Locust Grove
Median Income by Occupancy in Locust Grove
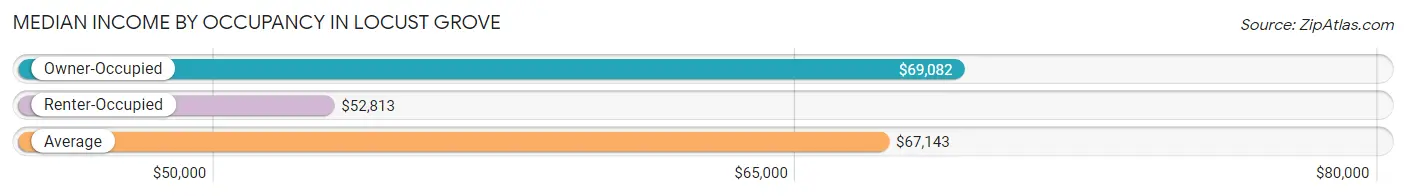
| Occupancy Type | # Households | Median Income |
| Owner-Occupied | 2,339 (79.3%) | $69,082 |
| Renter-Occupied | 611 (20.7%) | $52,813 |
| Average | 2,950 (100.0%) | $67,143 |
Occupancy by Householder Income Bracket in Locust Grove
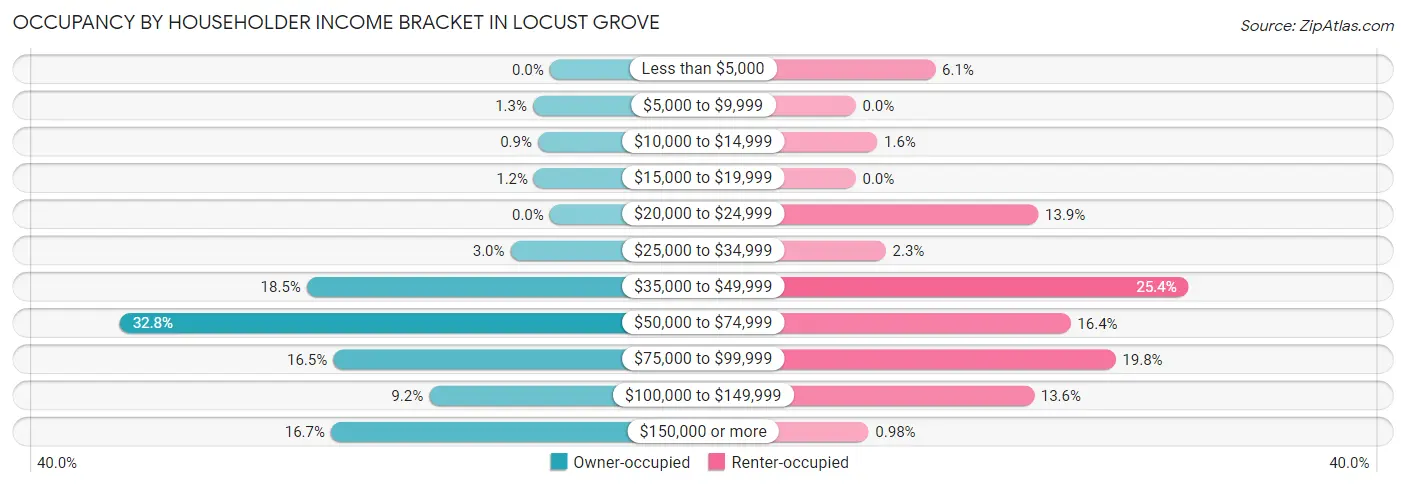
| Income Bracket | Owner-occupied | Renter-occupied |
| Less than $5,000 | 0 (0.0%) | 37 (6.1%) |
| $5,000 to $9,999 | 30 (1.3%) | 0 (0.0%) |
| $10,000 to $14,999 | 21 (0.9%) | 10 (1.6%) |
| $15,000 to $19,999 | 28 (1.2%) | 0 (0.0%) |
| $20,000 to $24,999 | 0 (0.0%) | 85 (13.9%) |
| $25,000 to $34,999 | 70 (3.0%) | 14 (2.3%) |
| $35,000 to $49,999 | 433 (18.5%) | 155 (25.4%) |
| $50,000 to $74,999 | 766 (32.8%) | 100 (16.4%) |
| $75,000 to $99,999 | 386 (16.5%) | 121 (19.8%) |
| $100,000 to $149,999 | 215 (9.2%) | 83 (13.6%) |
| $150,000 or more | 390 (16.7%) | 6 (1.0%) |
| Total | 2,339 (100.0%) | 611 (100.0%) |
Monthly Housing Cost Tiers in Locust Grove
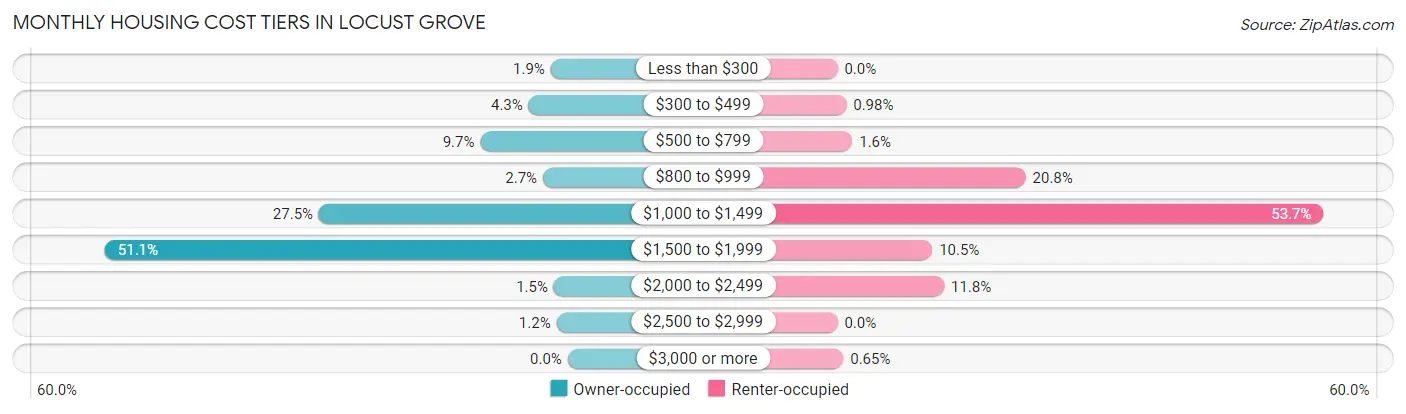
| Monthly Cost | Owner-occupied | Renter-occupied |
| Less than $300 | 44 (1.9%) | 0 (0.0%) |
| $300 to $499 | 101 (4.3%) | 6 (1.0%) |
| $500 to $799 | 226 (9.7%) | 10 (1.6%) |
| $800 to $999 | 64 (2.7%) | 127 (20.8%) |
| $1,000 to $1,499 | 643 (27.5%) | 328 (53.7%) |
| $1,500 to $1,999 | 1,196 (51.1%) | 64 (10.5%) |
| $2,000 to $2,499 | 36 (1.5%) | 72 (11.8%) |
| $2,500 to $2,999 | 29 (1.2%) | 0 (0.0%) |
| $3,000 or more | 0 (0.0%) | 4 (0.6%) |
| Total | 2,339 (100.0%) | 611 (100.0%) |
Physical Housing Characteristics in Locust Grove
Housing Structures in Locust Grove
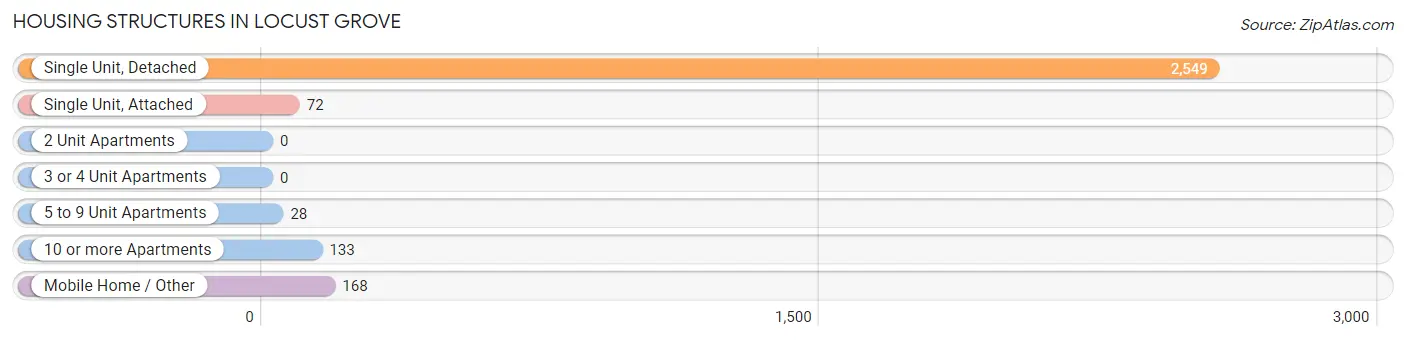
| Structure Type | # Housing Units | % Housing Units |
| Single Unit, Detached | 2,549 | 86.4% |
| Single Unit, Attached | 72 | 2.4% |
| 2 Unit Apartments | 0 | 0.0% |
| 3 or 4 Unit Apartments | 0 | 0.0% |
| 5 to 9 Unit Apartments | 28 | 0.9% |
| 10 or more Apartments | 133 | 4.5% |
| Mobile Home / Other | 168 | 5.7% |
| Total | 2,950 | 100.0% |
Housing Structures by Occupancy in Locust Grove
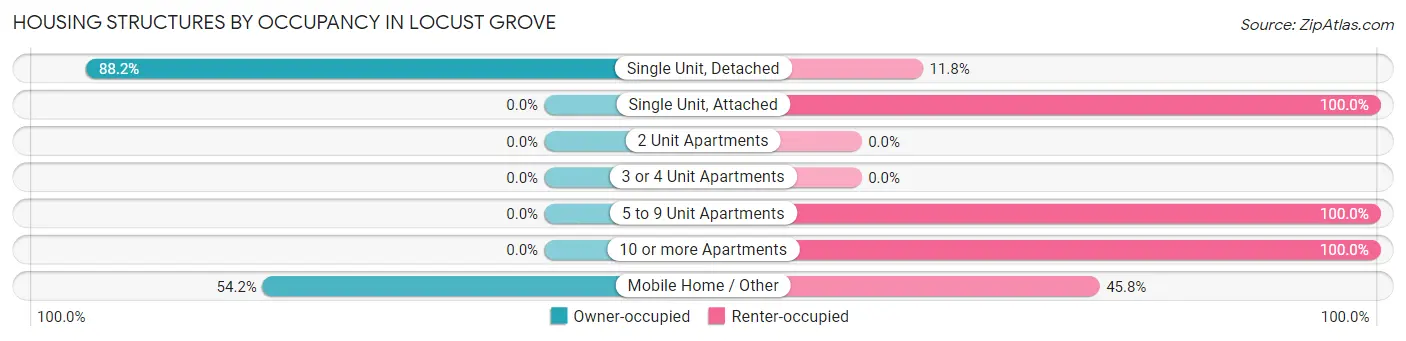
| Structure Type | Owner-occupied | Renter-occupied |
| Single Unit, Detached | 2,248 (88.2%) | 301 (11.8%) |
| Single Unit, Attached | 0 (0.0%) | 72 (100.0%) |
| 2 Unit Apartments | 0 (0.0%) | 0 (0.0%) |
| 3 or 4 Unit Apartments | 0 (0.0%) | 0 (0.0%) |
| 5 to 9 Unit Apartments | 0 (0.0%) | 28 (100.0%) |
| 10 or more Apartments | 0 (0.0%) | 133 (100.0%) |
| Mobile Home / Other | 91 (54.2%) | 77 (45.8%) |
| Total | 2,339 (79.3%) | 611 (20.7%) |
Housing Structures by Number of Rooms in Locust Grove
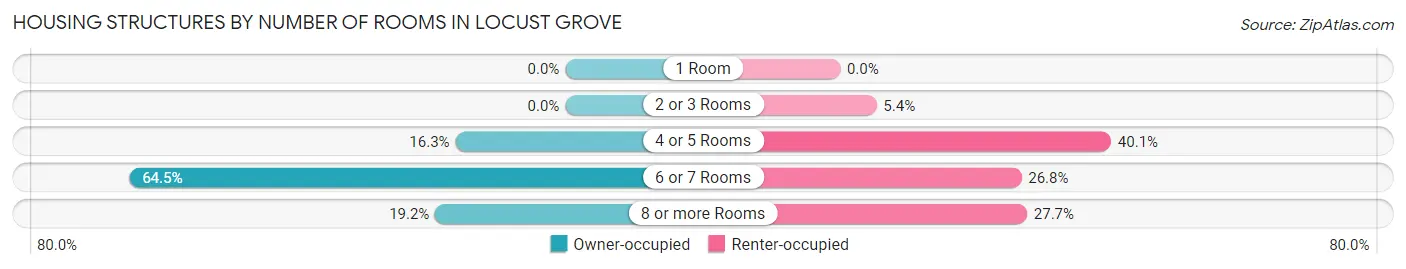
| Number of Rooms | Owner-occupied | Renter-occupied |
| 1 Room | 0 (0.0%) | 0 (0.0%) |
| 2 or 3 Rooms | 0 (0.0%) | 33 (5.4%) |
| 4 or 5 Rooms | 380 (16.3%) | 245 (40.1%) |
| 6 or 7 Rooms | 1,509 (64.5%) | 164 (26.8%) |
| 8 or more Rooms | 450 (19.2%) | 169 (27.7%) |
| Total | 2,339 (100.0%) | 611 (100.0%) |
Housing Structure by Heating Type in Locust Grove
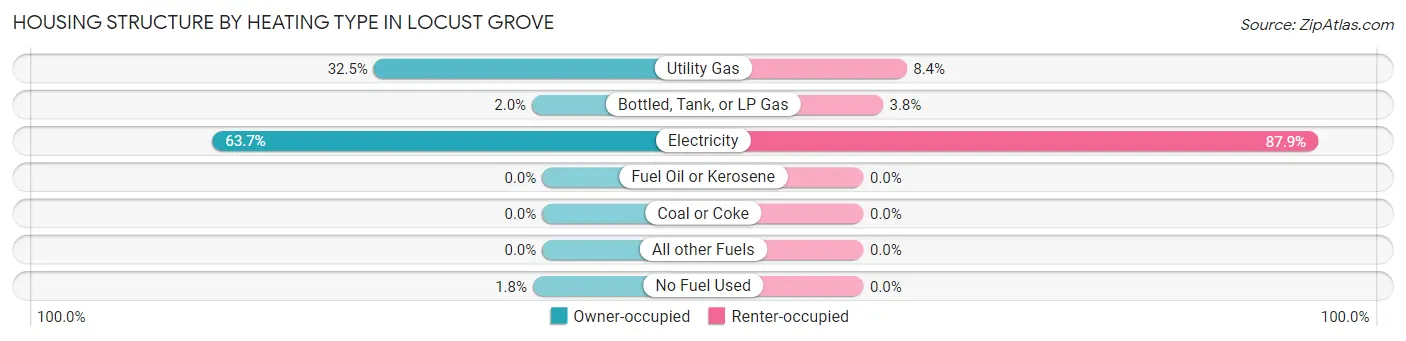
| Heating Type | Owner-occupied | Renter-occupied |
| Utility Gas | 761 (32.5%) | 51 (8.4%) |
| Bottled, Tank, or LP Gas | 46 (2.0%) | 23 (3.8%) |
| Electricity | 1,490 (63.7%) | 537 (87.9%) |
| Fuel Oil or Kerosene | 0 (0.0%) | 0 (0.0%) |
| Coal or Coke | 0 (0.0%) | 0 (0.0%) |
| All other Fuels | 0 (0.0%) | 0 (0.0%) |
| No Fuel Used | 42 (1.8%) | 0 (0.0%) |
| Total | 2,339 (100.0%) | 611 (100.0%) |
Household Vehicle Usage in Locust Grove
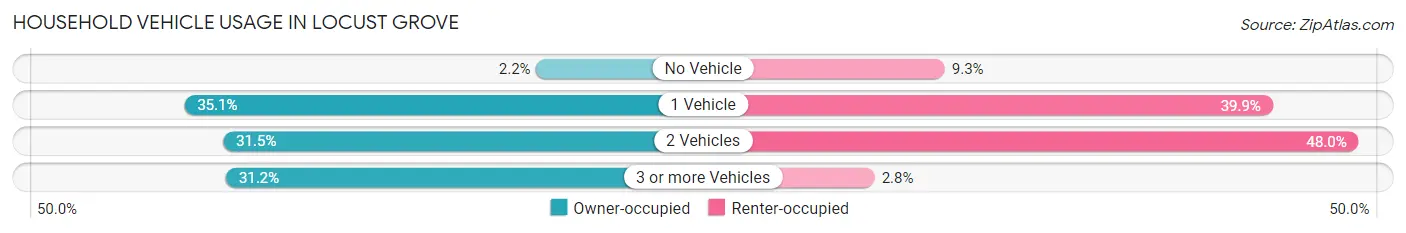
| Vehicles per Household | Owner-occupied | Renter-occupied |
| No Vehicle | 52 (2.2%) | 57 (9.3%) |
| 1 Vehicle | 821 (35.1%) | 244 (39.9%) |
| 2 Vehicles | 736 (31.5%) | 293 (47.9%) |
| 3 or more Vehicles | 730 (31.2%) | 17 (2.8%) |
| Total | 2,339 (100.0%) | 611 (100.0%) |
Real Estate & Mortgages in Locust Grove
Real Estate and Mortgage Overview in Locust Grove
| Characteristic | Without Mortgage | With Mortgage |
| Housing Units | 297 | 2,042 |
| Median Property Value | $226,300 | $191,500 |
| Median Household Income | $73,472 | $324 |
| Monthly Housing Costs | $505 | $0 |
| Real Estate Taxes | $1,804 | $168 |
Property Value by Mortgage Status in Locust Grove
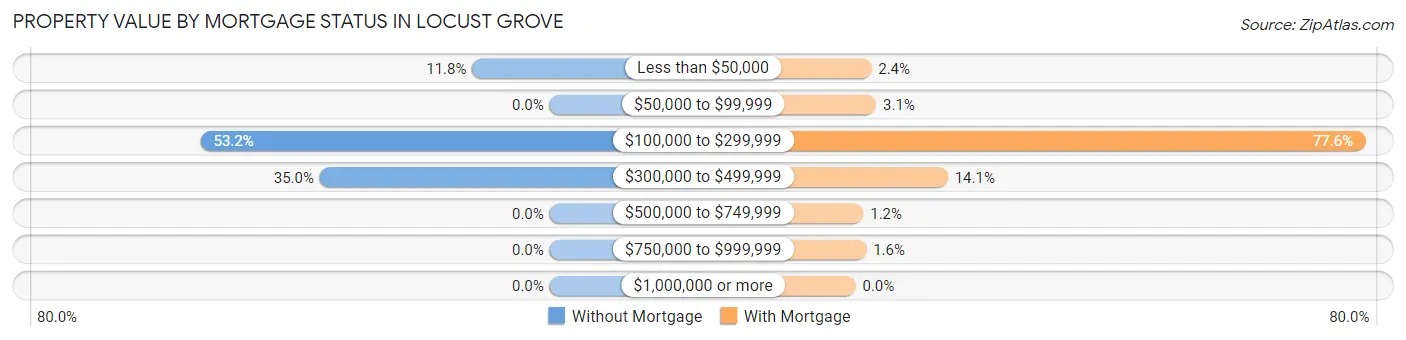
| Property Value | Without Mortgage | With Mortgage |
| Less than $50,000 | 35 (11.8%) | 49 (2.4%) |
| $50,000 to $99,999 | 0 (0.0%) | 64 (3.1%) |
| $100,000 to $299,999 | 158 (53.2%) | 1,585 (77.6%) |
| $300,000 to $499,999 | 104 (35.0%) | 287 (14.1%) |
| $500,000 to $749,999 | 0 (0.0%) | 24 (1.2%) |
| $750,000 to $999,999 | 0 (0.0%) | 33 (1.6%) |
| $1,000,000 or more | 0 (0.0%) | 0 (0.0%) |
| Total | 297 (100.0%) | 2,042 (100.0%) |
Household Income by Mortgage Status in Locust Grove
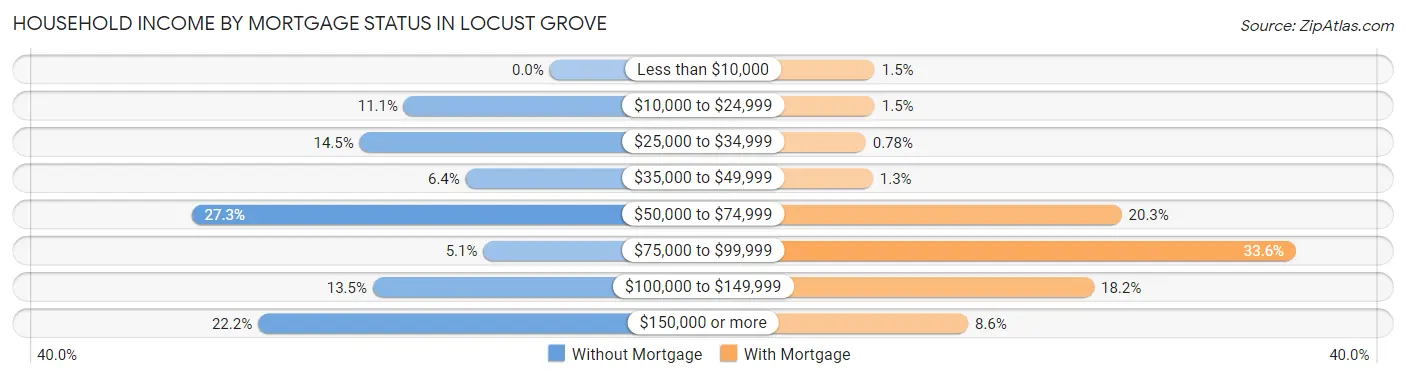
| Household Income | Without Mortgage | With Mortgage |
| Less than $10,000 | 0 (0.0%) | 30 (1.5%) |
| $10,000 to $24,999 | 33 (11.1%) | 30 (1.5%) |
| $25,000 to $34,999 | 43 (14.5%) | 16 (0.8%) |
| $35,000 to $49,999 | 19 (6.4%) | 27 (1.3%) |
| $50,000 to $74,999 | 81 (27.3%) | 414 (20.3%) |
| $75,000 to $99,999 | 15 (5.1%) | 685 (33.6%) |
| $100,000 to $149,999 | 40 (13.5%) | 371 (18.2%) |
| $150,000 or more | 66 (22.2%) | 175 (8.6%) |
| Total | 297 (100.0%) | 2,042 (100.0%) |
Property Value to Household Income Ratio in Locust Grove
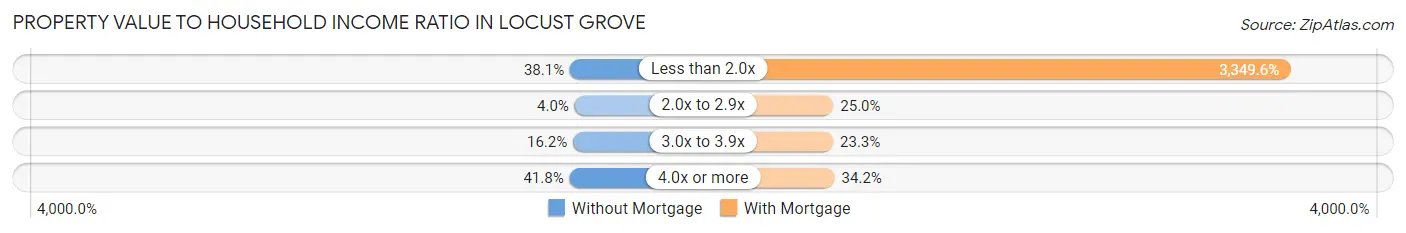
| Value-to-Income Ratio | Without Mortgage | With Mortgage |
| Less than 2.0x | 113 (38.1%) | 68,398 (3,349.6%) |
| 2.0x to 2.9x | 12 (4.0%) | 511 (25.0%) |
| 3.0x to 3.9x | 48 (16.2%) | 476 (23.3%) |
| 4.0x or more | 124 (41.7%) | 699 (34.2%) |
| Total | 297 (100.0%) | 2,042 (100.0%) |
Real Estate Taxes by Mortgage Status in Locust Grove
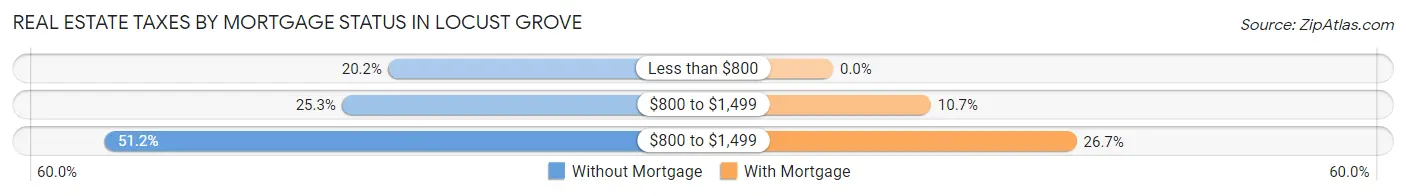
| Property Taxes | Without Mortgage | With Mortgage |
| Less than $800 | 60 (20.2%) | 0 (0.0%) |
| $800 to $1,499 | 75 (25.3%) | 219 (10.7%) |
| $800 to $1,499 | 152 (51.2%) | 545 (26.7%) |
| Total | 297 (100.0%) | 2,042 (100.0%) |
Health & Disability in Locust Grove
Health Insurance Coverage by Age in Locust Grove
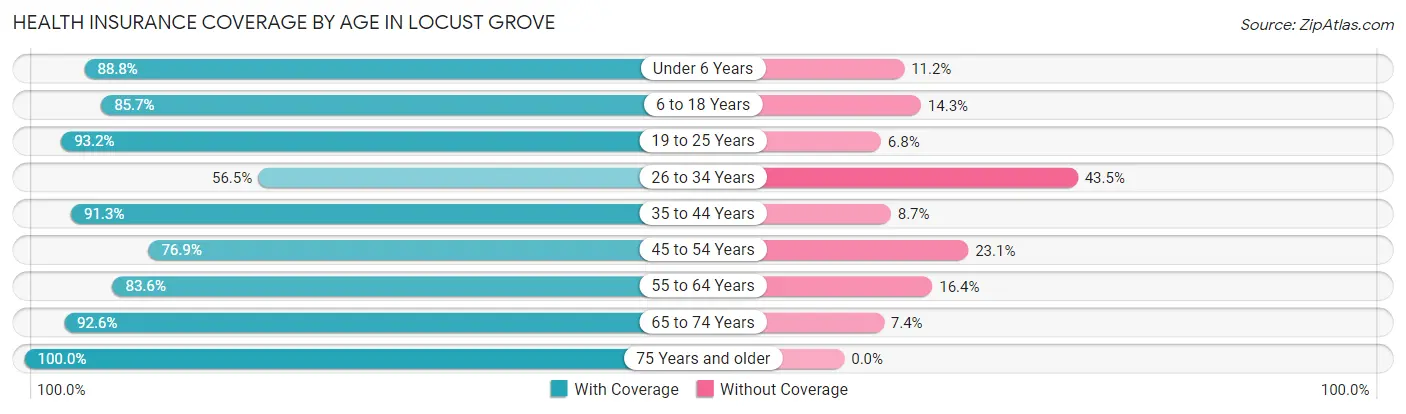
| Age Bracket | With Coverage | Without Coverage |
| Under 6 Years | 493 (88.8%) | 62 (11.2%) |
| 6 to 18 Years | 1,854 (85.7%) | 309 (14.3%) |
| 19 to 25 Years | 682 (93.2%) | 50 (6.8%) |
| 26 to 34 Years | 772 (56.5%) | 595 (43.5%) |
| 35 to 44 Years | 1,506 (91.3%) | 143 (8.7%) |
| 45 to 54 Years | 1,218 (76.9%) | 366 (23.1%) |
| 55 to 64 Years | 545 (83.6%) | 107 (16.4%) |
| 65 to 74 Years | 503 (92.6%) | 40 (7.4%) |
| 75 Years and older | 122 (100.0%) | 0 (0.0%) |
| Total | 7,695 (82.2%) | 1,672 (17.8%) |
Health Insurance Coverage by Citizenship Status in Locust Grove
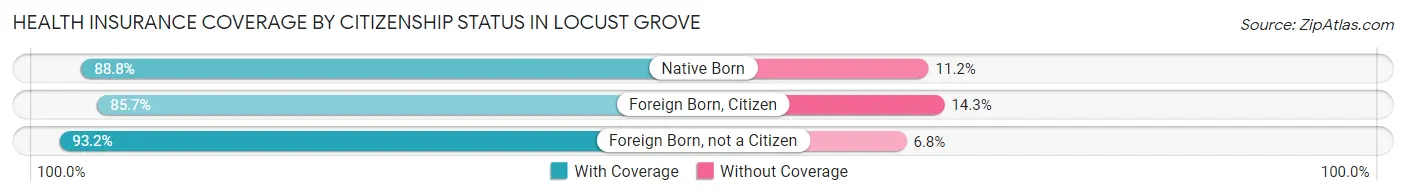
| Citizenship Status | With Coverage | Without Coverage |
| Native Born | 493 (88.8%) | 62 (11.2%) |
| Foreign Born, Citizen | 1,854 (85.7%) | 309 (14.3%) |
| Foreign Born, not a Citizen | 682 (93.2%) | 50 (6.8%) |
Health Insurance Coverage by Household Income in Locust Grove
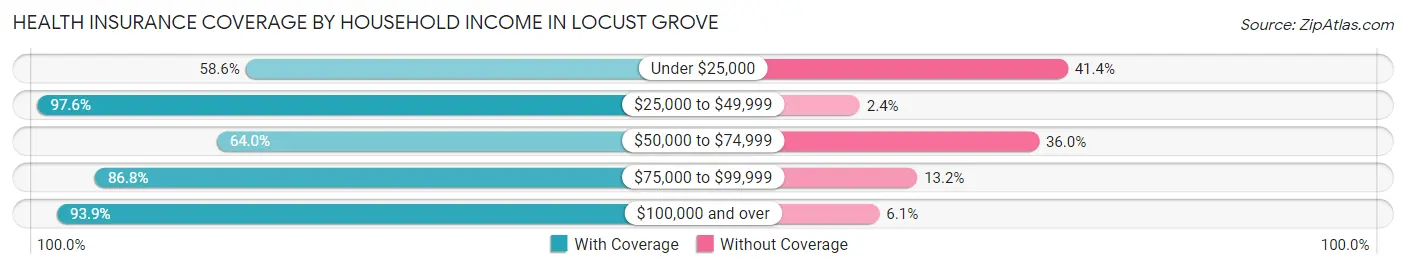
| Household Income | With Coverage | Without Coverage |
| Under $25,000 | 286 (58.6%) | 202 (41.4%) |
| $25,000 to $49,999 | 1,797 (97.6%) | 45 (2.4%) |
| $50,000 to $74,999 | 1,930 (64.0%) | 1,086 (36.0%) |
| $75,000 to $99,999 | 1,145 (86.8%) | 174 (13.2%) |
| $100,000 and over | 2,537 (93.9%) | 165 (6.1%) |
Public vs Private Health Insurance Coverage by Age in Locust Grove
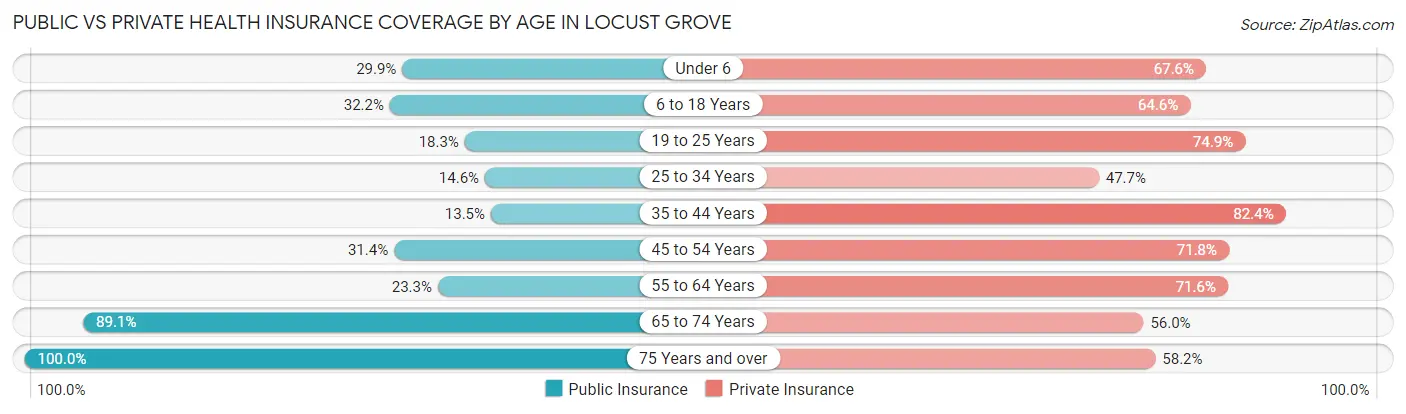
| Age Bracket | Public Insurance | Private Insurance |
| Under 6 | 166 (29.9%) | 375 (67.6%) |
| 6 to 18 Years | 697 (32.2%) | 1,398 (64.6%) |
| 19 to 25 Years | 134 (18.3%) | 548 (74.9%) |
| 25 to 34 Years | 199 (14.6%) | 652 (47.7%) |
| 35 to 44 Years | 222 (13.5%) | 1,358 (82.4%) |
| 45 to 54 Years | 498 (31.4%) | 1,138 (71.8%) |
| 55 to 64 Years | 152 (23.3%) | 467 (71.6%) |
| 65 to 74 Years | 484 (89.1%) | 304 (56.0%) |
| 75 Years and over | 122 (100.0%) | 71 (58.2%) |
| Total | 2,674 (28.5%) | 6,311 (67.4%) |
Disability Status by Sex by Age in Locust Grove
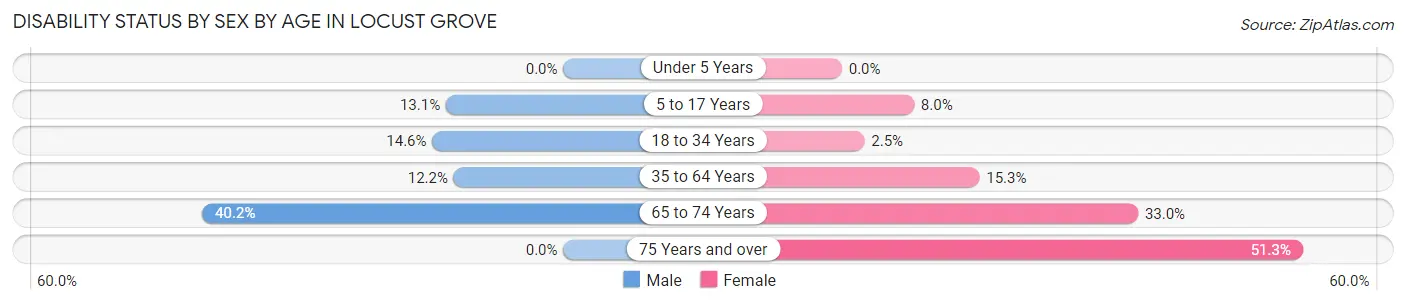
| Age Bracket | Male | Female |
| Under 5 Years | 0 (0.0%) | 0 (0.0%) |
| 5 to 17 Years | 163 (13.1%) | 74 (8.0%) |
| 18 to 34 Years | 150 (14.6%) | 30 (2.5%) |
| 35 to 64 Years | 223 (12.2%) | 315 (15.3%) |
| 65 to 74 Years | 66 (40.2%) | 125 (33.0%) |
| 75 Years and over | 0 (0.0%) | 58 (51.3%) |
Disability Class by Sex by Age in Locust Grove
Disability Class: Hearing Difficulty
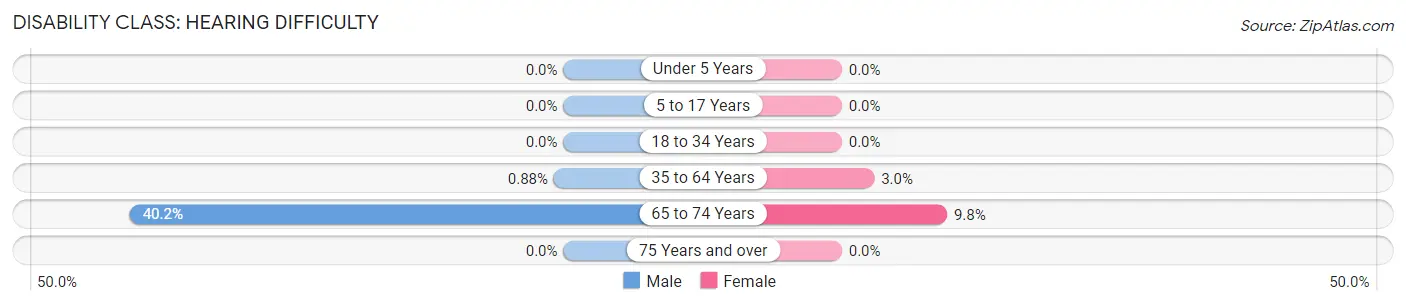
| Age Bracket | Male | Female |
| Under 5 Years | 0 (0.0%) | 0 (0.0%) |
| 5 to 17 Years | 0 (0.0%) | 0 (0.0%) |
| 18 to 34 Years | 0 (0.0%) | 0 (0.0%) |
| 35 to 64 Years | 16 (0.9%) | 62 (3.0%) |
| 65 to 74 Years | 66 (40.2%) | 37 (9.8%) |
| 75 Years and over | 0 (0.0%) | 0 (0.0%) |
Disability Class: Vision Difficulty
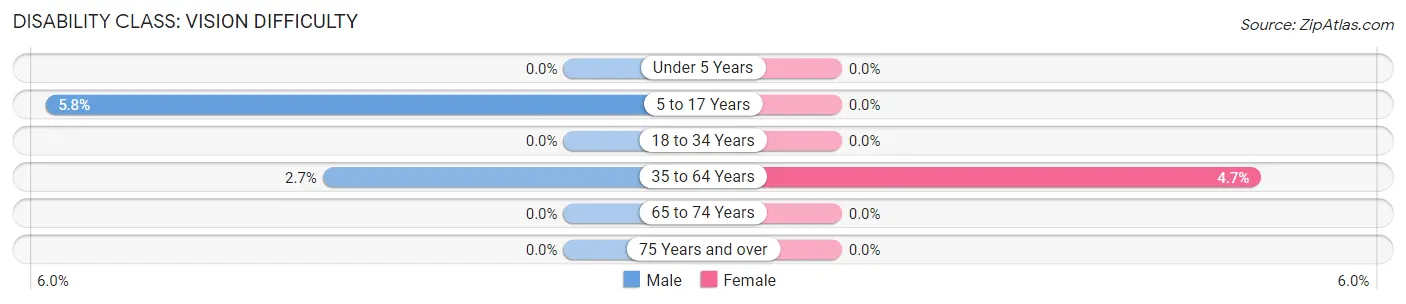
| Age Bracket | Male | Female |
| Under 5 Years | 0 (0.0%) | 0 (0.0%) |
| 5 to 17 Years | 72 (5.8%) | 0 (0.0%) |
| 18 to 34 Years | 0 (0.0%) | 0 (0.0%) |
| 35 to 64 Years | 49 (2.7%) | 96 (4.7%) |
| 65 to 74 Years | 0 (0.0%) | 0 (0.0%) |
| 75 Years and over | 0 (0.0%) | 0 (0.0%) |
Disability Class: Cognitive Difficulty
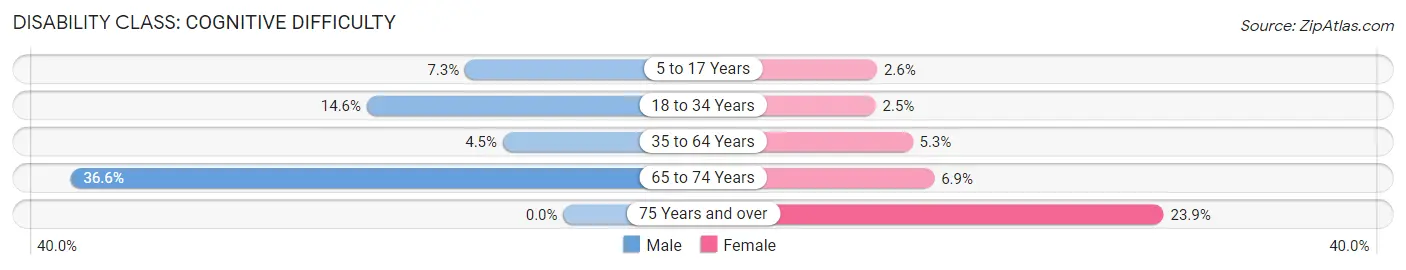
| Age Bracket | Male | Female |
| 5 to 17 Years | 91 (7.3%) | 24 (2.6%) |
| 18 to 34 Years | 150 (14.6%) | 30 (2.5%) |
| 35 to 64 Years | 82 (4.5%) | 108 (5.2%) |
| 65 to 74 Years | 60 (36.6%) | 26 (6.9%) |
| 75 Years and over | 0 (0.0%) | 27 (23.9%) |
Disability Class: Ambulatory Difficulty
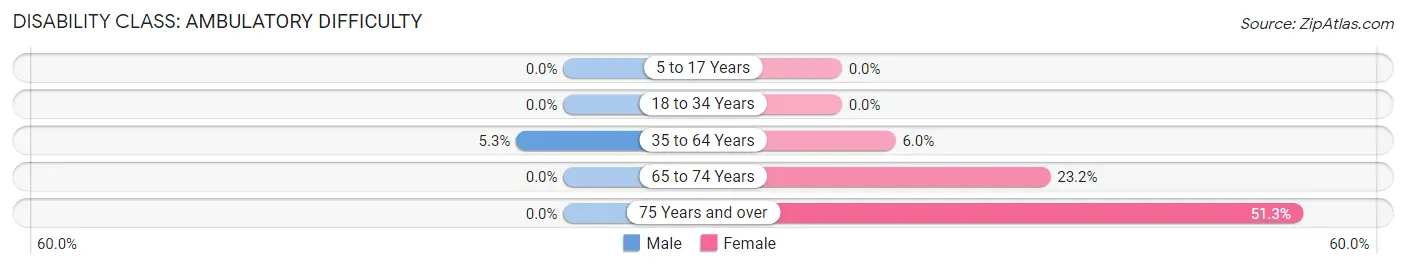
| Age Bracket | Male | Female |
| 5 to 17 Years | 0 (0.0%) | 0 (0.0%) |
| 18 to 34 Years | 0 (0.0%) | 0 (0.0%) |
| 35 to 64 Years | 96 (5.2%) | 123 (6.0%) |
| 65 to 74 Years | 0 (0.0%) | 88 (23.2%) |
| 75 Years and over | 0 (0.0%) | 58 (51.3%) |
Disability Class: Self-Care Difficulty
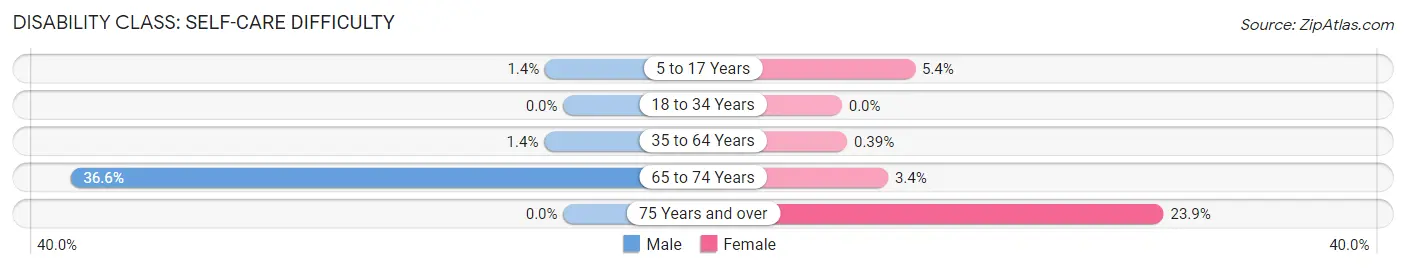
| Age Bracket | Male | Female |
| 5 to 17 Years | 17 (1.4%) | 50 (5.4%) |
| 18 to 34 Years | 0 (0.0%) | 0 (0.0%) |
| 35 to 64 Years | 26 (1.4%) | 8 (0.4%) |
| 65 to 74 Years | 60 (36.6%) | 13 (3.4%) |
| 75 Years and over | 0 (0.0%) | 27 (23.9%) |
Technology Access in Locust Grove
Computing Device Access in Locust Grove
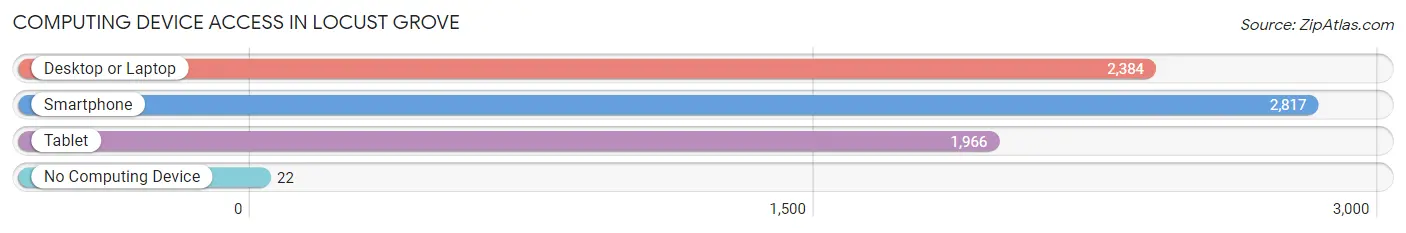
| Device Type | # Households | % Households |
| Desktop or Laptop | 2,384 | 80.8% |
| Smartphone | 2,817 | 95.5% |
| Tablet | 1,966 | 66.6% |
| No Computing Device | 22 | 0.7% |
| Total | 2,950 | 100.0% |
Internet Access in Locust Grove
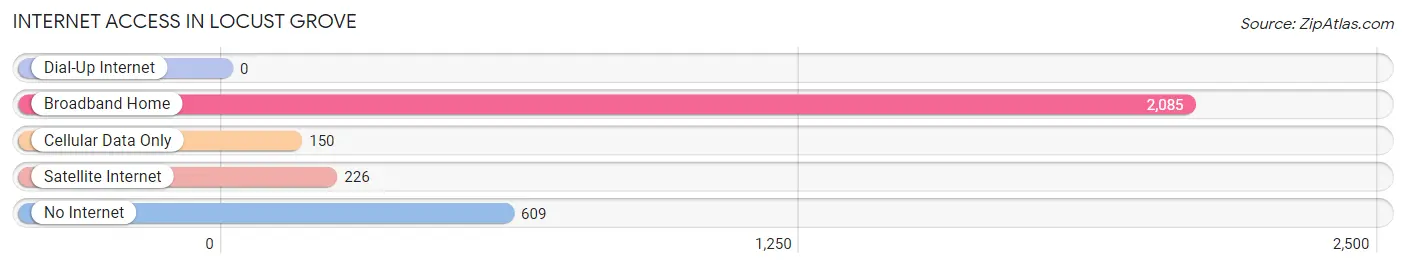
| Internet Type | # Households | % Households |
| Dial-Up Internet | 0 | 0.0% |
| Broadband Home | 2,085 | 70.7% |
| Cellular Data Only | 150 | 5.1% |
| Satellite Internet | 226 | 7.7% |
| No Internet | 609 | 20.6% |
| Total | 2,950 | 100.0% |
Locust Grove Summary
History
Locust Grove is a city located in Henry County, Georgia, United States. It is part of the Atlanta metropolitan area. The city was incorporated in 1874 and is named after the grove of locust trees that once grew in the area. The city is located along Interstate 75, which runs through the center of the city.
The area that is now Locust Grove was first settled in the early 1800s by settlers from North Carolina. The first settler was William Few, who arrived in 1820. He was followed by other settlers, including the families of John and William Few, who established a trading post in the area.
The city was officially incorporated in 1874 and was named after the grove of locust trees that grew in the area. The city was originally a farming community, but it began to grow in the late 19th century when the railroad was built through the area. The railroad brought new businesses and industries to the city, and it also helped to connect the city to the rest of the state.
In the early 20th century, the city continued to grow and develop. The city was home to several businesses, including a cotton mill, a sawmill, and a brickyard. The city also had a number of churches, schools, and other civic organizations.
In the late 20th century, the city began to experience rapid growth due to its proximity to Atlanta. The city is now home to a number of businesses, including a number of restaurants, retail stores, and other businesses. The city is also home to a number of parks and recreational facilities.
Geography
Locust Grove is located in Henry County, Georgia, United States. It is part of the Atlanta metropolitan area. The city is located along Interstate 75, which runs through the center of the city. The city is located in the Piedmont region of Georgia, and it is situated on the banks of the Ocmulgee River.
The city has a total area of 4.2 square miles, all of which is land. The city is located at an elevation of 845 feet above sea level. The climate in the city is humid subtropical, with hot, humid summers and mild winters.
Economy
The economy of Locust Grove is largely based on the service industry. The city is home to a number of restaurants, retail stores, and other businesses. The city is also home to a number of industrial and manufacturing businesses.
The city is also home to a number of parks and recreational facilities. The city is home to the Locust Grove Nature Center, which is a popular destination for visitors. The city is also home to a number of golf courses, including the Locust Grove Country Club.
Demographics
As of the 2010 census, the population of Locust Grove was 5,402. The racial makeup of the city was 79.3% White, 15.3% African American, 0.4% Native American, 0.9% Asian, 0.1% Pacific Islander, 1.7% from other races, and 2.3% from two or more races. Hispanic or Latino of any race were 4.2% of the population.
The median household income in the city was $45,938, and the median family income was $54,844. The per capita income in the city was $20,945. About 11.3% of the population was below the poverty line.
Common Questions
What is Per Capita Income in Locust Grove?
Per Capita income in Locust Grove is $27,454.
What is the Median Family Income in Locust Grove?
Median Family Income in Locust Grove is $73,430.
What is the Median Household income in Locust Grove?
Median Household Income in Locust Grove is $67,143.
What is Income or Wage Gap in Locust Grove?
Income or Wage Gap in Locust Grove is 52.2%.
Women in Locust Grove earn 47.8 cents for every dollar earned by a man.
What is Inequality or Gini Index in Locust Grove?
Inequality or Gini Index in Locust Grove is 0.37.
What is the Total Population of Locust Grove?
Total Population of Locust Grove is 9,367.
What is the Total Male Population of Locust Grove?
Total Male Population of Locust Grove is 4,479.
What is the Total Female Population of Locust Grove?
Total Female Population of Locust Grove is 4,888.
What is the Ratio of Males per 100 Females in Locust Grove?
There are 91.63 Males per 100 Females in Locust Grove.
What is the Ratio of Females per 100 Males in Locust Grove?
There are 109.13 Females per 100 Males in Locust Grove.
What is the Median Population Age in Locust Grove?
Median Population Age in Locust Grove is 33.1 Years.
What is the Average Family Size in Locust Grove
Average Family Size in Locust Grove is 3.4 People.
What is the Average Household Size in Locust Grove
Average Household Size in Locust Grove is 3.2 People.
How Large is the Labor Force in Locust Grove?
There are 4,916 People in the Labor Forcein in Locust Grove.
What is the Percentage of People in the Labor Force in Locust Grove?
68.5% of People are in the Labor Force in Locust Grove.
What is the Unemployment Rate in Locust Grove?
Unemployment Rate in Locust Grove is 8.5%.