Madison, GA Map & Demographics
Madison Map
Madison Overview
$42,167
PER CAPITA INCOME
$92,862
AVG FAMILY INCOME
$73,965
AVG HOUSEHOLD INCOME
0.48
INEQUALITY / GINI INDEX
4,574
TOTAL POPULATION
1,995
MALE POPULATION
2,579
FEMALE POPULATION
77.36
MALES / 100 FEMALES
129.27
FEMALES / 100 MALES
39.5
MEDIAN AGE
2.6
AVG FAMILY SIZE
2.1
AVG HOUSEHOLD SIZE
2,241
LABOR FORCE [ PEOPLE ]
62.0%
PERCENT IN LABOR FORCE
0.8%
UNEMPLOYMENT RATE
Madison Zip Codes
Madison Area Codes
Income in Madison
Income Overview in Madison
Per Capita Income in Madison is $42,167, while median incomes of families and households are $92,862 and $73,965 respectively.
| Characteristic | Number | Measure |
| Per Capita Income | 4,574 | $42,167 |
| Median Family Income | 1,382 | $92,862 |
| Mean Family Income | 1,382 | $113,947 |
| Median Household Income | 2,094 | $73,965 |
| Mean Household Income | 2,094 | $95,431 |
| Income Deficit | 1,382 | $0 |
| Wage / Income Gap (%) | 4,574 | 0.00% |
| Wage / Income Gap ($) | 4,574 | 100.00¢ per $1 |
| Gini / Inequality Index | 4,574 | 0.48 |
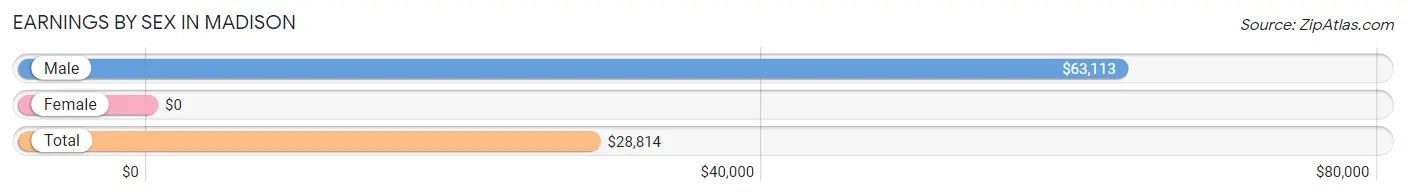
Earnings by Sex in Madison
| Sex | Number | Average Earnings |
| Male | 929 (40.2%) | $63,113 |
| Female | 1,384 (59.8%) | $0 |
| Total | 2,313 (100.0%) | $28,814 |
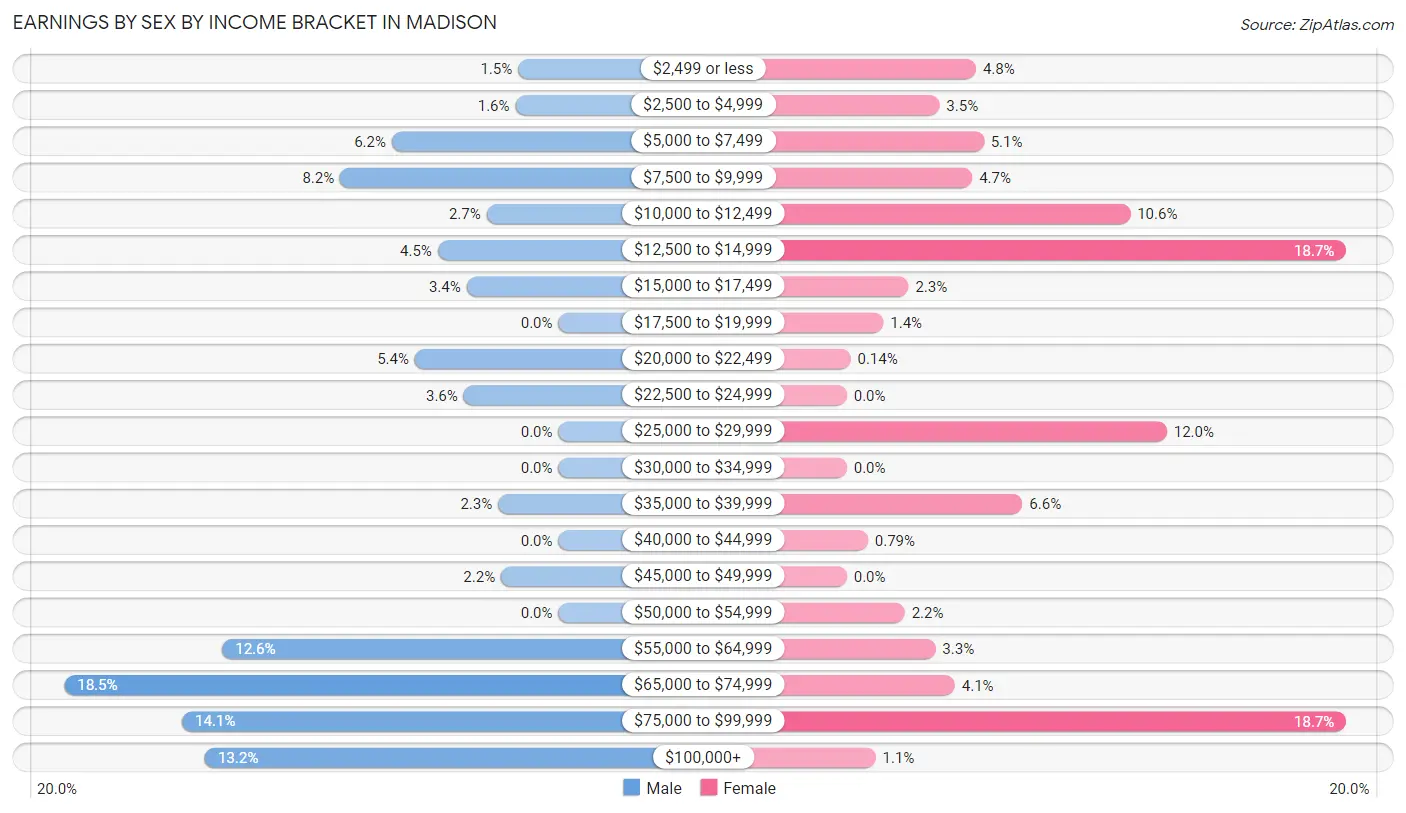
Earnings by Sex by Income Bracket in Madison
The most common earnings brackets in Madison are $65,000 to $74,999 for men (172 | 18.5%) and $12,500 to $14,999 for women (259 | 18.7%).
| Income | Male | Female |
| $2,499 or less | 14 (1.5%) | 67 (4.8%) |
| $2,500 to $4,999 | 15 (1.6%) | 48 (3.5%) |
| $5,000 to $7,499 | 58 (6.2%) | 71 (5.1%) |
| $7,500 to $9,999 | 76 (8.2%) | 65 (4.7%) |
| $10,000 to $12,499 | 25 (2.7%) | 147 (10.6%) |
| $12,500 to $14,999 | 42 (4.5%) | 259 (18.7%) |
| $15,000 to $17,499 | 32 (3.4%) | 32 (2.3%) |
| $17,500 to $19,999 | 0 (0.0%) | 19 (1.4%) |
| $20,000 to $22,499 | 50 (5.4%) | 2 (0.1%) |
| $22,500 to $24,999 | 33 (3.5%) | 0 (0.0%) |
| $25,000 to $29,999 | 0 (0.0%) | 166 (12.0%) |
| $30,000 to $34,999 | 0 (0.0%) | 0 (0.0%) |
| $35,000 to $39,999 | 21 (2.3%) | 91 (6.6%) |
| $40,000 to $44,999 | 0 (0.0%) | 11 (0.8%) |
| $45,000 to $49,999 | 20 (2.1%) | 0 (0.0%) |
| $50,000 to $54,999 | 0 (0.0%) | 30 (2.2%) |
| $55,000 to $64,999 | 117 (12.6%) | 46 (3.3%) |
| $65,000 to $74,999 | 172 (18.5%) | 56 (4.1%) |
| $75,000 to $99,999 | 131 (14.1%) | 259 (18.7%) |
| $100,000+ | 123 (13.2%) | 15 (1.1%) |
| Total | 929 (100.0%) | 1,384 (100.0%) |
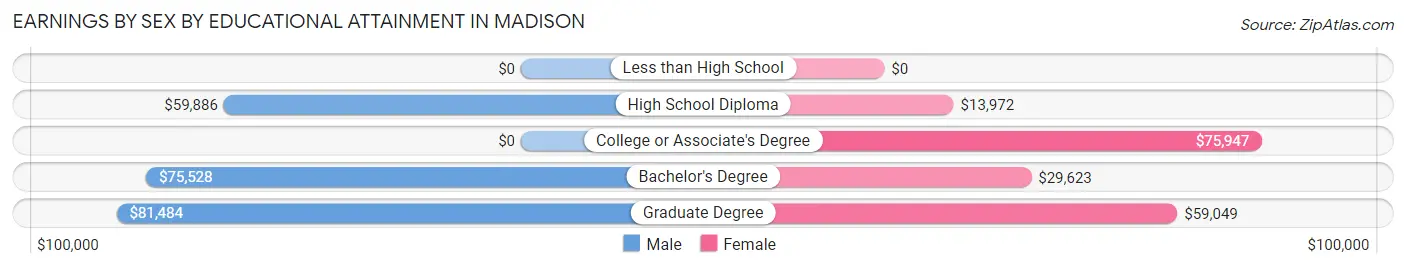
Earnings by Sex by Educational Attainment in Madison
Average earnings in Madison are $63,113 for men and $28,051 for women, a difference of 55.5%. Men with an educational attainment of graduate degree enjoy the highest average annual earnings of $81,484, while those with high school diploma education earn the least with $59,886. Women with an educational attainment of college or associate's degree earn the most with the average annual earnings of $75,947, while those with high school diploma education have the smallest earnings of $13,972.
| Educational Attainment | Male Income | Female Income |
| Less than High School | - | - |
| High School Diploma | $59,886 | $13,972 |
| College or Associate's Degree | - | - |
| Bachelor's Degree | $75,528 | $29,623 |
| Graduate Degree | $81,484 | $59,049 |
| Total | $63,113 | $28,051 |
Family Income in Madison
Family Income Brackets in Madison
According to the Madison family income data, there are 388 families falling into the $75,000 to $99,999 income range, which is the most common income bracket and makes up 28.1% of all families.
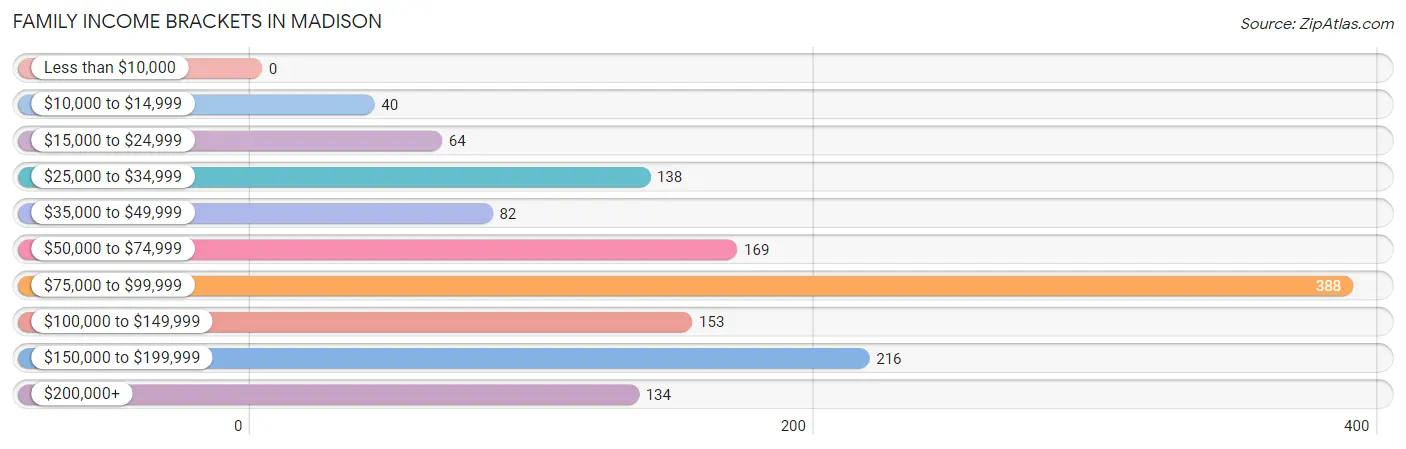
| Income Bracket | # Families | % Families |
| Less than $10,000 | 0 | 0.0% |
| $10,000 to $14,999 | 40 | 2.9% |
| $15,000 to $24,999 | 64 | 4.6% |
| $25,000 to $34,999 | 138 | 10.0% |
| $35,000 to $49,999 | 82 | 5.9% |
| $50,000 to $74,999 | 169 | 12.2% |
| $75,000 to $99,999 | 388 | 28.1% |
| $100,000 to $149,999 | 153 | 11.1% |
| $150,000 to $199,999 | 216 | 15.6% |
| $200,000+ | 134 | 9.7% |
Family Income by Famaliy Size in Madison
4-person families (182 | 13.2%) account for the highest median family income in Madison with $163,207 per family, while 4-person families (182 | 13.2%) have the highest median income of $40,802 per family member.
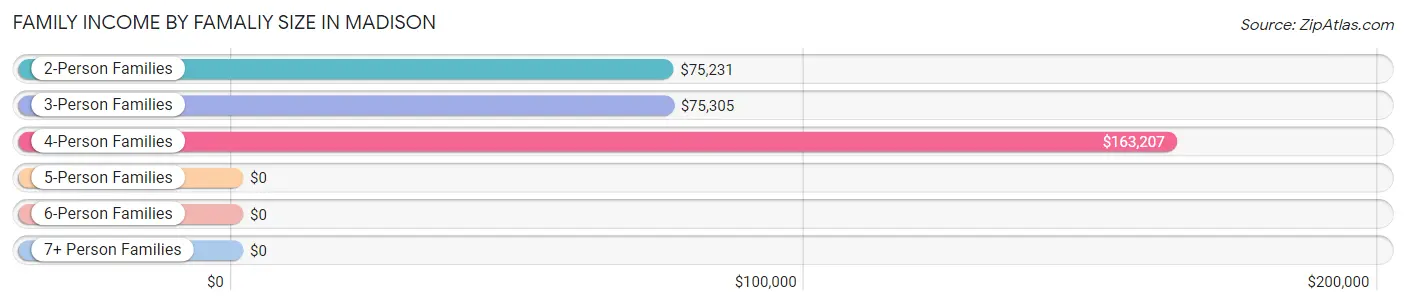
| Income Bracket | # Families | Median Income |
| 2-Person Families | 847 (61.3%) | $75,231 |
| 3-Person Families | 132 (9.6%) | $75,305 |
| 4-Person Families | 182 (13.2%) | $163,207 |
| 5-Person Families | 0 (0.0%) | $0 |
| 6-Person Families | 221 (16.0%) | $0 |
| 7+ Person Families | 0 (0.0%) | $0 |
| Total | 1,382 (100.0%) | $92,862 |
Family Income by Number of Earners in Madison
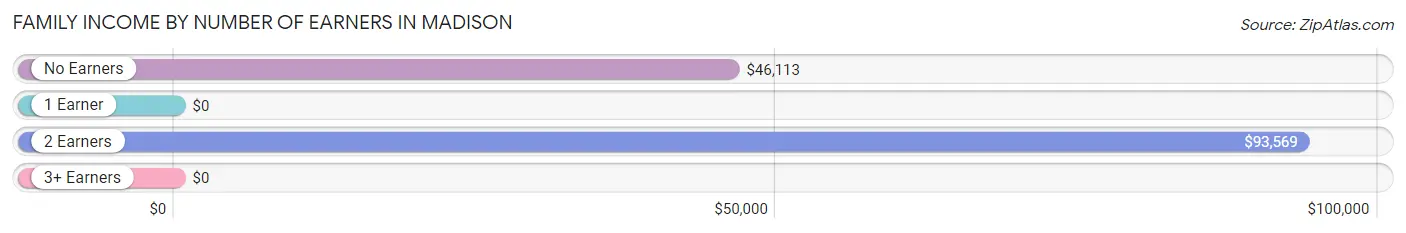
| Number of Earners | # Families | Median Income |
| No Earners | 153 (11.1%) | $46,113 |
| 1 Earner | 592 (42.8%) | $0 |
| 2 Earners | 595 (43.0%) | $93,569 |
| 3+ Earners | 42 (3.0%) | $0 |
| Total | 1,382 (100.0%) | $92,862 |
Household Income in Madison
Household Income Brackets in Madison
With 469 households falling in the category, the $75,000 to $99,999 income range is the most frequent in Madison, accounting for 22.4% of all households. In contrast, only 25 households (1.2%) fall into the less than $10,000 income bracket, making it the least populous group.
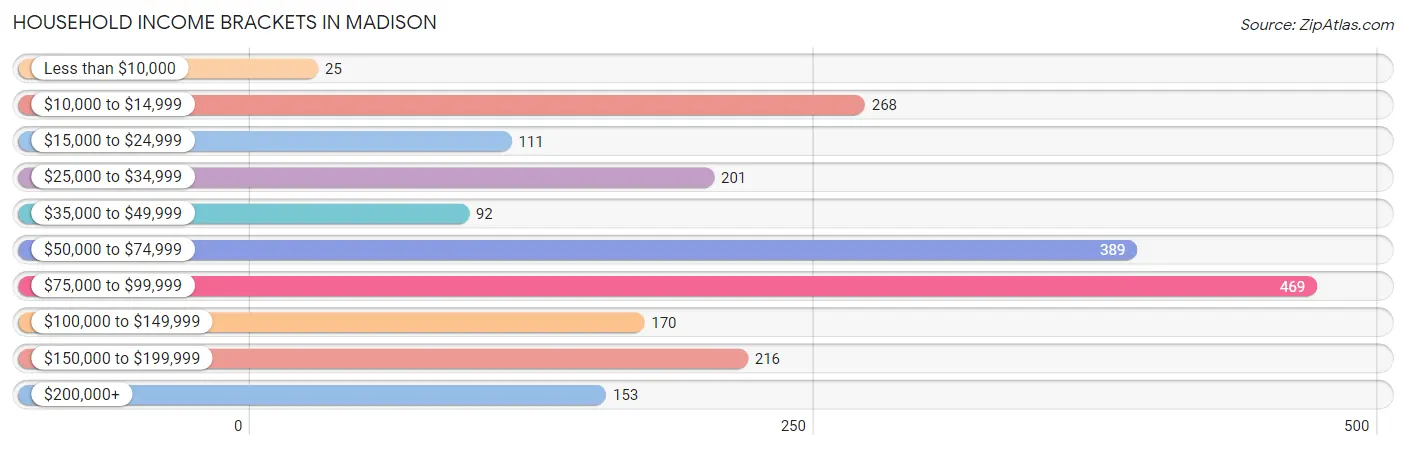
| Income Bracket | # Households | % Households |
| Less than $10,000 | 25 | 1.2% |
| $10,000 to $14,999 | 268 | 12.8% |
| $15,000 to $24,999 | 111 | 5.3% |
| $25,000 to $34,999 | 201 | 9.6% |
| $35,000 to $49,999 | 92 | 4.4% |
| $50,000 to $74,999 | 389 | 18.6% |
| $75,000 to $99,999 | 469 | 22.4% |
| $100,000 to $149,999 | 170 | 8.1% |
| $150,000 to $199,999 | 216 | 10.3% |
| $200,000+ | 153 | 7.3% |
Household Income by Householder Age in Madison
The median household income in Madison is $73,965, with the highest median household income of $92,698 found in the 25 to 44 years age bracket for the primary householder. A total of 747 households (35.7%) fall into this category. Meanwhile, the 15 to 24 years age bracket for the primary householder has the lowest median household income of $0, with 99 households (4.7%) in this group.
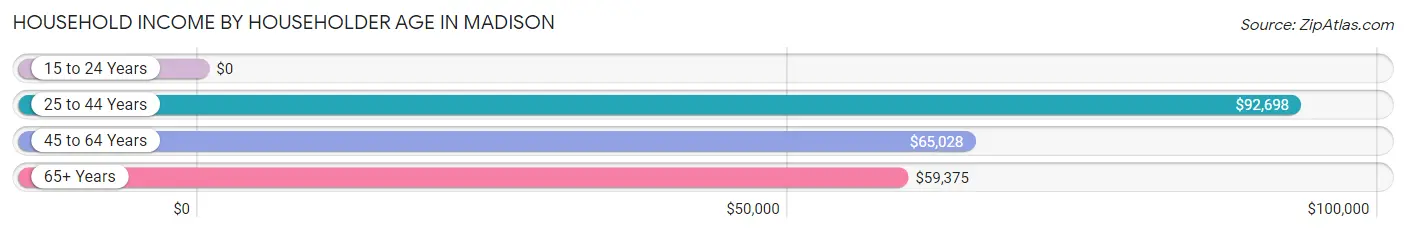
| Income Bracket | # Households | Median Income |
| 15 to 24 Years | 99 (4.7%) | $0 |
| 25 to 44 Years | 747 (35.7%) | $92,698 |
| 45 to 64 Years | 591 (28.2%) | $65,028 |
| 65+ Years | 657 (31.4%) | $59,375 |
| Total | 2,094 (100.0%) | $73,965 |
Poverty in Madison
Income Below Poverty by Sex and Age in Madison
With 4.1% poverty level for males and 17.1% for females among the residents of Madison, 35 to 44 year old males and 18 to 24 year old females are the most vulnerable to poverty, with 38 males (25.3%) and 99 females (75.6%) in their respective age groups living below the poverty level.
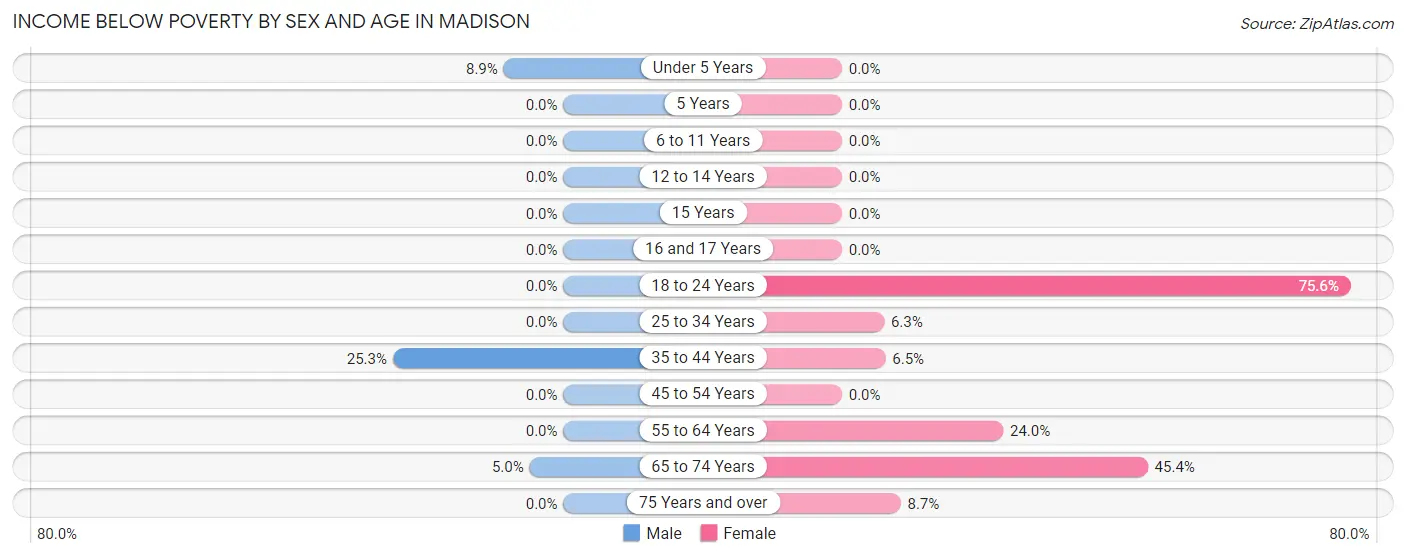
| Age Bracket | Male | Female |
| Under 5 Years | 25 (8.9%) | 0 (0.0%) |
| 5 Years | 0 (0.0%) | 0 (0.0%) |
| 6 to 11 Years | 0 (0.0%) | 0 (0.0%) |
| 12 to 14 Years | 0 (0.0%) | 0 (0.0%) |
| 15 Years | 0 (0.0%) | 0 (0.0%) |
| 16 and 17 Years | 0 (0.0%) | 0 (0.0%) |
| 18 to 24 Years | 0 (0.0%) | 99 (75.6%) |
| 25 to 34 Years | 0 (0.0%) | 35 (6.3%) |
| 35 to 44 Years | 38 (25.3%) | 20 (6.5%) |
| 45 to 54 Years | 0 (0.0%) | 0 (0.0%) |
| 55 to 64 Years | 0 (0.0%) | 120 (23.9%) |
| 65 to 74 Years | 14 (5.0%) | 129 (45.4%) |
| 75 Years and over | 0 (0.0%) | 26 (8.7%) |
| Total | 77 (4.1%) | 429 (17.1%) |
Income Above Poverty by Sex and Age in Madison
According to the poverty statistics in Madison, males aged 6 to 11 years and females aged under 5 years are the age groups that are most secure financially, with 100.0% of males and 100.0% of females in these age groups living above the poverty line.
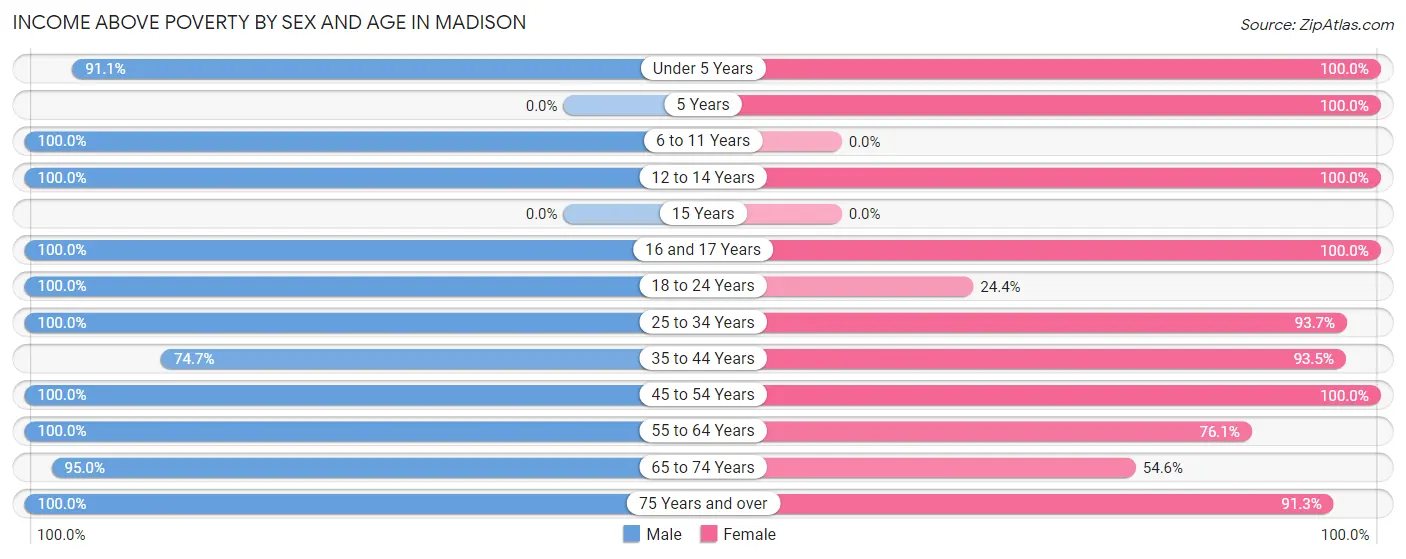
| Age Bracket | Male | Female |
| Under 5 Years | 257 (91.1%) | 64 (100.0%) |
| 5 Years | 0 (0.0%) | 133 (100.0%) |
| 6 to 11 Years | 145 (100.0%) | 0 (0.0%) |
| 12 to 14 Years | 285 (100.0%) | 20 (100.0%) |
| 15 Years | 0 (0.0%) | 0 (0.0%) |
| 16 and 17 Years | 19 (100.0%) | 25 (100.0%) |
| 18 to 24 Years | 43 (100.0%) | 32 (24.4%) |
| 25 to 34 Years | 289 (100.0%) | 524 (93.7%) |
| 35 to 44 Years | 112 (74.7%) | 289 (93.5%) |
| 45 to 54 Years | 126 (100.0%) | 182 (100.0%) |
| 55 to 64 Years | 212 (100.0%) | 381 (76.0%) |
| 65 to 74 Years | 265 (95.0%) | 155 (54.6%) |
| 75 Years and over | 64 (100.0%) | 272 (91.3%) |
| Total | 1,817 (95.9%) | 2,077 (82.9%) |
Income Below Poverty Among Married-Couple Families in Madison
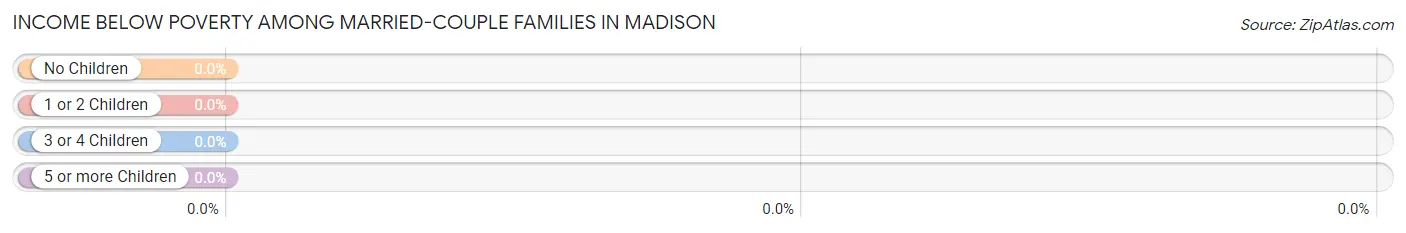
| Children | Above Poverty | Below Poverty |
| No Children | 459 (100.0%) | 0 (0.0%) |
| 1 or 2 Children | 193 (100.0%) | 0 (0.0%) |
| 3 or 4 Children | 221 (100.0%) | 0 (0.0%) |
| 5 or more Children | 0 (0.0%) | 0 (0.0%) |
| Total | 873 (100.0%) | 0 (0.0%) |
Income Below Poverty Among Single-Parent Households in Madison
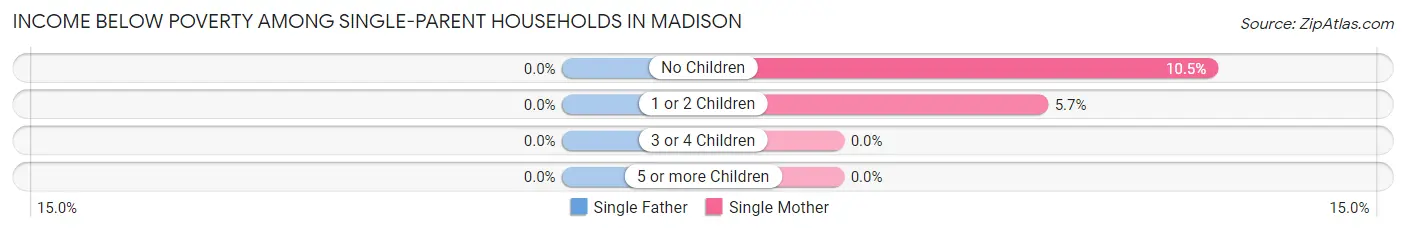
| Children | Single Father | Single Mother |
| No Children | 0 (0.0%) | 25 (10.5%) |
| 1 or 2 Children | 0 (0.0%) | 15 (5.7%) |
| 3 or 4 Children | 0 (0.0%) | 0 (0.0%) |
| 5 or more Children | 0 (0.0%) | 0 (0.0%) |
| Total | 0 (0.0%) | 40 (8.0%) |
Income Below Poverty Among Married-Couple vs Single-Parent Households in Madison
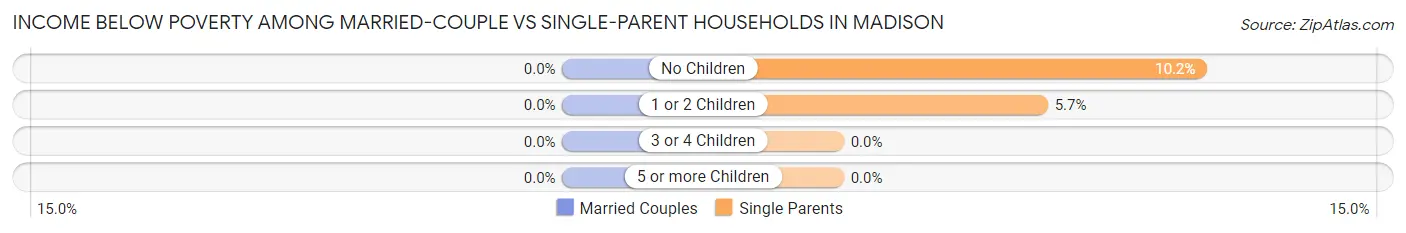
| Children | Married-Couple Families | Single-Parent Households |
| No Children | 0 (0.0%) | 25 (10.2%) |
| 1 or 2 Children | 0 (0.0%) | 15 (5.7%) |
| 3 or 4 Children | 0 (0.0%) | 0 (0.0%) |
| 5 or more Children | 0 (0.0%) | 0 (0.0%) |
| Total | 0 (0.0%) | 40 (7.9%) |
Race in Madison
The most populous races in Madison are White / Caucasian (2,644 | 57.8%), Black / African American (1,835 | 40.1%), and Hispanic or Latino (155 | 3.4%).
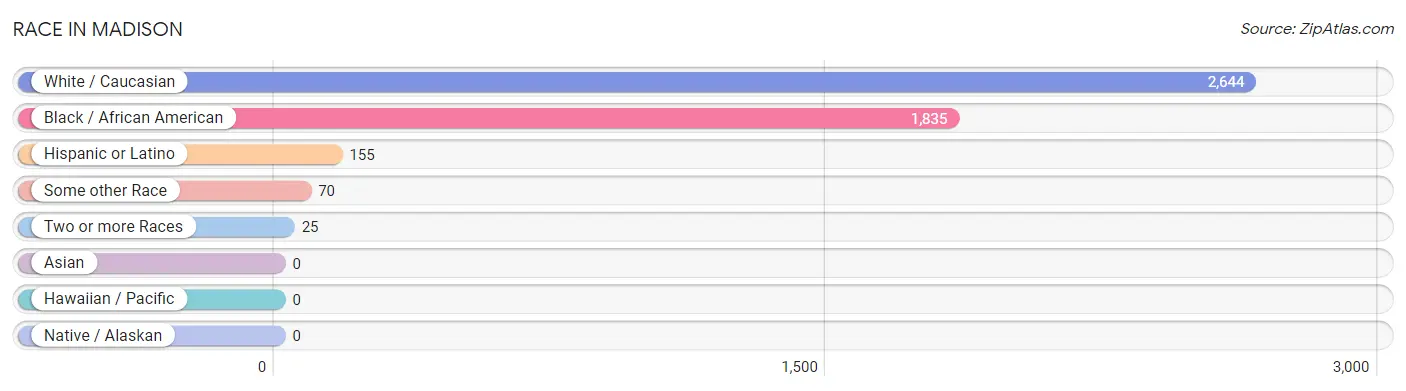
| Race | # Population | % Population |
| Asian | 0 | 0.0% |
| Black / African American | 1,835 | 40.1% |
| Hawaiian / Pacific | 0 | 0.0% |
| Hispanic or Latino | 155 | 3.4% |
| Native / Alaskan | 0 | 0.0% |
| White / Caucasian | 2,644 | 57.8% |
| Two or more Races | 25 | 0.5% |
| Some other Race | 70 | 1.5% |
| Total | 4,574 | 100.0% |
Ancestry in Madison
The most populous ancestries reported in Madison are American (1,546 | 33.8%), English (694 | 15.2%), Irish (455 | 10.0%), German (300 | 6.6%), and Scottish (278 | 6.1%), together accounting for 71.6% of all Madison residents.
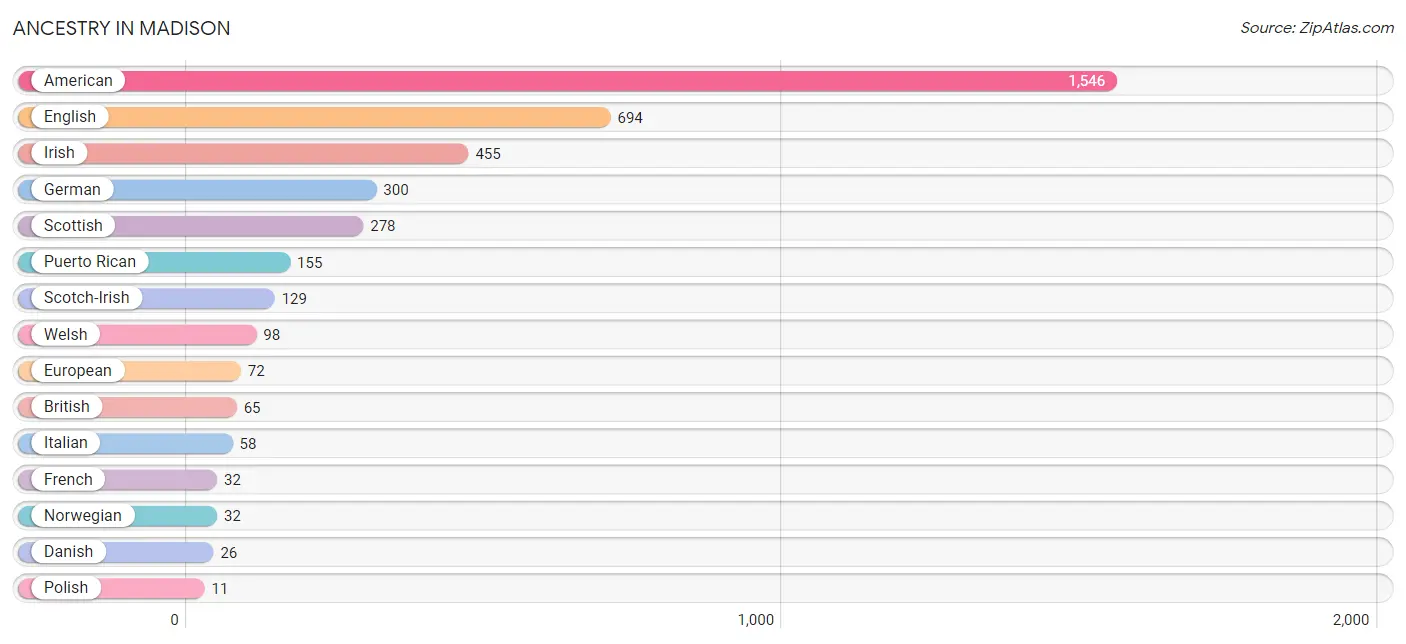
| Ancestry | # Population | % Population |
| American | 1,546 | 33.8% |
| British | 65 | 1.4% |
| Croatian | 8 | 0.2% |
| Danish | 26 | 0.6% |
| English | 694 | 15.2% |
| European | 72 | 1.6% |
| French | 32 | 0.7% |
| German | 300 | 6.6% |
| Irish | 455 | 10.0% |
| Italian | 58 | 1.3% |
| Luxembourger | 10 | 0.2% |
| Norwegian | 32 | 0.7% |
| Polish | 11 | 0.2% |
| Puerto Rican | 155 | 3.4% |
| Scotch-Irish | 129 | 2.8% |
| Scottish | 278 | 6.1% |
| Welsh | 98 | 2.1% | View All 17 Rows |
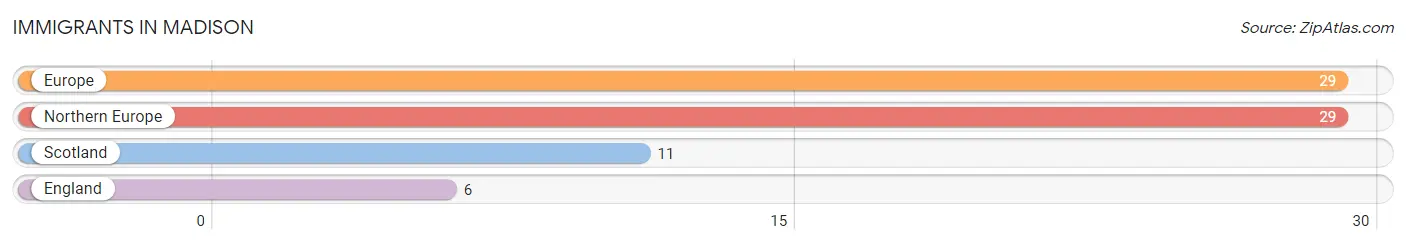
Immigrants in Madison
The most numerous immigrant groups reported in Madison came from Europe (29 | 0.6%), Northern Europe (29 | 0.6%), Scotland (11 | 0.2%), and England (6 | 0.1%), together accounting for 1.6% of all Madison residents.
| Immigration Origin | # Population | % Population |
| England | 6 | 0.1% |
| Europe | 29 | 0.6% |
| Northern Europe | 29 | 0.6% |
| Scotland | 11 | 0.2% | View All 4 Rows |
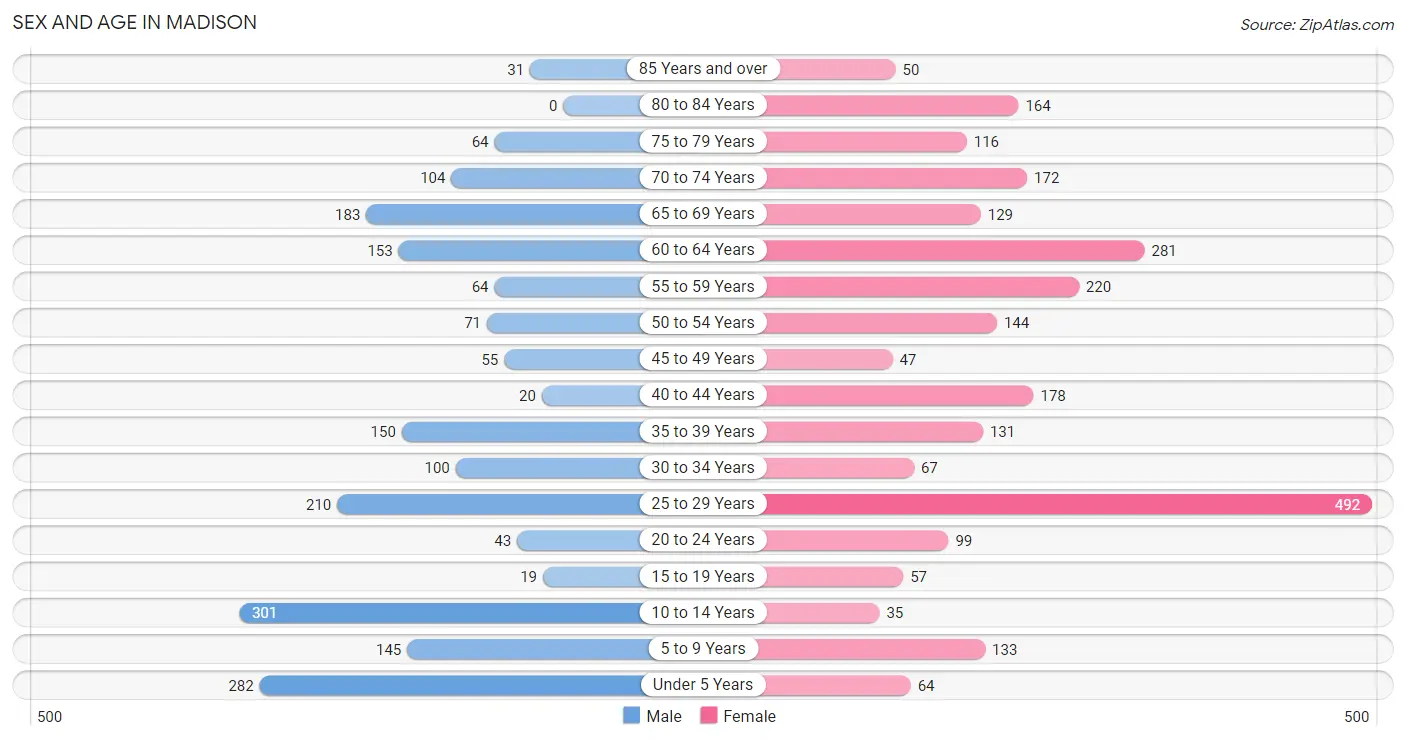
Sex and Age in Madison
Sex and Age in Madison
The most populous age groups in Madison are 10 to 14 Years (301 | 15.1%) for men and 25 to 29 Years (492 | 19.1%) for women.
| Age Bracket | Male | Female |
| Under 5 Years | 282 (14.1%) | 64 (2.5%) |
| 5 to 9 Years | 145 (7.3%) | 133 (5.2%) |
| 10 to 14 Years | 301 (15.1%) | 35 (1.4%) |
| 15 to 19 Years | 19 (0.9%) | 57 (2.2%) |
| 20 to 24 Years | 43 (2.2%) | 99 (3.8%) |
| 25 to 29 Years | 210 (10.5%) | 492 (19.1%) |
| 30 to 34 Years | 100 (5.0%) | 67 (2.6%) |
| 35 to 39 Years | 150 (7.5%) | 131 (5.1%) |
| 40 to 44 Years | 20 (1.0%) | 178 (6.9%) |
| 45 to 49 Years | 55 (2.8%) | 47 (1.8%) |
| 50 to 54 Years | 71 (3.6%) | 144 (5.6%) |
| 55 to 59 Years | 64 (3.2%) | 220 (8.5%) |
| 60 to 64 Years | 153 (7.7%) | 281 (10.9%) |
| 65 to 69 Years | 183 (9.2%) | 129 (5.0%) |
| 70 to 74 Years | 104 (5.2%) | 172 (6.7%) |
| 75 to 79 Years | 64 (3.2%) | 116 (4.5%) |
| 80 to 84 Years | 0 (0.0%) | 164 (6.4%) |
| 85 Years and over | 31 (1.5%) | 50 (1.9%) |
| Total | 1,995 (100.0%) | 2,579 (100.0%) |
Families and Households in Madison
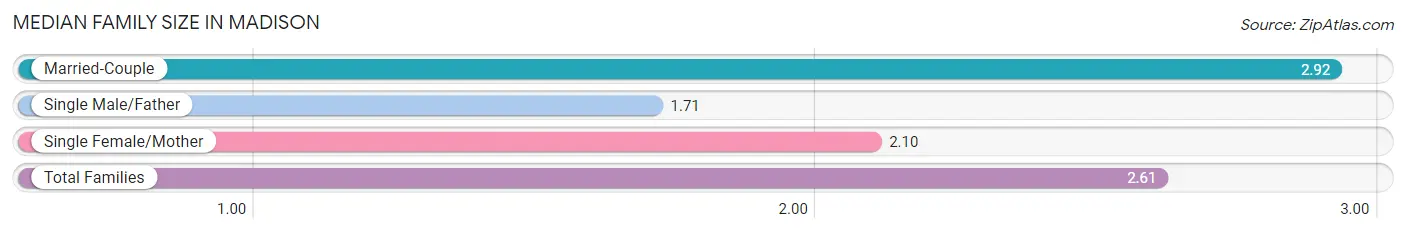
Median Family Size in Madison
The median family size in Madison is 2.61 persons per family, with married-couple families (873 | 63.2%) accounting for the largest median family size of 2.92 persons per family. On the other hand, single male/father families (7 | 0.5%) represent the smallest median family size with 1.71 persons per family.
| Family Type | # Families | Family Size |
| Married-Couple | 873 (63.2%) | 2.92 |
| Single Male/Father | 7 (0.5%) | 1.71 |
| Single Female/Mother | 502 (36.3%) | 2.10 |
| Total Families | 1,382 (100.0%) | 2.61 |
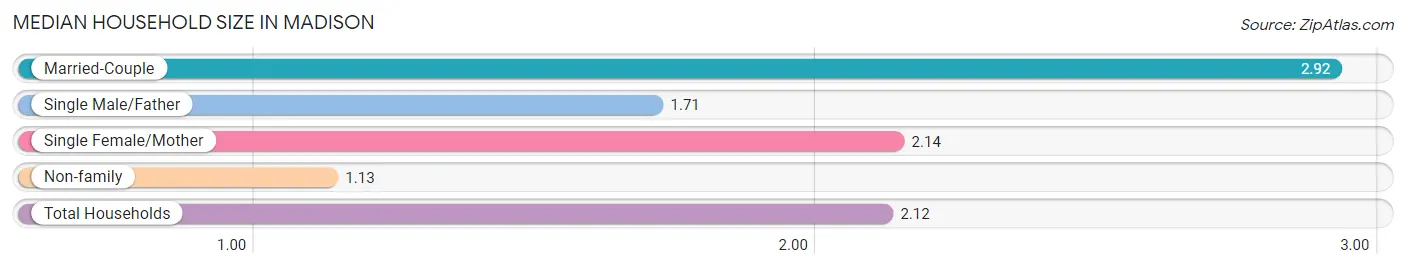
Median Household Size in Madison
The median household size in Madison is 2.12 persons per household, with married-couple households (873 | 41.7%) accounting for the largest median household size of 2.92 persons per household. non-family households (712 | 34.0%) represent the smallest median household size with 1.13 persons per household.
| Household Type | # Households | Household Size |
| Married-Couple | 873 (41.7%) | 2.92 |
| Single Male/Father | 7 (0.3%) | 1.71 |
| Single Female/Mother | 502 (24.0%) | 2.14 |
| Non-family | 712 (34.0%) | 1.13 |
| Total Households | 2,094 (100.0%) | 2.12 |
Household Size by Marriage Status in Madison
Out of a total of 2,094 households in Madison, 1,382 (66.0%) are family households, while 712 (34.0%) are nonfamily households. The most numerous type of family households are 2-person households, comprising 845, and the most common type of nonfamily households are 1-person households, comprising 583.
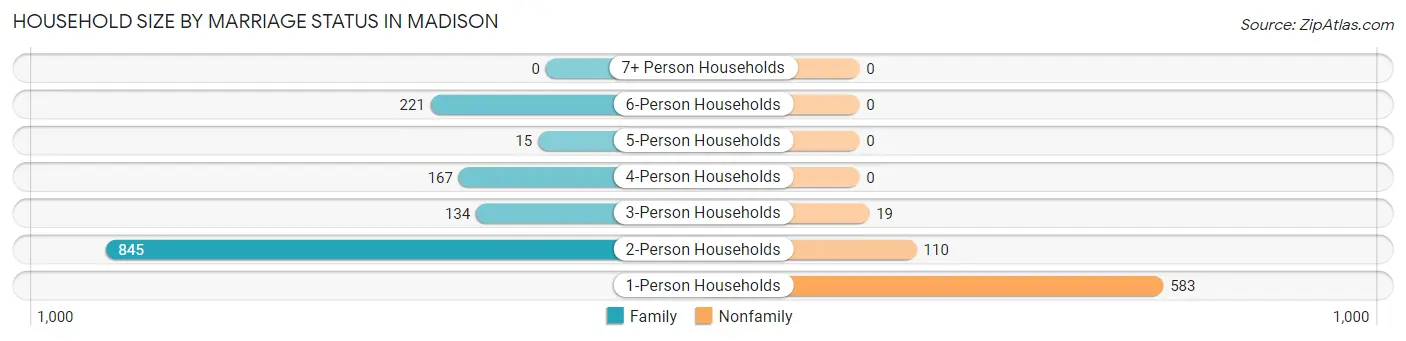
| Household Size | Family Households | Nonfamily Households |
| 1-Person Households | - | 583 (27.8%) |
| 2-Person Households | 845 (40.4%) | 110 (5.2%) |
| 3-Person Households | 134 (6.4%) | 19 (0.9%) |
| 4-Person Households | 167 (8.0%) | 0 (0.0%) |
| 5-Person Households | 15 (0.7%) | 0 (0.0%) |
| 6-Person Households | 221 (10.5%) | 0 (0.0%) |
| 7+ Person Households | 0 (0.0%) | 0 (0.0%) |
| Total | 1,382 (66.0%) | 712 (34.0%) |
Female Fertility in Madison
Fertility by Age in Madison
Average fertility rate in Madison is 244.0 births per 1,000 women. Women in the age bracket of 20 to 34 years have the highest fertility rate with 336.0 births per 1,000 women. Women in the age bracket of 20 to 34 years acount for 84.7% of all women with births.
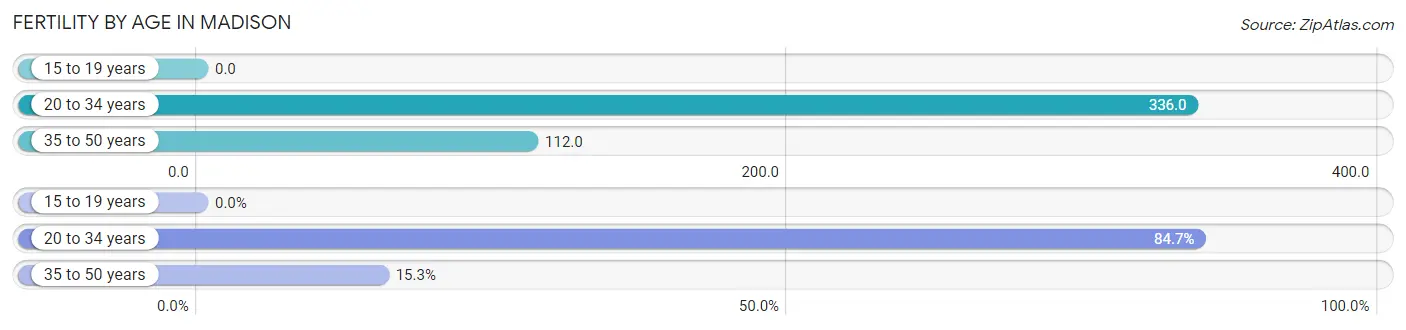
| Age Bracket | Women with Births | Births / 1,000 Women |
| 15 to 19 years | 0 (0.0%) | 0.0 |
| 20 to 34 years | 221 (84.7%) | 336.0 |
| 35 to 50 years | 40 (15.3%) | 112.0 |
| Total | 261 (100.0%) | 244.0 |
Fertility by Age by Marriage Status in Madison
92.3% of women with births (261) in Madison are married. The highest percentage of unmarried women with births falls into 35 to 50 years age bracket with 50.0% of them unmarried at the time of birth, while the lowest percentage of unmarried women with births belong to 20 to 34 years age bracket with 0.0% of them unmarried.
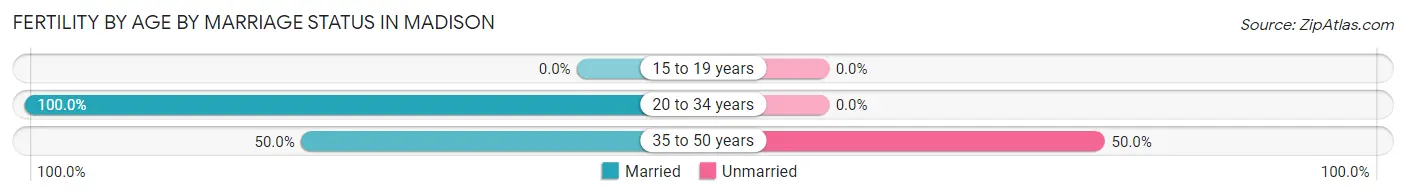
| Age Bracket | Married | Unmarried |
| 15 to 19 years | 0 (0.0%) | 0 (0.0%) |
| 20 to 34 years | 221 (100.0%) | 0 (0.0%) |
| 35 to 50 years | 20 (50.0%) | 20 (50.0%) |
| Total | 241 (92.3%) | 20 (7.7%) |
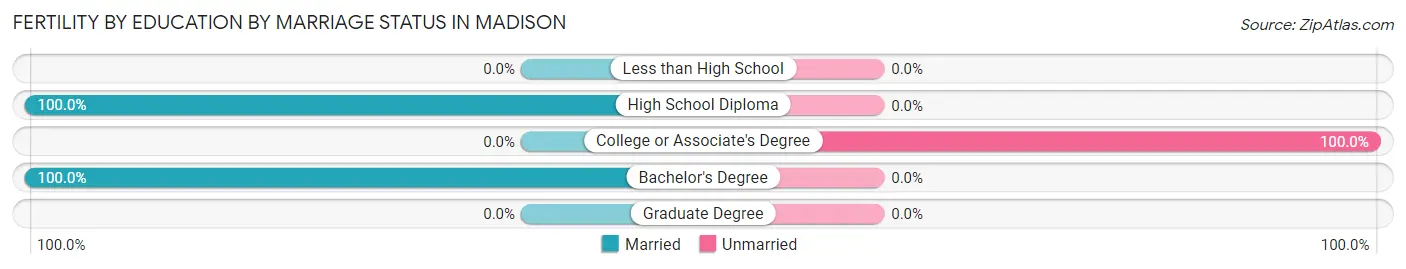
Fertility by Education in Madison
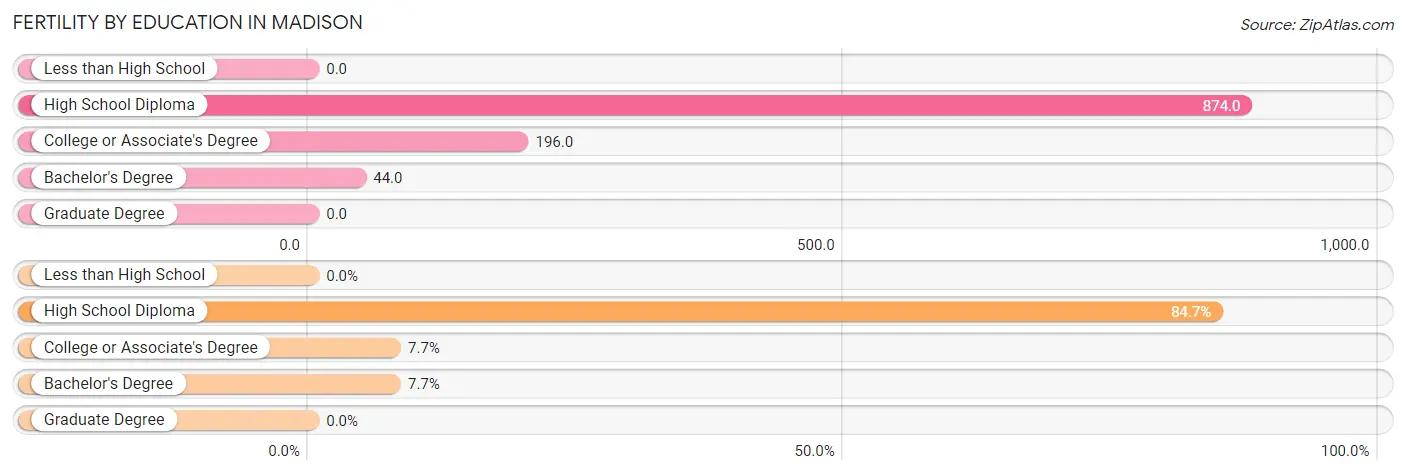
| Educational Attainment | Women with Births | Births / 1,000 Women |
| Less than High School | 0 (0.0%) | 0.0 |
| High School Diploma | 221 (84.7%) | 874.0 |
| College or Associate's Degree | 20 (7.7%) | 196.0 |
| Bachelor's Degree | 20 (7.7%) | 44.0 |
| Graduate Degree | 0 (0.0%) | 0.0 |
| Total | 261 (100.0%) | 244.0 |
Fertility by Education by Marriage Status in Madison
7.7% of women with births in Madison are unmarried. Women with the educational attainment of high school diploma are most likely to be married with 100.0% of them married at childbirth, while women with the educational attainment of college or associate's degree are least likely to be married with 100.0% of them unmarried at childbirth.
| Educational Attainment | Married | Unmarried |
| Less than High School | 0 (0.0%) | 0 (0.0%) |
| High School Diploma | 221 (100.0%) | 0 (0.0%) |
| College or Associate's Degree | 0 (0.0%) | 20 (100.0%) |
| Bachelor's Degree | 20 (100.0%) | 0 (0.0%) |
| Graduate Degree | 0 (0.0%) | 0 (0.0%) |
| Total | 241 (92.3%) | 20 (7.7%) |
Employment Characteristics in Madison
Employment by Class of Employer in Madison
Among the 2,222 employed individuals in Madison, private company employees (1,346 | 60.6%), local government employees (252 | 11.3%), and state government employees (231 | 10.4%) make up the most common classes of employment.
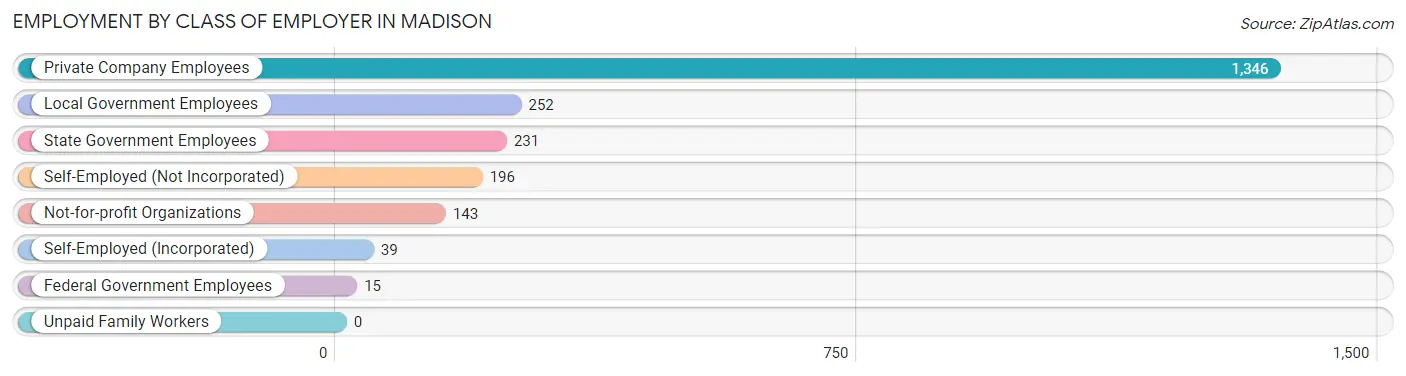
| Employer Class | # Employees | % Employees |
| Private Company Employees | 1,346 | 60.6% |
| Self-Employed (Incorporated) | 39 | 1.8% |
| Self-Employed (Not Incorporated) | 196 | 8.8% |
| Not-for-profit Organizations | 143 | 6.4% |
| Local Government Employees | 252 | 11.3% |
| State Government Employees | 231 | 10.4% |
| Federal Government Employees | 15 | 0.7% |
| Unpaid Family Workers | 0 | 0.0% |
| Total | 2,222 | 100.0% |
Employment Status by Age in Madison
According to the labor force statistics for Madison, out of the total population over 16 years of age (3,614), 62.0% or 2,241 individuals are in the labor force, with 0.8% or 18 of them unemployed. The age group with the highest labor force participation rate is 25 to 29 years, with 97.0% or 681 individuals in the labor force. Within the labor force, the 60 to 64 years age range has the highest percentage of unemployed individuals, with 7.3% or 19 of them being unemployed.
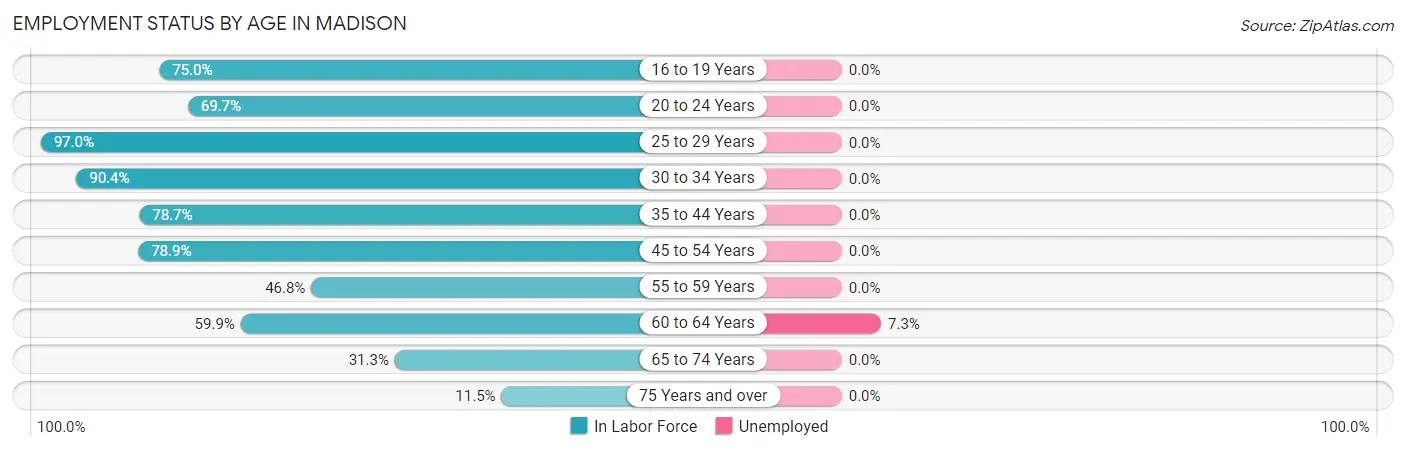
| Age Bracket | In Labor Force | Unemployed |
| 16 to 19 Years | 57 (75.0%) | 0 (0.0%) |
| 20 to 24 Years | 99 (69.7%) | 0 (0.0%) |
| 25 to 29 Years | 681 (97.0%) | 0 (0.0%) |
| 30 to 34 Years | 151 (90.4%) | 0 (0.0%) |
| 35 to 44 Years | 377 (78.7%) | 0 (0.0%) |
| 45 to 54 Years | 250 (78.9%) | 0 (0.0%) |
| 55 to 59 Years | 133 (46.8%) | 0 (0.0%) |
| 60 to 64 Years | 260 (59.9%) | 19 (7.3%) |
| 65 to 74 Years | 184 (31.3%) | 0 (0.0%) |
| 75 Years and over | 49 (11.5%) | 0 (0.0%) |
| Total | 2,241 (62.0%) | 18 (0.8%) |
Employment Status by Educational Attainment in Madison
According to labor force statistics for Madison, 77.7% of individuals (1,852) out of the total population between 25 and 64 years of age (2,383) are in the labor force, with 1.0% or 19 of them being unemployed. The group with the highest labor force participation rate are those with the educational attainment of bachelor's degree or higher, with 90.7% or 931 individuals in the labor force. Within the labor force, individuals with high school diploma education have the highest percentage of unemployment, with 2.8% or 19 of them being unemployed.
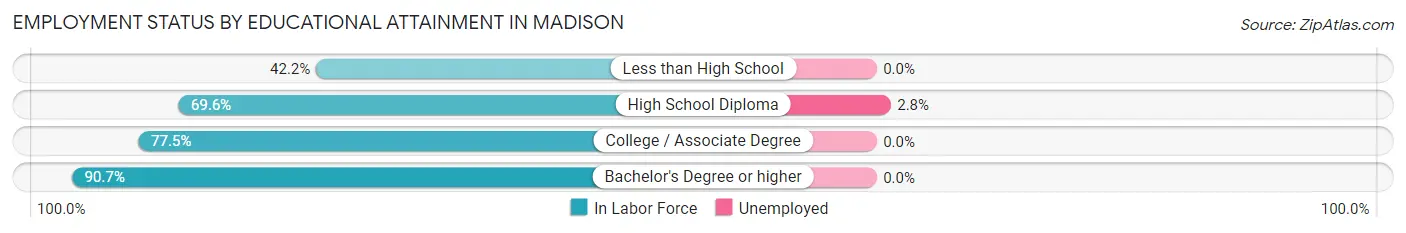
| Educational Attainment | In Labor Force | Unemployed |
| Less than High School | 65 (42.2%) | 0 (0.0%) |
| High School Diploma | 667 (69.6%) | 27 (2.8%) |
| College / Associate Degree | 189 (77.5%) | 0 (0.0%) |
| Bachelor's Degree or higher | 931 (90.7%) | 0 (0.0%) |
| Total | 1,852 (77.7%) | 24 (1.0%) |
Employment Occupations by Sex in Madison
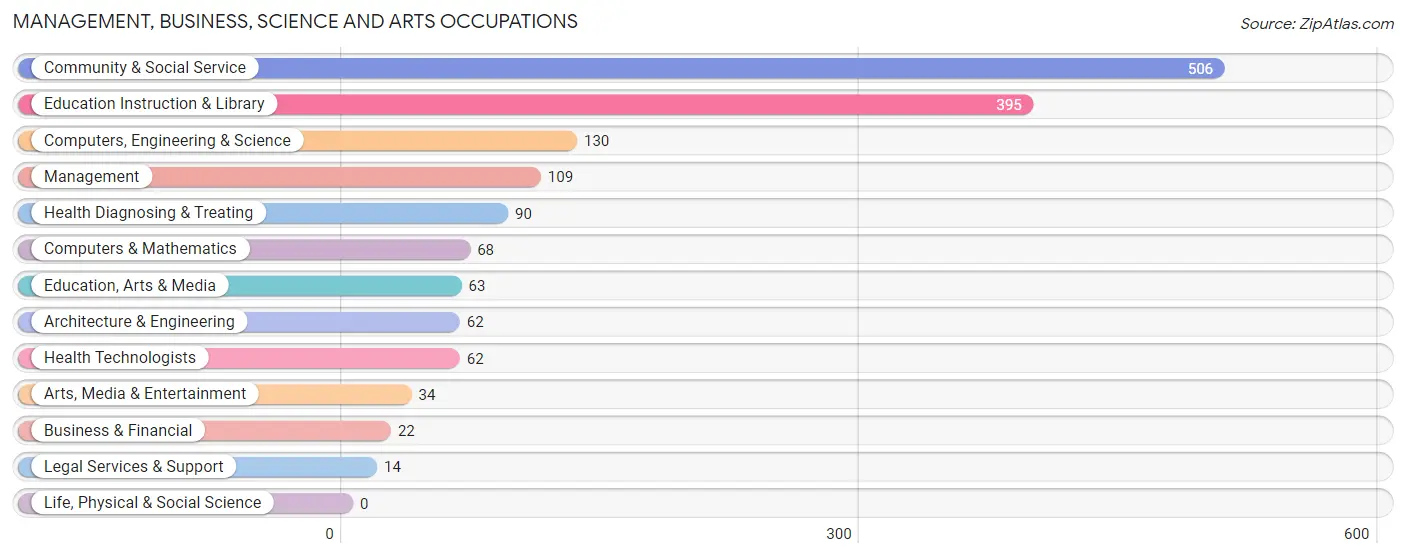
Management, Business, Science and Arts Occupations
The most common Management, Business, Science and Arts occupations in Madison are Community & Social Service (506 | 22.8%), Education Instruction & Library (395 | 17.8%), Computers, Engineering & Science (130 | 5.9%), Management (109 | 4.9%), and Health Diagnosing & Treating (90 | 4.1%).
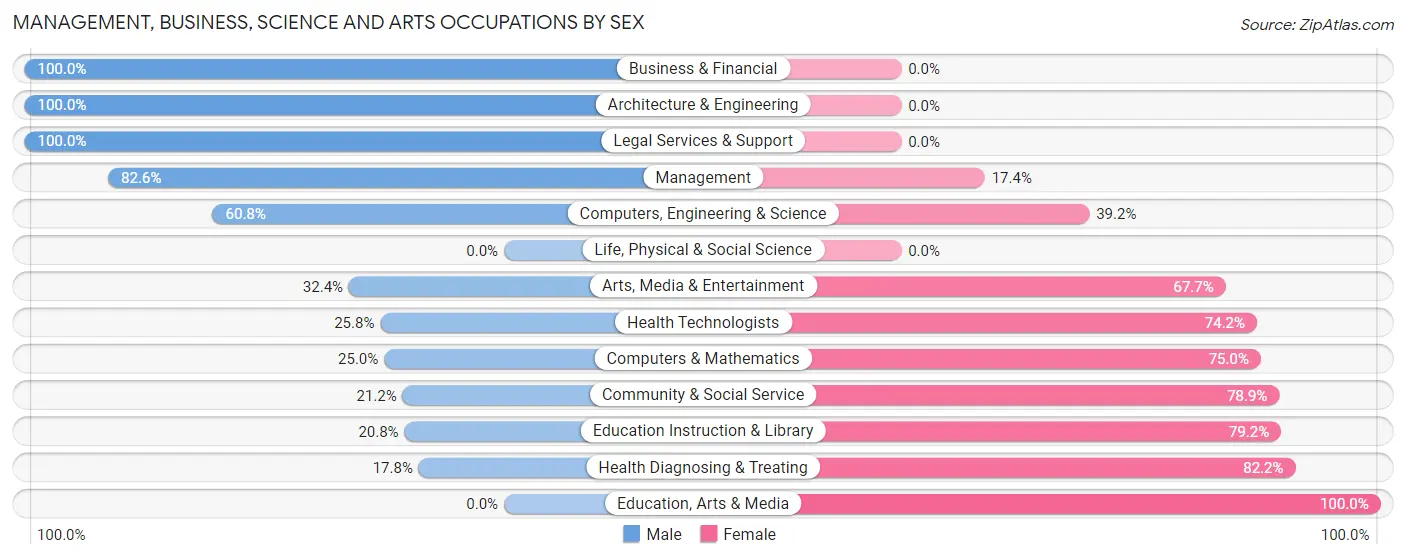
Management, Business, Science and Arts Occupations by Sex
Within the Management, Business, Science and Arts occupations in Madison, the most male-oriented occupations are Business & Financial (100.0%), Architecture & Engineering (100.0%), and Legal Services & Support (100.0%), while the most female-oriented occupations are Education, Arts & Media (100.0%), Health Diagnosing & Treating (82.2%), and Education Instruction & Library (79.2%).
| Occupation | Male | Female |
| Management | 90 (82.6%) | 19 (17.4%) |
| Business & Financial | 22 (100.0%) | 0 (0.0%) |
| Computers, Engineering & Science | 79 (60.8%) | 51 (39.2%) |
| Computers & Mathematics | 17 (25.0%) | 51 (75.0%) |
| Architecture & Engineering | 62 (100.0%) | 0 (0.0%) |
| Life, Physical & Social Science | 0 (0.0%) | 0 (0.0%) |
| Community & Social Service | 107 (21.1%) | 399 (78.8%) |
| Education, Arts & Media | 0 (0.0%) | 63 (100.0%) |
| Legal Services & Support | 14 (100.0%) | 0 (0.0%) |
| Education Instruction & Library | 82 (20.8%) | 313 (79.2%) |
| Arts, Media & Entertainment | 11 (32.4%) | 23 (67.6%) |
| Health Diagnosing & Treating | 16 (17.8%) | 74 (82.2%) |
| Health Technologists | 16 (25.8%) | 46 (74.2%) |
| Total (Category) | 314 (36.6%) | 543 (63.4%) |
| Total (Overall) | 858 (38.6%) | 1,364 (61.4%) |
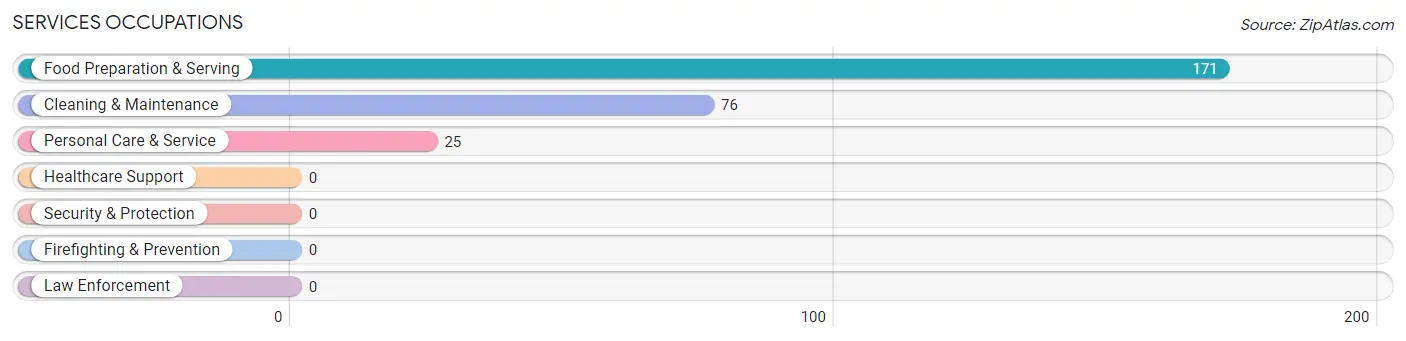
Services Occupations
The most common Services occupations in Madison are Food Preparation & Serving (171 | 7.7%), Cleaning & Maintenance (76 | 3.4%), and Personal Care & Service (25 | 1.1%).
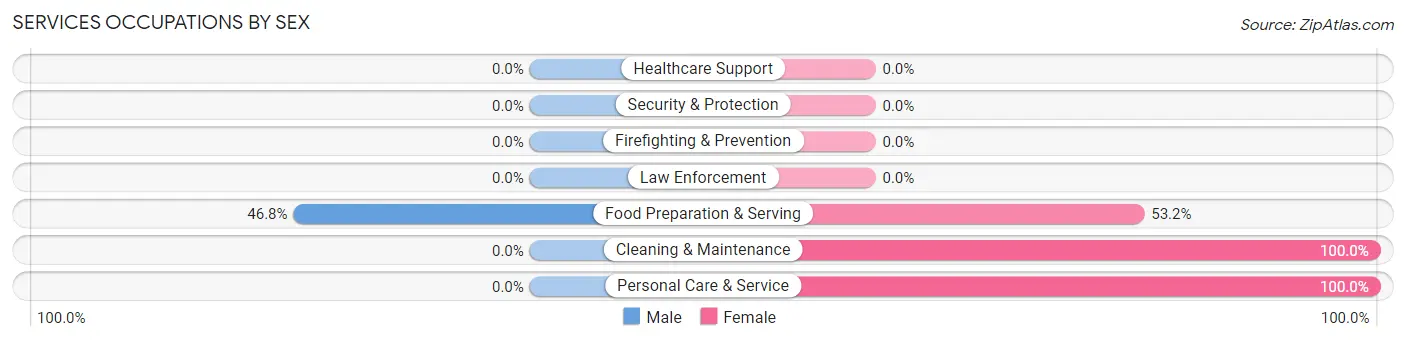
Services Occupations by Sex
| Occupation | Male | Female |
| Healthcare Support | 0 (0.0%) | 0 (0.0%) |
| Security & Protection | 0 (0.0%) | 0 (0.0%) |
| Firefighting & Prevention | 0 (0.0%) | 0 (0.0%) |
| Law Enforcement | 0 (0.0%) | 0 (0.0%) |
| Food Preparation & Serving | 80 (46.8%) | 91 (53.2%) |
| Cleaning & Maintenance | 0 (0.0%) | 76 (100.0%) |
| Personal Care & Service | 0 (0.0%) | 25 (100.0%) |
| Total (Category) | 80 (29.4%) | 192 (70.6%) |
| Total (Overall) | 858 (38.6%) | 1,364 (61.4%) |
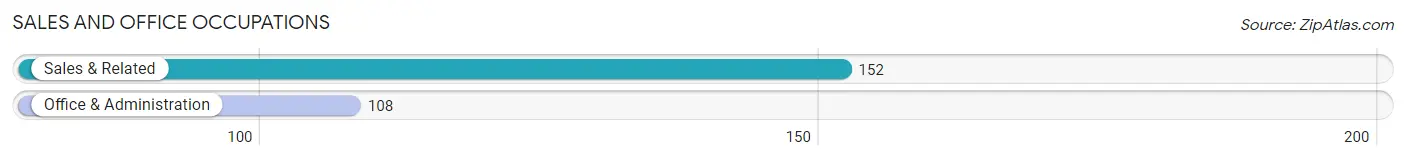
Sales and Office Occupations
The most common Sales and Office occupations in Madison are Sales & Related (152 | 6.8%), and Office & Administration (108 | 4.9%).
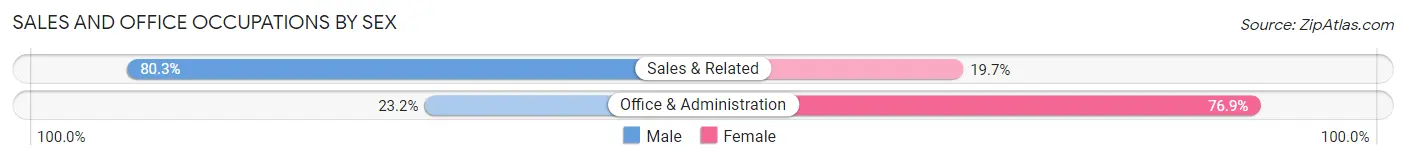
Sales and Office Occupations by Sex
| Occupation | Male | Female |
| Sales & Related | 122 (80.3%) | 30 (19.7%) |
| Office & Administration | 25 (23.2%) | 83 (76.8%) |
| Total (Category) | 147 (56.5%) | 113 (43.5%) |
| Total (Overall) | 858 (38.6%) | 1,364 (61.4%) |
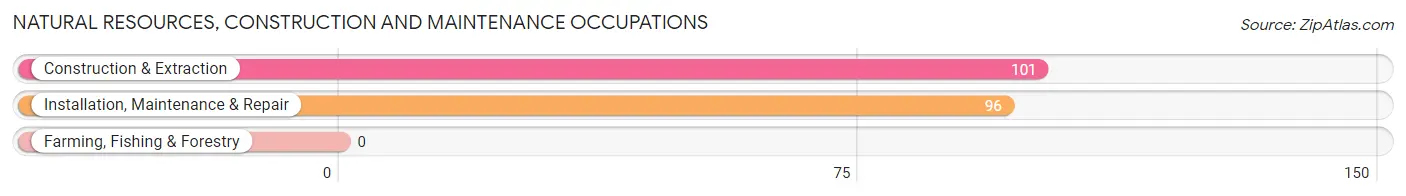
Natural Resources, Construction and Maintenance Occupations
The most common Natural Resources, Construction and Maintenance occupations in Madison are Construction & Extraction (101 | 4.5%), and Installation, Maintenance & Repair (96 | 4.3%).
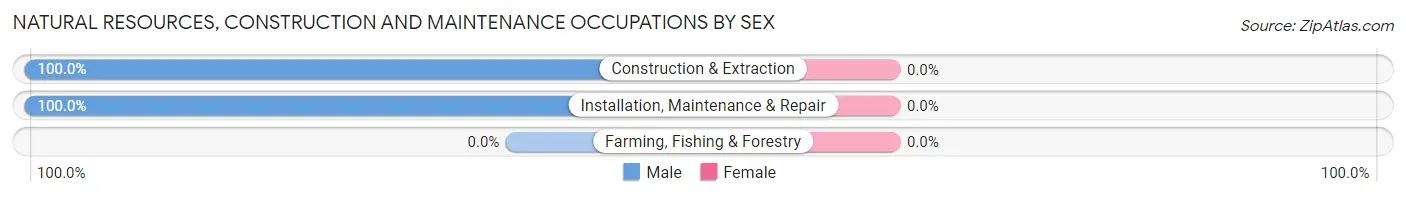
Natural Resources, Construction and Maintenance Occupations by Sex
| Occupation | Male | Female |
| Farming, Fishing & Forestry | 0 (0.0%) | 0 (0.0%) |
| Construction & Extraction | 101 (100.0%) | 0 (0.0%) |
| Installation, Maintenance & Repair | 96 (100.0%) | 0 (0.0%) |
| Total (Category) | 197 (100.0%) | 0 (0.0%) |
| Total (Overall) | 858 (38.6%) | 1,364 (61.4%) |
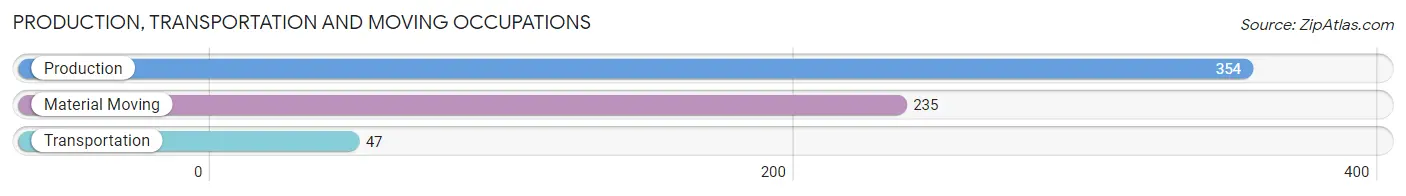
Production, Transportation and Moving Occupations
The most common Production, Transportation and Moving occupations in Madison are Production (354 | 15.9%), Material Moving (235 | 10.6%), and Transportation (47 | 2.1%).
Production, Transportation and Moving Occupations by Sex
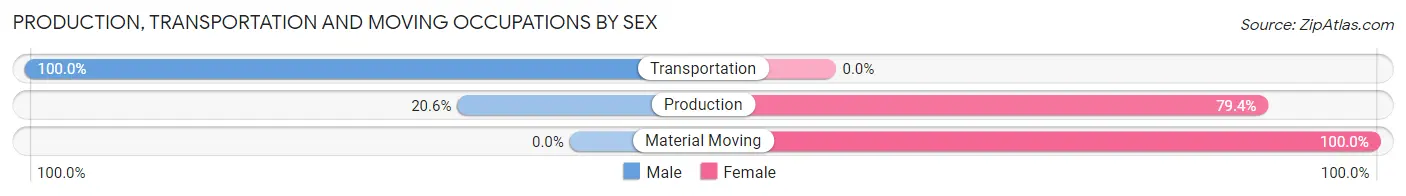
| Occupation | Male | Female |
| Production | 73 (20.6%) | 281 (79.4%) |
| Transportation | 47 (100.0%) | 0 (0.0%) |
| Material Moving | 0 (0.0%) | 235 (100.0%) |
| Total (Category) | 120 (18.9%) | 516 (81.1%) |
| Total (Overall) | 858 (38.6%) | 1,364 (61.4%) |
Employment Industries by Sex in Madison
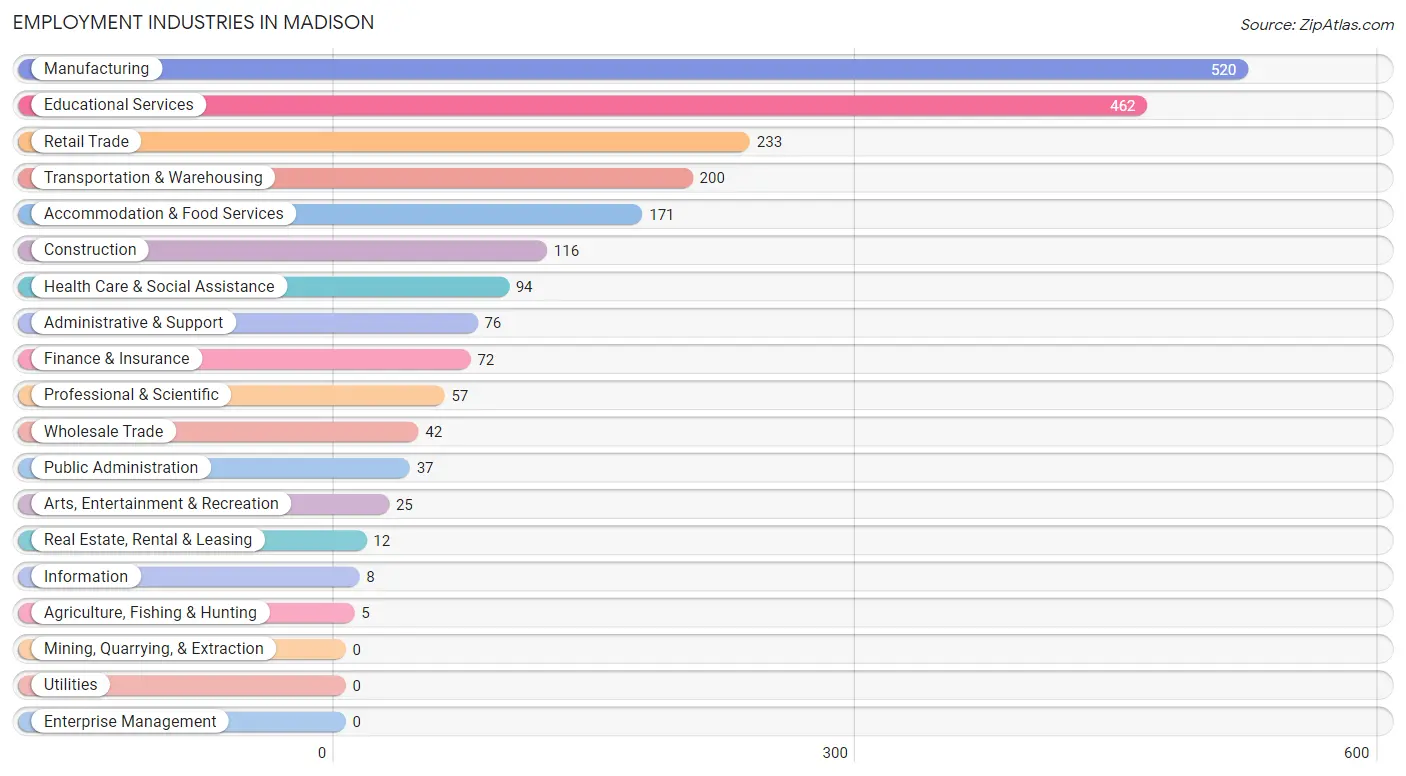
Employment Industries in Madison
The major employment industries in Madison include Manufacturing (520 | 23.4%), Educational Services (462 | 20.8%), Retail Trade (233 | 10.5%), Transportation & Warehousing (200 | 9.0%), and Accommodation & Food Services (171 | 7.7%).
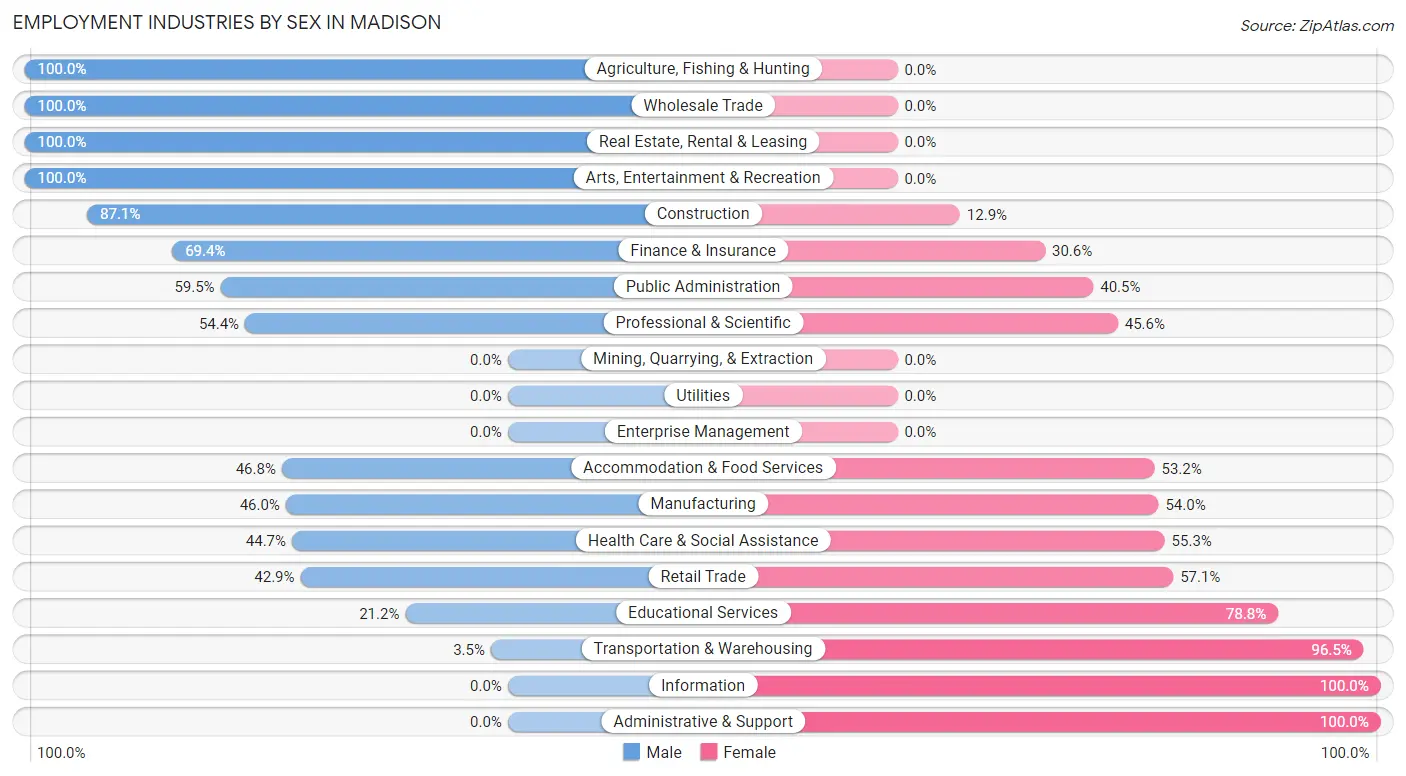
Employment Industries by Sex in Madison
The Madison industries that see more men than women are Agriculture, Fishing & Hunting (100.0%), Wholesale Trade (100.0%), and Real Estate, Rental & Leasing (100.0%), whereas the industries that tend to have a higher number of women are Information (100.0%), Administrative & Support (100.0%), and Transportation & Warehousing (96.5%).
| Industry | Male | Female |
| Agriculture, Fishing & Hunting | 5 (100.0%) | 0 (0.0%) |
| Mining, Quarrying, & Extraction | 0 (0.0%) | 0 (0.0%) |
| Construction | 101 (87.1%) | 15 (12.9%) |
| Manufacturing | 239 (46.0%) | 281 (54.0%) |
| Wholesale Trade | 42 (100.0%) | 0 (0.0%) |
| Retail Trade | 100 (42.9%) | 133 (57.1%) |
| Transportation & Warehousing | 7 (3.5%) | 193 (96.5%) |
| Utilities | 0 (0.0%) | 0 (0.0%) |
| Information | 0 (0.0%) | 8 (100.0%) |
| Finance & Insurance | 50 (69.4%) | 22 (30.6%) |
| Real Estate, Rental & Leasing | 12 (100.0%) | 0 (0.0%) |
| Professional & Scientific | 31 (54.4%) | 26 (45.6%) |
| Enterprise Management | 0 (0.0%) | 0 (0.0%) |
| Administrative & Support | 0 (0.0%) | 76 (100.0%) |
| Educational Services | 98 (21.2%) | 364 (78.8%) |
| Health Care & Social Assistance | 42 (44.7%) | 52 (55.3%) |
| Arts, Entertainment & Recreation | 25 (100.0%) | 0 (0.0%) |
| Accommodation & Food Services | 80 (46.8%) | 91 (53.2%) |
| Public Administration | 22 (59.5%) | 15 (40.5%) |
| Total | 858 (38.6%) | 1,364 (61.4%) |
Education in Madison
School Enrollment in Madison
The most common levels of schooling among the 899 students in Madison are middle school (310 | 34.5%), college / undergraduate (213 | 23.7%), and elementary school (145 | 16.1%).
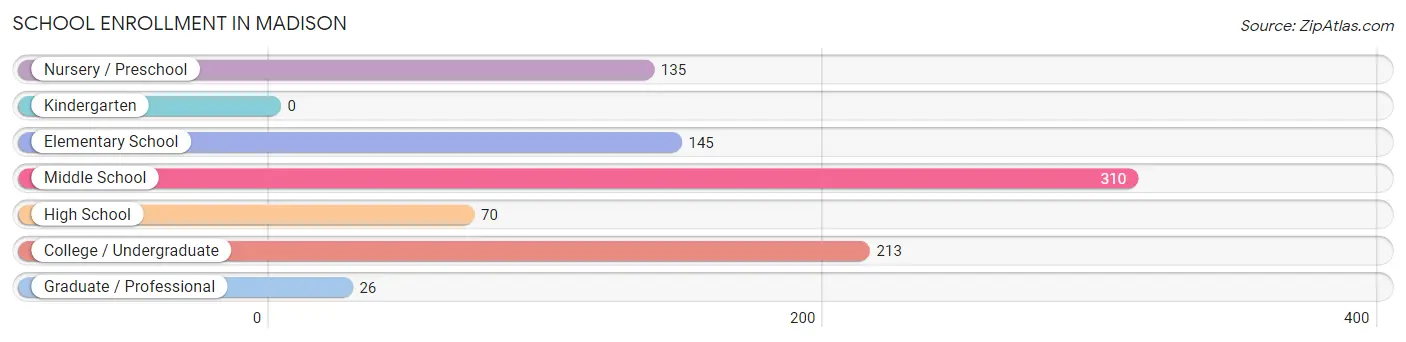
| School Level | # Students | % Students |
| Nursery / Preschool | 135 | 15.0% |
| Kindergarten | 0 | 0.0% |
| Elementary School | 145 | 16.1% |
| Middle School | 310 | 34.5% |
| High School | 70 | 7.8% |
| College / Undergraduate | 213 | 23.7% |
| Graduate / Professional | 26 | 2.9% |
| Total | 899 | 100.0% |
School Enrollment by Age by Funding Source in Madison
Out of a total of 899 students who are enrolled in schools in Madison, 97 (10.8%) attend a private institution, while the remaining 802 (89.2%) are enrolled in public schools. The age group of 3 to 4 year olds has the highest likelihood of being enrolled in private schools, with 58 (47.5% in the age bracket) enrolled. Conversely, the age group of 10 to 14 year olds has the lowest likelihood of being enrolled in a private school, with 336 (100.0% in the age bracket) attending a public institution.
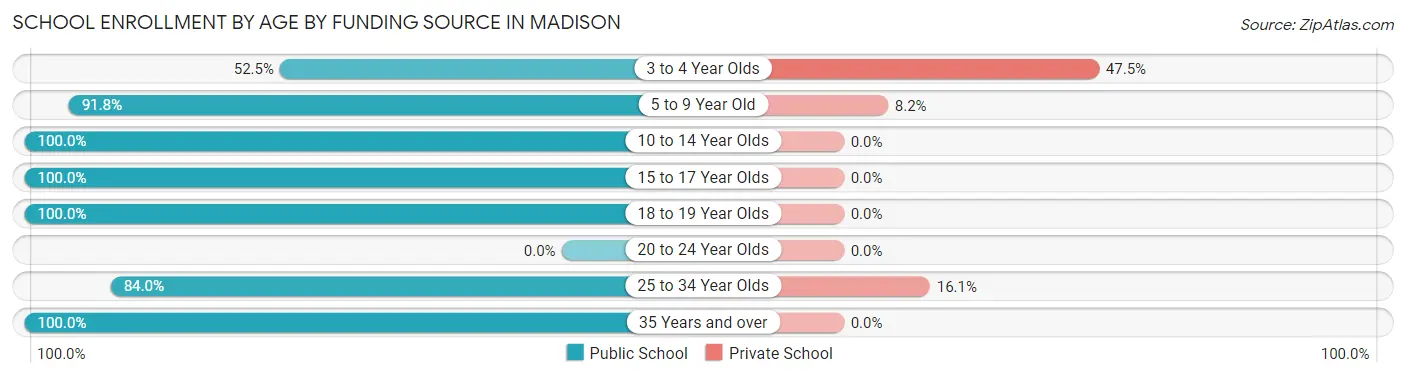
| Age Bracket | Public School | Private School |
| 3 to 4 Year Olds | 64 (52.5%) | 58 (47.5%) |
| 5 to 9 Year Old | 145 (91.8%) | 13 (8.2%) |
| 10 to 14 Year Olds | 336 (100.0%) | 0 (0.0%) |
| 15 to 17 Year Olds | 44 (100.0%) | 0 (0.0%) |
| 18 to 19 Year Olds | 32 (100.0%) | 0 (0.0%) |
| 20 to 24 Year Olds | 0 (0.0%) | 0 (0.0%) |
| 25 to 34 Year Olds | 136 (84.0%) | 26 (16.1%) |
| 35 Years and over | 45 (100.0%) | 0 (0.0%) |
| Total | 802 (89.2%) | 97 (10.8%) |
Educational Attainment by Field of Study in Madison
Business (292 | 19.9%), arts & humanities (258 | 17.5%), education (189 | 12.9%), psychology (115 | 7.8%), and engineering (103 | 7.0%) are the most common fields of study among 1,471 individuals in Madison who have obtained a bachelor's degree or higher.
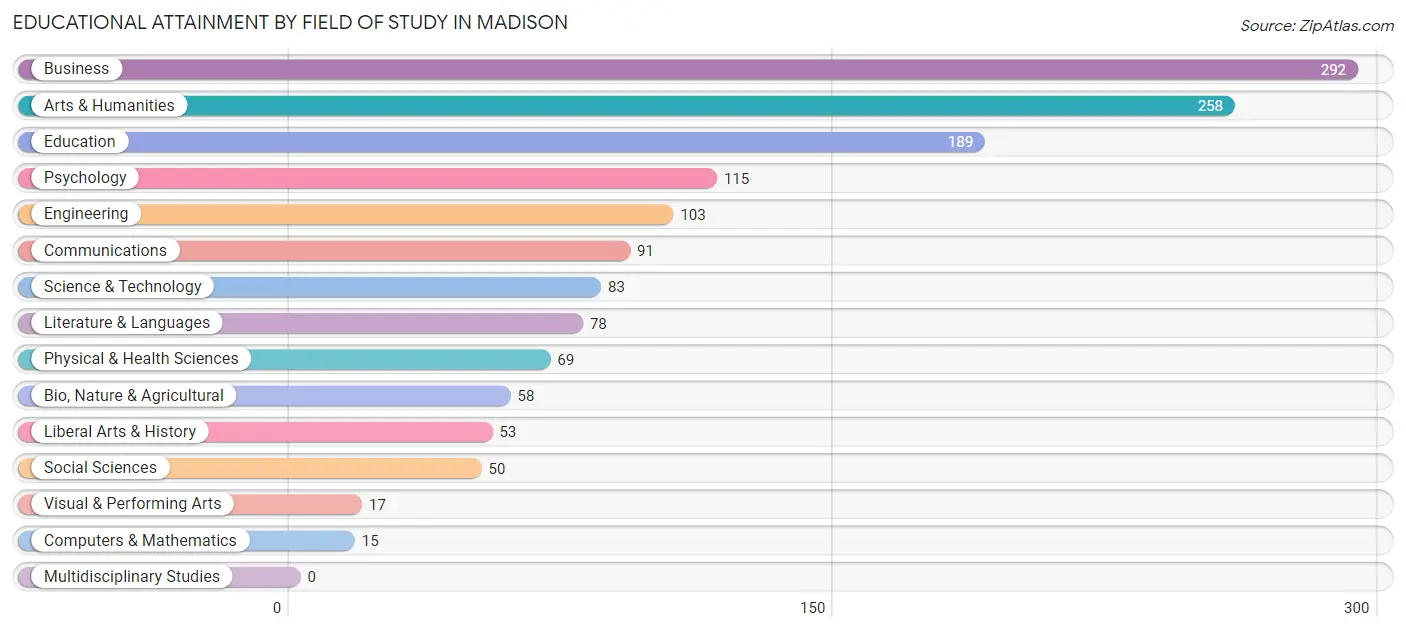
| Field of Study | # Graduates | % Graduates |
| Computers & Mathematics | 15 | 1.0% |
| Bio, Nature & Agricultural | 58 | 3.9% |
| Physical & Health Sciences | 69 | 4.7% |
| Psychology | 115 | 7.8% |
| Social Sciences | 50 | 3.4% |
| Engineering | 103 | 7.0% |
| Multidisciplinary Studies | 0 | 0.0% |
| Science & Technology | 83 | 5.6% |
| Business | 292 | 19.9% |
| Education | 189 | 12.9% |
| Literature & Languages | 78 | 5.3% |
| Liberal Arts & History | 53 | 3.6% |
| Visual & Performing Arts | 17 | 1.2% |
| Communications | 91 | 6.2% |
| Arts & Humanities | 258 | 17.5% |
| Total | 1,471 | 100.0% |
Transportation & Commute in Madison
Vehicle Availability by Sex in Madison
The most prevalent vehicle ownership categories in Madison are males with 2 vehicles (377, accounting for 43.9%) and females with 2 vehicles (561, making up 27.6%).
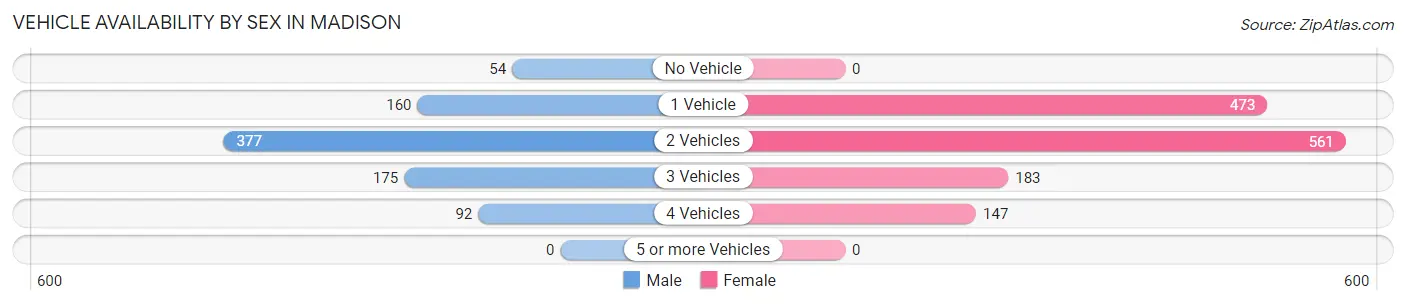
| Vehicles Available | Male | Female |
| No Vehicle | 54 (6.3%) | 0 (0.0%) |
| 1 Vehicle | 160 (18.6%) | 473 (34.7%) |
| 2 Vehicles | 377 (43.9%) | 561 (41.1%) |
| 3 Vehicles | 175 (20.4%) | 183 (13.4%) |
| 4 Vehicles | 92 (10.7%) | 147 (10.8%) |
| 5 or more Vehicles | 0 (0.0%) | 0 (0.0%) |
| Total | 858 (100.0%) | 1,364 (100.0%) |
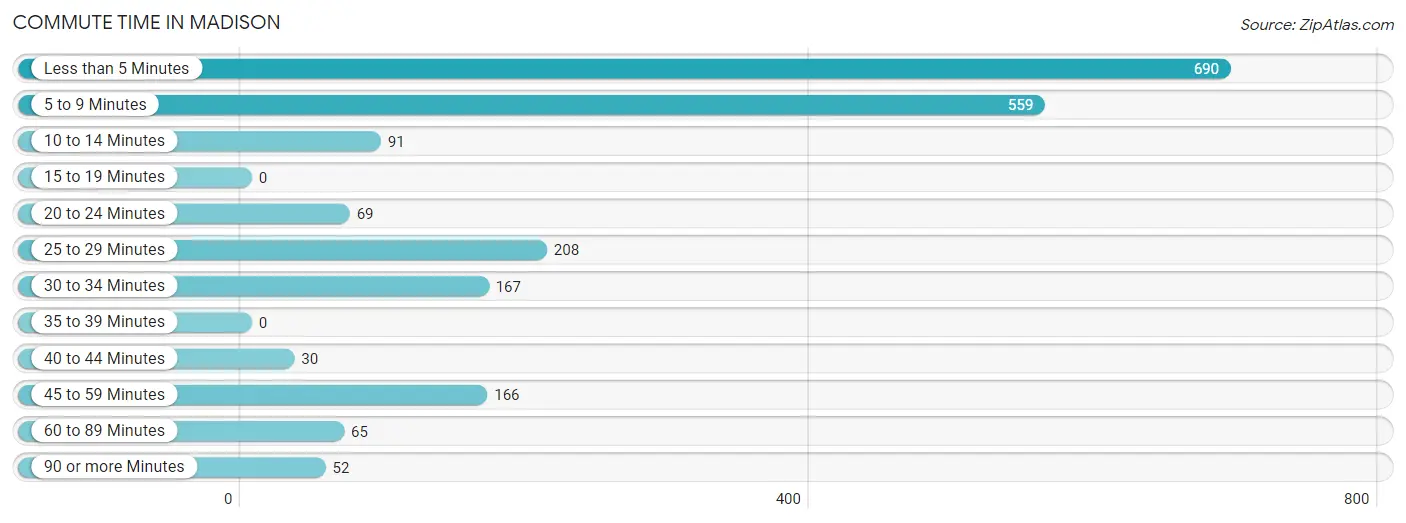
Commute Time in Madison
The most frequently occuring commute durations in Madison are less than 5 minutes (690 commuters, 32.9%), 5 to 9 minutes (559 commuters, 26.7%), and 25 to 29 minutes (208 commuters, 9.9%).
| Commute Time | # Commuters | % Commuters |
| Less than 5 Minutes | 690 | 32.9% |
| 5 to 9 Minutes | 559 | 26.7% |
| 10 to 14 Minutes | 91 | 4.3% |
| 15 to 19 Minutes | 0 | 0.0% |
| 20 to 24 Minutes | 69 | 3.3% |
| 25 to 29 Minutes | 208 | 9.9% |
| 30 to 34 Minutes | 167 | 8.0% |
| 35 to 39 Minutes | 0 | 0.0% |
| 40 to 44 Minutes | 30 | 1.4% |
| 45 to 59 Minutes | 166 | 7.9% |
| 60 to 89 Minutes | 65 | 3.1% |
| 90 or more Minutes | 52 | 2.5% |
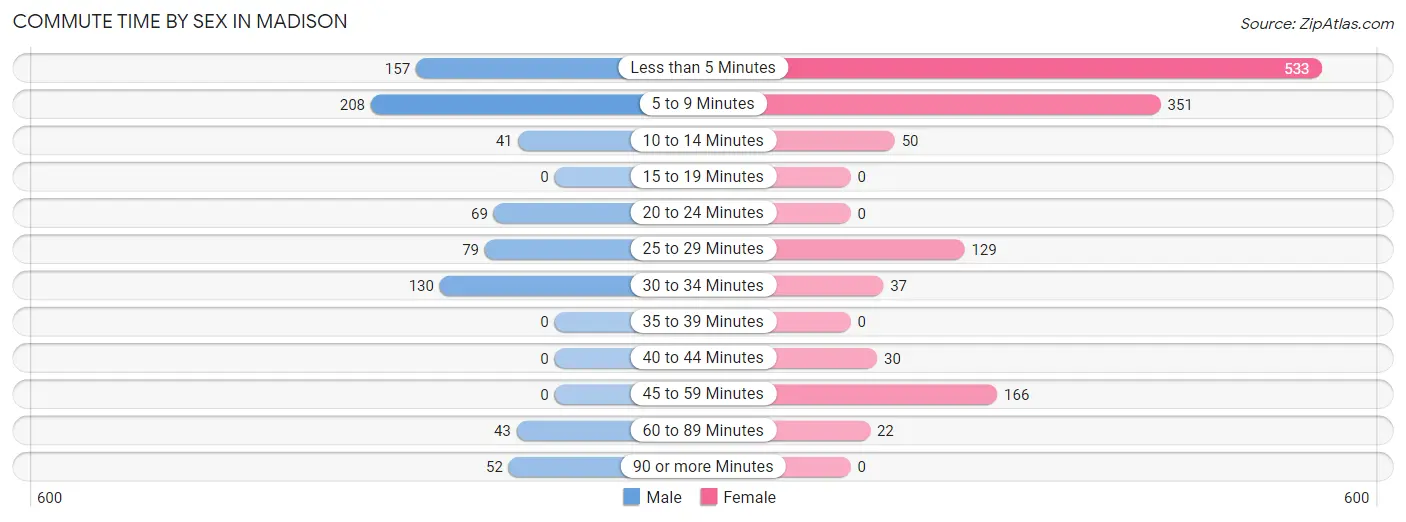
Commute Time by Sex in Madison
The most common commute times in Madison are 5 to 9 minutes (208 commuters, 26.7%) for males and less than 5 minutes (533 commuters, 40.4%) for females.
| Commute Time | Male | Female |
| Less than 5 Minutes | 157 (20.2%) | 533 (40.4%) |
| 5 to 9 Minutes | 208 (26.7%) | 351 (26.6%) |
| 10 to 14 Minutes | 41 (5.3%) | 50 (3.8%) |
| 15 to 19 Minutes | 0 (0.0%) | 0 (0.0%) |
| 20 to 24 Minutes | 69 (8.9%) | 0 (0.0%) |
| 25 to 29 Minutes | 79 (10.1%) | 129 (9.8%) |
| 30 to 34 Minutes | 130 (16.7%) | 37 (2.8%) |
| 35 to 39 Minutes | 0 (0.0%) | 0 (0.0%) |
| 40 to 44 Minutes | 0 (0.0%) | 30 (2.3%) |
| 45 to 59 Minutes | 0 (0.0%) | 166 (12.6%) |
| 60 to 89 Minutes | 43 (5.5%) | 22 (1.7%) |
| 90 or more Minutes | 52 (6.7%) | 0 (0.0%) |
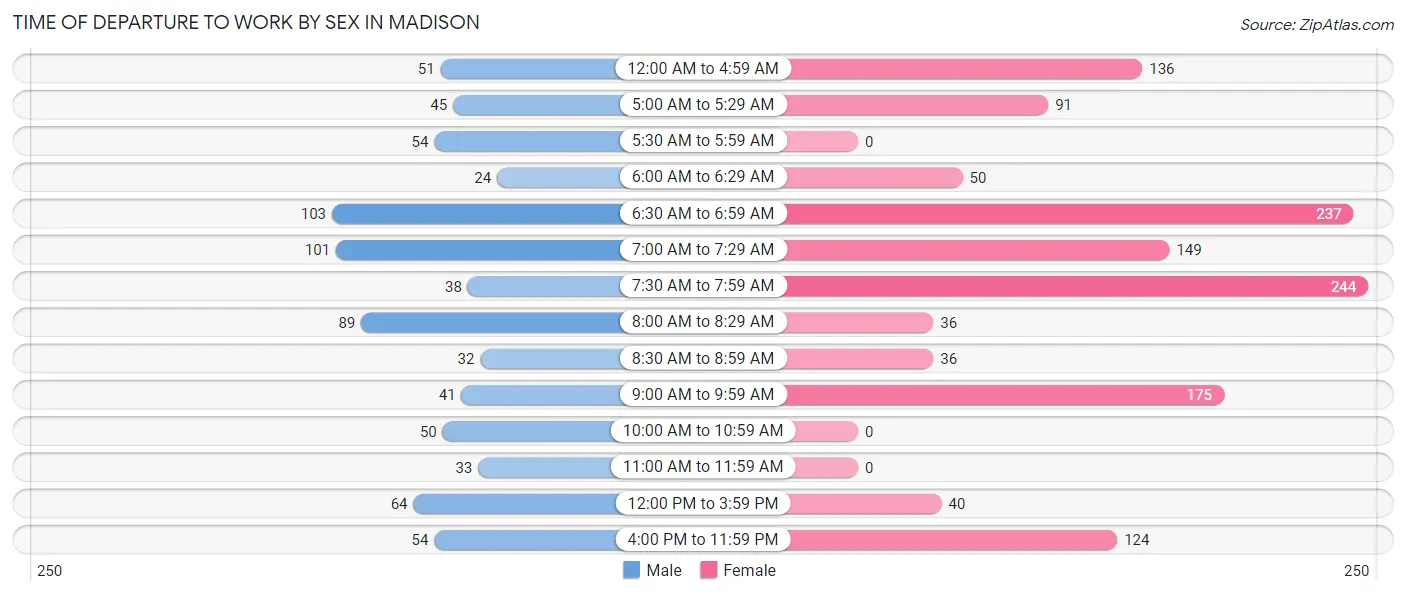
Time of Departure to Work by Sex in Madison
The most frequent times of departure to work in Madison are 6:30 AM to 6:59 AM (103, 13.2%) for males and 7:30 AM to 7:59 AM (244, 18.5%) for females.
| Time of Departure | Male | Female |
| 12:00 AM to 4:59 AM | 51 (6.6%) | 136 (10.3%) |
| 5:00 AM to 5:29 AM | 45 (5.8%) | 91 (6.9%) |
| 5:30 AM to 5:59 AM | 54 (6.9%) | 0 (0.0%) |
| 6:00 AM to 6:29 AM | 24 (3.1%) | 50 (3.8%) |
| 6:30 AM to 6:59 AM | 103 (13.2%) | 237 (18.0%) |
| 7:00 AM to 7:29 AM | 101 (13.0%) | 149 (11.3%) |
| 7:30 AM to 7:59 AM | 38 (4.9%) | 244 (18.5%) |
| 8:00 AM to 8:29 AM | 89 (11.4%) | 36 (2.7%) |
| 8:30 AM to 8:59 AM | 32 (4.1%) | 36 (2.7%) |
| 9:00 AM to 9:59 AM | 41 (5.3%) | 175 (13.3%) |
| 10:00 AM to 10:59 AM | 50 (6.4%) | 0 (0.0%) |
| 11:00 AM to 11:59 AM | 33 (4.2%) | 0 (0.0%) |
| 12:00 PM to 3:59 PM | 64 (8.2%) | 40 (3.0%) |
| 4:00 PM to 11:59 PM | 54 (6.9%) | 124 (9.4%) |
| Total | 779 (100.0%) | 1,318 (100.0%) |
Housing Occupancy in Madison
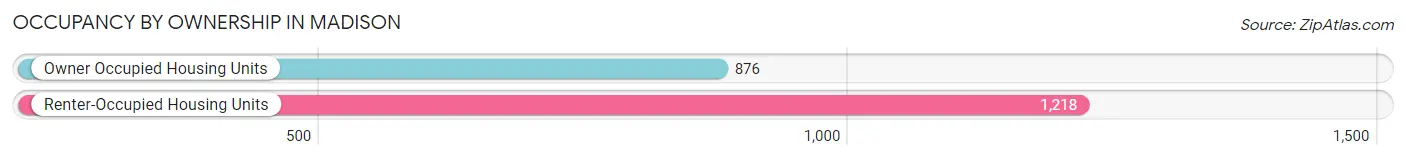
Occupancy by Ownership in Madison
Of the total 2,094 dwellings in Madison, owner-occupied units account for 876 (41.8%), while renter-occupied units make up 1,218 (58.2%).
| Occupancy | # Housing Units | % Housing Units |
| Owner Occupied Housing Units | 876 | 41.8% |
| Renter-Occupied Housing Units | 1,218 | 58.2% |
| Total Occupied Housing Units | 2,094 | 100.0% |
Occupancy by Household Size in Madison
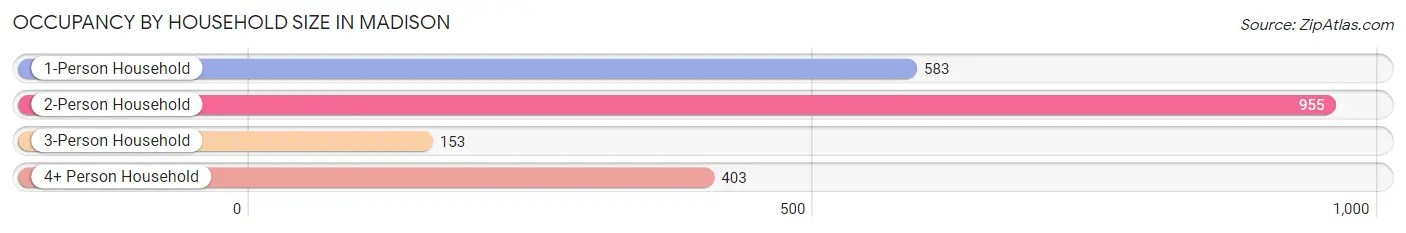
| Household Size | # Housing Units | % Housing Units |
| 1-Person Household | 583 | 27.8% |
| 2-Person Household | 955 | 45.6% |
| 3-Person Household | 153 | 7.3% |
| 4+ Person Household | 403 | 19.3% |
| Total Housing Units | 2,094 | 100.0% |
Occupancy by Ownership by Household Size in Madison
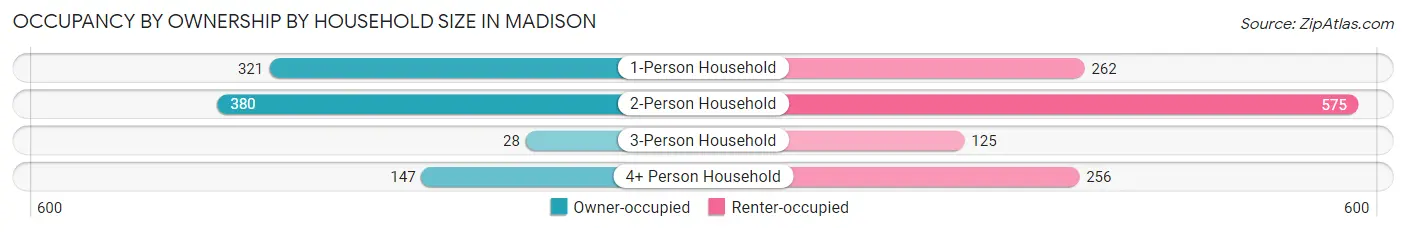
| Household Size | Owner-occupied | Renter-occupied |
| 1-Person Household | 321 (55.1%) | 262 (44.9%) |
| 2-Person Household | 380 (39.8%) | 575 (60.2%) |
| 3-Person Household | 28 (18.3%) | 125 (81.7%) |
| 4+ Person Household | 147 (36.5%) | 256 (63.5%) |
| Total Housing Units | 876 (41.8%) | 1,218 (58.2%) |
Occupancy by Educational Attainment in Madison
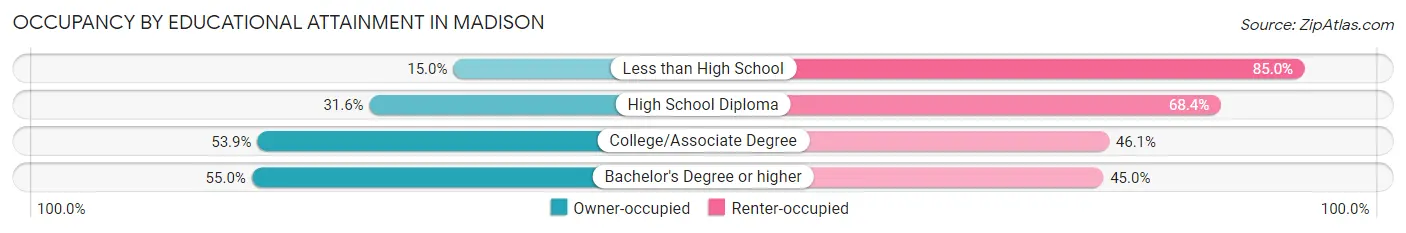
| Household Size | Owner-occupied | Renter-occupied |
| Less than High School | 42 (15.0%) | 238 (85.0%) |
| High School Diploma | 217 (31.6%) | 469 (68.4%) |
| College/Associate Degree | 153 (53.9%) | 131 (46.1%) |
| Bachelor's Degree or higher | 464 (55.0%) | 380 (45.0%) |
Occupancy by Age of Householder in Madison
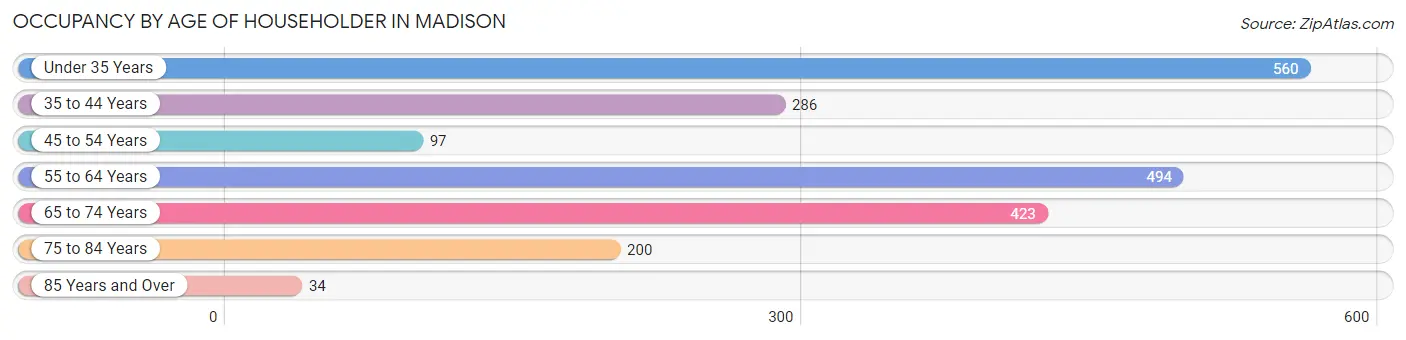
| Age Bracket | # Households | % Households |
| Under 35 Years | 560 | 26.7% |
| 35 to 44 Years | 286 | 13.7% |
| 45 to 54 Years | 97 | 4.6% |
| 55 to 64 Years | 494 | 23.6% |
| 65 to 74 Years | 423 | 20.2% |
| 75 to 84 Years | 200 | 9.6% |
| 85 Years and Over | 34 | 1.6% |
| Total | 2,094 | 100.0% |
Housing Finances in Madison
Median Income by Occupancy in Madison
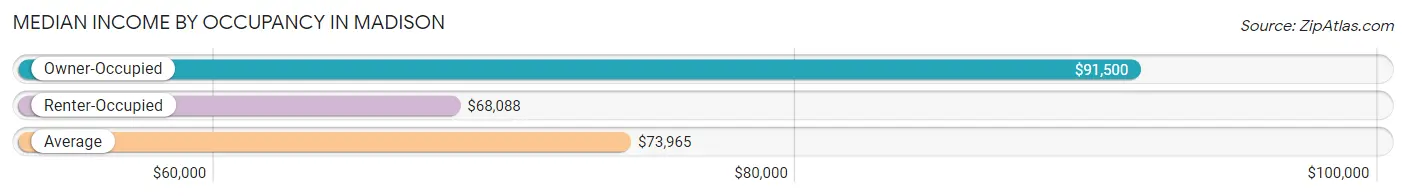
| Occupancy Type | # Households | Median Income |
| Owner-Occupied | 876 (41.8%) | $91,500 |
| Renter-Occupied | 1,218 (58.2%) | $68,088 |
| Average | 2,094 (100.0%) | $73,965 |
Occupancy by Householder Income Bracket in Madison
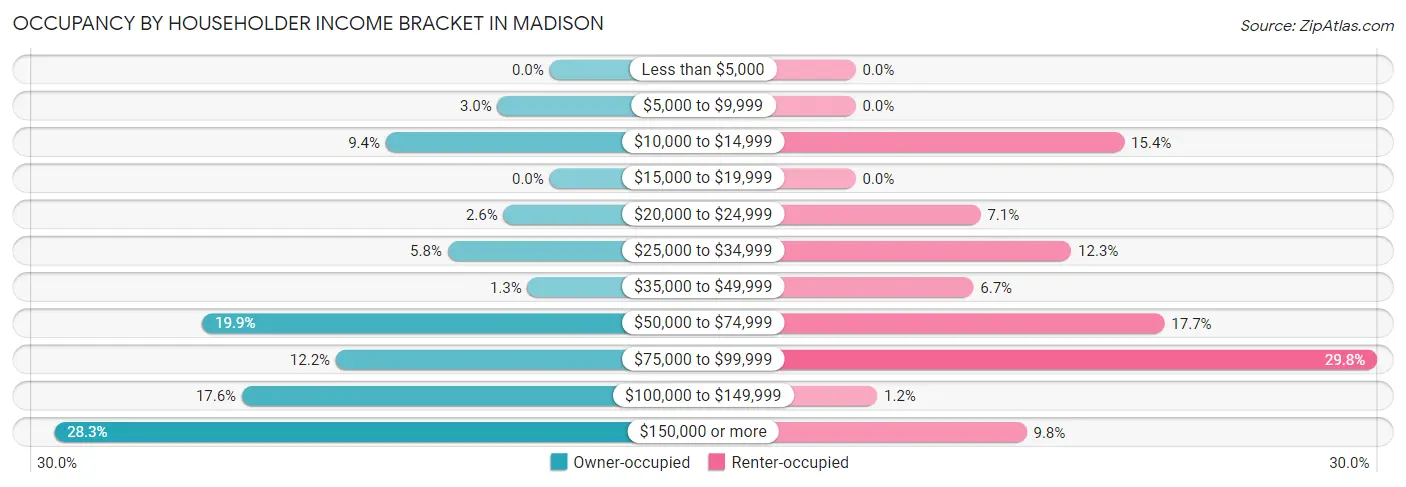
| Income Bracket | Owner-occupied | Renter-occupied |
| Less than $5,000 | 0 (0.0%) | 0 (0.0%) |
| $5,000 to $9,999 | 26 (3.0%) | 0 (0.0%) |
| $10,000 to $14,999 | 82 (9.4%) | 187 (15.3%) |
| $15,000 to $19,999 | 0 (0.0%) | 0 (0.0%) |
| $20,000 to $24,999 | 23 (2.6%) | 87 (7.1%) |
| $25,000 to $34,999 | 51 (5.8%) | 150 (12.3%) |
| $35,000 to $49,999 | 11 (1.3%) | 82 (6.7%) |
| $50,000 to $74,999 | 174 (19.9%) | 215 (17.6%) |
| $75,000 to $99,999 | 107 (12.2%) | 363 (29.8%) |
| $100,000 to $149,999 | 154 (17.6%) | 15 (1.2%) |
| $150,000 or more | 248 (28.3%) | 119 (9.8%) |
| Total | 876 (100.0%) | 1,218 (100.0%) |
Monthly Housing Cost Tiers in Madison
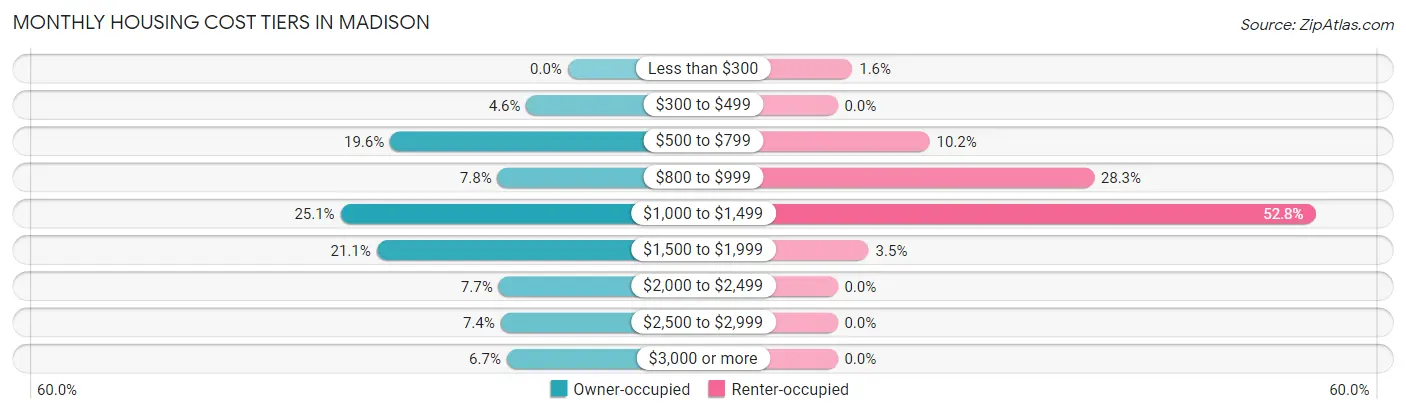
| Monthly Cost | Owner-occupied | Renter-occupied |
| Less than $300 | 0 (0.0%) | 20 (1.6%) |
| $300 to $499 | 40 (4.6%) | 0 (0.0%) |
| $500 to $799 | 172 (19.6%) | 124 (10.2%) |
| $800 to $999 | 68 (7.8%) | 345 (28.3%) |
| $1,000 to $1,499 | 220 (25.1%) | 643 (52.8%) |
| $1,500 to $1,999 | 185 (21.1%) | 42 (3.5%) |
| $2,000 to $2,499 | 67 (7.6%) | 0 (0.0%) |
| $2,500 to $2,999 | 65 (7.4%) | 0 (0.0%) |
| $3,000 or more | 59 (6.7%) | 0 (0.0%) |
| Total | 876 (100.0%) | 1,218 (100.0%) |
Physical Housing Characteristics in Madison
Housing Structures in Madison
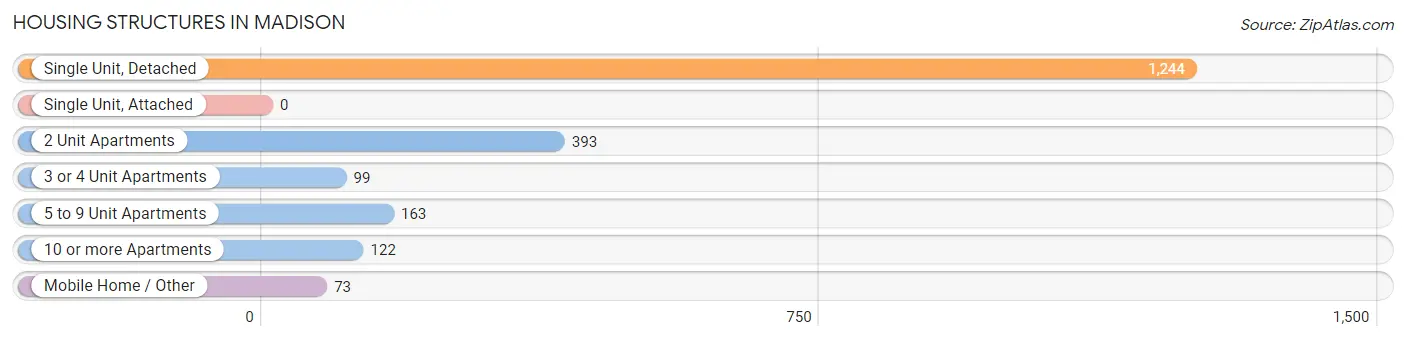
| Structure Type | # Housing Units | % Housing Units |
| Single Unit, Detached | 1,244 | 59.4% |
| Single Unit, Attached | 0 | 0.0% |
| 2 Unit Apartments | 393 | 18.8% |
| 3 or 4 Unit Apartments | 99 | 4.7% |
| 5 to 9 Unit Apartments | 163 | 7.8% |
| 10 or more Apartments | 122 | 5.8% |
| Mobile Home / Other | 73 | 3.5% |
| Total | 2,094 | 100.0% |
Housing Structures by Occupancy in Madison
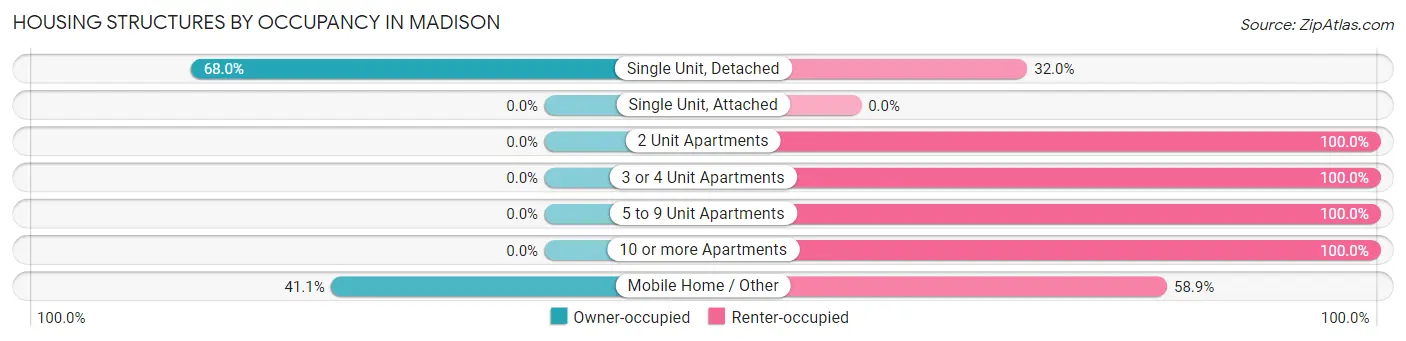
| Structure Type | Owner-occupied | Renter-occupied |
| Single Unit, Detached | 846 (68.0%) | 398 (32.0%) |
| Single Unit, Attached | 0 (0.0%) | 0 (0.0%) |
| 2 Unit Apartments | 0 (0.0%) | 393 (100.0%) |
| 3 or 4 Unit Apartments | 0 (0.0%) | 99 (100.0%) |
| 5 to 9 Unit Apartments | 0 (0.0%) | 163 (100.0%) |
| 10 or more Apartments | 0 (0.0%) | 122 (100.0%) |
| Mobile Home / Other | 30 (41.1%) | 43 (58.9%) |
| Total | 876 (41.8%) | 1,218 (58.2%) |
Housing Structures by Number of Rooms in Madison
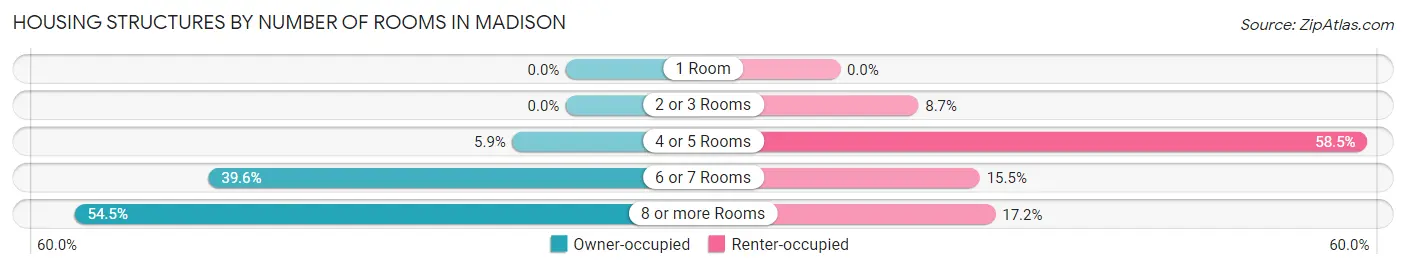
| Number of Rooms | Owner-occupied | Renter-occupied |
| 1 Room | 0 (0.0%) | 0 (0.0%) |
| 2 or 3 Rooms | 0 (0.0%) | 106 (8.7%) |
| 4 or 5 Rooms | 52 (5.9%) | 713 (58.5%) |
| 6 or 7 Rooms | 347 (39.6%) | 189 (15.5%) |
| 8 or more Rooms | 477 (54.4%) | 210 (17.2%) |
| Total | 876 (100.0%) | 1,218 (100.0%) |
Housing Structure by Heating Type in Madison
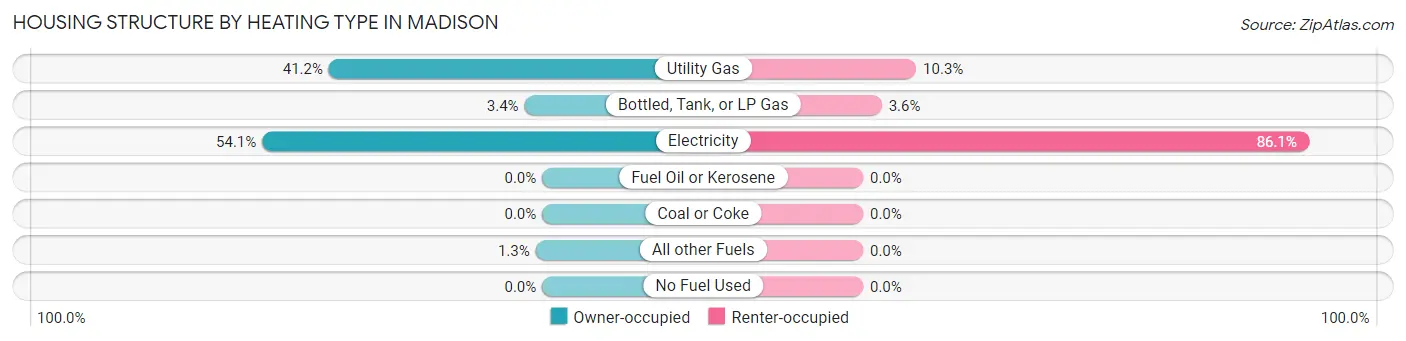
| Heating Type | Owner-occupied | Renter-occupied |
| Utility Gas | 361 (41.2%) | 125 (10.3%) |
| Bottled, Tank, or LP Gas | 30 (3.4%) | 44 (3.6%) |
| Electricity | 474 (54.1%) | 1,049 (86.1%) |
| Fuel Oil or Kerosene | 0 (0.0%) | 0 (0.0%) |
| Coal or Coke | 0 (0.0%) | 0 (0.0%) |
| All other Fuels | 11 (1.3%) | 0 (0.0%) |
| No Fuel Used | 0 (0.0%) | 0 (0.0%) |
| Total | 876 (100.0%) | 1,218 (100.0%) |
Household Vehicle Usage in Madison
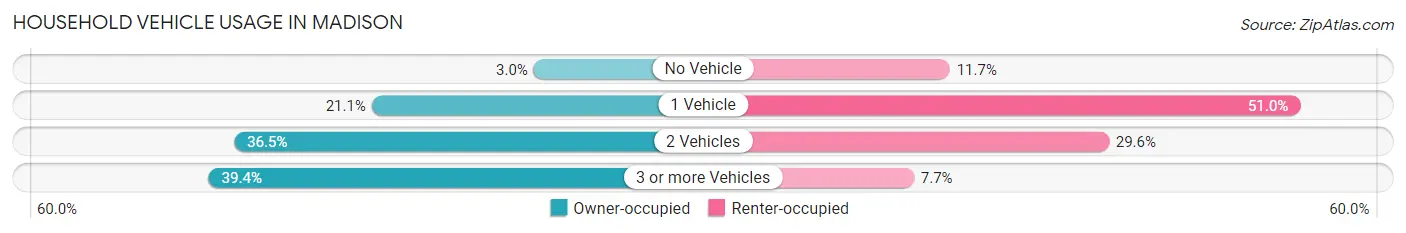
| Vehicles per Household | Owner-occupied | Renter-occupied |
| No Vehicle | 26 (3.0%) | 143 (11.7%) |
| 1 Vehicle | 185 (21.1%) | 621 (51.0%) |
| 2 Vehicles | 320 (36.5%) | 360 (29.6%) |
| 3 or more Vehicles | 345 (39.4%) | 94 (7.7%) |
| Total | 876 (100.0%) | 1,218 (100.0%) |
Real Estate & Mortgages in Madison
Real Estate and Mortgage Overview in Madison
| Characteristic | Without Mortgage | With Mortgage |
| Housing Units | 279 | 597 |
| Median Property Value | $297,000 | $234,500 |
| Median Household Income | $119,479 | $141 |
| Monthly Housing Costs | $733 | $59 |
| Real Estate Taxes | $3,736 | $0 |
Property Value by Mortgage Status in Madison
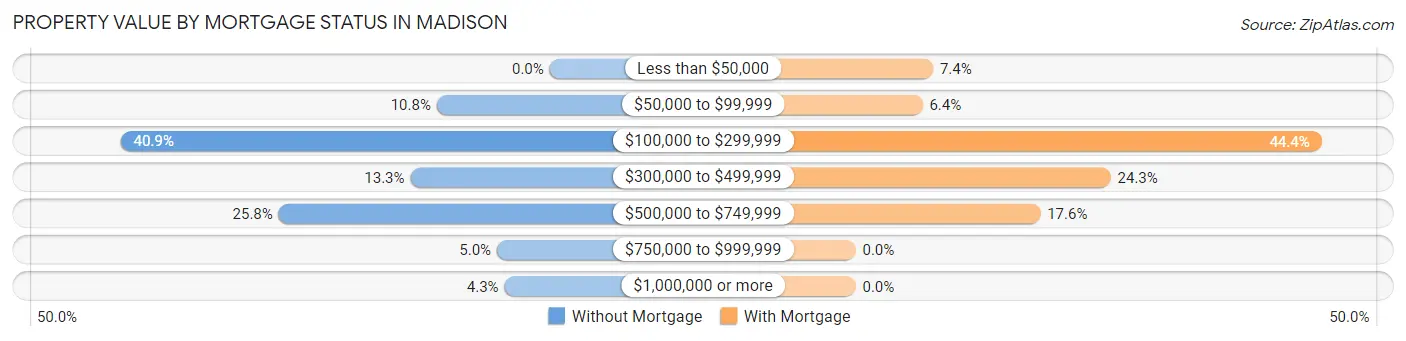
| Property Value | Without Mortgage | With Mortgage |
| Less than $50,000 | 0 (0.0%) | 44 (7.4%) |
| $50,000 to $99,999 | 30 (10.7%) | 38 (6.4%) |
| $100,000 to $299,999 | 114 (40.9%) | 265 (44.4%) |
| $300,000 to $499,999 | 37 (13.3%) | 145 (24.3%) |
| $500,000 to $749,999 | 72 (25.8%) | 105 (17.6%) |
| $750,000 to $999,999 | 14 (5.0%) | 0 (0.0%) |
| $1,000,000 or more | 12 (4.3%) | 0 (0.0%) |
| Total | 279 (100.0%) | 597 (100.0%) |
Household Income by Mortgage Status in Madison
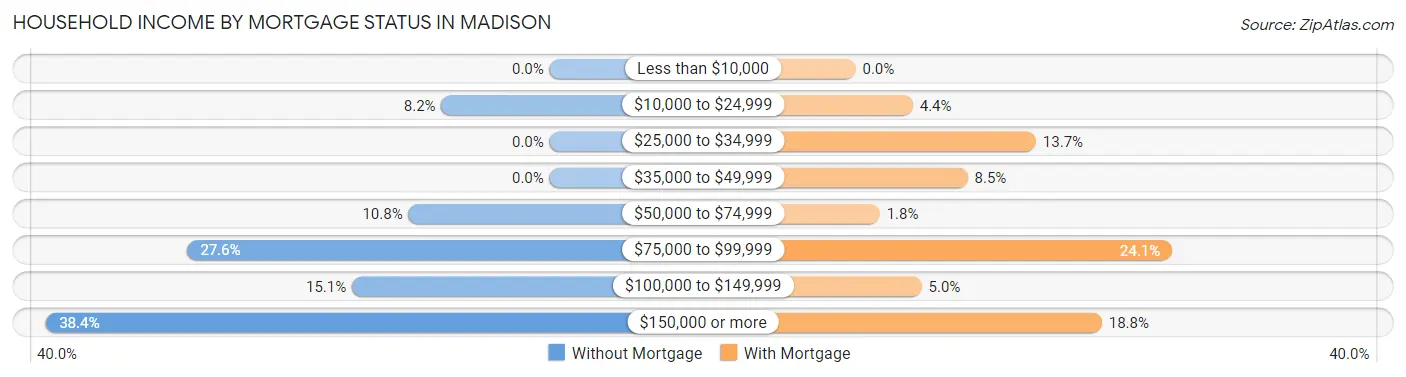
| Household Income | Without Mortgage | With Mortgage |
| Less than $10,000 | 0 (0.0%) | 0 (0.0%) |
| $10,000 to $24,999 | 23 (8.2%) | 26 (4.4%) |
| $25,000 to $34,999 | 0 (0.0%) | 82 (13.7%) |
| $35,000 to $49,999 | 0 (0.0%) | 51 (8.5%) |
| $50,000 to $74,999 | 30 (10.7%) | 11 (1.8%) |
| $75,000 to $99,999 | 77 (27.6%) | 144 (24.1%) |
| $100,000 to $149,999 | 42 (15.0%) | 30 (5.0%) |
| $150,000 or more | 107 (38.4%) | 112 (18.8%) |
| Total | 279 (100.0%) | 597 (100.0%) |
Property Value to Household Income Ratio in Madison
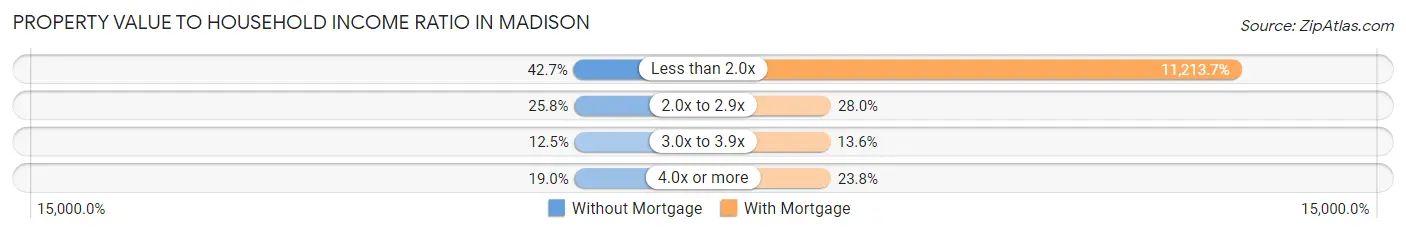
| Value-to-Income Ratio | Without Mortgage | With Mortgage |
| Less than 2.0x | 119 (42.6%) | 66,946 (11,213.7%) |
| 2.0x to 2.9x | 72 (25.8%) | 167 (28.0%) |
| 3.0x to 3.9x | 35 (12.5%) | 81 (13.6%) |
| 4.0x or more | 53 (19.0%) | 142 (23.8%) |
| Total | 279 (100.0%) | 597 (100.0%) |
Real Estate Taxes by Mortgage Status in Madison
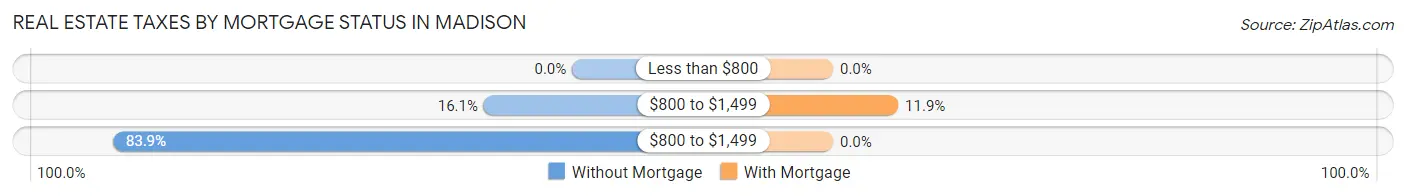
| Property Taxes | Without Mortgage | With Mortgage |
| Less than $800 | 0 (0.0%) | 0 (0.0%) |
| $800 to $1,499 | 45 (16.1%) | 71 (11.9%) |
| $800 to $1,499 | 234 (83.9%) | 0 (0.0%) |
| Total | 279 (100.0%) | 597 (100.0%) |
Health & Disability in Madison
Health Insurance Coverage by Age in Madison
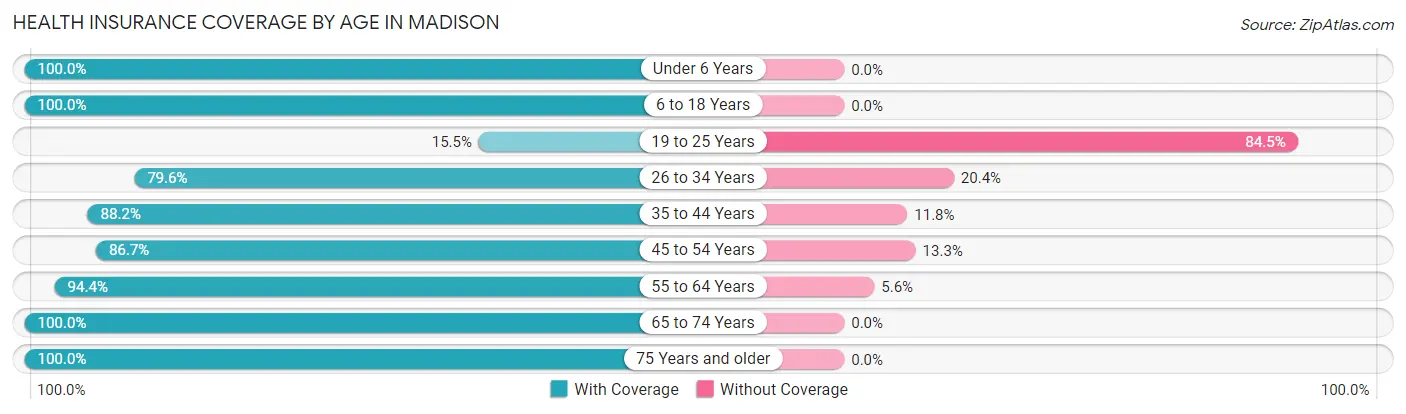
| Age Bracket | With Coverage | Without Coverage |
| Under 6 Years | 479 (100.0%) | 0 (0.0%) |
| 6 to 18 Years | 557 (100.0%) | 0 (0.0%) |
| 19 to 25 Years | 26 (15.5%) | 142 (84.5%) |
| 26 to 34 Years | 654 (79.6%) | 168 (20.4%) |
| 35 to 44 Years | 405 (88.2%) | 54 (11.8%) |
| 45 to 54 Years | 267 (86.7%) | 41 (13.3%) |
| 55 to 64 Years | 673 (94.4%) | 40 (5.6%) |
| 65 to 74 Years | 563 (100.0%) | 0 (0.0%) |
| 75 Years and older | 362 (100.0%) | 0 (0.0%) |
| Total | 3,986 (90.0%) | 445 (10.0%) |
Health Insurance Coverage by Citizenship Status in Madison
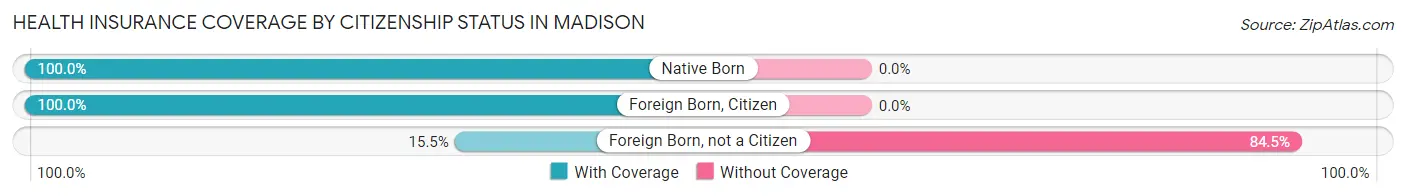
| Citizenship Status | With Coverage | Without Coverage |
| Native Born | 479 (100.0%) | 0 (0.0%) |
| Foreign Born, Citizen | 557 (100.0%) | 0 (0.0%) |
| Foreign Born, not a Citizen | 26 (15.5%) | 142 (84.5%) |
Health Insurance Coverage by Household Income in Madison
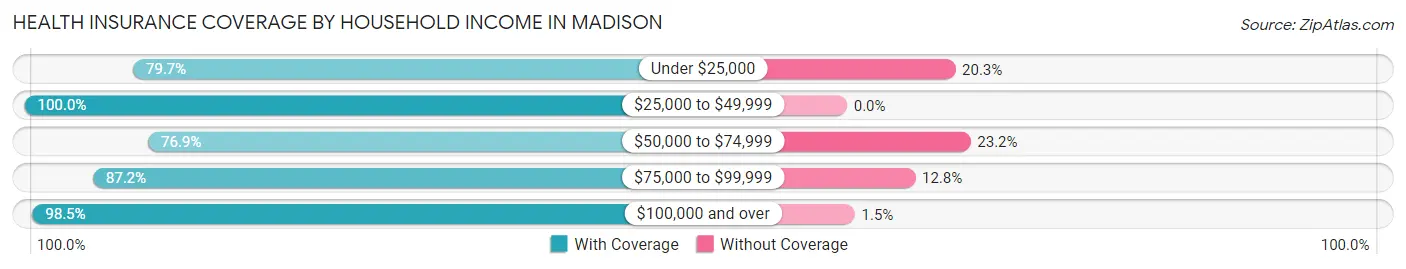
| Household Income | With Coverage | Without Coverage |
| Under $25,000 | 436 (79.7%) | 111 (20.3%) |
| $25,000 to $49,999 | 525 (100.0%) | 0 (0.0%) |
| $50,000 to $74,999 | 498 (76.8%) | 150 (23.2%) |
| $75,000 to $99,999 | 1,111 (87.2%) | 163 (12.8%) |
| $100,000 and over | 1,416 (98.5%) | 21 (1.5%) |
Public vs Private Health Insurance Coverage by Age in Madison
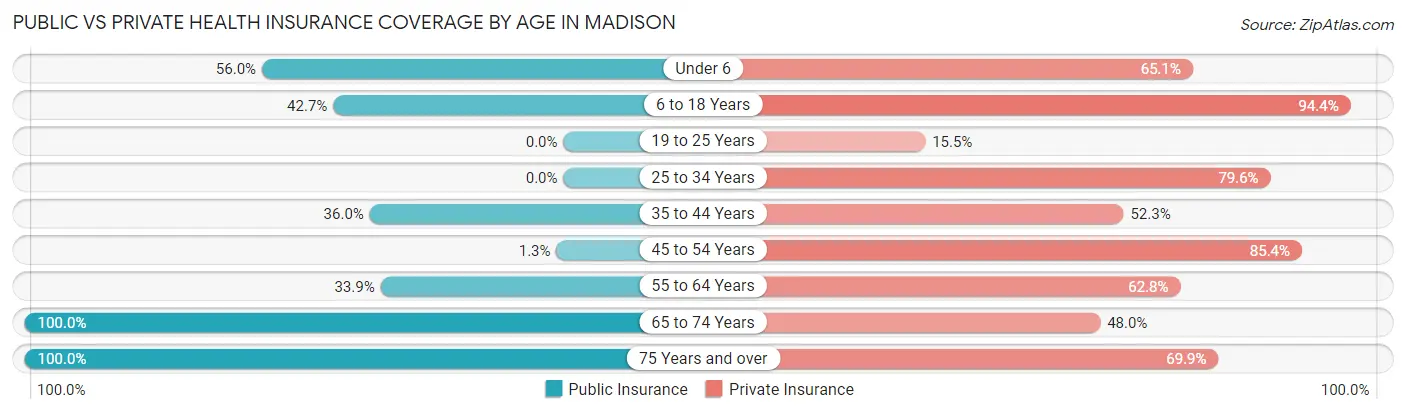
| Age Bracket | Public Insurance | Private Insurance |
| Under 6 | 268 (55.9%) | 312 (65.1%) |
| 6 to 18 Years | 238 (42.7%) | 526 (94.4%) |
| 19 to 25 Years | 0 (0.0%) | 26 (15.5%) |
| 25 to 34 Years | 0 (0.0%) | 654 (79.6%) |
| 35 to 44 Years | 165 (35.9%) | 240 (52.3%) |
| 45 to 54 Years | 4 (1.3%) | 263 (85.4%) |
| 55 to 64 Years | 242 (33.9%) | 448 (62.8%) |
| 65 to 74 Years | 563 (100.0%) | 270 (48.0%) |
| 75 Years and over | 362 (100.0%) | 253 (69.9%) |
| Total | 1,842 (41.6%) | 2,992 (67.5%) |
Disability Status by Sex by Age in Madison
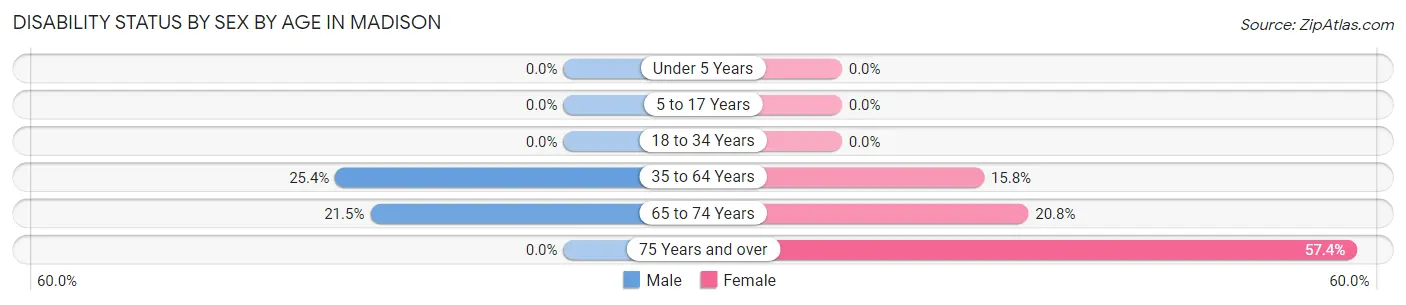
| Age Bracket | Male | Female |
| Under 5 Years | 0 (0.0%) | 0 (0.0%) |
| 5 to 17 Years | 0 (0.0%) | 0 (0.0%) |
| 18 to 34 Years | 0 (0.0%) | 0 (0.0%) |
| 35 to 64 Years | 124 (25.4%) | 157 (15.8%) |
| 65 to 74 Years | 60 (21.5%) | 59 (20.8%) |
| 75 Years and over | 0 (0.0%) | 171 (57.4%) |
Disability Class by Sex by Age in Madison
Disability Class: Hearing Difficulty
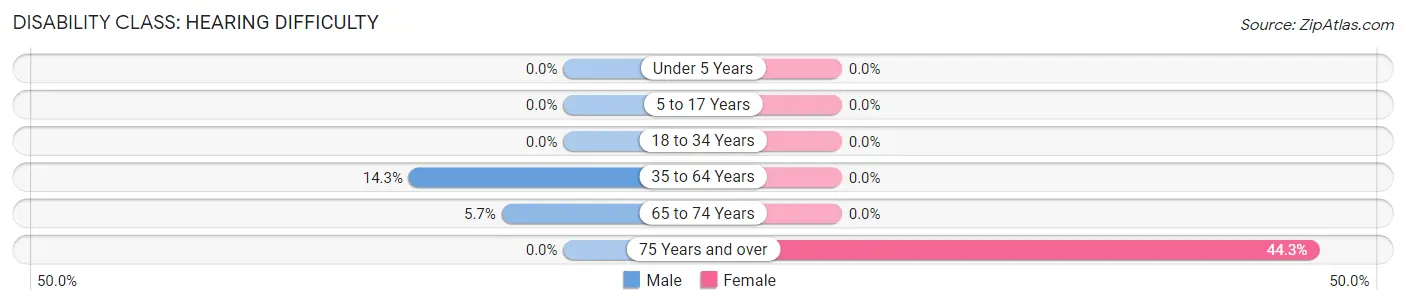
| Age Bracket | Male | Female |
| Under 5 Years | 0 (0.0%) | 0 (0.0%) |
| 5 to 17 Years | 0 (0.0%) | 0 (0.0%) |
| 18 to 34 Years | 0 (0.0%) | 0 (0.0%) |
| 35 to 64 Years | 70 (14.3%) | 0 (0.0%) |
| 65 to 74 Years | 16 (5.7%) | 0 (0.0%) |
| 75 Years and over | 0 (0.0%) | 132 (44.3%) |
Disability Class: Vision Difficulty
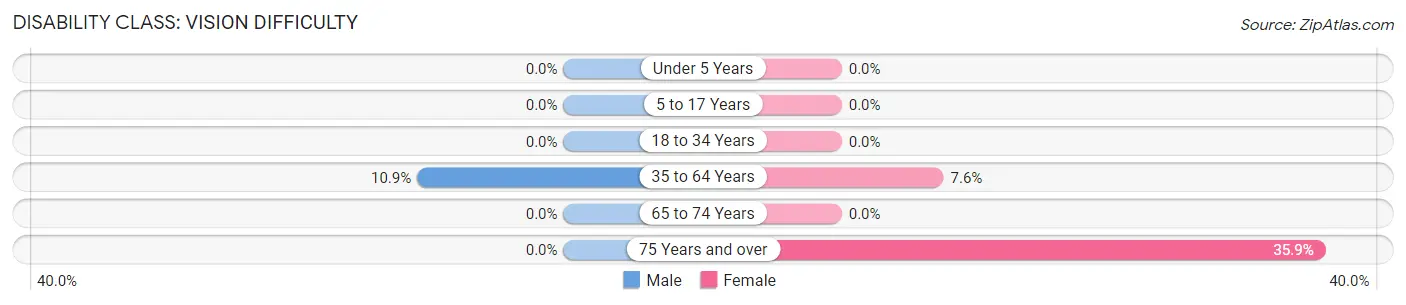
| Age Bracket | Male | Female |
| Under 5 Years | 0 (0.0%) | 0 (0.0%) |
| 5 to 17 Years | 0 (0.0%) | 0 (0.0%) |
| 18 to 34 Years | 0 (0.0%) | 0 (0.0%) |
| 35 to 64 Years | 53 (10.9%) | 75 (7.6%) |
| 65 to 74 Years | 0 (0.0%) | 0 (0.0%) |
| 75 Years and over | 0 (0.0%) | 107 (35.9%) |
Disability Class: Cognitive Difficulty
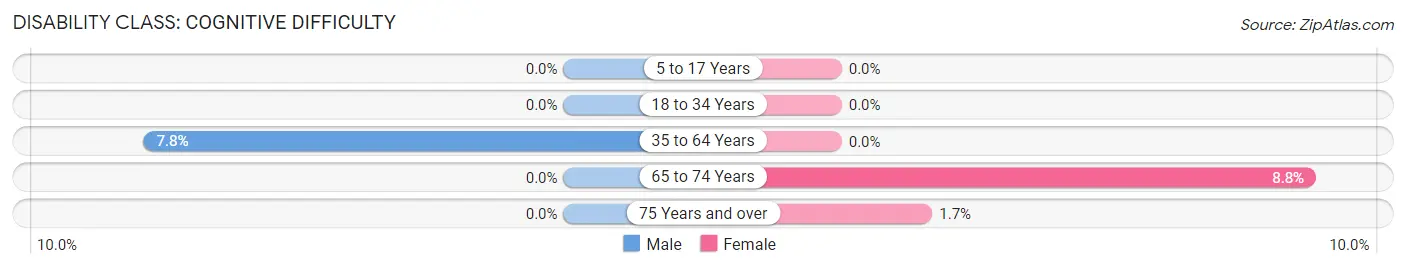
| Age Bracket | Male | Female |
| 5 to 17 Years | 0 (0.0%) | 0 (0.0%) |
| 18 to 34 Years | 0 (0.0%) | 0 (0.0%) |
| 35 to 64 Years | 38 (7.8%) | 0 (0.0%) |
| 65 to 74 Years | 0 (0.0%) | 25 (8.8%) |
| 75 Years and over | 0 (0.0%) | 5 (1.7%) |
Disability Class: Ambulatory Difficulty
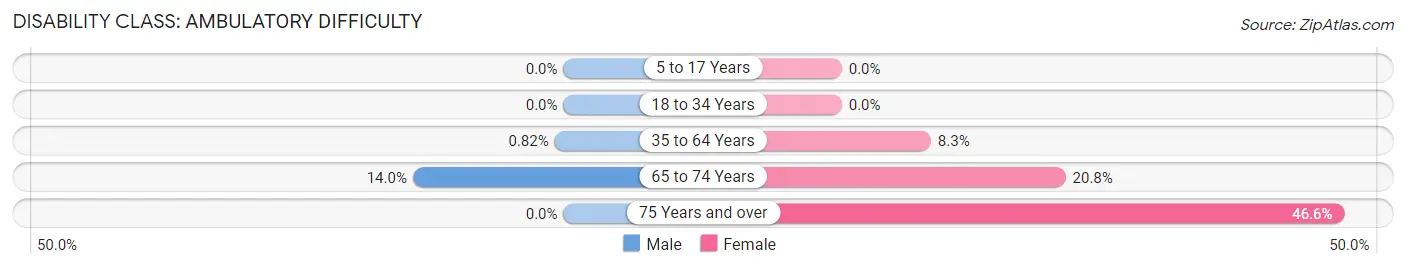
| Age Bracket | Male | Female |
| 5 to 17 Years | 0 (0.0%) | 0 (0.0%) |
| 18 to 34 Years | 0 (0.0%) | 0 (0.0%) |
| 35 to 64 Years | 4 (0.8%) | 82 (8.3%) |
| 65 to 74 Years | 39 (14.0%) | 59 (20.8%) |
| 75 Years and over | 0 (0.0%) | 139 (46.6%) |
Disability Class: Self-Care Difficulty
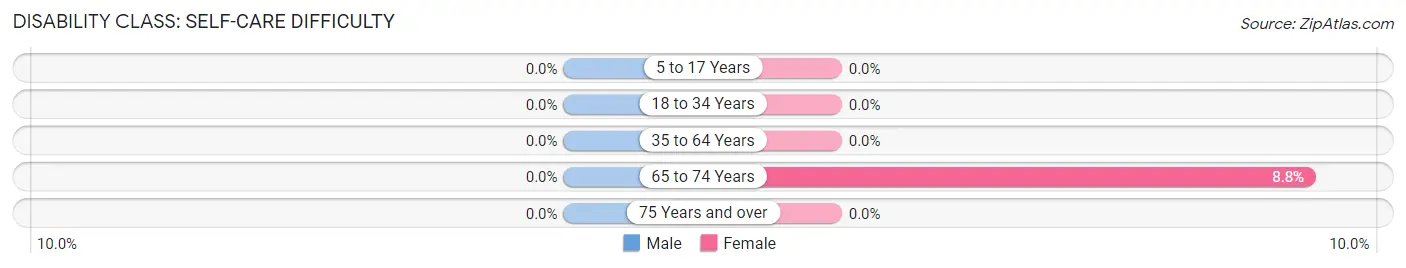
| Age Bracket | Male | Female |
| 5 to 17 Years | 0 (0.0%) | 0 (0.0%) |
| 18 to 34 Years | 0 (0.0%) | 0 (0.0%) |
| 35 to 64 Years | 0 (0.0%) | 0 (0.0%) |
| 65 to 74 Years | 0 (0.0%) | 25 (8.8%) |
| 75 Years and over | 0 (0.0%) | 0 (0.0%) |
Technology Access in Madison
Computing Device Access in Madison
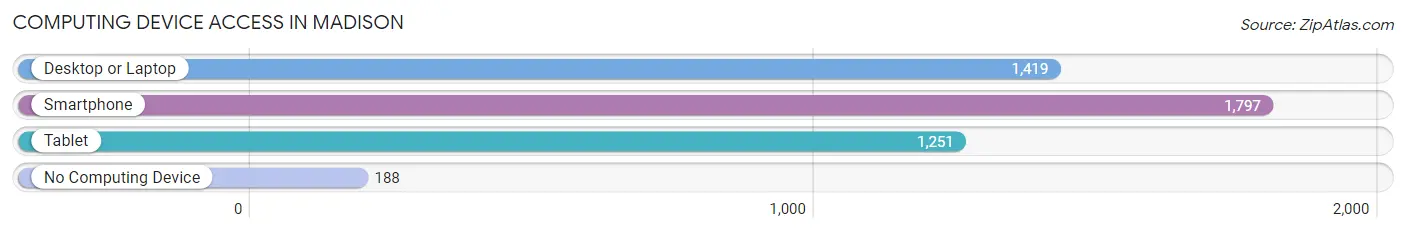
| Device Type | # Households | % Households |
| Desktop or Laptop | 1,419 | 67.8% |
| Smartphone | 1,797 | 85.8% |
| Tablet | 1,251 | 59.7% |
| No Computing Device | 188 | 9.0% |
| Total | 2,094 | 100.0% |
Internet Access in Madison
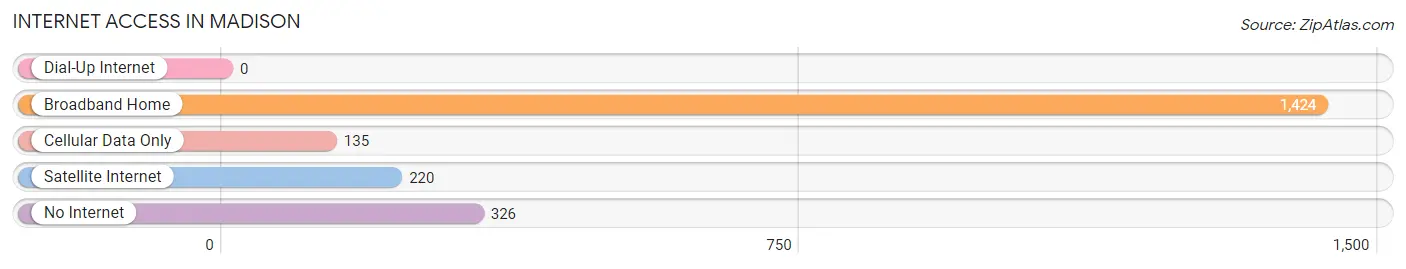
| Internet Type | # Households | % Households |
| Dial-Up Internet | 0 | 0.0% |
| Broadband Home | 1,424 | 68.0% |
| Cellular Data Only | 135 | 6.5% |
| Satellite Internet | 220 | 10.5% |
| No Internet | 326 | 15.6% |
| Total | 2,094 | 100.0% |
Madison Summary
Madison, Georgia is a small city located in the northeastern part of the state, about 70 miles east of Atlanta. It is the county seat of Morgan County and is part of the Athens-Clarke County Metropolitan Statistical Area. The city has a population of approximately 4,000 people and is known for its historic downtown area, which is listed on the National Register of Historic Places.
Geography
Madison is located in the Piedmont region of Georgia, in the foothills of the Appalachian Mountains. The city is situated on the banks of the Oconee River, which flows through the city and provides a scenic backdrop. The city is surrounded by rolling hills and forests, and is home to several parks and recreational areas.
The city has a total area of 4.2 square miles, of which 4.1 square miles is land and 0.1 square miles is water. The city is located at an elevation of 830 feet above sea level.
Economy
Madison’s economy is largely based on agriculture and manufacturing. The city is home to several large farms, which produce a variety of crops, including cotton, corn, soybeans, and peanuts. The city is also home to several manufacturing companies, including a paper mill, a furniture factory, and a plastics plant.
The city is also home to several small businesses, including restaurants, retail stores, and professional services. The city is also home to several educational institutions, including a community college and a technical college.
Demographics
As of the 2010 census, Madison had a population of 4,073 people. The racial makeup of the city was 79.2% White, 17.3% African American, 0.3% Native American, 0.7% Asian, 0.1% Pacific Islander, 1.2% from other races, and 1.3% from two or more races. Hispanic or Latino of any race were 3.2% of the population.
The median income for a household in the city was $35,938, and the median income for a family was $45,938. The per capita income for the city was $19,938. About 17.3% of families and 20.2% of the population were below the poverty line, including 28.3% of those under age 18 and 11.2% of those age 65 or over.
Conclusion
Madison, Georgia is a small city located in the northeastern part of the state, about 70 miles east of Atlanta. It is the county seat of Morgan County and is part of the Athens-Clarke County Metropolitan Statistical Area. The city has a population of approximately 4,000 people and is known for its historic downtown area, which is listed on the National Register of Historic Places. The city’s economy is largely based on agriculture and manufacturing, and it is home to several small businesses, educational institutions, and recreational areas. The city has a diverse population, with a median income of $35,938 and a poverty rate of 17.3%.
Common Questions
What is Per Capita Income in Madison?
Per Capita income in Madison is $42,167.
What is the Median Family Income in Madison?
Median Family Income in Madison is $92,862.
What is the Median Household income in Madison?
Median Household Income in Madison is $73,965.
What is Inequality or Gini Index in Madison?
Inequality or Gini Index in Madison is 0.48.
What is the Total Population of Madison?
Total Population of Madison is 4,574.
What is the Total Male Population of Madison?
Total Male Population of Madison is 1,995.
What is the Total Female Population of Madison?
Total Female Population of Madison is 2,579.
What is the Ratio of Males per 100 Females in Madison?
There are 77.36 Males per 100 Females in Madison.
What is the Ratio of Females per 100 Males in Madison?
There are 129.27 Females per 100 Males in Madison.
What is the Median Population Age in Madison?
Median Population Age in Madison is 39.5 Years.
What is the Average Family Size in Madison
Average Family Size in Madison is 2.6 People.
What is the Average Household Size in Madison
Average Household Size in Madison is 2.1 People.
How Large is the Labor Force in Madison?
There are 2,241 People in the Labor Forcein in Madison.
What is the Percentage of People in the Labor Force in Madison?
62.0% of People are in the Labor Force in Madison.
What is the Unemployment Rate in Madison?
Unemployment Rate in Madison is 0.8%.