Snellville, GA Map & Demographics
Snellville Map
Snellville Overview
$34,609
PER CAPITA INCOME
$94,195
AVG FAMILY INCOME
$88,586
AVG HOUSEHOLD INCOME
7.3%
WAGE / INCOME GAP [ % ]
92.7¢/ $1
WAGE / INCOME GAP [ $ ]
0.35
INEQUALITY / GINI INDEX
20,895
TOTAL POPULATION
9,843
MALE POPULATION
11,052
FEMALE POPULATION
89.06
MALES / 100 FEMALES
112.28
FEMALES / 100 MALES
42.1
MEDIAN AGE
3.4
AVG FAMILY SIZE
3.0
AVG HOUSEHOLD SIZE
10,358
LABOR FORCE [ PEOPLE ]
60.6%
PERCENT IN LABOR FORCE
4.1%
UNEMPLOYMENT RATE
Income in Snellville
Income Overview in Snellville
Per Capita Income in Snellville is $34,609, while median incomes of families and households are $94,195 and $88,586 respectively.
| Characteristic | Number | Measure |
| Per Capita Income | 20,895 | $34,609 |
| Median Family Income | 5,294 | $94,195 |
| Mean Family Income | 5,294 | $110,160 |
| Median Household Income | 6,792 | $88,586 |
| Mean Household Income | 6,792 | $101,877 |
| Income Deficit | 5,294 | $0 |
| Wage / Income Gap (%) | 20,895 | 7.29% |
| Wage / Income Gap ($) | 20,895 | 92.71¢ per $1 |
| Gini / Inequality Index | 20,895 | 0.35 |
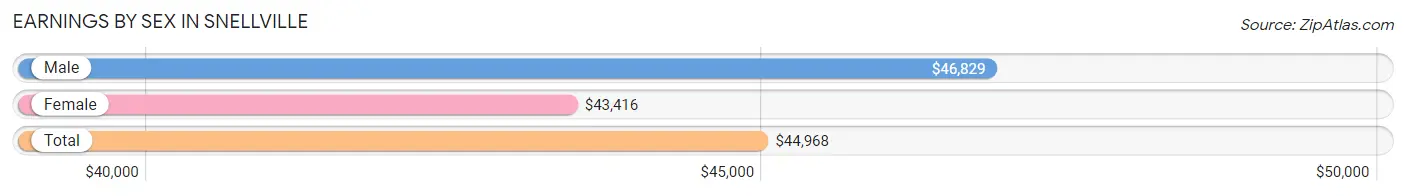
Earnings by Sex in Snellville
Average Earnings in Snellville are $44,968, $46,829 for men and $43,416 for women, a difference of 7.3%.
| Sex | Number | Average Earnings |
| Male | 5,535 (51.6%) | $46,829 |
| Female | 5,199 (48.4%) | $43,416 |
| Total | 10,734 (100.0%) | $44,968 |
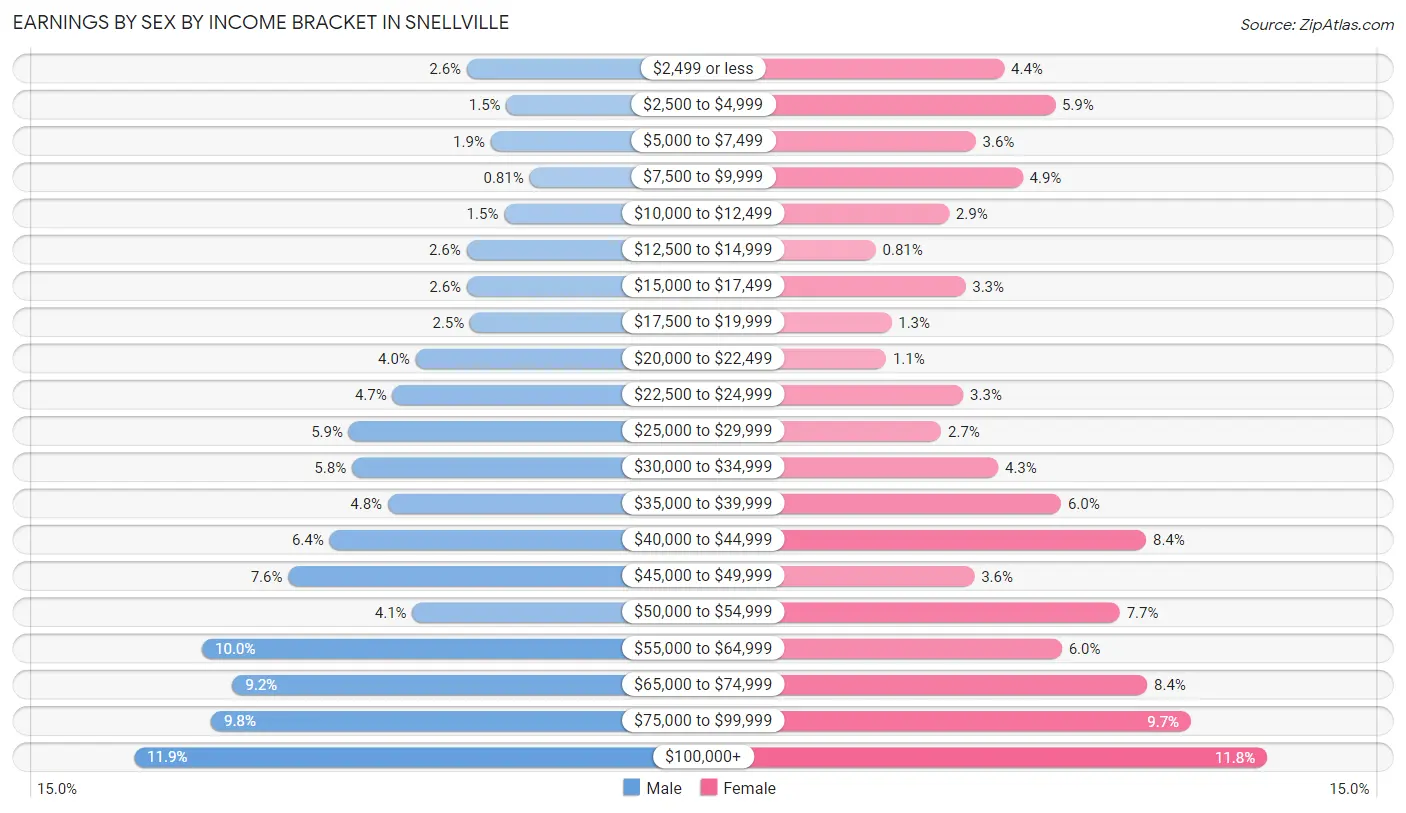
Earnings by Sex by Income Bracket in Snellville
The most common earnings brackets in Snellville are $100,000+ for men (660 | 11.9%) and $100,000+ for women (614 | 11.8%).
| Income | Male | Female |
| $2,499 or less | 142 (2.6%) | 230 (4.4%) |
| $2,500 to $4,999 | 81 (1.5%) | 304 (5.9%) |
| $5,000 to $7,499 | 105 (1.9%) | 188 (3.6%) |
| $7,500 to $9,999 | 45 (0.8%) | 257 (4.9%) |
| $10,000 to $12,499 | 84 (1.5%) | 149 (2.9%) |
| $12,500 to $14,999 | 143 (2.6%) | 42 (0.8%) |
| $15,000 to $17,499 | 142 (2.6%) | 173 (3.3%) |
| $17,500 to $19,999 | 137 (2.5%) | 65 (1.3%) |
| $20,000 to $22,499 | 222 (4.0%) | 57 (1.1%) |
| $22,500 to $24,999 | 258 (4.7%) | 170 (3.3%) |
| $25,000 to $29,999 | 326 (5.9%) | 138 (2.6%) |
| $30,000 to $34,999 | 321 (5.8%) | 221 (4.3%) |
| $35,000 to $39,999 | 265 (4.8%) | 313 (6.0%) |
| $40,000 to $44,999 | 356 (6.4%) | 437 (8.4%) |
| $45,000 to $49,999 | 420 (7.6%) | 186 (3.6%) |
| $50,000 to $54,999 | 227 (4.1%) | 399 (7.7%) |
| $55,000 to $64,999 | 554 (10.0%) | 314 (6.0%) |
| $65,000 to $74,999 | 507 (9.2%) | 439 (8.4%) |
| $75,000 to $99,999 | 540 (9.8%) | 503 (9.7%) |
| $100,000+ | 660 (11.9%) | 614 (11.8%) |
| Total | 5,535 (100.0%) | 5,199 (100.0%) |
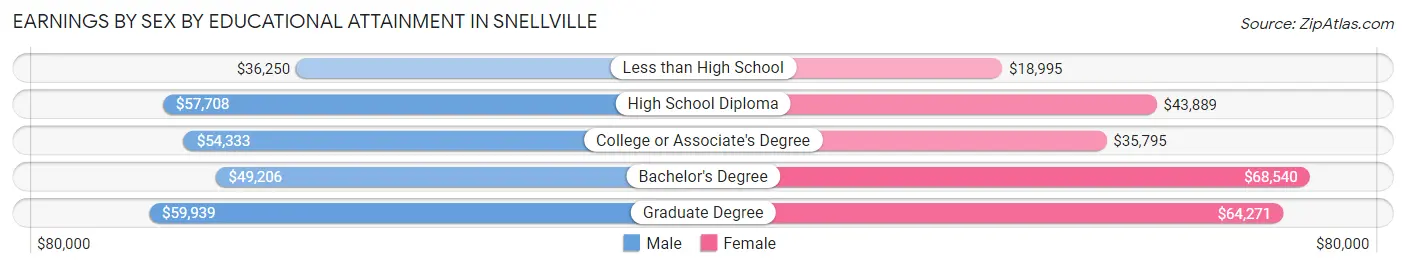
Earnings by Sex by Educational Attainment in Snellville
Average earnings in Snellville are $49,397 for men and $49,050 for women, a difference of 0.7%. Men with an educational attainment of graduate degree enjoy the highest average annual earnings of $59,939, while those with less than high school education earn the least with $36,250. Women with an educational attainment of bachelor's degree earn the most with the average annual earnings of $68,540, while those with less than high school education have the smallest earnings of $18,995.
| Educational Attainment | Male Income | Female Income |
| Less than High School | $36,250 | $18,995 |
| High School Diploma | $57,708 | $43,889 |
| College or Associate's Degree | $54,333 | $35,795 |
| Bachelor's Degree | $49,206 | $68,540 |
| Graduate Degree | $59,939 | $64,271 |
| Total | $49,397 | $49,050 |
Family Income in Snellville
Family Income Brackets in Snellville
According to the Snellville family income data, there are 1,292 families falling into the $100,000 to $149,999 income range, which is the most common income bracket and makes up 24.4% of all families. Conversely, the less than $10,000 income bracket is the least frequent group with only 58 families (1.1%) belonging to this category.
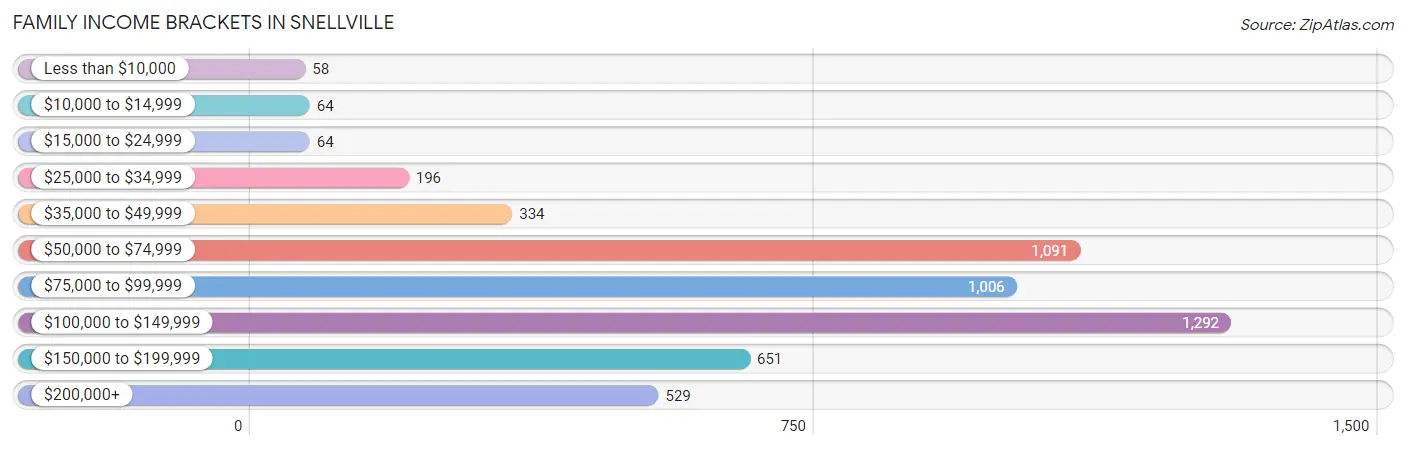
| Income Bracket | # Families | % Families |
| Less than $10,000 | 58 | 1.1% |
| $10,000 to $14,999 | 64 | 1.2% |
| $15,000 to $24,999 | 64 | 1.2% |
| $25,000 to $34,999 | 196 | 3.7% |
| $35,000 to $49,999 | 334 | 6.3% |
| $50,000 to $74,999 | 1,091 | 20.6% |
| $75,000 to $99,999 | 1,006 | 19.0% |
| $100,000 to $149,999 | 1,292 | 24.4% |
| $150,000 to $199,999 | 651 | 12.3% |
| $200,000+ | 529 | 10.0% |
Family Income by Famaliy Size in Snellville
6-person families (61 | 1.1%) account for the highest median family income in Snellville with $140,114 per family, while 2-person families (2,257 | 42.6%) have the highest median income of $49,488 per family member.
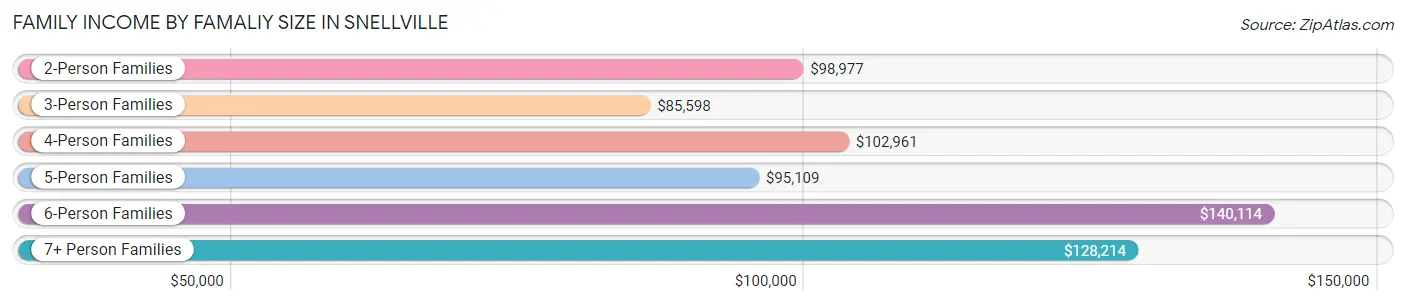
| Income Bracket | # Families | Median Income |
| 2-Person Families | 2,257 (42.6%) | $98,977 |
| 3-Person Families | 1,156 (21.8%) | $85,598 |
| 4-Person Families | 1,146 (21.6%) | $102,961 |
| 5-Person Families | 486 (9.2%) | $95,109 |
| 6-Person Families | 61 (1.1%) | $140,114 |
| 7+ Person Families | 188 (3.5%) | $128,214 |
| Total | 5,294 (100.0%) | $94,195 |
Family Income by Number of Earners in Snellville
The median family income in Snellville is $94,195, with families comprising 3+ earners (832) having the highest median family income of $148,750, while families with 1 earner (1,320) have the lowest median family income of $68,276, accounting for 15.7% and 24.9% of families, respectively.
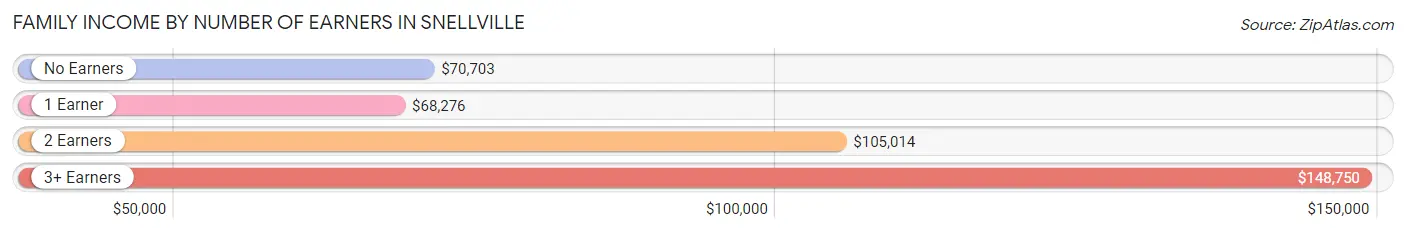
| Number of Earners | # Families | Median Income |
| No Earners | 723 (13.7%) | $70,703 |
| 1 Earner | 1,320 (24.9%) | $68,276 |
| 2 Earners | 2,419 (45.7%) | $105,014 |
| 3+ Earners | 832 (15.7%) | $148,750 |
| Total | 5,294 (100.0%) | $94,195 |
Household Income in Snellville
Household Income Brackets in Snellville
With 1,596 households falling in the category, the $100,000 to $149,999 income range is the most frequent in Snellville, accounting for 23.5% of all households. In contrast, only 122 households (1.8%) fall into the less than $10,000 income bracket, making it the least populous group.
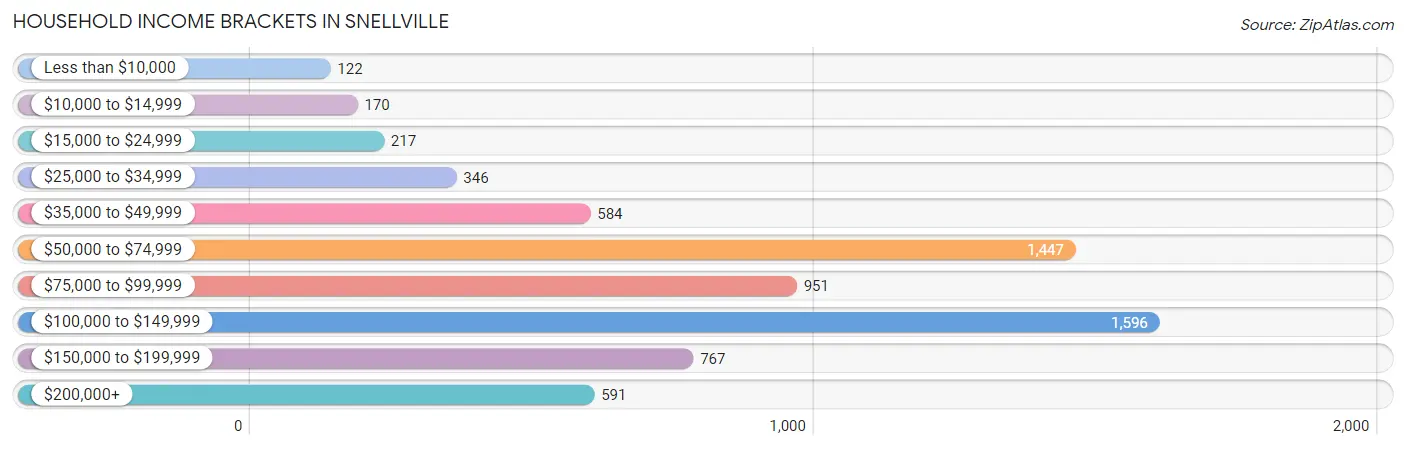
| Income Bracket | # Households | % Households |
| Less than $10,000 | 122 | 1.8% |
| $10,000 to $14,999 | 170 | 2.5% |
| $15,000 to $24,999 | 217 | 3.2% |
| $25,000 to $34,999 | 346 | 5.1% |
| $35,000 to $49,999 | 584 | 8.6% |
| $50,000 to $74,999 | 1,447 | 21.3% |
| $75,000 to $99,999 | 951 | 14.0% |
| $100,000 to $149,999 | 1,596 | 23.5% |
| $150,000 to $199,999 | 767 | 11.3% |
| $200,000+ | 591 | 8.7% |
Household Income by Householder Age in Snellville
The median household income in Snellville is $88,586, with the highest median household income of $105,288 found in the 45 to 64 years age bracket for the primary householder. A total of 3,063 households (45.1%) fall into this category. Meanwhile, the 15 to 24 years age bracket for the primary householder has the lowest median household income of $0, with 47 households (0.7%) in this group.
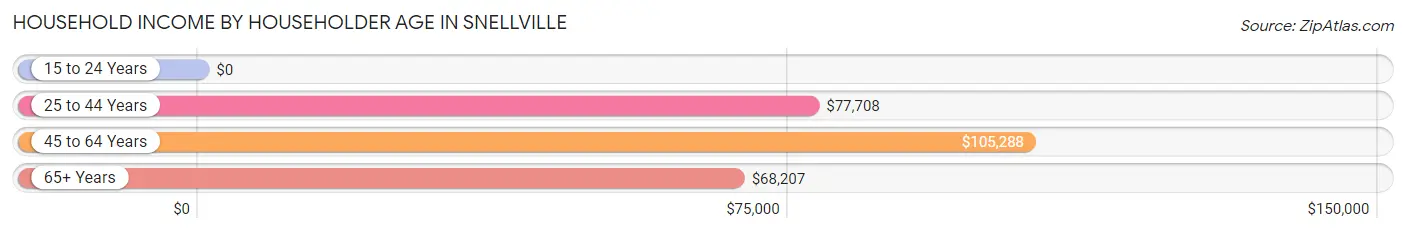
| Income Bracket | # Households | Median Income |
| 15 to 24 Years | 47 (0.7%) | $0 |
| 25 to 44 Years | 1,868 (27.5%) | $77,708 |
| 45 to 64 Years | 3,063 (45.1%) | $105,288 |
| 65+ Years | 1,814 (26.7%) | $68,207 |
| Total | 6,792 (100.0%) | $88,586 |
Poverty in Snellville
Income Below Poverty by Sex and Age in Snellville
With 4.6% poverty level for males and 8.2% for females among the residents of Snellville, 15 year old males and 18 to 24 year old females are the most vulnerable to poverty, with 32 males (26.7%) and 344 females (32.6%) in their respective age groups living below the poverty level.
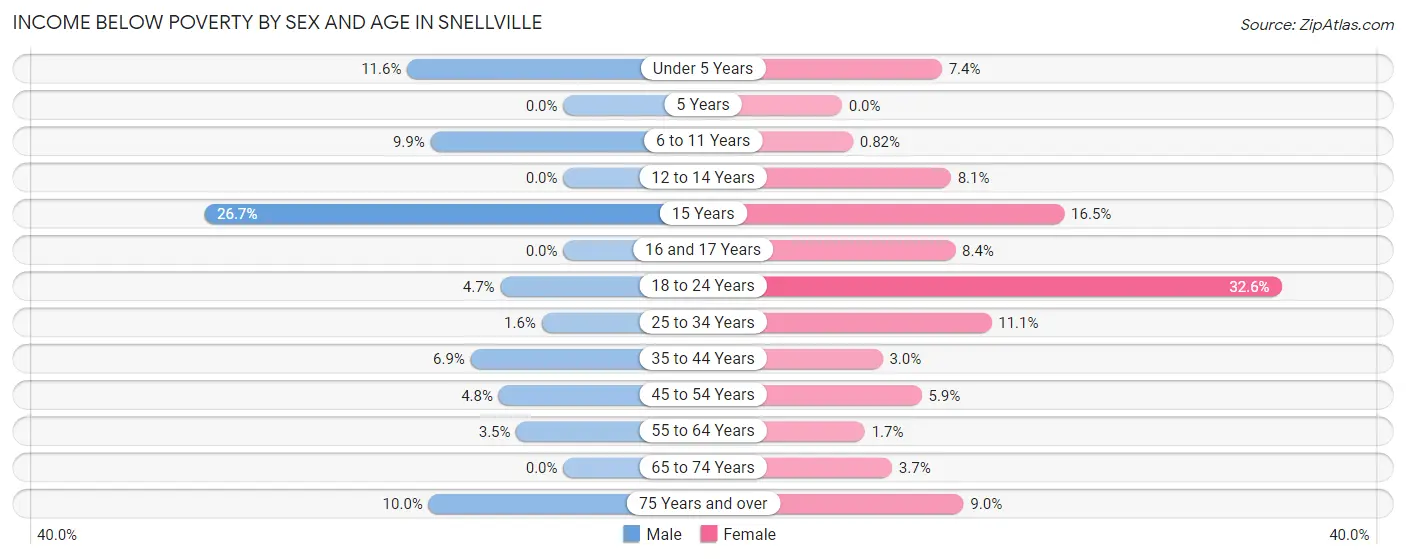
| Age Bracket | Male | Female |
| Under 5 Years | 32 (11.6%) | 32 (7.4%) |
| 5 Years | 0 (0.0%) | 0 (0.0%) |
| 6 to 11 Years | 75 (9.9%) | 8 (0.8%) |
| 12 to 14 Years | 0 (0.0%) | 33 (8.1%) |
| 15 Years | 32 (26.7%) | 35 (16.5%) |
| 16 and 17 Years | 0 (0.0%) | 27 (8.4%) |
| 18 to 24 Years | 28 (4.7%) | 344 (32.6%) |
| 25 to 34 Years | 27 (1.6%) | 125 (11.1%) |
| 35 to 44 Years | 79 (6.9%) | 35 (3.0%) |
| 45 to 54 Years | 62 (4.8%) | 88 (5.9%) |
| 55 to 64 Years | 54 (3.5%) | 27 (1.7%) |
| 65 to 74 Years | 0 (0.0%) | 34 (3.7%) |
| 75 Years and over | 55 (10.0%) | 95 (9.0%) |
| Total | 444 (4.6%) | 883 (8.2%) |
Income Above Poverty by Sex and Age in Snellville
According to the poverty statistics in Snellville, males aged 5 years and females aged 5 years are the age groups that are most secure financially, with 100.0% of males and 100.0% of females in these age groups living above the poverty line.
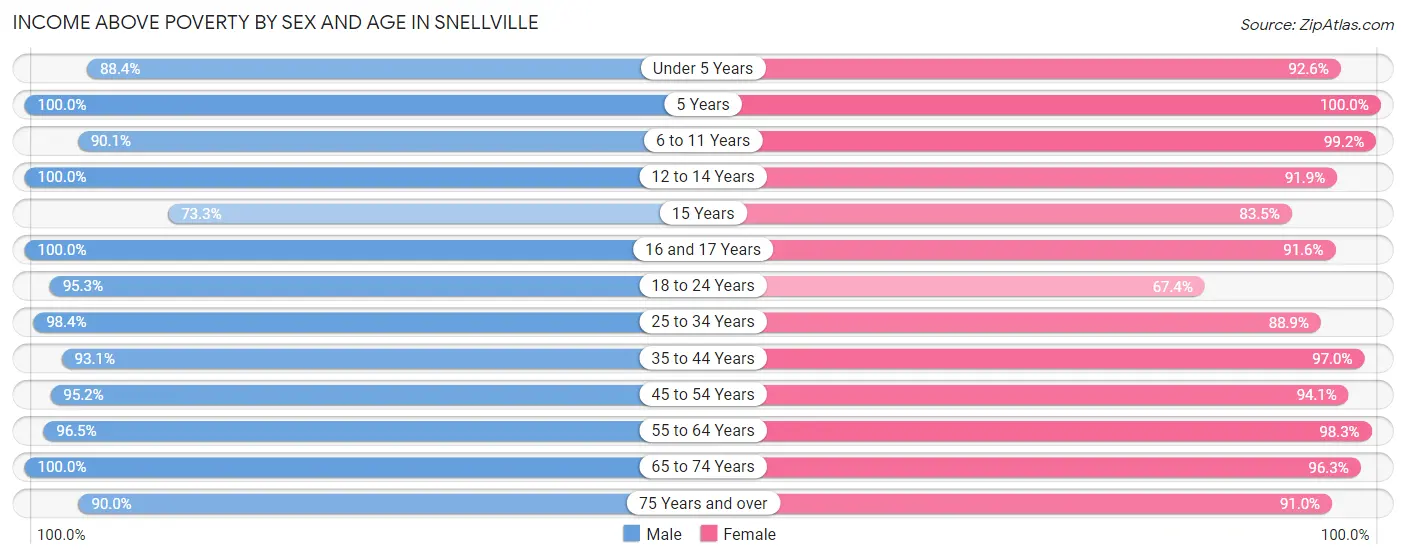
| Age Bracket | Male | Female |
| Under 5 Years | 244 (88.4%) | 399 (92.6%) |
| 5 Years | 148 (100.0%) | 98 (100.0%) |
| 6 to 11 Years | 686 (90.1%) | 969 (99.2%) |
| 12 to 14 Years | 291 (100.0%) | 375 (91.9%) |
| 15 Years | 88 (73.3%) | 177 (83.5%) |
| 16 and 17 Years | 375 (100.0%) | 294 (91.6%) |
| 18 to 24 Years | 571 (95.3%) | 710 (67.4%) |
| 25 to 34 Years | 1,652 (98.4%) | 1,001 (88.9%) |
| 35 to 44 Years | 1,070 (93.1%) | 1,125 (97.0%) |
| 45 to 54 Years | 1,232 (95.2%) | 1,399 (94.1%) |
| 55 to 64 Years | 1,494 (96.5%) | 1,559 (98.3%) |
| 65 to 74 Years | 859 (100.0%) | 880 (96.3%) |
| 75 Years and over | 495 (90.0%) | 957 (91.0%) |
| Total | 9,205 (95.4%) | 9,943 (91.8%) |
Income Below Poverty Among Married-Couple Families in Snellville
The poverty statistics for married-couple families in Snellville show that 2.2% or 93 of the total 4,223 families live below the poverty line. Families with 1 or 2 children have the highest poverty rate of 4.8%, comprising of 69 families. On the other hand, families with 3 or 4 children have the lowest poverty rate of 0.0%, which includes 0 families.
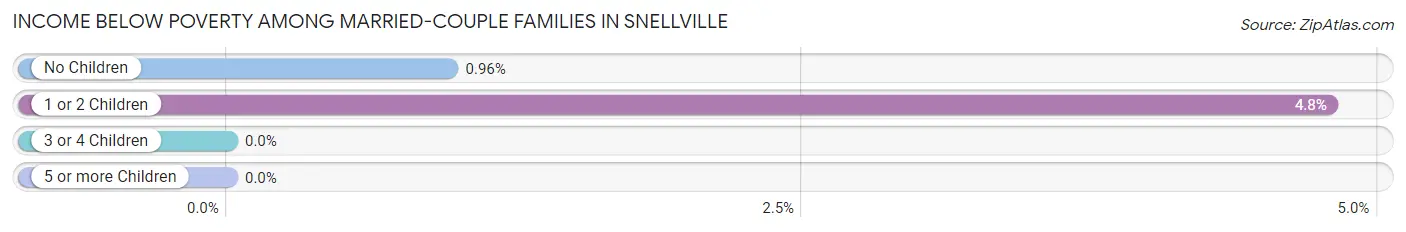
| Children | Above Poverty | Below Poverty |
| No Children | 2,477 (99.0%) | 24 (1.0%) |
| 1 or 2 Children | 1,370 (95.2%) | 69 (4.8%) |
| 3 or 4 Children | 283 (100.0%) | 0 (0.0%) |
| 5 or more Children | 0 (0.0%) | 0 (0.0%) |
| Total | 4,130 (97.8%) | 93 (2.2%) |
Income Below Poverty Among Single-Parent Households in Snellville
According to the poverty data in Snellville, 17.7% or 38 single-father households and 4.0% or 34 single-mother households are living below the poverty line. Among single-father households, those with 1 or 2 children have the highest poverty rate, with 38 households (26.0%) experiencing poverty. Likewise, among single-mother households, those with 3 or 4 children have the highest poverty rate, with 25 households (75.8%) falling below the poverty line.
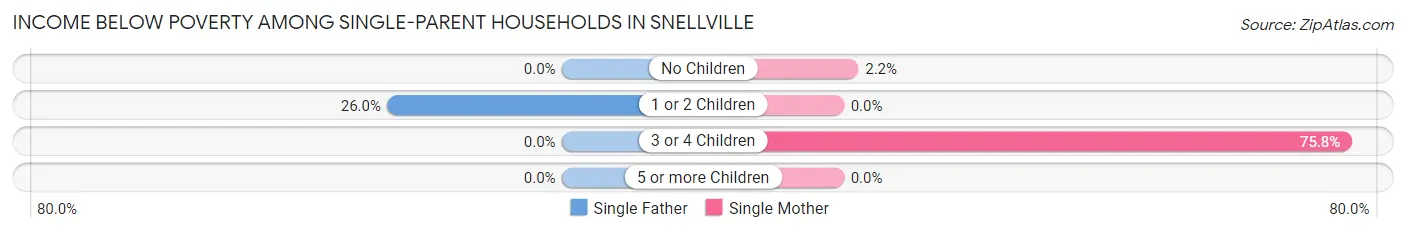
| Children | Single Father | Single Mother |
| No Children | 0 (0.0%) | 9 (2.2%) |
| 1 or 2 Children | 38 (26.0%) | 0 (0.0%) |
| 3 or 4 Children | 0 (0.0%) | 25 (75.8%) |
| 5 or more Children | 0 (0.0%) | 0 (0.0%) |
| Total | 38 (17.7%) | 34 (4.0%) |
Income Below Poverty Among Married-Couple vs Single-Parent Households in Snellville
The poverty data for Snellville shows that 93 of the married-couple family households (2.2%) and 72 of the single-parent households (6.7%) are living below the poverty level. Within the married-couple family households, those with 1 or 2 children have the highest poverty rate, with 69 households (4.8%) falling below the poverty line. Among the single-parent households, those with 3 or 4 children have the highest poverty rate, with 25 household (65.8%) living below poverty.
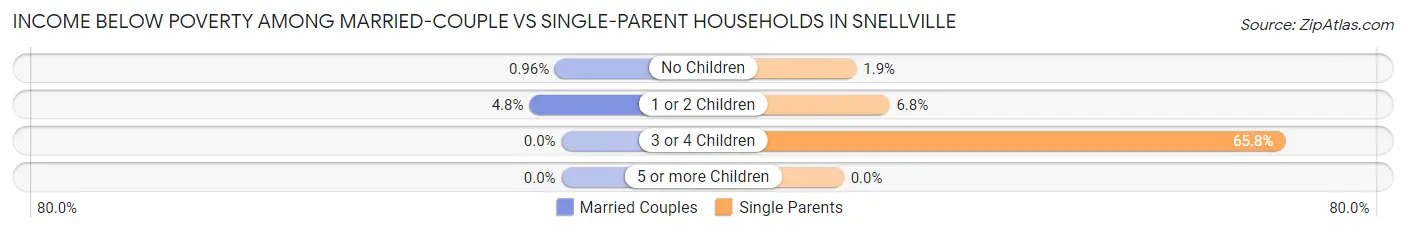
| Children | Married-Couple Families | Single-Parent Households |
| No Children | 24 (1.0%) | 9 (1.9%) |
| 1 or 2 Children | 69 (4.8%) | 38 (6.8%) |
| 3 or 4 Children | 0 (0.0%) | 25 (65.8%) |
| 5 or more Children | 0 (0.0%) | 0 (0.0%) |
| Total | 93 (2.2%) | 72 (6.7%) |
Race in Snellville
The most populous races in Snellville are Black / African American (8,383 | 40.1%), White / Caucasian (8,230 | 39.4%), and Hispanic or Latino (2,795 | 13.4%).
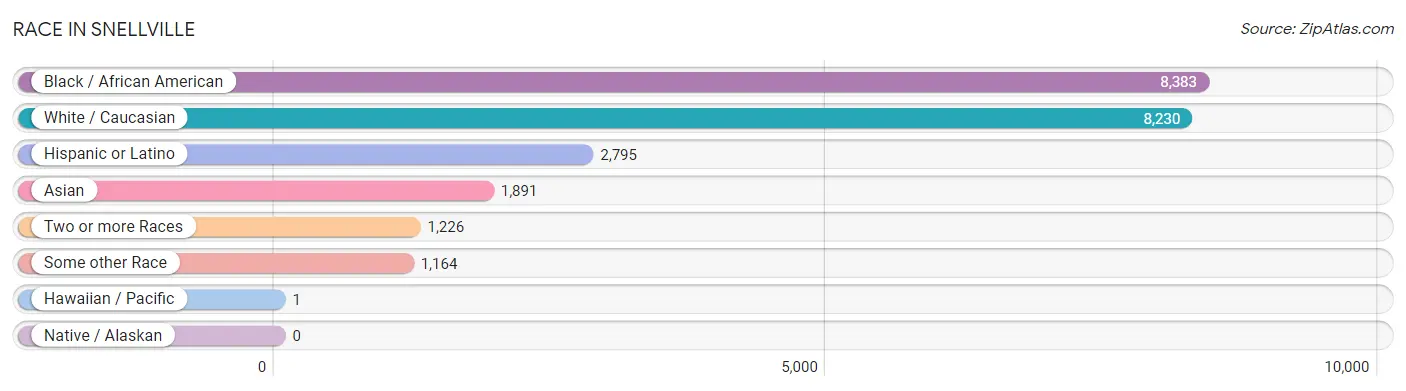
| Race | # Population | % Population |
| Asian | 1,891 | 9.0% |
| Black / African American | 8,383 | 40.1% |
| Hawaiian / Pacific | 1 | 0.0% |
| Hispanic or Latino | 2,795 | 13.4% |
| Native / Alaskan | 0 | 0.0% |
| White / Caucasian | 8,230 | 39.4% |
| Two or more Races | 1,226 | 5.9% |
| Some other Race | 1,164 | 5.6% |
| Total | 20,895 | 100.0% |
Ancestry in Snellville
The most populous ancestries reported in Snellville are English (1,725 | 8.3%), German (1,388 | 6.6%), Subsaharan African (1,106 | 5.3%), American (1,096 | 5.2%), and Mexican (991 | 4.7%), together accounting for 30.2% of all Snellville residents.
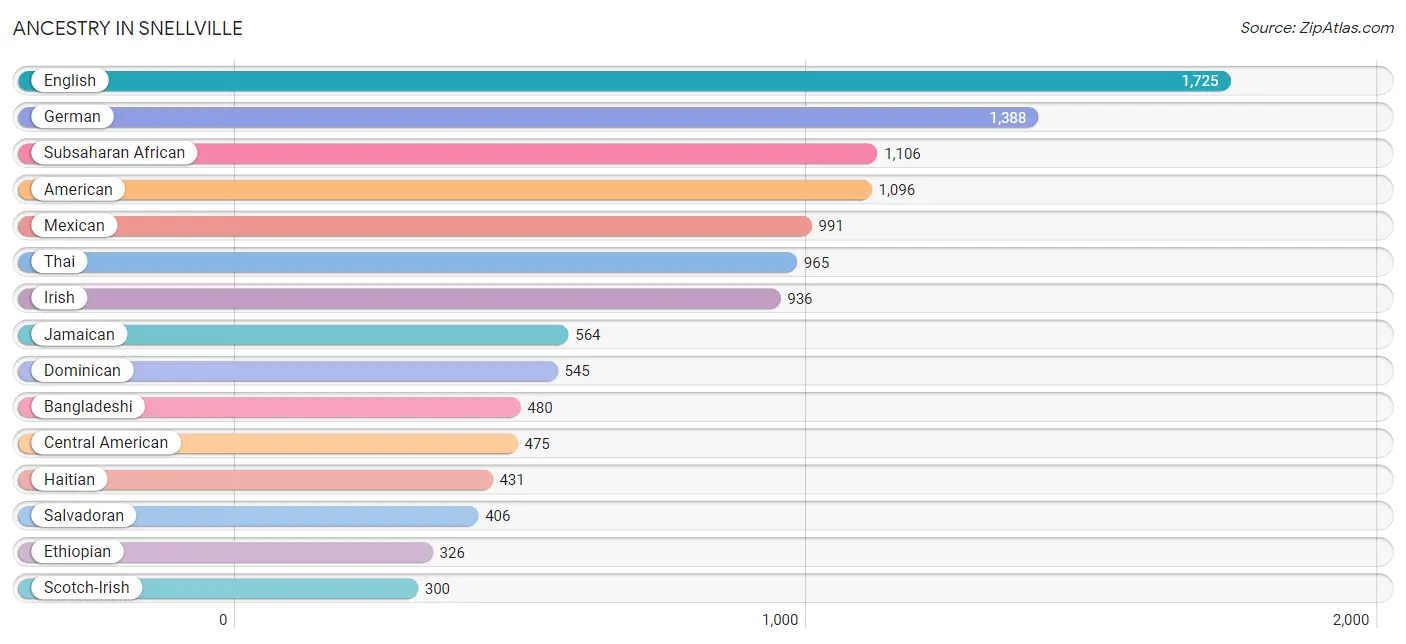
| Ancestry | # Population | % Population |
| African | 270 | 1.3% |
| American | 1,096 | 5.2% |
| Arab | 46 | 0.2% |
| Bahamian | 15 | 0.1% |
| Bangladeshi | 480 | 2.3% |
| Barbadian | 33 | 0.2% |
| Blackfeet | 23 | 0.1% |
| British | 155 | 0.7% |
| Bulgarian | 5 | 0.0% |
| Burmese | 4 | 0.0% |
| Canadian | 36 | 0.2% |
| Cape Verdean | 13 | 0.1% |
| Central American | 475 | 2.3% |
| Cherokee | 10 | 0.1% |
| Chilean | 18 | 0.1% |
| Colombian | 132 | 0.6% |
| Comanche | 85 | 0.4% |
| Costa Rican | 35 | 0.2% |
| Cuban | 260 | 1.2% |
| Danish | 9 | 0.0% |
| Dominican | 545 | 2.6% |
| Dutch | 67 | 0.3% |
| Ecuadorian | 10 | 0.1% |
| Egyptian | 16 | 0.1% |
| English | 1,725 | 8.3% |
| Ethiopian | 326 | 1.6% |
| European | 211 | 1.0% |
| French | 233 | 1.1% |
| French Canadian | 20 | 0.1% |
| German | 1,388 | 6.6% |
| Greek | 32 | 0.2% |
| Guamanian / Chamorro | 1 | 0.0% |
| Guyanese | 131 | 0.6% |
| Haitian | 431 | 2.1% |
| Hungarian | 22 | 0.1% |
| Indian (Asian) | 50 | 0.2% |
| Indonesian | 36 | 0.2% |
| Irish | 936 | 4.5% |
| Iroquois | 5 | 0.0% |
| Italian | 197 | 0.9% |
| Jamaican | 564 | 2.7% |
| Korean | 160 | 0.8% |
| Laotian | 24 | 0.1% |
| Lebanese | 14 | 0.1% |
| Liberian | 46 | 0.2% |
| Lithuanian | 41 | 0.2% |
| Mexican | 991 | 4.7% |
| Nicaraguan | 34 | 0.2% |
| Nigerian | 69 | 0.3% |
| Northern European | 59 | 0.3% |
| Norwegian | 152 | 0.7% |
| Peruvian | 11 | 0.1% |
| Polish | 274 | 1.3% |
| Puerto Rican | 285 | 1.4% |
| Romanian | 181 | 0.9% |
| Russian | 65 | 0.3% |
| Salvadoran | 406 | 1.9% |
| Scandinavian | 19 | 0.1% |
| Scotch-Irish | 300 | 1.4% |
| Scottish | 269 | 1.3% |
| Serbian | 8 | 0.0% |
| Slovak | 3 | 0.0% |
| Slovene | 18 | 0.1% |
| South American | 193 | 0.9% |
| Spaniard | 21 | 0.1% |
| Sri Lankan | 219 | 1.1% |
| Subsaharan African | 1,106 | 5.3% |
| Swedish | 49 | 0.2% |
| Swiss | 14 | 0.1% |
| Syrian | 16 | 0.1% |
| Thai | 965 | 4.6% |
| Trinidadian and Tobagonian | 87 | 0.4% |
| Venezuelan | 22 | 0.1% |
| Welsh | 124 | 0.6% |
| West Indian | 96 | 0.5% | View All 75 Rows |
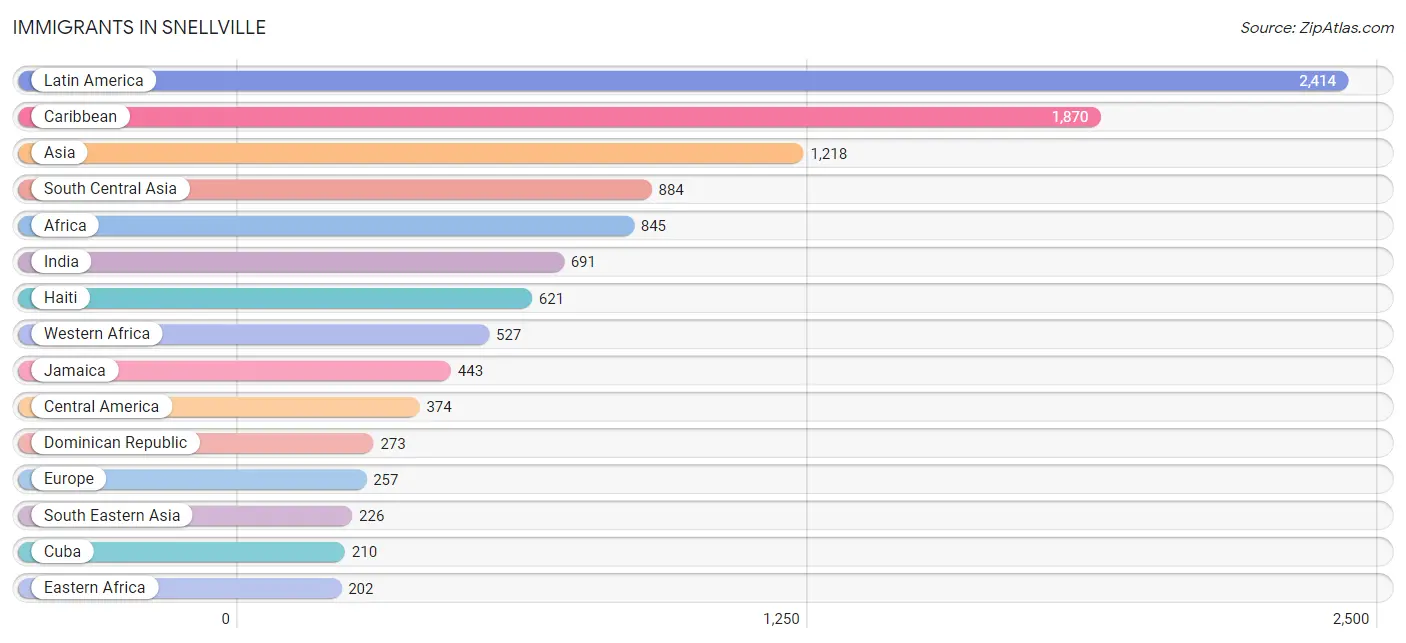
Immigrants in Snellville
The most numerous immigrant groups reported in Snellville came from Latin America (2,414 | 11.6%), Caribbean (1,870 | 8.9%), Asia (1,218 | 5.8%), South Central Asia (884 | 4.2%), and Africa (845 | 4.0%), together accounting for 34.6% of all Snellville residents.
| Immigration Origin | # Population | % Population |
| Africa | 845 | 4.0% |
| Asia | 1,218 | 5.8% |
| Australia | 16 | 0.1% |
| Bahamas | 15 | 0.1% |
| Bangladesh | 123 | 0.6% |
| Bosnia and Herzegovina | 12 | 0.1% |
| Cameroon | 73 | 0.4% |
| Canada | 16 | 0.1% |
| Caribbean | 1,870 | 8.9% |
| Central America | 374 | 1.8% |
| Chile | 18 | 0.1% |
| China | 6 | 0.0% |
| Colombia | 91 | 0.4% |
| Cuba | 210 | 1.0% |
| Dominican Republic | 273 | 1.3% |
| Eastern Africa | 202 | 1.0% |
| Eastern Asia | 10 | 0.1% |
| Eastern Europe | 105 | 0.5% |
| El Salvador | 159 | 0.8% |
| Ethiopia | 202 | 1.0% |
| Europe | 257 | 1.2% |
| France | 12 | 0.1% |
| Germany | 32 | 0.2% |
| Ghana | 12 | 0.1% |
| Guatemala | 13 | 0.1% |
| Guyana | 50 | 0.2% |
| Haiti | 621 | 3.0% |
| India | 691 | 3.3% |
| Indonesia | 15 | 0.1% |
| Italy | 15 | 0.1% |
| Jamaica | 443 | 2.1% |
| Korea | 4 | 0.0% |
| Latin America | 2,414 | 11.6% |
| Liberia | 46 | 0.2% |
| Mexico | 181 | 0.9% |
| Middle Africa | 116 | 0.6% |
| Moldova | 5 | 0.0% |
| Nepal | 13 | 0.1% |
| Nicaragua | 21 | 0.1% |
| Nigeria | 69 | 0.3% |
| Northern Europe | 93 | 0.4% |
| Oceania | 16 | 0.1% |
| Pakistan | 43 | 0.2% |
| Peru | 11 | 0.1% |
| Philippines | 32 | 0.2% |
| Romania | 83 | 0.4% |
| South America | 170 | 0.8% |
| South Central Asia | 884 | 4.2% |
| South Eastern Asia | 226 | 1.1% |
| Southern Europe | 15 | 0.1% |
| Trinidad and Tobago | 31 | 0.2% |
| Vietnam | 150 | 0.7% |
| Western Africa | 527 | 2.5% |
| Western Asia | 76 | 0.4% |
| Western Europe | 44 | 0.2% |
| Zaire | 43 | 0.2% | View All 56 Rows |
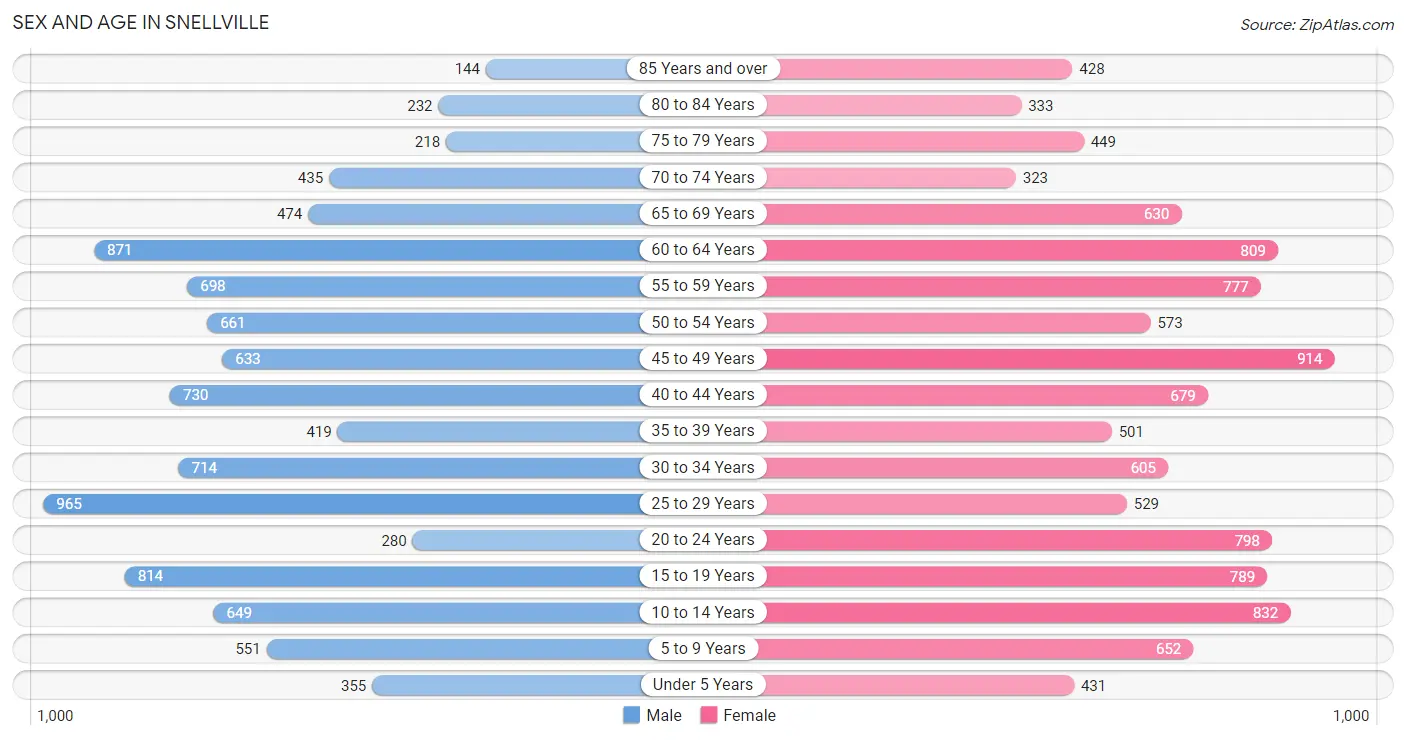
Sex and Age in Snellville
Sex and Age in Snellville
The most populous age groups in Snellville are 25 to 29 Years (965 | 9.8%) for men and 45 to 49 Years (914 | 8.3%) for women.
| Age Bracket | Male | Female |
| Under 5 Years | 355 (3.6%) | 431 (3.9%) |
| 5 to 9 Years | 551 (5.6%) | 652 (5.9%) |
| 10 to 14 Years | 649 (6.6%) | 832 (7.5%) |
| 15 to 19 Years | 814 (8.3%) | 789 (7.1%) |
| 20 to 24 Years | 280 (2.8%) | 798 (7.2%) |
| 25 to 29 Years | 965 (9.8%) | 529 (4.8%) |
| 30 to 34 Years | 714 (7.2%) | 605 (5.5%) |
| 35 to 39 Years | 419 (4.3%) | 501 (4.5%) |
| 40 to 44 Years | 730 (7.4%) | 679 (6.1%) |
| 45 to 49 Years | 633 (6.4%) | 914 (8.3%) |
| 50 to 54 Years | 661 (6.7%) | 573 (5.2%) |
| 55 to 59 Years | 698 (7.1%) | 777 (7.0%) |
| 60 to 64 Years | 871 (8.8%) | 809 (7.3%) |
| 65 to 69 Years | 474 (4.8%) | 630 (5.7%) |
| 70 to 74 Years | 435 (4.4%) | 323 (2.9%) |
| 75 to 79 Years | 218 (2.2%) | 449 (4.1%) |
| 80 to 84 Years | 232 (2.4%) | 333 (3.0%) |
| 85 Years and over | 144 (1.5%) | 428 (3.9%) |
| Total | 9,843 (100.0%) | 11,052 (100.0%) |
Families and Households in Snellville
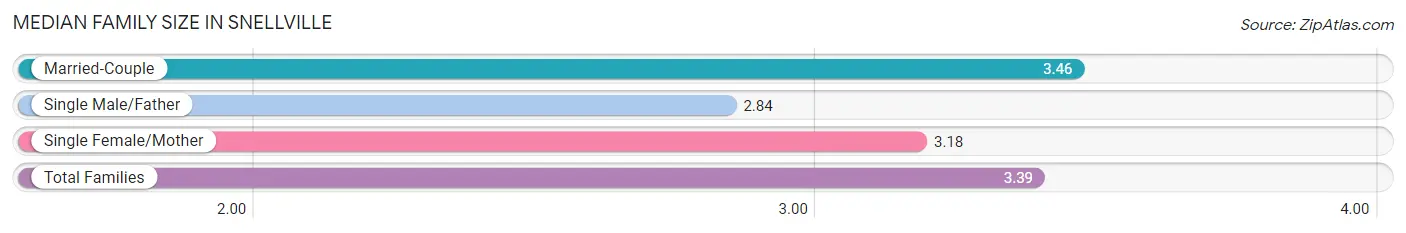
Median Family Size in Snellville
The median family size in Snellville is 3.39 persons per family, with married-couple families (4,223 | 79.8%) accounting for the largest median family size of 3.46 persons per family. On the other hand, single male/father families (215 | 4.1%) represent the smallest median family size with 2.84 persons per family.
| Family Type | # Families | Family Size |
| Married-Couple | 4,223 (79.8%) | 3.46 |
| Single Male/Father | 215 (4.1%) | 2.84 |
| Single Female/Mother | 856 (16.2%) | 3.18 |
| Total Families | 5,294 (100.0%) | 3.39 |
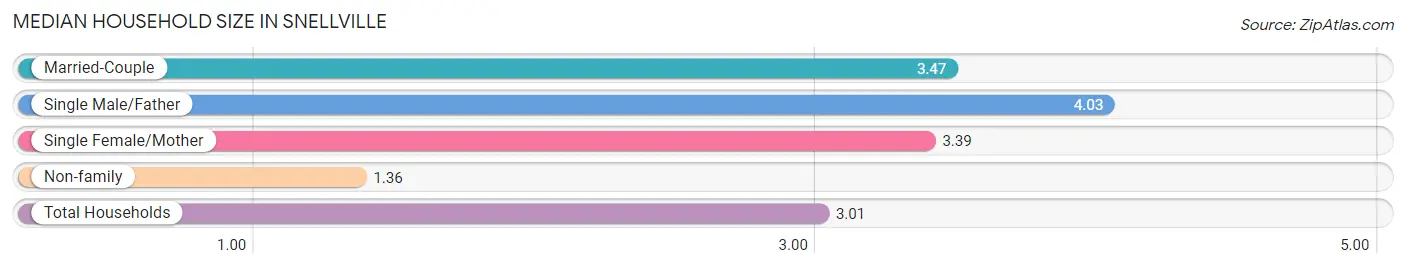
Median Household Size in Snellville
The median household size in Snellville is 3.01 persons per household, with single male/father households (215 | 3.2%) accounting for the largest median household size of 4.03 persons per household. non-family households (1,498 | 22.1%) represent the smallest median household size with 1.36 persons per household.
| Household Type | # Households | Household Size |
| Married-Couple | 4,223 (62.2%) | 3.47 |
| Single Male/Father | 215 (3.2%) | 4.03 |
| Single Female/Mother | 856 (12.6%) | 3.39 |
| Non-family | 1,498 (22.1%) | 1.36 |
| Total Households | 6,792 (100.0%) | 3.01 |
Household Size by Marriage Status in Snellville
Out of a total of 6,792 households in Snellville, 5,294 (77.9%) are family households, while 1,498 (22.1%) are nonfamily households. The most numerous type of family households are 2-person households, comprising 2,185, and the most common type of nonfamily households are 1-person households, comprising 1,254.
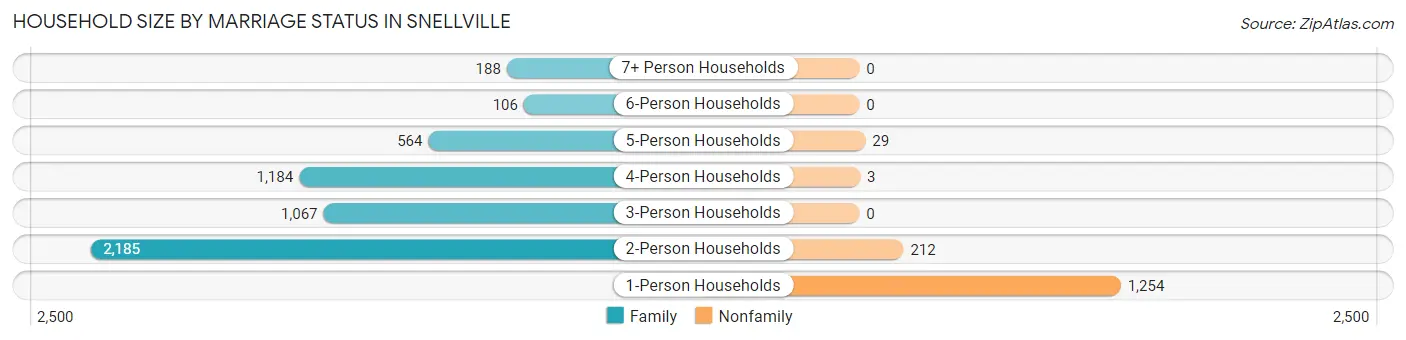
| Household Size | Family Households | Nonfamily Households |
| 1-Person Households | - | 1,254 (18.5%) |
| 2-Person Households | 2,185 (32.2%) | 212 (3.1%) |
| 3-Person Households | 1,067 (15.7%) | 0 (0.0%) |
| 4-Person Households | 1,184 (17.4%) | 3 (0.0%) |
| 5-Person Households | 564 (8.3%) | 29 (0.4%) |
| 6-Person Households | 106 (1.6%) | 0 (0.0%) |
| 7+ Person Households | 188 (2.8%) | 0 (0.0%) |
| Total | 5,294 (77.9%) | 1,498 (22.1%) |
Female Fertility in Snellville
Fertility by Age in Snellville
Average fertility rate in Snellville is 27.0 births per 1,000 women. Women in the age bracket of 20 to 34 years have the highest fertility rate with 47.0 births per 1,000 women. Women in the age bracket of 20 to 34 years acount for 68.2% of all women with births.
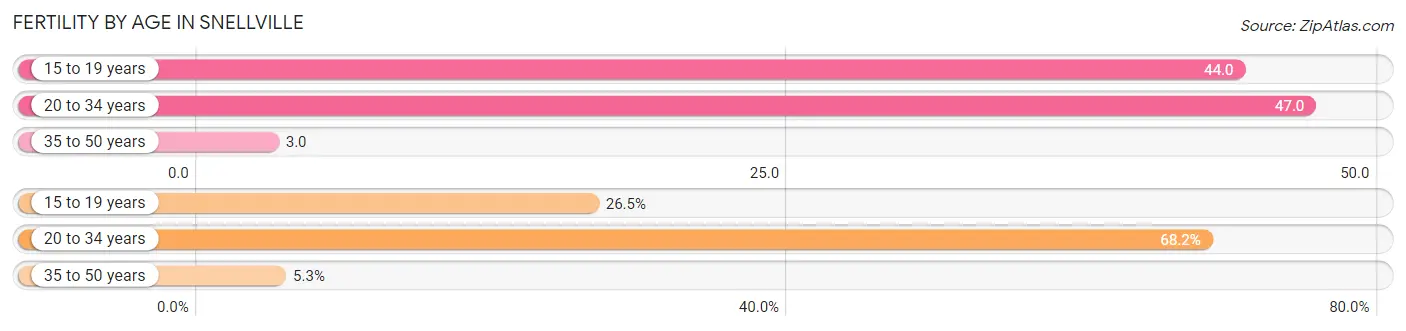
| Age Bracket | Women with Births | Births / 1,000 Women |
| 15 to 19 years | 35 (26.5%) | 44.0 |
| 20 to 34 years | 90 (68.2%) | 47.0 |
| 35 to 50 years | 7 (5.3%) | 3.0 |
| Total | 132 (100.0%) | 27.0 |
Fertility by Age by Marriage Status in Snellville
47.0% of women with births (132) in Snellville are married. The highest percentage of unmarried women with births falls into 15 to 19 years age bracket with 100.0% of them unmarried at the time of birth, while the lowest percentage of unmarried women with births belong to 35 to 50 years age bracket with 0.0% of them unmarried.
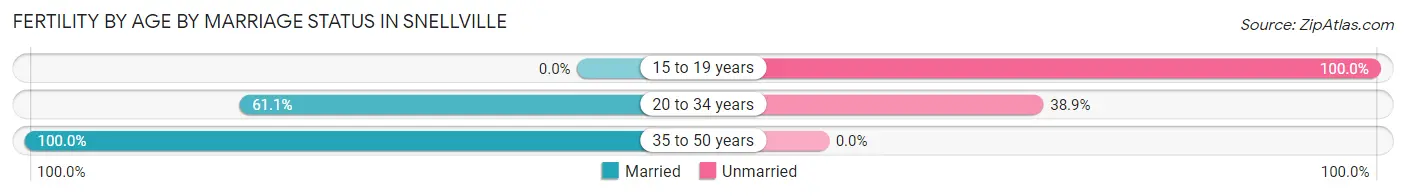
| Age Bracket | Married | Unmarried |
| 15 to 19 years | 0 (0.0%) | 35 (100.0%) |
| 20 to 34 years | 55 (61.1%) | 35 (38.9%) |
| 35 to 50 years | 7 (100.0%) | 0 (0.0%) |
| Total | 62 (47.0%) | 70 (53.0%) |
Fertility by Education in Snellville
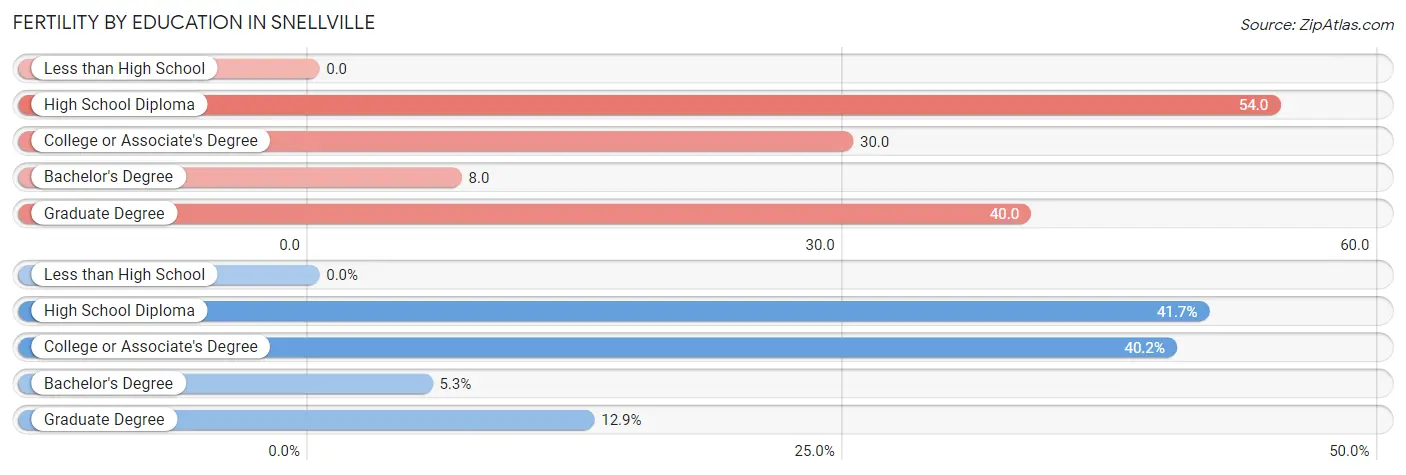
| Educational Attainment | Women with Births | Births / 1,000 Women |
| Less than High School | 0 (0.0%) | 0.0 |
| High School Diploma | 55 (41.7%) | 54.0 |
| College or Associate's Degree | 53 (40.2%) | 30.0 |
| Bachelor's Degree | 7 (5.3%) | 8.0 |
| Graduate Degree | 17 (12.9%) | 40.0 |
| Total | 132 (100.0%) | 27.0 |
Fertility by Education by Marriage Status in Snellville
53.0% of women with births in Snellville are unmarried. Women with the educational attainment of high school diploma are most likely to be married with 100.0% of them married at childbirth, while women with the educational attainment of college or associate's degree are least likely to be married with 100.0% of them unmarried at childbirth.
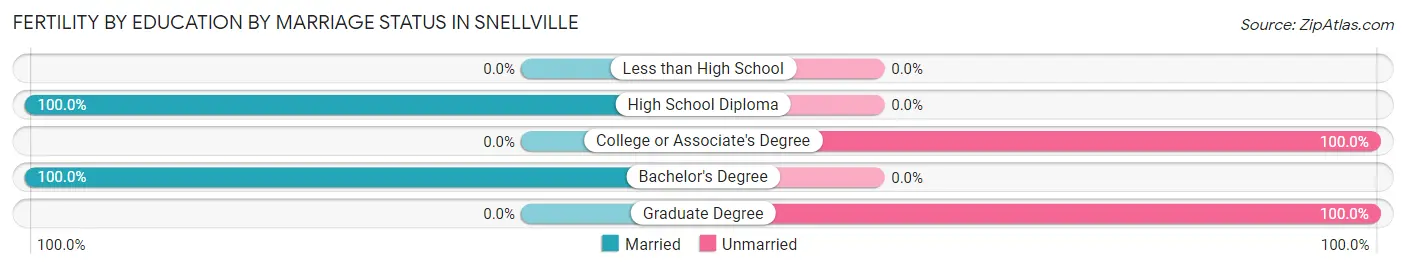
| Educational Attainment | Married | Unmarried |
| Less than High School | 0 (0.0%) | 0 (0.0%) |
| High School Diploma | 55 (100.0%) | 0 (0.0%) |
| College or Associate's Degree | 0 (0.0%) | 53 (100.0%) |
| Bachelor's Degree | 7 (100.0%) | 0 (0.0%) |
| Graduate Degree | 0 (0.0%) | 17 (100.0%) |
| Total | 62 (47.0%) | 70 (53.0%) |
Employment Characteristics in Snellville
Employment by Class of Employer in Snellville
Among the 9,623 employed individuals in Snellville, private company employees (6,518 | 67.7%), local government employees (737 | 7.7%), and not-for-profit organizations (658 | 6.8%) make up the most common classes of employment.
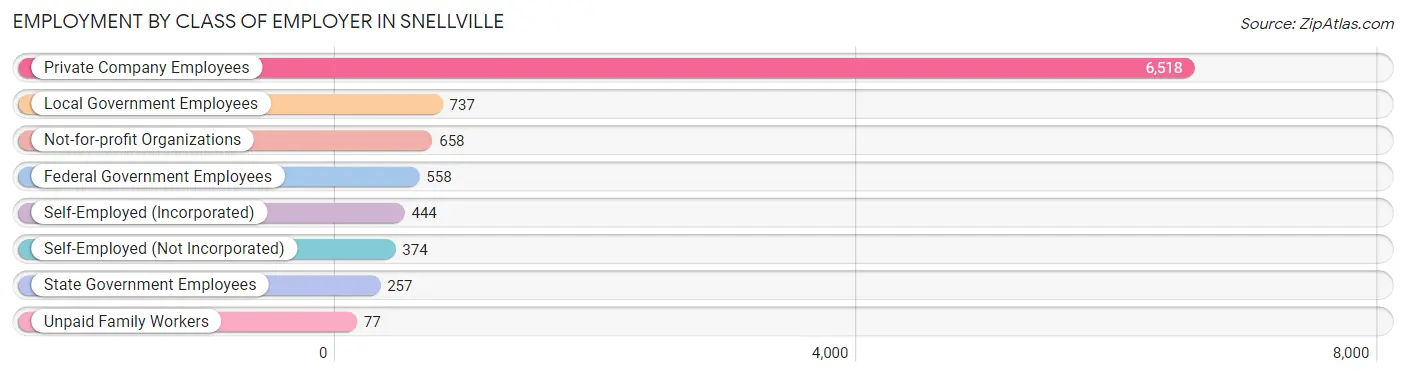
| Employer Class | # Employees | % Employees |
| Private Company Employees | 6,518 | 67.7% |
| Self-Employed (Incorporated) | 444 | 4.6% |
| Self-Employed (Not Incorporated) | 374 | 3.9% |
| Not-for-profit Organizations | 658 | 6.8% |
| Local Government Employees | 737 | 7.7% |
| State Government Employees | 257 | 2.7% |
| Federal Government Employees | 558 | 5.8% |
| Unpaid Family Workers | 77 | 0.8% |
| Total | 9,623 | 100.0% |
Employment Status by Age in Snellville
According to the labor force statistics for Snellville, out of the total population over 16 years of age (17,093), 60.6% or 10,358 individuals are in the labor force, with 4.1% or 425 of them unemployed. The age group with the highest labor force participation rate is 35 to 44 years, with 91.8% or 2,138 individuals in the labor force. Within the labor force, the 25 to 29 years age range has the highest percentage of unemployed individuals, with 12.2% or 136 of them being unemployed.
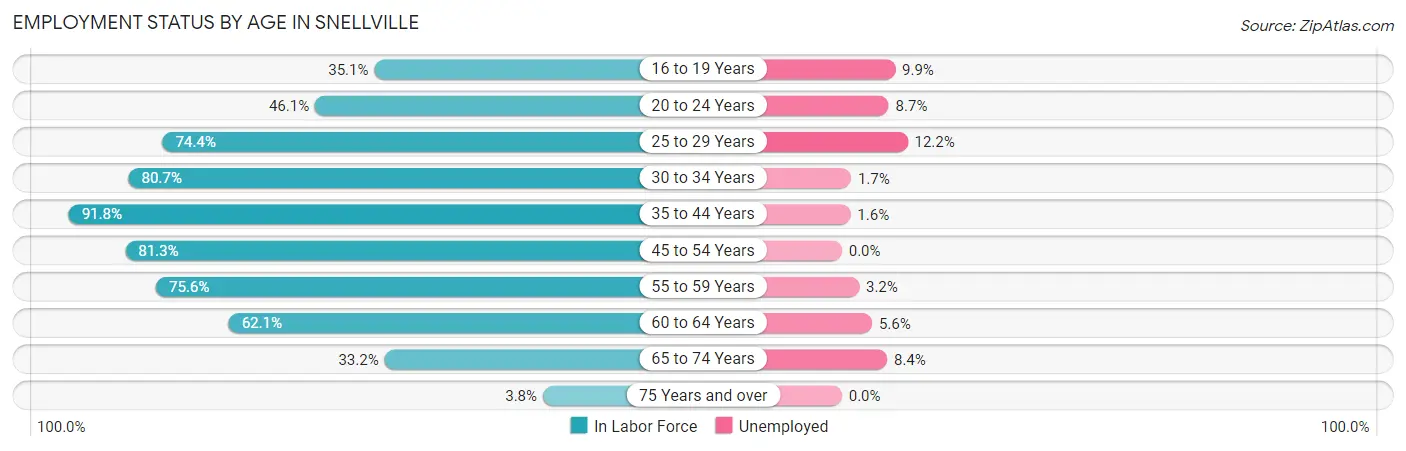
| Age Bracket | In Labor Force | Unemployed |
| 16 to 19 Years | 446 (35.1%) | 44 (9.9%) |
| 20 to 24 Years | 497 (46.1%) | 43 (8.7%) |
| 25 to 29 Years | 1,112 (74.4%) | 136 (12.2%) |
| 30 to 34 Years | 1,064 (80.7%) | 18 (1.7%) |
| 35 to 44 Years | 2,138 (91.8%) | 34 (1.6%) |
| 45 to 54 Years | 2,261 (81.3%) | 0 (0.0%) |
| 55 to 59 Years | 1,115 (75.6%) | 36 (3.2%) |
| 60 to 64 Years | 1,043 (62.1%) | 58 (5.6%) |
| 65 to 74 Years | 618 (33.2%) | 52 (8.4%) |
| 75 Years and over | 69 (3.8%) | 0 (0.0%) |
| Total | 10,358 (60.6%) | 425 (4.1%) |
Employment Status by Educational Attainment in Snellville
According to labor force statistics for Snellville, 78.8% of individuals (8,729) out of the total population between 25 and 64 years of age (11,078) are in the labor force, with 3.2% or 279 of them being unemployed. The group with the highest labor force participation rate are those with the educational attainment of bachelor's degree or higher, with 87.1% or 3,777 individuals in the labor force. Within the labor force, individuals with less than high school education have the highest percentage of unemployment, with 5.6% or 36 of them being unemployed.
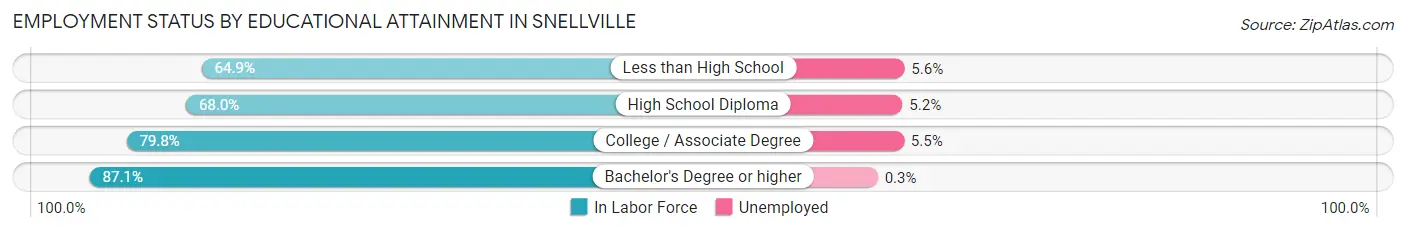
| Educational Attainment | In Labor Force | Unemployed |
| Less than High School | 646 (64.9%) | 56 (5.6%) |
| High School Diploma | 1,571 (68.0%) | 120 (5.2%) |
| College / Associate Degree | 2,741 (79.8%) | 189 (5.5%) |
| Bachelor's Degree or higher | 3,777 (87.1%) | 13 (0.3%) |
| Total | 8,729 (78.8%) | 354 (3.2%) |
Employment Occupations by Sex in Snellville
Management, Business, Science and Arts Occupations
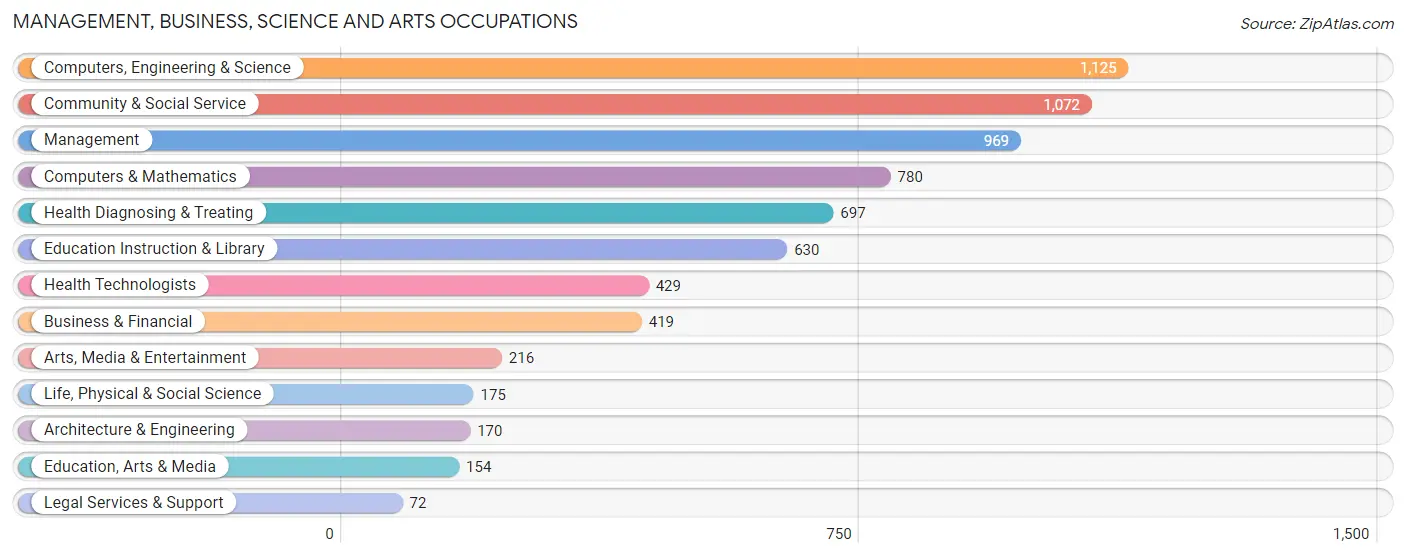
The most common Management, Business, Science and Arts occupations in Snellville are Computers, Engineering & Science (1,125 | 11.3%), Community & Social Service (1,072 | 10.8%), Management (969 | 9.8%), Computers & Mathematics (780 | 7.9%), and Health Diagnosing & Treating (697 | 7.0%).
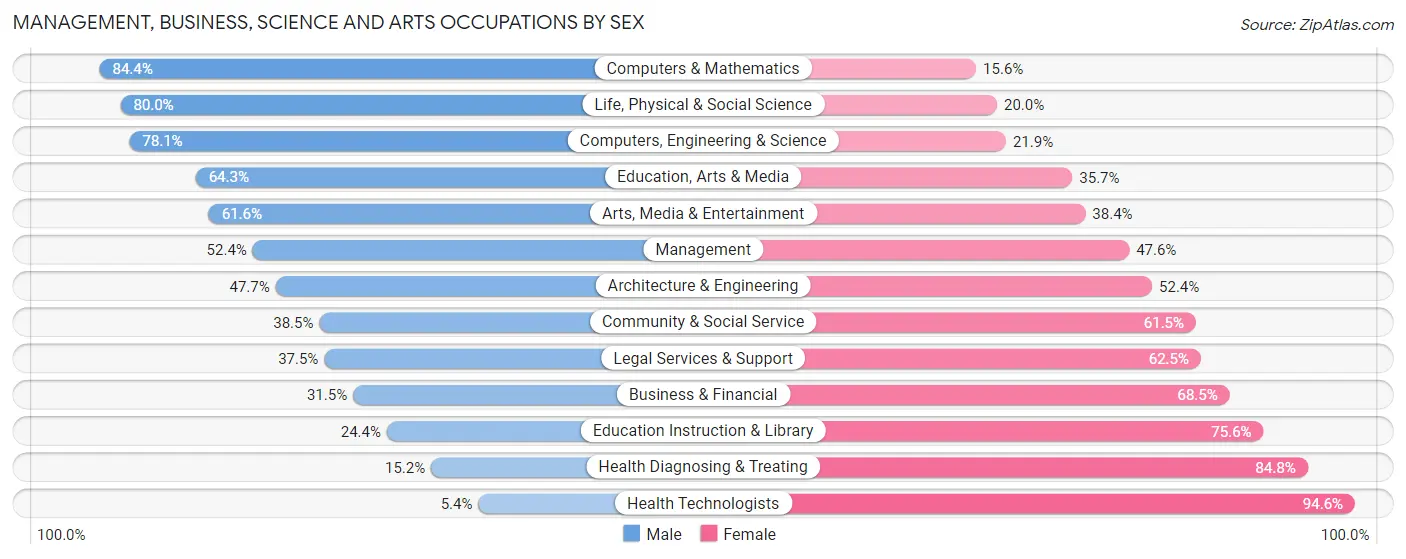
Management, Business, Science and Arts Occupations by Sex
Within the Management, Business, Science and Arts occupations in Snellville, the most male-oriented occupations are Computers & Mathematics (84.4%), Life, Physical & Social Science (80.0%), and Computers, Engineering & Science (78.1%), while the most female-oriented occupations are Health Technologists (94.6%), Health Diagnosing & Treating (84.8%), and Education Instruction & Library (75.6%).
| Occupation | Male | Female |
| Management | 508 (52.4%) | 461 (47.6%) |
| Business & Financial | 132 (31.5%) | 287 (68.5%) |
| Computers, Engineering & Science | 879 (78.1%) | 246 (21.9%) |
| Computers & Mathematics | 658 (84.4%) | 122 (15.6%) |
| Architecture & Engineering | 81 (47.6%) | 89 (52.3%) |
| Life, Physical & Social Science | 140 (80.0%) | 35 (20.0%) |
| Community & Social Service | 413 (38.5%) | 659 (61.5%) |
| Education, Arts & Media | 99 (64.3%) | 55 (35.7%) |
| Legal Services & Support | 27 (37.5%) | 45 (62.5%) |
| Education Instruction & Library | 154 (24.4%) | 476 (75.6%) |
| Arts, Media & Entertainment | 133 (61.6%) | 83 (38.4%) |
| Health Diagnosing & Treating | 106 (15.2%) | 591 (84.8%) |
| Health Technologists | 23 (5.4%) | 406 (94.6%) |
| Total (Category) | 2,038 (47.6%) | 2,244 (52.4%) |
| Total (Overall) | 5,148 (51.8%) | 4,786 (48.2%) |
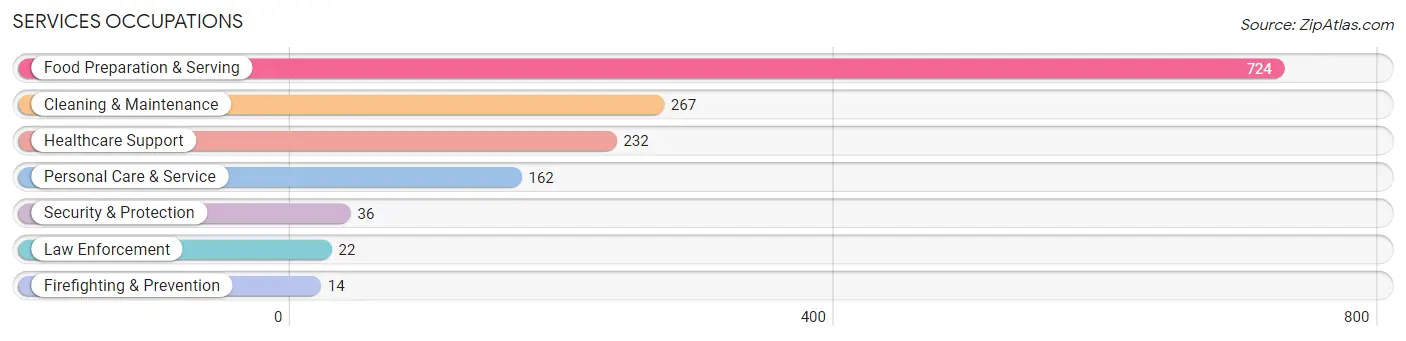
Services Occupations
The most common Services occupations in Snellville are Food Preparation & Serving (724 | 7.3%), Cleaning & Maintenance (267 | 2.7%), Healthcare Support (232 | 2.3%), Personal Care & Service (162 | 1.6%), and Security & Protection (36 | 0.4%).
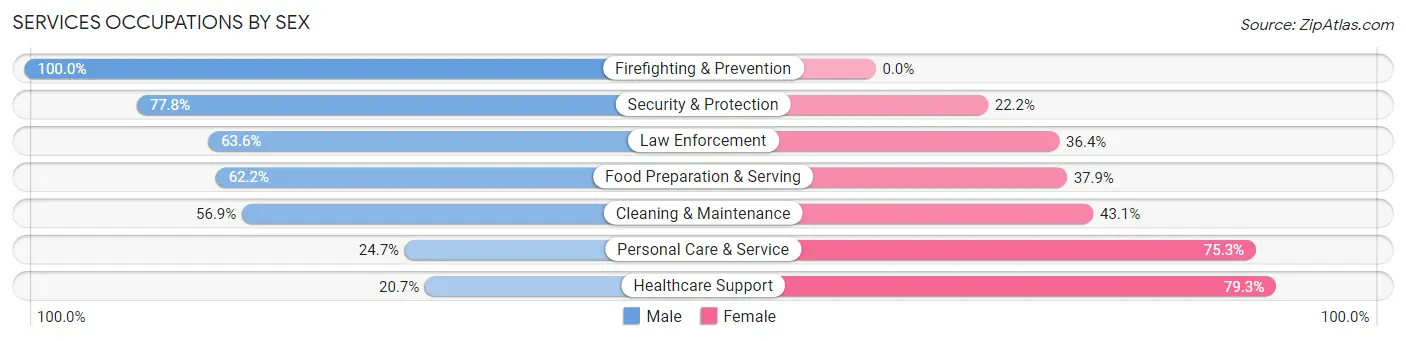
Services Occupations by Sex
Within the Services occupations in Snellville, the most male-oriented occupations are Firefighting & Prevention (100.0%), Security & Protection (77.8%), and Law Enforcement (63.6%), while the most female-oriented occupations are Healthcare Support (79.3%), Personal Care & Service (75.3%), and Cleaning & Maintenance (43.1%).
| Occupation | Male | Female |
| Healthcare Support | 48 (20.7%) | 184 (79.3%) |
| Security & Protection | 28 (77.8%) | 8 (22.2%) |
| Firefighting & Prevention | 14 (100.0%) | 0 (0.0%) |
| Law Enforcement | 14 (63.6%) | 8 (36.4%) |
| Food Preparation & Serving | 450 (62.2%) | 274 (37.9%) |
| Cleaning & Maintenance | 152 (56.9%) | 115 (43.1%) |
| Personal Care & Service | 40 (24.7%) | 122 (75.3%) |
| Total (Category) | 718 (50.5%) | 703 (49.5%) |
| Total (Overall) | 5,148 (51.8%) | 4,786 (48.2%) |
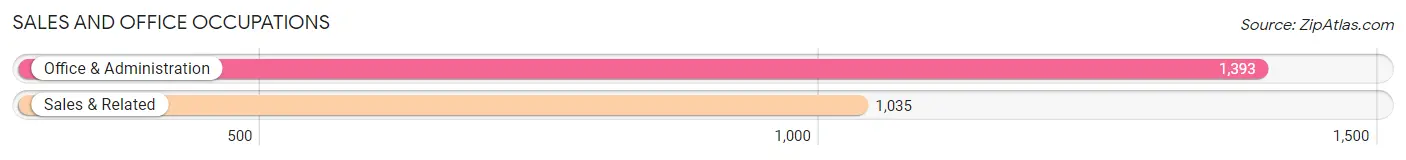
Sales and Office Occupations
The most common Sales and Office occupations in Snellville are Office & Administration (1,393 | 14.0%), and Sales & Related (1,035 | 10.4%).
Sales and Office Occupations by Sex
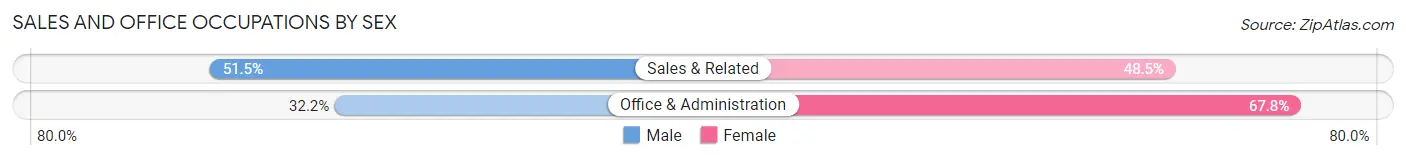
| Occupation | Male | Female |
| Sales & Related | 533 (51.5%) | 502 (48.5%) |
| Office & Administration | 449 (32.2%) | 944 (67.8%) |
| Total (Category) | 982 (40.4%) | 1,446 (59.6%) |
| Total (Overall) | 5,148 (51.8%) | 4,786 (48.2%) |
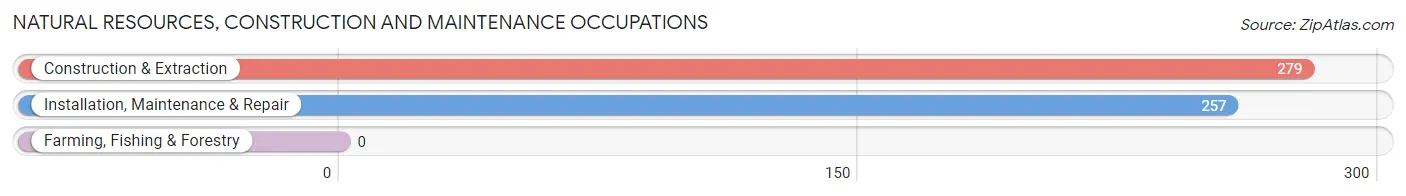
Natural Resources, Construction and Maintenance Occupations
The most common Natural Resources, Construction and Maintenance occupations in Snellville are Construction & Extraction (279 | 2.8%), and Installation, Maintenance & Repair (257 | 2.6%).
Natural Resources, Construction and Maintenance Occupations by Sex
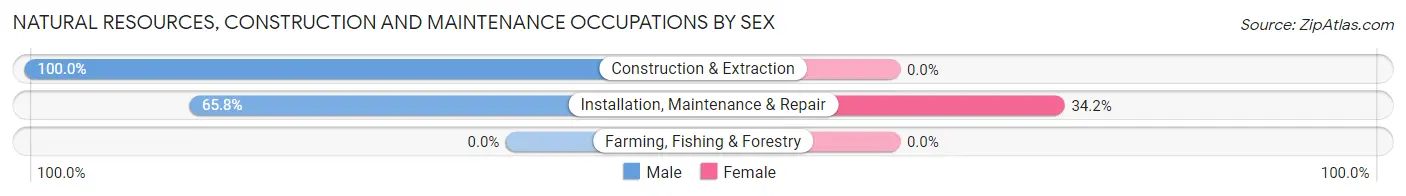
| Occupation | Male | Female |
| Farming, Fishing & Forestry | 0 (0.0%) | 0 (0.0%) |
| Construction & Extraction | 279 (100.0%) | 0 (0.0%) |
| Installation, Maintenance & Repair | 169 (65.8%) | 88 (34.2%) |
| Total (Category) | 448 (83.6%) | 88 (16.4%) |
| Total (Overall) | 5,148 (51.8%) | 4,786 (48.2%) |
Production, Transportation and Moving Occupations
The most common Production, Transportation and Moving occupations in Snellville are Transportation (654 | 6.6%), Material Moving (375 | 3.8%), and Production (238 | 2.4%).
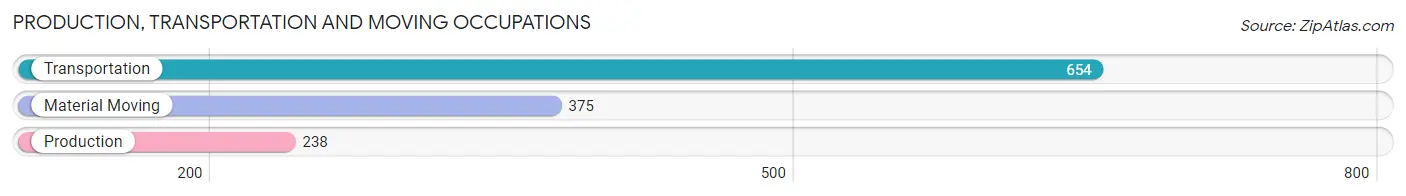
Production, Transportation and Moving Occupations by Sex
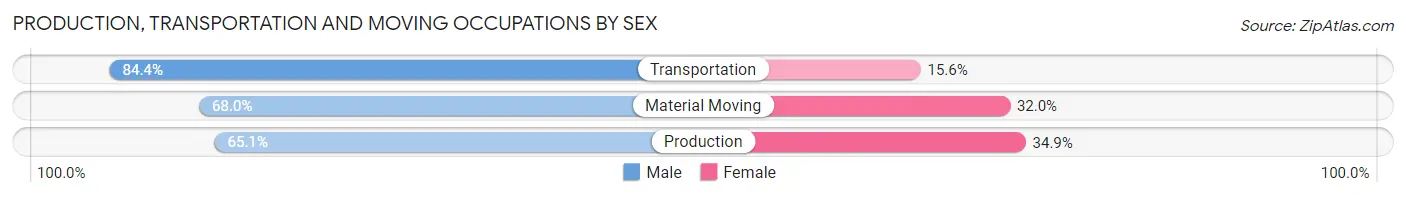
| Occupation | Male | Female |
| Production | 155 (65.1%) | 83 (34.9%) |
| Transportation | 552 (84.4%) | 102 (15.6%) |
| Material Moving | 255 (68.0%) | 120 (32.0%) |
| Total (Category) | 962 (75.9%) | 305 (24.1%) |
| Total (Overall) | 5,148 (51.8%) | 4,786 (48.2%) |
Employment Industries by Sex in Snellville
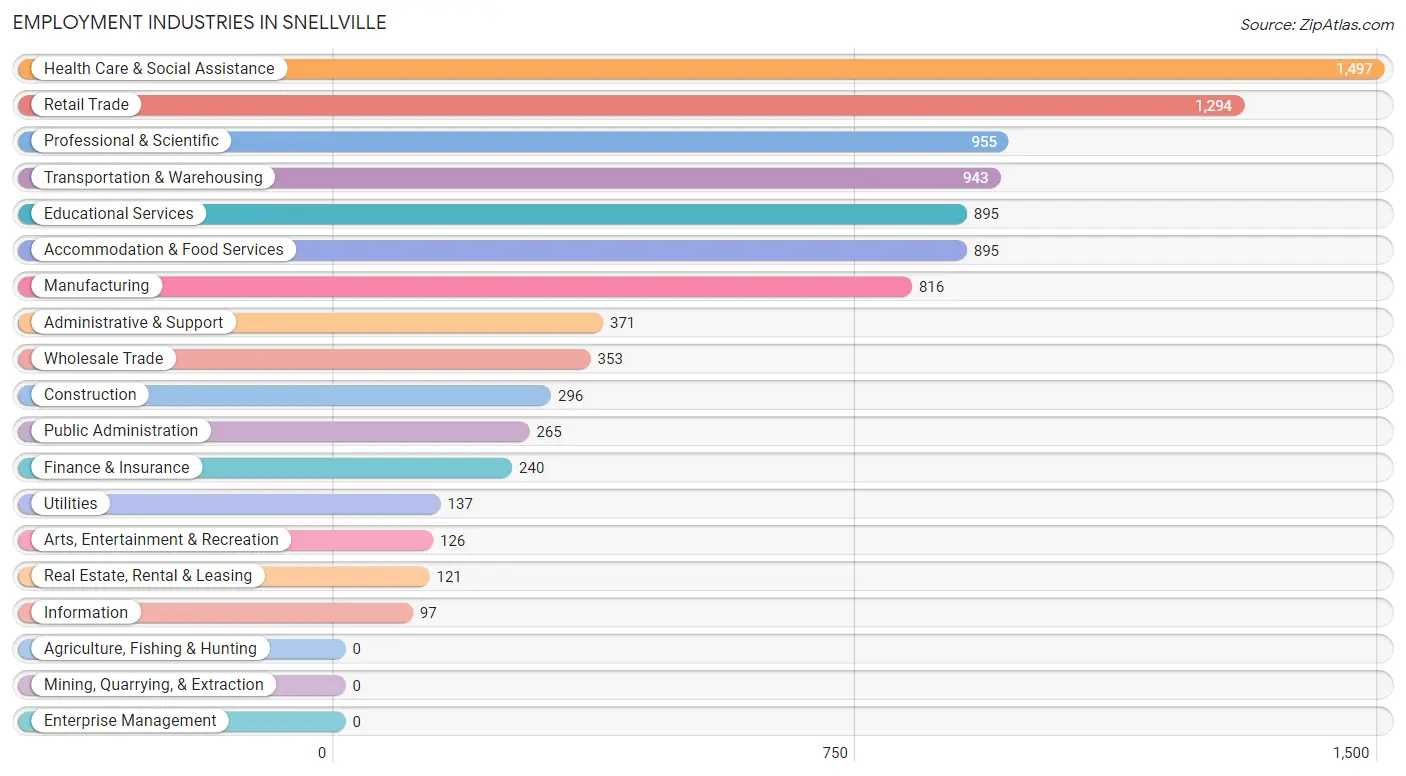
Employment Industries in Snellville
The major employment industries in Snellville include Health Care & Social Assistance (1,497 | 15.1%), Retail Trade (1,294 | 13.0%), Professional & Scientific (955 | 9.6%), Transportation & Warehousing (943 | 9.5%), and Educational Services (895 | 9.0%).
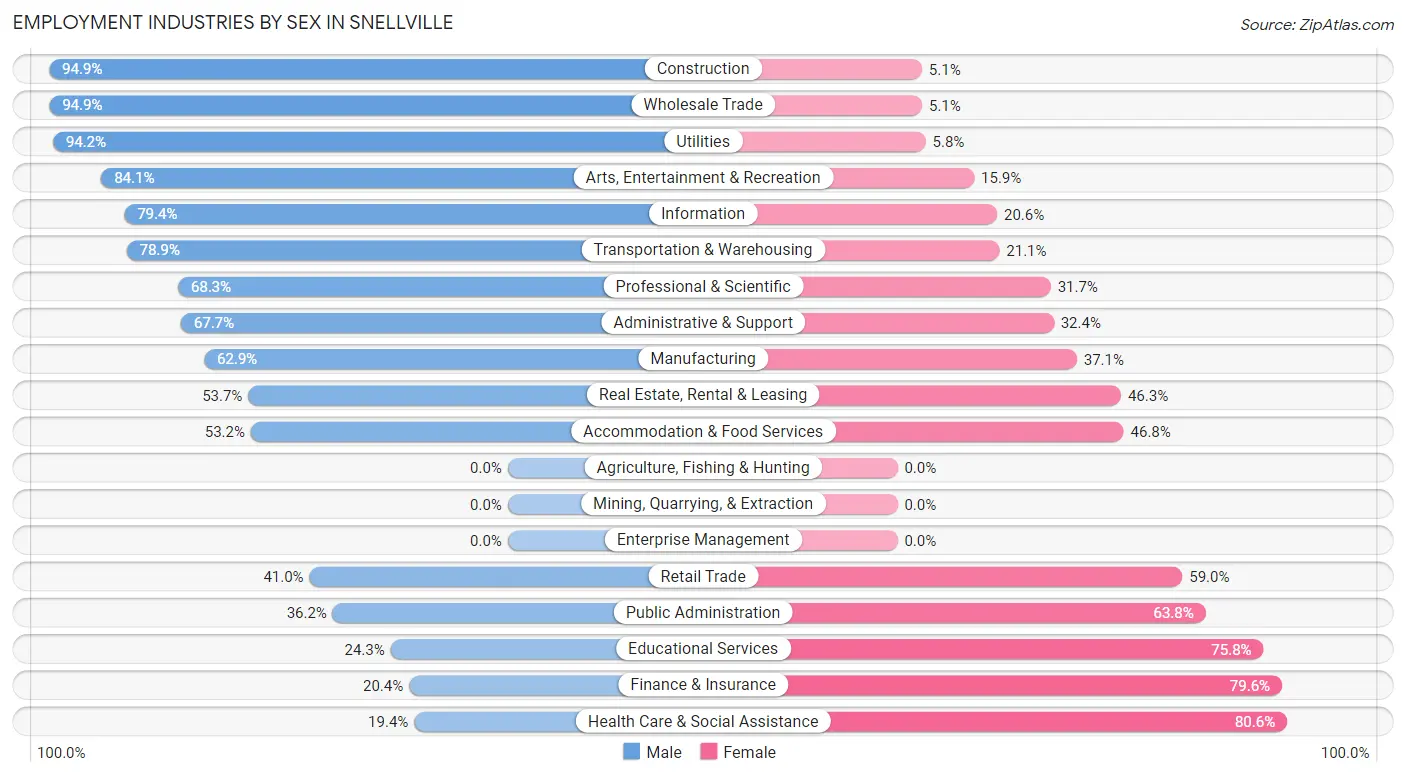
Employment Industries by Sex in Snellville
The Snellville industries that see more men than women are Construction (94.9%), Wholesale Trade (94.9%), and Utilities (94.2%), whereas the industries that tend to have a higher number of women are Health Care & Social Assistance (80.6%), Finance & Insurance (79.6%), and Educational Services (75.7%).
| Industry | Male | Female |
| Agriculture, Fishing & Hunting | 0 (0.0%) | 0 (0.0%) |
| Mining, Quarrying, & Extraction | 0 (0.0%) | 0 (0.0%) |
| Construction | 281 (94.9%) | 15 (5.1%) |
| Manufacturing | 513 (62.9%) | 303 (37.1%) |
| Wholesale Trade | 335 (94.9%) | 18 (5.1%) |
| Retail Trade | 531 (41.0%) | 763 (59.0%) |
| Transportation & Warehousing | 744 (78.9%) | 199 (21.1%) |
| Utilities | 129 (94.2%) | 8 (5.8%) |
| Information | 77 (79.4%) | 20 (20.6%) |
| Finance & Insurance | 49 (20.4%) | 191 (79.6%) |
| Real Estate, Rental & Leasing | 65 (53.7%) | 56 (46.3%) |
| Professional & Scientific | 652 (68.3%) | 303 (31.7%) |
| Enterprise Management | 0 (0.0%) | 0 (0.0%) |
| Administrative & Support | 251 (67.6%) | 120 (32.4%) |
| Educational Services | 217 (24.2%) | 678 (75.7%) |
| Health Care & Social Assistance | 290 (19.4%) | 1,207 (80.6%) |
| Arts, Entertainment & Recreation | 106 (84.1%) | 20 (15.9%) |
| Accommodation & Food Services | 476 (53.2%) | 419 (46.8%) |
| Public Administration | 96 (36.2%) | 169 (63.8%) |
| Total | 5,148 (51.8%) | 4,786 (48.2%) |
Education in Snellville
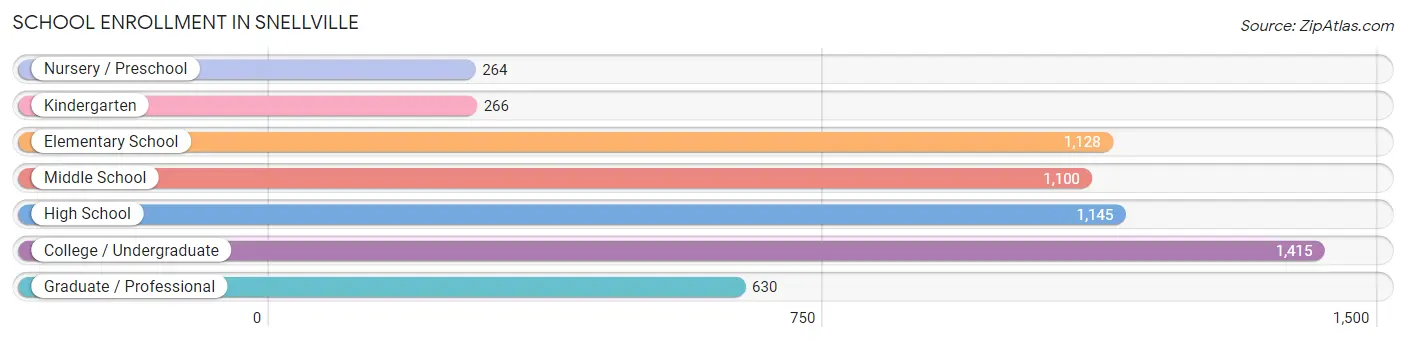
School Enrollment in Snellville
The most common levels of schooling among the 5,948 students in Snellville are college / undergraduate (1,415 | 23.8%), high school (1,145 | 19.3%), and elementary school (1,128 | 19.0%).
| School Level | # Students | % Students |
| Nursery / Preschool | 264 | 4.4% |
| Kindergarten | 266 | 4.5% |
| Elementary School | 1,128 | 19.0% |
| Middle School | 1,100 | 18.5% |
| High School | 1,145 | 19.3% |
| College / Undergraduate | 1,415 | 23.8% |
| Graduate / Professional | 630 | 10.6% |
| Total | 5,948 | 100.0% |
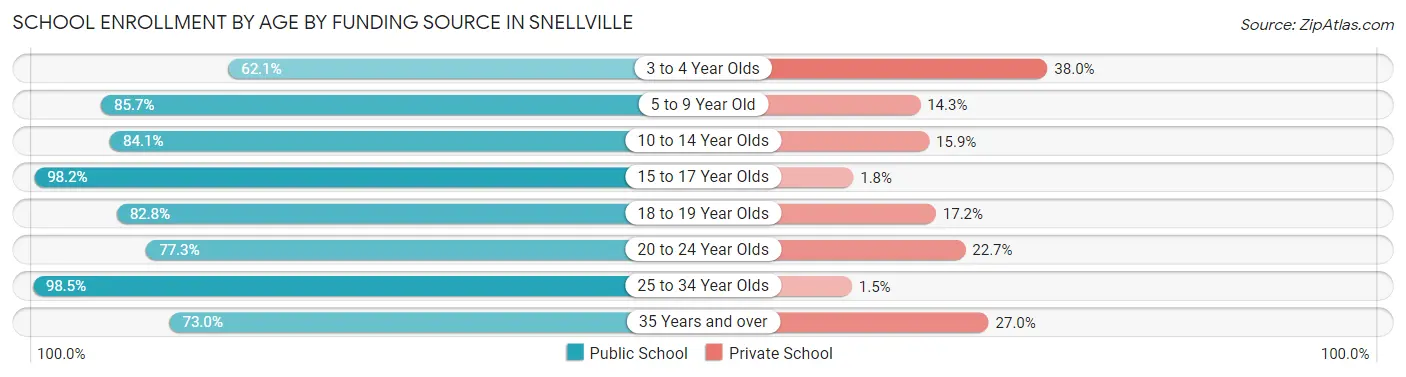
School Enrollment by Age by Funding Source in Snellville
Out of a total of 5,948 students who are enrolled in schools in Snellville, 862 (14.5%) attend a private institution, while the remaining 5,086 (85.5%) are enrolled in public schools. The age group of 3 to 4 year olds has the highest likelihood of being enrolled in private schools, with 85 (38.0% in the age bracket) enrolled. Conversely, the age group of 25 to 34 year olds has the lowest likelihood of being enrolled in a private school, with 579 (98.5% in the age bracket) attending a public institution.
| Age Bracket | Public School | Private School |
| 3 to 4 Year Olds | 139 (62.1%) | 85 (38.0%) |
| 5 to 9 Year Old | 1,004 (85.7%) | 167 (14.3%) |
| 10 to 14 Year Olds | 1,225 (84.1%) | 232 (15.9%) |
| 15 to 17 Year Olds | 932 (98.2%) | 17 (1.8%) |
| 18 to 19 Year Olds | 463 (82.8%) | 96 (17.2%) |
| 20 to 24 Year Olds | 232 (77.3%) | 68 (22.7%) |
| 25 to 34 Year Olds | 579 (98.5%) | 9 (1.5%) |
| 35 Years and over | 511 (73.0%) | 189 (27.0%) |
| Total | 5,086 (85.5%) | 862 (14.5%) |
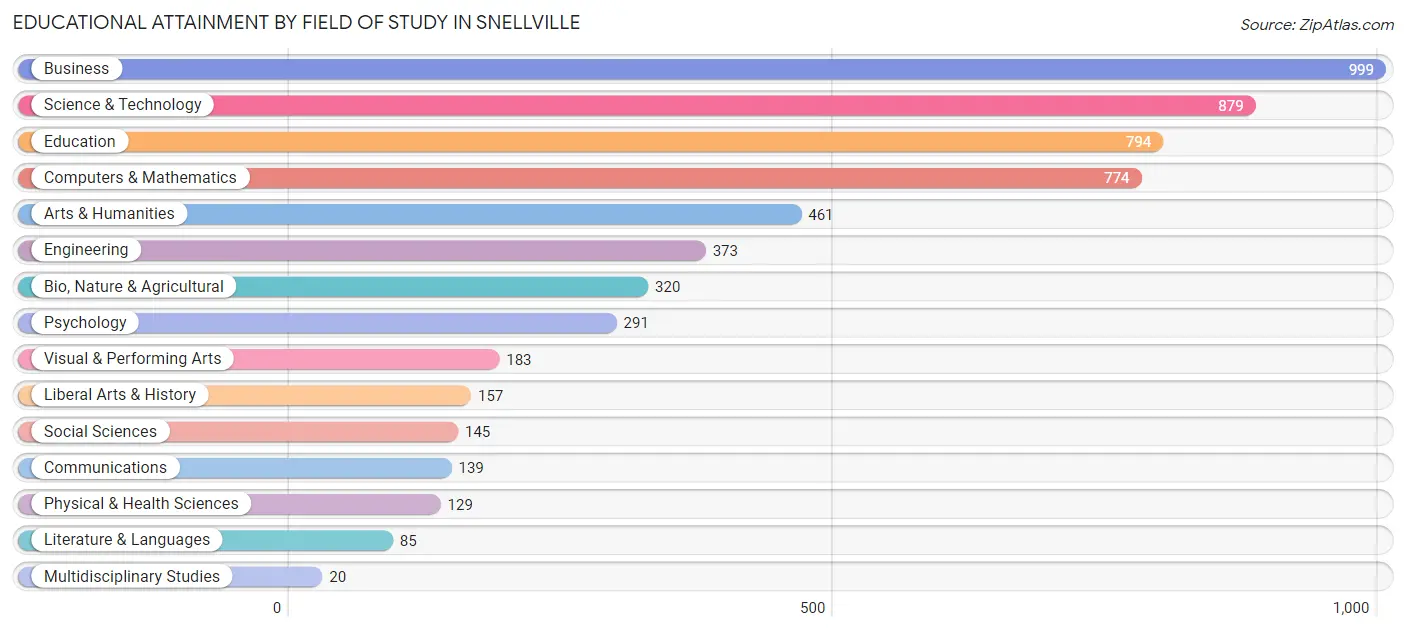
Educational Attainment by Field of Study in Snellville
Business (999 | 17.4%), science & technology (879 | 15.3%), education (794 | 13.8%), computers & mathematics (774 | 13.5%), and arts & humanities (461 | 8.0%) are the most common fields of study among 5,749 individuals in Snellville who have obtained a bachelor's degree or higher.
| Field of Study | # Graduates | % Graduates |
| Computers & Mathematics | 774 | 13.5% |
| Bio, Nature & Agricultural | 320 | 5.6% |
| Physical & Health Sciences | 129 | 2.2% |
| Psychology | 291 | 5.1% |
| Social Sciences | 145 | 2.5% |
| Engineering | 373 | 6.5% |
| Multidisciplinary Studies | 20 | 0.4% |
| Science & Technology | 879 | 15.3% |
| Business | 999 | 17.4% |
| Education | 794 | 13.8% |
| Literature & Languages | 85 | 1.5% |
| Liberal Arts & History | 157 | 2.7% |
| Visual & Performing Arts | 183 | 3.2% |
| Communications | 139 | 2.4% |
| Arts & Humanities | 461 | 8.0% |
| Total | 5,749 | 100.0% |
Transportation & Commute in Snellville
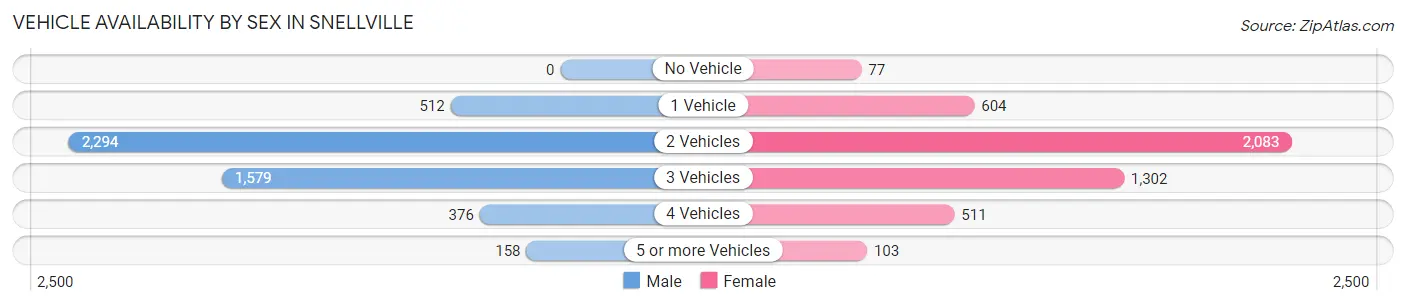
Vehicle Availability by Sex in Snellville
The most prevalent vehicle ownership categories in Snellville are males with 2 vehicles (2,294, accounting for 46.6%) and females with 2 vehicles (2,083, making up 49.0%).
| Vehicles Available | Male | Female |
| No Vehicle | 0 (0.0%) | 77 (1.7%) |
| 1 Vehicle | 512 (10.4%) | 604 (12.9%) |
| 2 Vehicles | 2,294 (46.6%) | 2,083 (44.5%) |
| 3 Vehicles | 1,579 (32.1%) | 1,302 (27.8%) |
| 4 Vehicles | 376 (7.6%) | 511 (10.9%) |
| 5 or more Vehicles | 158 (3.2%) | 103 (2.2%) |
| Total | 4,919 (100.0%) | 4,680 (100.0%) |
Commute Time in Snellville
The most frequently occuring commute durations in Snellville are 60 to 89 minutes (1,373 commuters, 16.3%), 45 to 59 minutes (1,331 commuters, 15.8%), and 30 to 34 minutes (1,323 commuters, 15.7%).
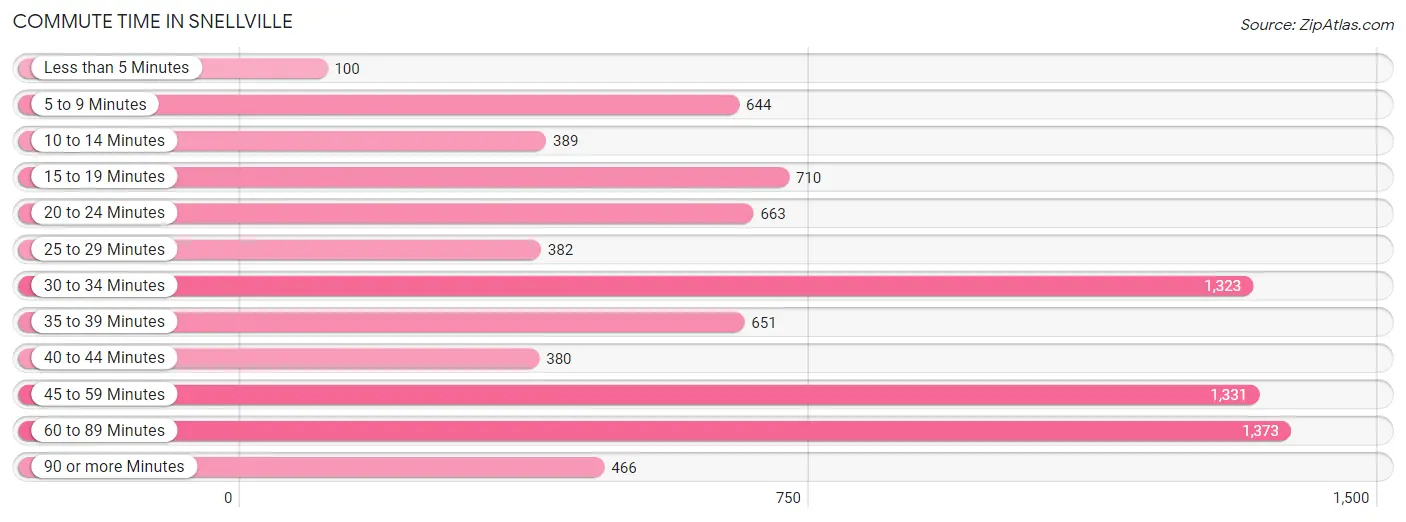
| Commute Time | # Commuters | % Commuters |
| Less than 5 Minutes | 100 | 1.2% |
| 5 to 9 Minutes | 644 | 7.7% |
| 10 to 14 Minutes | 389 | 4.6% |
| 15 to 19 Minutes | 710 | 8.4% |
| 20 to 24 Minutes | 663 | 7.9% |
| 25 to 29 Minutes | 382 | 4.5% |
| 30 to 34 Minutes | 1,323 | 15.7% |
| 35 to 39 Minutes | 651 | 7.7% |
| 40 to 44 Minutes | 380 | 4.5% |
| 45 to 59 Minutes | 1,331 | 15.8% |
| 60 to 89 Minutes | 1,373 | 16.3% |
| 90 or more Minutes | 466 | 5.5% |
Commute Time by Sex in Snellville
The most common commute times in Snellville are 45 to 59 minutes (789 commuters, 19.1%) for males and 60 to 89 minutes (835 commuters, 19.5%) for females.
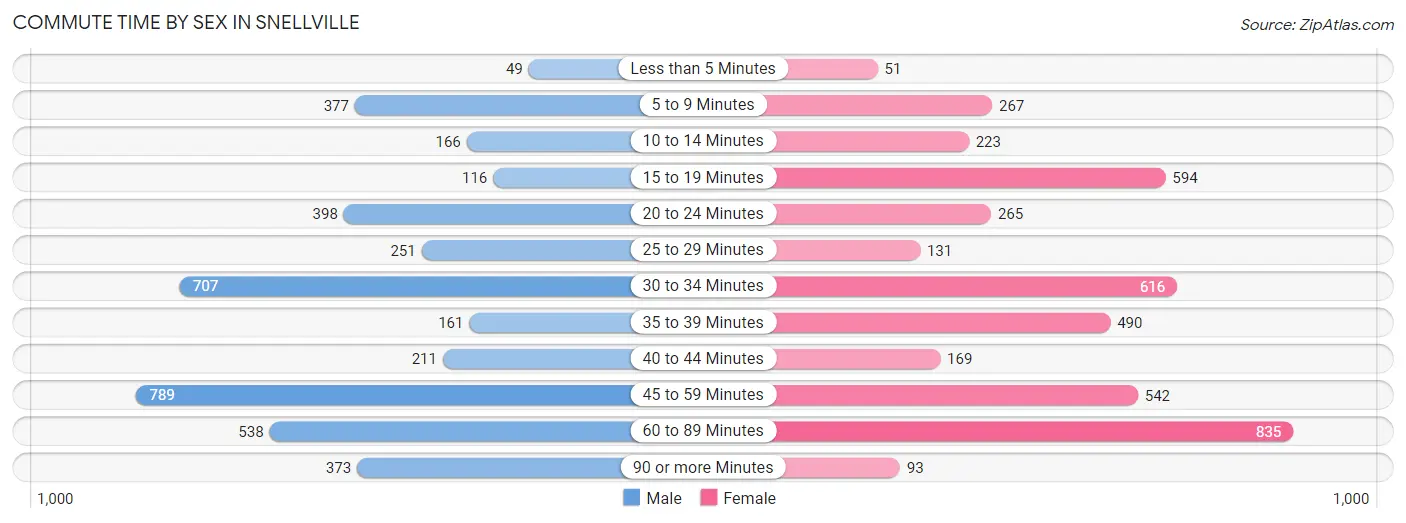
| Commute Time | Male | Female |
| Less than 5 Minutes | 49 (1.2%) | 51 (1.2%) |
| 5 to 9 Minutes | 377 (9.1%) | 267 (6.2%) |
| 10 to 14 Minutes | 166 (4.0%) | 223 (5.2%) |
| 15 to 19 Minutes | 116 (2.8%) | 594 (13.9%) |
| 20 to 24 Minutes | 398 (9.6%) | 265 (6.2%) |
| 25 to 29 Minutes | 251 (6.1%) | 131 (3.1%) |
| 30 to 34 Minutes | 707 (17.1%) | 616 (14.4%) |
| 35 to 39 Minutes | 161 (3.9%) | 490 (11.5%) |
| 40 to 44 Minutes | 211 (5.1%) | 169 (4.0%) |
| 45 to 59 Minutes | 789 (19.1%) | 542 (12.7%) |
| 60 to 89 Minutes | 538 (13.0%) | 835 (19.5%) |
| 90 or more Minutes | 373 (9.0%) | 93 (2.2%) |
Time of Departure to Work by Sex in Snellville
The most frequent times of departure to work in Snellville are 8:00 AM to 8:29 AM (582, 14.1%) for males and 7:00 AM to 7:29 AM (937, 21.9%) for females.
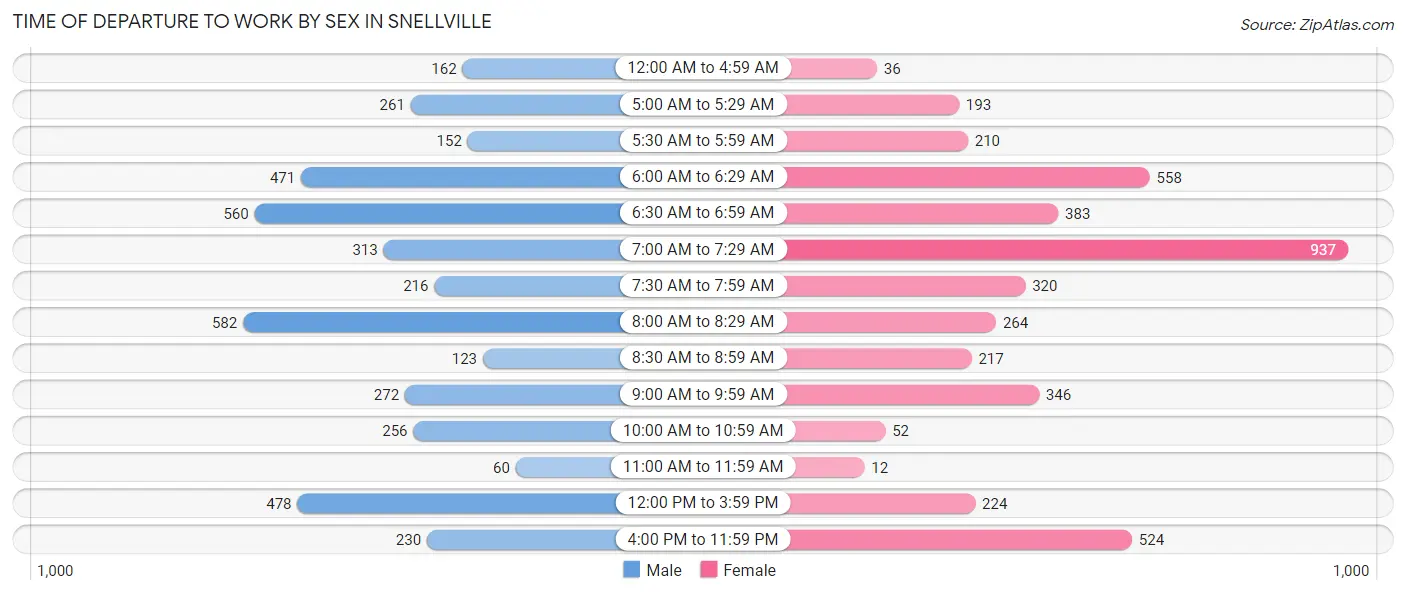
| Time of Departure | Male | Female |
| 12:00 AM to 4:59 AM | 162 (3.9%) | 36 (0.8%) |
| 5:00 AM to 5:29 AM | 261 (6.3%) | 193 (4.5%) |
| 5:30 AM to 5:59 AM | 152 (3.7%) | 210 (4.9%) |
| 6:00 AM to 6:29 AM | 471 (11.4%) | 558 (13.1%) |
| 6:30 AM to 6:59 AM | 560 (13.5%) | 383 (9.0%) |
| 7:00 AM to 7:29 AM | 313 (7.6%) | 937 (21.9%) |
| 7:30 AM to 7:59 AM | 216 (5.2%) | 320 (7.5%) |
| 8:00 AM to 8:29 AM | 582 (14.1%) | 264 (6.2%) |
| 8:30 AM to 8:59 AM | 123 (3.0%) | 217 (5.1%) |
| 9:00 AM to 9:59 AM | 272 (6.6%) | 346 (8.1%) |
| 10:00 AM to 10:59 AM | 256 (6.2%) | 52 (1.2%) |
| 11:00 AM to 11:59 AM | 60 (1.5%) | 12 (0.3%) |
| 12:00 PM to 3:59 PM | 478 (11.6%) | 224 (5.2%) |
| 4:00 PM to 11:59 PM | 230 (5.6%) | 524 (12.2%) |
| Total | 4,136 (100.0%) | 4,276 (100.0%) |
Housing Occupancy in Snellville
Occupancy by Ownership in Snellville
Of the total 6,792 dwellings in Snellville, owner-occupied units account for 5,407 (79.6%), while renter-occupied units make up 1,385 (20.4%).
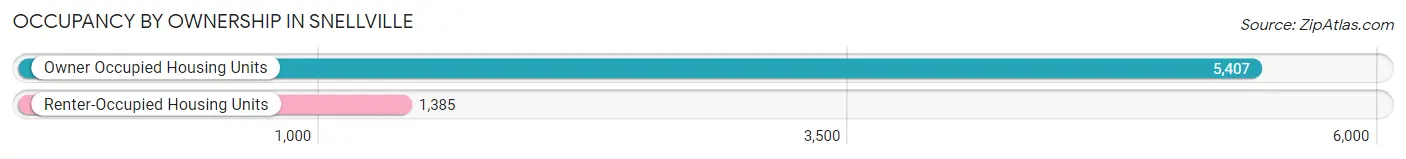
| Occupancy | # Housing Units | % Housing Units |
| Owner Occupied Housing Units | 5,407 | 79.6% |
| Renter-Occupied Housing Units | 1,385 | 20.4% |
| Total Occupied Housing Units | 6,792 | 100.0% |
Occupancy by Household Size in Snellville
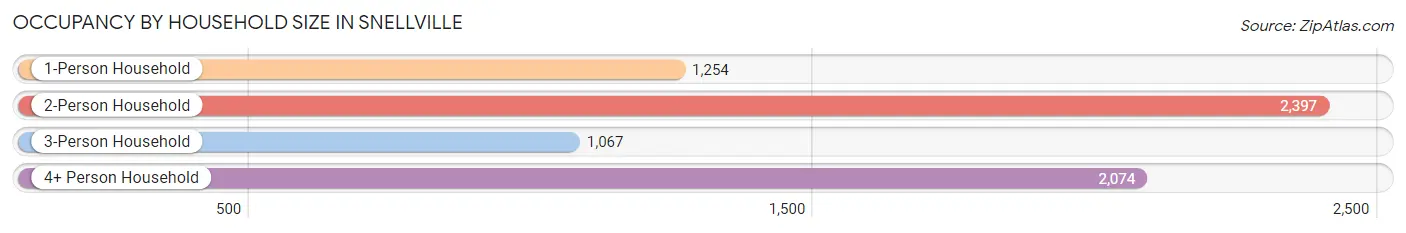
| Household Size | # Housing Units | % Housing Units |
| 1-Person Household | 1,254 | 18.5% |
| 2-Person Household | 2,397 | 35.3% |
| 3-Person Household | 1,067 | 15.7% |
| 4+ Person Household | 2,074 | 30.5% |
| Total Housing Units | 6,792 | 100.0% |
Occupancy by Ownership by Household Size in Snellville
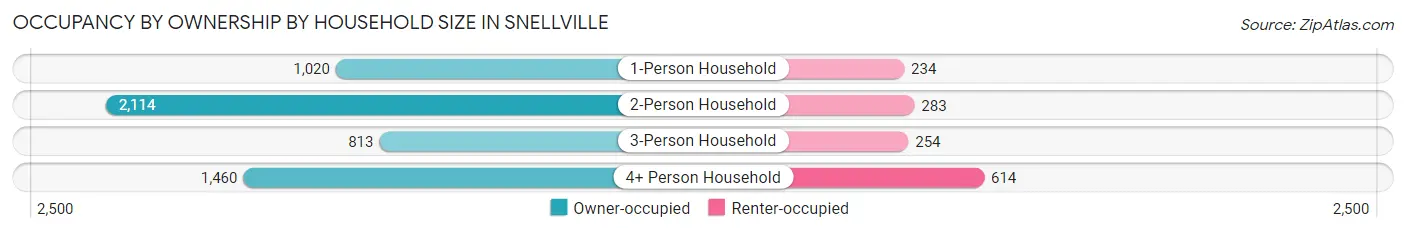
| Household Size | Owner-occupied | Renter-occupied |
| 1-Person Household | 1,020 (81.3%) | 234 (18.7%) |
| 2-Person Household | 2,114 (88.2%) | 283 (11.8%) |
| 3-Person Household | 813 (76.2%) | 254 (23.8%) |
| 4+ Person Household | 1,460 (70.4%) | 614 (29.6%) |
| Total Housing Units | 5,407 (79.6%) | 1,385 (20.4%) |
Occupancy by Educational Attainment in Snellville
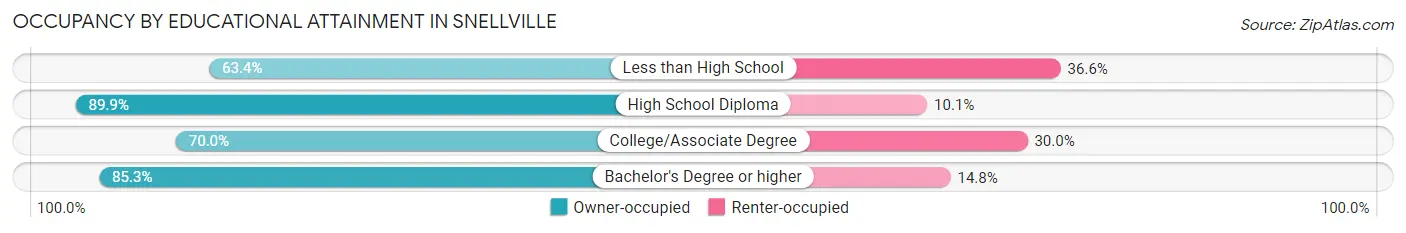
| Household Size | Owner-occupied | Renter-occupied |
| Less than High School | 319 (63.4%) | 184 (36.6%) |
| High School Diploma | 1,191 (89.9%) | 134 (10.1%) |
| College/Associate Degree | 1,538 (70.0%) | 659 (30.0%) |
| Bachelor's Degree or higher | 2,359 (85.3%) | 408 (14.7%) |
Occupancy by Age of Householder in Snellville
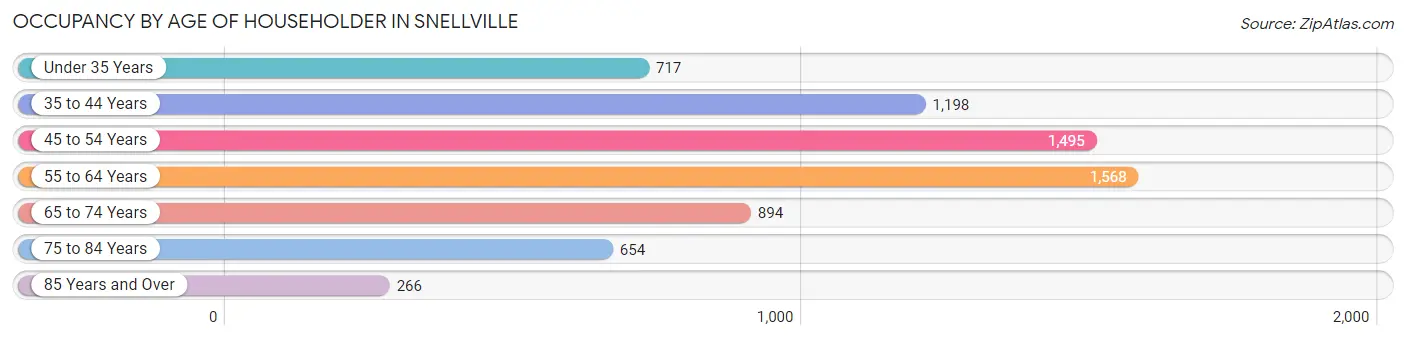
| Age Bracket | # Households | % Households |
| Under 35 Years | 717 | 10.6% |
| 35 to 44 Years | 1,198 | 17.6% |
| 45 to 54 Years | 1,495 | 22.0% |
| 55 to 64 Years | 1,568 | 23.1% |
| 65 to 74 Years | 894 | 13.2% |
| 75 to 84 Years | 654 | 9.6% |
| 85 Years and Over | 266 | 3.9% |
| Total | 6,792 | 100.0% |
Housing Finances in Snellville
Median Income by Occupancy in Snellville
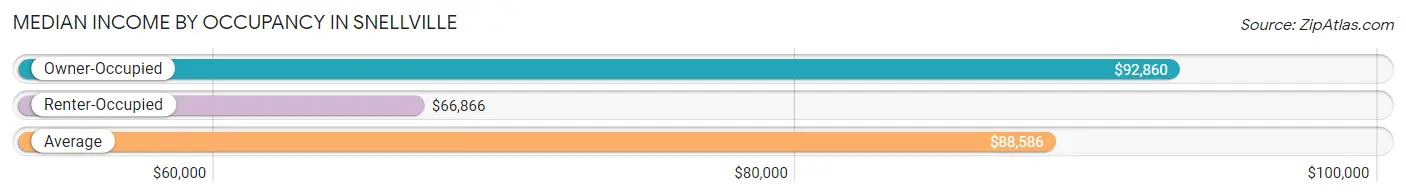
| Occupancy Type | # Households | Median Income |
| Owner-Occupied | 5,407 (79.6%) | $92,860 |
| Renter-Occupied | 1,385 (20.4%) | $66,866 |
| Average | 6,792 (100.0%) | $88,586 |
Occupancy by Householder Income Bracket in Snellville
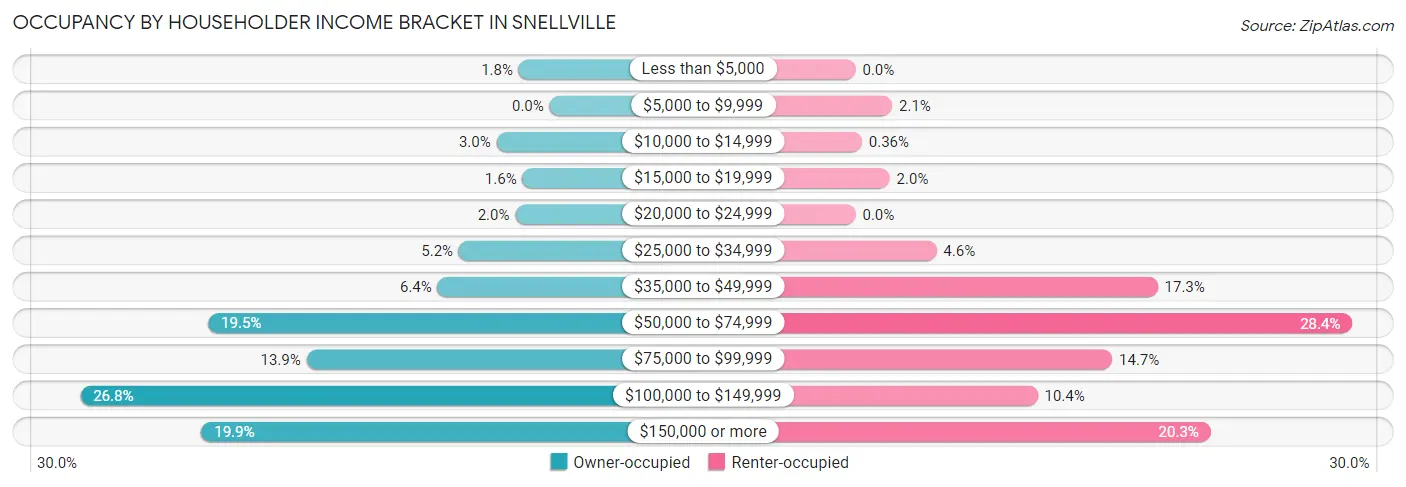
| Income Bracket | Owner-occupied | Renter-occupied |
| Less than $5,000 | 95 (1.8%) | 0 (0.0%) |
| $5,000 to $9,999 | 0 (0.0%) | 29 (2.1%) |
| $10,000 to $14,999 | 164 (3.0%) | 5 (0.4%) |
| $15,000 to $19,999 | 84 (1.5%) | 27 (1.9%) |
| $20,000 to $24,999 | 106 (2.0%) | 0 (0.0%) |
| $25,000 to $34,999 | 280 (5.2%) | 64 (4.6%) |
| $35,000 to $49,999 | 346 (6.4%) | 239 (17.3%) |
| $50,000 to $74,999 | 1,055 (19.5%) | 393 (28.4%) |
| $75,000 to $99,999 | 751 (13.9%) | 203 (14.7%) |
| $100,000 to $149,999 | 1,450 (26.8%) | 144 (10.4%) |
| $150,000 or more | 1,076 (19.9%) | 281 (20.3%) |
| Total | 5,407 (100.0%) | 1,385 (100.0%) |
Monthly Housing Cost Tiers in Snellville
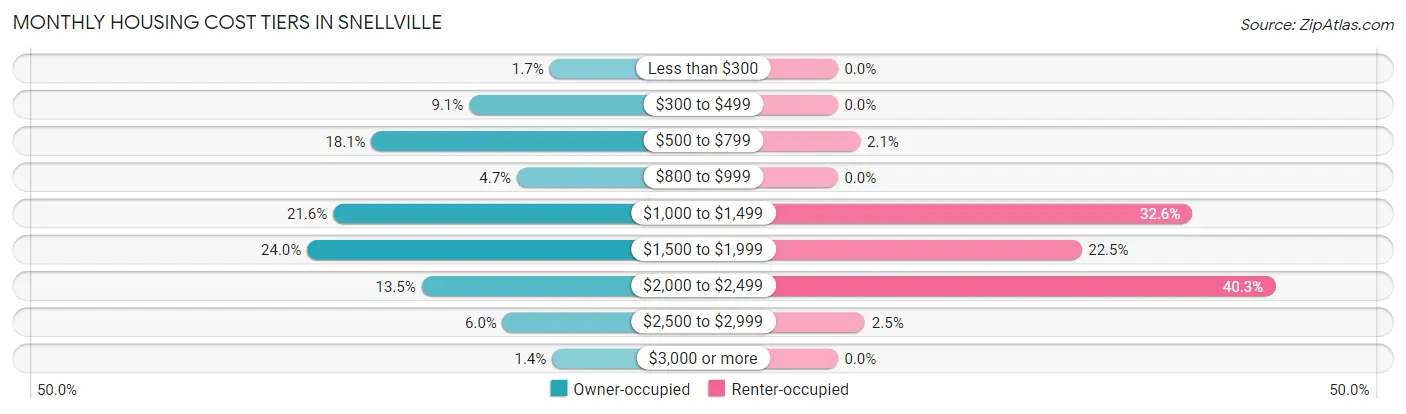
| Monthly Cost | Owner-occupied | Renter-occupied |
| Less than $300 | 91 (1.7%) | 0 (0.0%) |
| $300 to $499 | 491 (9.1%) | 0 (0.0%) |
| $500 to $799 | 977 (18.1%) | 29 (2.1%) |
| $800 to $999 | 253 (4.7%) | 0 (0.0%) |
| $1,000 to $1,499 | 1,168 (21.6%) | 452 (32.6%) |
| $1,500 to $1,999 | 1,297 (24.0%) | 311 (22.5%) |
| $2,000 to $2,499 | 728 (13.5%) | 558 (40.3%) |
| $2,500 to $2,999 | 324 (6.0%) | 35 (2.5%) |
| $3,000 or more | 78 (1.4%) | 0 (0.0%) |
| Total | 5,407 (100.0%) | 1,385 (100.0%) |
Physical Housing Characteristics in Snellville
Housing Structures in Snellville
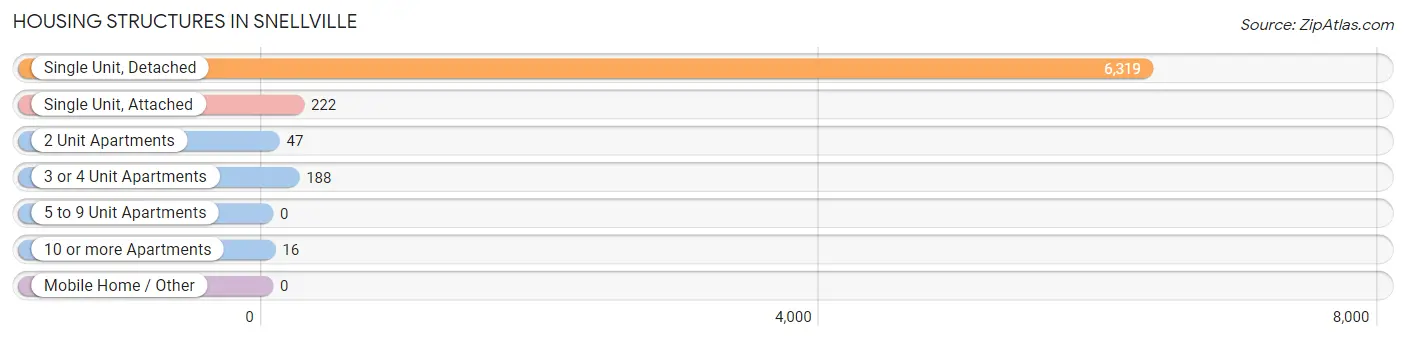
| Structure Type | # Housing Units | % Housing Units |
| Single Unit, Detached | 6,319 | 93.0% |
| Single Unit, Attached | 222 | 3.3% |
| 2 Unit Apartments | 47 | 0.7% |
| 3 or 4 Unit Apartments | 188 | 2.8% |
| 5 to 9 Unit Apartments | 0 | 0.0% |
| 10 or more Apartments | 16 | 0.2% |
| Mobile Home / Other | 0 | 0.0% |
| Total | 6,792 | 100.0% |
Housing Structures by Occupancy in Snellville
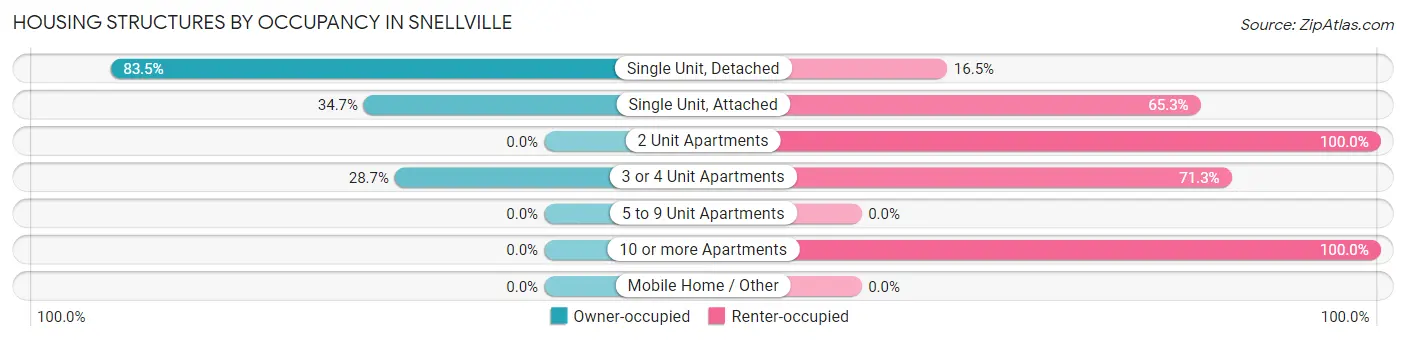
| Structure Type | Owner-occupied | Renter-occupied |
| Single Unit, Detached | 5,276 (83.5%) | 1,043 (16.5%) |
| Single Unit, Attached | 77 (34.7%) | 145 (65.3%) |
| 2 Unit Apartments | 0 (0.0%) | 47 (100.0%) |
| 3 or 4 Unit Apartments | 54 (28.7%) | 134 (71.3%) |
| 5 to 9 Unit Apartments | 0 (0.0%) | 0 (0.0%) |
| 10 or more Apartments | 0 (0.0%) | 16 (100.0%) |
| Mobile Home / Other | 0 (0.0%) | 0 (0.0%) |
| Total | 5,407 (79.6%) | 1,385 (20.4%) |
Housing Structures by Number of Rooms in Snellville
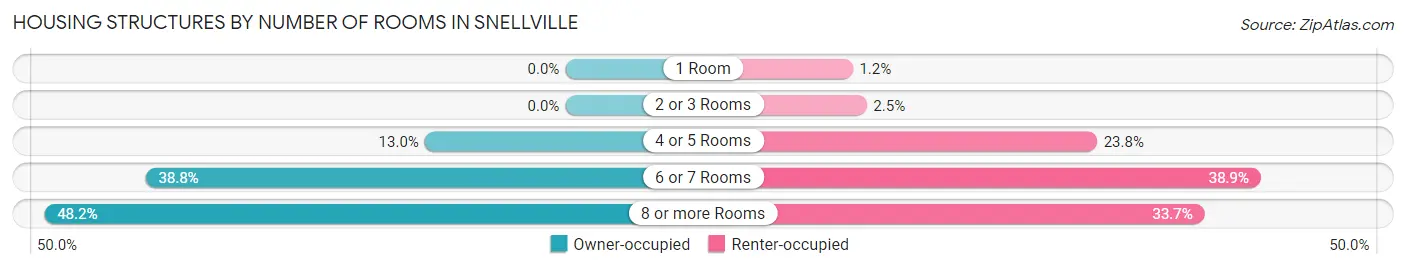
| Number of Rooms | Owner-occupied | Renter-occupied |
| 1 Room | 0 (0.0%) | 16 (1.2%) |
| 2 or 3 Rooms | 0 (0.0%) | 34 (2.5%) |
| 4 or 5 Rooms | 703 (13.0%) | 329 (23.7%) |
| 6 or 7 Rooms | 2,099 (38.8%) | 539 (38.9%) |
| 8 or more Rooms | 2,605 (48.2%) | 467 (33.7%) |
| Total | 5,407 (100.0%) | 1,385 (100.0%) |
Housing Structure by Heating Type in Snellville
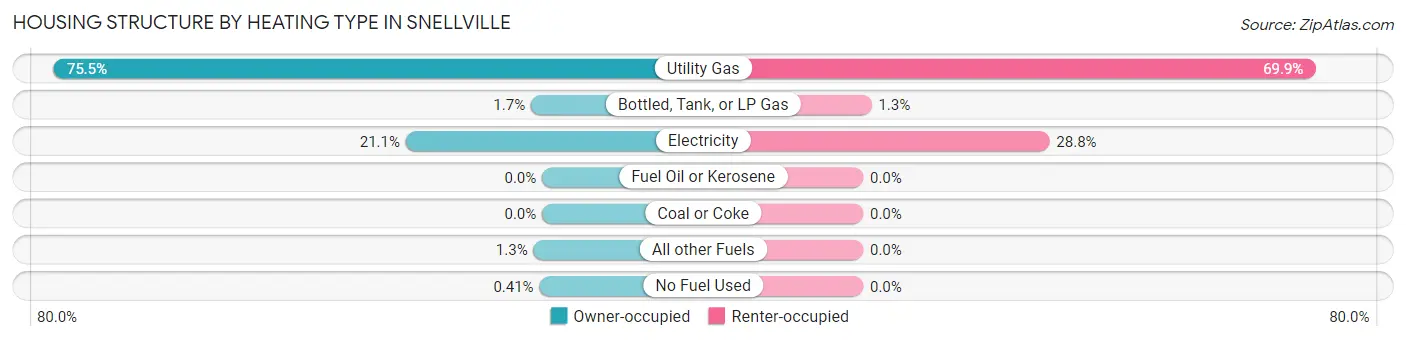
| Heating Type | Owner-occupied | Renter-occupied |
| Utility Gas | 4,081 (75.5%) | 968 (69.9%) |
| Bottled, Tank, or LP Gas | 93 (1.7%) | 18 (1.3%) |
| Electricity | 1,139 (21.1%) | 399 (28.8%) |
| Fuel Oil or Kerosene | 0 (0.0%) | 0 (0.0%) |
| Coal or Coke | 0 (0.0%) | 0 (0.0%) |
| All other Fuels | 72 (1.3%) | 0 (0.0%) |
| No Fuel Used | 22 (0.4%) | 0 (0.0%) |
| Total | 5,407 (100.0%) | 1,385 (100.0%) |
Household Vehicle Usage in Snellville
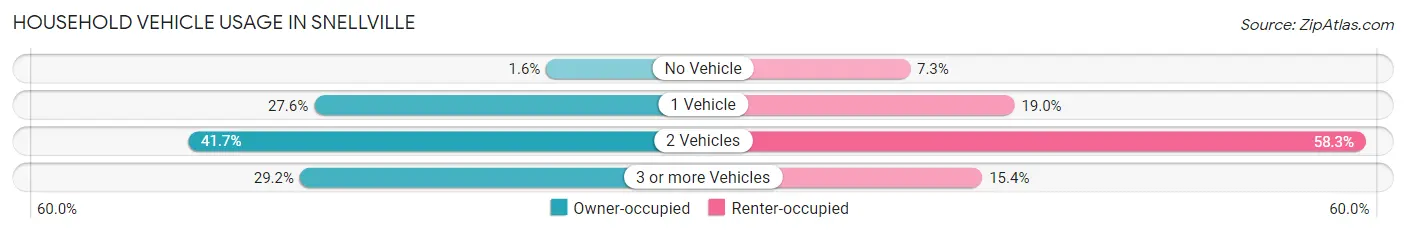
| Vehicles per Household | Owner-occupied | Renter-occupied |
| No Vehicle | 85 (1.6%) | 101 (7.3%) |
| 1 Vehicle | 1,491 (27.6%) | 263 (19.0%) |
| 2 Vehicles | 2,254 (41.7%) | 808 (58.3%) |
| 3 or more Vehicles | 1,577 (29.2%) | 213 (15.4%) |
| Total | 5,407 (100.0%) | 1,385 (100.0%) |
Real Estate & Mortgages in Snellville
Real Estate and Mortgage Overview in Snellville
| Characteristic | Without Mortgage | With Mortgage |
| Housing Units | 1,661 | 3,746 |
| Median Property Value | $246,800 | $263,500 |
| Median Household Income | $81,012 | $837 |
| Monthly Housing Costs | $567 | $78 |
| Real Estate Taxes | $2,292 | $102 |
Property Value by Mortgage Status in Snellville
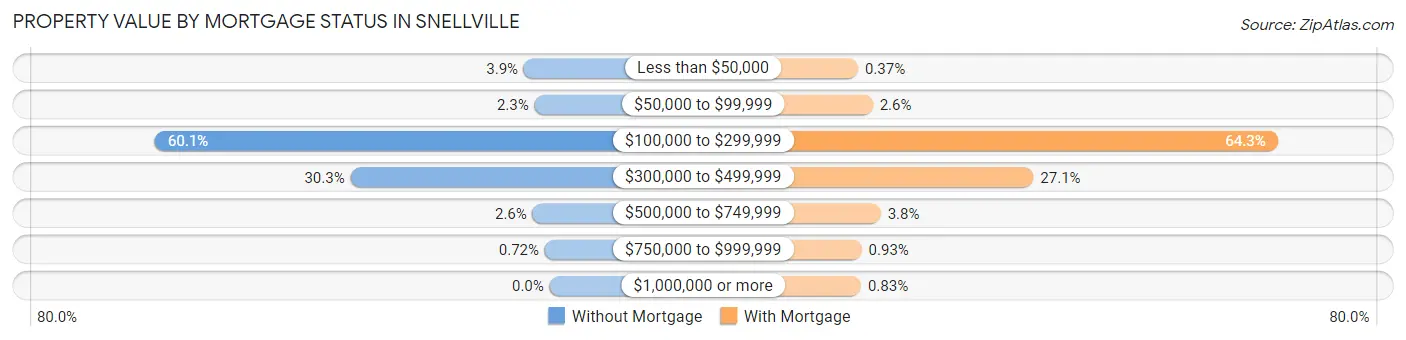
| Property Value | Without Mortgage | With Mortgage |
| Less than $50,000 | 65 (3.9%) | 14 (0.4%) |
| $50,000 to $99,999 | 38 (2.3%) | 98 (2.6%) |
| $100,000 to $299,999 | 999 (60.1%) | 2,409 (64.3%) |
| $300,000 to $499,999 | 504 (30.3%) | 1,015 (27.1%) |
| $500,000 to $749,999 | 43 (2.6%) | 144 (3.8%) |
| $750,000 to $999,999 | 12 (0.7%) | 35 (0.9%) |
| $1,000,000 or more | 0 (0.0%) | 31 (0.8%) |
| Total | 1,661 (100.0%) | 3,746 (100.0%) |
Household Income by Mortgage Status in Snellville
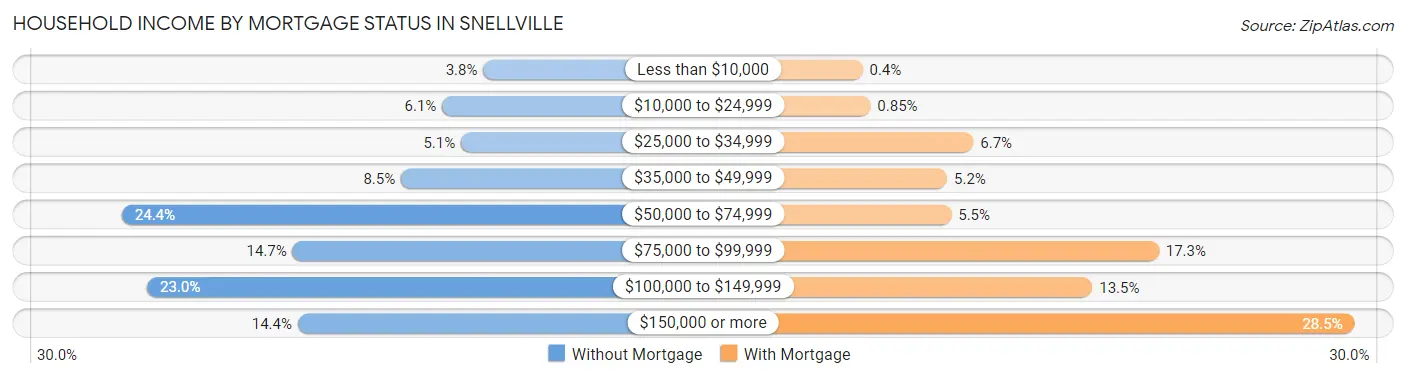
| Household Income | Without Mortgage | With Mortgage |
| Less than $10,000 | 63 (3.8%) | 15 (0.4%) |
| $10,000 to $24,999 | 102 (6.1%) | 32 (0.9%) |
| $25,000 to $34,999 | 84 (5.1%) | 252 (6.7%) |
| $35,000 to $49,999 | 141 (8.5%) | 196 (5.2%) |
| $50,000 to $74,999 | 406 (24.4%) | 205 (5.5%) |
| $75,000 to $99,999 | 244 (14.7%) | 649 (17.3%) |
| $100,000 to $149,999 | 382 (23.0%) | 507 (13.5%) |
| $150,000 or more | 239 (14.4%) | 1,068 (28.5%) |
| Total | 1,661 (100.0%) | 3,746 (100.0%) |
Property Value to Household Income Ratio in Snellville
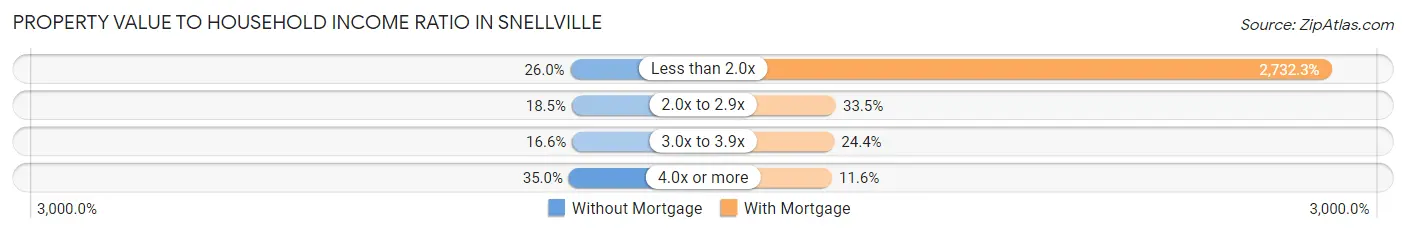
| Value-to-Income Ratio | Without Mortgage | With Mortgage |
| Less than 2.0x | 432 (26.0%) | 102,353 (2,732.3%) |
| 2.0x to 2.9x | 308 (18.5%) | 1,256 (33.5%) |
| 3.0x to 3.9x | 276 (16.6%) | 913 (24.4%) |
| 4.0x or more | 582 (35.0%) | 433 (11.6%) |
| Total | 1,661 (100.0%) | 3,746 (100.0%) |
Real Estate Taxes by Mortgage Status in Snellville
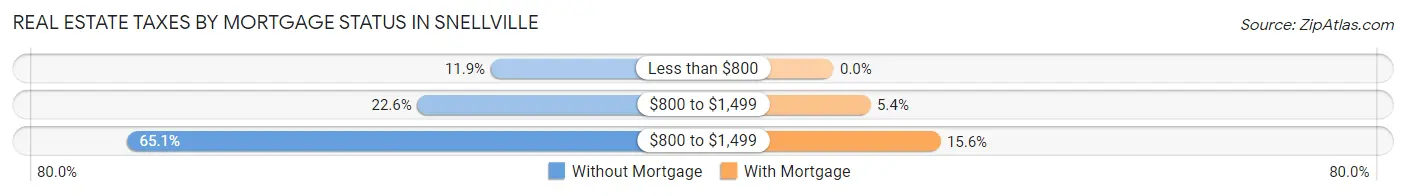
| Property Taxes | Without Mortgage | With Mortgage |
| Less than $800 | 197 (11.9%) | 0 (0.0%) |
| $800 to $1,499 | 375 (22.6%) | 203 (5.4%) |
| $800 to $1,499 | 1,081 (65.1%) | 585 (15.6%) |
| Total | 1,661 (100.0%) | 3,746 (100.0%) |
Health & Disability in Snellville
Health Insurance Coverage by Age in Snellville
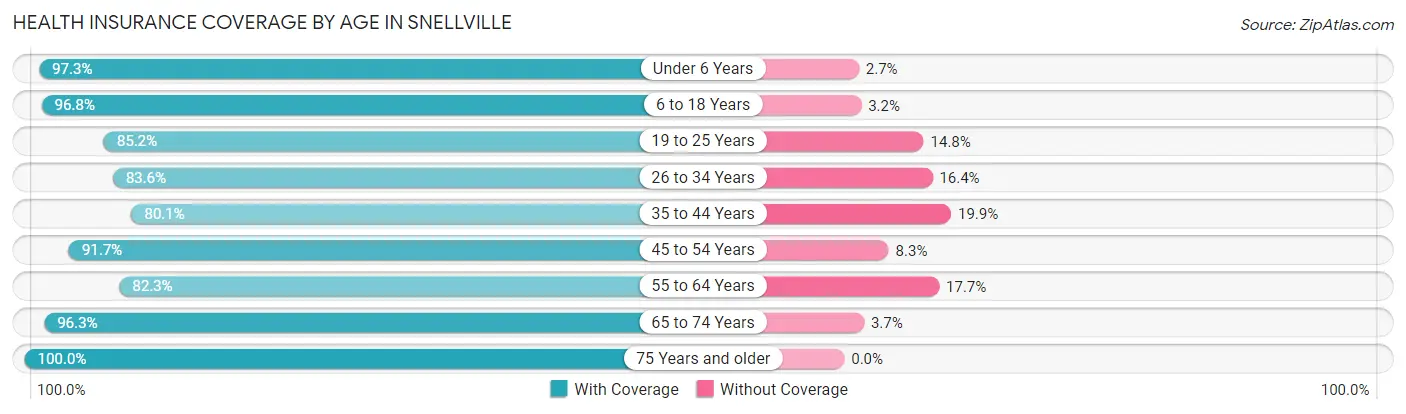
| Age Bracket | With Coverage | Without Coverage |
| Under 6 Years | 1,004 (97.3%) | 28 (2.7%) |
| 6 to 18 Years | 3,525 (96.8%) | 115 (3.2%) |
| 19 to 25 Years | 1,498 (85.2%) | 260 (14.8%) |
| 26 to 34 Years | 2,110 (83.6%) | 415 (16.4%) |
| 35 to 44 Years | 1,842 (80.1%) | 458 (19.9%) |
| 45 to 54 Years | 2,551 (91.7%) | 230 (8.3%) |
| 55 to 64 Years | 2,580 (82.3%) | 554 (17.7%) |
| 65 to 74 Years | 1,708 (96.3%) | 65 (3.7%) |
| 75 Years and older | 1,602 (100.0%) | 0 (0.0%) |
| Total | 18,420 (89.7%) | 2,125 (10.3%) |
Health Insurance Coverage by Citizenship Status in Snellville
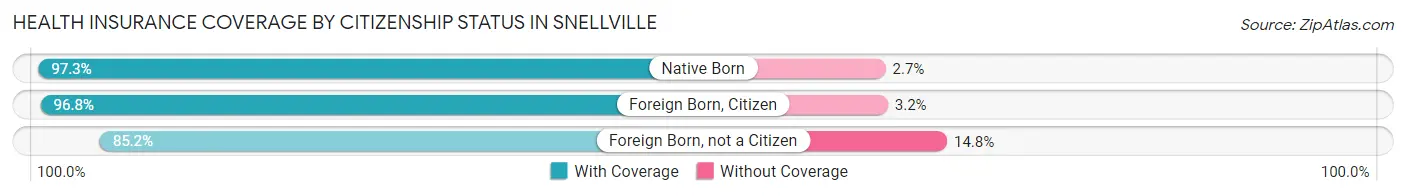
| Citizenship Status | With Coverage | Without Coverage |
| Native Born | 1,004 (97.3%) | 28 (2.7%) |
| Foreign Born, Citizen | 3,525 (96.8%) | 115 (3.2%) |
| Foreign Born, not a Citizen | 1,498 (85.2%) | 260 (14.8%) |
Health Insurance Coverage by Household Income in Snellville
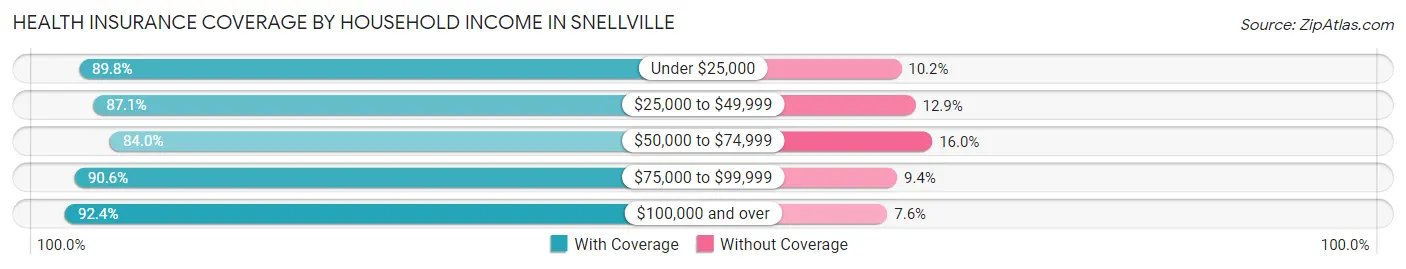
| Household Income | With Coverage | Without Coverage |
| Under $25,000 | 730 (89.8%) | 83 (10.2%) |
| $25,000 to $49,999 | 1,758 (87.1%) | 260 (12.9%) |
| $50,000 to $74,999 | 3,701 (84.0%) | 705 (16.0%) |
| $75,000 to $99,999 | 2,761 (90.6%) | 287 (9.4%) |
| $100,000 and over | 9,370 (92.4%) | 770 (7.6%) |
Public vs Private Health Insurance Coverage by Age in Snellville
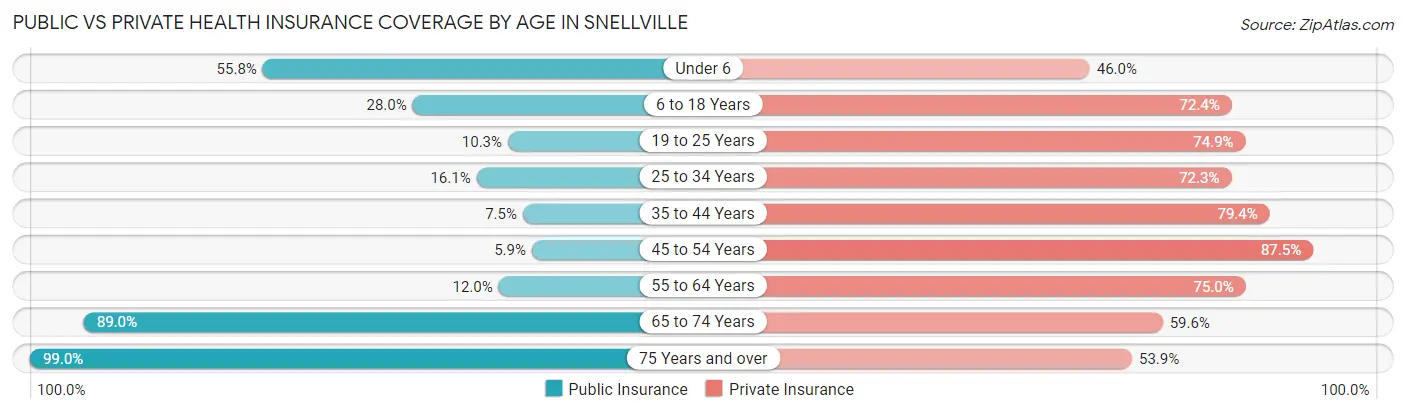
| Age Bracket | Public Insurance | Private Insurance |
| Under 6 | 576 (55.8%) | 475 (46.0%) |
| 6 to 18 Years | 1,019 (28.0%) | 2,634 (72.4%) |
| 19 to 25 Years | 181 (10.3%) | 1,317 (74.9%) |
| 25 to 34 Years | 407 (16.1%) | 1,825 (72.3%) |
| 35 to 44 Years | 173 (7.5%) | 1,826 (79.4%) |
| 45 to 54 Years | 163 (5.9%) | 2,432 (87.5%) |
| 55 to 64 Years | 377 (12.0%) | 2,349 (75.0%) |
| 65 to 74 Years | 1,578 (89.0%) | 1,056 (59.6%) |
| 75 Years and over | 1,586 (99.0%) | 863 (53.9%) |
| Total | 6,060 (29.5%) | 14,777 (71.9%) |
Disability Status by Sex by Age in Snellville
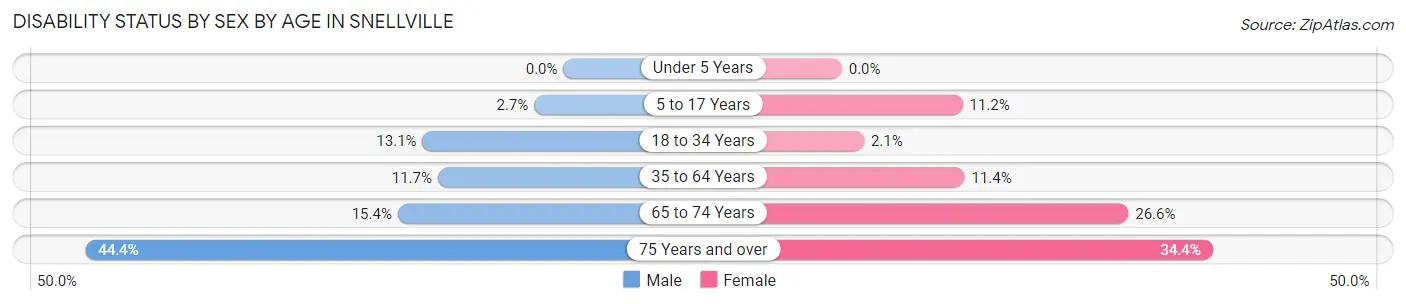
| Age Bracket | Male | Female |
| Under 5 Years | 0 (0.0%) | 0 (0.0%) |
| 5 to 17 Years | 46 (2.7%) | 226 (11.2%) |
| 18 to 34 Years | 298 (13.1%) | 45 (2.1%) |
| 35 to 64 Years | 464 (11.7%) | 482 (11.4%) |
| 65 to 74 Years | 132 (15.4%) | 243 (26.6%) |
| 75 Years and over | 244 (44.4%) | 362 (34.4%) |
Disability Class by Sex by Age in Snellville
Disability Class: Hearing Difficulty
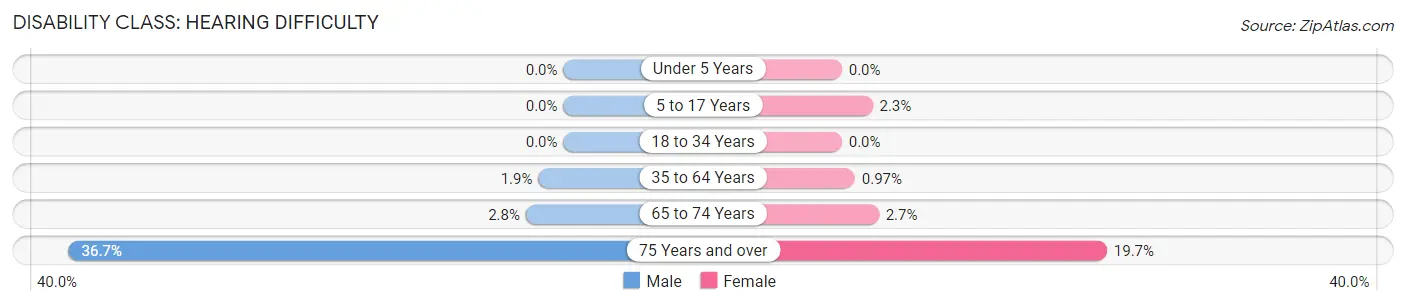
| Age Bracket | Male | Female |
| Under 5 Years | 0 (0.0%) | 0 (0.0%) |
| 5 to 17 Years | 0 (0.0%) | 46 (2.3%) |
| 18 to 34 Years | 0 (0.0%) | 0 (0.0%) |
| 35 to 64 Years | 74 (1.9%) | 41 (1.0%) |
| 65 to 74 Years | 24 (2.8%) | 25 (2.7%) |
| 75 Years and over | 202 (36.7%) | 207 (19.7%) |
Disability Class: Vision Difficulty
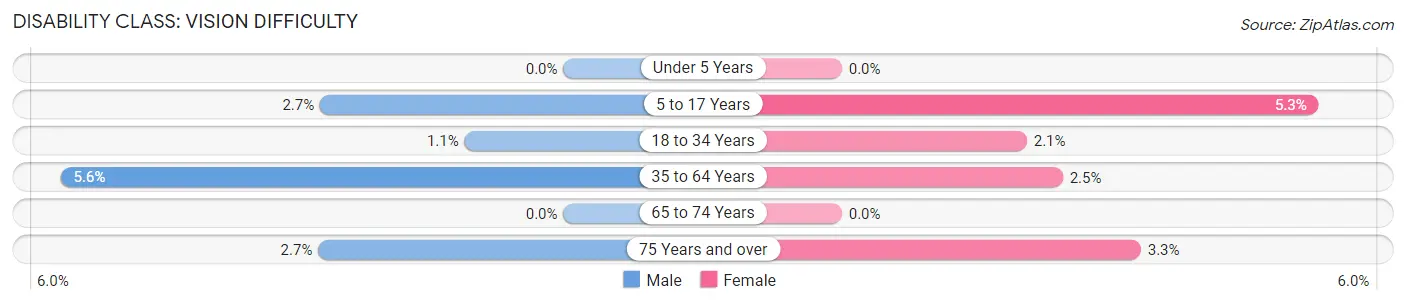
| Age Bracket | Male | Female |
| Under 5 Years | 0 (0.0%) | 0 (0.0%) |
| 5 to 17 Years | 46 (2.7%) | 107 (5.3%) |
| 18 to 34 Years | 25 (1.1%) | 45 (2.1%) |
| 35 to 64 Years | 223 (5.6%) | 104 (2.5%) |
| 65 to 74 Years | 0 (0.0%) | 0 (0.0%) |
| 75 Years and over | 15 (2.7%) | 35 (3.3%) |
Disability Class: Cognitive Difficulty
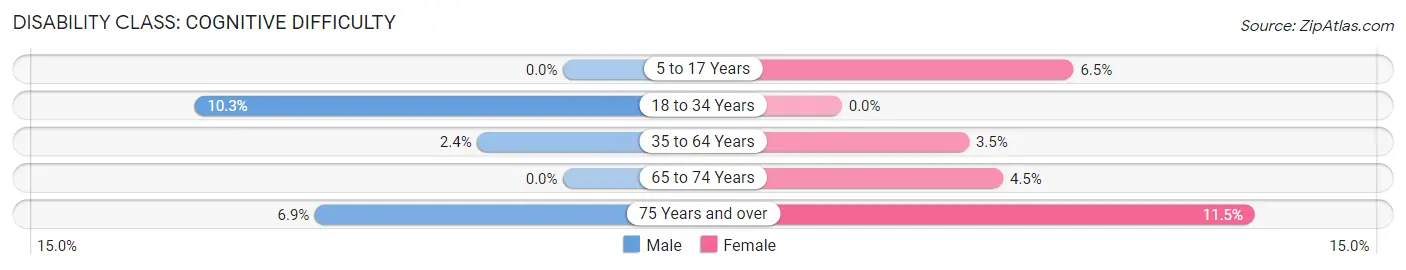
| Age Bracket | Male | Female |
| 5 to 17 Years | 0 (0.0%) | 130 (6.5%) |
| 18 to 34 Years | 234 (10.3%) | 0 (0.0%) |
| 35 to 64 Years | 95 (2.4%) | 150 (3.5%) |
| 65 to 74 Years | 0 (0.0%) | 41 (4.5%) |
| 75 Years and over | 38 (6.9%) | 121 (11.5%) |
Disability Class: Ambulatory Difficulty
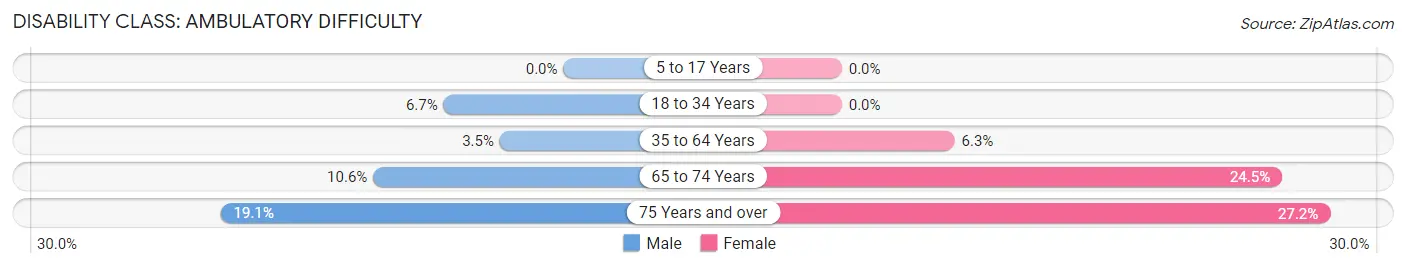
| Age Bracket | Male | Female |
| 5 to 17 Years | 0 (0.0%) | 0 (0.0%) |
| 18 to 34 Years | 152 (6.7%) | 0 (0.0%) |
| 35 to 64 Years | 141 (3.5%) | 266 (6.3%) |
| 65 to 74 Years | 91 (10.6%) | 224 (24.5%) |
| 75 Years and over | 105 (19.1%) | 286 (27.2%) |
Disability Class: Self-Care Difficulty
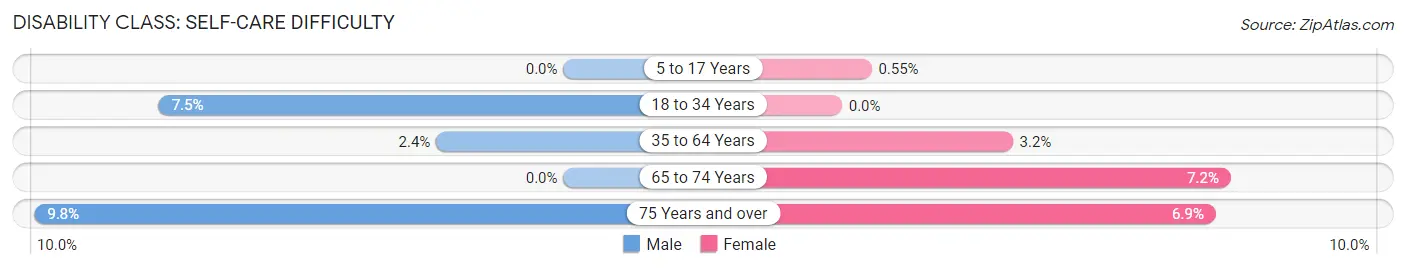
| Age Bracket | Male | Female |
| 5 to 17 Years | 0 (0.0%) | 11 (0.5%) |
| 18 to 34 Years | 171 (7.5%) | 0 (0.0%) |
| 35 to 64 Years | 94 (2.4%) | 134 (3.2%) |
| 65 to 74 Years | 0 (0.0%) | 66 (7.2%) |
| 75 Years and over | 54 (9.8%) | 73 (6.9%) |
Technology Access in Snellville
Computing Device Access in Snellville
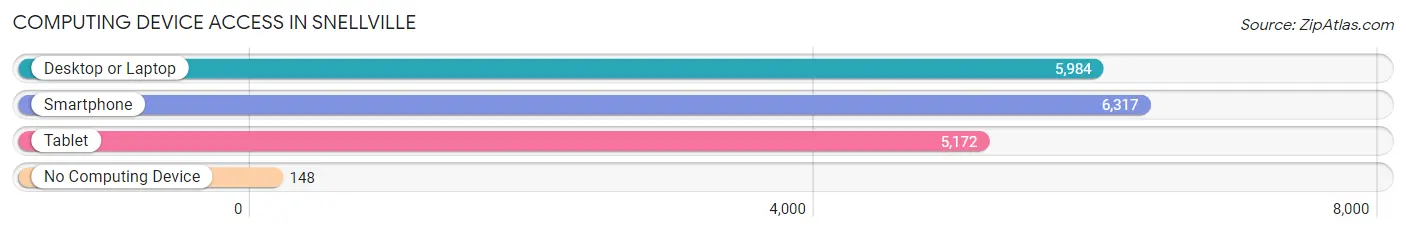
| Device Type | # Households | % Households |
| Desktop or Laptop | 5,984 | 88.1% |
| Smartphone | 6,317 | 93.0% |
| Tablet | 5,172 | 76.1% |
| No Computing Device | 148 | 2.2% |
| Total | 6,792 | 100.0% |
Internet Access in Snellville
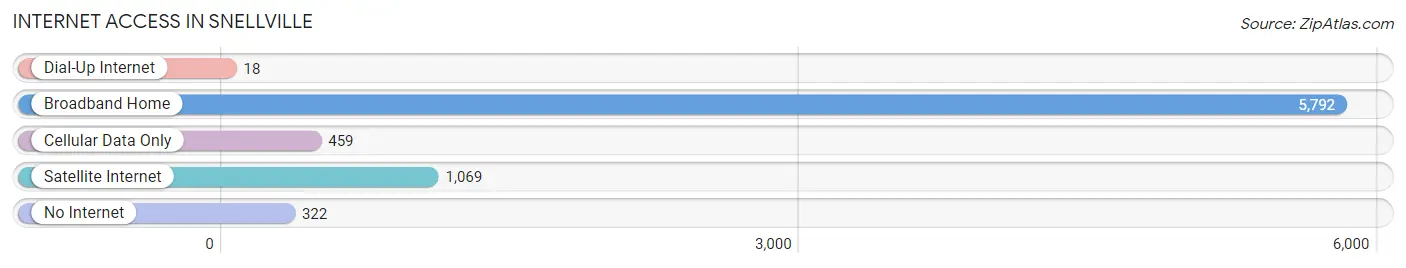
| Internet Type | # Households | % Households |
| Dial-Up Internet | 18 | 0.3% |
| Broadband Home | 5,792 | 85.3% |
| Cellular Data Only | 459 | 6.8% |
| Satellite Internet | 1,069 | 15.7% |
| No Internet | 322 | 4.7% |
| Total | 6,792 | 100.0% |
Snellville Summary
Snellville is a city located in the eastern part of Gwinnett County, Georgia, United States. It is a suburb of Atlanta, located approximately 30 miles east of downtown. The population was 18,242 at the 2010 census, making it one of the most populous cities in the county.
History
Snellville was founded in 1874 by Evan P. Snell, a former slave who purchased the land from the state of Georgia. He named the town after himself and began to develop it as a farming community. The town was incorporated in 1923 and grew steadily throughout the 20th century. In the 1950s, Snellville began to experience a population boom as people moved from the city of Atlanta to the suburbs. This growth continued into the 21st century, and Snellville is now one of the most populous cities in Gwinnett County.
Geography
Snellville is located in eastern Gwinnett County, approximately 30 miles east of downtown Atlanta. It is bordered to the north by the city of Lawrenceville, to the east by the city of Lilburn, to the south by the city of Loganville, and to the west by the city of Grayson. The city covers an area of 8.3 square miles, with a population density of 2,200 people per square mile.
Economy
Snellville’s economy is largely based on retail and services. The city is home to several large shopping centers, including the Snellville Towne Center, which features a variety of stores and restaurants. The city is also home to several industrial and manufacturing businesses, including a Coca-Cola bottling plant and a manufacturing plant for the automotive parts supplier, Autoliv.
Demographics
As of the 2010 census, Snellville had a population of 18,242. The racial makeup of the city was 73.3% White, 15.2% African American, 0.4% Native American, 4.2% Asian, 0.1% Pacific Islander, 4.2% from other races, and 2.6% from two or more races. Hispanic or Latino of any race were 8.7% of the population.
The median income for a household in Snellville was $50,945, and the median income for a family was $60,945. The per capita income for the city was $25,945. About 8.2% of families and 10.3% of the population were below the poverty line, including 14.2% of those under age 18 and 8.2% of those age 65 or over.
Snellville is served by the Gwinnett County Public Schools system. The city is home to several elementary schools, a middle school, and a high school. The city also has several private schools, including a Montessori school and a Christian school.
Snellville is a vibrant and growing city that offers its residents a variety of amenities and opportunities. With its convenient location, strong economy, and diverse population, Snellville is an ideal place to live, work, and play.
Common Questions
What is Per Capita Income in Snellville?
Per Capita income in Snellville is $34,609.
What is the Median Family Income in Snellville?
Median Family Income in Snellville is $94,195.
What is the Median Household income in Snellville?
Median Household Income in Snellville is $88,586.
What is Income or Wage Gap in Snellville?
Income or Wage Gap in Snellville is 7.3%.
Women in Snellville earn 92.7 cents for every dollar earned by a man.
What is Inequality or Gini Index in Snellville?
Inequality or Gini Index in Snellville is 0.35.
What is the Total Population of Snellville?
Total Population of Snellville is 20,895.
What is the Total Male Population of Snellville?
Total Male Population of Snellville is 9,843.
What is the Total Female Population of Snellville?
Total Female Population of Snellville is 11,052.
What is the Ratio of Males per 100 Females in Snellville?
There are 89.06 Males per 100 Females in Snellville.
What is the Ratio of Females per 100 Males in Snellville?
There are 112.28 Females per 100 Males in Snellville.
What is the Median Population Age in Snellville?
Median Population Age in Snellville is 42.1 Years.
What is the Average Family Size in Snellville
Average Family Size in Snellville is 3.4 People.
What is the Average Household Size in Snellville
Average Household Size in Snellville is 3.0 People.
How Large is the Labor Force in Snellville?
There are 10,358 People in the Labor Forcein in Snellville.
What is the Percentage of People in the Labor Force in Snellville?
60.6% of People are in the Labor Force in Snellville.
What is the Unemployment Rate in Snellville?
Unemployment Rate in Snellville is 4.1%.